 Junwen Wu
 Jisheng Chen1
 Cui Wang
 Xiuli Yan
 Qian Liu
- 1Guangdong Provincial Key Laboratory of Marine Disaster Prediction and Prevention & Institute of Marine Sciences, Shantou University, Shantou, China
- 2Southern Marine Science and Engineering Guangdong Laboratory (Guangzhou), Guangzhou, China
- 3Third Institute of Oceanography, Ministry of Natural Resource, Xiamen, China
- 4Frontiers Science Center for Deep Ocean Multispheres and Earth System, and Key Laboratory of Marine Chemistry Theory and Technology, Ministry of Education, Ocean University of China, Qingdao, China
The source apportionment of organic carbon is of great scientific significance for understanding the carbon sink pattern in the coastal ocean. The concentrations of total organic carbon (TOC) and total nitrogen (TN) and their isotopic compositions (δ13CTOC and δ15NTN) were determined in surface sediments and sediment cores (Y3 and Y5) collected in the eastern Guangdong coast (EGDC) during spring, summer and winter cruises in 2021, in order to determine the distribution and source of sedimentary organic matter. Spatially, TOC and δ13CTOC distributions in the EGDC have contrasting patterns; TOC concentrations decreased and δ13CTOC values increased with distance offshore. Higher TOC concentrations and enriched δ13CTOC were observed in the marine aquaculture area off EGDC. The measured values of δ13CTOC, δ15NTN and the C/N ratio constrained the two dominant sources of organic matter, marine and terrestrial material, in the EGDC. Using a two end−member mixing model, we estimated the proportion of marine organic matter to be 74 ± 20% in spring, 74 ± 16% in summer and 75 ± 12% in winter, respectively. This suggests in situ production of marine phytoplankton dominated the organic carbon pool (average=~74%) in the EGDC sediment. These consistent marine organic matter contributions are also observed in sediment cores, with proportions averaging 59 ± 5% in core Y3 and 66 ± 4% in core Y5. The observed variations in biogeochemical proxies in sediments are thus mainly caused by differing relative contributions of marine and terrestrial organic matter. Additionally, the high TOC inventory in the marine aquaculture area indicates increased carbon storage and carbon fixation capacity compared to the other areas investigated. Overall, this study establishes a background carbon database in the coastal environment that can be used in future studies of blue carbon to achieve carbon neutrality in China.
1 Introduction
The continental margins, acting as a transition zone between the land and open ocean, only account for ~7% of the global ocean area (Gattuso et al., 1998). However, they contribute ~28% of the marine primary production and ~80% of the organic matter burial (Dan et al., 2019). Compared to other oceanic settings, they have more complex and variable processes. First, terrestrial organic matter inputs are decomposed by microorganisms, influencing biogeochemical cycling and resulting in spatiotemporal variability in the coastal ocean (Seidel et al., 2015). Terrestrial organic carbon produced by the allochthonous and autochthonous matter is usually buried in the marginal sea after the degradation and deposition (Hedges et al., 1997; Burdige, 2005). Second, hypoxia and red tides frequently occur in the coastal ocean, which is considered to be caused by eutrophication (Bauer et al., 2013; Medeiros et al., 2015). A large number of riverine input of nutrients including nitrogen and phosphorus usually result in this eutrophication. Last, terrestrial organic carbon in the continental margins from riverine input plays a critical role in controlling the global carbon cycle (Hedges et al., 1997; Galy et al., 2008). Therefore, knowledge of the source of organic carbon in estuarine and coastal sediments and its distribution is vital to understand the biogeochemical cycles of these systems.
Due to the complicated process of sedimentary organic matter in coastal systems, multiple parameters such as δ13C, δ15N and the C/N ratio (the molar ratio of TOC and TN) have frequently been used as effective indexes for identifying organic matter sources, which have characteristic values (Hedges et al., 1988; Andrews et al., 1998; Maksymowska et al., 2000; Hu et al., 2006). The δ13C values characteristic of aquatic plants are mainly controlled by bicarbonate (δ13CHCO3−=~0‰) or dissolved CO2 (δ13Catm =~−8‰). Whereas HCO3− in the marine environment is mainly assimilated by the marine phytoplankton, dissolved CO2 (δ13C ~−8‰) is preferentially utilized by the freshwater phytoplankton (Lamb et al., 2006). Consequently, δ13C values characteristic of phytoplankton range from a depleted 13C value in freshwater setting to an enriched 13C signature in the ocean. Therefore, marine producers have higher δ13C values than terrestrial primary producers, allowing us to trace the source of organic carbon in sediments of coastal environment (Bouillon et al., 2000). For example, the δ13C characteristic values of phytoplankton in temperate ocean vary from −18‰ to −22‰ (average=~20.5‰)(Middelburg and Nieuwenhuize, 1998), while the characteristic δ13C values of terrestrial C3 plants usually range from −25‰ to −33‰ (average=~27‰) (Fry and Sherr, 1984; Boutton, 1991; Ramaswamy et al., 2008; Gao et al., 2012; Remeikaitė-Nikienė et al., 2017). Similar to δ13C, the δ15N values of macrophytes and phytoplankton are controlled by the sources of dissolved inorganic nitrogen. Typical δ15N value of marine particulate organic matter is in the range of 3‰–12‰ (average=~6‰) and terrestrial plant varies from −5‰ to +18‰ (average=~3‰) (Wada and Hattori, 1991; Muller and Voss, 1999; Maksymowska et al., 2000). Additionally, the C/N ratio of sedimentary organic matter does not occur diagenetic change after burial due to that over 90% of the organic matter has been mineralized during the setting processes (Meyers, 2003). Thus, the C/N ratio is also an excellent index to trace the source of the deposited organic matter (Hedges and Oades, 1997; Louchouarn et al., 1999; Wu et al., 2007). The C/N atomic ratios of phytoplankton range between 4 and 10 due to their low cellulose and high protein compositions, while bacterioplankton has C/N atomic ratios ranging between 2.6 and 4.3 (Lee and Fuhrman, 1987). In contrast, the high cellulose and lignin composition of vascular terrigenous plants, along with low protein content, results in higher C/N atomic ratios, varying between 12 and 200 (Hedges and Mann, 1979; Meyers, 1994; Meyers, 1997; Sampei and Matsumoto, 2001; Meyers, 2003).
The eastern Guangdong coast (EGDC) holds great importance as one of the key zones along the southeastern coast of China, and it has experienced significant anthropogenic influences due to rapid urbanization and industrialization processes (Qiao et al., 2013). Hanjiang River flows into the sea through multiple branches and is the main river flowing into the sea in the EGDC. Rongjiang and Lianjiang Rivers flow into the EGDC through Port of Shantou and Haimen Bay respectively. The nutrients contents (e.g., dissolved inorganic nitrogen: DIN) entering the sea shows an overall increasing trend during the period of 2004-2015 (Wu, 2017). The EGDC receives substantial fluxes of terrestrial matter, anthropogenic nutrients from sewage and agricultural discharge, and marine fish farming (Huang et al., 2003), which gives rise to a suit of prominent ecological environmental questions, such as eutrophication and frequent outbreaks of harmful algal blooms, but no report of hypoxia (Xiao et al., 2021). They have the potential to change the content of organic matter in marine deposits and their δ13C, δ15N and C/N values, which further impacts and regulates the processes of carbon cycle such as in site production and turnover of organic carbon (Owen and Lee, 2004). Meanwhile, the chemical process of the EGDC is complex and changeable due to multiple river inputs, which has unique characteristics different from the estuary of a single river entering the sea. Therefore, it is necessary to understand the source and fate of organic carbon under the multi river inputs. However, there is limited information about organic matter in the EGDC, including the sources of organic carbon and their distributions. Here, we report the TOC and TN concentrations and their isotopic compositions of the EGDC sediments from the subtropical coastal ocean of China. The objective of this study is to determine the distribution and source of organic matter deposited in this coastal region, as well as to quantify the proportions of different sources. This study also establishes a background organic carbon database in the coastal environment for use in future studies of blue carbon in order to achieve the carbon neutrality in China.
2 Materials and methods
2.1 Study area
The EGDC is an important hub connecting the South China Sea (SCS) and East China Sea (ECS). Its nearshore ecosystem is impacted by multi rivers in the Chaoshan zone: e.g., the Hanjiang, Rongjiang and Lianjiang. The Hanjiang, Rongjiang and Lianjiang River basins have annual average rainfall and runoff of 1600 mm and 2.7×10¹⁰ m3, 2033 mm and 3.5×10⁹ m3, and 1700 mm and 1.0×10⁹ m3, respectively (Zhuang et al., 2019). They discharge an estimated water volume of 3.31×10⁸ m3 yr-1 into the SCS (Zhuang et al., 2019), which is three orders of magnitude lower than mean annual runoff discharge in the Pearl River (3.2×10¹¹ m3 yr-1) (Lu et al., 2009). Hanjiang River, with a basin area of 30,112 km2, is the second largest river (after Pearl River) in Guangdong Province (Liu et al., 2016). A simple comparison of the runoff, sediment load and nutrients between the Hanjiang river and the other major rivers was listed in the Table S1 (Supporting Information, SI). In addition to the influence of riverine runoff, strong upwelling and Zhe−Min coastal current affect the EGDC in summer and winter, respectively (Gan et al., 2009; Hu et al., 2011).
2.2 Field sampling
Field measurements were conducted onboard the R/V Haijian 203 during spring, summer and winter cruises in 2021 in the EGDC organized by the Key Special Project for Introduced Talents Team of Southern Marine Science and Engineering Guangdong Laboratory (Guangzhou). Detailed sampling locations are plotted in Figure 1. Surface sediment samples (0-3 cm) in the EGDC were collected with a grab sampler in January (winter cruise), April (spring cruise) and August (summer cruise) of 2021. Sediment cores (Y3 and Y5) were also collected during the 2021 spring cruise so as to investigate the storage capacity of organic carbon in the nearshore and aquaculture area. To better present the goals of this study, we divided the investigated area into several main regions. Stations Y1−Y3 are located in the nearshore region, while stations Y14−Y15 and Y31−Y34 are regarded as the offshore region. Station Y5 is located in the seawater aquaculture area including the fish culture, shellfish culture, shrimp culture, crab culture, algae culture. And stations Y22−Y23 are located in the seaweed bed area. In addition, surface sediment samples from the Hanjiang (HJR1-4, HJR6, HJR11, HJR14-16), Rongjiang (RJR2) and Lianjiang Rivers (LJR1-3, LJR5-6, LJR8) were collected in June 2021 (summer cruise) to obtain terrestrial background information in the upper reaches of the coastal watershed. Sediment samples were kept frozen until returning to the land laboratory. They were dried by electric blast drying oven at 60°C for at least 24 h then pulverized using an agate mortar and pestle in preparation for carbon and nitrogen analyses.
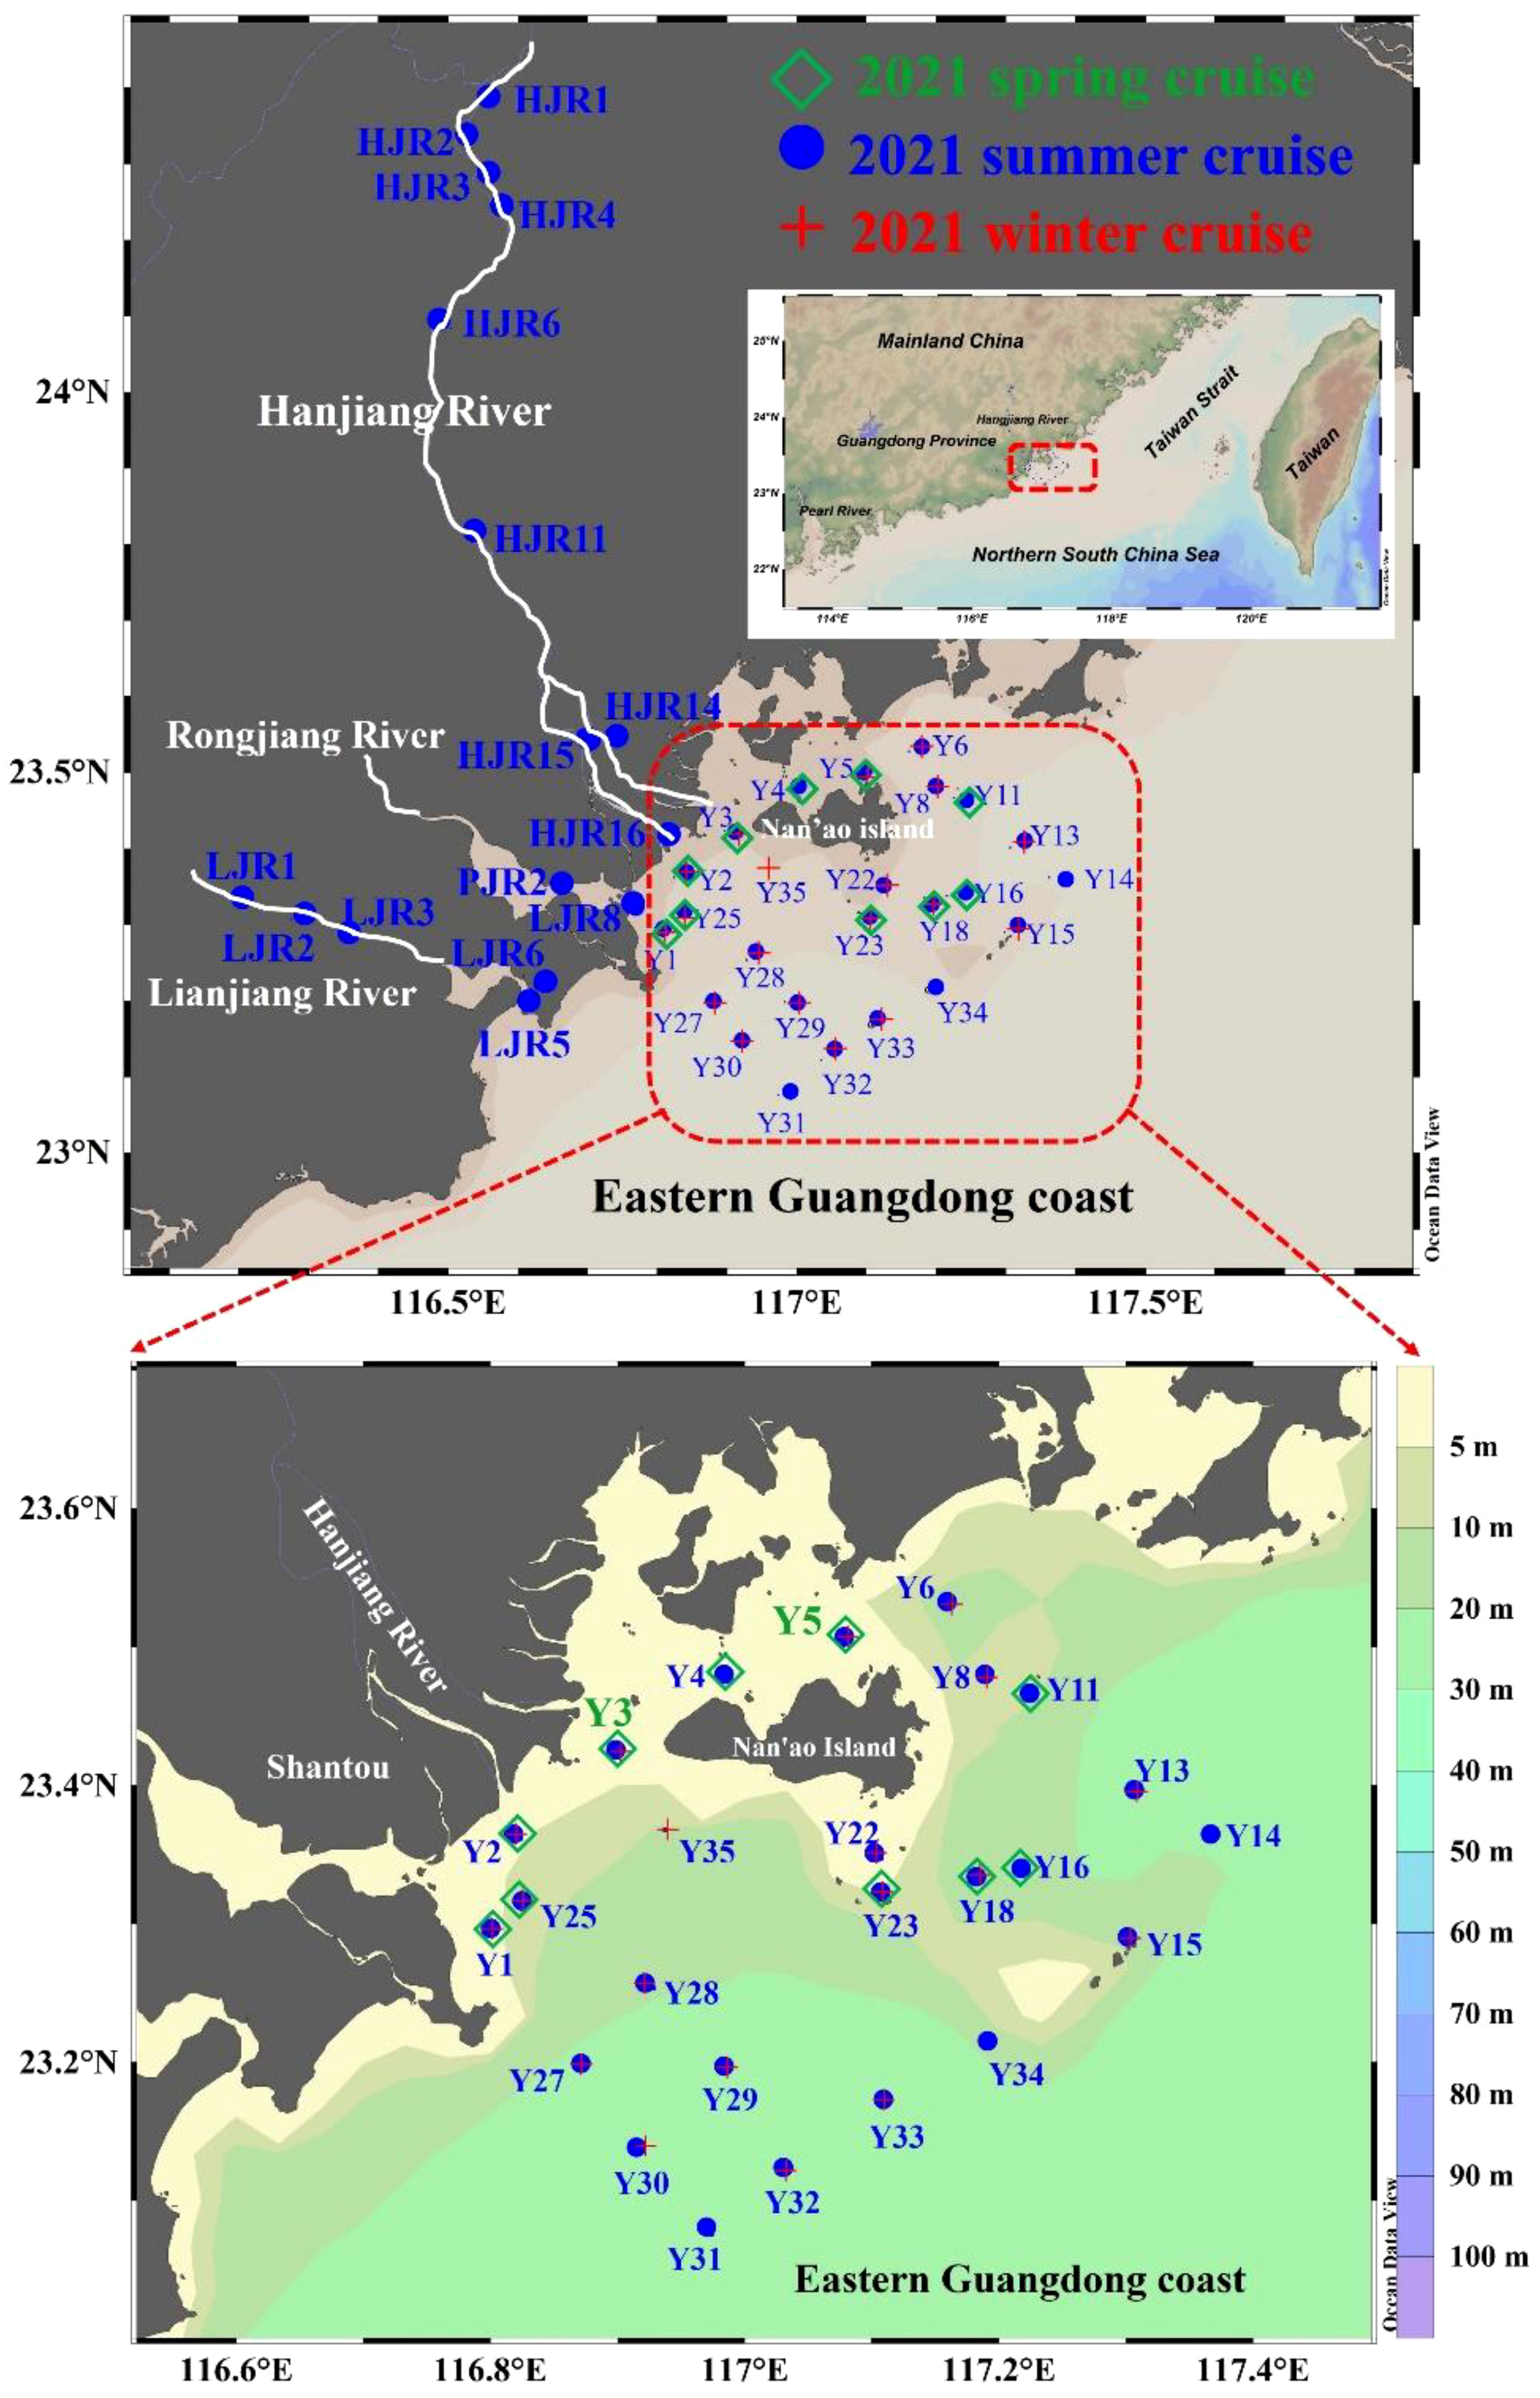
Figure 1 Map of the eastern Guangdong coast with details of the sites sampled during the spring, summer and winter cruises. Green diamonds indicate stations where surface sediment samples, except for sediment cores Y3 and Y5 (large green font) were collected in April, 2021 (spring cruise). Blue circles represent stations where surface sediment samples were collected in August, 2021 (summer cruise); red crosses represent the surface sampling stations visited in January, 2021 (winter cruise).
2.3 Sample processing and analysis
Analytic procedure for sediment grain size has been in detail described in elsewhere (Mi et al., 2022). In brief, the sediment samples were pretreated with 5 mL 10% hydrogen peroxide and 5 mL 3N HCl. Then, the samples were dispersed with 5 mL 0.5% (NaPO3)6 and subsequent ultrasonic dispersion. The grain size was determined by a Master Sizer 2000 laser particle sizer (Malvern Instruments Ltd., England), located in the Third Institute of Oceanography, Ministry of Natural Resource. The measured size range was 0.02–2000 μm, a particle resolution of 0.01 φ and relative error< 3%.
Non-destructive analysis of 210Pb in sediment using HPGe detector (ORTEC GMX-100-230) interfaced to a digital spectrometer (DSPec Plus®) has been in detail described in elsewhere (Zhao et al., 2012). Activities of 210Pb and 214Pb (supported 210Pb) were determined from the count rate of gamma-ray energies at 46.52 keV and 351.99 keV, respectively. Meanwhile, natural sediment standard of IAEA-300 (Baltic Sea sediment) was measured to obtain the detector efficiencies for this geometry and detector backgrounds.
Sample processing for TOC, TN, δ13C and δ15N analysis refer to the procedures of Hu et al. (2006). Before TOC and TN analysis, subsamples of the dried and homogenized sediments were treated with 4 N HCl to effectively get rid of inorganic carbon, followed by three rinses with deionized water to remove salt content. They were then dried in an electric blast drying oven at 60°C. The standards of USGS-40, IAEA-600 and Acetanilide were used to test analytical method. The concentrations of TOC and TN were determined on a Vario EL−III elemental analyzer with precisions of σTOC = ± 2.0% (n = 10) for C and σTN = ± 0.30% (n = 10) for N, respectively. The weight percentage of TOC and TN in the dry sediment was determined using the gravimetric method. This “acid washing method” results in the loss of organic carbon should be less than 4%.
δ13C and δ15N analysis was performed on carbonate free sediment subsamples, using EA−IRMS interfaced with a MAT 253 plus mass spectrometer, located in the Third Institute of Oceanography, Ministry of Natural Resource. Results are calculated by the following equation (1):
where δ (‰) represents the δ15N (‰) or δ13C (‰) value, and R reference and R sample indicate the 15N/14N or 13C/12C atom ratios of the reference and sample, respectively. The references for δ15N and δ13C are atmospheric N2 and the Vienna Pee Dee Belemnite (VPDB) standard, respectively. Based on triplicate analyses of a sample, the average standard deviations of δ15N and δ13C were ±0.3‰ and ±0.2‰, respectively.
2.4 Statistical analysis
To examine if the data of C and N exhibit seasonal differences in the EGDC, we used a simple F-test and T-test as described minutely in Lettner et al. (2000). Briefly, the probability value of<0.05 in the F-test indicates non-homogeneous variance between the datasets. A p-value of<0.05 in the T-test indicates a statistically significant difference in means between the datasets. The opposite is true if the p-values are ≥0.05. Meanwhile, principal component analysis (PCA) was performed to identify the sources of organic carbon in the EGDC sediment (Belicka and Harvey, 2009).
3 Results and discussion
3.1 Temporal−spatial distributions of TOC concentrations and δ13C values in sediment
3.1.1 TOC concentrations
The TOC concentrations of surface sediments in the EGDC are listed in Table S2. In spring, the TOC concentrations ranged from 0.05% to 0.93%, averaging 0.53% ± 0.33% (n=10). In summer, they are in the range of 0.06%-0.90%, with an average value of 0.36% ± 0.29% (n=24), which is significantly lower than those obtained in the Hanjiang (0.72% ± 0.43%, n=9) and Lianjiang (1.53% ± 1.40%, n=7) River basins (student t–test, p<0.05). In winter, the TOC concentrations are comparable to those in summer, varying from 0.05% to 0.89% (average=0.37% ± 0.29%, n=19). It is worth pointing out that fewer data were collected in spring compared to in summer and winter, and samples were mainly collected near shore where TOC concentrations were higher overall. Thus, the average value of TOC concentration found in spring is slightly higher than those from summer and winter. Indeed, the average TOC concentrations of samples from the same stations collected during different seasons are equivalent (e.g., stations Y1–Y3, Y5, Y18, Y23 and Y25: ~0.59% in spring, ~0.64% in summer and ~0.57% in winter) and their TOC variations are minor. We also statistically compared differences in TOC concentrations during the different seasons based on an F−test and T−test; the results show that the TOC contents in the surface sediments at the same stations in spring and summer are not substantially different (student t–test, p>0.05), as well as those in summer and winter (student t–test, p>0.05). Therefore, we conclude that there is no seasonal variability in sedimentary TOC content in the coastal sediments. The TOC concentration in surface sediments instead mainly depends on the deposition of particulate organic carbon (POC) in the upper water column, including terrestrially and marine derived organic carbon. Additionally, terrestrial inorganic and dissolve organic carbon can be converted into POC after biological transformation and deposited into sediment (Wen et al., 2021). Riverine DOC and POC discharged into an estuary usually show significant seasonal variability (Wen et al., 2021); for example, in the Pearl River estuary (Huang et al., 2020; Wen et al., 2021) and Yangtze River estuary (Sun et al., 2021). The POC concentrations in the investigated area here also varies seasonally (student t–test, p<0.05). For example, in summer, the POC concentrations in surface seawater ranged from 9.1 to 31.0 μmol/L, averaging 17.5 ± 6.4 μmol/L (n=27). In winter, they varied from 8.8 to 64.3 μmol/L (average=23.6 ± 16.5 μmol/L, n=25). Therefore, marine POC should be the dominant contributor to sedimentary TOC in this region (see later discussion).
The lateral distributions of surface sediment TOC concentrations during the different seasons, plotted in Figure 2, consistently show a decrease with increasing distance offshore. For example, in summer, the TOC concentrations along transect 1 (stations Y1−Y27−Y30−Y31) decreased from 0.90% to 0.08%, declining by ~91%. Similarly, along transect 2 (stations Y2−Y28−Y29−Y32), the TOC concentrations also decreased, declining in ~90% from 0.86% to 0.09%. In the nearshore stations Y1−Y3, the TOC concentrations varied from 0.64% to 0.90%, averaging 0.80% ± 0.14% (n=3), and were significantly higher than the measured results of the offshore stations Y31−34 and Y14−Y15, which ranged from 0.07% to 0.13% (average=0.09% ± 0.02%, n=6). Note that, the TOC concentration in the aquaculture area (station Y5) also showed a high value of 0.90%, which is comparable to those in nearshore. In the seaweed bed area (e.g., stations Y22−Y23), the TOC concentrations ranged from 0.44% to 0.51%, averaging 0.48% ± 0.05% (n=2), which is lower than those in the aquaculture area. A similar pattern was also observed during the other two seasons. Lateral TOC distributions are mainly related to the following factors: 1) high riverine fluxes of nutrients (DIN: 42.2×10⁶ kg yr-1 N; SRP: 0.7×10⁶ kg yr-1 P; DSi: 158.6×10⁶ kg yr-1 Si) and organic carbon (DOC: 54.5×10⁶ kg yr-1) in the Hanjiang river estuary (Zhao, 2019; Zhou et al., 2023), 2) sediment types characterized by clayey silt in the river mouth, 3) water depth, 4) high biomass and depositional fluxes in the aquaculture area. Given the presence of the large riverine fluxes of nutrients and organic carbon, it is to be expected that the deposition rate of organic particles will be greater (Zhang et al., 1999), resulting in higher TOC concentrations in the estuary and nearshore. Meanwhile, we measured the sediment grain size in summer cruise. The results show that the sediment in the EGDC is characterized by a change from clayey silt nearshore to sandy silt offshore; for example, the mean sediment grain sizes along transect 2 (stations Y2−Y28−Y29−Y32) varied from 7.3 φ (Y2) to 2.9 φ (Y32). This pattern can be attributed to the deposition of terrigenous materials resulting from the suspension of fine particles carried by the Hanjiang, Rongjiang, and Lianjiang rivers. In the nearshore area, a large amount of fine sediment accumulates under the interaction effect of freshwater discharge and tidal currents (Xia et al., 2013). However, as the surface sediments moves farther away from the river mouth, it becomes coarser due to the strong dynamic effects, resulting in a large proportion of coarse-grained particles, primarily composed of sand. The clayey silt is favorable for the adsorption and storage of organic carbon, which has been observed in the Pearl River estuary (Yang et al., 2011). The TOC concentration in the sediment is positive correlation with the percent of fine−grained sediment (Hu et al., 2006). The water depth in the EGDC deepens as increasing distance offshore, and the shallower water depths are favorable for the rapid sinking of POC into the seabed. In the estuaries of Pearl River and Yangtze River, the TOC concentrations of the surface sediments are also significantly negatively correlated with water depth (Zhou et al., 2006; Yang et al., 2011). Additionally, high nutrients and a suitable environment in the aquaculture area enhanced biomass accumulation and depositional fluxes (Herbeck et al., 2013; Liu et al., 2021), which are responsible for high TOC concentrations in sediment.
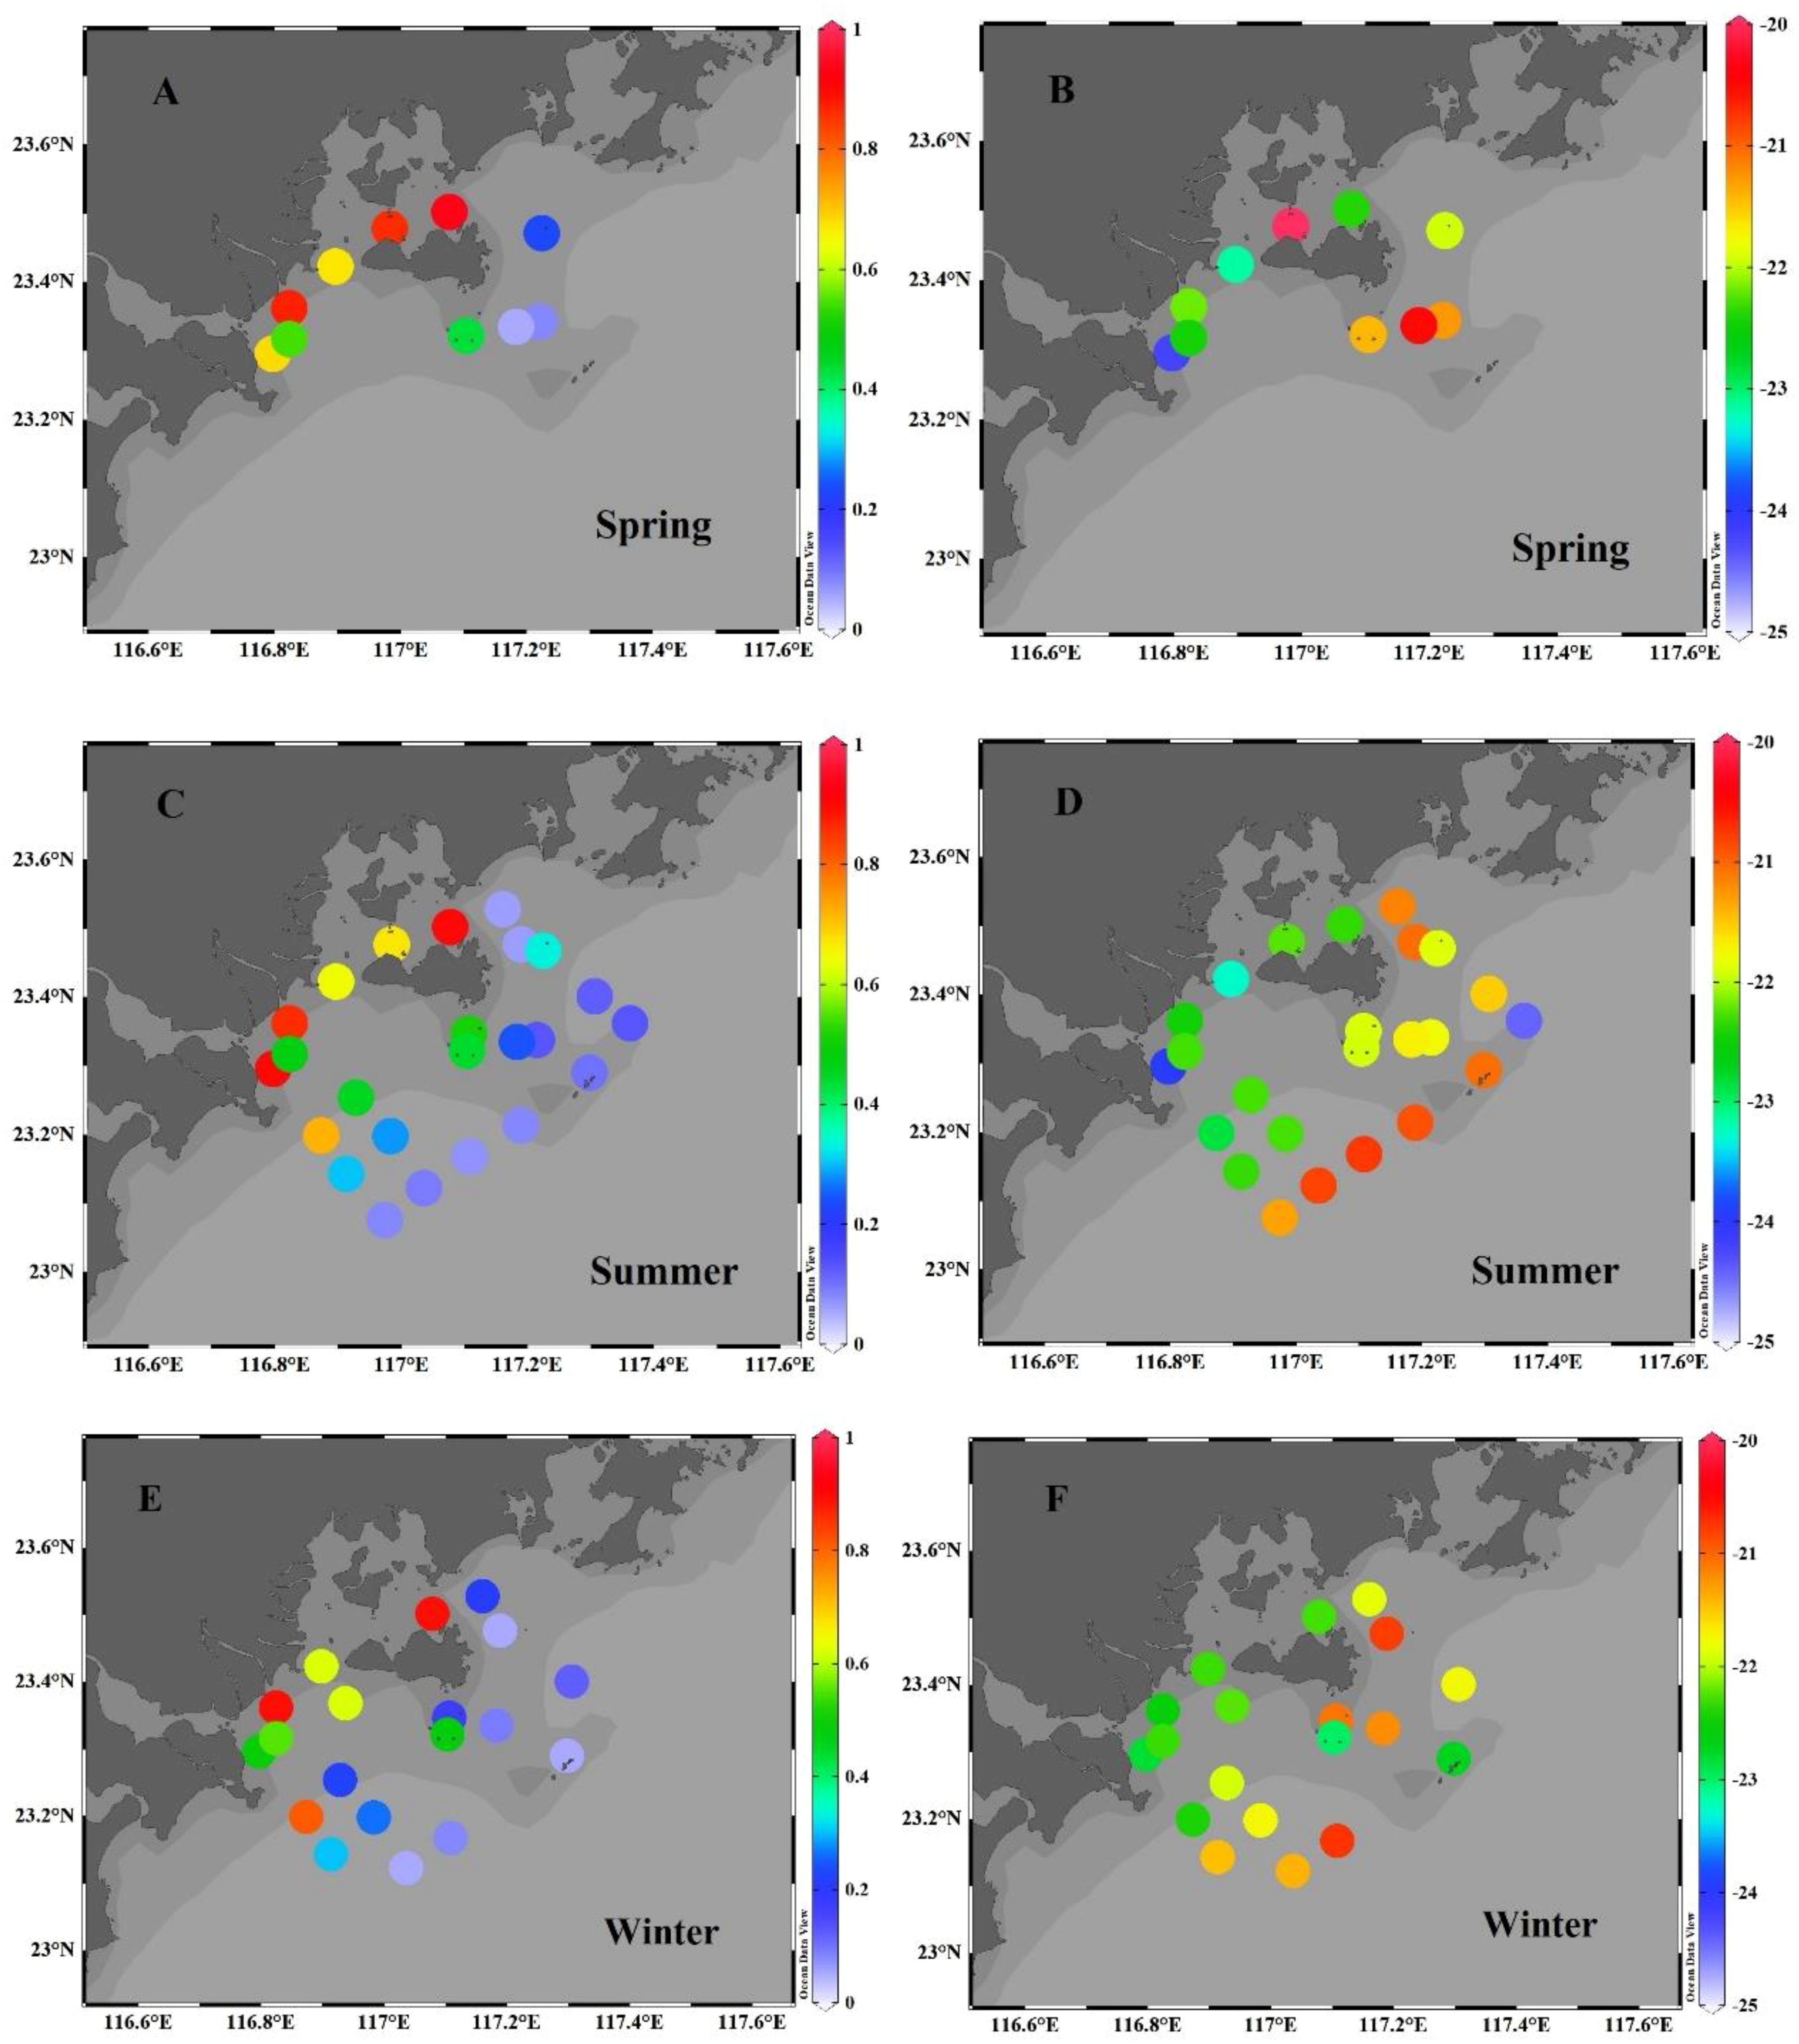
Figure 2 Horizontal distributions of TOC concentration (A, C, E) (unit: %)) and δ13C (B, D, F) (unit: ‰)) in the surface sediments of the eastern Guangdong coast during the spring (A, B), summer (C, D) and winter (E, F).
3.1.2 δ13C values
The δ13C values in surface sediments of the EGDC are listed in Table S2. In spring, they ranged from −24.2‰ to −19.6‰, averaging −21.9‰ ± 1.3‰ (n=10). In summer, they ranged from −24.4‰ to −20.8‰, averaging −22.0‰ ± 0.9‰ (n=24), which is heavier than the δ13C of particles exported from the Hanjiang (−24.9 ± 1.4‰, n=9) and Lianjiang (−24.5 ± 2.2‰, n=6) River basins (student t–test, p<0.05). In winter, the δ13C values in surface sediments varied from −23.0‰ to −20.7‰, averaging −21.9‰ ± 0.7‰ (n=19). We use the F−test and T−test to show there has no seasonal variability in the δ13C values of surface sediments at the same stations between spring and summer (student t–test, p>0.05). Similarly, they were not significantly different in summer versus winter (student t–test, p>0.05). Therefore, we conclude the δ13C values of surface sediments in the study region have no seasonal variability, further suggesting there received a relatively stable marine POC source.
The horizontal distribution of δ13C in the EGDC, plotted in Figure 2, shows an increase in δ13C value with increasing distance from the shore. In summer, the δ13C values at nearshore stations Y1−Y3 varied from −24.0‰ to −22.5‰, averaging −23.2‰ ± 0.7‰ (n=3). These values are slightly lower than those of offshore stations Y31−Y34 and Y14−Y15, which ranged from −24.4‰ to −20.8‰ (average=−21.6‰ ± 1.4‰, n=6). The low δ13C values at nearshore stations are primarily caused by terrestrial organic matter discharged from the Hanjiang river, which is characterized by depleted δ13C values ranging from −25.0‰ to −33.0‰, while the mostly higher δ13C values at offshore stations reflect additions of marine organic matter which is featured by enriched δ13C values ranging from −18.0‰ to −22.0‰ (Middelburg and Nieuwenhuize, 1998). Note that, the δ13C in aquaculture area (station Y5) was slightly heavier (−22.4‰) compared to the δ13C of sediment nearshore (−23.2‰). In the seaweed bed area (stations Y22−Y23), the average δ13C value of −21.9‰ is slightly heavier than in the aquaculture area (−22.4‰). This implies the seaweed bed area receives higher proportion of marine organic matter compared to the aquaculture area.
3.2 Vertical distributions of TOC concentrations and δ13C values in sediment cores
3.2.1 TOC concentrations
The TOC concentrations in sediment core Y3, from nearshore in the EGDC, ranged from 0.44% to 0.67% (average=0.54% ± 0.07%, n=13; Table S3), showing slight variability. These TOC concentrations are slightly lower than the previously published values from sediment core S2 (0.53–0.75%, average=0.66%: Gu et al., 2021), which was located in a non−mariculture area off Nan’ao island, and the sediment cores BH2 (average=0.86%) and HKUV1 (average=1.07%) in the Pearl River estuary (Yang et al., 2011). However, the average TOC concentration in sediment core Y3 is slightly higher than the results of the sediment core CM97 (average=0.44%) in the Yangtze River estuary (Yang et al., 2011) and the core D2 (average=0.43%) in the Zhe-Min coastal mud area (Li et al., 2015). In the aquaculture area, the TOC concentrations of sediment core Y5 ranged from 0.78% to 1.06%, averaging 0.95% ± 0.07% (n=19), which are overall higher than in sediment core Y3. This suggests that the depositional flux of TOC in the aquaculture area is higher compared to the nearshore region. Indeed, the TOC concentrations in sediment core Y5 are also higher than previously reported results from sediment core S1 (a large seaweed aquaculture area located in the nearby Shen’ao Bay), which ranged from 0.51 to 0.64% (average=0.60%) (Gu et al., 2021), suggesting a higher depositional flux of TOC in core Y5. Indeed, it is reported that the deposition velocity of POC at the aquaculture area was ~1.5 times that at non-aquaculture area (Yoshikawa and Eguchi, 2013). TOC concentrations in core Y5 are also higher than the published results obtained in sediment core CM97 from the Yangtze River estuary, but are comparable to those in the Pearl River estuary (Yang et al., 2011). The downcore TOC profile fluctuates repeatedly throughout the length of the core (Figure 3A), which reflects dynamic depositional processes nearshore. Meanwhile, carbon stock per unit area and flux of organic carbon are calculated by the following equations (Birungi et al., 2023):
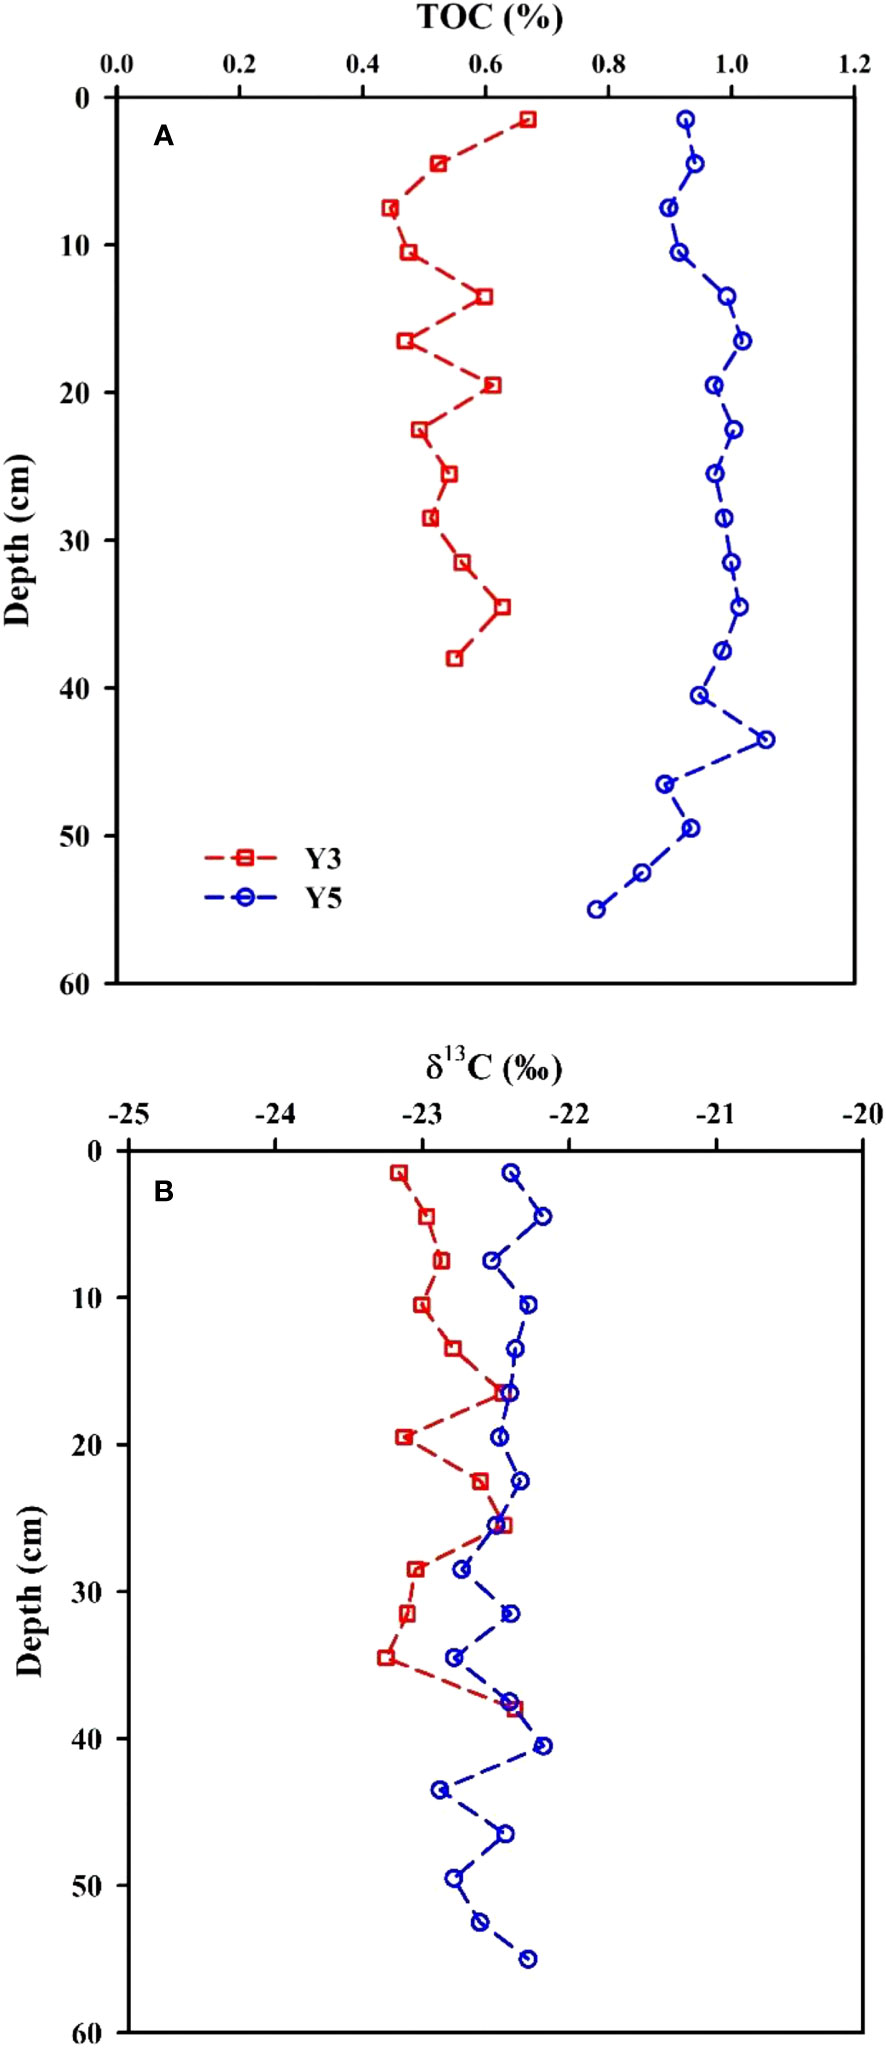
Figure 3 Vertical distributions of TOC (A) and δ13C (B) in sediment cores Y3 and Y5 from the eastern Guangdong coast.
where TOC (%) represents percent carbon concentration, BD indicates bulk dry density (g m−3) of sediment, d is depth of soil sample (cm) and S is the apparent sedimentation rate (cm/yr). The organic carbon stocks in the nearshore (Y3) and aquaculture area (Y5) are estimated to be 26.4 tC/ha and 55.2 tC/ha, respectively. The organic carbon stocks in the EGDC are lower than those estimated in the Zhanjiang mangrove national nature reserve (156.97−157.47 tC/ha: Wang et al., 2021) and the average value of 956 tC/ha in global mangrove forests (Alongi, 2014). They are also lower than those obtained in the terrestrial forests (113.8−282.5 tC/ha: Pan et al., 2011). However, there is the largest seawater aquaculture area in the Guangdong Province of China (about 1500 ha in 2011) (Gu et al., 2021), where the inventory of organic carbon in the aquaculture area is further calculated to be ~8.28×10⁴ tC. Additionally, we measured the natural radionuclide 210Pb in sediment cores Y3 and Y5 (see in Table S3) using gamma spectrometry. The 210Pbex activities in core Y5 are higher than those in core Y3, which is potentially related to the higher deposition flux of particulate matter in the aquaculture area than nearshore area. 210Pb in the atmosphere in the aquaculture area rapidly deposited into the sediment. Due to sampling limitation, the core depths in cores Y3 and Y5 are only 40 cm and 56 cm, respectively. Based on the existing 210Pb data and the average 226Ra activity of 50.4 ± 3.5 Bq kg-1, the 210Pbex in core Y3 has almost decayed, while 210Pbex in core Y5 has not fully decayed. But the vertical distributions of 210Pbex activities are well smooth. Here, we hypothesized that the materials in the investigated area maintained a consistent sediment accumulation rate. There was no surface mixed-layer in core Y3 according to an exponential decline in 210Pbex from the top of the core. While core Y5 was a 15 cm surface mixed-layer, which is characterized by a homogenous vertical distribution of 210Pbex activity. The apparent sedimentation rates at stations Y3 and Y5 were then calculated to be 1.05 cm/yr and 2.54 cm/yr, respectively. These apparent sedimentation rates are slightly lower than those obtained in nearby Shen’ao Bay (2.33−2.69 cm/yr: Ouyang, 2017). We further calculate the fluxes of organic carbon at stations Y3 and Y5 to be 71.0 ± 6.1 gC/m2/yr and 246.0 ± 23.4 gC/m2/yr, respectively. The flux of organic carbon in the aquaculture area is more than three that of the nearshore area, suggesting there is a great potential for increasing the carbon sink in the aquaculture area. Yoshikawa and Eguchi (2013) also reported the planktonic processes would contribute observably to the organic carbon sink in the coastal fish-culturing zone.
3.2.2 δ13C values
In the nearshore of the EGDC, the δ13C values in sediment core Y3 ranged from −23.3‰ to −22.4‰ (average=−22.9‰ ± 0.3‰, n=13; Table S3). In the aquaculture area, the δ13C values in sediment core Y5 varied from −22.9‰ to −22.2‰, averaging −22.5‰ ± 0.2‰ (n=19). They are comparable to those in the core D2 (average=−22.7‰ ± 0.4‰) in the Zhe-Min coastal mud area (Li et al., 2015) and the cores YZ and DH2 in the Yangtze River estuary (−22.2‰ ± 0.4‰: Zhao et al., 2012). The δ13C values are heavier than those measured in sediment core Y3 and are more close to the characteristic values from marine organic matter (Middelburg and Nieuwenhuize, 1998), suggesting core Y5 received a higher proportion from marine organic matter compared to the nearshore zone. The profile of δ13C exhibits little variability from the surface to the core bottom (Figure 3B), suggesting a relatively stable organic carbon source.
3.3 Temporal−spatial distributions of TN concentrations and δ15N values in sediment
3.3.1 TN concentrations
The TN concentrations of sediment samples were measured in the same subsamples as TOC, but were often below the detection limit (TN absolute content in ~25 mg sediment sample is not less than 10 μg) due to the sandy sample. Therefore, there is less data for TN than TOC. In spring, the TN concentrations in the EGDC surface sediments varied from below detection limit to 0.16%, averaging 0.09% ± 0.05% (n=10). In summer, they ranged from below detection limit to 0.15%, averaging 0.05% ± 0.05% (n=24), which is slightly lower than measured in the Hanjiang and Lianjiang River basins (0.10% ± 0.09%, n=16; student t–test, p<0.05). In winter, they ranged from below detection limit to 0.20%, averaging 0.05% ± 0.07% (n=19). Here, we use the F−test and T−test to examine the difference in the TN concentrations of surface sediments between seasons. The results show that the TN concentrations at the same stations between winter and summer have significant variation (student t–test, p<0.05), but their average difference (0.04%) is smaller than the precisions of elemental analyzer (σTN = ± 0.30%). While they were not significantly different in spring versus winter (student t–test, p>0.05) and spring versus summer (student t–test, p>0.05). Therefore, we conclude the TN concentrations of surface sediments in the investigated region have no seasonal variability.
The horizontal distribution of TN concentrations, plotted in Figure 4, shows a slight decrease in concentration with distance from the shore. For example, in summer, the TN concentrations at nearshore stations (e.g., stations Y1−Y3) varied from 0.06% to 0.14%, averaging 0.10% ± 0.04% (n=3), which is comparable to those in the seaweed bed area (stations Y22−Y23), but slightly lower than those in the aquaculture area (station Y5: 0.15%).
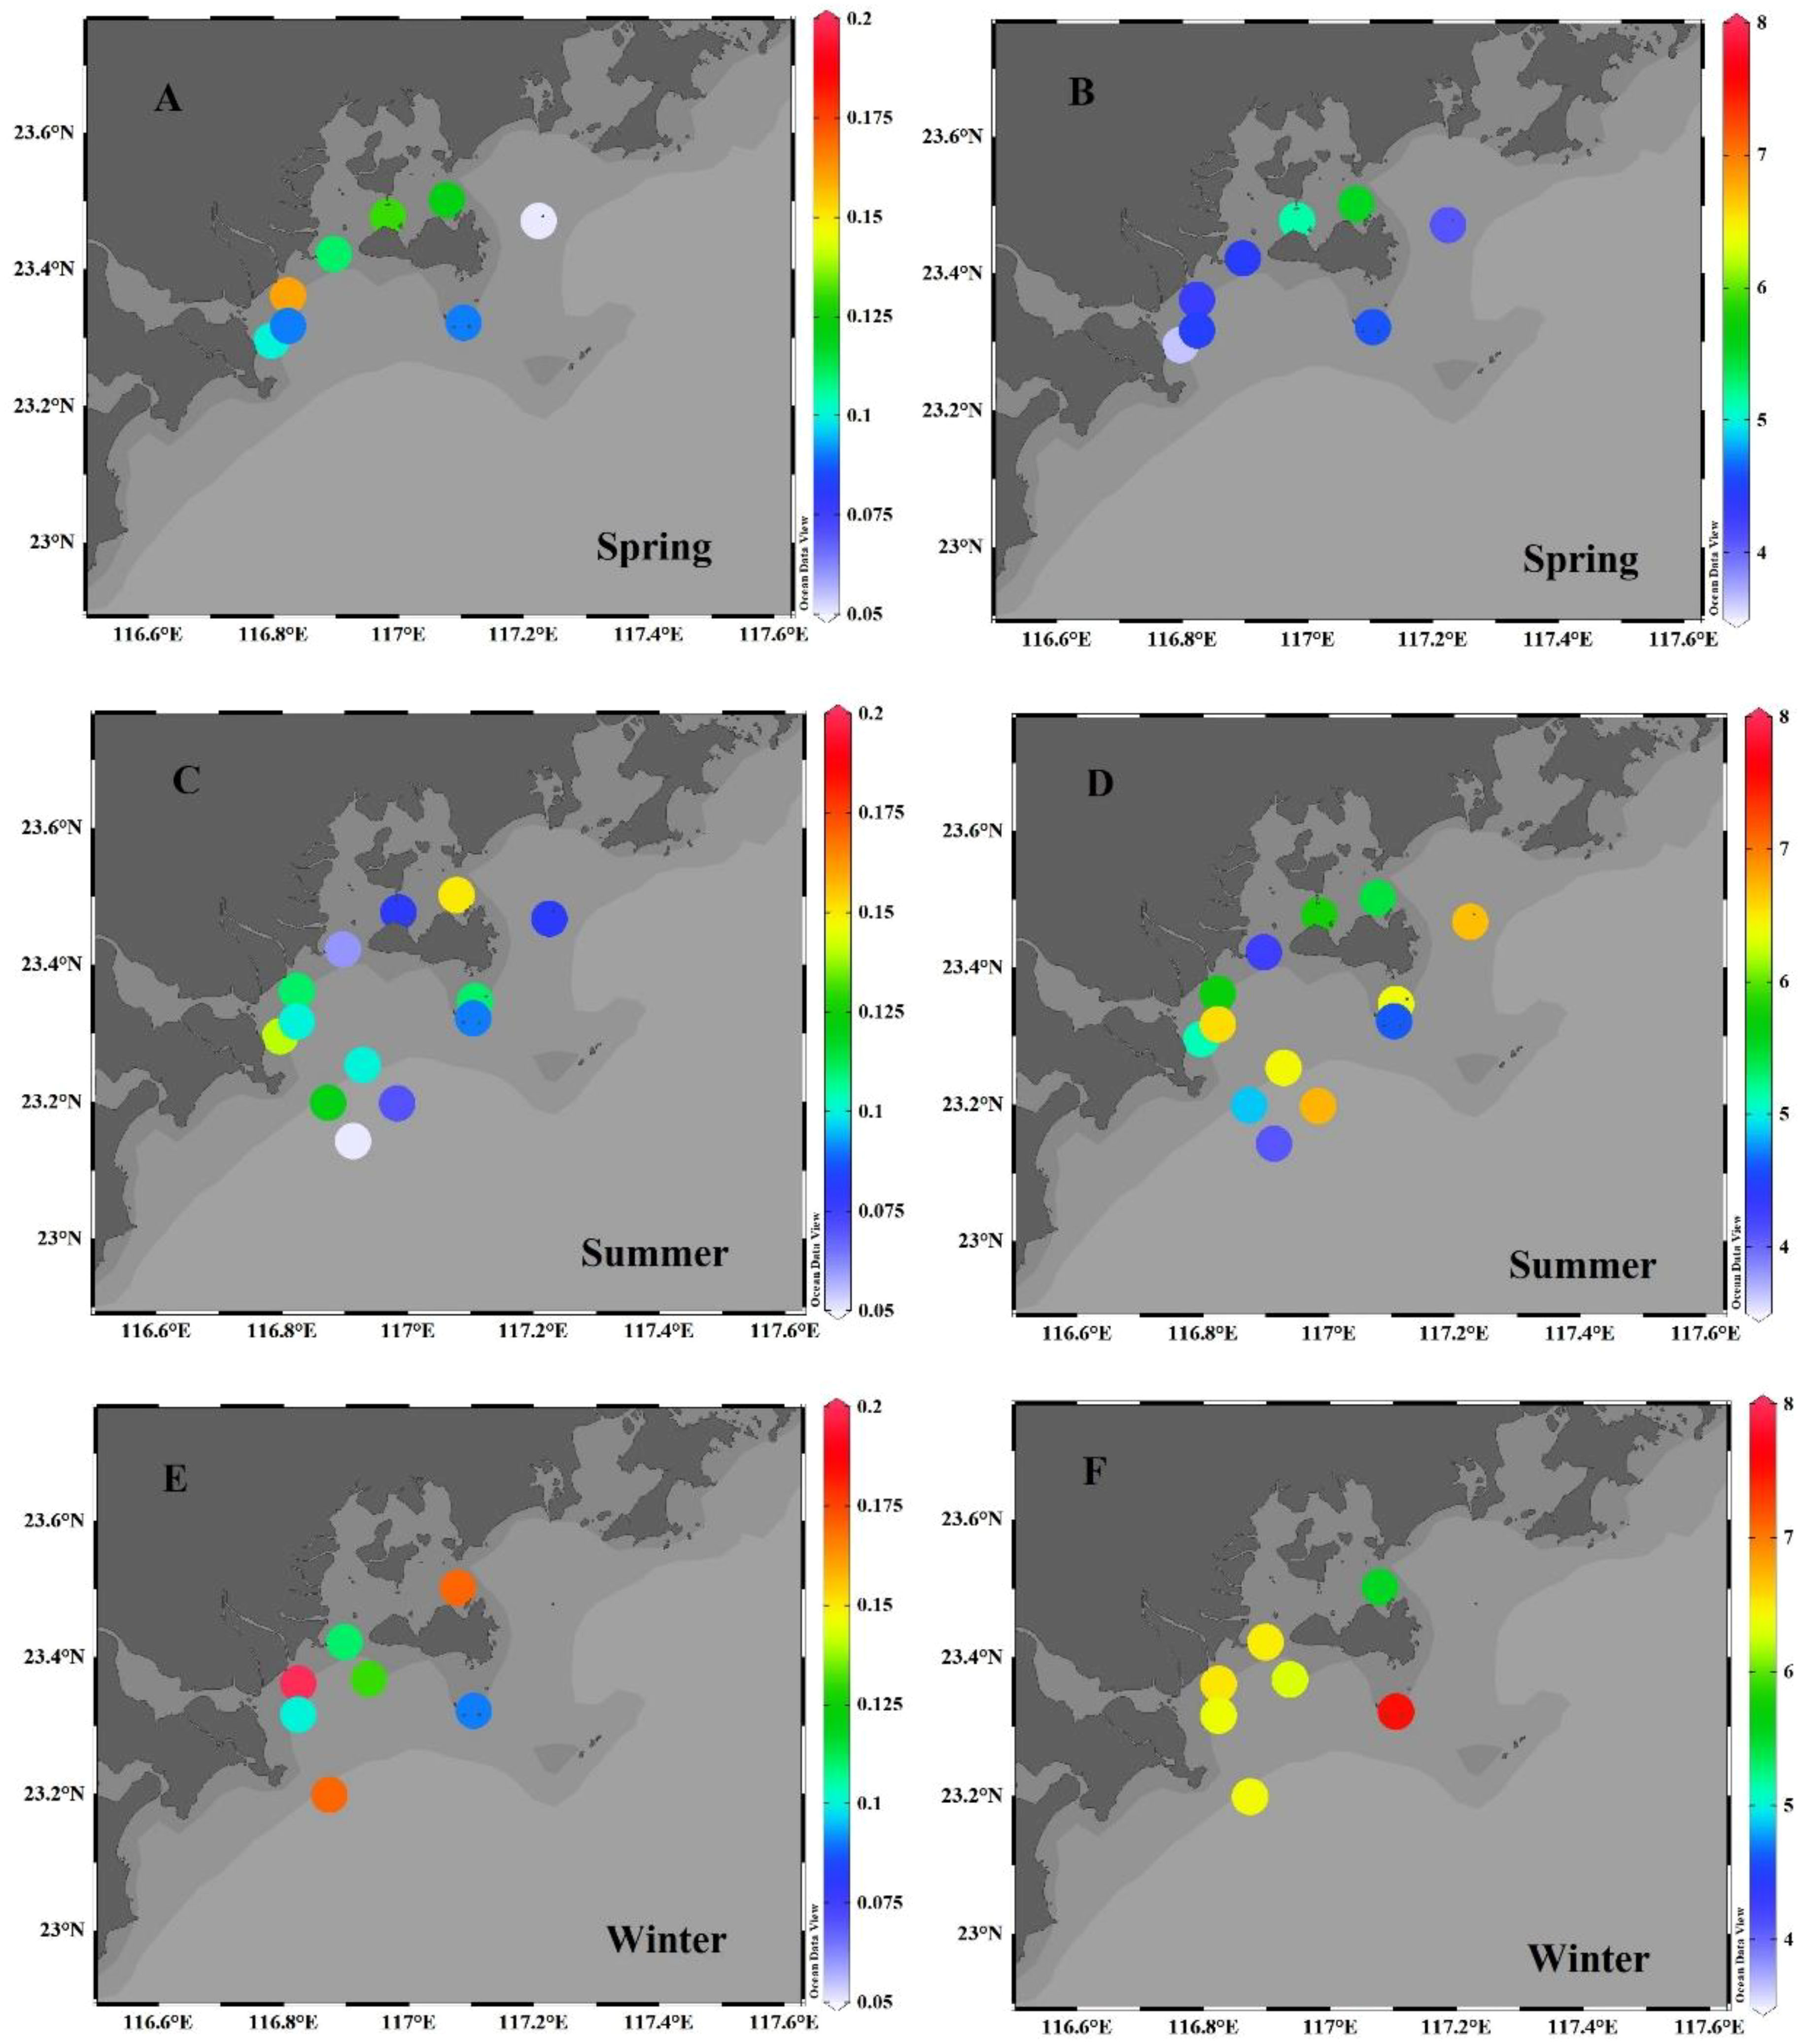
Figure 4 Horizontal distributions of TN (A, C, E) (unit: %)) and δ15N (B, D, F) (unit: ‰)) in the surface sediment of the Hanjiang estuary during the spring (A, B), summer (C, D) and winter (E, F).
3.3.2 δ15N values
In spring, the δ15N values in the EGDC surface sediments were in the range of 3.6‰-5.5‰, averaging 4.5‰ ± 0.6‰ (n=8). In summer, they ranged from 4.1‰ to 6.7‰, averaging 5.6 ± 0.9‰ (n=13), which is heavier than in the Hanjiang and Lianjiang River basins (4.8 ± 1.0‰, n=11; student t–test, p<0.05). In winter, they varied from 5.5‰ to 7.5‰, averaging 6.4‰ ± 0.6‰ (n=7). The δ15N values of surface sediments varied seasonally, with the values decreasing in the order of winter > summer > spring. In spring, frequent algal blooms occur, leading to the production of lighter δ15N organic matter that eventually sinks into the sediment. Meanwhile, the riverine input of terrestrial particulate matter in spring/wet season also exhibits relatively lighter δ15N. In contrast, a decrease in river runoff in winter/dry season leads to reduced input of terrestrial particulate matter. Conversely, the main source of biological uptake is marine organic matter, which tends to have enriched δ15N. Additionally, it should be noted that the δ15N exhibits greater variability compared to δ13C due to the faster nitrogen recycle and the substantial impact of bioturbation (Zheng et al., 2009). However, due to the limited number of sampling stations (only five stations) during three seasons, we have not extensively discussed the seasonal variation of δ15N values in this study. We plan to address this issue in future research with a more comprehensive dataset.
Spatially, the δ15N values in the EGDC surface sediments had no significant variation (Figure 4), suggesting there has similar nitrogen source. The mineralization utilization rates of TN in different area are commensurate, resulting in the similar δ15N values. In summer, the δ15N values nearshore (e.g., stations Y1−Y3) varied from 4.3‰ to 5.7‰, averaging 5.0‰ ± 0.7‰ (n=3), which is comparable to that of the aquaculture area (station Y5: 5.4‰). In the seaweed bed area (stations Y22−Y23), the δ15N values ranged from 4.6‰ to 6.4‰, averaging 5.5‰ ± 1.3‰ (n=2).
3.4 Vertical distributions of TN concentrations and δ15N values in sediment core
3.4.1 TN concentrations
The TN concentrations in sediment core Y3 varied from 0.08% to 0.11% (average=0.09% ± 0.01%, n=13), showing a little variation in the nearshore of the EGDC. In the aquaculture area, the TN concentrations in sediment core Y5 were in the range of 0.11%-0.17%, averaging 0.14% ± 0.02% (n=19), which is overall higher than in sediment core Y3. This suggests that the depositional flux of TN in the aquaculture zone is higher than it is nearshore, which is possibly related to the input of abundant aquaculture bait (Lin and Lin, 2022). They are comparable to those in the Yangtze River estuary (0.09% ± 0.01%: Zhao et al., 2012). The TN concentration repeatedly fluctuates downcore (Figure 5A), which reflects dynamic depositional processes in the nearshore.
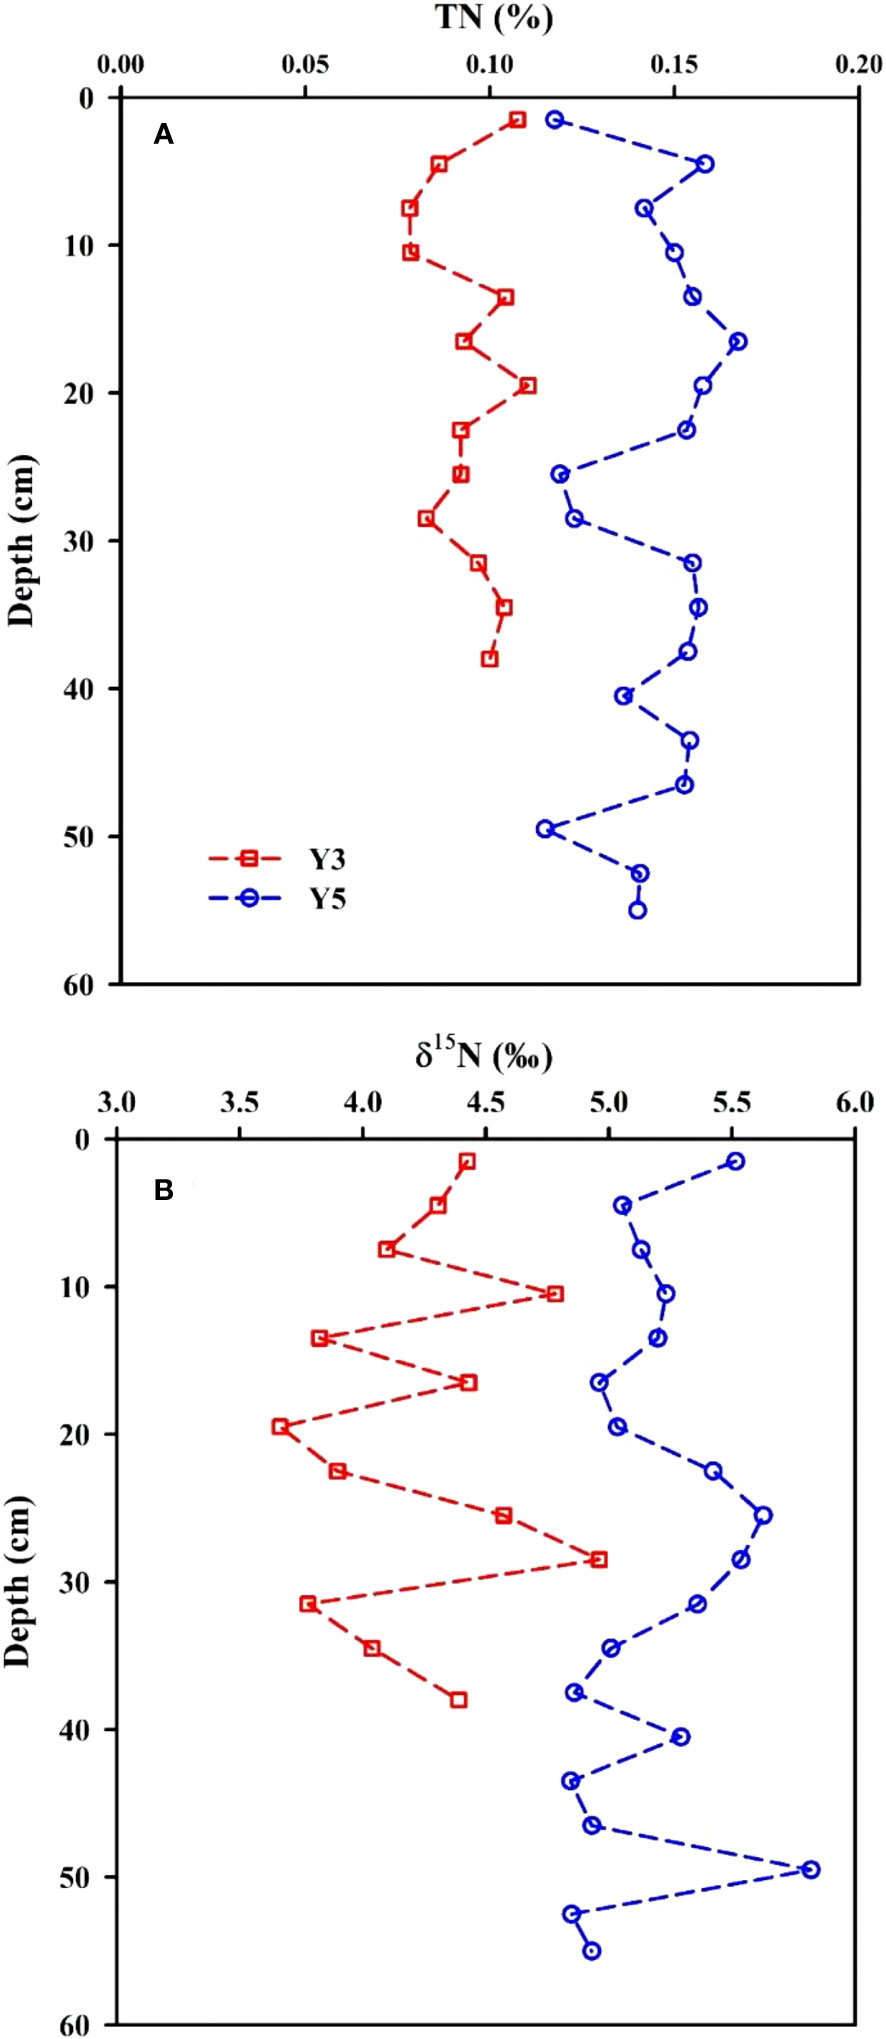
Figure 5 Vertical distributions of TN (A) and δ15N (B) in sediment cores Y3 and Y5 from the eastern Guangdong coast.
3.4.2 δ15N values
In the EGDC nearshore, the δ15N values in sediment core Y3 ranged from 3.7‰ to 5.0‰ (average=4.2‰ ± 0.4‰, n=13). In the aquaculture area, the δ15N values in sediment core Y5 varied from 4.8‰ to 5.8‰, averaging 5.2‰ ± 0.3‰ (n=19). They are comparable to those obtained in the cores YZ and DH2 of the Yangtze River estuary (4.3‰ ± 0.3‰: Zhao et al., 2012). The δ15N values are heavier than in sediment core Y3 and closer to characteristic values for marine organic matter (Gearing, 1988; Gao et al., 2012). The vertical distributions of δ15N in sediment cores Y3 and Y5 are plotted in Figure 5B. They show repetitive fluctuations with core length. The distribution of δ15N values in the upper 10 cm of core Y3 is consistent with its TN distribution, but is negatively correlated at the below 10 cm. While the distributions of δ15N and TN in sediment core Y5 are negatively correlated throughout the length of core. This may be related to the fractionation coefficient. The high TN content in sediment indicates low mineralization utilization rate, resulting in a relatively low δ15N value due to the influence of fractionation. In contrast, low TN content in sediment suggests high mineralization utilization rate, leaving the heavier N isotope. And thus, there correspondingly occurred in a relatively high δ15N value.
3.5 Organic matter source discrimination
The accumulation of organic matter in estuarine sediments is mainly influenced by the source of organic matter, sedimentation velocity, the decomposition rate of organic matter during transportation, burial, and diagenesis after deposition (Lin et al., 2000; Zong et al., 2006; Yang et al., 2011). Among these, the source of organic matter is considered a dominant control factor (Zong et al., 2006). Organic matter in the estuary is mainly contributed from allochthonous and autochthonous productions. Allochthonous sources consist of riverine input of terrestrial organic matter, while autochthonous organic matter mainly derived from marine phytoplankton that grow in the estuary. In the above introduction section, we summarize that terrestrial organic matter has lower δ13C (−25‰ to −33‰, average ~−27‰) and δ15N (−5‰ to 18‰, average ~3‰) values, and higher C/N ratios (> 12) compared to marine organic matter derived mainly from marine phytoplankton, which has higher δ13C (−18.0‰ to −22.0‰, average −20.5‰) and δ15N (3‰ to 12‰, average 6‰) values, and lower C/N ratios (5–8) (Lamb et al., 2006; Yang et al., 2011; Gao et al., 2012; Pradhan et al., 2014; Liénart et al., 2017). These differences in the composition of organic matter from different sources can influence their accumulation and preservation in estuarine sediments.
As shown in Figure 2, there is a net increase in δ13C of the surface sediments moving offshore of the EGDC. A direct explanation for this pattern is that the proportion of marine organic matter relative to terrestrial organic matter gradually increases towards the seaward. Nearshore sediment samples have depleted δ13C values, which are closer to the characteristic values of terrestrial organic matter found in the literature (−27‰ for δ13C: Gao et al., 2012). This is potentially related to riverine/terrestrial inputs dominated by the local hydrology and seasonal climate (Kendall et al., 2001). In general, plenty of riverine input freshwater laden with terrestrial organic matter and nutrients due to monsoonal precipitation results in the explosive growth of phytoplankton, especially in the nearshore and aquaculture areas. However, during winter/dry periods, freshwater discharging into the EGDC is limited. In contrast, offshore sediment samples have the enriched δ13C values, which is closer to the characteristic value of marine organic matter found in the literature (−20.5‰ for δ13C: Lamb et al., 2006; Gao et al., 2012), as organic matter accumulation there is sourced from marine phytoplankton production. The relationship between the δ13C and δ15N values of organic matter in the surface sediments and sediment cores, plotted in Figure 6, shows these measured values fall in between the characteristic values of terrestrial and marine organic matter (Gearing, 1988; Ramaswamy et al., 2008; Yang et al., 2011; Liénart et al., 2017). Meanwhile, we conducted PCA analysis using multiple parameters in order to accurately obtain the source of organic carbon. Variable loadings in three seasons of Factor 1 and Factor 2 from PCA of EGDC samples is plotted in Figures S1A–C. Here, we analyze the PCA summer result as an example. As shown in Figure S1B, the 15 variable parameters in the six sampling locations were used in the PCA analysis. Two factors (Factors 1 and 2) were generally responsible for 64.6% of the variance in the data. Factor 1 accounted for 46.5% of the total variance, showing high positive loading for TOC content, TN content, C/N ratio and three fine-particle related parameters (silt percentage, clay percentage, Mz). Factor 1 loadings showed the negative parameters including sand percentage, salinity, depth, δ13C and δ15N. Factor 2 only accounted for 18.1% of the total variance. Sand proportion and δ13C was characterized by negative loadings for both Factors 1 and 2. According to the positions of variables, we define the member A (TOC content, TN content, C/N ratio and three fine-particle related parameters) and member B (sand percentage, salinity, depth, δ13C and δ15N). Meanwhile, a representative sample score plot of the PCA was used to examine relationships between the sample locations and the factors (Figures S1D–F). As shown in Figure S1E, the groups A and B were divided according to their sample scores; and each group was characterized by variables in the members A and B defined earlier. Along Factor 1, the nearshore samples (Group A) were resolved from samples collected from the offshore (Group B). Group A was mainly defined by TOC content, TN content, C/N ratio and three fine-particle related parameters, indicating that the terrestrial organic matter is the main source for this group. Group B was characterized by the sand percentage, salinity, depth, δ13C and δ15N, indicating that the marine organic matter is the major source for this group. All this suggests the sedimentary organic matter in the EGDC is sourced from marine and terrestrial organic matter, with relative contributions varying spatially.
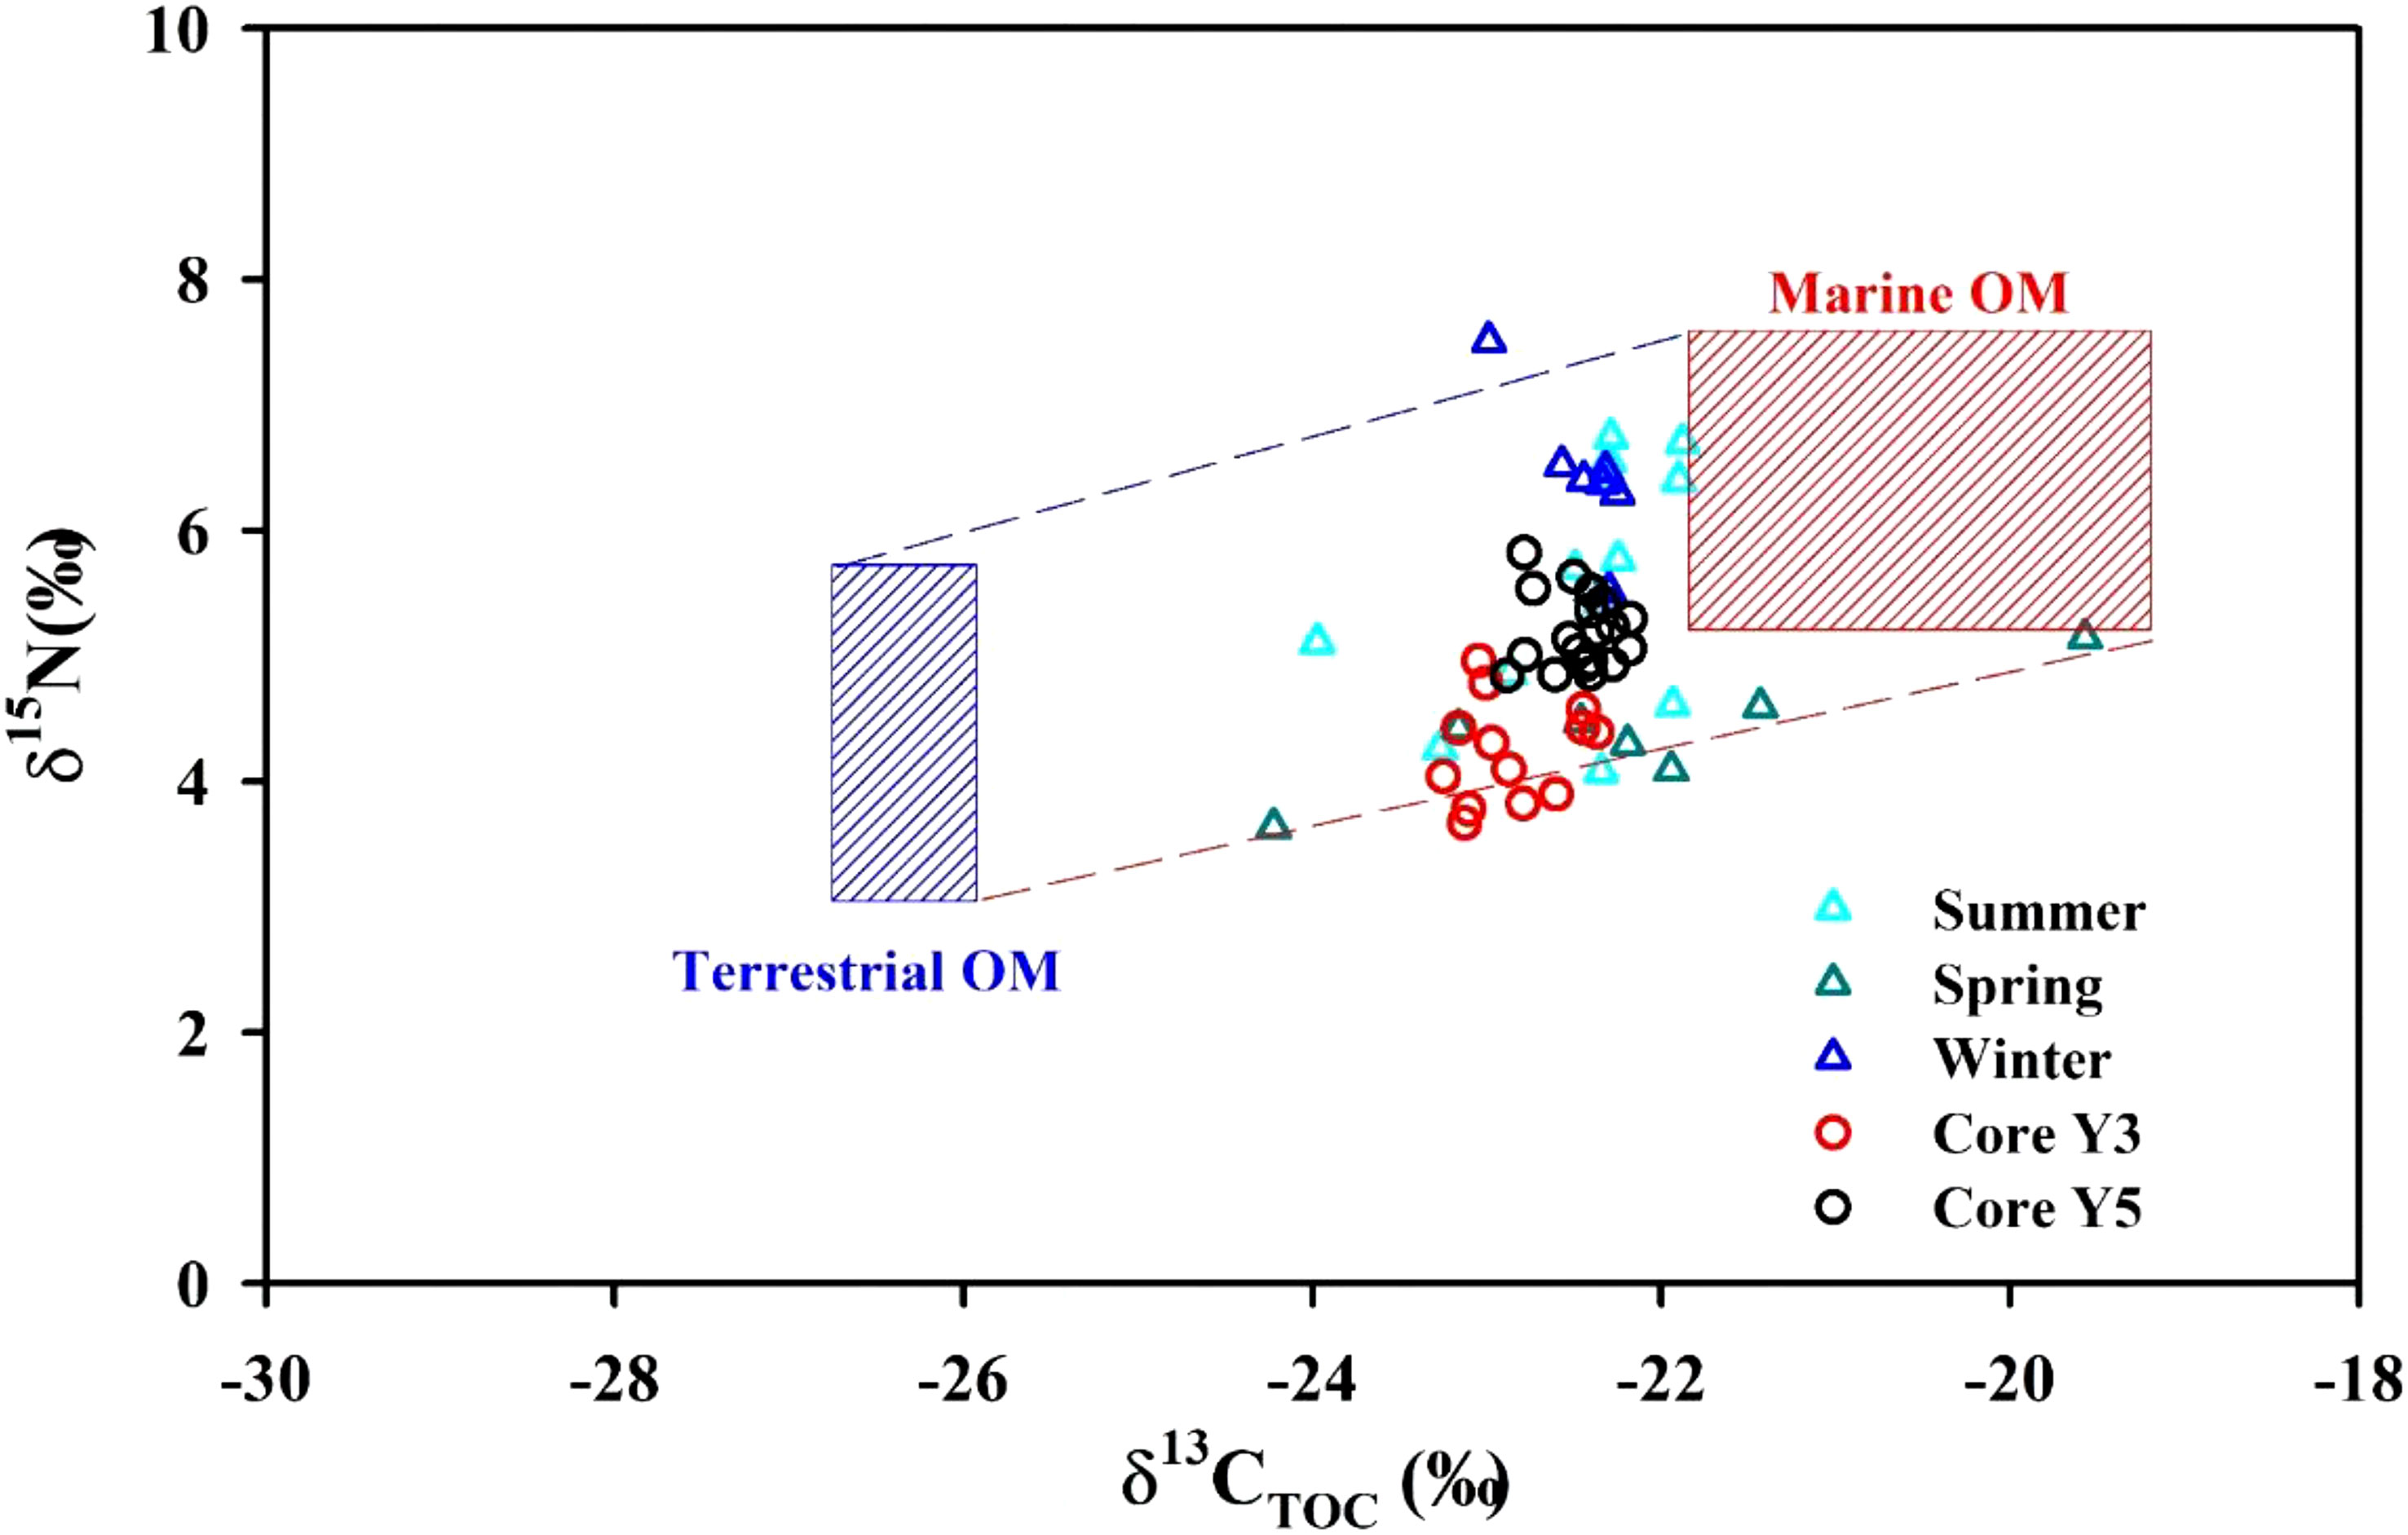
Figure 6 Binary plot of organic matter δ15N versus δ13C in surface sediments (triangles) and sediment cores (circles). OM indicates organic matter.
The C/N ratio is an additional important index to trace the origin of organic matter. The elemental compositions of organic matter in the EGDC surface sediments are highly variable. The Redfield C/N atomic ratio of marine phytoplankton is 6.6. In this study, the C/N ratios of the estuarine sediments (average=6.7) range between this marine signature and the Hanjiang−derived terrestrial signature (C/N ratio of 13.2 in summer). These values are comparable to those found in the Pearl River estuary (Hu et al., 2006). Seasonally, the C/N ratios in spring ranged from 5.2 to 9.2, averaging 7.1 ± 1.3 (n=8). In summer, they varied from 4.3 to 12.2, averaging 7.0 ± 2.2 (n=13), which is comparable to values in spring. These average values are slightly higher than the Redfield C/N ratio (~6.6), but significantly lower than those in the Hanjiang and Lianjiang River basins (average=11.1 ± 2.3, n=11: student t–test, p<0.05). In winter, the C/N atom ratios in the EGDC surface sediments varied from 5.3 to 6.7, averaging 6.0 ± 0.5 (n=7). As shown in Figure 7A, the C/N atom ratios suggest that the organic matter is sourced from terrestrial and marine matter, although their C/N ratios are closer to the Redfield ratio, implying a greater proportion of marine organic matter relative to terrestrial. Additionally, the F−test and T−test revealed that the C/N ratios measured at the same stations during different seasons shows no significant variability, suggesting a relatively stable organic carbon source, namely marine organic matter. The temporal variations in C/N atom ratios are consistent with those of TOC concentrations, showing a significant positive relationship between the two parameters (Figure 7B).
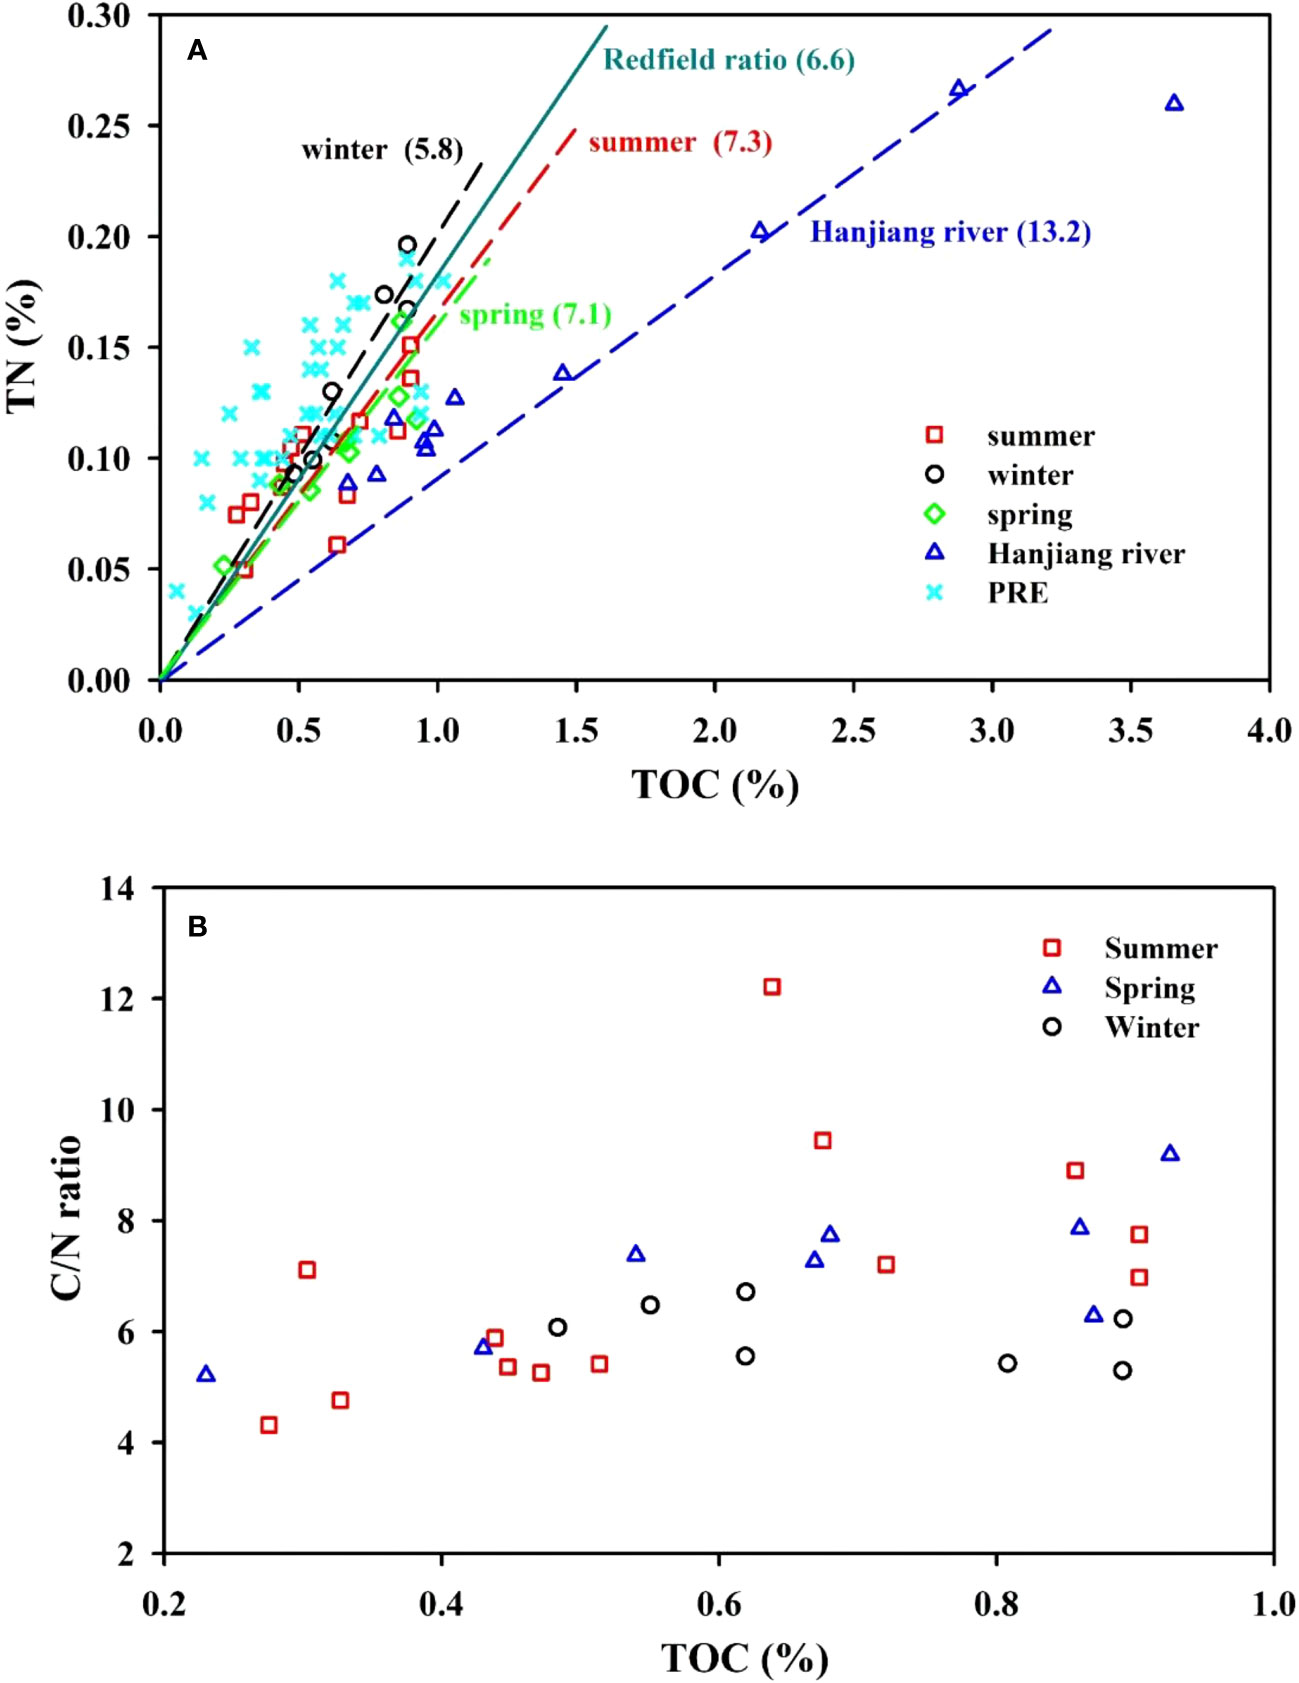
Figure 7 Seasonal TN vs. TOC (A) and C/N ratio vs. TOC (B) in the surface sediments from the eastern Guangdong coast. Lines in (A) indicate the Redfield ratio (teal), and C/N relationships for spring (green), summer (red), winter (black) and the Hanjiang River (blue); data from the Pearl River estuary (PRE, pale blue) is also shown.
The horizontal distribution of C/N ratios shows a slight decline in values with increasing distance offshore (Figure S2). This pattern is attributed to the gradual decrease in terrigenous organic matter deposition and the relative increase in input of marine organic matter moving towards the sea. The C/N ratios in the nearshore area during summer is higher than those in spring and winter, indicating the greater input of terrestrial OM in summer. This is consistent with that high chlorophyll-a in the nearshore area observed in summer. For example, in the nearshore stations Y1−Y3, the chlorophyll-a concentration in summer was on average 13.4 ± 10.3 μg L-1 (n=3), significantly higher than those of the spring (average=1.7 ± 0.3 μg L-1, n=3) and winter (average=2.2 ± 0.6 μg L-1, n=3). Terrestrial nutrient input from anthropogenic sources enhanced the primary production in the nearshore area, resulting in the contribution of terrestrial OM is relatively high (high C/N ratio). Note that, the C/N value of the surface sediment of aquaculture area (station Y5) is not always higher than that of nearshore zone (stations Y1−Y3) in different seasons. In spring, the C/N ratio of surface sediment in station Y5 is higher than those of stations Y1−Y3, suggesting a proportionally greater accumulation of terrestrial particulate organic matter in the aquaculture area compared to nearshore zone. On the one hand, there has higher deposition flux of particulate matter in the aquaculture area than nearshore area. On the other hand, the breeding bait can produce the aquaculture OM, which has similar C/N ratio as terrestrial OM (Yokoyama et al., 2005). On the contrary, they are true in summer.
3.6 Quantitative estimation of the organic carbon contribution
We confirmed that organic carbon in the EGDC is predominantly sourced from a combination of marine and terrestrial organic matter. We thus estimate the fractions of these sources in the sedimentary organic carbon pool using a two end−member mixing model. Since the δ15N or C/N data is little, we did not use δ15N or C/N to quantitatively estimate the contribution of different organic carbon sources, while δ13C was used to the estimations. The relative proportion of terrestrial organic matter () is calculated by the following equation (Parnell et al., 2010; Krishna et al., 2018):
where δ13Cmarine and δ13Cterrestrial indicate the δ13C values characteristic of marine organic matter and terrestrial organic matter, respectively, and δ13Corg represents the δ13C value of the sediment sample. The proportion of marine organic matter (FMAR) to the TOC pool is calculated by the following equation:
The selection of end-member values is critical for reliably estimating the proportional contribution of possible organic matter sources. The marine organic matter end member (δ13Cmarine) was taken as −20.5 ± 1.3‰ as suggested by previous publications (Jia and Peng, 2003; Wu et al., 2007; Guo et al., 2015). While the terrestrial organic matter end-member (δ13Cterrestrial) was taken as −26.3 ± 0.4 ‰, which is the average soil δ13C value from upstream in the Hanjiang River (HJR14-15) and Longjiang River (LJR1-3). These stations are close to the estuary but with zero salinity, which can effectively represent the riverine input. This terrestrial value in the Hangjiang River basin is comparable to the average of the δ13C values of the carbon in C3 organic matter (−27.0‰: Gao et al., 2012). And then, the marine OM fractions in surface sediment were estimated to be 74 ± 20% in spring, 74 ± 16% in summer, and 75 ± 12% in winter, respectively (Figure 8A). The marine organic matter contribution is thus on average 74 ± 15% throughout the year, which is comparable to the reported results in the Bohai offshore (58–82%: Wang et al., 2018). This marine organic matter contribution is significantly higher than those in the Pearl River estuary (52 ± 13%: Hu et al., 2006) and the northern South China Sea (NSCS) shelf (64 ± 7%: Hu et al., 2006). Pearl River Estuary, with a long residence time, is favorable to the transformation and adsorption of terrestrial materials (Liu et al., 2014), resulting in an increased proportion of terrestrial organic matter and decreased marine organic matter fraction. Indeed, the marine organic matter contribution to POC in the Pearl River estuary and the NSCS shelf is reported to be about 47% and 73%, respectively (Huang et al., 2020), which is lower than our results in the EGDC. Note that, in the nearshore region (stations Y1-Y3), the marine OM fractions in surface sediment were estimated to be 54 ± 12% in spring, 53 ± 11% in summer, and 64 ± 4% in winter, respectively. This estimation in winter is slightly higher than those in spring and summer because less carbon input from terrestrial sources can be utilized in the dry season. In the offshore region (stations Y14-Y15 and Y31-Y34), the marine OM fraction in winter is comparable to those in summer (~80%). This suggests the marine OM fractions increase with distance from the shore although they are dominated in the investigated area. Meanwhile, under the assumption that end-member values have not significant variations during the period examined in this study, we also calculated the marine OM contribution to the sediment cores Y3 and Y5 to be on average 59 ± 5% and 66 ± 4% (Figure 8B), respectively. The lower marine organic matter contribution in sediment core Y3 is consistent with the high input of terrestrial OM in the nearshore region. The proportions of marine OM show minimal variations (<5%) from the surface to the bottom in sediment cores Y3 and Y5. This suggests that the sedimentary organic matter is relatively well preserved after burial, and significant remineralization does not occur. This finding is consistent with the previous studies, which indicate that over 90% of organic matter is mineralized before deposition (Meyers, 1994; Meyers, 1997; Meyers, 2003). The horizontal distribution of the proportion of marine OM showed an increase from the nearshore (~70%) to the outer shelf (~80%) (Figure S3), presumably reflecting spatial variability in marine primary production over the study area. As shown in Figure S4, the spatial distributions of chlorophyll-a in surface seawater during three seasons show a consistent decrease with increasing distance offshore. For example, in the nearshore stations Y1−Y5, the chlorophyll-a concentrations in spring ranged from 1.5 to 2.1 μg L-1, averaging 1.8 ± 0.3 μg L-1 (n=5), significantly higher than those of the offshore stations Y31−33 and Y14−Y15, ranging from 0.6 to 1.0 μg L-1 (average=0.8 ± 0.2 μg L-1, n=5). The increase in chlorophyll-a in the nearshore area can be attributed to the enhanced primary production due to terrestrial nutrient input from anthropogenic sources. Consequently, the contribution of terrestrial organic matter is relatively high in these nearshore regions. As distance offshore increases, the decline in terrestrial nutrients leads to reduced primary production, and the chlorophyll-a is mainly sourced from marine organic matter. Thus, the contribution of marine organic matter in the offshore area increases correspondingly.
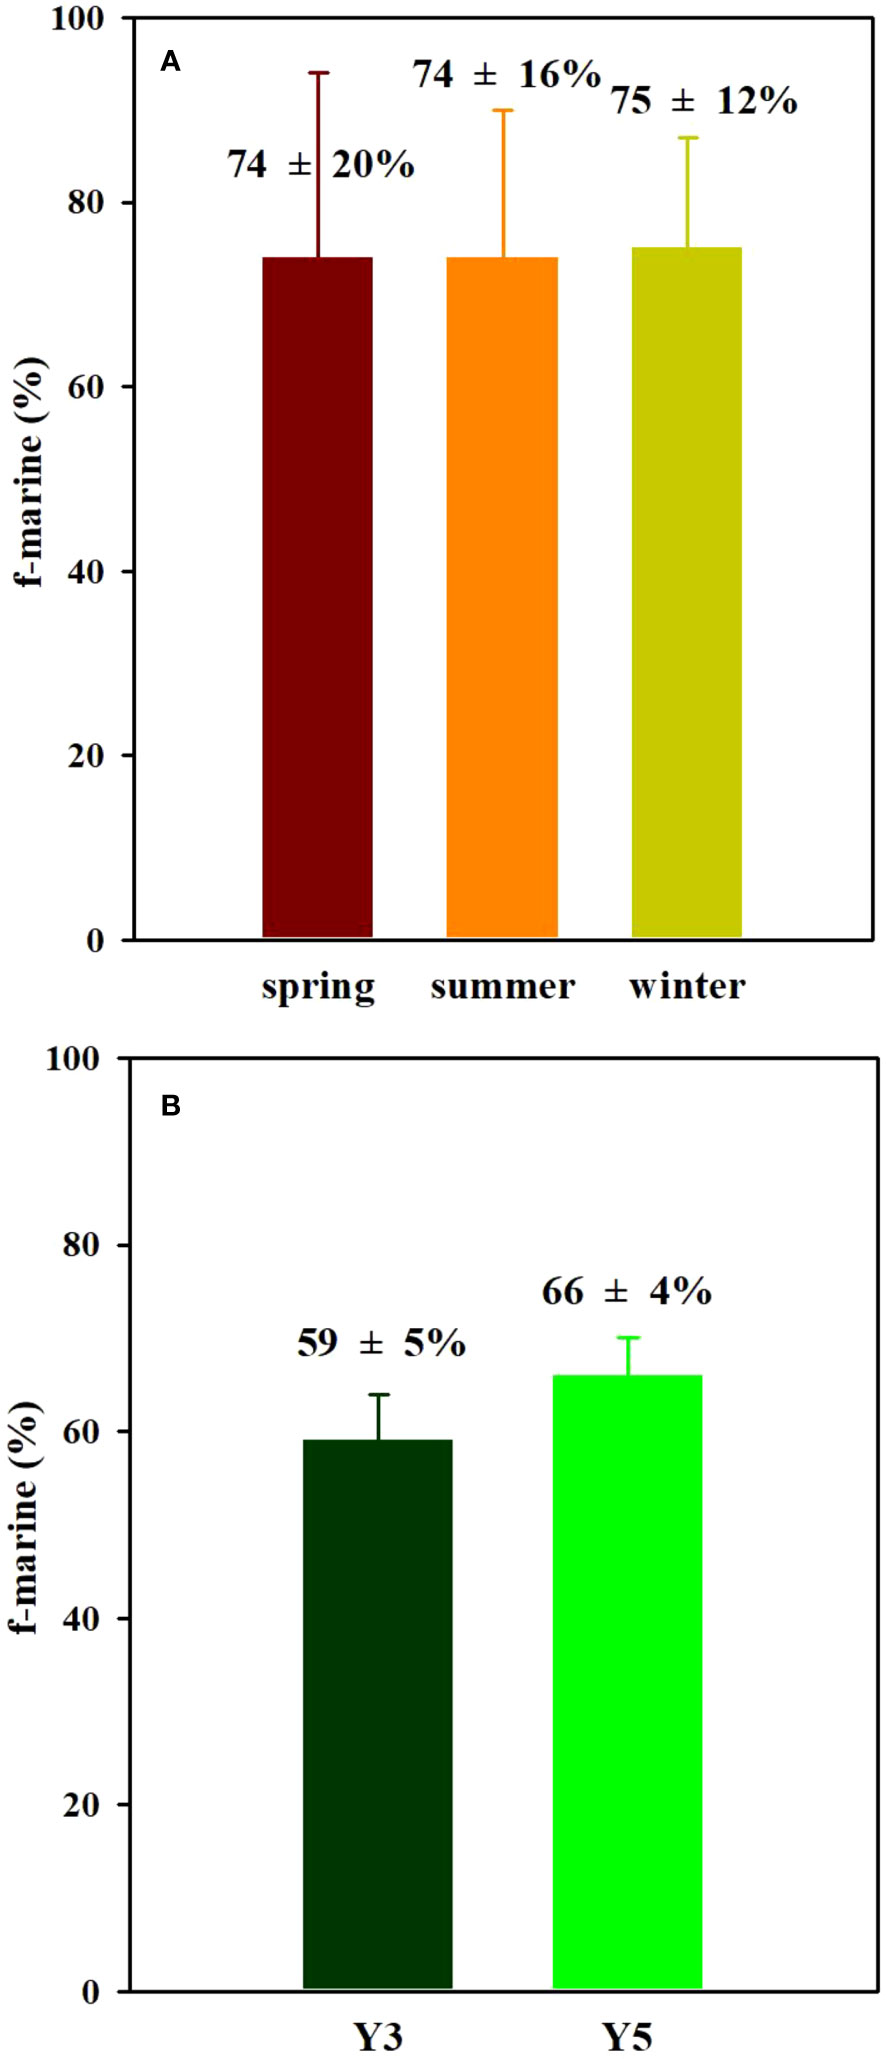
Figure 8 Proportion (%) of TOC from marine organic matter seasonally in surface sediments (A) and sediment cores (B) from the eastern Guangdong coast.
4 Conclusions
In surface sediments of the EGDC, the TOC content and δ13CTOC were measured in spring, summer and winter, and showed no seasonal variability. The lateral distribution of TOC contents decreased with increasing distance offshore, while the spatial distribution of δ13CTOC consistently increased with distance from shore. The sedimentary δ13CTOC, δ15NTN and C/N values constrained the two dominant sources, marine and terrestrial organic matter, in the EGDC. The proportions of the marine OM were estimated to be 74 ± 20% in spring, 74 ± 16% in summer and 75 ± 12% in winter, respectively. This suggests marine phytoplankton production was the major organic carbon source (average=74 ± 15%) in sediments of the EGDC, and further confirms no seasonal variability in organic carbon source. The marine organic matter contributions calculated for sediment cores Y3 and Y5 averaged 59 ± 5% and 66 ± 4%, respectively. A high concentration and inventory of TOC in the marine aquaculture area of the EGDC indicates a higher carbon fixation capacity compared to the other area investigated. These findings provide a background carbon database in the coastal area that can be used in future studies of blue carbon, with the goal of achieving carbon neutrality in China.
Data availability statement
The original contributions presented in the study are included in the article/Supplementary Material. Further inquiries can be directed to the corresponding authors.
Author contributions
JW: Conceptualization, Project management, Funding acquisition, Supervision; Validation, Writing−original draft preparation, Visualization. JC: Sampling and measurement, Investigation, Writing−review & editing. CW: Conceptualization, Writing−review& editing. XLY: Conceptualization, Writing−review& editing. XJY: Methodology, Writing−review & editing. QL: Conceptualization, Writing−review& editing.
Funding
This study was supported by the National Natural Science Foundation of China (42076038), the Guangdong Basic and Applied Basic Research Foundation (2021A1515011886), Key Special Project for Introduced Talents Team of Southern Marine Science and Engineering Guangdong Laboratory (Guangzhou) (GML2019ZD0606), STU Scientific Research Start−Up Foundation for Talents (NTF18011), Science and Technology Plan Projects of Guangdong Province (2021B1212050025), the National Natural Science Foundation of China (92158201), Innovation and Entrepreneurship Project of Shantou (201112176541391).
Conflict of interest
The authors declare that the research was conducted in the absence of any commercial or financial relationships that could be construed as a potential conflict of interest.
Publisher’s note
All claims expressed in this article are solely those of the authors and do not necessarily represent those of their affiliated organizations, or those of the publisher, the editors and the reviewers. Any product that may be evaluated in this article, or claim that may be made by its manufacturer, is not guaranteed or endorsed by the publisher.
Supplementary material
The Supplementary Material for this article can be found online at: https://www.frontiersin.org/articles/10.3389/fmars.2023.1234116/full#supplementary-material
References
Alongi D. M. (2014). Carbon cycling and storage in mangrove forests. Annu. Rev. Mar. Sci. 6 (1), 195–219. doi: 10.1146/annurev-marine-010213-135020
Andrews J. E., Greenaway A. M., Dennis P. F. (1998). Combined carbon isotope and C/N ratios as indicators of source and fate of organic matter in a poorly flushed, tropical estuary: Hunts Bay, Kingston Harbour, Jamaica. Estuar. Coast. Shelf Sci. 46, 743–756. doi: 10.1006/ecss.1997.0305
Bauer J. E., Cai W. J., Raymond P. A., Bianchi T. S., Hopkinson C. S., Regnier P. A. (2013). The changing carbon cycle of the coastal ocean. Nature 504, 61–70. doi: 10.1038/nature12857
Belicka L. L., Harvey H. R. (2009). The sequestration of terrestrial organic carbon in Arctic Ocean sediments: a comparison of methods and implications for regional carbon budgets, Geochim. Cosmochim. Acta 73, 6231–6248. doi: 10.1016/j.gca.2009.07.020
Birungi V., Dejene S. W., Mbogga M. S. (2023). Carbon stock of Agoro Agu central forest reserve, in Lamwo district, Northern Uganda. Heliyon 9, e14252. doi: 10.1016/j.heliyon.2023.e14252
Bouillon S., Chandra Mohan P., Sreenivas N., Dehairs F. (2000). Sources of suspended organic matter and selective feeding by zooplankton in an estuarine mangrove ecosystem as traced by stable isotopes. Mar. Ecol. Prog. Ser. 208, 79–92. doi: 10.3354/meps208079
Boutton T. W. (1991). “Stable carbon isotope ratios of natural materials: II. Atmospheric, terrestrial, marine, and freshwater environments,” in Carbon isotopes techniques. Eds. Coleman D. C., Fry B. (San Diego: Academic Press), 173–185.
Burdige D. J. (2005). Burial of terrestrial organic matter in marine sediments: a reassessment. Glob. Biogeochem. Cy. 19, 1–7. doi: 10.1029/2004GB002368
Dan S. F., Liu S. M., Yang B., Udoh E. C., Umoh U., Ewa–Oboho I. (2019). Geochemical discrimination of bulk organic matter in surface sediments of the Cross River estuary system and adjacent shelf, South East Nigeria (West Africa). Sci. Total Environ. 678, 351–368. doi: 10.1016/j.scitotenv.2019.04.422
Fry B., Sherr E. B. (1984). δ13C measurements as indicators of carbon flow in marine and freshwater ecosystems. Contr. Mar. Sci. 27, 13–47. doi: 10.1007/978-1-4612-3498-2_12
Galy V., France–Lanord C., Lartiges B. (2008). Loading and fate of particulate organic carbon from the Himalaya to the Ganga–Brahmaputra delta. Geochim. Cosmochim. Ac. 72, 1767–1787. doi: 10.1016/j.gca.2008.01.027
Gan J. P., Li L., Wang D. X., Guo X. G. (2009). Interaction of a river plume with coastal upwelling in the northeastern South China Sea. Cont. Shelf Res. 29, 728–740. doi: 10.1016/j.csr.2008.12.002
Gao X., Yang Y., Wang C. (2012). Geochemistry of organic carbon and nitrogen in surface sediments of coastal Bohai Bay inferred from their ratios and stable isotopic signatures. Mar. pollut. Bull. 64, 1148–1155. doi: 10.1016/j.marpolbul.2012.03.028
Gattuso J. P., Frankignoulle M., Wollast R. (1998). Carbon and carbonate metabolism in coastal aquatic ecosystems. Annu. Rev. Ecol. Syst. 29, 405–434. doi: 10.1146/annurev.ecolsys.29.1.405
Gearing J. N. (1988). “The use of stable isotope ratios for tracing the nearshore–offshore exchange of organic matter,” in Lecture notes on coastal–offshore ecosystem studies. Coastal off–shore ecosystem interactions 22. Ed. Jansson B. O. (Berlin, Heidelberg: Springer), 69–101.
Gu Y. G., Wang Y. S., Ouyang J., Jordan R. W., Jiang S. J. (2021). Impacts of coastal aquaculture on sedimentary phosphorus speciation and fate: evidence from a seaweed aquaculture area off Nao’ao island, South China. Mar. pollut. Bull. 171, 112719. doi: 10.1016/j.marpolbul.2021.112719
Guo W., Ye F., Xu S., Jia G. (2015). Seasonal variation in sources and processing of particulate organic carbon in the Pearl River estuary, South China. Estuar. Coast. Shelf Sci. 167, 540–548. doi: 10.1016/j.ecss.2015.11.004
Hedges J. I., Clark W. A., Cowie G. L. (1988). Organic matter sources to the water column and surficial sediment of a marine bay. Limnol. Oceanogr. 33, 1116–1136. doi: 10.4319/lo.1988.33.5.1116
Hedges J. I., Keil R. G., Benner R. (1997). What happens to terrestrial organic matter in the ocean? Org. Geochem. 27, 195–212. doi: 10.1016/S0146-6380(97)00066-1
Hedges J. I., Mann D. C. (1979). Lignin geochemistry of marine–sediments from the southern Washington coast. Geochim. Cosmochim. Ac. 43, 1809–1818. doi: 10.1016/0016-7037(79)90029-2
Hedges J. I., Oades J. M. (1997). Comparative organic geochemistries of soils and marine sediments. Org. Geochem. 27 (7–8), 319–361. doi: 10.1016/S0146-6380(97)00056-9
Herbeck L. S., Unger D., Wu Y., Jennerjahn T. C. (2013). Effluent, nutrient and organic matter export from shrimp and fish ponds causing eutrophication in coastal and back-reef waters of NE Hainan, tropical China. Cont. Shelf Res. 57, 92–104. doi: 10.1016/j.csr.2012.05.006
Hu J. Y., Hong H. S., Li Y., Jiang Y. W., Chen Z. Z., Zhu J., et al. (2011). Variable temperature, salinity and water mass structures in the southwestern Taiwan strait in summer. Cont. Shelf Res. 31, S13–S23. doi: 10.1016/j.csr.2011.02.003
Hu J., Peng P. A., Jia G., Mai B., Zhang G. (2006). Distribution and sources of organic carbon, nitrogen and their isotopes in sediments of the subtropical Pearl River estuary and adjacent shelf, Southern China. Mar. Chem. 98, 274–285. doi: 10.1016/j.marchem.2005.03.008
Huang C., Chen F. J., Zhang S. W., Chen C. Q., Meng Y. F., Zhu Q. M., et al. (2020). Carbon and nitrogen isotopic composition of particulate organic matter in the Pearl River estuary and the adjacent shelf. Estuar. Coast. Shelf Sci. 246, 107003. doi: 10.1016/j.ecss.2020.107003
Huang X. P., Huang L. M., Yue W. Z. (2003). The characteristic of nutrients and eutrophication in the Pearl River estuary, South China. Mar. pollut. Bull. 47, 30–36. doi: 10.1016/S0025-326X(02)00474-5
Jia G. D., Peng P. A. (2003). Temporal and spatial variations in signatures of sedimented organic matter in Lingding Bay (Pearl estuary), southern China. Mar. Chem. 82, 47–54. doi: 10.1016/S0304-4203(03)00050-1
Kendall C., Silva S. R., Kelly V. J. (2001). Carbon and nitrogen isotopic compositions of particulate organic matter in four large river systems across the United States. Hydrol. Process. 15, 1301–1346. doi: 10.1002/hyp.216
Krishna M., Mukherjee J., Dalabehera H., Sarma V. (2018). Particulate organic carbon composition in temperature fronts of the Northeastern Arabian sea during winter. J. Geophys. Res.: Biogeosciences 123, 463–478. doi: 10.1002/2018JG004387
Lamb A. L., Wilson G. P., Leng M. J. (2006). A review of coastal palaeoclimate and relative sea–level reconstructions using δ13C and C/N ratios in organic material. Earth–Sci. Rev. 75, 29–57. doi: 10.1016/j.earscirev.2005.10.003
Lee S., Fuhrman J. A. (1987). Relationships between biovolume and biomass of naturally derived marine bacterioplankton. Appl. Environ. Microbiol. 53, 1298–1303. doi: 10.1128/aem.53.6.1298-1303.1987
Lettner H., Bossew P., Hubmer A. K. (2000). Spatial variability of fallout caesium-137 in Austrian alpine regions. J. Environ. Radioact. 47, 71–82. doi: 10.1016/S0265-931X(99)00023-5
Li D., Yao P., Bianchi T. S., Zhao B., Pan H., Zhang T., et al. (2015). Historical reconstruction of organic carbon inputs to the East China Sea inner shelf: Implications for anthropogenic activities and regional climate variability. Holocene 25, 1869–1881. doi: 10.1177/0959683615591358
Liénart C., Savoye N., Bozec Y., Breton E., Conan P., David V., et al. (2017). Dynamics of particulate organic matter composition in coastal systems: a spatio–temporal study at multi–systems scale. Prog. Oceanogr. 156, 221–239. doi: 10.1016/j.pocean.2017.03.001
Lin G. M., Lin X. B. (2022). Bait input altered microbial community structure and increased greenhouse gases production in coastal wetland sediment. Water Res. 218, 118520. doi: 10.1016/j.watres.2022.118520
Lin S., Huang K. M., Chen S. K. (2000). Organic carbon deposition and its control on iron sulfide formation of the southern East China Sea continental shelf sediments. Cont. Shelf Res. 20, 619–635. doi: 10.1016/S0278-4343(99)00088-6
Liu Y., Gao S., Wang Y., Yang Y., Long J., Zhang Y., et al. (2014). Distal mud deposits associated with the Pearl River over the northwestern continental shelf of the South China Sea. Mar. Geol. 347, 43–57. doi: 10.1016/j.margeo.2013.10.012
Liu J., Qi S. H., Yao J., Yang D., Xing X. L., Liu H. X., et al. (2016). Contamination characteristics of organochlorine pesticides in multimatrix sampling of the Hanjiang River basin, southeast China. Chemosphere 163, 35–43. doi: 10.1016/j.chemosphere.2016.07.040
Liu M. T., Wang Z. H., Zhang G. T. (2021). Nitrogen removal through oyster aquaculture: integration with artificial fertilization makes it more efficient. Sci. Total Environ. 792, 148057. doi: 10.1016/j.scitotenv.2021.148057
Louchouarn P., Lucotte M., Farella N. (1999). Historical and geographical variations of sources and transport of terrigenous organic matter within a large-scale coastal environment. Org. Geochem. 30, 675–699. doi: 10.1016/S0146-6380(99)00019-4
Lu F. H., Ni H. G., Liu F., Zeng E. Y. (2009). Occurrence of nutrients in riverine runoff of the Pearl River Delta, South China. J. Hydrol. 376, 107–115. doi: 10.1016/j.jhydrol.2009.07.018
Maksymowska D., Richard P., Piekarek–Jankowska H., Riera P. (2000). Chemical and isotopic composition of the organic matter sources in the Gulf of Gdansk (Southern Baltic Sea). Estuar. Coast. Shelf Sci. 51, 585–598. doi: 10.1006/ecss.2000.0701
Medeiros P. M., Seidel M., Ward N. D., Carpenter E. J., Gomes H. R., Niggemann J., et al. (2015). Fate of the Amazon river dissolved organic matter in the tropical Atlantic ocean. Global Biogeochem. Cy. 29, 677–690. doi: 10.1002/2015GB005115
Meyers P. A. (1994). Preservation of source identification of sedimentary organic matter during and after deposition. Chem. Geol. 144, 289–302. doi: 10.1016/0009-2541(94)90059-0
Meyers P. A. (1997). Organic geochemical proxies of paleoceanographic, paleolimnologic, and paleoclimatic processes. Organ. Geochem. 27, 213–250. doi: 10.1016/S0146-6380(97)00049-1
Meyers P. A. (2003). Applications of organic geochemistry to paleolimnological reconstructions: a summary of examples from the Laurentian Great Lakes. Org. Geochem. 34, 261–289. doi: 10.1016/S0146-6380(02)00168-7
Mi B. B., Zhang Y., Mei X. (2022). The sediment distribution characteristics and transport pattern in the eastern China seas. Quat. Int. 629, 44–52. doi: 10.1016/j.quaint.2020.11.020
Middelburg J. J., Nieuwenhuize J. (1998). Carbon and nitrogen stable isotopes in suspended matter and sediments from the Schelde Estuary. Mar. Chem. 60, 217–225. doi: 10.1016/S0304-4203(97)00104-7
Muller A., Voss M. (1999). The palaeoenvironments of coastal lagoons in the southern Baltic Sea: II. δ13C and δ15N ratios of organic matter–sources and sediments. Palaeogeogr. Palaeoclimatol. Palaeoecol. 145, 17–32. doi: 10.1016/S0031-0182(98)00095-9
Ouyang J. (2017). Temporal and Spatial Distribution Characteristics of Nitrogen Forms and Phosphorus forms in sediments of large-scale farming area and its environment implications in Guangdong, China 57. Jinan University, Jinan University Library.
Owen R. B., Lee R. (2004). Human impacts on organic matter sedimentation in a proximal shelf setting, Hong Kong. Contin. Shelf Res. 24, 583–602. doi: 10.1016/j.csr.2003.11.004
Pan Y. D., Birdsey R. A., Fang J. Y., Houghton R., Kauppi P. E., Kurz W. A., et al. (2011). A large and persistent carbon sink in the world’s forests. Science 333 (6045), 988–993. doi: 10.1126/science.1201609
Parnell A., Inger R., Bearhop S., Jackson A. L. (2010). Source partitioning using stable isotopes coping with too much variation. PloS One 5, 9672. doi: 10.1371/journal.pone.0009672
Pradhan U. K., Wu Y., Shirodkar P. V., Zhang J., Zhang G. (2014). Sources and distribution of organic matter in thirty five tropical estuaries along the west coast of India–a preliminary assessment. Estuar. Coast. Shelf Sci. 151, 21–33. doi: 10.1016/j.ecss.2014.09.010
Qiao Y., Yang Y., Zhao J., Tao R., Xu R. (2013). Influence of urbanization and industrialization on metal enrichment of sediment cores from Shantou Bay, South China. Environ. pollut. 182, 28–36. doi: 10.1016/j.envpol.2013.06.044
Ramaswamy V., Gaye B., Shirodkar P. V., Rao P. S., Chivas A. R., Wheeler D., et al. (2008). Distribution and sources of organic carbon, nitrogen and their isotopic signatures in sediments from the Ayeyarwady (Irrawaddy) continental shelf, northern Andaman Sea. Mar. Chem. 111, 137–150. doi: 10.1016/j.marchem.2008.04.006
Remeikaitė-Nikienė N., Lujanienė G., Malejevas V., Barisevičiūtė R., Zilius M., Vybernaitė-Lubienė I., et al. (2017). Assessing nature and dynamics of POM in transitional environment (the Curonian Lagoon, SE Baltic Sea) using a stable isotope approach. Ecol. Indic. 82, 217–226. doi: 10.1016/j.ecolind.2017.06.035
Sampei Y., Matsumoto E. (2001). C/N ratios in a sediment core from Nakaumi Lagoon, southwest Japan—usefulness as an organic source indicator. Geochem. J. 35, 189–205. doi: 10.2343/geochemj.35.189
Seidel M., Yager P. L., Ward N. D., Carpenter E. J., Gomes H. R., Krusche A. V., et al. (2015). Molecular–level changes of dissolved organic matter along the Amazon River–to–ocean continuum. Mar. Chem. 177, 218–231. doi: 10.1016/j.marchem.2015.06.019
Sun X. S., Fan D. J., Cheng P., Hu L. M., Sun X., Guo Z. G., et al. (2021). Source, transport and fate of terrestrial organic carbon from Yangtze River during a large flood event: insights from multiple–isotopes (δ13C, δ15N, Δ14C) and geochemical tracers. Geochim. Cosmochim. Ac. 308, 217–236. doi: 10.1016/j.gca.2021.06.004
Wada E., Hattori A. (1991). Nitrogen in the sea: forms, abundances, and rate processes (Boca Raton, FL: CRC Press), 208.
Wang C., Lv Y., Li Y. (2018). Riverine input of organic carbon and nitrogen in water-sediment system from the yellow river estuary reach to the coastal zone of Bohai sea, China. Cont. Shelf Res. 157, 1–9. doi: 10.1016/j.csr.2018.02.004
Wang G., Zhang Y. S., Guan D. S., Xiao L., Singh M. (2021). The potential of mature Sonneratia apetala plantations to enhance carbon stocks in the Zhanjiang mangrove national nature reserve. Ecol. Indic. 133, 108415. doi: 10.1016/j.ecolind.2021.108415
Wen Z. D., Shang Y. X., Lyu L. L., Liu G., Hou J. B., He C., et al. (2021). Sources and composition of riverine dissolved organic matter to marginal seas from mainland China. J. Hydrol. 603, 127152. doi: 10.1016/j.jhydrol.2021.127152
Wu H. B. (2017). Analysis of inorganic nitrogen pollution characteristics and load estimation method in the Hanjiang River Basin. Guangdong Water Resour. Hydropower 9, 14–19.
Wu Y., Zhang J., Liu S. M., Zhang Z. F., Yao Q. Z., Hong G. H., et al. (2007). Sources and distribution of carbon within the Yangtze River system. Estuar. Coast. Shelf Sci. 71, 13–25. doi: 10.1016/j.ecss.2006.08.016
Xia Z., Jia P., Ma S., Liang K., Shi Y., Waniek J. (2013). Sedimentation in the Lingdingyang bay, Pearl River estuary, southern China. J. Coast. Res. 66 (66), 12–24. doi: 10.2112/SI_66_2
Xiao J., Wang Z. L., Liu D. Y., Fu M. Z., Yuan C., Yan T. (2021). Harmful macroalgal blooms (HMBs) in China’s coastal water: green and gloden tides. Harmful Algae 107, 102061. doi: 10.1016/j.hal.2021.102061
Yang S. Y., Tang M., Yim W. W. W., Zong Y. Q., Huang G. Q., Switzer A. D., et al. (2011). Burial of organic carbon in Holocene sediments of the Zhujiang (Pearl River) and Changjiang (Yangtze River) estuaries. Mar. Chem. 123, 1–10. doi: 10.1016/j.marchem.2010.07.001
Yokoyama H., Tamaki A., Harada K., Shimoda K., Koyama K., Ishihi Y. (2005). Variability of diet-tissue isotopic fractionation in estuarine macrobenthos. Mar. Ecol. Prog. Ser. 296, 115–128. doi: 10.3354/meps296115
Yoshikawa T., Eguchi M. (2013). Planktonic processes contribute significantly to the organic carbon budget of a coastal fish-culturing area. Aquacult. Env. Interac. 4 (3), 239–250. doi: 10.3354/aei00085
Zhang J., Yu Z. G., Wang J. T., Ren J. L., Chen H. T., Xiong H., et al. (1999). The subtropical Zhujiang (Pearl River) estuary: nutrient, trace species and their relationship to photosynthesis. Estuar. Coast. Shelf Sci. 49, 385–400. doi: 10.1006/ecss.1999.0500
Zhao L. (2019). Characteristic analysis of runoff and sediment at Chaoan hydrometric station in Hanjiang River basin. Gaungdong Water Resour. Hydropower 1, 22–25. doi: CNKI:SUN:GDSD.0.2019-01-010
Zhao J., Bianchi T. S., Li X., Allison M. A., Yao P., Yu Z. (2012). Historical eutrophication in the Changjiang and Mississippi delta-front estuaries: stable sedimentary chloropigments as biomarkers. Cont. Shelf Res. 47, 133–144. doi: 10.1016/j.csr.2012.07.005
Zheng Y., Zhang J., Wang A. (2009). Fast removal of ammonium nitrogen from aqueous solution using chitosan-g-poly (acrylic acid)/attapulgite composite. Chem. Eng. J. 155 (1-2), 215–222. doi: 10.1016/j.cej.2009.07.038
Zhou J. L., Wu Y., Zhang J., Kang Q. S., Liu Z. T. (2006). Carbon and nitrogen composition and stable isotopes as potential indicators of source and fate of organic matter in the salt marsh of the Changjiang Estuary, China. Chemosphere 65, 310–317. doi: 10.1016/j.chemosphere.2006.02.026
Zhou X., Yan X. L., Sun Z. Y., Yu X. X., Wang D. L., Huang B. Q., et al. (2023). Estuarine chemistry characteristics of nutrients and dissolved organic matter in the Hanjiang River estuary and adjacent coastal areas during summer. J. Xiamen Univ. Nat. Sci. 62 (3), 385–396. doi: 10.6043/j.issn.0438-0479.202209051
Zhuang M., Sanganyado E., Li P., Liu W. H. (2019). Distribution of microbial communities in metal–contaminated nearshore sediment from Eastern Guangdong, China. Environ. pollut. 250, 482–492. doi: 10.1016/j.envpol.2019.04.041
Keywords: terrestrial organic carbon, δ13C, C/N ratio, marine sediment, eastern Guangdong coast
Citation: Wu J, Chen J, Wang C, Yan X, Yin X and Liu Q (2023) Constraining the origin of sedimentary organic matter in the eastern Guangdong coast of China using δ13C and δ15N. Front. Mar. Sci. 10:1234116. doi: 10.3389/fmars.2023.1234116
Received: 03 June 2023; Accepted: 22 August 2023;
Published: 15 September 2023.
Edited by:
Liyang Yang, Fuzhou University, ChinaReviewed by:
Dandan Duan, Hainan Normal University, ChinaJun Zhao, Ministry of Natural Resources, China
Yongyu Zhang, Chinese Academy of Sciences (CAS), China
Shan Jiang, East China Normal University, China
Copyright © 2023 Wu, Chen, Wang, Yan, Yin and Liu. This is an open-access article distributed under the terms of the Creative Commons Attribution License (CC BY). The use, distribution or reproduction in other forums is permitted, provided the original author(s) and the copyright owner(s) are credited and that the original publication in this journal is cited, in accordance with accepted academic practice. No use, distribution or reproduction is permitted which does not comply with these terms.
*Correspondence: Junwen Wu, d3Vqd0BzdHUuZWR1LmNu; Qian Liu, bGl1cWlhbkBvdWMuZWR1LmNu