 Yuandong Zhu
 Zhenjin Li
 Zheng Zhao
 Lijun Lu2
 Zhiyong Wang
- 1College of Geodesy and Geomatics, Shandong University of Science and Technology, Qingdao, China
- 2Chinese Academy of Surveying and Mapping, Beijing, China
In the past 35 years, the natural coastline along Jiaozhou Bay has undergone extensive changes under the influence of human activities, and the coastal wetland area has been drastically reduced. Therefore, it is of great importance to study the spatio-temporal changes of the Jiaozhou Bay coastline, and their trends and causes, for sustainable economic development and the rational utilization of coastal resources. This paper constructed a comprehensive method for extracting the coastline information and change analysis based on long time series remote sensing data. Based on multi-spectral optical data and dual-polarization SAR data, the Normalized Difference Water Index (NDWI) and the Sentinel-1 Dual-polarized Water body Index (SDWI) combined with the Otsu threshold segmentation method were used to automatically extract the spatial distribution of coastline. The U-Net semantic segmentation model was used to classify the land cover types in the land direction of the coastline to count the coastline types. The End Point Rate (EPR) and Linear Regression Rate (LRR) were used to analyze the coastline changes, and the land reclamation was calculated according to the changing trends. The Pearson coefficient was used to study the reasons for the coastline changes. With an average time interval of 5 years, eight coastlines of Jiaozhou Bay in different years were extracted, and the coastline types were obtained. Then, the changes of the coastlines in Jiaozhou Bay from 1987 to 2022 were analyzed. The results show that: 1) Coastline type information provides important information for analyzing the coastline changes in long time series, and coastline information can be effectively extracted using multi-spectral optical data and dual-polarization SAR data. When the resolution of remote sensing data is 30m, the average error of the two types of data is better than one pixel, and the error between the data is about 1-2 pixels. 2) Based on the U-Net model, the overall accuracy of coastline classification using multi-spectral optical data and dual-polarization SAR data is 94.49% and 94.88%, respectively, with kappa coefficients of 0.9143 and 0.8949. 3) In the past 35 years, Jiaozhou Bay area has shown an obvious trend towards the ocean, with an average annual expansion of 16.723m. 4) The coastline of the Jiaozhou Bay area is dynamic. Due to the frequent human activities, the coastline has been reconstructed on a large scale, and the length of artificial coastline has increased significantly. The proportion of artificial coastline length has increased from 33.72% in 1987 to 59.33% in 2022. 5) In the past 35 years, the land reclamation area has reached 41.45km2, of which Shibei District, Licang District, and Huangdao District are the three most frequent areas, with an area of 34.62 km2.
1 Introduction
Historically, human beings have tended to live and produce in coastal areas because these areas provide the best conditions for survival and development, which has also led to coastal areas becoming among the more densely populated areas in the world (Özpolat and Demir, 2019; Ferreira et al., 2021). According to the data of the International Union for Conservation of Nature (IUCN), as of 2017, more than 60% of the world’s global population lived within 60km of the coast (Moussa et al., 2019). Compared with other areas, coastal areas are subject to frequent changes, and coastlines change more frequently than other areas. As the most important feature of coastal systems, coastlines have been listed as one of the 27 most important features of the Earth’s surface by the United Nations Initiative on Global Geospatial Information Management (Özpolat and Demir, 2019; Chen et al., 2022).
Coastline is defined as the interface or edge of land and sea (Moussa et al., 2019), and its change is a dynamic process (Ai et al., 2019). In a system operating under natural conditions, anthropogenic pressure is very low or non-existent, and it poses no immediate risk to coastline accretion or erosion. Nevertheless, anthropogenic activities can exert profound impacts on the dynamics of coastlines (Thom, 2020; Wiles et al., 2022). In recent years, due to the changes of natural factors such as global warming and frequent human transformation activities on coastlines, the changing of coastlines has been accelerated (Ouma and Tateishi, 2006; Chen et al., 2019). The collection and analysis of long-term sequential data on coastlines are crucial for comprehending the impact of natural and anthropogenic activities on coastal changes and for providing recommendations for safeguarding and promoting sustainable development in coastal regions (Qiao et al., 2018; Özpolat and Demir, 2019; Boussetta et al., 2022).
Acquiring the location of the coastline is the first step in studying spatio-temporal changes. The development of remote sensing technology has demonstrated that coastlines can be obtained from remote sensing images, and optical satellites such as Landsat can be used to map flood ranges (Smith, 1997). Space-borne synthetic aperture radar (SAR) imaging is not limited by dark or weather conditions, and multi-polarization SAR also provides time series information for ground object classification (Boak and Turner, 2005). The methods for acquiring coastlines from remote sensing images can be divided into manual rendering and automatic interpretation. Manual delineation of coastlines from remote sensing images is labor-intensive and subjective, whereas the extracted coastlines have better continuity and are more suitable for small-scale research (Chang et al., 2022). For automated interpretation, digital image processing technology is utilized to acquire coastlines through the automatic processing of remote sensing images. This approach is highly efficient and more suitable for the automatic extraction and spatio-temporal analysis of coastline information (Pardo-Pascual et al., 2012; Li and Gong, 2016; Chen et al., 2018; Cai et al., 2022). Remote sensing image processing methods for obtaining coastlines include edge detection, thresholding, machine learning, object-oriented approaches, level set techniques, and others (Sheng et al., 2022). Each of these methods has its own set of advantages and disadvantages. For example, the edge detection method is more sensitive to noise and is better suited for detecting straight lines and simple coastlines. The object-oriented method demands higher data, involves setting complex rules, and has poor real-time performance. The threshold method is greatly affected by noise, the pre-preparation of machine learning is complicated, and the level set technique takes a long time to obtain results (Cerimele et al., 2009; Toure et al., 2019; Hu and Wang, 2022; Li J. et al., 2022). It is necessary to further explore remote sensing data and automatic coastline extraction methods that are suitable for coastline change analysis.
There are generally two methods for analyzing changes in the coastline of a district. One approach is to analyze spatial changes in order to obtain data on coastlines, while the other involves establishing coastline models for comparative analysis (Le Cozannet et al., 2014; Chataigner et al., 2022; Hu and Wang, 2022). In this process, the End Point Rate (EPR) and other assessment indicators are widely employed to evaluate changes in the coastline. These indicators are commonly calculated and visualized by the digital coastline analysis system (DSAS), which combines various data to find the main causes of coastline changes (Siyal et al., 2022; Kılar, 2023). Santosh Kumar Das et al. (2021) analyzed the position change of a coastline by using EPR and LRR indicators, and Najeeb S (Aladwani, 2022). predicted the future position of a coastline by using DSAS.
However, analyzing the transition of coastline solely based on changes in location is limited. Further analysis of the factors driving coastal changes is necessary to provide more informed recommendations for coastline management. Zhu et al. (2021) combined optical and SAR to study the coastline changes of the Yellow River Delta in the 40 years preceding 2020 and found that the sediment transport of the river was the main factor causing the coastline changes. By analyzing the coastline changes of islands in Southeast Asia, Zhang et al. (2021) pointed out that human activities, material composition, and coastal geomorphic types played an important role in island countries, and the impact of sea-level rise should also be a cause for vigilance. Wang et al (Wang X. et al., 2021). analyzed land reclamation through the changes of coastline. In seaport areas, human activities have a more obvious influence on changes to coastlines, and monitoring these changes can guide policymaking and economic development (Zahra, 2018; Wiles et al., 2022).
The classification of coastlines can complete the analysis of their spatio-temporal changes. Different types of coastlines are accompanied by different land cover types, which can be used to identify the type of coastline. The combination of deep learning technology and remote sensing is primarily aimed at meeting the needs of processing and analyzing remote sensing images, such as image fusion, image registration, scene classification, object detection, land use and land cover classification, segmentation, and object-based image analysis (Ma et al., 2019; Li Z. et al., 2022). Son et al. (2022) used SegNet, a deep learning model, to classify land cover types in Nanyang City, South Korea, and proved that the accuracy was much higher than the traditional method. Navnath et al. (2022) obtained the temporal land cover type for France’s Reunion Island using a time series satellite image and deep learning technology. Pouliot et al. (2021) used time series Landsat satellite images and deep learning technology to obtain the long-term cover type of the Canadian grasslands. These results demonstrate the advantages of deep learning technology in time series research.
The curved natural coastline of Jiaozhou Bay has been extensively reconstructed due to human activities, resulting in a significant reduction in the area of coastal wetlands and the emergence of other problems (Wang N. et al., 2021), which have led to an increasingly fragile coastline. To achieve the effective monitoring of coastline changes in Jiaozhou Bay area over the past 35 years, this utilizes multi-spectral optical remote sensing data, dual-polarization SAR data, and a semantic segmentation model U-Net network to classify long time series land cover types and coastline types in Jiaozhou Bay. The study explores the spatio-temporal changes of the Jiaozhou Bay coastline and their underlying reasons. The main purposes of this study are as follows: (1) To analyze the spatio-temporal changes of the coastline in the Jiaozhou Bay area from 1987 to 2022 using long time series remote sensing data; (2) to explore the driving factors of the coastline change in the Jiaozhou Bay area; (3) to analyze the performance and accuracy of coastline extraction by using optical remote sensing data and dual-polarization SAR data and to search for remote sensing data sources suitable for coastline extraction.
The structure of this paper is as follows: In Section 2, the situation of the study area and the experimental data are introduced in detail, as are the types of coastlines in Jiaozhou Bay. Section 3 covers the study methods, mainly introducing the coastline extraction method based on multi-source remote sensing images, the coastline land cover type classification method based on the U-Net neural network, and the coastline change analysis method. Section 4 covers the study results, including an accuracy evaluation and a discussion of the results of the coastline extraction and classification. In section 5, the spatio-temporal evolution of the coastline of Jiaozhou Bay area from 1987 to 2022 is discussed and analyzed. In the last section of this paper, some important conclusions are given.
2 Study area and data
2.1 Study area
Jiaozhou Bay is located in the south of the Shandong Peninsula, which is situated in Shandong Province, China. It is located between 35°50’~36°15’N and 120°04’~120°25’E, belonging to the warm temperate monsoon climate. The annual average temperature is about 14.3°, and the average water depth is about 7 meters (Yin et al., 2023). It is connected to the Yellow Sea at its entrance (Pan et al., 2023). The mouth of Jiaozhou Bay is bounded by the southern end of Tuan Island (north side) and the northern end of Xuejia Island (south side), which also taken as the starting point and ending point in this study. Figure 1 is a schematic diagram of the study area in this paper, and the location of Jiaozhou Bay is shown in blue.
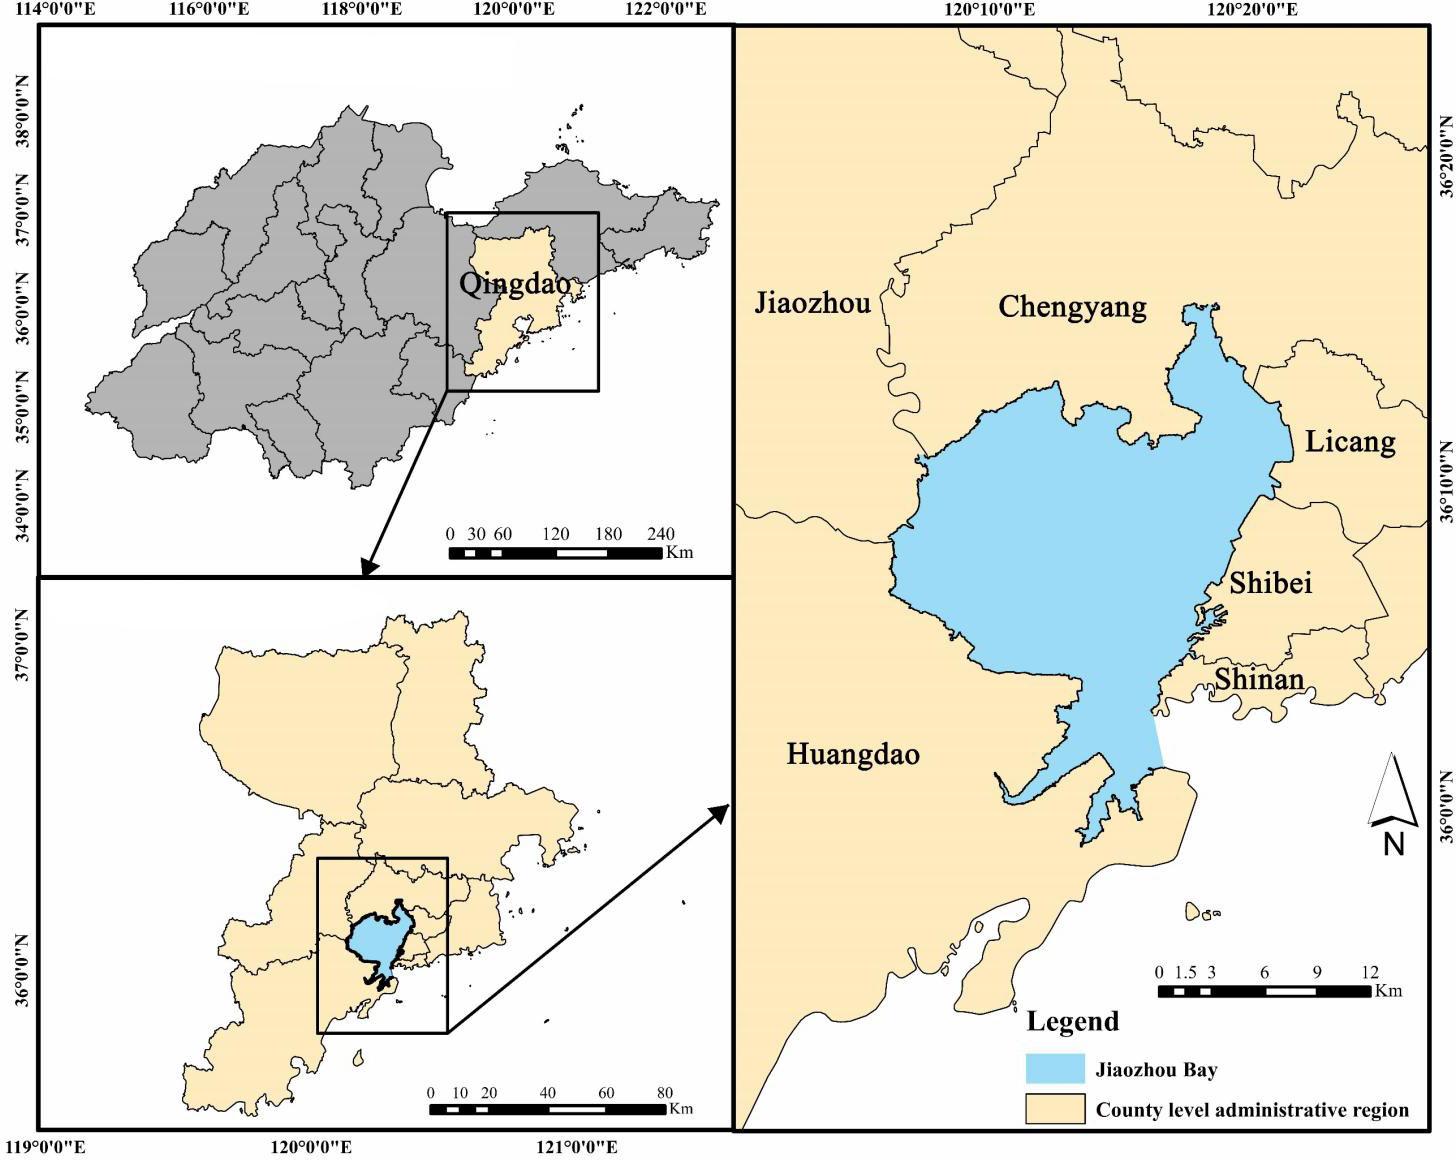
Figure 1 Geographical location of the study area.
The city of Qingdao surrounds Jiaozhou Bay. Qingdao City is one of the first 14 open coastal cities in China and is approved by the State Council of the People’s Republic of China as an important coastal central city, a coastal resort city, and an international port city. The study area is surrounded by six districts and cities, namely, Shinan District, Shibei District, Licang District, Chengyang District, Jiaozhou City, and Huangdao District. The resident population of Huangdao District alone reaches 1,964,200 (Qingdao Municipal Statistics Bureau). Qingdao Port, one of the largest integrated ports in the world, is located in Jiaozhou Bay (Chen et al., 2017). In 2021, Qingdao’s GDP exceeded 1.5 trillion yuan, and its GDP has increased by nearly 100 times in the past 35 years (Qingdao Municipal Statistics Bureau). Great changes have taken place along the coastline of Jiaozhou Bay due to human activities.
2.2 Data
In order to analyze the spatio-temporal changes of the coastline in Jiaozhou Bay area from 1987 to 2022, multi-spectral optical satellite remote sensing data and dual-polarized SAR data were selected with an average interval of 5 years. For 1987-2008, Landsat-5 optical image data were selected, and for the period since 2013, the multi-source data of Landsat-8 and Sentinel-1A/1B were used (in 2022, two scenes of data are mosaiced). The detailed parameters of the experimental data are shown in Table 1.
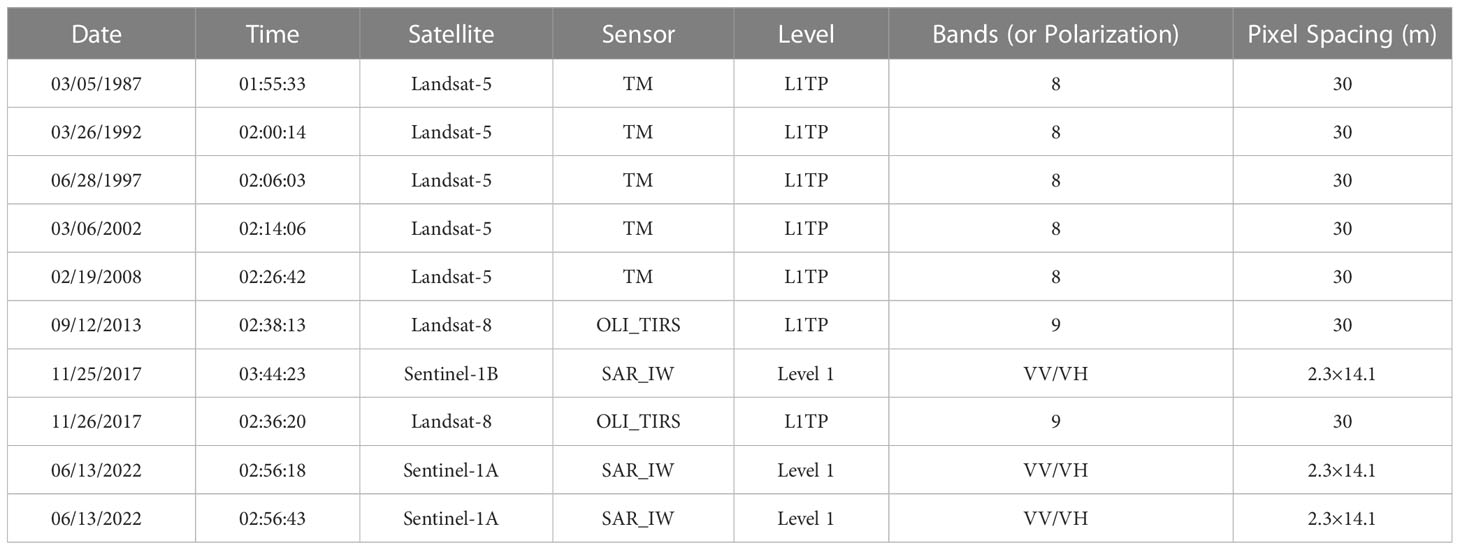
Table 1 Data used in this study.
Both Landsat-5 and Landsat-8 have a spatial resolution of 30m, containing multi-spectral information, and can derive various remote sensing indices for different purposes. To achieve the purpose of using the remote sensing index calculation, the dual-polarization Sentinel-1A/1B data with a spatial resolution of approximately 30m was selected. In November 2017, one Sentinel-1B radar data and one Landsat-8 multi-spectral remote sensing data (with a temporal offset of only 1 day) were selected. On the one hand, a comparison was conducted between the performance of multi-spectral remote sensing data and SAR data in the coastline extraction. On the other hand, in order to establish a unified standard for coastline classification, it is imperative to conduct histogram matching on multi-spectral optical data and dual-polarization SAR data. The U-Net model is then used to classify the two different datasets.
The Landsat data were from the U.S. Geological Survey (USGS, https://earthexplorer.usgs.gov/). The dual-polarization Sentinel-1A/1B data were from the European Space Agency (ESA, https://scihub.copernicus.eu/dhus/#/home/).
3 Method
3.1 Overall technical route
The overall technical route is shown in Figure 2, which mainly included the preprocessing of optical and SAR images, the extraction method of coastlines, and the classification method of coastlines. Firstly, NDWI and SDWI were used to process the two types of data, respectively, and the coastline was extracted by the threshold method and manual confirmation. Then, a buffer zone was established along the coastline to obtain classified samples, and the U-Net convolutional neural network was used for model training. After the classification map was predicted, the specific type information of the coastline could be obtained. Finally, the obtained results were visualized, the accuracy difference between the multi-source data was analyzed, and the spatio-temporal changes of the coastline in Jiaozhou Bay area in the past 35 years were analyzed. In this section, the impact of human activities, particularly land reclamation behavior, on changes to the coastline is analyzed in detail.
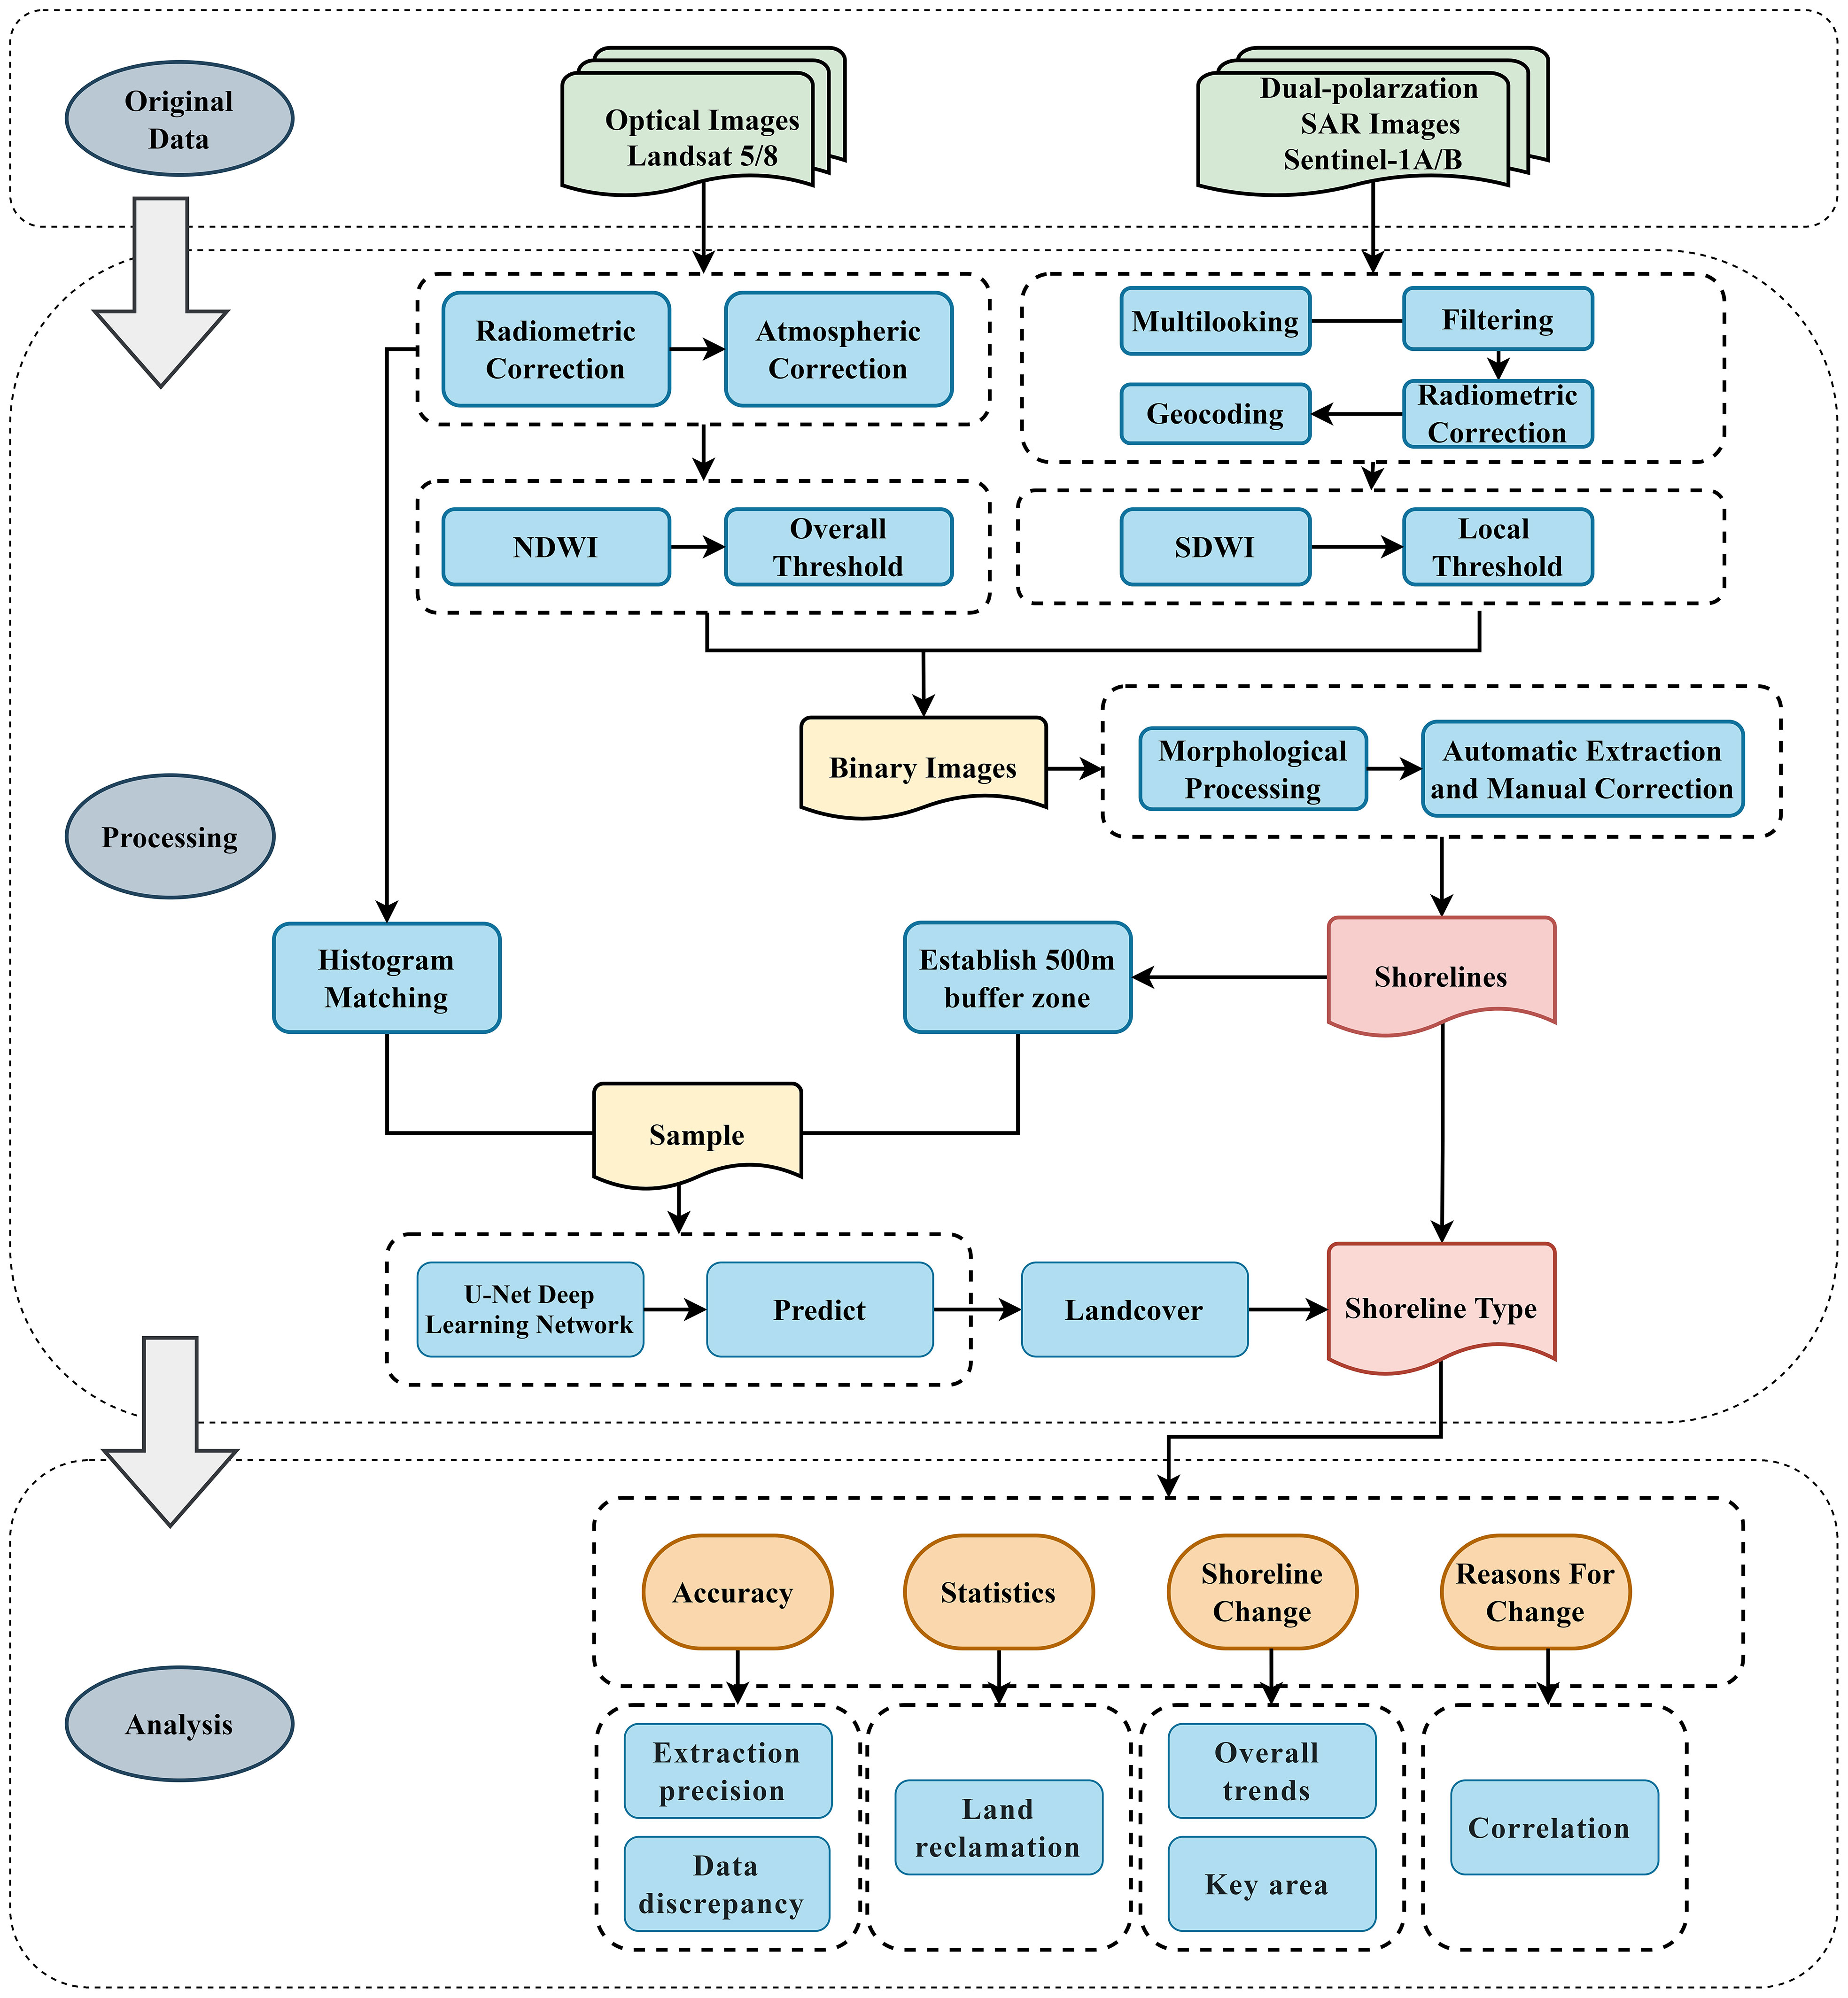
Figure 2 Flowchart of the method in this paper.
3.2 Coastline extraction
The extraction of the coastline is crucial for analyzing its spatio-temporal changes. Boak and Turner (2005) proposed three indicators to determine coastlines. In this paper, the third indicator was adopted as the main method to obtain coastline data:
1) The water and land were preliminary separated. For optical remote sensing images, preprocessing was performed first. Then, the green and near-infrared bands (NIR) were utilized to calculate the normalized difference water index (NDWI) (McFEETERS, 1996; Teng et al., 2021) and its formula expressed as (1) and (2):
where Band2Green and Band4NIR represent DN values used for bands of the Landsat-5 image, and Band3Green and Band5NIR represent DN values used for bands of the Landsat-8 image.
For the dual-polarization SAR image, multi-look processing was performed first. Then, refined Lee filtering (Lee, 1981) was applied to filter speckle noise in the radar image while retaining texture information in heterogeneous areas, minimizing radiation and texture information loss. Jia et al. proposed using the backscattering coefficient (dB) for Sentinel-1 dual-polarized data to calculate the SDWI (Jia et al., 2019). The SDWI was slightly improved in this study, as shown in formula (3).
where VV and VH represent the value of the backscattering coefficient corresponding to this polarization mode.
2) Next, water and land were accurately separated. The Otsu threshold method (Otsu, 1979) was utilized to determine the optimal threshold for segmenting water bodies and land in the obtained NDWI and SDWI images. For the NDWI images, the overall threshold was used. For the SDWI images, the local threshold was used to splice the segmented images due to significant variations in backscattering coefficients across the different types of coastlines. Thus, the binary image of water and land separation was obtained.
3) For obtaining the coastlines, the morphology operation was performed on the acquired binary image. The opening operation was first carried out to smooth the boundary, followed by the closing operation to eliminate meaningless objects near the boundary. The coastline was determined by the boundary of the land area with the largest size in the obtained binary image.
3.3 Coastline type acquisition
Before classifying coastlines, it is necessary to determine the required types. In this study, taking into account factors such as image resolution, the coastlines in Jiaozhou Bay area were classified into three categories: artificial coastlines, sandy or muddy coastlines, and bedrock coastlines. Pseudocolor composite images combining near-infrared, green, and blue wave segments were used for optical images due to the high degree of separation in land cover between the NIR or SWIR bands (Sunny et al., 2022). For the pseudocolor SAR image, the VH polarization mode was used to assign red and blue channels, and the VV polarization mode was used to assign green channels. An example of the classification standards is shown in Table 2.
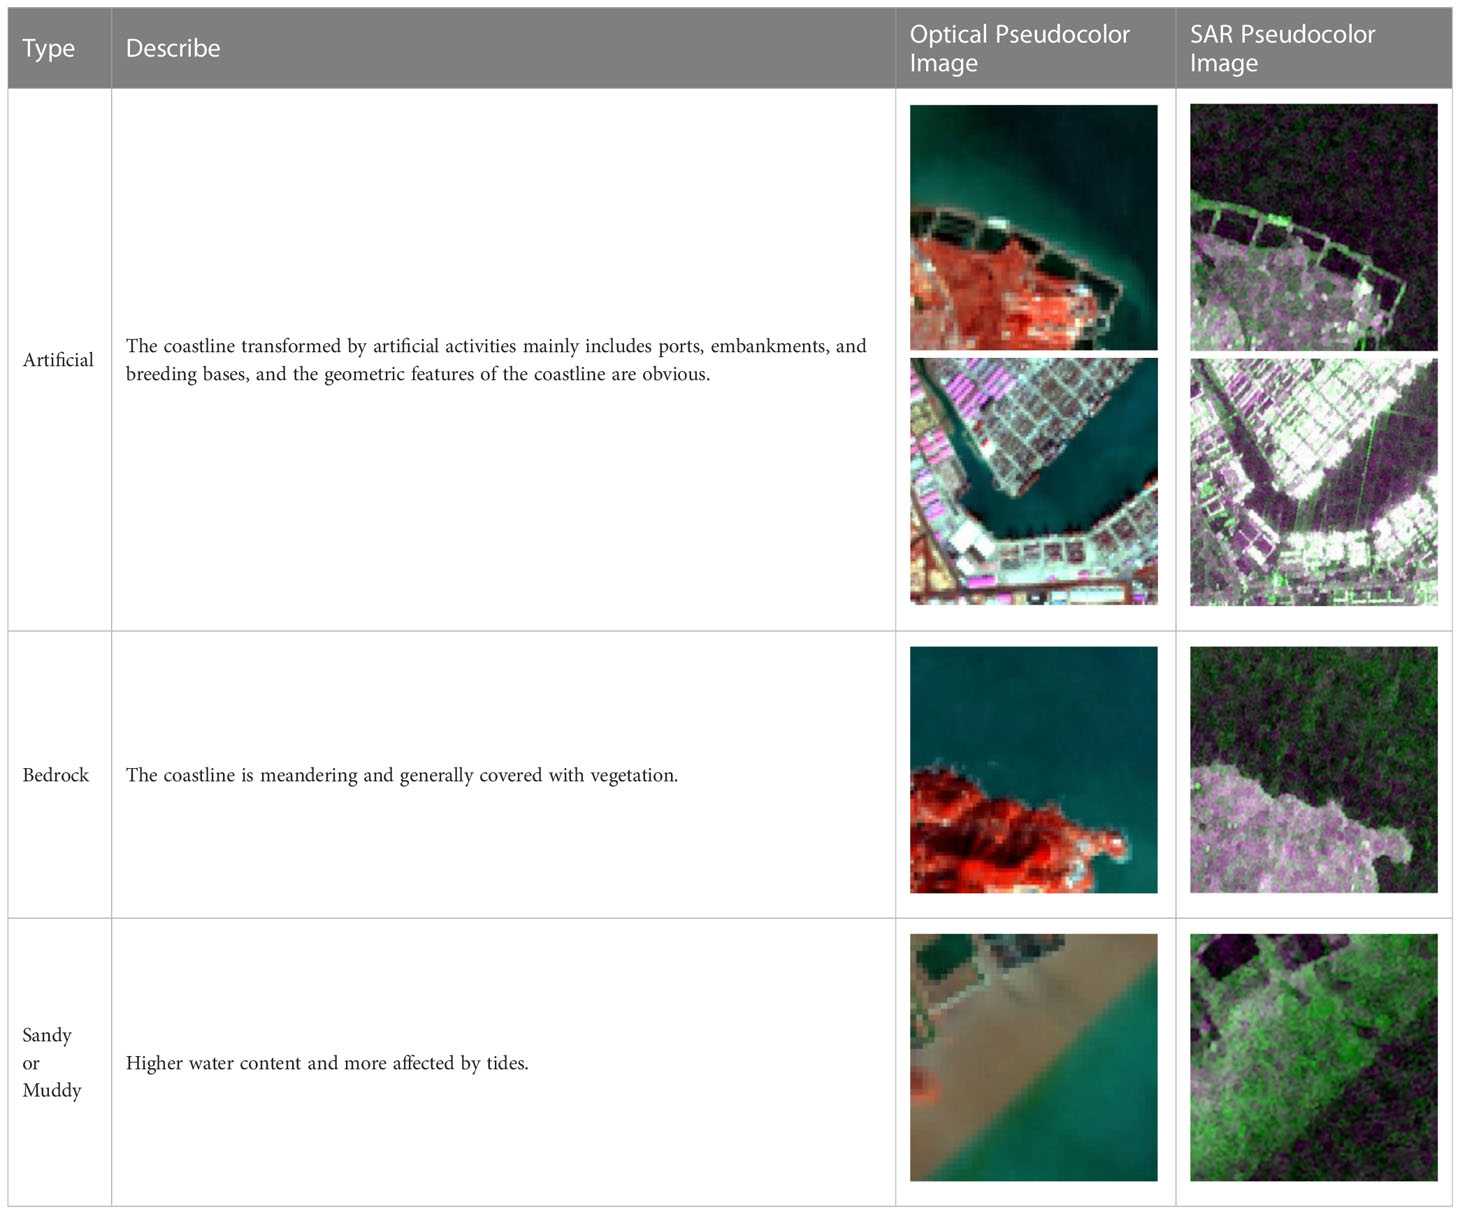
Table 2 Coastline classification standards.
To classify land cover types corresponding to different coastlines with multi-source data, this paper adopted the U-Net (Ronneberger et al., 2015) neural network model and then counted the coastline type information. U-Net is a semantic segmentation model that adopts a convolutional neural network. Initially established for medical image segmentation, U-Net has later been applied to remote sensing image processing due to its outstanding segmentation effect (Zhang et al., 2023). In this study, the optical pseudocolor composite image from November 26 2017 and SAR pseudocolor composite image from November 25 2017 were used as standards to conduct histogram matching for images from other years. After the comparison test, the extracted coastline data were extended towards land to establish a 500m buffer in order to remove interference information and obtain the range of samples. The samples were cut into 512×512 size for manual labeling. A total of 447 optical image samples and 178 SAR image samples were labeled. Of these, 80% were used for model training and the remaining 20% for verification. The optical and SAR samples were input into the U-net model for training to obtain their respective prediction models. The classification images were sized to 512×512 for prediction and mosaic, and the coastline land cover type of each year was obtained through classification. The coastline type was statistically analyzed according to the classification results.
3.4 Accuracy verification methods
To verify the accuracy of both types of data, coastline extraction was performed in 2017 using two different types of data with only one day apart. Due to the lack of real data, part of the artificial coastline was manually drawn using GF-2 data with a spatial resolution of 4m as a substitute for the actual coastline. A total of 311 checkpoints were selected at intervals of 30m for precision comparison. For the accuracy evaluation of the coastal land cover result, the confusion matrix was used to calculate, and the overall accuracy and kappa coefficient were used to evaluate the accuracy.
3.5 Analysis of coastline changes
The artificial coastline index is most often used to describe the changes of coastline. In this paper, the End Point Rate (EPR) (Akbari et al., 2022) (Formula (4)) and Linear Regression Rate (LRR) (Thior et al. (2019)) (Formula (5)-(7)) were used to evaluate the changes of the coastline of Jiaozhou Bay area.
where the parameter Distance is the net coastline movement distance, which is the distance of the change in the direction of the extended baseline between the oldest and latest years of the coastline, and the parameter Time is the time span, which is the interval between the coastline of the oldest year and the latest year.
where xi is the year and yi is the distance from the coastline to the baseline along a cross section, and and are the averages of xi and yi, respectively.
These two indicators represent changes relative to a baseline, and the EPR only considers the relationship between the newest and oldest coastlines, which more directly reflects the results of coastline changes. In contrast, the LRR calculated by the least squares method is considered to have a more statistical concept and can better reflect the average trend of coastline change (Zoysa et al., 2023). Landward movement (erosion) refers to the inward movement of a coastline relative to the baseline, while seaward movement (accretion) refers to the outward movement of a coastline relative to the baseline. Erosion is typical expressed as negative (-), while accretion is expressed as positive (+). The buffer boundary 500m to the ocean of the results obtained in 2022 was taken as the baseline, and 100m was taken as the average interval to obtain 1048 transects perpendicular to the coastline for calculating the artificial coastline index.
To analyze the reasons for coastline changes in the Jiaozhou Bay area, we introduced the Pearson coefficient r to determine the relationship between two quantities. As shown in Formula (8), the value of the Pearson coefficient between [-1,+1] and “+” and “-” indicates the positive and negative relationship between two quantities. The stronger the correlation between two quantities, the closer their absolute value of Pearson coefficient is to 1.
where and are the average values of the two variables x and y, respectively.
3 Results and accuracy verification
3.1 Coastline extraction results and type information
By comparing the extracted coastline results (Figure 3) with the coastal land cover results (Figure 4), we obtained the results of eight periods of Jiaozhou Bay coastline since 1987. The coastline lengths of different years and different types were counted, and the results are shown in Figure 5.

Figure 3 Overlay of coastline, baseline, and cross section (pseudocolor composite image with 1987 data in background).
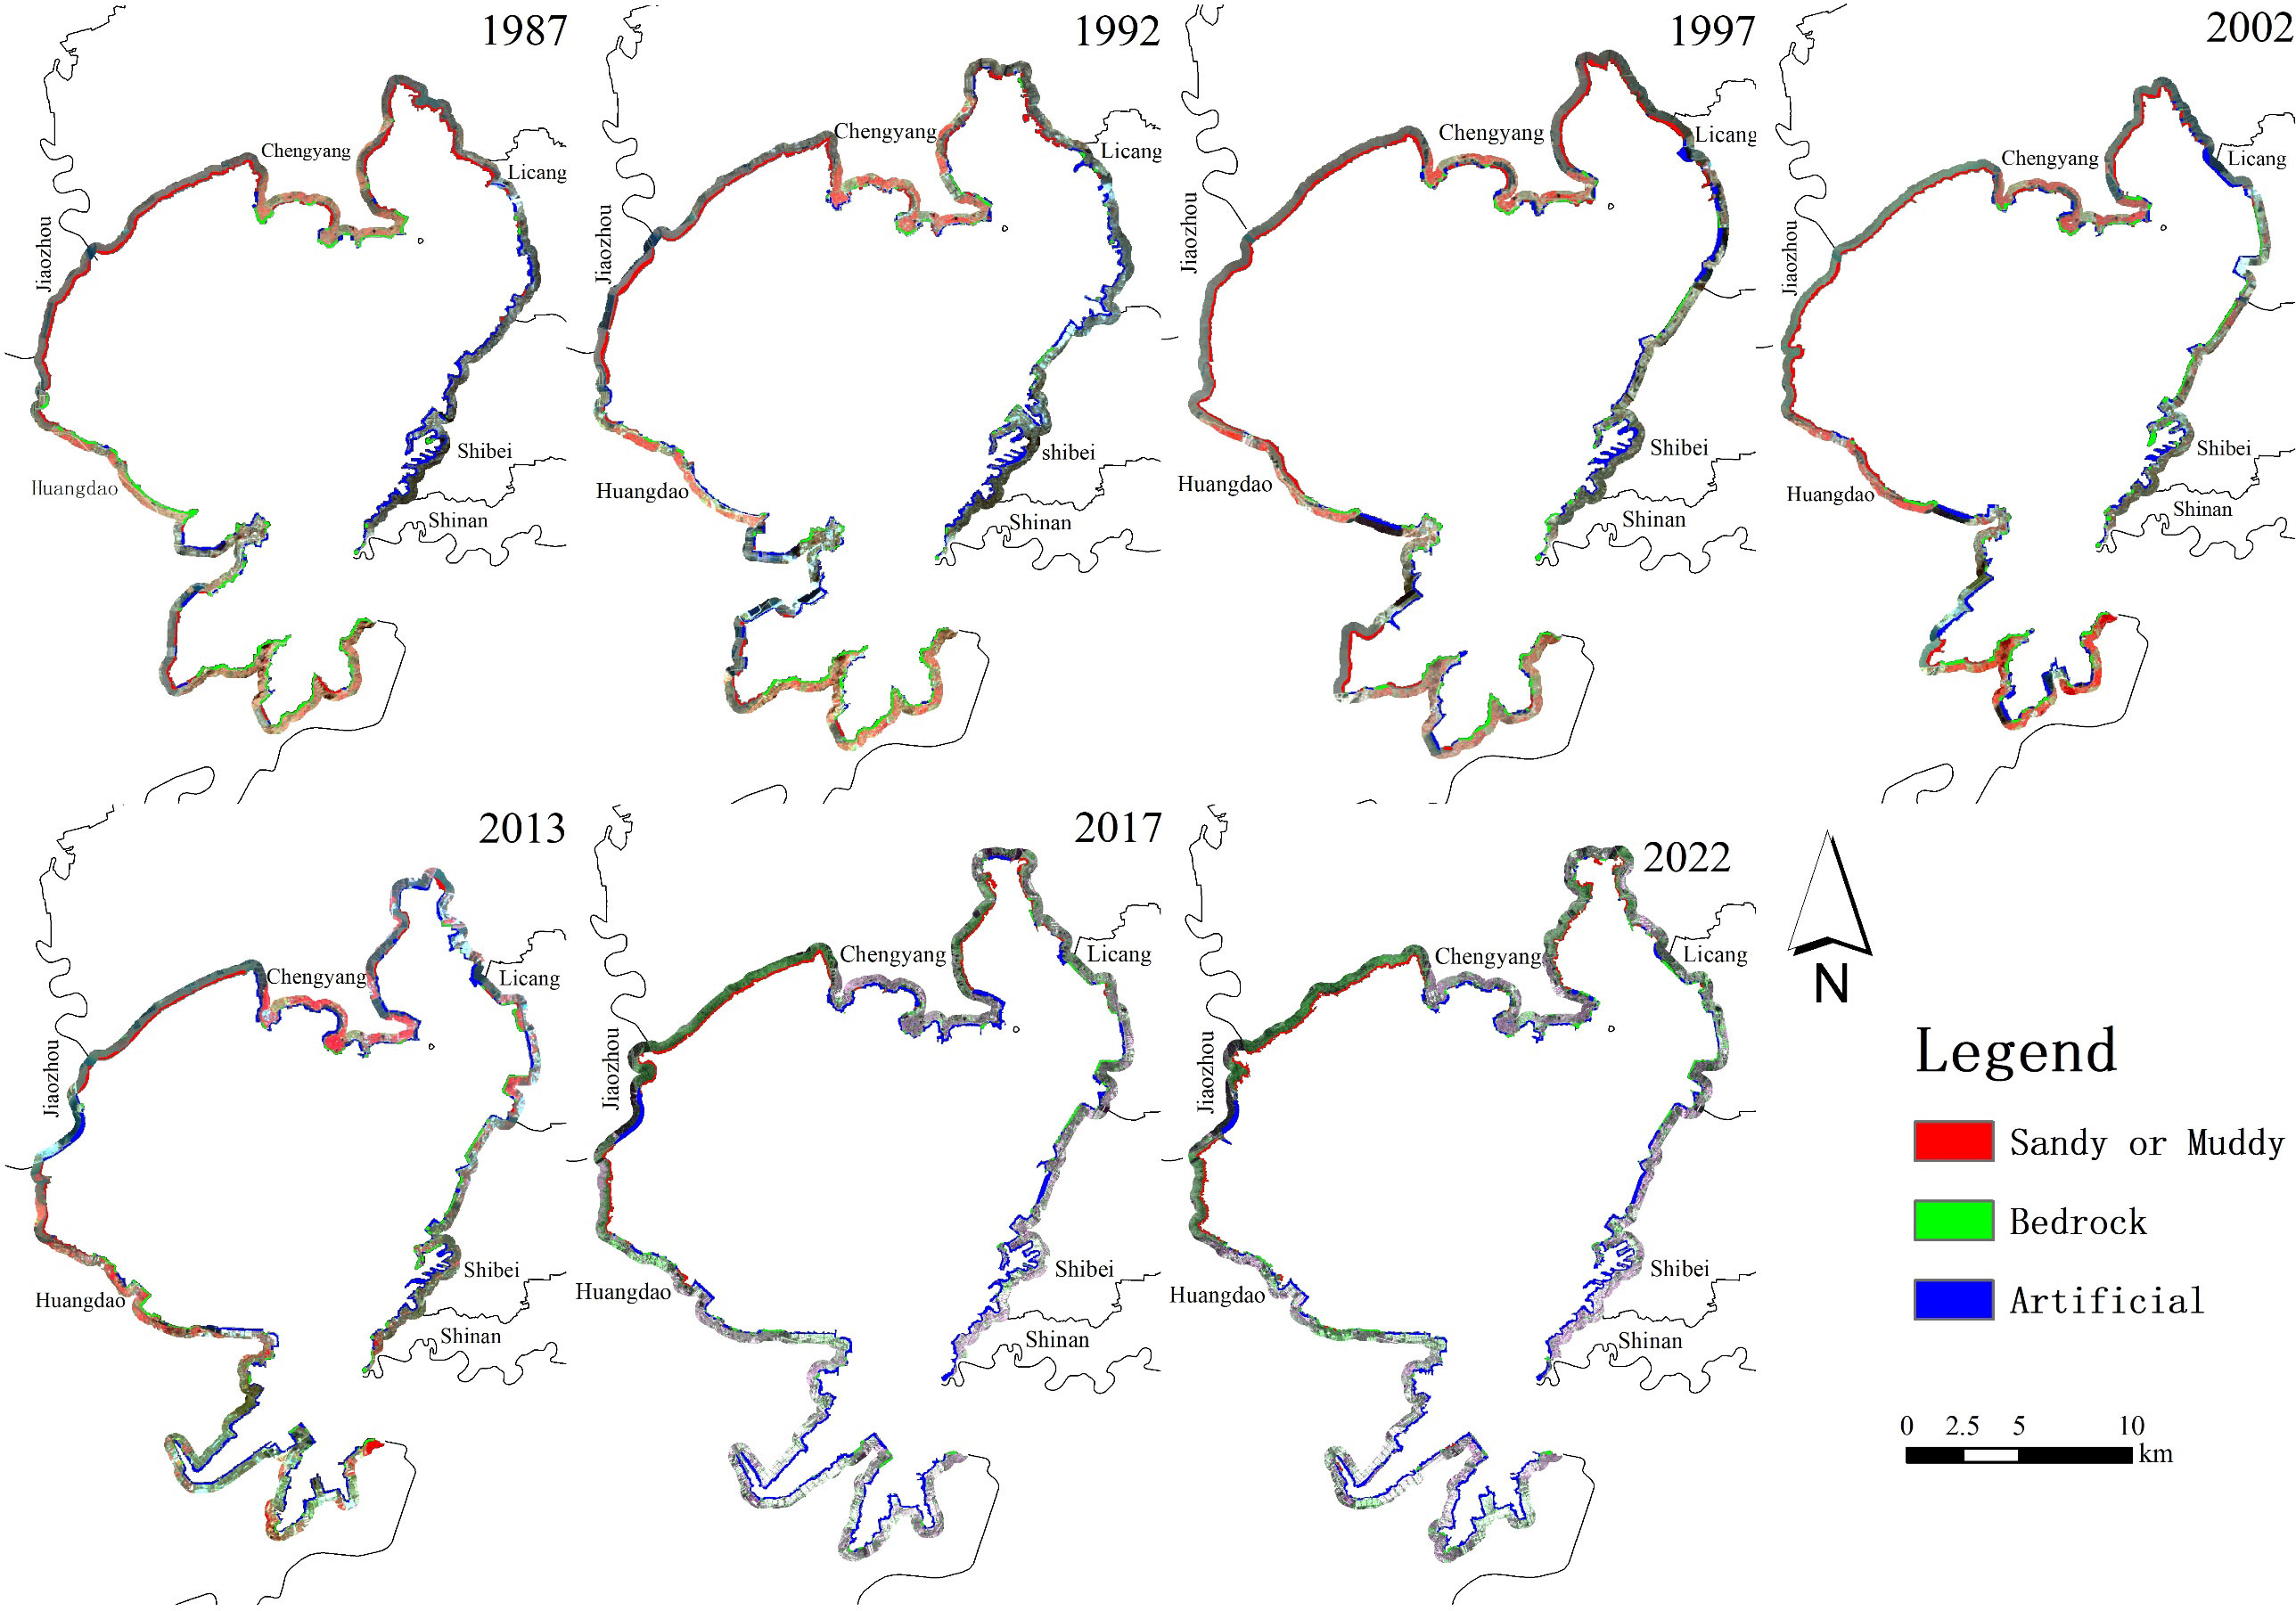
Figure 4 Results of coastal land cover type classification of Jiaozhou Bay. The base map is the result of matching the respective buffer histograms.
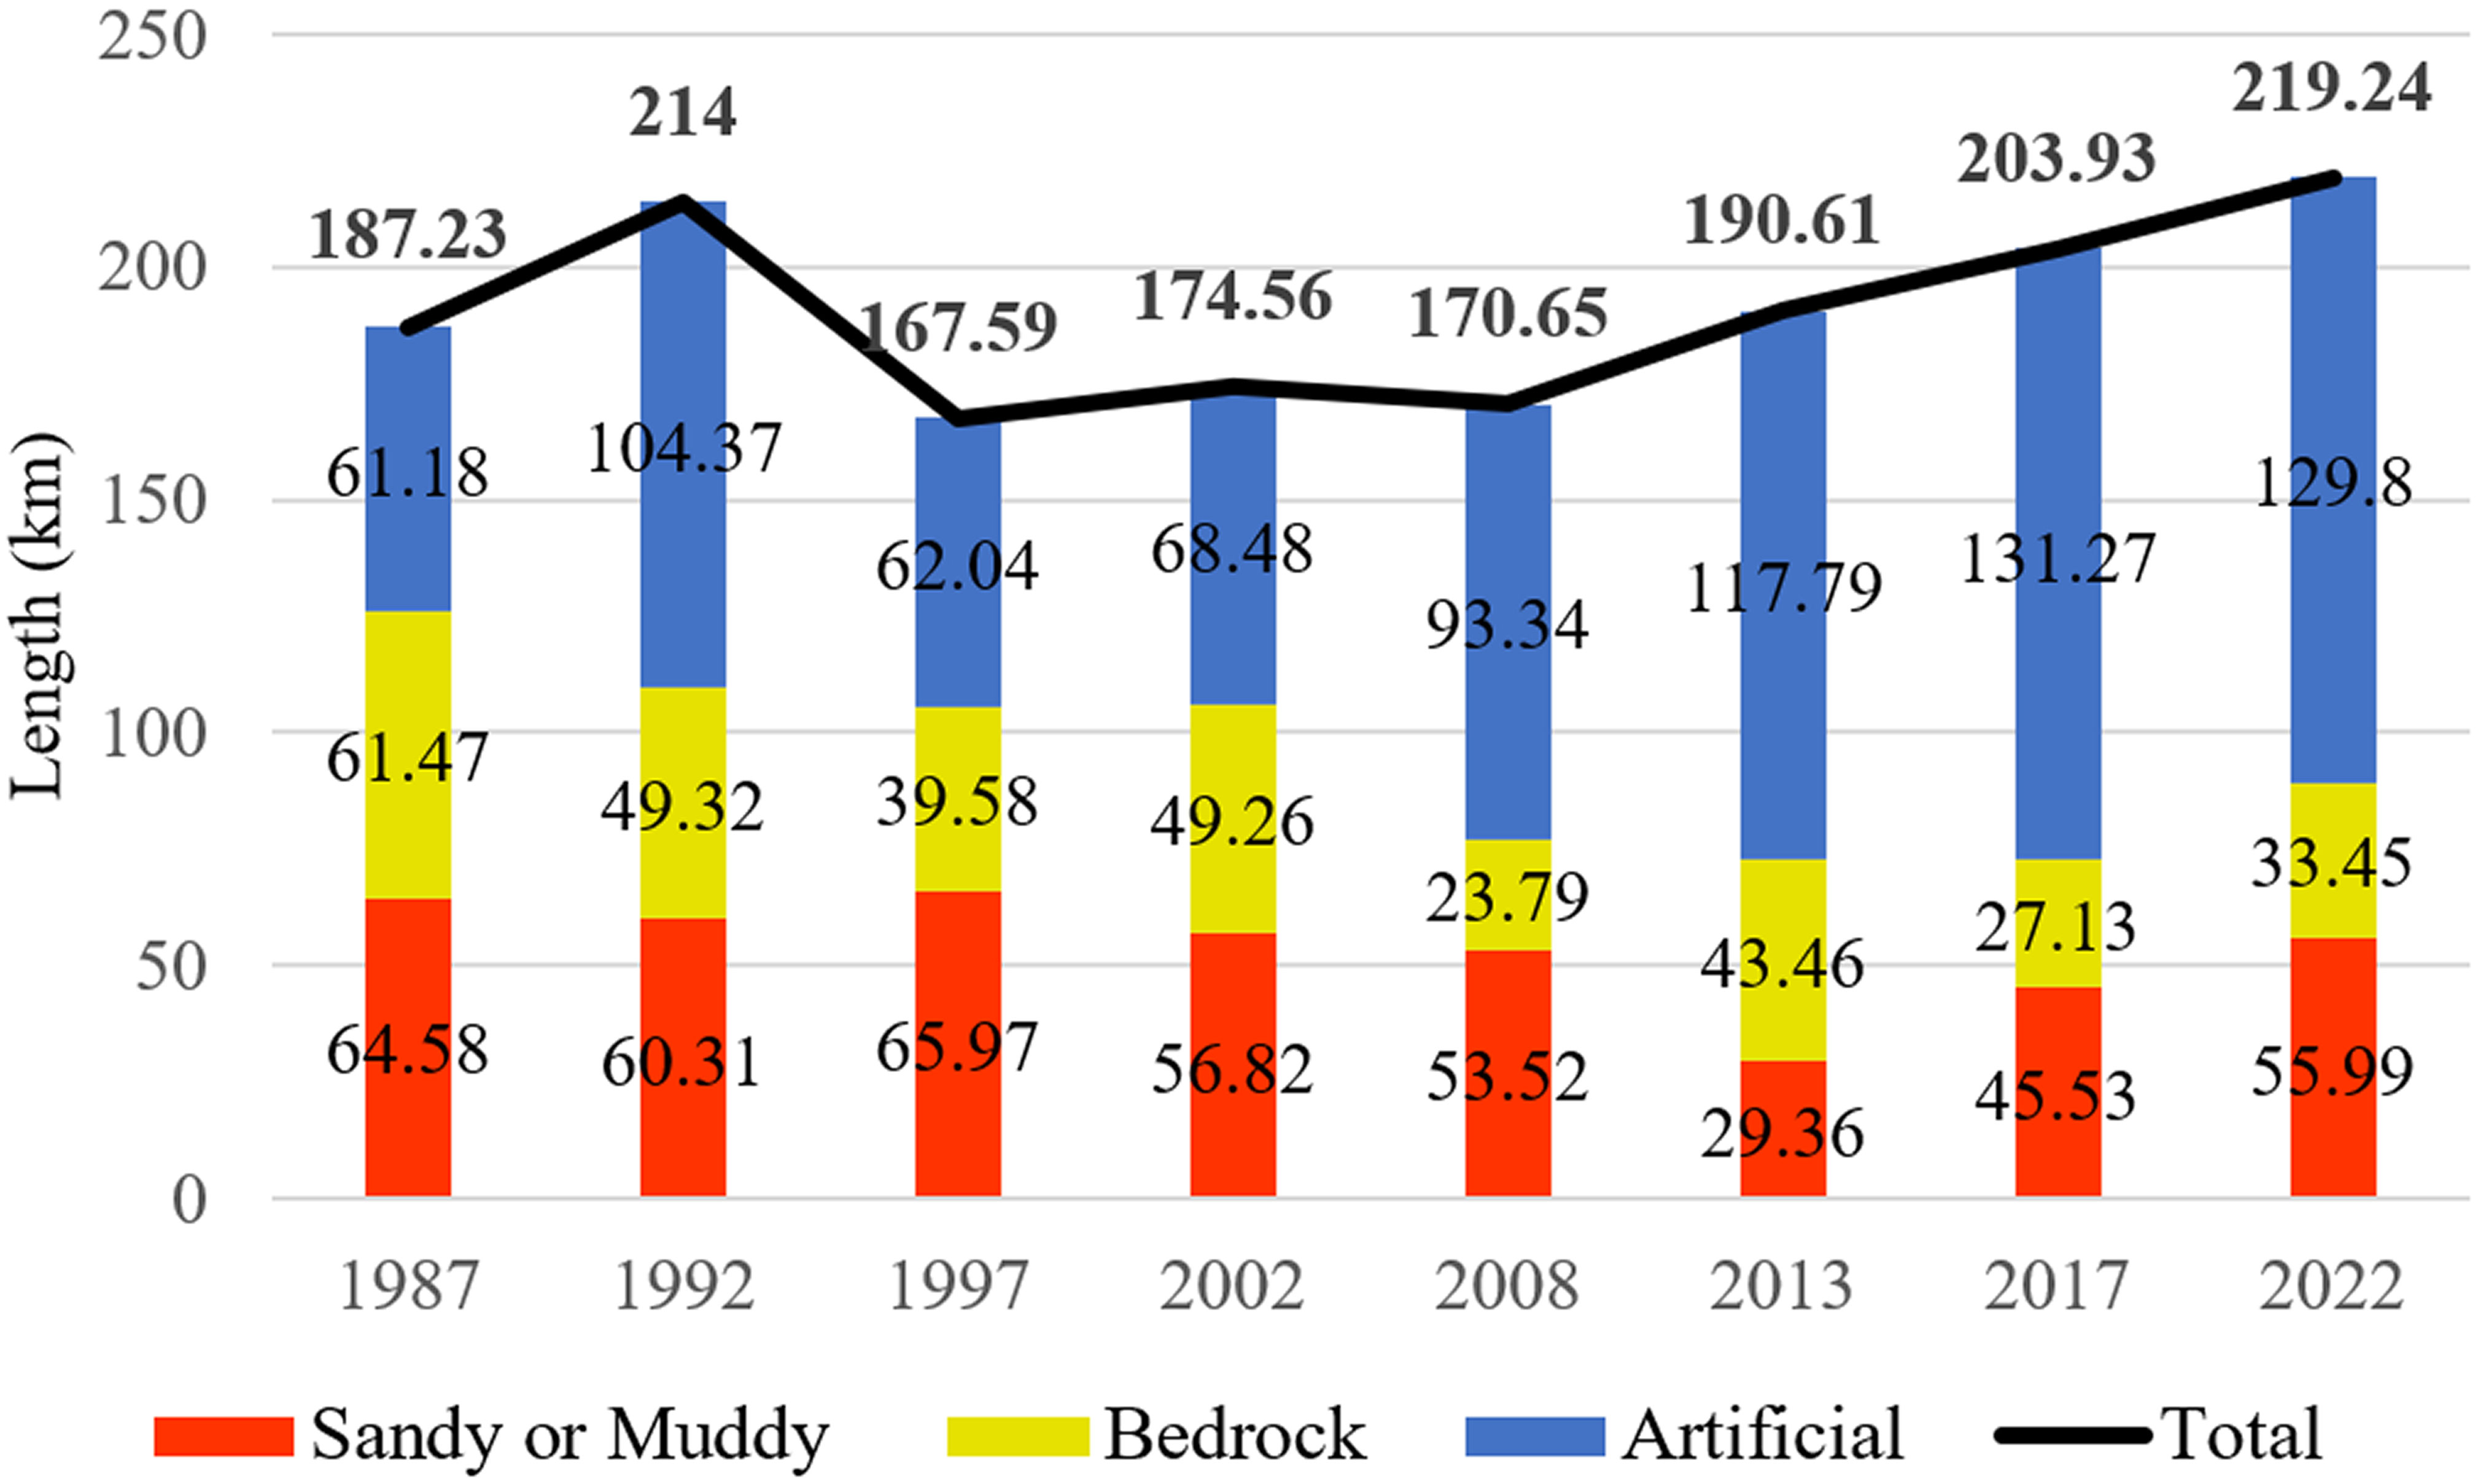
Figure 5 The total length of coastline and the length of different types of coastlines changed during the study period.
From 1987 to 1992, the coastline of Jiaozhou Bay briefly increased from 187.23km to 214km but then decreased to 167.59km in 1997. During this period, the length of artificial coastline also showed a consistent trend of first increasing and then decreasing. After 1997, there was a general trend of growth, and by 2022, the length of the coastline reached 219.24km. The length of artificial coastlines increased significantly from 61.18km in 1987 to 129.8km in 2022, while the other two types of coastlines first decreased and then increased.
3.2 Accuracy verification
The confusion matrix, as shown in Table 3, indicates that the U-Net model accurately classified the three types of coastlines based on their degree of separation. The overall accuracy of optical and SAR image classification is 94.49% and 94.88%, and the kappa coefficient is 0.9143 and 0.8949, respectively.
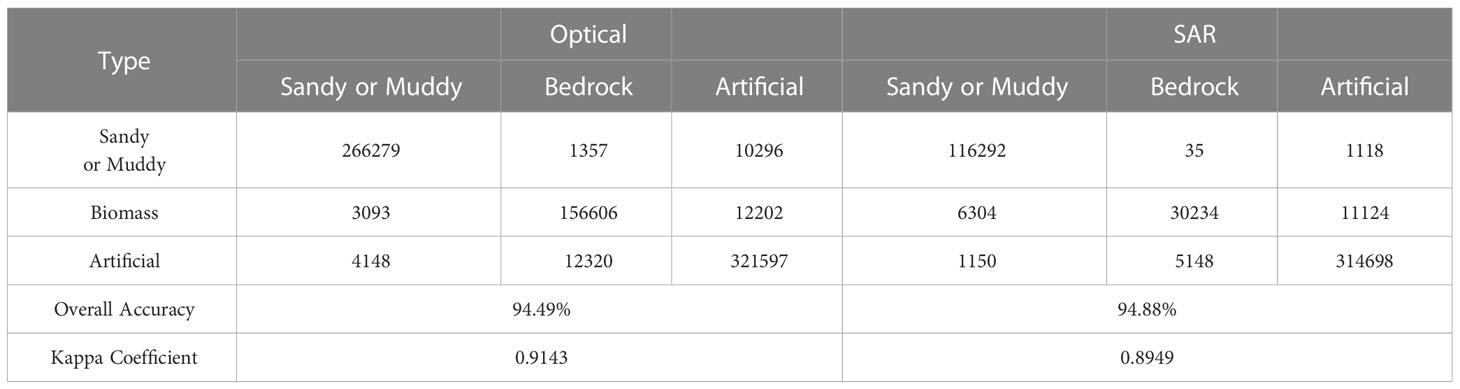
Table 3 Accuracy calculation of semantic segmentation (pixel).
As shown in Figure 6A, the average error of optical and SAR data is 29.2m and 13.1m, respectively. The average deviation in the direction of the ocean, or comprehensive accuracy, is better than 1 pixel when using data with a resolution of 30m. Additionally, SAR data has higher accuracy than optical data at the same resolution. To compare and analyze the differences in coastline extraction between multi-spectral optical data and dual-polarization SAR data, 2,865 comparison points were selected along the coastline with a spacing of 50m at each point for position comparison, as shown in Figure 6B. Among them, 2,021 points are less than 30m apart, accounting for 70.54%, and 2,624 points are less than 60m apart, accounting for 91.59%. The mean error is 5.44m, which is much less than 1 pixel, and the error for the part of the coastline that remains unchanged in the five-year cycle of coastline extraction is 1.09m/yr. When the spatial resolution is approximately 30m, it can be concluded that the coastline extraction error between different datasets is around 1-2 pixels.
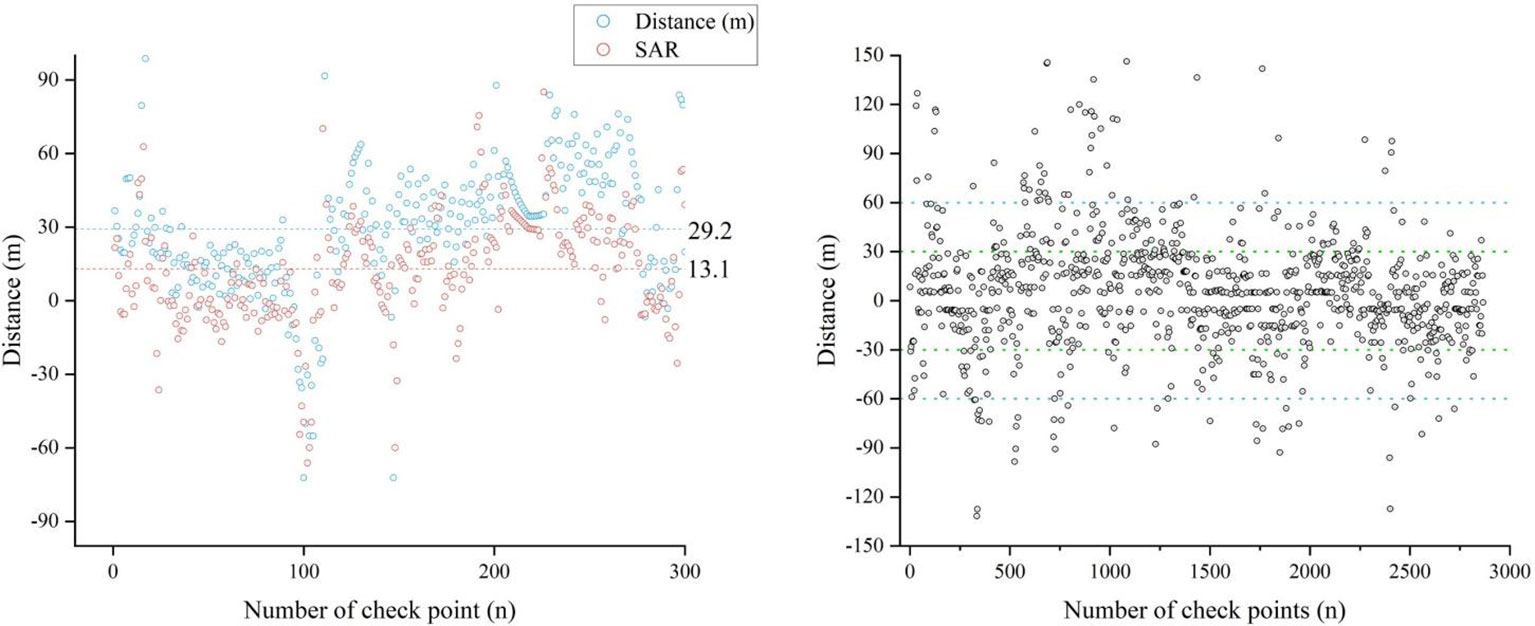
Figure 6 Precision comparison verification diagram. (A) is the distance between the SAR image and the optical remote sensing image and the real coastline in 2017. Checkpoints were selected at intervals of 30m. The blue dot is the extraction result of the optical image, the red dot is the extraction result of the SAR image, and the corresponding dashed color line is the average error; (B) is the difference distance between the SAR image and optical remote sensing image in 2017, and the comparison point is selected with an interval of 50m. The blue and green dotted lines indicate ranges of ±30 and ±60, respectively.
3.3 Dynamic changes in coastline location
The line chart depicting the changes in the EPR and LPR along the coastline of Jiaozhou Bay from 1987 to 2022 is presented in Figure 7. The coastline of Jiaozhou Bay is constantly changing, and the results of the EPR and LRR are highly consistent. Nearly 90% of the coastline extends from land to sea, and the average variation is 14.19m/yr and 14.24m/yr, respectively. The statistical changes in different districts are shown in Table 4, with the maximum value occurring in Huangdao District. The EPR and LRR values indicate that the maximum rate of accretion reaches 59.94m/yr and 69.48m/yr, respectively, which are 2.95 and 3.12 times higher than the average change observed in the district. The maximum accretion point has changed by nearly 2.5km towards the ocean in the past 35 years. Shibei, Licang, and Huangdao districts exhibit a high rate of coastline change, with accretion far exceeding erosion. These areas will be studied and discussed as key regions.
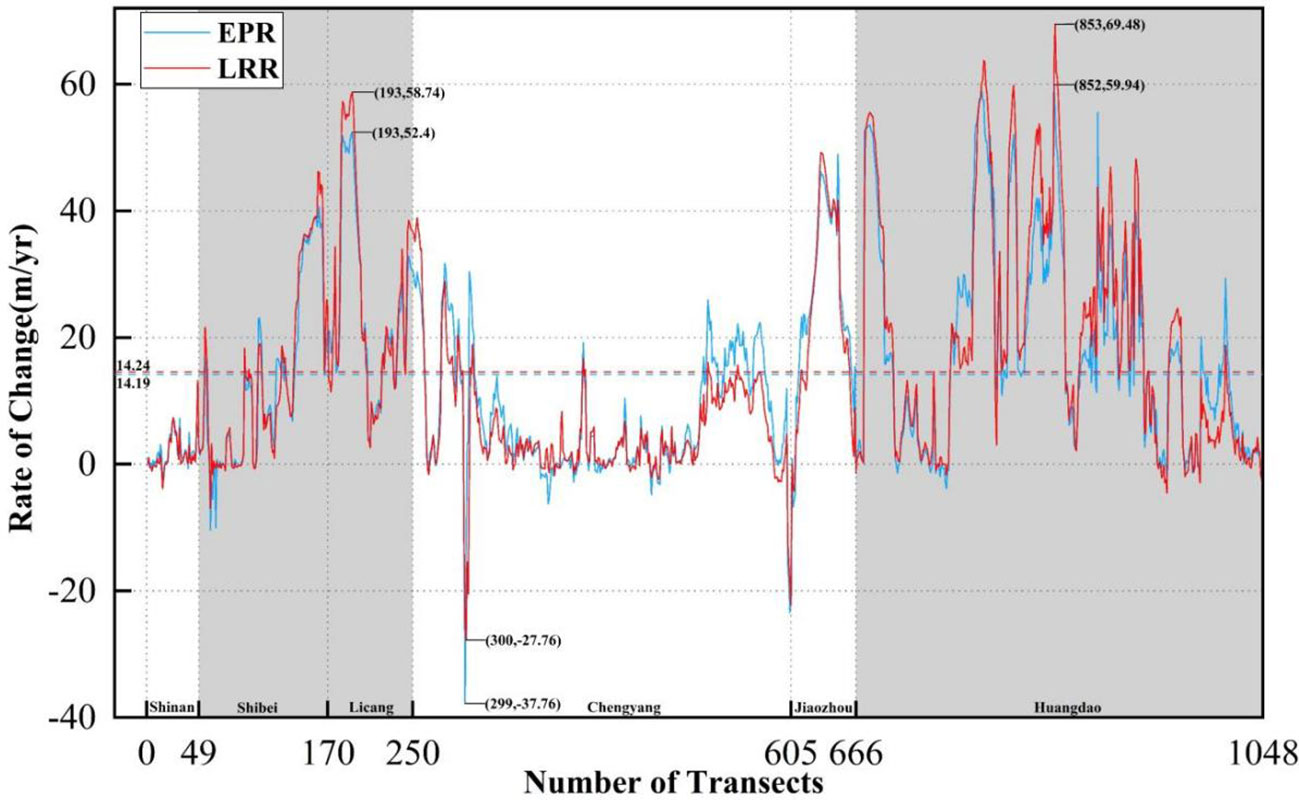
Figure 7 The coastline change rate of Jiaozhou Bay from 1987 to 2022. EPR and LRR are shown in blue and red solid lines. The blue and red dotted lines are the mean values of EPR and LRR, respectively. The parentheses are the maximum values for the two rates.
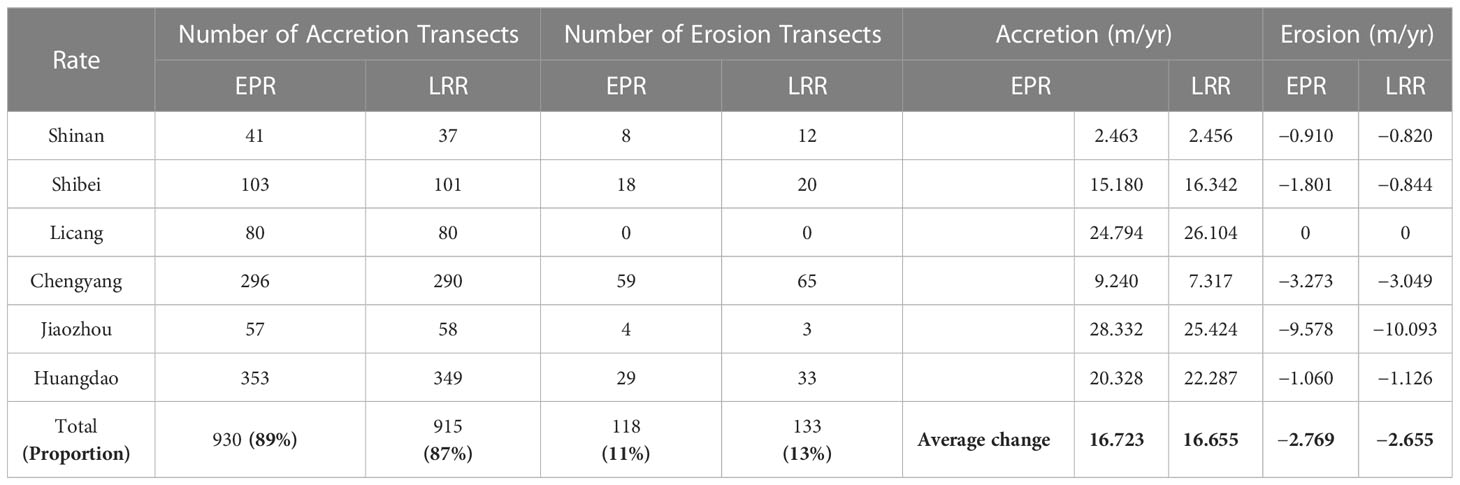
Table 4 Statistics of the overall changes of coastline in Jiaozhou Bay from 1987 to 2022.
4 Discussion of the changes of the coastline from 1987 to 2022
4.1 Statistics of land reclamation area
The expansion of coastlines into the sea or land is influenced by dominant factors. From the above results, it can be seen that the artificial coastline in the Jiaozhou Bay area is the type of coastline with the most significant changes, which are directly related to human-made land reclamation and excavation. We have calculated these changes according to the following principles:
● The breakpoints along the coastline were connected to form a closed polyhedron, and the polyhedron formed by the coastlines of the two adjacent years was overlaid to obtain the changing region of the coastline.
● Based on the accuracy evaluation results of the two consecutive years, any change area less than 4 pixels was excluded.
● In order to eliminate the influence of tides, the coastal areas with the same sandy or silty type and bedrock change were deleted. The region of change with an earlier time of any type and a later time of sandy or silty type and spreading out to the ocean was deleted.
● If the coastline change area of the adjacent two years was any type of coastline at an earlier time and expanded to the sea as an artificial coastline at a later time, it was considered as reclaimed land change area. If the early time was artificial coastline and the late time was any type of coastline and expanded to land, it was regarded as the change area of excavated land.
The statistical results are shown in Figures 8 and 9. Due to the small area of excavated land (0.17km2, 1.47km2, and 0.20km2 from 2002 to 2008, 2008 to 2013, and 2013 to 2017, respectively), changes were no longer reflected by years and were uniformly represented as the erosion part.
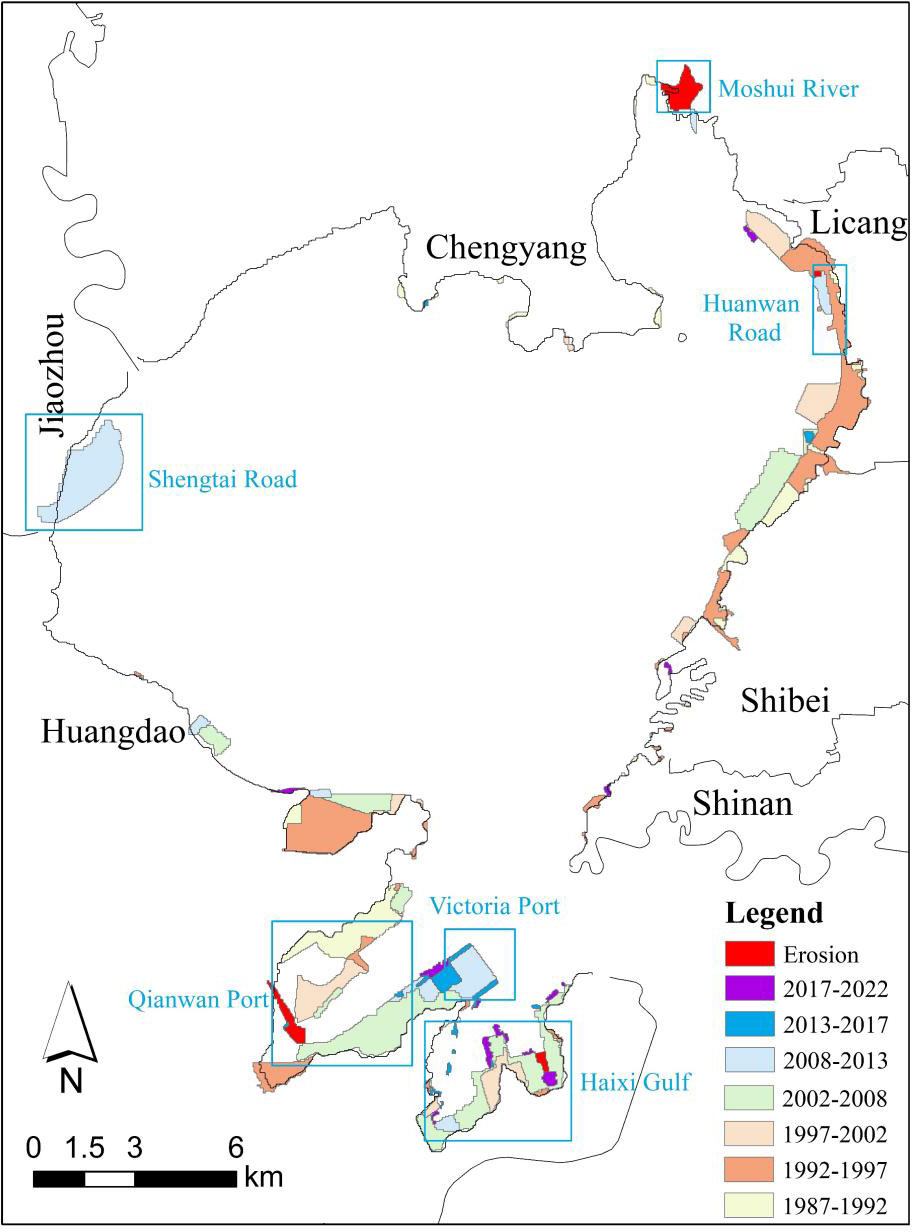
Figure 8 Reclamation and excavation in Jiaozhou Bay from 1987 to 2022. The shoreline in the base map is extracted from the experiment in 1987.
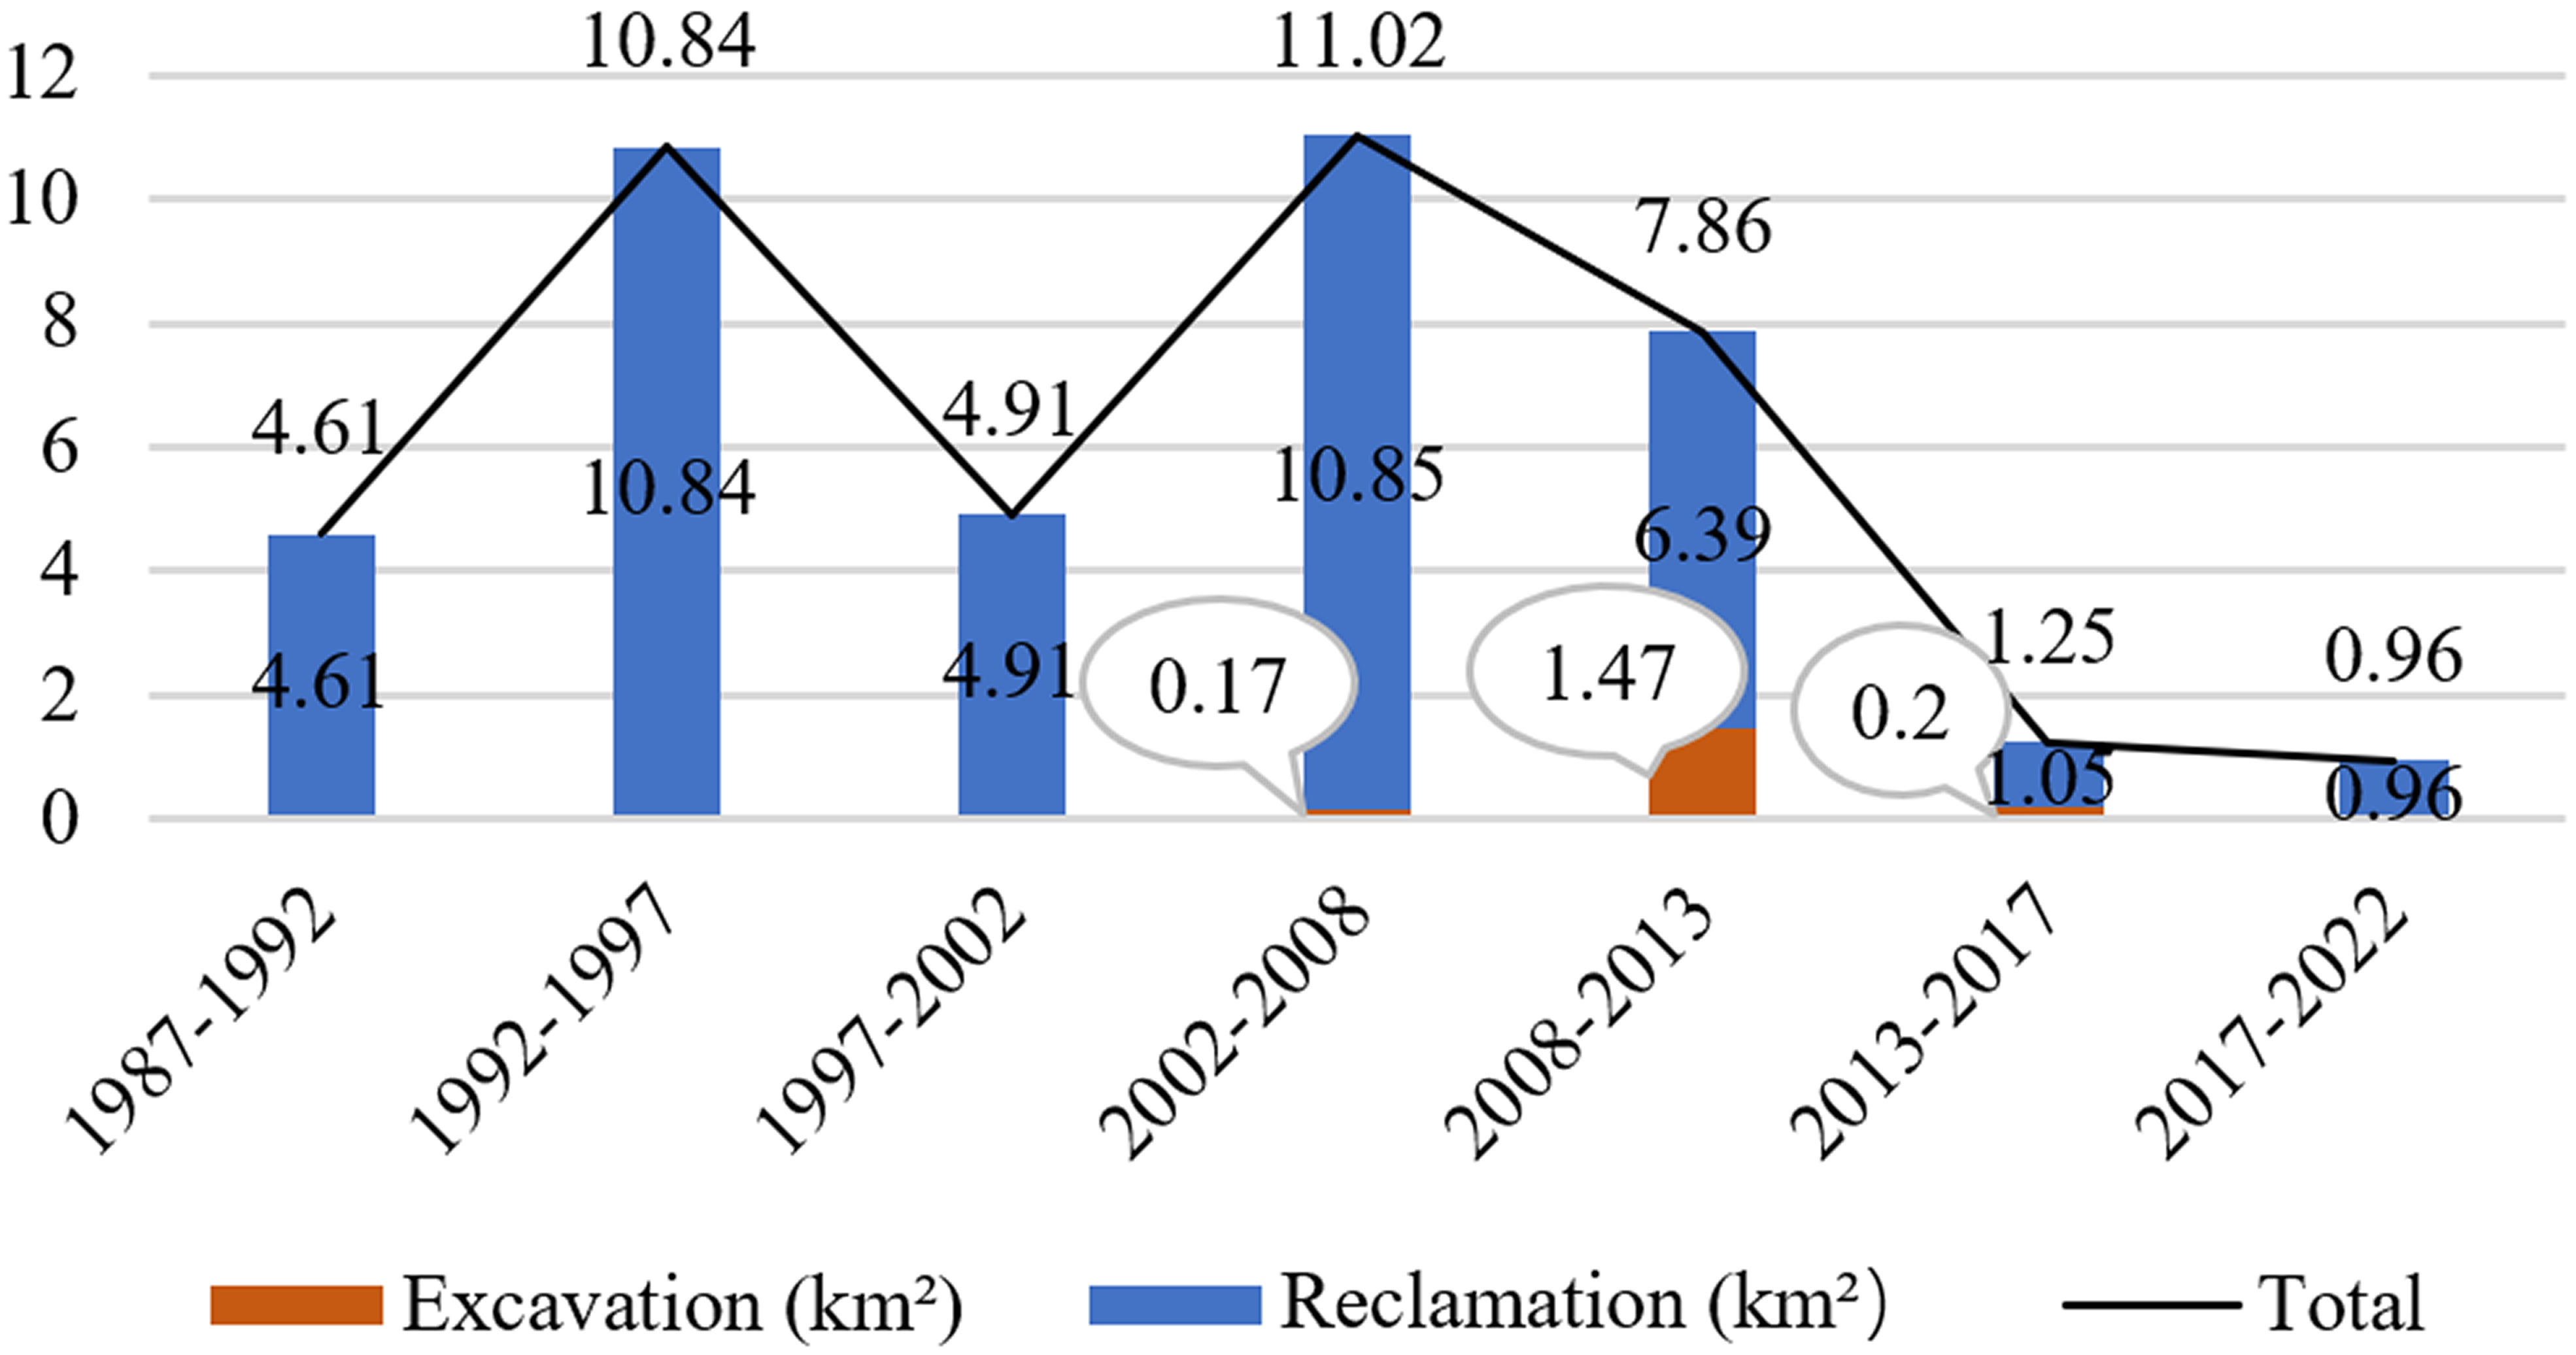
Figure 9 Statistics of reclamation and excavation area (km2) in Jiaozhou Bay from 1987 to 2022.
Land reclamation activities were frequent in the east coast of Jiaozhou Bay, mainly concentrated in Shibei and Licang districts during the first 20 years. Afterwards, these changes were mainly concentrated in Huangdao District, where several seaports were constructed, including Qianwan Port, Victoria Port, and Haixi Gulf, as highlighted in Figure 8. In addition, road construction was carried out, including Huanhu Road on the east coast and Shengtai Road on the west coast. Over the past 35 years, the total land area reclaimed from the sea has reached 41.45km2.
4.2 Coastline changes and policies in Shibei, Licang, and Huangdao
It should be noted that Shibei District, Licang District, and Huangdao District are the three districts where land reclamation is most frequent among the six districts surrounding Jiaozhou Bay. In this study, Shibei District and Licang District are considered as one region. Therefore, the land reclamation changes in these two regions are counted separately, as shown in Figure 10. The broken EPR line coincides highly with the histogram of the trend in area change. It is indicated that the changes of the coastline in these two regions were mainly caused by land reclamation. In the past 35 years, the land reclamation areas of Shibei and Licang have reached a total of 12.03km2, while that of Huangdao District has reached 22.59km2, accounting for 81.45% of the total area, which indicates that the land reclamation activities mainly occurred in these two regions. Shibei and Licang districts are located on the east bank of Jiaozhou Bay, where the “Old City” of Qingdao is situated. In order to further open up to the outside world and introduce and utilize foreign investment, Qingdao established the Huangdao Economic and Technological Development Zone in the Huangdao area in 1984. The coastline changes of the two areas over the past 35 years have been greatly influenced by Qingdao’s policies.
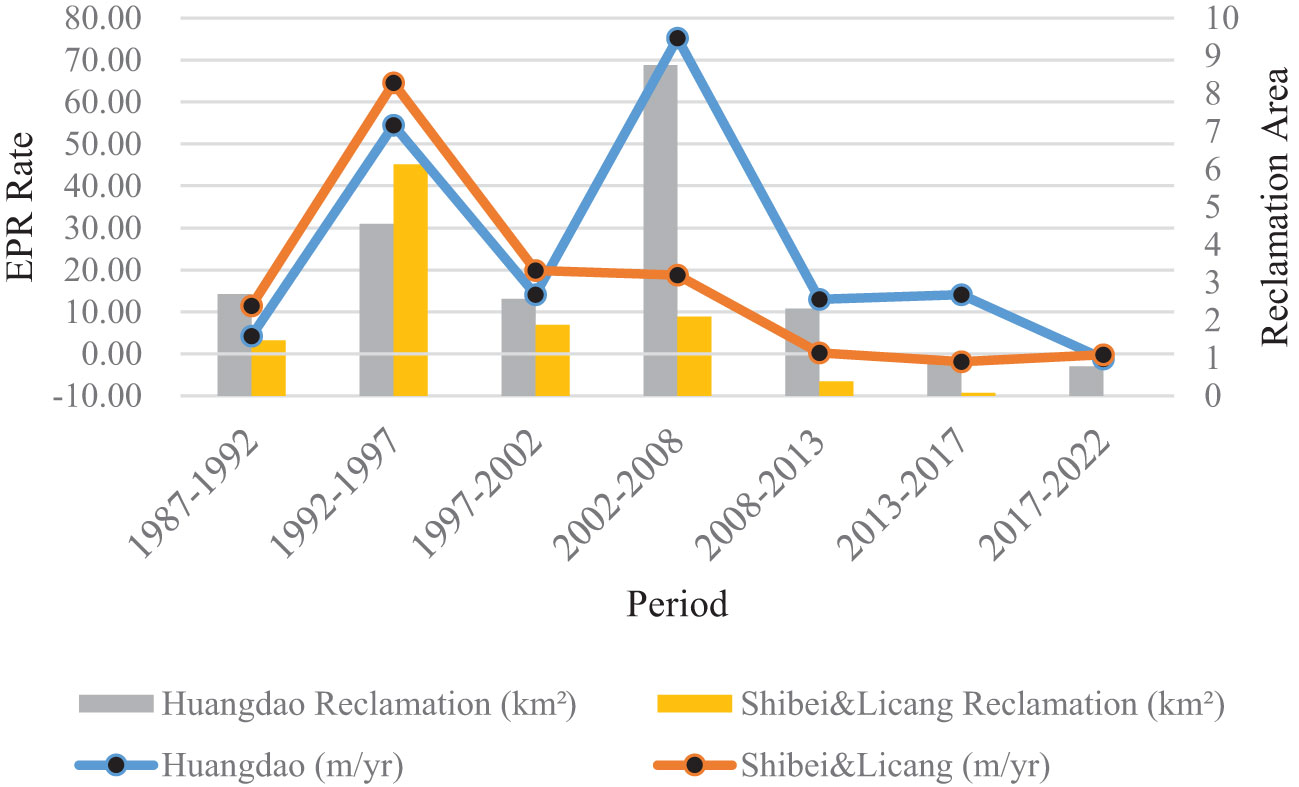
Figure 10 Integrated phase change table of land surface reclamation in Shibei, Licang, and Huangdao districts. The broken line shows the change of EPR, and the bar chart shows the area of land reclamation.
In the Ten-year Plan of Qingdao National Economic and Social Development and the Outline of the Eighth 5-Year Plan issued in 1991, it was mentioned that the “Old City” should be planned as a group in the south, middle, and north. The plan included establishing a north–south narrow belt layout, strengthening infrastructure construction, improving urban functions, and enhancing urban modernization. During this period, Shibei and Licang districts constructed a road around the sea called Huanwan Road and carried out numerous reclamation activities. The zigzag coastline was transformed into a relatively straight one, resulting in a reduction of the total length of the coastline. During this period, the reclamation activities in Shibei and Licang districts also peaked, and the construction of Qianwan Port and other ports in Huangdao District supported land reclamation in the Huangdao area. Especially after implementing the strategy of advancing to the Qingdao West Coast New Area in 2003, which aimed to promote industrial cluster development in Huangdao District, a large number of ports were constructed there, leading to extensive land reclamation activities. During this period, the land reclamation activities in Huangdao District reached a peak.
4.3 Reasons for coastline changes
To explore the main factors that lead to coastline changes in Jiaozhou Bay and their relationships, Figure 11 presents a scatter matrix that was formed of the length of three types of coastlines, total coastline length, and area change caused by artificial reconstruction. The relative relationship between them was then obtained through fitting.
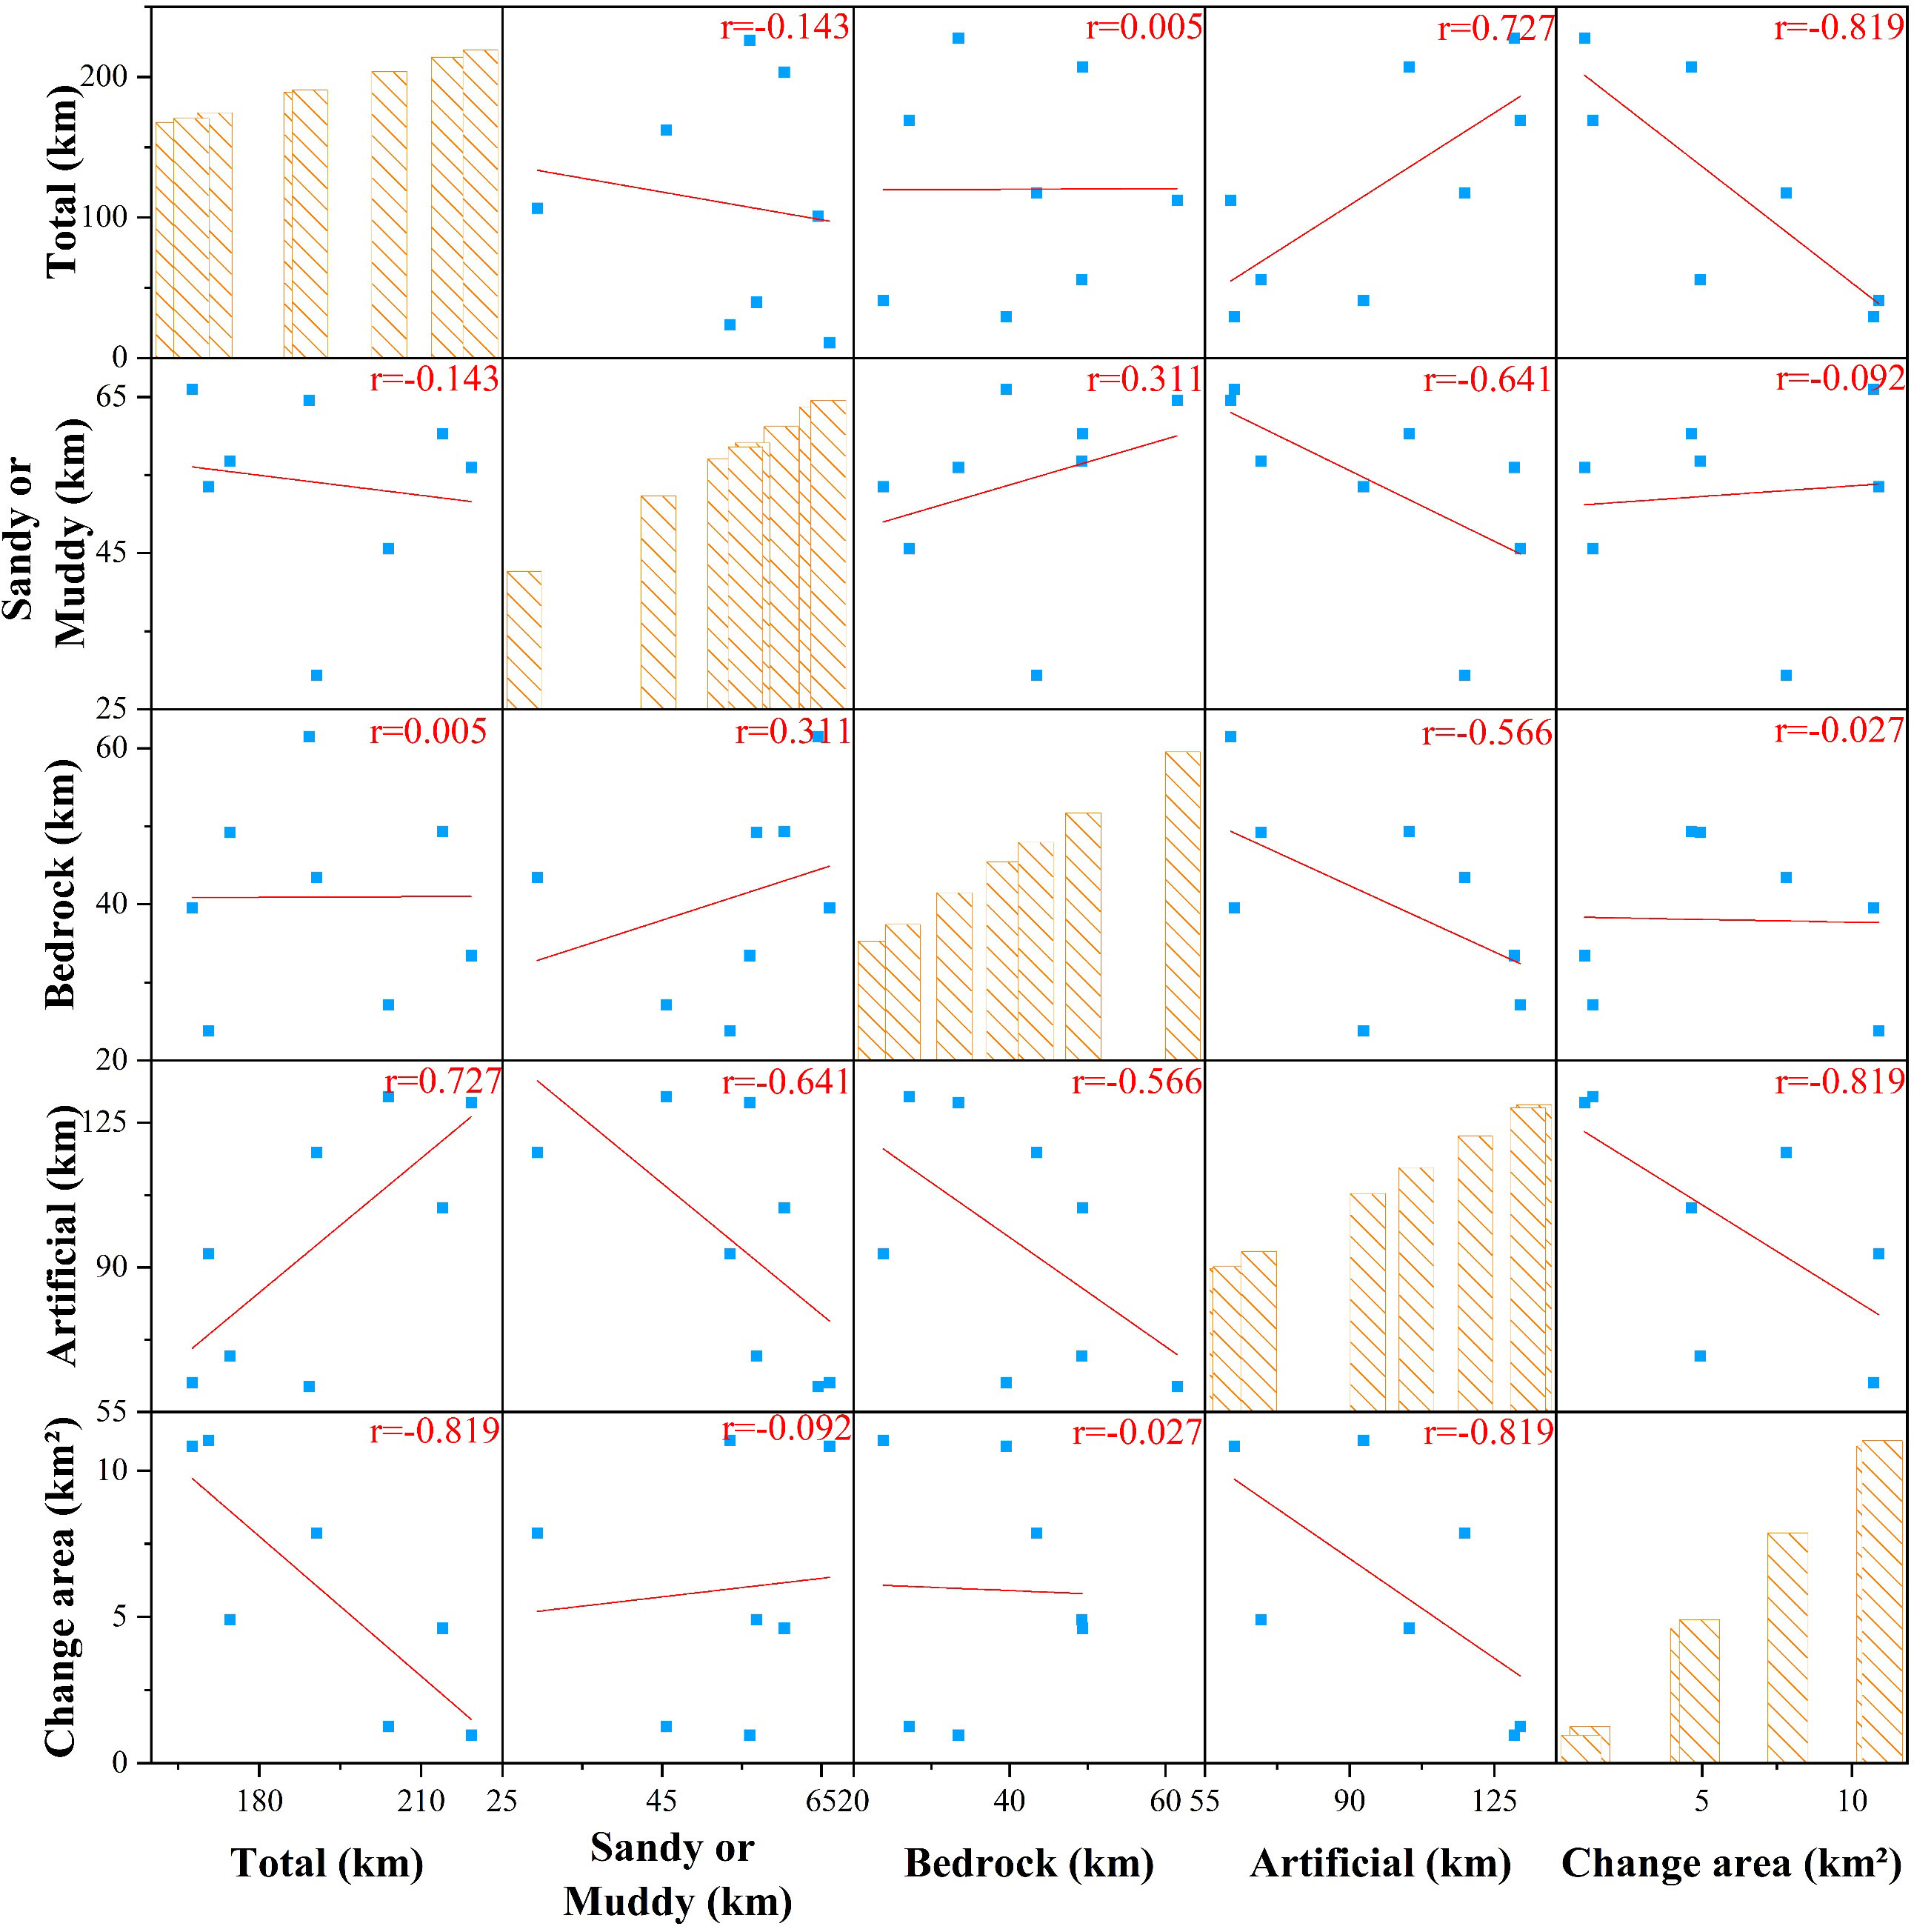
Figure 11 Scatter matrix of sandy or muddy material, bedrock, artificial coastline length, total coastline length, and area changes caused by human behavior. The red line is the fitting line, and r value is the Pearson correlation coefficient.
The relevance value (r) between the total length of the coastline and artificial coastline was 0.727, indicating a strong positive correlation. However, there was a strong negative correlation between the total length of the coastline and the area change caused by artificial coastline, with an r value of -0.819. This indicates that the dominant factor driving coastline change in the Jiaozhou Bay area over the past 35 years has been human activities related to coastline reconstruction. These activities, especially the construction of seaports and roads, made the coastline of Jiaozhou Bay more regular in shape. As a result, the coastline initially appeared to be shortening but then began to lengthen due to further reconstruction in these areas. Sandy or muddy shorelines, which are strongly affected by tides and may lead to changes in the area of Jiaozhou Bay, have little impact on the total length of the coastline. Artificial coastline is negatively correlated with sandy or muddy coastlines and bedrock-rich coastlines. This is because human activities related to coastal reconstruction have transformed parts of these two types of coastlines into artificial ones over the past 35 years. Human reconstruction activities in the Jiaozhou Bay area began to weaken after 2013. Since 2017, the length of the other types of shorelines has been increasing, while the artificial coastline area remains stable.
In a word, the coastline of Jiaozhou Bay is constantly changing. During the nearly 20 years from 1992 to 2013, the reconstruction of Jiaozhou Bay’s coastline was at its peak, particularly in terms of sea and land reclamation for port and coastal road construction, which significantly altered the spatial distribution of the coastline. Over the following 10 years, developers along the shoreline gradually came to realize that the reconstruction of Jiaozhou Bay’s coastline had caused significant damage to its marine ecological environment. Then, the reconstruction speed leveled off, and the length of sandy or muddy coastline and bedrock increased.
5 Conclusions
To analyze the spatio-temporal changes of Jiaozhou Bay’s coastline over the past 35 years, we utilized a combination of long-term optical and SAR images and the NDWI and SDWI indices with the Otsu threshold method to automatically extract the coastline. We then used the U-Net network to classify different types of coastlines and analyzed their spatio-temporal changes over the past 35 years. Through the research in this paper, the following valuable conclusions can be drawn:
1) The coastline type information provides important information for analyzing long time series coastline changes. Based on the U-Net model, the coastline type information of Jiaozhou Bay was accurately extracted. The overall accuracy of the classification based on the optical and SAR images is 94.49% and 94.88%, and the kappa coefficient is 0.9143 and 0.8949, respectively.
2) The NDWI based on multi-spectral remote sensing data and the SDWI based on dual-polarization SAR data can effectively extract coastline information. The average error of the coastline extracted from the NDWI by optical data and SDWI by SAR images is about one pixel, and the accuracy of SAR image is better than that of optical image. The error of coastline extraction from the two types of data is within the 1-2 pixels range. When these errors are reflected in the coastline evaluation index, the error is 1.09m/yr, which achieves a high accuracy under the image condition with a resolution of 30m.
3) The coastline of Jiaozhou Bay is dynamically changing. In the past 35 years, due to the frequent human activities, the coastline has been reconstructed on a large scale, and the length of the artificial coastline has increased significantly. According to the LRR, the coastline is developing at an average of 14.24m per year towards the sea, and the maximum change reaches 69.48m/yr.
4) In the past 35 years, the main reason for the coastline changes in Jiaozhou Bay area is human reclamation. The total land reclamation in the past 35 years has reached 41.45km2, among which Shibei District, Licang District, and Huangdao District are the three districts with the most drastic coastline changes and the most frequent land reclamation activities, with a total land reclamation area of 34.62km2. The coastline changes in each area are closely related to the policies of Qingdao City.
This paper realizes the extraction and classification of coastlines through multi-source remote sensing data, providing a reasonable method for analyzing spatio-temporal changes in coastlines using such data. Meanwhile, analyzing the spatio-temporal changes of the coastline in the Jiaozhou Bay area can provide a reference for local coastal zone development and protection. Its deficiency is the lack of analysis on the impact of tides on coastal changes in areas greatly affected by tides. In addition, due to issues such as remote sensing image resolution, only three types of coastlines have been classified; we can provide a more detailed classification of coastline types in future work.
Data availability statement
The original contributions presented in the study are included in the article/supplementary material. Further inquiries can be directed to the corresponding author.
Author contributions
YZ collected and analyzed the data and wrote the manuscript. ZW proposed the method, designed its structure, and revised the manuscript. ZL and ZZ helped in collecting and analyzing the data. LL and SY critically revised the manuscript. All authors contributed to the article and approved the submitted version.
Funding
This research is funded by the National Key Research and Development Program of China (Grant No.2022YFB3902605), and Basic Research Fund of Chinese Academy of Surveying and Mapping (Grant No.AR2203; AR2206), and the National Natural Science Foundation of China (No. 41876202).
Acknowledgments
We thank the European Space Agency (ESA) for providing the Sentinel-1 remote sensing data. We also thank the U.S. Geological Survey (USGS) for providing the Landsat remote sensing data.
Conflict of interest
The authors declare that the research was conducted in the absence of any commercial or financial relationships that could be construed as a potential conflict of interest.
Publisher’s note
All claims expressed in this article are solely those of the authors and do not necessarily represent those of their affiliated organizations, or those of the publisher, the editors and the reviewers. Any product that may be evaluated in this article, or claim that may be made by its manufacturer, is not guaranteed or endorsed by the publisher.
References
Ai B., Zhang R., Zhang H., Ma C., Gu F. (2019). Dynamic process and artificial mechanism of coastline change in the Pearl River Estuary. Regional Stud. Mar. Sci. 30, 100715. doi: 10.1016/j.rsma.2019.100715
Akbari E., Hamzeh S., Kakroodi A. A., Maanan M. (2022). Time series analysis of the Caspian Sea shoreline in response to sea level fluctuation using remotely sensed data. Regional Stud. Mar. Sci. 56, 102672. doi: 10.1016/j.rsma.2022.102672
Aladwani N. S. (2022). Shoreline change rate dynamics analysis and prediction of future positions using satellite imagery for the southern coast of Kuwait: A case study. Oceanologia 64, 417–432. doi: 10.1016/j.oceano.2022.02.002
Boak E., Turner I. (2005). Shoreline definition and detection: A review. J. Coast. Res. J. Coast. Res. 21, 688–703. doi: 10.2112/03-0071.1
Boussetta A., Niculescu S., Bengoufa S., Zagrarni M. F. (2022). Spatio-temporal analysis of shoreline changes and erosion risk assessment along Jerba island (Tunisia) based on remote-sensing data and geospatial tools. Regional Stud. Mar. Sci. 55, 102564. doi: 10.1016/j.rsma.2022.102564
Cai H., Li C., Luan X., Ai B, Yan L., Wen Z. (2022). Analysis of the spatiotemporal evolution of the coastline of Jiaozhou Bay and its driving factors. Ocean Coast. Manage. 226, 106246. doi: 10.1016/j.ocecoaman.2022.106246
Cerimele M., Cinque L., Cossu R., Galiffa R. (2009). Coastline detection from SAR images by level set model. Image Anal. Process. – ICIAP 2009 5716, 364–373. doi: 10.1007/978-3-642-04146-4_40
Chang D., Wang Z., Ning X., Li Z., Zhang L., Liu X. (2022). Vegetation changes in Yellow River Delta wetlands from 2018 to 2020 using PIE-Engine and short time series Sentinel-2 images. Front. Mar. Sci. 9. doi: 10.3389/fmars.2022.977050
Chataigner T., Yates M. L., Le Dantec N., Harley M. D., Splinter K. D., Goutal N. (2022). Sensitivity of a one-line longshore shoreline change model to the mean wave direction. Coast. Eng. 172, 104025. doi: 10.1016/j.coastaleng.2021.104025
Chen C., Bu J., Zhang Y., Zhuang Y., Chu Y., Hu J., et al. (2019). The application of the tasseled cap transformation and feature knowledge for the extraction of coastline information from remote sensing images. Adv. Space Res. 64, 1780–1791. doi: 10.1016/j.asr.2019.07.032
Chen C., Fu J., Zhang S., Zhao X. (2018). Coastline information extraction based on the tasseled cap transformation of Landsat-8 OLI images. Estuarine Coast. Shelf Sci 217, 281-291. doi: 10.1016/j.ecss.2018.10.021
Chen C., Liang J., Xie F., Hu Z., Sun W., Yang G., et al. (2022). Temporal and spatial variation of coastline using remote sensing images for Zhoushan archipelago, China. Int. J. Appl. Earth Observation Geoinformation 107, 102711. doi: 10.1016/j.jag.2022.102711
Chen D., Wang X., Nelson P., Li Y., Zhao N, Zhao Y., et al. (2017). Ship emission inventory and its impact on the PM2.5 air pollution in Qingdao Port, North China. Atmospheric Environ. 166, 351–361. doi: 10.1016/j.atmosenv.2017.07.021
Das S. K., Sajan B., Ojha C., Soren S. (2021). Shoreline change behavior study of Jambudwip island of Indian Sundarban using DSAS model. Egyptian J. Remote Sens. Space Sci. 24, 961-970. doi: 10.1016/j.ejrs.2021.09.004
Ferreira T., Aquino da Silva A., Perez Y., Stattegger K., Vital H. (2021). Evaluation of decadal shoreline changes along the Parnaíba Delta (NE Brazil) using satellite images and statistical methods. Ocean Coast. Management. 202, 105513. doi: 10.1016/j.ocecoaman.2020.105513
Hu X., Wang Y. (2022). Monitoring coastline variations in the Pearl River Estuary from 1978 to 2018 by integrating Canny edge detection and Otsu methods using long time series Landsat dataset. CATENA 209, 105840. doi: 10.1016/j.catena.2021.105840
Jia S., Xue D., Chengrao L. I., Zheng J., Wanqiu L. I. (2019). Study on new method for water area information extraction based on Sentinel-1 data. Yangtze River 50, 213–217. doi: 10.16232/j.cnki.1001-4179.2019.02.038
Kılar H. (2023). Shoreline change assessment using DSAS technique: A case study on the coast of Meriç Delta (NW Türkiye). Regional Stud. Mar. Sci. 57, 102737. doi: 10.1016/j.rsma.2022.102737
Le Cozannet G, Garcin M., Yates M., Idier D, Meyssignac B. (2014). Approaches to evaluate the recent impacts of sea-level rise on shoreline changes. Earth-Science Rev. 138, 47–60. doi: 10.1016/j.earscirev.2014.08.005
Lee J. S. (1981). Refined filtering of image noise using local statistics. Comput. Graphics Image Process. 15, 380–389. doi: 10.1016/S0146-664X(81)80018-4
Li W., Gong P. (2016). Continuous monitoring of coastline dynamics in western Florida with a 30-year time series of Landsat imagery. Remote Sens. Environ. 179, 196–209. doi: 10.1016/j.rse.2016.03.031
Li J., Ma R., Cao Z., Xue K., Xiong J., Hu M., et al. (2022). Satellite detection of surface water extent: A review of methodology. Water 14, 1148. doi: 10.3390/w14071148
Li Z., Wang Z., Liu X., Zhu Y., Wang K., Zhang T. (2022). Classification and Evolutionary Analysis of Yellow River Delta Wetlands (China) using Decision Tree based on Time Series SAR Backscattering Coefficient and Coherence. Front. Mar. Sci. 9. doi: 10.3389/fmars.2022.940342
Ma L., Liu Y, Zhang X., Ye Y., Yin G., Johnson B. A. (2019). Deep learning in remote sensing applications: A meta-analysis and review. ISPRS J. Photogrammetry Remote Sens. 152, 166–177. doi: 10.1016/j.isprsjprs.2019.04.015
McFEETERS S. K. (1996). The use of the Normalized Difference Water Index (NDWI) in the delineation of open water features. Int. J. Remote Sens. 17, 7, 1425–1432. doi: 10.1080/01431169608948714
Moussa R. M., Fogg L., Bertucci Frédéric, Calandra M., Collin A., Aubanel A., et al. (2019). Long-term coastline monitoring on a coral reef island (Moorea, French Polynesia). Ocean Coast. Manage. 180, 104928. doi: 10.1016/j.ocecoaman.2019.104928
Navnath N. N., Chandrasekaran K., Stateczny A., Sundaram V. M., Panneer P. (2022). Spatiotemporal assessment of satellite image time series for land cover classification using deep learning techniques: A case study of Reunion Island, France. Remote Sens. 14, 5232. doi: 10.3390/rs14205232
Otsu N. (1979). A threshold selection method from gray-level histograms. IEEE Trans. Systems Man Cybernetics 9, 62–66. doi: 10.1109/TSMC.1979.4310076
Ouma Y., Tateishi R. (2006). A water index for rapid mapping of shoreline changes of five East African Rift Valley lakes: an empirical analysis using Landsat TM and ETM+ data. Int. J. Remote Sens. 27, 3153–3181. doi: 10.1080/01431160500309934
Özpolat E., Demir T. (2019). The spatiotemporal shoreline dynamics of a delta under natural and anthropogenic conditions from 1950 to 2018: A dramatic case from the Eastern Mediterranean. Ocean Coast. Manage. 180, 104910. doi: 10.1016/j.ocecoaman.2019.104910
Pan X., Wang Z., Ullah H., Chen C., Wang X., Li X., et al. (2023). Evaluation of eutrophication in jiaozhou bay via water color parameters determination with UAV-borne hyperspectral imagery. Atmosphere 14, 387. doi: 10.3390/atmos14020387
Pardo-Pascual J. E., Almonacid-Caballer J., Ruiz L. A., Palomar-Vázquez J. (2012). Automatic extraction of shorelines from Landsat TM and ETM+ multi-temporal images with subpixel precision. Remote Sens. Environ. 123, 1–11. doi: 10.1016/j.rse.2012.02.024
Pouliot D., Alavi N., Wilson S., Duffe J., Pasher J., Davidson A., et al. (2021). Assessment of landsat based deep-learning membership analysis for development of from–to change time series in the prairie region of Canada from 1984 to 2018. Remote Sens. 13, 634. doi: 10.3390/rs13040634
Qiao G., Mi H., Wang W., Tong X., Li Z., Li T., et al. (2018). 55-year (1960–2015) spatiotemporal shoreline change analysis using historical DISP and Landsat time series data in Shanghai. Int. J. Appl. Earth Observation Geoinformation 68, 238–251. doi: 10.1016/j.jag.2018.02.00
Ronneberger O., Fischer P., Brox T. (2015). U-net: convolutional networks for biomedical image segmentation. Medical image computing and computer-assisted intervention. Int. Conf. Med. image computing computer-assisted intervention, 9351, 234–241. doi: 10.1007/978-3-319-24574-4_28
Sheng H., Guo M., Gan Y., Xu M., Liu S., Muhammad Y., et al. (2022). Coastline extraction based on multi-scale segmentation and multi-level inheritance classification. Front. Mar. Sci. 9. doi: 10.3389/fmars.2022.1031417
Siyal A. A., Solangi G. S., Siyal Z.-u., Siyal P., Babar M. M., Ansari K. (2022). Shoreline change assessment of Indus delta using GIS-DSAS and satellite data. Reg. Stud. Mar. Sci. 53, 102405. doi: 10.1016/j.rsma.2022.102405
Smith L. (1997). Satellite remote sensing of river inundation area, stage, and discharge: A review. Hydrological Processes 11, 1427–1439. doi: 10.1002/(SICI)1099-1085(199708)11:103.0.CO;2-S
Son S., Lee S.-H., Bae J., Ryu M., Lee D., Park S.-R., et al (2022). Land-cover-change detection with aerial orthoimagery using segNet-based semantic segmentationin Namyangju City, South Korea. Sustainability 14, 2321. doi: 10.3390/su141912321
Sunny D. S., Islam K. M. A., Mullick Md. R. A., Ellis J. T. (2022). Performance study of imageries from MODIS, Landsat 8 and Sentinel-2 on measuring shoreline change at a regional scale. Remote Sens. Applications: Soc. Environ. 28, 100816. doi: 10.1016/j.rsase.2022.100816
Teng J., Xia S., Liu Y, Yu X., Duan H., Xiao H., et al. (2021). Assessing habitat suitability for wintering geese by using Normalized Difference Water Index (NDWI) in a large floodplain wetland, China. Ecol. Indic. 122, 107260. doi: 10.1016/j.ecolind.2020.107260
Thior M., Sané T., Dièye E h. B., Sy O., Cissokho D., Ba B. D., et al (2019). Coastline dynamics of the northern Lower Casamance (Senegal) and southern Gambia littoral from 1968 to 2017. J. Afr. Earth Sci. 160, 103611. doi: 10.1016/j.jafrearsci.2019.103611
Thom B. (2020). Future challenges in beach management as contested spaces. SandyBeach Morphodynamics 29, 711–731. doi: 10.1016/B978-0-08-102927-5.00029-1
Toure S., Diop O., Kpalma K., Maiga A. S. (2019). Shoreline detection using optical remote sensing: A review. Int. J. Geo-Information. 8, 75. doi: 10.3390/ijgi8020075
Wang N, Li J.-M., Xu Z.-H. (2021). Public preference for the ecological restoration of coastal wetlands in Jiaozhou Bay in China based on a choice experiment. Mar. Policy 128, 104487. doi: 10.1016/j.marpol.2021.104487
Wang X., Yan F., Su F. (2021). Changes in coastline and coastal reclamation in the three most developed areas of China, 1980–2018. Ocean Coast. Manage. 204, 105542. doi: 10.1016/j.ocecoaman.2021.105542
Wiles E., Loureiro C., Cawthra H. (2022). Shoreline variability and coastal vulnerability: Mossel Bay, South Africa. Estuarine Coast. Shelf Sci. 268, 107789. doi: 10.1016/j.ecss.2022.107789
Yin J., Wu C., Shen P., Wan A., Tao Z., Wang Y. (2023). Annual variations of abundance, egg production rate, and community structure of Oithona similis in Jiaozhou Bay, the Yellow Sea. Front. Mar. Sci. 10. doi: 10.3389/fmars.2023.1119883
Zahra K. A. (2018). Assessment of implementation stages of submerged breakwater on the bay and shoreline at Al-Ahlam Sea Resort, Northwest Coast, Egypt. Ocean Coast. Manage. 165, 15–32. doi: 10.1016/j.ocecoaman.2018.08.009
Zhang Y., Li D., Fan C., Xu H, Hou X. (2021). Southeast Asia island coastline changes and driving forces from 1990 to 2015. Ocean Coast. Manage. 215, 105967. doi: 10.1016/j.ocecoaman.2021.105967
Zhang Y., Li K., Zhang G., Zhu Z., Wang P. (2023). DFA-UNet: efficient railroad image segmentation. Appl. Sci. 13, 662. doi: 10.3390/app13010662
Zhu Q., Li P., Li Z., Pu S., Wu X., Bi N., et al. (2021). Spatiotemporal changes of coastline over the Yellow River Delta in the previous 40 years with optical and SAR remote sensing. Remote Sensing.; 13 (10), 1940. doi: 10.3390/rs13101940
Keywords: coastline, optical and SAR remote sensing images, spatio-temporal change analysis, land reclamation, Jiaozhou Bay
Citation: Zhu Y, Li Z, Zhao Z, Lu L, Yang S and Wang Z (2023) Spatio-temporal changes of coastline in Jiaozhou Bay from 1987 to 2022 based on optical and SAR data. Front. Mar. Sci. 10:1233410. doi: 10.3389/fmars.2023.1233410
Received: 02 June 2023; Accepted: 04 July 2023;
Published: 24 July 2023.
Edited by:
Chao Chen, Suzhou University of Science and Technology, ChinaReviewed by:
Gang Yang, Ningbo University, ChinaNa Zeng, Zhejiang Agriculture and Forestry University, China
Copyright © 2023 Zhu, Li, Zhao, Lu, Yang and Wang. This is an open-access article distributed under the terms of the Creative Commons Attribution License (CC BY). The use, distribution or reproduction in other forums is permitted, provided the original author(s) and the copyright owner(s) are credited and that the original publication in this journal is cited, in accordance with accepted academic practice. No use, distribution or reproduction is permitted which does not comply with these terms.
*Correspondence: Zhiyong Wang, c2tkOTk0MTc3QHNkdXN0LmVkdS5jbg==