 Adam C. Stoer1*
 Yuichiro Takeshita2
 Tanya Lea Maurer2
 Charlotte Begouen Demeaux3
 Henry C. Bittig4
 Emmanuel Boss3
 Hervé Claustre5
 Giorgio Dall’Olmo6
 Christopher Gordon7
 Blair John William Greenan7
 Kenneth S. Johnson2
 Emanuele Organelli8
 Raphaëlle Sauzède9
 Catherine Marie Schmechtig10
 Katja Fennel1
- 1Department of Oceanography, Dalhousie University, Halifax, NS, Canada
- 2Monterey Bay Aquarium Research Institute, Moss Landing, CA, United States
- 3School of Marine Sciences, University of Maine, Orono, ME, United States
- 4Leibniz Institute for Baltic Sea Research Warnemunde, Rostock, Germany
- 5CNRS & Sorbonne Université, Laboratoire d’Océanographie de Villefranche, Villefranche-sur-Mer, France
- 6Istituto Nazionale di Oceanografia e di Geofisica Sperimentale, Trieste, Italy
- 7Bedford Institute of Oceanography, Fisheries and Oceans Canada, Dartmouth, NS, Canada
- 8National Research Council of Italy, Institute of Marine Sciences, Rome, Italy
- 9CNRS & Sorbonne Université, Institut de la Mer de Villefranche, Villefranche-sur-Mer, France
- 10OSU Ecce Terra, CNRS & Sorbonne Université, Paris, France
Biogeochemical- (BGC-) Argo aims to deploy and maintain a global array of autonomous profiling floats to monitor ocean biogeochemistry. With over 250,000 profiles collected so far, the BGC-Argo network is rapidly expanding toward the target of a sustained fleet of 1,000 floats. These floats prioritize the measurement of six key properties: oxygen, nitrate, pH, chlorophyll-a, suspended particles, and downwelling light. To assess the current biogeochemical state of the ocean, its variability, and trends with confidence, it is crucial to quality control these measurements. Accordingly, BGC-Argo maintains a quality control system using manual inspection and parameter-specific algorithms for flagging and adjusting data. In this study, we provide a census of the quantity and quality of measurements from BGC-Argo based on their quality flagging system. The purpose of this census is to assess the current status of the array in terms of data quality, how data quality has changed over time, and to provide a better understanding of the quality-controlled data to current and future users. Alongside increasing profile numbers and spatial coverage, we report that for most parameters between 80 and 95% of the profiles collected so far contain high-quality BGC data, with an exception for pH. The quality of pH profiles has seen a large improvement in the last five years and is on track to match the data quality of other BGC parameters. We highlight how BGC-Argo is improving and discuss strategies to increase the quality and quantity of BGC profiles available to users. This census shows that tracking percentages of high-quality data through time is useful for monitoring float sensor technology and helpful for ensuring the long-term success of BGC-Argo.
1 Introduction
Biogeochemical- (BGC-) Argo is a component of OneArgo (Owens et al., 2022), a planned major expansion of the Argo program, which revolutionized the collection, management, and free access of in situ oceanographic data on a global scale for the operational, climate assessment, and research communities (Claustre et al., 2020; Johnson et al., 2022). BGC-Argo supports a network of autonomous floats with the goal of monitoring the biogeochemistry of the global ocean (Roemmich et al., 2019). The majority of these floats profile the upper 2 km of the ocean every 10 days. Six BGC properties have been chosen to help constrain the ocean’s distribution of oxygen and carbon (Biogeochemical-Argo Planning Group, 2016): oxygen (O2), nitrate (NO3-), pH, fluorescence from chlorophyll-a (Chla), particle optical backscatter (bbp, a proxy for particulate organic carbon), and downwelling light as photosynthetically available radiation (PAR) and irradiance (Ed).
BGC-Argo aims to deploy 250 floats equipped to measure these properties each year to sustain a global network of 1,000 operational floats and deliver science-quality profiles within ~24 hours of collection. This real-time oceanographic monitoring system requires parameter-specific, quality control (QC) procedures. A guide to BGC-Argo by Bittig et al. (2019) describes, among other aspects, the data structure and QC procedures. More detailed procedures are found in QC manuals provided by BGC-Argo that are referenced throughout this document (http://www.argodatamgt.org/Documentation; https://biogeochemical-argo.org/data-management.php).
Briefly, profile data received from each BGC-Argo float cycle is formatted into two types of files: a core file that includes temperature and salinity measurements from the CTD (Conductivity-Temperature-Depth) sensor, and a b-file that includes measurements from all BGC sensors available. These two files are combined into a synthetic-profile file, which aligns or interpolates each measurement along a synthetic pressure axis. This process accounts for any misalignment of the CTD and BGC measurements during onboard processing, and thus greatly enhances the usability of the data while maintaining the character of the original sample design (Bittig et al., 2022). All synthetic-profile files from each float are merged into a single “Sprof” file, which contains the CTD and BGC data and associated quality control information.
The BGC-Argo quality control procedures are structured under two main levels (Argo Data Management Team, 2022). The first level is real-time QC (RTQC) involving a set of automatic tests on each profile, with the goal of screening grossly bad data from the system (i.e., global range and spike tests). The second level is referred to as delayed-mode QC (DMQC), which aims at delivering high-quality data for research purposes, such as long-term studies testing for climate-driven changes in ocean biogeochemistry. DMQC involves a more detailed set of procedures that are performed by an expert to account for shifts in sensor calibration that can occur during storage and post-deployment. For O2, NO3-, and pH, these adjustments are an essential part of the QC process, as they provide significant improvements to the accuracy of the raw data. Users are always advised to use ‘<PARAM>_ADJUSTED’ data fields, such as ‘DOXY_ADJUSTED’ for adjusted O2 measurements, as described in Johnson et al. (2023); Johnson et al. (2021); Bittig et al. (2019), and Thierry et al. (2021). The DMQC procedures generally involve re-calibrating the sensor to high-quality reference fields or climatologies (Takeshita et al., 2013; Bittig and Körtzinger, 2015; Johnson et al., 2015; Maurer et al., 2021). These new calibrations are then propagated forward to provide higher-quality real-time data (called real-time adjusted data).
The DMQC procedures for the bio-optical parameters are currently still under development, although various methods have been explored (Organelli et al., 2016; Organelli et al., 2017; Cornec et al., 2021; Jutard et al., 2021; Begouen Demeaux and Boss, 2022; O’Brien and Boss, 2022). However, all bio-optical parameters receive some level of real-time QC at this stage (Schmechtig et al., 2016; Schmechtig et al., 2018; Poteau et al., 2019; Schmechtig et al., 2019). The Chla parameter also receives an adjustment in real time, which includes a correction for non-photochemical quenching (NPQ), dark values, and an improved calibration factor (Roesler et al., 2017).
In this study, we report a census of select BGC measurements, and their associated data quality based on the Argo QC flagging system. We limit the main analysis to profiles of the O2, NO3-, pH, Chla, bbp, PAR, and Ed. When describing both adjusted and unadjusted measurements, we simply refer to the variable name (e.g., “Chla”); otherwise, we specify when adjusted or unadjusted data is used (e.g., “adjusted O2”). For O2, NO3-, pH, and Chla, we refer to the adjusted data when reporting quality metrics, as the unadjusted data is intentionally treated as bad for scientific analysis (e.g., due to storage drift for the O2, NO3-, and pH sensors, or NPQ for Chla). Comparatively, for bbp, PAR, and Ed, data are generally usable for scientific analysis without requiring further adjustments. For this analysis, we also only consider floats that simultaneously collect Ed at 380, 412, and 490 nm and PAR, which is the most common configuration in the BGC-Argo array. For brevity, we refer to simultaneous measurements of PAR and Ed as PAR/Ed.
This paper describes the current breakdown of BGC profile quality in terms of data quality flags, what’s been collected so far, annual trends in data quality, and how close BGC-Argo is to reaching its targets. We compare data quality before 2017 with that in the last six years to identify improvements in data quality. The area density of quality BGC profiles is also assessed regionally and in relation to the target density of a 1,000-float network. Finally, we also discuss potential strategies for increasing the number of high-quality profiles in the future.
2 Materials and methods
For each profile and BGC parameter used in this study, we recorded the WMO number of the float, date and location, cycle number, profile- and depth-level quality flags, and the presence of sensor data using Sprof files downloaded from March 16−17, 2023 (Argo, 2000). We also recorded information about each sensor’s manufacturer and model from the metadata file associated with each float (Argo Data Management Team, 2022). Data from 2023 was not included in this analysis. With the QC flags BGC-Argo provides, we applied two simplified flagging systems we created (described below). We only used ascending profiles (~96% of the database) because QC flags and BGC data were not consistently available from descending profiles. For the rare occasion where a single float had multiple sensors measuring the same BGC property (e.g., 24 floats had more than one O2 sensor), we used the sensor designated as the primary parameter (see pg. 84 in Argo Data Management Team, 2022).
2.1 Description of BGC-Argo quality flag system
First, we provide a description of BGC-Argo’s QC flag system which is based on the pre-existing flagging scheme used operationally within the Argo data management system. The QC flag system sets depth-level and profile-level quality flags for each BGC property (Table 1; Argo Data Management Team, 2022). The depth-level flag system in Argo denotes the QC flags as “<PARAM>_QC” or “<PARAM_ADJUSTED>_QC” for unadjusted or adjusted measurements, respectively. These QC flags will flag “good” data as “1”, “probably good” data as “2”, “probably bad” data as “3”, and “bad” data as “4” (Table 1). Data are labeled with a flag of “5” when they are changed (e.g., the correction for NPQ of chlorophyll-a fluorescence). If values are interpolated or extrapolated, a label of “8” is used. If no QC is performed, a flag of “0” is used, while missing data are flagged as “9”. Generally, data with flags “1”, “2”, “5”, and “8” are treated as high-quality data, while data with flags “3” or “4” are treated as low-quality data.
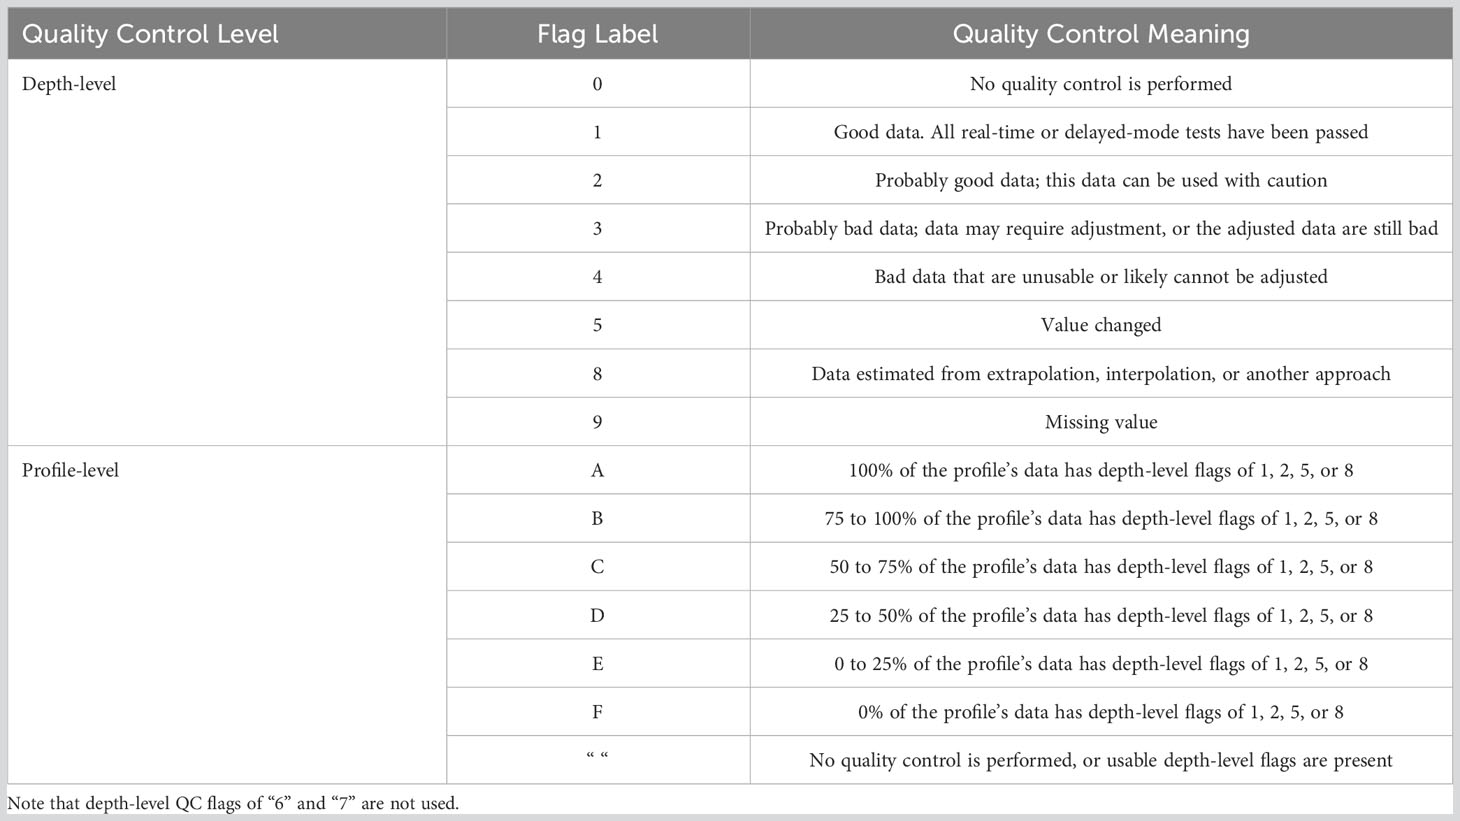
Table 1 Quality control system used by BGC-Argo (Argo Data Management Team, 2022).
Profile-level quality flags, denoted as “PROFILE_<PARAM>_QC” in Argo, describe the percentage of high-quality data points out of all the available data points in a profile (N). For the calculation of N, the QC flags associated with the adjusted data (from either adjusted RTQC or DMQC) are used. If there are no adjusted data available, the QC flags associated with the unadjusted data are used in the calculation instead (from unadjusted RTQC processing). Depth-level data points with flags “0” or “9” are not used in the determination of the profile-level flag. The calculation for profile-level quality flags is as follows:
where n is the number of QC flags in the profile with the subscript indicating the value of the depth-level QC flag. Then, N is categorized as one of seven different flags: flag “A” means when 100% of the profile has high-quality data, flag “B” when 75 to 100% of the profile has high-quality data, and so on in 25% increments to flag “F” which means that 0% of the profile data are high quality (Table 1). If no QC is performed or the only depth-level quality flags are “0” and “9”, then no profile-level flag is given, and an empty value is assigned.
2.2 Measurement-quality metrics
For this analysis, we created two simplified systems of flags based on BGC-Argo’s quality flag scales described in the previous section. Our first flag classification system is important for those interested in scientific analysis as it focuses on the availability of high-quality data profiles.
The second flag system we created describes the prevalence of functioning sensors, as opposed to those that have malfunctioned (e.g., the sensor stops reporting data or reports oceanographically inconsistent values entirely). Data profiles from malfunctioning sensors cannot be recovered for biogeochemical analysis and may be meaningless. The purpose of the second flag classification system is to identify causes of poor-quality data that result from an unfixable sensor malfunction, and not from intermittent error or other operational limitations. This flag scale is likely of interest to those who are currently deploying floats and those who plan to. Both flag scales provide a foundation for tracking BGC-Argo data quality and sensor performance through repeated future analyses.
2.2.1 Profile quality flag system
The first system of flags defines high-quality profiles as profiles where N is greater than or equal to 75% (so profile flags “A” and “B” as defined in Table 1). Low-quality profiles were defined as profiles where N is less than 75% (or having profile-level flags of “C”, “D”, “E”, or “F”).
We needed to identify the cause of missing QC flags in a profile, which can result from either the QC algorithm simply not being applied, or from the sensor no longer reporting data due to malfunction. To distinguish between the two possible causes, we checked for the presence of BGC data in the profile. If BGC data were missing, the profile was categorized as having an unresponsive sensor. If BGC data was present, the profile was labelled as having missing QC flags.
Based on these definitions, we calculated the percentage of high-quality profiles (PHQ) by parameter, year, region, or for each float as:
where SHQ is the number of high-quality profiles, SLQ is the number of low-quality profiles, and SNR is the number of profiles where the sensor was no longer reporting data. We repeat a similar calculation but for the percentage of low-quality profiles (PLQ) and profiles with unresponsive sensors (PNR). Note that the number of profiles without QC (SNOQC) is not included in the calculation.
2.2.2 Functioning-sensor flag system
The second QC flag scheme created for this analysis classifies sensors as either functioning or malfunctioning. We use this scheme to describe the prevalence of functioning/malfunctioning sensors for each BGC parameter and sensor manufacturer/model.
We defined “malfunctioning sensors” as sensors that produced profiles where all data points in the profile had a depth-level flag of “4” or when the sensor reported no data in the profile. When data are labeled with a depth-level flag of “4”, BGC data are outside the expected range, contain spikes, have unexpected gradients, or the measurements remain ‘stuck’ at the same value. Otherwise, if the sensor profile did not follow these conditions, the sensor was labeled as functional.
For this calculation, QC flags were produced from the combination of unadjusted or adjusted data for all BGC parameters. Profiles without QC flags and deemed as SNOQC (as previously described) were ignored. We calculated the percentage of functioning profiles as PFUNC as:
where SFUNC is the number of profiles with functioning sensors and SFAIL is the number of profiles with malfunctioning sensors.
2.2.3 Float survival rate
The survival rate of floats and their sensors are an important aspect of maintaining the BGC-Argo network. Depending on various factors (e.g., power consumption, environmental conditions, manufacturing quality), some floats will collect only a few profiles before failing, while others will last several years. For similar reasons, sensors may stop functioning before the float does. The survival rates of floats (RFloat) can be quantified as the number of floats operating at a pre-defined cycle number divided by the number of floats originally deployed. As cycle numbers increase, the portion of floats remaining declines until no floats are active. Similarly, the portion of remaining floats that produce high-quality profiles at a pre-defined cycle number represents a combination of float and sensor performance and is termed the high-quality survival rate or RHQ. The difference between RFloat and RHQ is therefore representative of sensor performance alone. The same concept can be applied to the float profiles we label as ‘functioning’ (termed the functioning survival rate or RFUNC).
We are interested in estimating RFloat, RHQ, and RFUNC at 36.5 cycles (equivalent to one year of profiling at a 10-d profiling frequency). To determine RFloat, we first calculated the fraction of floats remaining at cycle numbers between one and thirty and then applied a linear regression to extrapolate the survival rate to 36.5 cycles. A similar calculation was performed for RHQ and RFUNC but only floats with high-quality profiles and with functioning sensors were counted, respectively. At a 10-d sampling interval, floats deployed after March 7, 2022, would not have been deployed for long enough to make 30 cycles, and are therefore not used in this calculation. Note that for these survival rate estimates, we relied on cycle numbers instead of profile numbers because 1) up- and down-cast profiles (if both were taken) are given the same cycle number, and 2) we only consider ascending profiles in this analysis.
2.3 Regional data density and coverage
The density and spatial coverage of BGC data are important for determining where regional biogeochemistry may need to be better constrained. We assessed these metrics in different marine regions (Flanders Marine Institute, 2021) which include the North Atlantic, South Atlantic, North Pacific, South Pacific, Indian Ocean, Southern Ocean, Arctic Ocean, Baltic Sea, Black Sea, and Mediterranean Sea. Floats in the Black, Mediterranean, and Baltic seas were also reviewed both individually and as a single region we call ‘seas around Europe’.
We determined the density of high-quality profiles (equal to SHQ divided by surface area) from both the total number of profiles available and on a yearly basis. The surface area of ocean was calculated for each marine region and from a global ocean grid resolved to 5° longitude by 5° latitude. For all regions, except for the seas around Europe, areas where the seabed was shallower than 200 m was excluded. We report the average number of high-quality profiles from PAR/Ed profiles since this BGC data comes from the same sensor and have similar numbers of high-quality profiles.
For the annual assessments, we compared the density of high-quality profiles with a target profile density of a BGC-Argo network of 1,000 active floats (assuming they are evenly-spaced). This comparison was made by calculating 1) the region-wide density as a percentage of target density, and 2) the percent area of grid cells where high-quality profile density met the target density in each region. A similar calculation was also made for the latter but by including areas with profile densities above 0. The target density is equal to ~1.1 profile per 10,000 km2 per year (i.e., ~1 profile per 100 km x 100 km square of ocean per year) and is based on a network of 1,000 floats (presumably profiling every 10 days) over ~335 million km2 of ocean each year.
3 Results
3.1 Overall BGC-Argo profile quantity
As of December 2022, the database of Sprof files has accumulated a total of 263,715 unique BGC profiles from 1,811 BGC-Argo floats (Table S1). The most frequently measured property is O2 (251,855 raw profiles from 1,754 floats) while the least frequently measured property is pH (39,483 raw profiles from 447 floats) after PAR/Ed (46,028 raw profiles from 273 floats). Since 2002, the total number of floats deployed has steadily increased, alongside the total number of floats sustained in the array (Figure 1).
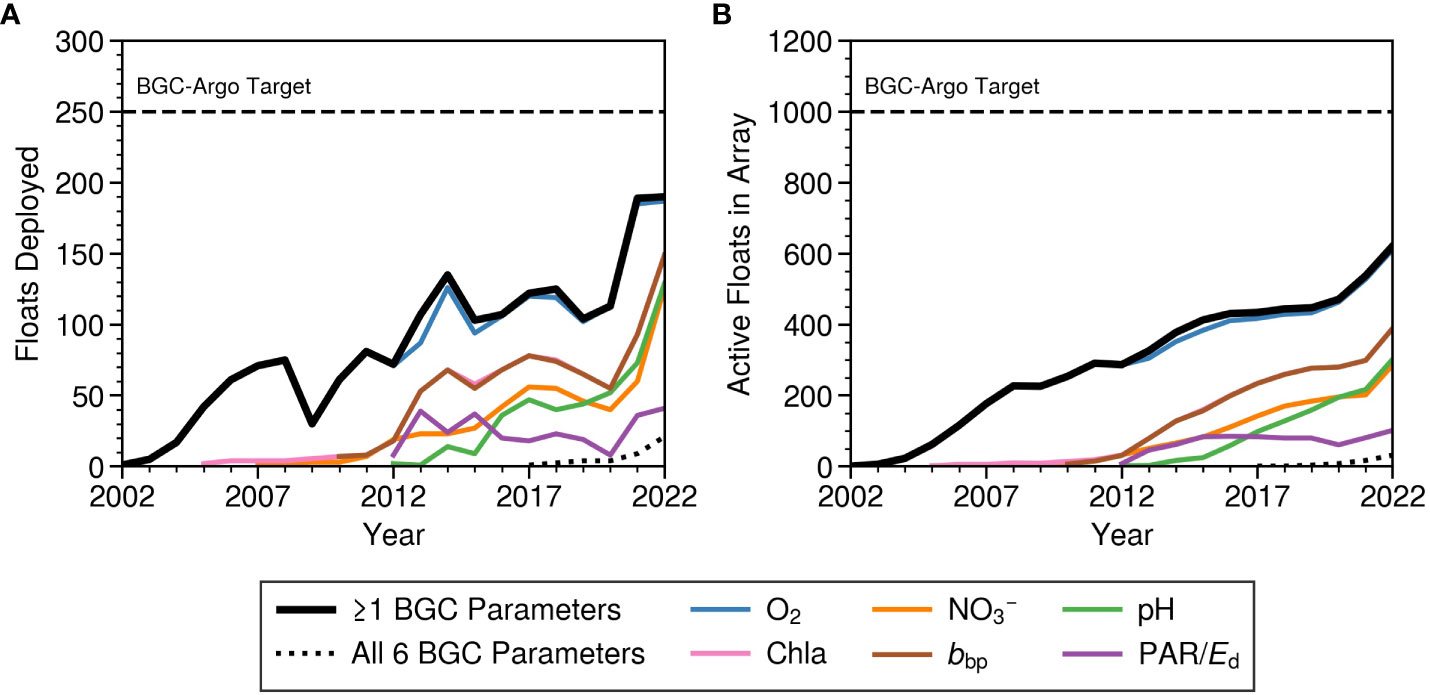
Figure 1 The number of floats deployed (A) and the size of the float array (B) by year since 2002. The solid black line represents floats with at least one BGC parameter, the dotted black line represents floats with all six BGC parameters (O2, NO3-, pH, Chla, bbp, and PAR/Ed), and the remaining colored lines represent floats with a specific BGC parameter. The BGC-Argo targets for annually deployed floats and the size of float array are shown in panels (A, B), respectively, as the horizontal dashed lines.
How close the float array is to the annual float or profile targets is highly dependent on the BGC parameter because most floats do not measure the full suite of BGC parameters. For example, the number of radiometer-equipped floats deployed each year has not surpassed 50, while the other five BGC parameters see a minimum of 100 floats deployed per year as of 2022. These discrepancies result from pilot programs that prioritized certain parameters. Radiometry has largely been driven by European and Australian projects, which focused on regions around Europe, the North Atlantic, and the Indian sector of the Southern Ocean. Currently, only 39 floats measure all 6 BGC parameters of interest (Figure 1). As of 2022, PROVOR, one of the three main models of floats used in the BGC-Argo fleet, is the only float type that can measure all six variables, restricting the full set of parameters from being collected. However, many operational float programs are currently putting effort toward expanding sensor suite capabilities on various platforms. For example, the Global Ocean Biogeochemistry (GO-BGC) array plans to begin deploying six-parameter APEX floats in the summer of 2023. A 6-parameter Navis float is currently in the later stages of development as well.
3.2 Overall BGC-Argo profile quality
The majority of profiles for each BGC parameter have received QC flags. Almost all O2 profiles have undergone QC (PNOQC =<1%). The parameters missing the most QC flags are Chla (PNOQC = 12%) and bbp (PNOQC = 15%). This lack of QC on some parameters will decline as the program matures. The mode of QC received by each property also varies greatly (Figure 2). At least three-quarters of O2, NO3-, pH, and Chla profiles have received adjusted or delayed-mode processing. In comparison, >40% of bbp and PAR/Ed data contain unadjusted real-time processing (also see Figure S1). Note that the RTQC for PAR/Ed only involves a range test and that there is no procedure for real-time adjustments; if adjustments are made to the radiometry data, then only DMQC has been applied.
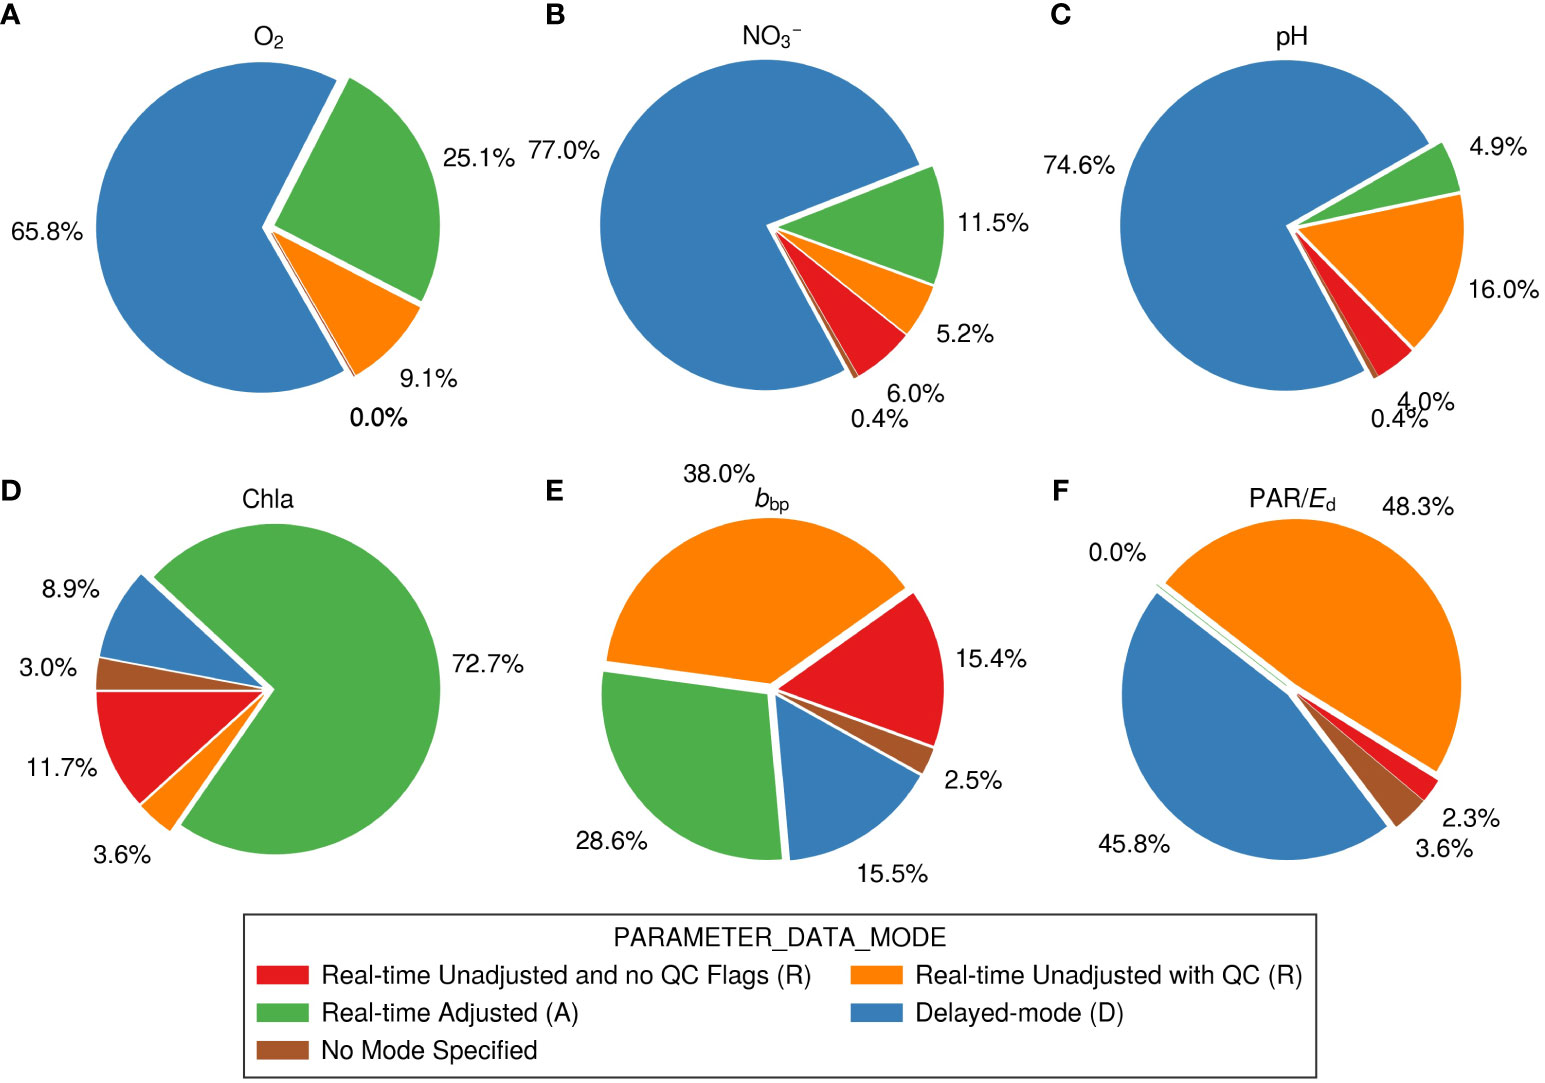
Figure 2 Percentage of profiles based on the type of quality-control mode, denoted in the PARAMETER_DATA_MODE field, for each BGC property: (A) O2, (B) NO3-, (C) pH, (D) Chla, (E) bbp, and (F) PAR/Ed. The associated label from Argo notation for each data mode is shown in brackets in the legend. Note that some data with real-time unadjusted processing do not always have QC flags (also see Supplementary Note). Representations for specific downwelling light channels are the same as (F) and are reported in Figure S1.
Due to their specialized QC procedures, which limit the quality flag of “1” to data that has been adjusted, we report only the QC metrics derived from adjusted data of O2, NO3-, pH, and Chla for the rest of this document, specifically referring to these variables as ‘adjusted’. Otherwise, the QC metrics for the other parameters (bbp and PAR/Ed) include both adjusted and unadjusted data, unless specifically stated.
Based on our first classification system, the number of high-quality profiles has generally increased each year, except for profiles of PAR/Ed (Figure 3). This lack of PAR/Ed profiles is due to no sustained rise in the deployments of floats equipped with these sensors (Figure 1). We find that the database-wide PHQ was the highest for PAR/Ed (92%, on average) and the lowest for adjusted pH (48%) (Table S2). Adjusted O2 and NO3- profiles have a PHQ equal to ~90% and 87%, respectively, while profiles of bbp and adjusted Chla have PHQ equal to 87% and 85%, respectively. For the ~21,000 adjusted PAR/Ed profiles that have received DMQC, PHQ increases to ~97% (or 96.7% for PAR; 97.3% for Ed[380], Ed[412], and Ed[490]).
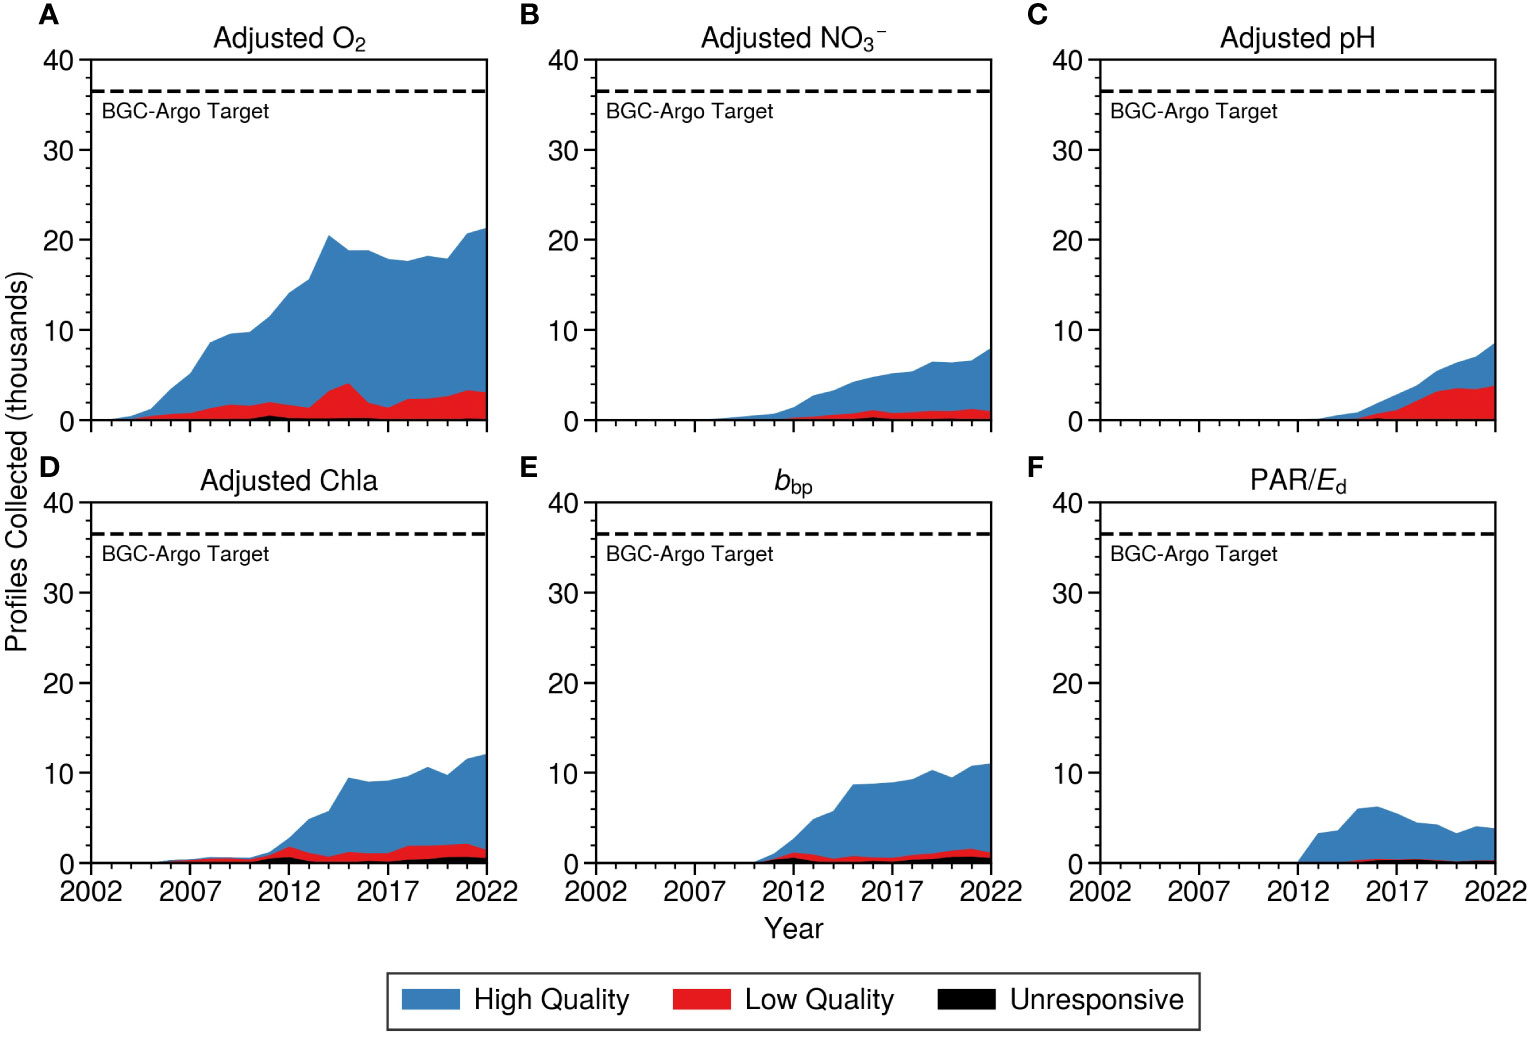
Figure 3 Profiles with QC collected each year for each BGC property: (A) adjusted O2, (B) adjusted NO3-, (C) adjusted pH, (D) adjusted Chla, (E) bbp, and (F) PAR/Ed. Both unadjusted and adjusted data profiles are shown in (E, F). Profiles are colored by their quality-control flags. The BGC-Argo target for the number of profiles collected each year is shown in each panel as a horizontal dashed line. PAR and Ed are collected by the same sensor and undergo similar quality control, so, for simplicity, the average number of profiles per quality type are shown in (F) instead; the exact number of high/low-quality profiles between PAR and Ed profiles vary slightly (Table S2).
Low-quality data profiles were the least common with PAR/Ed (PLQ = 2.5% for PAR; 1.8% for Ed[380]; 1.8% for Ed[412]; and 1.9% for Ed[490]). Low-quality adjusted pH profiles are currently the most common (PLQ = ~52%) among the BGC parameters. Other BGC sensors tend to report low-quality profiles 7−15% of the time. Profiles with no data (i.e., unresponsive sensors) are the most common among PAR/Ed and bbp (PNR = ~6% for each), while they are the least common among the adjusted O2, NO3-, pH, and Chla profiles (PNR< 1.5%; Table S2).
Using our secondary classification system, profiles with functioning sensors were the least common among pH profiles (PFUNC = 60%; Table S2). This suggests that sensor malfunction is the cause of most low-quality pH profiles, rather than correctable calibration drift errors. Functioning sensors were present in a higher portion of profiles for O2 (91%), NO3- (91%), Chla (94%), bbp (88%), and PAR/Ed (PFUNC= 93% for PAR, Ed[380], Ed[412], and Ed[490]).
3.3 Annual trends in profile quality and functionality
We first analyzed annual PHQ by the year a profile was collected to summarize temporal trends in the BGC data quality available to users (Figure 4). Secondly, we estimated the survival rates after one year (RFloat, RHQ, and RFUNC) by year the float was deployed (Figures 5, S2). The trends in RFloat, RHQ, and RFUNC by deployment year are useful for characterizing similar batches of floats/sensors (Figure 5; Table S3). With both data quality and survival rates, we compared pre-2017 values with the period of 2017 to 2022 to determine changes in the past six years with respect to the early stages of the program.
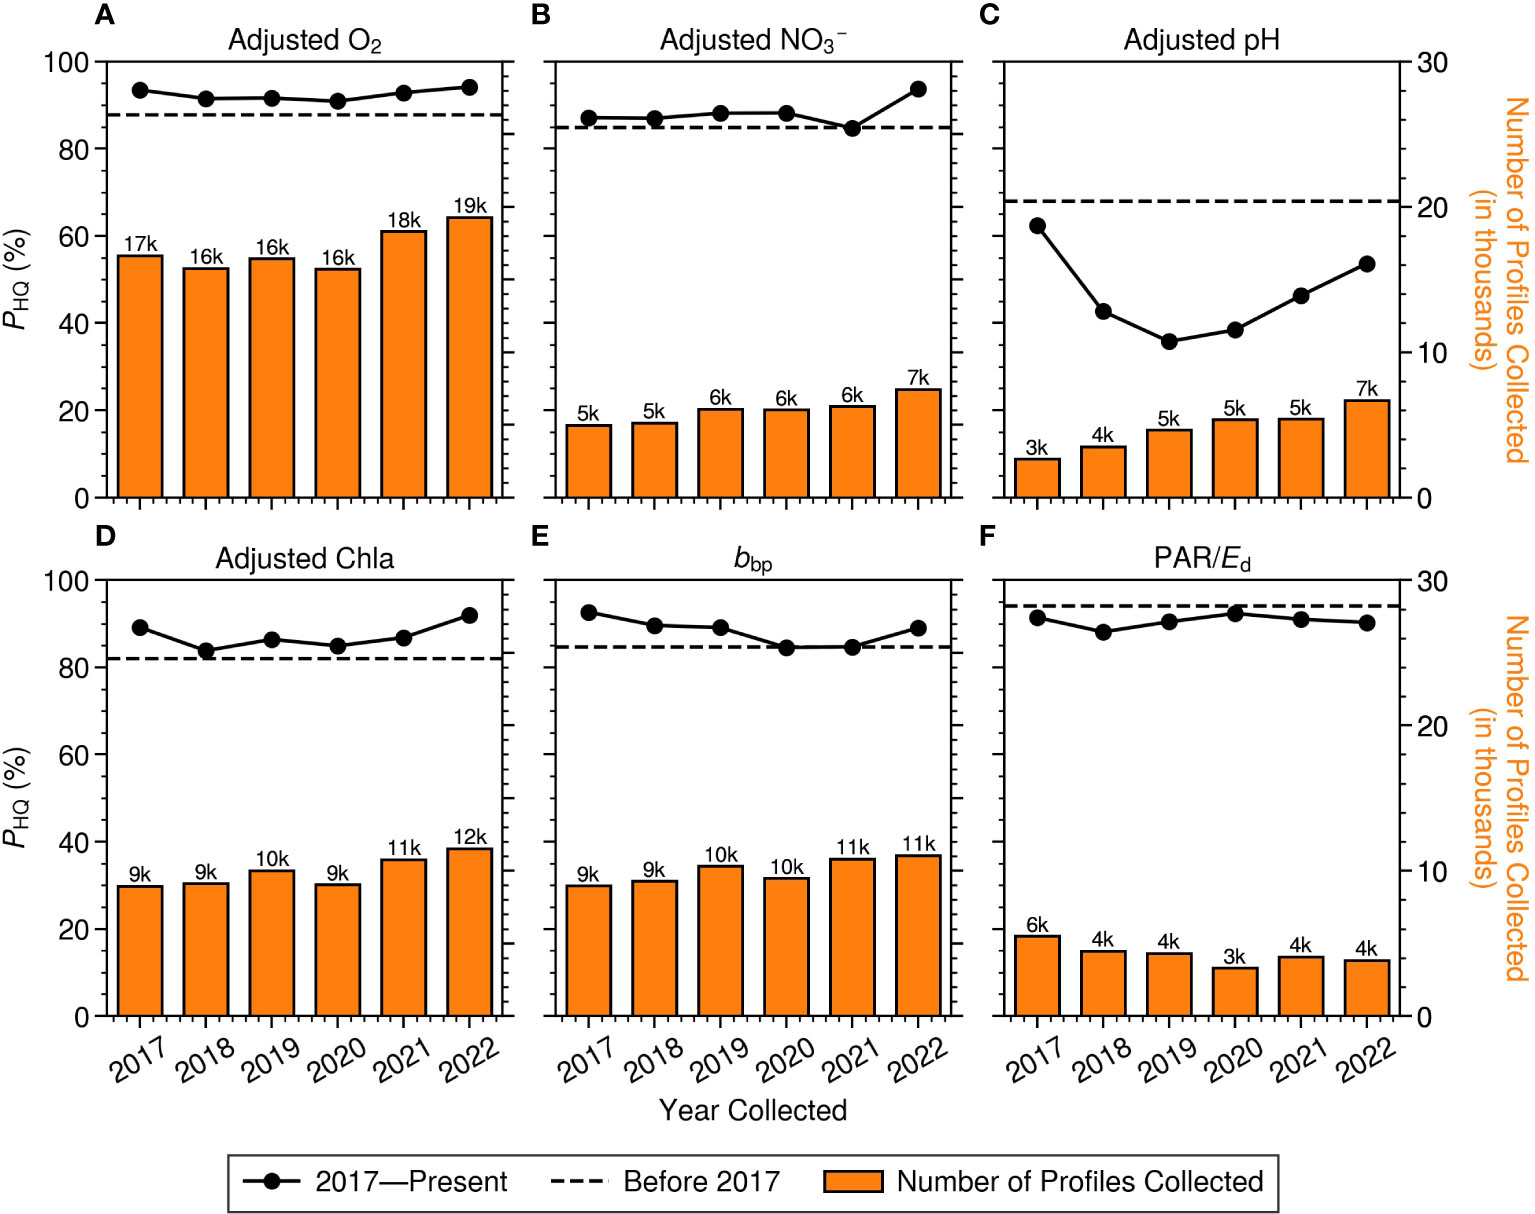
Figure 4 Percentage of high-quality profiles (PHQ) for each year collected: (A) adjusted O2, (B) adjusted NO3-, (C) adjusted pH, (D) adjusted Chla, (E) bbp, and (F) PAR/Ed. The solid lines represent the annual PHQ from 2017 to 2022. The number of profiles available each year is reported as the orange bar plot in each subplot, where the total number of profiles is indicated on the top of each bar. The dashed lines in each subplot represent PHQ before 2017. The number of unique profiles collected before 2017 for ~127k for adjusted O2; ~17k for NO3-; ~3.3k for pH; ~32k for Chla; ~32k for bbp; and ~19k for PAR/Ed. DMQC for bbp and PAR/Ed has been developed but is not yet fully implemented; a mix of adjusted and unadjusted data are shown for bbp and PAR/Ed here.
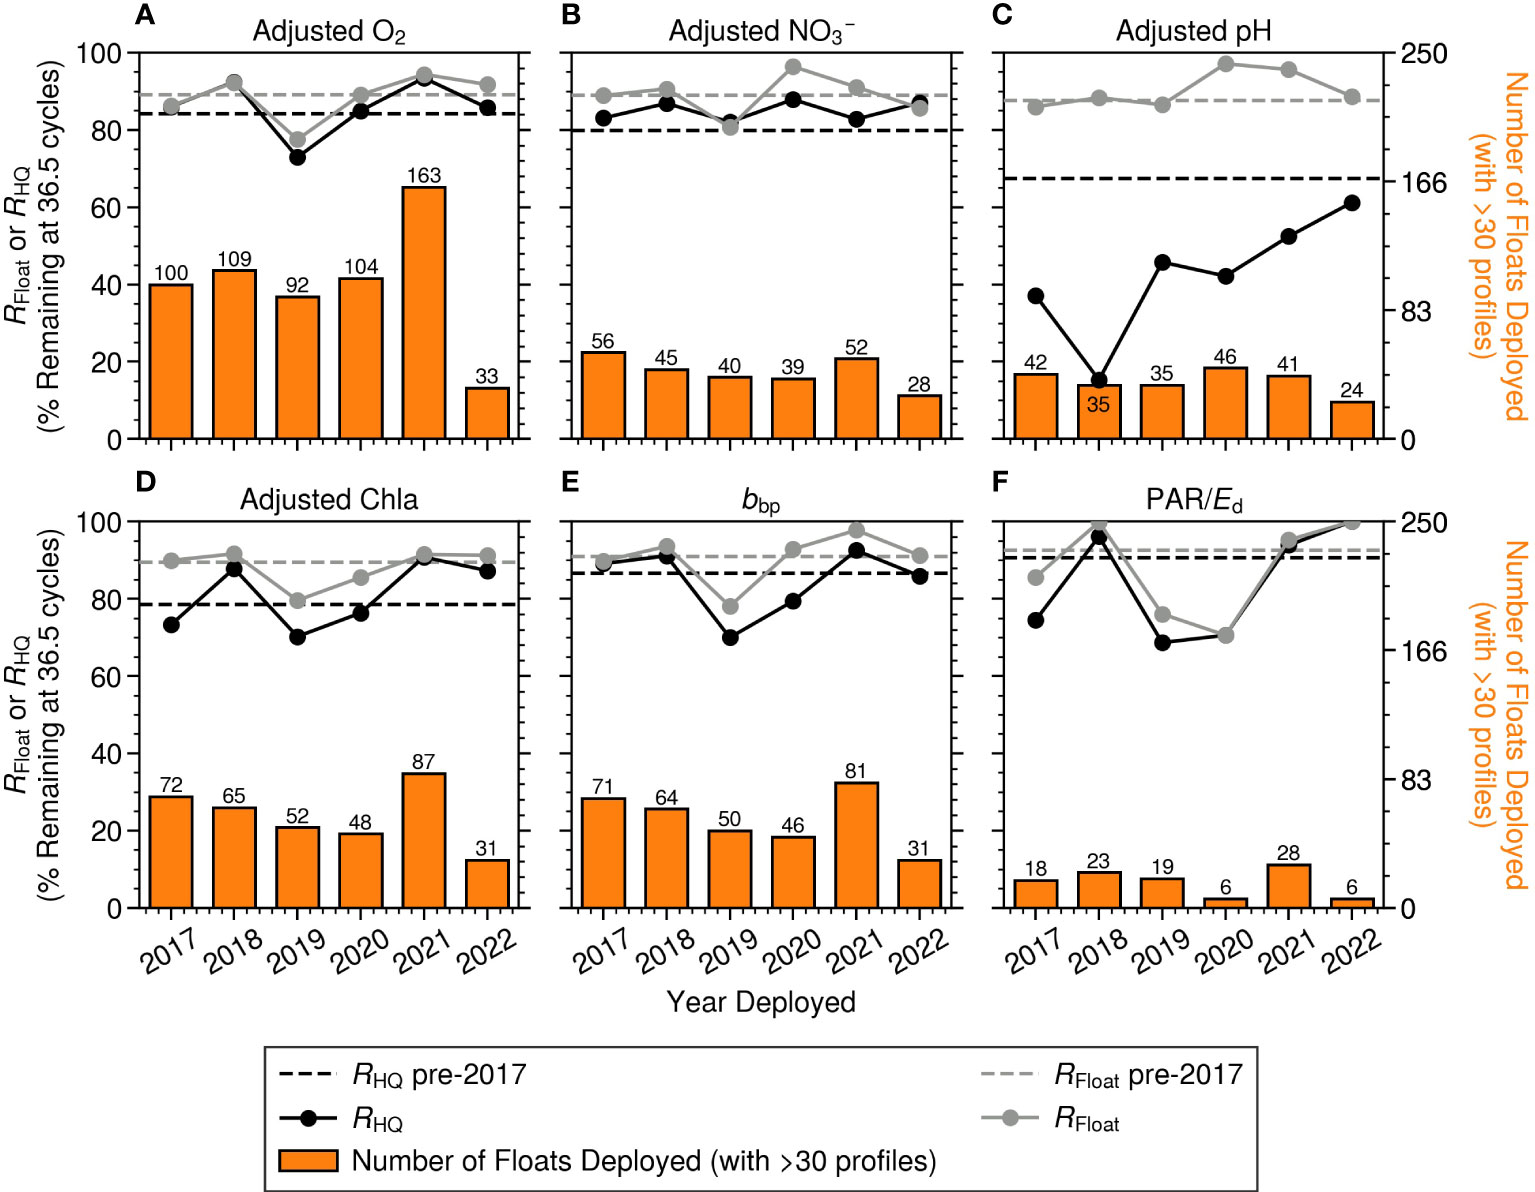
Figure 5 Survival rates of floats (RFloat) and high-quality profiles (RHQ) by deployment year. Each of the six key BGC variables: (A) adjusted O2, (B) adjusted NO3-, (C) adjusted pH, (D) adjusted Chla, (E) bbp, and (F) PAR/Ed. The solid line represents RFloat (grey) and RHQ (black) by year from 2017 to 2022. The horizontal dashed line in each subplot represents RFloat (grey) and RHQ (black) before 2017. The number of floats with quality-controlled data (and adjusted data when relevant) deployed each year are reported as the bar plot at bottom of each subplot and on the top of each bar. The number of floats deployed before 2017 are 817 for O2; 144 for NO3-; 60 for pH; 249 for Chla; 238 for bbp; and 128 for PAR/Ed. Note that only floats deployed for more than 300 days before January 1, 2023, were used to standardize float lifetimes for the survival rate calculation (see Methods).
We find that annual PHQ in the past six years was >80% for most BGC parameters, except for adjusted pH, which was between 40 and 60% and below pre-2017 levels (Figure 4). PAR/Ed profiles have an annual PHQ that is always >85%, even though PHQ in the past six years is below pre-2017 levels. For the remaining parameters, the PHQ values between 2017 and 2022 are generally close to or above pre-2017 levels.
Regarding survival rates, we find that the annual RFloat and RHQ can appreciably vary from year-to-year (Figure 5). Generally, RFloat is ~90% at 36.5 cycles, meaning that about 9-in-10 floats survive their first year. RHQ tends to vary more and is more parameter dependent. RHQ should always be equal to or less than RFloat because it is not possible for the sensor to record data if the float fails (the reverse is possible). The results show that RHQ is typically <10% below RFloat. In some cases, RFloat is more than RHQ, which we suspect results from sensors that temporarily become unresponsive or report bad data, before reporting good data in a successive profile, and the non-linear nature of float/sensor survival over time. Furthermore, RFUNC follows the same patterns as RHQ (Figure S2). This suggests that the cause of most low-quality profiles is not intermittent error or other operational limitations but rather sensor/cable damage, degradation, and/or bio-fouling.
RFloat for floats with pH sensors is similar to the RFloat of floats measuring other parameters. However, RHQ derived from adjusted pH profiles had a distinct drop in 2017 and 2018 that was not associated with a decline in RFloat. This gap between RFloat and RHQ for floats with pH sensors led to the accumulation of low-quality, adjusted pH profiles seen one-to-two years later in 2018 and 2019. Since then, the RHQ has improved, resulting in an increase in PHQ of adjusted pH profiles in the following years (Figure 4). This recovery in PHQ and RHQ, especially in 2022, puts pH on track to have similar data quality as the other five BGC properties.
A similar case may have occurred with bbp from floats deployed in 2019. The RHQ of bbp was ~10% lower than the RFloat in 2019 and 2020 (Figure 5) and was followed by a decline in the PHQ of bbp profiles in 2020 and 2021 (Figure 4). This difference suggests that bbp sensors failed before the floats did, which led to a disproportionate collection of low-quality profiles. However, a similar pattern in RHQ was observed in adjusted Chla (Figure 5), without a similar decline in PHQ in 2020 or 2021 (Figure 5). The decline in annual PHQ of bbp appears to have been corrected since 2022.
RFloat is generally close to the RHQ for most parameters in most years. The similarity between the two rates explains why there is little variability in the PHQ of adjusted O2 profiles in the last six years. For the same reason, PHQ for PAR/Ed profiles remains generally consistent from 2017 to 2022, despite both RFloat and RHQ declining to ~70% in 2019/2020.
3.4 Regional profile quality
The density of accumulated BGC profiles is important to construct global climatologies (e.g., Sauzède et al., 2016; Cossarini et al., 2021). The number of float profiles, including those of high quality, are available in most marine regions (Figure 6) but at greatly varying densities (Table S4). The density of high-quality profiles varies among parameters as pilot programs prioritized certain types of sensors early on (e.g., radiometry in the North Atlantic and the Mediterranean Sea).
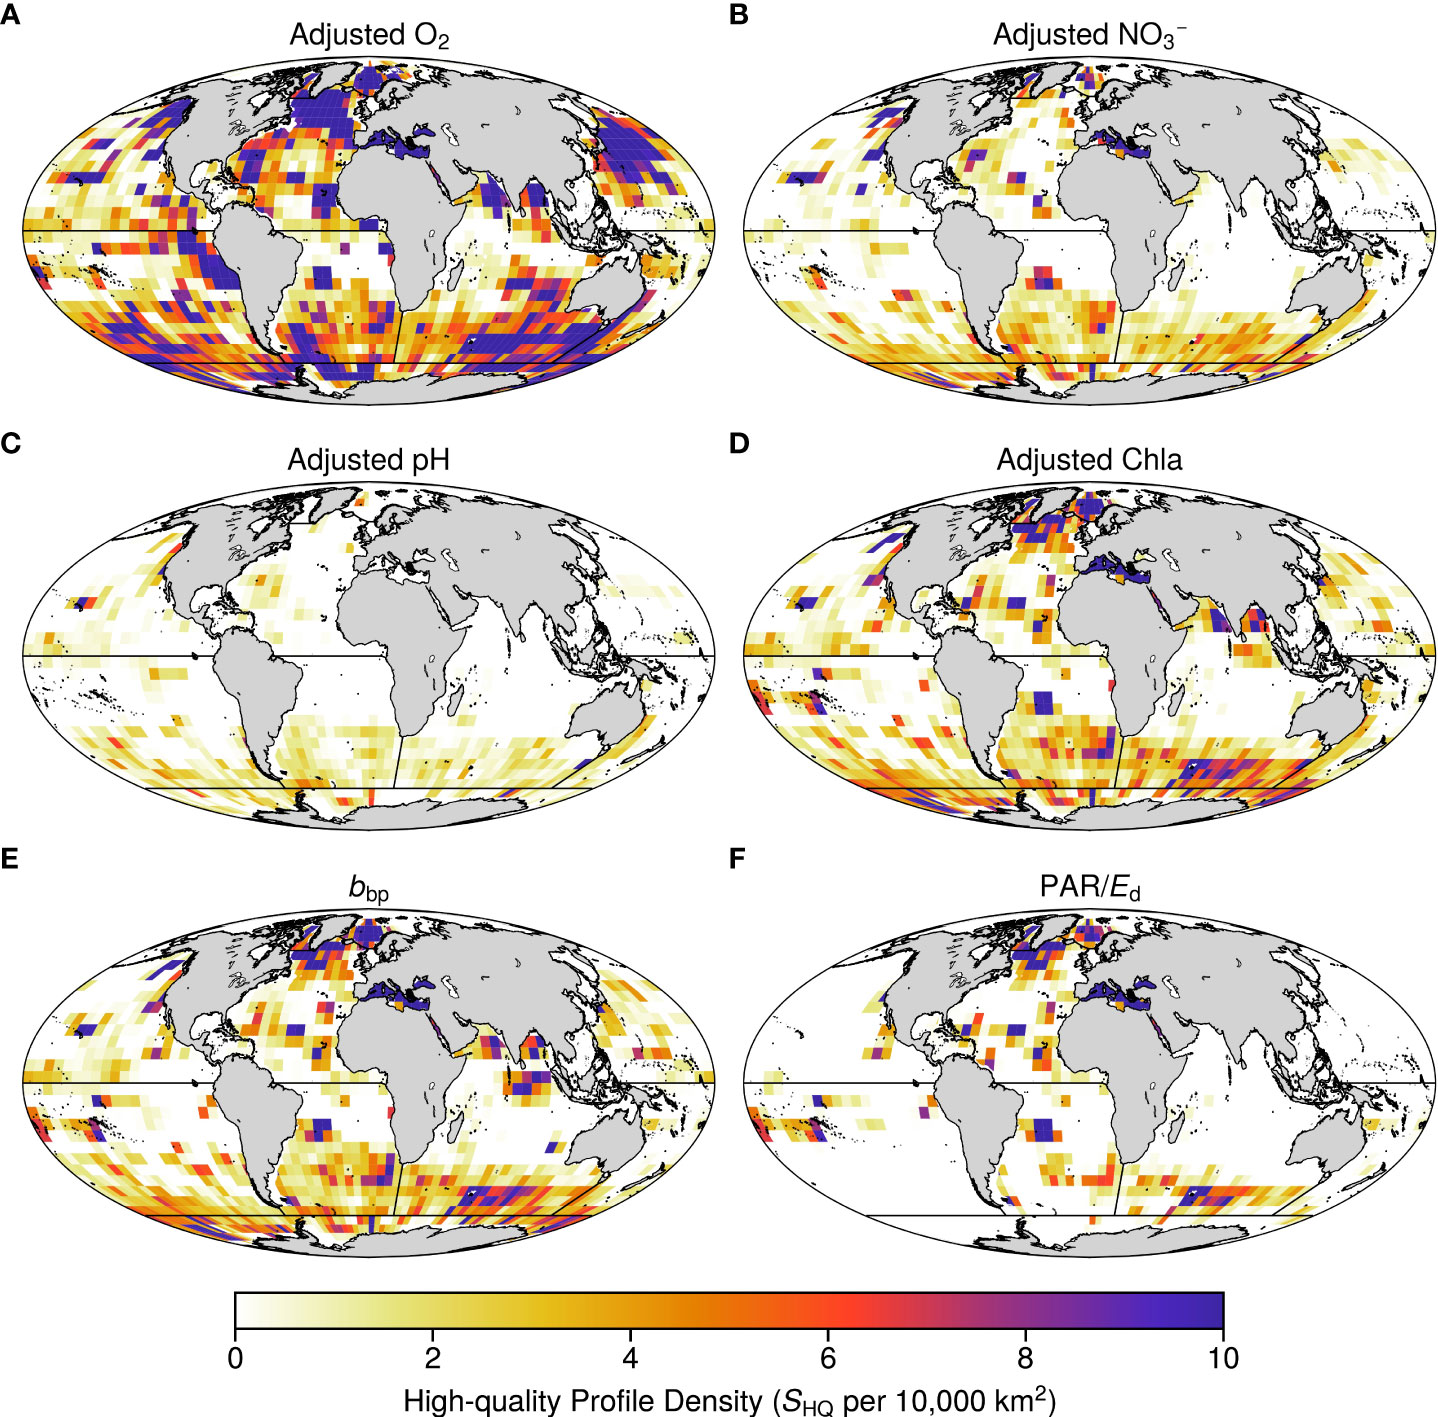
Figure 6 Density of high-quality profiles collected from 2002 to 2022 per 5°-by-5° grid cell for (A) adjusted O2, (B) adjusted NO3-, (C) adjusted pH, (D) adjusted Chla, (E) bbp, and (F) PAR/Ed. The black lines delineate the marine regions defined by Flanders Marine Institute (2021). Areas shallower than 200 m were removed, except for the Mediterranean, Black, and Baltic seas. Note that the target density for a full BGC-Argo network is ~1.1 profiles per 10,000 km² each year. The accumulated density of high-quality profiles in each marine region is described in Table S4.
Generally, the marine regions that have accumulated the highest density of high-quality profiles are the seas around Europe (Mediterranean Sea, Black Sea, and Baltic Sea), the Arctic Ocean, and the Southern Ocean (Figure 6; Table S4), although these densities are highly parameter dependent. In the Arctic Ocean, sampling also has not occurred evenly throughout the region. There is a lack of floats between the Chukchi Sea and Fram Strait, leaving a large portion of the Arctic Ocean under-sampled.
The Southern Ocean has accumulated high profile densities for each BGC property due in large part to the success of the Southern Ocean Carbon and Climate Observations and Modelling (SOCCOM) project (Maurer et al., 2021; Sarmiento et al., 2023). However, floats deployed as part of SOCCOM do not include radiometers, explaining the low level of PAR/Ed data in this region. Additionally, pH data coverage is also lower than the other parameters in this region, due to sensor quality issues highlighted in the previous section.
For the major basins (Pacific, Atlantic, and Indian Oceans), the densities of high-quality profiles are generally lower than polar regions and the seas around Europe (Table S4). Additionally, the high-quality, adjusted O2 profiles are generally high compared to other BGC parameters collected in the same major basins.
With an annual global target density of ~1.1 profiles per 10,000 km2 per year, the density of high-quality profiles is assessed on an annual basis to help evaluate the success of BGC-Argo (Figures 7, 8; Figures S3, S4). The annual, regional density of high-quality profiles, expressed as a percentage of the target density, highly varies between parameters and regions, although there is a general interannual trend of increasing profile densities. The percent area of each region with sufficient sampling also highly varies between parameters and regions. While there are significant year-to-year fluctuations, the general long-term trend is that profile densities and percent area coverage have been increasing since 2012.
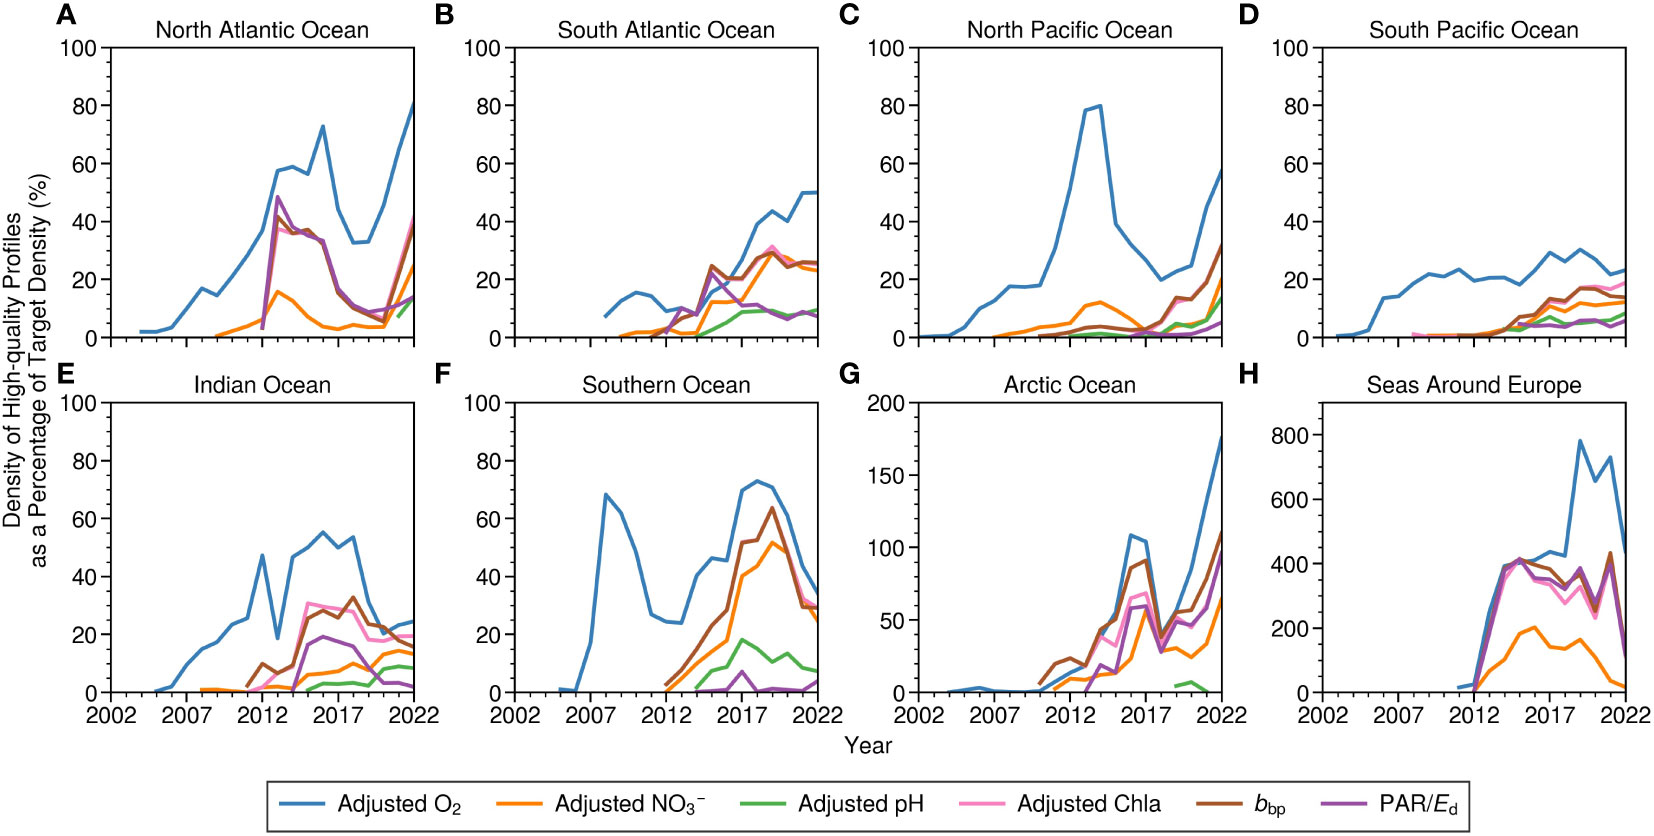
Figure 7 Density of high-quality profiles as a percentage of the targeted high-quality profiles per year with each BGC parameter in the (A) North Atlantic, (B) South Atlantic, (C) North Pacific, (D) South Pacific, (E) Indian Ocean, (F) Southern Ocean, (G) Arctic Ocean, and (H) seas around Europe. For regions in (A–G), areas shallower than 200 m were removed. The average number of high-quality profiles for co-located PAR and Ed profiles was used. In each region, sampling efforts are not evenly distributed (see Figure 8) nor may floats sample at 10-d intervals. Note the change in y-axis limits in (G, H).
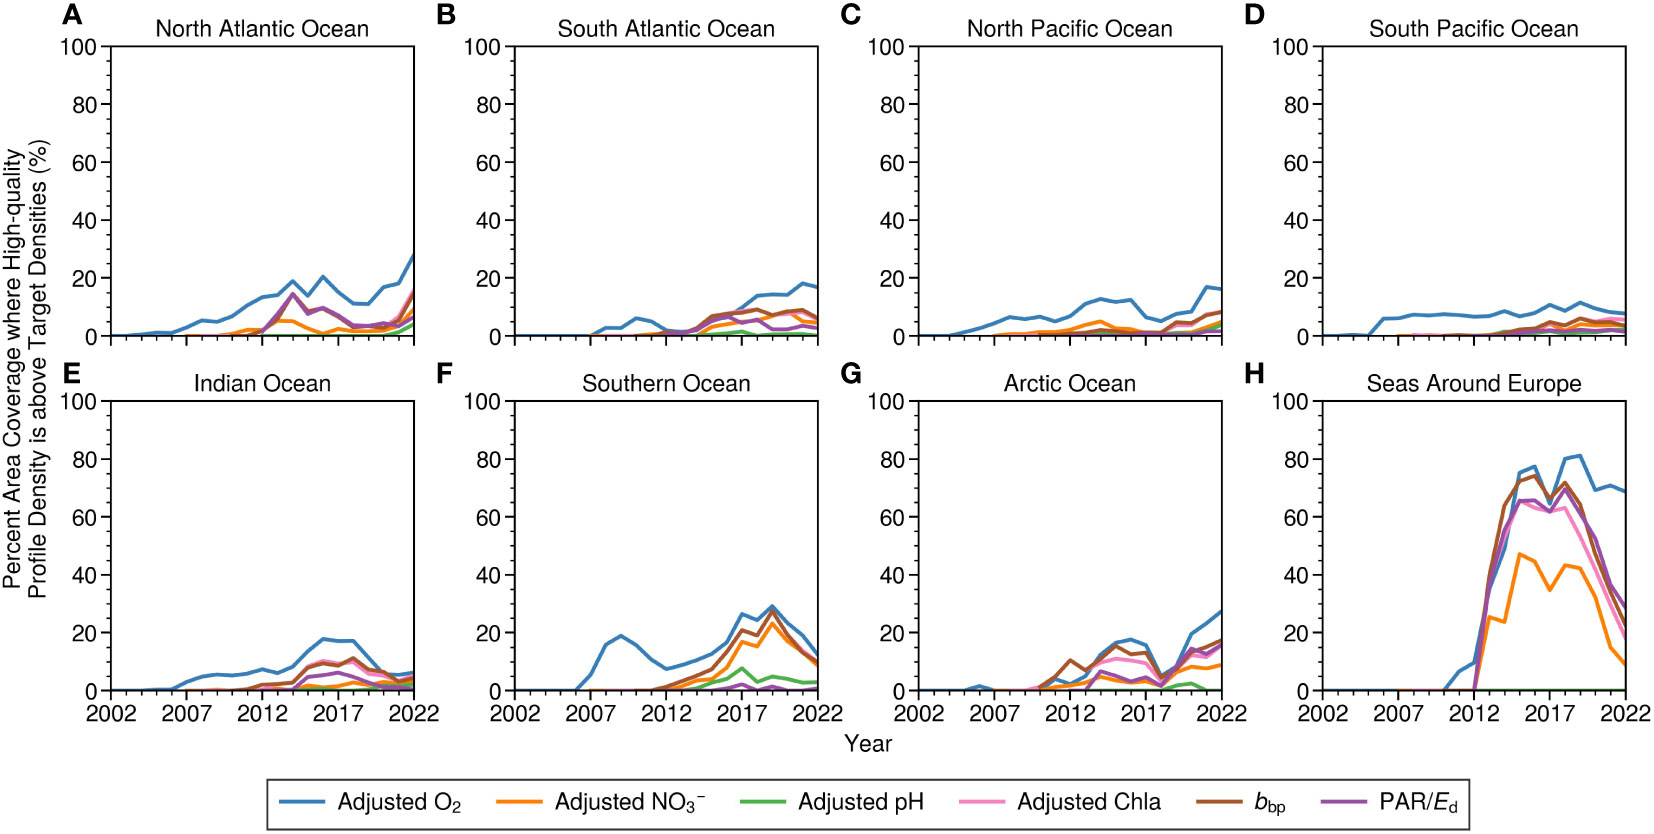
Figure 8 Percent area coverage where high-quality profile density is above target density for each BGC parameter in the (A) North Atlantic, (B) South Atlantic, (C) North Pacific, (D) South Pacific, (E) Indian Ocean, (F) Southern Ocean, (G) Arctic Ocean, and (H) seas around Europe. For regions in (A–G), areas shallower than 200 m were removed. The average density of high-quality profiles for co-located PAR and Ed profiles was used in density calculations.
BGC profiles in the seas around Europe far surpassed annual region-wide target densities at >100% in recent years (Figure 7) and meet target profile densities in ~70% of the area (Figures 8, S4), except for profiles of adjusted pH and adjusted NO3-. For the parameters present, profile densities surpassed annual targets in the Mediterranean, Black, and Baltic seas individually (Figure S5). Considering that the marginal seas around Europe are more variable than much of the open ocean, a higher sampling effort may be needed to better constrain uncertainties. The Arctic Ocean has met target densities for most parameters in the last two years as well, however, this sampling is largely concentrated in an area that consists of 30% or less of the region. The high, region-wide densities (in both the Arctic Ocean and the seas around Europe) are partly driven by floats profiling more frequently than every 10 days, which leads to more observations than what is expected from an annual target based on 10-d sampling intervals.
The Atlantic, Indian, and Pacific oceans generally have reached 10 to 30% of target densities, region-wide, for most parameters. In the same regions, about 5 to 30% of the area has hit target densities. The ocean surface area in these regions with any amount of BGC data is much higher, generally reaching 30 to 60% of a region’s area (Figure S4). For O2, profile density and percent area coverage tend to be higher than other parameters. O2 profile densities are between 50 to 70% of the target in the North Atlantic, North Pacific, and South Atlantic oceans in recent years, while the percent area coverage is <30%.
As is the case for all regions, region-wide profile densities are closer to the target density than when evaluating target density in terms of surface area covered. This discrepancy means that the sampling effort is concentrated over a small portion of a region’s area. Future float deployments could target these under-sampled regions, although, depending on scientific interest, concentrating sampling effort in certain areas may be needed for constraining highly variable regions (e.g., the Labrador Sea).
4 Discussion
The success of BGC-Argo is dependent on collecting and providing high-quality BGC observations of the ocean. The data quality summary provided herein was based on the pre-existing flagging scheme that is used operationally within the Argo data management system. It offers a quick synopsis of the current extent of high-quality BGC-Argo data directly available to users for scientific applications.
It is important to note that the various methods used in the quality control of different BGC parameters, as well as the capability to adopt and implement new methods uniformly across Argo Data Assembly Centers (DACs), are still maturing. For example, there remain floats within the data system for which QC flags are missing (Figure 2). This lack of QC is due, in part, to limited resources in addressing management requirements for legacy floats, as one example. Additionally, for a portion of floats, the <PARAM>_ADJUSTED field is not filled. While it is advised to use the adjusted data when available, a lack of adjusted data does not necessarily mean the sensor is bad, and the data may receive an adjustment in the future. For bbp and PAR/Ed, analysis can be performed without further adjustments, unlike O2, NO3-, and pH data profiles, which require adjustments for proper scientific analysis. Similarly, the adjusted Chla data includes improved estimates of Chla. The unadjusted Chla profiles should not be used for the analysis of Chla. However, the unadjusted data can still yield other valuable scientific information about the strength of NPQ and the photo-physiology of phytoplankton (e.g., Schallenberg et al., 2022; Ryan-Keogh et al., 2023).
The most efficient way to bolster the number of high-quality profiles available is to process existing profiles that have not received QC flags, so such floats should not be overlooked. As we reported in the results, QC flags are missing for 4−15% of BGC profiles, excluding O2, which has QC flags assigned to almost all profiles. Processing these remaining profiles should increase the number of profiles labeled as high-quality, yet not significantly alter PHQ.
Furthermore, efforts should be made to ensure all floats get processed (and reprocessed) with the most up-to-date QC procedures across DACs as protocols continue to be refined. This will result in improved consistency across the dataset into the future and strengthen its overall value for use in global analyses.
4.1 Parameter-specific improvements
In addition to refining quality flags through time and initiating data adjustments, there are further parameter-specific procedures that should be adopted by the data management team to further improve the absolute accuracy of BGC parameters. While high-quality profiles already represent more than 90% of adjusted O2 profiles collected thus far, O2 optode sensors suffer from slow response times, which are not routinely corrected within the data system. Slow sensor response times lead to a lag in true O2 concentrations and can create errors on the order of ~10 μmol kg-1 (Bittig et al., 2014; Gordon et al., 2020). Fortunately, various methods exist for calculating the in situ response time of O2 optodes, given the existence of certain ancillary data and/or sampling conditions (Bittig et al., 2014; Gordon et al., 2020). Such response time corrections will help reduce uncertainties around the oxycline, although, it would not likely affect the assigned QC flags.
In situations where salinity sensor data are labeled with a flag of “4” (unrecoverable), O2 data are given a label of “3” because salinity compensation to the O2 measurements cannot be performed. In these cases, utilizing salinity profiles from a high-quality derived product may help recover more O2 profiles. This procedure has been explored by the Argo community and will likely be implemented in the near future.
The pH sensors tended to fail far more than the other BGC sensors (Figures 4, 5; Table S2). Since a significant portion of the processed pH data was given a QC flag of “4” or characterized as “malfunctioned”, improvements to the PHQ appear more limited by the technology. Accordingly, the community has continued to refine and improve the design of the pH sensor, leading to a steady increase in reliability over the past five years. Future, repeated analysis of the pH QC time series presented here should be performed to ensure that the upward trending pattern in PHQ continues. It is important to note that even with relatively high failure rates, BGC-floats now collect substantially more pH profiles than shipboard measurements, playing a critical role in understanding the ocean carbon cycle.
Float fluorometers currently rely on a lab-based calibration of fluorescence-to-Chla. The conversion of fluorescence to in situ Chla concentration depends on both the composition of the phytoplankton community and their physiological status (Cullen, 1982). Ideally, the relationship between fluorescence and Chla is determined using water samples collected at the deployment site. However, this approach is not the most cost-effective, and any relationships determined at the time of deployment will likely not be the same once seasons change or the float drifts into an ecologically distinct region. Currently, each fluorometer is calibrated in a laboratory setting, using a reference fluorometer that was initially calibrated to a single culture of Thalassiosira weissflogii. This calibration has introduced a bias in the determination of Chla in situ. Roesler et al. (2017) quantified this bias with WET Labs ECO sensors and Chla concentrations determined by high pressure liquid chromatography (HPLC). Using their analysis, BGC-Argo adjusts Chla data by dividing unadjusted Chla by two to reduce this global bias. While this adjustment does not account for regional or seasonal changes in the fluorescence-Chla relationship nor greatly affects how QC flags are applied, it is a step forward for gaining more accurate estimates.
An important effort is made by the Argo Data Management Team to calibrate and qualify fluorescence data measured from BGC-Argo floats in order to deliver Chla with the best possible accuracy. It has been shown that using radiometric data associated with fluorescence measurements is an effective way to improve the fluorescence calibration (Xing et al., 2011; Xing et al., 2018). However, not all BGC-Argo floats are equipped with radiometers, making it impossible to calibrate the entire fleet homogeneously. Recently, new methods based on machine learning have made it possible to derive radiometric profiles, from merged satellite ocean color observations and hydrological data, for any BGC-Argo float, whether equipped with a radiometer or not. These synthetic radiometric profiles can thus be assigned to the fluorescence profiles to consistently calibrate the whole BGC-Argo fleet. This method is a promising alternative to other possible approaches that obtain seasonal/regional adjustments tuned to space-based estimates at the surface (Boss et al., 2008; Lavigne et al., 2015), or to HPLC Chla data.
Since the global adjustment factor is also only applicable for WET Labs (now Seabird) ECO sensors, other sensors may have to be calibrated to Chla following a different procedure and may behave differently when compared to WET Labs sensors. Subsequently, new sensors will most likely require different adjustment factors. One way to assess sensor/model-dependent adjustment factors could be to deploy some floats with multiple models of fluorometers to cross-calibrate between sensors. To catch the possibly wide range of variability in these adjustments, float deployment should be undertaken in various open ocean areas covering a wide range of biogeochemical and trophic conditions (e.g., from oligotrophic subtropical gyres to high latitude environments with strong seasonal changes in biomass). This cross-calibration could then be used to convert all Chla measurements to a common unit, assuming that differences between the same models of fluorometers are negligible. Similarly, a standard calibration procedure could be developed for BGC-Argo floats to ensure all Chla derived from fluorescence measurements from various models are intercomparable (e.g., with diffuse attenuation coefficient estimates from irradiance profiles). Regardless of which technique is applied, great care will need to be taken to ensure the interoperability of the resulting Chla concentration data so that the researchers can leverage the full database at once.
Measurements of bbp from floats currently have a limited QC procedure that includes processing for range filters, data spikes, and bad offsets. Additional real-time QC procedures proposed by Dall’Olmo et al. (2023) will be integrated into BGC-Argo data processing soon and will likely change the proportion of QC flags in the system. Briefly, this new procedure identifies issues such as noisy bbp data, profiles with a large fraction of missing data, and profiles with negative bbp. Potential sensor malfunction or biofouling is also identified by setting a threshold for high deep values of bbp, where bbp is expected to be very low (but not equal to zero). Dall’Olmo et al. (2023) also describe a procedure that identifies biased measurements of bbp resulting from particles that have accumulated on the float while the float is parked at depth between casts. For those interested in data spikes (e.g., Briggs et al., 2011) or high bbp at depth, both of which could result from real oceanographic phenomena, users will likely want to apply custom QC procedures. Once implemented, these added real-time QC procedures will reduce the number of falsely identified high-quality profiles available, but also erroneously identify good data as bad. Efforts should be made in developing a DMQC procedure to improve data quality flagging.
We found that high-quality PAR/Ed profiles represent ~90% of the entire database (Table S2). The data from radiometers are generally good without much QC. (Radiometry RTQC currently involves a global range test, and all radiometry data are given a QC flag of “2” unless the test is failed.) Previously tested improvements to the float radiometry processing include a dark offset correction, temperature correction, spike removal, and sensor drift detection (Organelli et al., 2016; Organelli et al., 2017; Jutard et al., 2021; O’Brien and Boss, 2022). About half of the database has DMQC processing correcting for temperature and dark values (Jutard et al., 2021) but has not yet been implemented on all floats. Future float deployments should prioritize collecting nighttime profiles of PAR/Ed, at least once a year by each float, for these temperature and dark offset corrections (Jutard et al., 2021). In a similar sense, collecting these nighttime profiles could also prove beneficial for assessing NPQ corrections. To reduce space-time biases in such an assessment without changing the standard profiling interval, average daily cycles could be extracted (Johnson and Bif, 2021; Stoer and Fennel, 2023).
Unstable sea states, clouds, and wave focusing can also momentarily alter light conditions which can lead to large fluctuations in the downwelling light profile. While there is nothing inherently wrong with the sensor during such events (as it represents natural light variability), stable light conditions are needed to better characterize the optical properties of the water column (e.g., estimation of the light diffuse attenuation coefficient). Procedures to identify these effects have been successfully applied to floats before (Organelli et al., 2016; Organelli et al., 2017) and could be further developed to create a reference dataset for use in the ocean optics community.
4.2 Pre-deployment strategies
A few pre-deployment strategies can also be taken to help improve BGC data quality in the future. For one, testing the float from a dock could help identify issues with sensors, communications, and mechanics before deployment in the open ocean. Ideally, dock testing would prevent the deployment of floats that would otherwise quickly fail in the field. This strategy has proven to be very effective for the SOCCOM and GO-BGC projects. Secondly, while not always logistically feasible, reducing the time between when the float is manufactured and deployed may improve float survival and functionality by limiting exposure to possible damage. Finally, larger batteries can also be purchased for some float models to increase the float’s lifetime, allowing the float to collect more high-quality profiles (assuming all sensors continue to function).
5 Conclusion
BGC-Argo is a rapidly expanding global ocean observation network that offers an independent, cost-effective approach to studying ocean biogeochemistry. The success of BGC-Argo depends on ensuring that scientific-quality data can be retrieved and delivered to the user in near real-time. Delivering scientific-quality data requires rigorous QC. Alongside the increasing profile numbers and spatial coverage, we report that for most of the key BGC parameters, high-quality profiles make up at least 80% of all profiles collected thus far, with the exception of pH. We find that pH profiles have drastically improved in quality in the past five years and are on track to have a similar data quality as the other BGC parameters. We suggest several ways in which the BGC-Argo data system is improving, which should lead to both an increase in the number of high-quality profiles available to users, as well as improvements to the absolute accuracy of key parameters in the future. These strategies involve ensuring that data from all new and old floats contain flags with the most up-to-date QC procedures, advancing parameter-specific corrections, and testing the float before deployment. This census provides the foundation necessary to monitor measurement quality and quantity in the future as BGC-Argo advances.
Data availability statement
Publicly available datasets were analyzed in this study. The Sprof files used in this study are available from the Argo Global Data Assembly Centers in Brest, France (ftp://ftp.ifremer.fr/ifremer/argo/dac/) and Monterey, California (ftp://usgodae.org/pub/outgoing/argo/dac/). The marine region data is from Flanders Marine Institute (2021) and is publicly available online (https://www.marineregions.org/). The Python software and the data in each figure are freely available on Zenodo (Stoer et al., 2023).
Author contributions
AS and KF conceptualized and wrote an early draft of the manuscript. All authors provided ideas for the methods and discussion and edited subsequent drafts. All authors contributed to the article and approved the submitted version.
Funding
The authors acknowledge support to AS from a Nova Scotia Graduate Student scholarship, a Canada Graduate Scholarship (Master’s) from the Natural Sciences and Engineering Research Council of Canada (NSERC), and KF’s NSERC Discovery Grant (RGPIN-2014-03938).
Acknowledgments
These data were collected and made freely available by the International Argo Program and the national programs that contribute to it (http://www.argo.ucsd.edu, https://www.ocean-ops.org/board?t=Argo). The Argo Program is part of the Global Ocean Observing System.
Conflict of interest
AS received a grant from Dalhousie University’s Surge Innovation for the development and potential commercialization of bio-optical sensors.
The remaining authors declare that the research was conducted in the absence of any commercial or financial relationships that could be construed as a potential conflict of interest.
Publisher’s note
All claims expressed in this article are solely those of the authors and do not necessarily represent those of their affiliated organizations, or those of the publisher, the editors and the reviewers. Any product that may be evaluated in this article, or claim that may be made by its manufacturer, is not guaranteed or endorsed by the publisher.
Supplementary material
The Supplementary Material for this article can be found online at: https://www.frontiersin.org/articles/10.3389/fmars.2023.1233289/full#supplementary-material
References
Argo (2000) Argo float data and metadata from Global Data Assembly Centre (Argo GDAC) (SEANOE). doi: 10.17882/42182
Begouen Demeaux C., Boss E. (2022). Validation of remote-sensing algorithms for diffuse attenuation of downward irradiance using BGC-argo floats. Remote Sens (Basel) 14, 4500. doi: 10.3390/rs14184500
Biogeochemical-Argo Planning Group (2016). The scientific rationale, design and Implementation Plan for a Biogeochemical-Argo float array. doi: 10.13155/46601
Bittig H., Fiedler B., Scholz R., Krahmann G., Körtzinger A. (2014). Time response of oxygen optodes on profiling platforms and its dependence on flow speed and temperature. Limnol Oceanogr Methods 12, 617–636. doi: 10.4319/lom.2014.12.617
Bittig H., Körtzinger A. (2015). Tackling oxygen optode drift: near-surface and in-air oxygen optode measurements on a float provide an accurate in situ reference. J. Atmos Ocean Technol. 32, 1536–1543. doi: 10.1175/JTECH-D-14-00162.1
Bittig H., Maurer T., Plant J., Schmechtig C., Wong A., Claustre H., et al. (2019). A BGC-argo guide: planning, deployment, data handling and usage. Front. Mar. Sci. 6, 502. doi: 10.3389/fmars.2019.00502
Bittig H., Wong A., Plant J., the Coriolis Argo data management team (2022). BGC-Argo synthetic profile file processing and format on Coriolis GDAC, v1.3. doi: 10.13155/55637
Boss E., Swift D., Taylor L., Brickley P., Zaneveld R., Riser S., et al. (2008). Observations of pigment and particle distributions in the western North Atlantic from an autonomous float and ocean color satellite. Limnol. Oceanogr. 53, 2112–2122. doi: 10.4319/lo.2008.53.5_part_2.2112
Briggs N., Perry M. J., Cetinić I., Lee C., D’Asaro E., Gray A., et al. (2011). High-resolution observations of aggregate flux during a sub-polar North Atlantic spring bloom. Deep Sea Res. Part I: Oceanograph. Res. Papers 58, 1031–1039. doi: 10.1016/j.dsr.2011.07.007
Claustre H., Johnson K. S., Takeshita Y. (2020). Observing the global ocean with Biogeochemical-Argo. Ann. Rev. Mar. Sci. 12, 23–48. doi: 10.1146/annurev-marine-010419-010956
Cornec M., Claustre H., Mignot A., Guidi L., Lacour L., Poteau A., et al. (2021). Deep chlorophyll maxima in the global ocean: occurrences, drivers and characteristics. Global Biogeochem Cycles 35, e2020GB006759. doi: 10.1029/2020GB006759
Cossarini G., Feudale L., Teruzzi A., Bolzon G., Coidessa G., Solidoro C., et al. (2021). High-resolution reanalysis of the mediterranean sea biogeochemistry (1999–2019). Front. Mar. Sci. 8, 1537. doi: 10.3389/fmars.2021.741486
Cullen J. J. (1982). The deep chlorophyll maximum: comparing vertical profiles of chlorophyll a. Can. J. Fisheries Aquat. Sci. 39, 791–803. doi: 10.1139/f82-108
Dall’Olmo G., Bhaskar TVS U., Bittig H., Boss E., Brewster J., Claustre H., et al. (2023). Real-time quality control of optical backscattering data from Biogeochemical-Argo floats. Open Res. Europe 2, 118. doi: 10.12688/openreseurope.15047.2
Flanders Marine Institute (2021). Global oceans and seas, version 1. Available online at https://www.marineregions.org/. doi: 10.14284/542
Gordon C., Fennel K., Richards C., Shay L., Brewster J. (2020). Can ocean community production and respiration be determined by measuring high-frequency oxygen profiles from autonomous floats? Biogeosciences 17, 4119–4134. doi: 10.5194/bg-17-4119-2020
Johnson G., Hosoda S., Jayne S., Oke P., Riser S., Roemmich D., et al. (2022). Argo—Two decades: global oceanography, revolutionized. Ann. Rev. Mar. Sci. 14, 379–403. doi: 10.1146/annurev-marine-022521-102008
Johnson K., Bif M. (2021). Constraint on net primary productivity of the global ocean by Argo oxygen measurements. Nat. Geosci. 14, 769–774. doi: 10.1038/s41561-021-00807-z
Johnson K., Maurer T., Plant J., Bittig H., Schallenberg C., Schmechtig C. (2021). BGC-Argo quality control manual for nitrate concentration. doi: 10.13155/84370
Johnson K., Plant J., Maurer T. (2023). Processing BGC-Argo pH data at the DAC level. doi: 10.13155/57195
Johnson K., Plant J., Riser S., Gilbert D. (2015). Air oxygen calibration of oxygen optodes on a profiling float array. J. Atmos. Ocean Technol. 32, 2160–2172. doi: 10.1175/JTECH-D-15-0101.1
Jutard Q., Organelli E., Briggs N., Xing X., Schmechtig C., Boss E., et al. (2021). Correction of biogeochemical-argo radiometry for sensor temperature-dependence and drift: protocols for a delayed-mode quality control. Sensors 21, 6217. doi: 10.3390/s21186217
Lavigne H., D’Ortenzio F., Ribera D’Alcalà M., Claustre H., Sauzède R., Gacic M. (2015). On the vertical distribution of the chlorophyll a concentration in the Mediterranean Sea: a basin-scale and seasonal approach. Biogeosciences 12, 5021–5039. doi: 10.5194/bg-12-5021-2015
Maurer T., Plant J., Johnson K. (2021). Delayed-mode quality control of oxygen, nitrate, and pH data on SOCCOM biogeochemical profiling floats. Front. Mar. Sci. 8, 683207. doi: 10.3389/fmars.2021.683207
O’Brien T., Boss E. (2022). Correction of radiometry data for temperature effect on dark current, with application to radiometers on profiling floats. Sensors 22, 6771. doi: 10.3390/s22186771
Organelli E., Barbieux M., Claustre H., Schmechtig C., Poteau A., Bricaud A., et al. (2017). Two databases derived from BGC-Argo float measurements for marine biogeochemical and bio-optical applications. Earth Syst. Sci. Data 9, 861–880. doi: 10.5194/essd-9-861-2017
Organelli E., Claustre H., Bricaud A., Schmechtig C., Poteau A., Xing X., et al. (2016). A novel near-real-time quality-control procedure for radiometric profiles measured by bio-argo floats: protocols and performances. J. Atmos Ocean Technol. 33, 937–951. doi: 10.1175/JTECH-D-15-0193.1
Owens B., Zilberman N., Johnson K., Claustre H., Scanderbeg M., Wijffels S., et al. (2022). OneArgo: A new paradigm for observing the global ocean. Mar. Technol. Soc. J. 56, 84–90. doi: 10.4031/MTSJ.56.3.8
Poteau A., Organelli E., Boss E., Xing X. (2019). Quality control for BGC-Argo radiometry. doi: 10.13155/62466
Roemmich D., Alford M. H., Claustre H., Johnson K., King B., Moum J., et al. (2019). On the future of argo: A global, full-depth, multi-disciplinary array. Front. Mar. Sci. 6. doi: 10.3389/fmars.2019.00439
Roesler C., Uitz J., Claustre H., Boss E., Xing X., Organelli E., et al. (2017). Recommendations for obtaining unbiased chlorophyll estimates from in situ chlorophyll fluorometers: A global analysis of WET Labs ECO sensors. Limnol. Oceanogr. Methods 15, 572–585. doi: 10.1002/lom3.10185
Ryan-Keogh T. J., Thomalla S. J., Monteiro P. M. S., Tagliabue A. (2023). Multidecadal trend of increasing iron stress in Southern Ocean phytoplankton. Sci. (1979) 379, 834–840. doi: 10.1126/science.abl5237
Sarmiento J. L., Johnson K. S., Arteaga L. A., Bushinsky S. M., Cullen H. M., Gray A. R., et al (2023). The Southern Ocean Carbon and Climate Observations and Modeling (SOCCOM) project: A review. Progress in Oceanography, 103130. doi: 10.1016/j.pocean.2023.103130
Sauzède R., Claustre H., Uitz J., Jamet C., Dall’Olmo G., D’Ortenzio F., et al. (2016). A neural network-based method for merging ocean color and Argo data to extend surface bio-optical properties to depth: Retrieval of the particulate backscattering coefficient. J. Geophys. Res. Oceans 121, 2552–2571. doi: 10.1002/2015JC011408
Schallenberg C., Strzepek R. F., Bestley S., Wojtasiewicz B., Trull T. W. (2022). Iron limitation drives the globally extreme fluorescence/chlorophyll ratios of the Southern Ocean. Geophys Res. Lett. 49, e2021GL097616. doi: 10.1029/2021GL097616
Schmechtig C., Claustre H., Poteau A., D’Ortenzio F. (2018). BGC-Argo quality control manual for the Chlorophyll-A concentration. doi: 10.13155/35385
Schmechtig C., Boss E., Briggs N., Claustre H., Dall’Olmo G., Poteau A. (2019) BGC Argo quality control manual for particles backscattering. doi: 10.13155/60262
Schmechtig C., Thierry V., the Bio Argo Team (2016). Argo quality control manual for biogeochemical data (Accessed January 31, 2023). doi: 10.13155/40879
Stoer A. C., Fennel K. (2023). Estimating ocean net primary productivity from daily cycles of carbon biomass measured by profiling floats. Limnol. Oceanogr. Lett. 8, 368–375. doi: 10.1002/lol2.10295
Stoer A., Takeshita Y., Maurer T., Begouen Demeaux C., Bittig H., Boss E., et al. (2023). “Processing and data for “A census of quality-controlled biogeochemical-argo float measurements,” in Zenodo. doi: 10.5281/zenodo.8322118
Takeshita Y., Martz T. R., Johnson K., Plant J., Gilbert D., Riser S., et al. (2013). A climatology-based quality control procedure for profiling float oxygen data. J. Geophys Res. Oceans 118, 5640–5650. doi: 10.1002/jgrc.20399
Thierry V., Bittig H., the Argo-BGC team (2021). Argo quality control manual for dissolved oxygen concentration, v2.1. doi: 10.13155/46542
Xing X., Briggs N., Boss E., Claustre H. (2018). Improved correction for non-photochemical quenching of in situ chlorophyll fluorescence based on a synchronous irradiance profile. Opt Express 26, 24734–24751. doi: 10.1364/OE.26.024734
Keywords: biogeochemical cycles, ocean observation, best practices, remote sensing, data processing, quality assurance
Citation: Stoer AC, Takeshita Y, Maurer TL, Begouen Demeaux C, Bittig HC, Boss E, Claustre H, Dall’Olmo G, Gordon C, Greenan BJW, Johnson KS, Organelli E, Sauzède R, Schmechtig CM and Fennel K (2023) A census of quality-controlled Biogeochemical-Argo float measurements. Front. Mar. Sci. 10:1233289. doi: 10.3389/fmars.2023.1233289
Received: 01 June 2023; Accepted: 11 September 2023;
Published: 27 October 2023.
Edited by:
Juliet Hermes, South African Environmental Observation Network (SAEON), South AfricaReviewed by:
Thomas James Ryan-Keogh, Southern Ocean Carbon and Climate Observatory (SOCCO), South AfricaHelen Elizabeth Phillips, University of Tasmania, Australia
Copyright © 2023 Stoer, Takeshita, Maurer, Begouen Demeaux, Bittig, Boss, Claustre, Dall’Olmo, Gordon, Greenan, Johnson, Organelli, Sauzède, Schmechtig and Fennel. This is an open-access article distributed under the terms of the Creative Commons Attribution License (CC BY). The use, distribution or reproduction in other forums is permitted, provided the original author(s) and the copyright owner(s) are credited and that the original publication in this journal is cited, in accordance with accepted academic practice. No use, distribution or reproduction is permitted which does not comply with these terms.
*Correspondence: Adam C. Stoer, YWRhbS5zdG9lckBkYWwuY2E=