
95% of researchers rate our articles as excellent or good
Learn more about the work of our research integrity team to safeguard the quality of each article we publish.
Find out more
ORIGINAL RESEARCH article
Front. Mar. Sci. , 06 November 2023
Sec. Marine Biology
Volume 10 - 2023 | https://doi.org/10.3389/fmars.2023.1233249
This article is part of the Research Topic Current Research on Fish Otoliths and their Applications View all 10 articles
 Estrella Malca1,2,3*
 José M. Quintanilla4
 Trika Gerard2Francisco Alemany5
 Tracey Sutton3Alberto García4John T. Lamkin2
 Raúl Laiz-Carrión4
Atlantic bluefin tuna (ABT), Thunnus thynnus, is a globally important fishery resource. This oceanic top predator undertakes long-distance migrations from its nutrient-rich feeding grounds in the north Atlantic to oligotrophic spawning grounds. Larvae are born mainly in the corresponding ecosystems of its two well-established spawning areas: the Gulf of Mexico (GoM) and the Mediterranean Sea (MED). Stable isotopes analyses (SIA) of δ15N and δ13C have proven useful for understanding marine food webs and have evaluated larval ABT signatures in their respective spawning areas. This study is among the first to use larvae collected during the same spawning season (2014) from the GoM and one of the main spawning areas within the MED (the Balearic Sea) to standardize methodologies, compare larval growth, and relate SIA with larval postflexion growth using GAMs for the two spawning areas. The main findings identify significant population differences, with comparatively faster growth in GoM larvae. The GoM population had larger otoliths with wider increments, as well as higher δ15N values and higher trophic position for postflexion stages. Collectively, these findings highlight the importance of not only developing well-calibrated growth curves, but also integrating the distinct early life history dynamics for each spawning area to properly support ABT’s ongoing management efforts.
The highly migratory Atlantic bluefin tuna (Thunnus thynnus Linnaeus, 1758, hereafter referred to as ABT) is the largest scombrid, reaching up to 650 kg (Block et al., 2005). The high value of ABT’s led to substantial overfishing (Rooker et al., 2007; Collette et al., 2011) until the last decade (Anonymous, 2023). Subsequently, multiple ecological studies have sought to inform ABT management decisions aiming to mitigate the species’ decline (Fromentin and Powers, 2005; Secor et al., 2008; Restrepo et al., 2010; Laiz-Carrión et al., 2019; Gerard et al., 2022). Following the implementation of a strict management plan in the late 1990’s, signs of population rebuilding have been documented (Anonymous, 2021), nonetheless uncertainties relating to ABT biology suggest that an overly simplistic management paradigm could compromise the long-term conservation of the species (Diaz-Arce et al., 2023).
The western ABT stock spawns in two locations: in the Gulf of Mexico (GoM) and the Slope Sea off the northeastern Atlantic Ocean, while the eastern stock spawns in various regions within the Mediterranean Sea (MED) (Fromentin and Powers, 2005; Muhling et al., 2013; Gordoa et al., 2021 and citations herein, Hernández et al., 2021). These oceanic (seaward of the 200-m isobath) tuna migrate large distances from nutrient-rich feeding areas to highly oligotrophic regions and position their larvae in an optimal habitat for survival (Bakun, 2012). Furthermore, ABT spawning appears to be mediated by sea surface temperatures (SSTs) above approximately 23°C (Alemany et al., 2010; Muhling et al., 2010), and occurs in the GoM between April and June and in the MED between June to July (Laiz-Carrión et al., 2015; Muhling et al., 2017).
Although ABT’s two spawning areas are both oligotrophic environments that experience a noticeable increase in SST prior to spawning, they diverge in environmental characteristics during the spawning periods. The GoM is influenced by eddies that are shed by the Loop Current year-round and propagate westward (Lindo-Atichati et al., 2012; Domingues et al., 2016). These features enrich the circulatory dynamics by introducing faster-moving, warmer Caribbean water into the region. In the MED, the summer hydrodynamics are influenced by the incoming North Atlantic Sea entering the region via the Strait of Gibraltar. The warmer and less saline Atlantic water mass interacts with the local bathymetry, the topography of various islands, and the cooler and more saline MED. Then, the North Atlantic water mass propagates eastward, and local productivity is enhanced in this area (Vélez-Belchí and Tintoré, 2001; Sabatés et al., 2007; Balbín et al., 2014).
Larval studies are particularly relevant in ABT fisheries management because abundances from annual fisheries surveys provide yearly estimates of adult spawning biomass by using observed larval length distributions (Scott et al., 1993; Ingram et al., 2010; Ingram et al., 2017). Previous studies have aged larval ABT otoliths from both spawning areas (García et al., 2006; García et al., 2013; Malca et al., 2017). For instance, otolith growth has examined larval development, nutritional changes, and trophodynamics through maternal transmission (Quintanilla et al., 2023). Daily otolith increments are visible as bipartite structures composed of a transparent layer (L-zone) and a darker but often-wider layer (D-zone) under transmitted light (Campana and Jones, 1992; Secor et al., 1995). Furthermore, daily increments widen with ontogeny for several larval tuna species: Katsuwonus pelamis, (Zygas et al., 2015), T. atlanticus (Gleiber et al., 2020b), Auxis spp. (Laiz-Carrión et al., 2013), T. thynnus (García et al., 2013; Malca et al., 2017), T. orientalis (Watai et al., 2017), and T. maccoyii (Jenkins and Davis, 1990). Moreover, recent otolith growth is proportional to the most recent somatic growth prior to collection (Pannella, 1971; Clemmesen, 1994; Robert et al., 2007; Robert et al., 2023) and has been utilized to analyze larval condition for Thunnus species in offshore environments such as the Straits of Florida (Gleiber et al., 2020a; Gleiber et al., 2020b) and in the GoM (Malca et al., 2022).
In the MED, García et al. (2013) aged multiple cohorts from the early 2000’s and reported a positive association between growth rates, SST and microzooplankton quality. Subsequently, Malca et al. (2017) compared GoM larval growth from the 2012 spawning season to the MED larval growth from the 2003-2005 spawning seasons from García et al. (2013). Malca et al. (2017) found significant differences in growth patterns between the two nursery grounds, with comparatively faster growth in the GoM. However, the inferences in the latter study relied on larvae that were aged using different methodologies and collected from different years in the GoM (2000-2012) and the MED (2003-2005). Ageing estimates during the first weeks of life can naturally vary between seasons and locations (García et al., 2013; Long and Porta, 2019), and these spatiotemporal dissimilarities may yield different growth rates. Despite the need to improve the understanding of larval ABT life history and the unidentified links to recruitment, larval growth comparisons between the two main spawning grounds have yet to be calibrated by the same readers for the same spawning season to examine temporal and spatial variability.
Mesozooplankton (0.2 – 0.5 mm) abundance and composition vary within the GoM and MED seasonally, yet decline offshore in the GoM and from west to east in the MED (Kovalev et al., 1999). Although copepods dominate the zooplankton community in both regions, larvaceans, cladocerans, chaetognaths, small hydromedusae, and doliolids were most abundant taxa overall (Siokou-Frangou et al., 2010; Benedetti et al., 2019; Daly et al., 2021). For a more detailed description of GoM and MED mesozooplankton abundance and community composition, see Daly et al. (2021); Ferguson (2022); Feuilloley et al. (2022); Kovalev et al. (1999); Mazzocchi et al. (2011); Siokou-Frangou et al. (2010), and Rathmell (2007). Previous trophodynamic studies of larval Scombridae have focused on stomach content analysis (SCA) to characterize the larval diet after yolk absorption is completed and exogenous feeding begins. Larval ABT in the GoM predominantly feed on copepods, copepod nauplii, appendicularians, and cladocerans (Llopiz and Hobday, 2015; Tilley et al., 2016; Shiroza et al., 2021). Interestingly, active selection of cladocerans (podonids) over copepods was reported for ABT (Shiroza et al., 2021), while other tuna larvae (e.g., Auxis spp., Katsuwonus pelamis) show a preference for appendicularians (Llopiz et al., 2010; Llopiz and Hobday, 2015). ABT diet in the MED is similar to the GoM, though selectivity has not been examined in depth with respect to the available prey field (Catalán et al., 2007; Catalán et al., 2011; Uriarte et al., 2019). Despite the utility of SCA, it represents a “last meal” perspective of diet composition, with some rapidly digested prey potentially underestimated (Polis and Strong, 1996; Pinnegar and Polunin, 1999). Moreover, SCA at wide geographic and temporal scales requires large numbers of samples across space, time, and requires extensive taxonomic expertise to accomplish.
In order to augment SCA, a biogeochemical approach utilizing natural abundances of stable isotopes of nitrogen (15N/14N, represented as δ15N) and carbon (13C/12C or δ13C) from consumers’ tissues has proven useful in ecosystem studies (Fry, 2006; Montoya, 2007; Varela et al., 2019; Hildebrand, 2022) including the GoM (Richards et al., 2023). Isotopic ratios reflect feeding pathways (Bodin et al., 2021). In general, higher δ15N values specify higher trophic levels (Post, 2002), and δ13C reflects food web dynamics (Bodin et al., 2021). In pelagic environments, phytoplankton are the base of the feeding pathway. The primary producers have low δ15N with variable δ13C values reflecting primary producers. Moving upwards in the food web, small zooplankton will in turn have larger (i.e., more enriched) isotopic values and larval fishes that consume a copepod-rich diet will have even more enriched values.
For larval ABT, the δ15N values are linked to the corresponding δ15N zooplankton prey baseline that allows the estimation of trophic position (TP) as well as the corresponding trophic niche width (Laiz-Carrión et al., 2015; Laiz-Carrión et al., 2019). Nitrogen and carbon stable isotope signatures can help to characterize the complex ecosystem of migratory species (Laiz-Carrión et al., 2013; Laiz-Carrión et al., 2015; García et al., 2017; Laiz-Carrión et al., 2019). Stable isotope analysis (SIA) of nitrogen from adult muscle tissues reflects the signature of the combined prey ingested for several months; however, for larval fishes the SIA signatures reflect only a few days of larval life (Peterson and Fry, 1987; Logan et al., 2006; Montoya, 2007). SIA is a suitable method for testing hypotheses on developmental changes in sources of nutrition as it provides information on assimilated food (Laiz-Carrión et al., 2011; Laiz-Carrión et al., 2019). Combining larval SIA along with recent otolith growth is strategic as both metrics reflect recent somatic and environmental conditions. Furthermore, the analysis of nitrogen stable isotopes from prey to predators can be used as a proxy for estimating trophic position (TP) which reflects the efficiency of nitrogen transfer through a food web (Montoya, 2007; Caut et al., 2009). SIA provides time-integrated information about assimilated diet over longer timeframes than SCA (Peterson and Fry, 1987) and TP indicates the ecological role of species in the ecosystem (Post, 2002; Quezada-Romegialli et al., 2018. Therefore, estimating the TP of organisms is crucial for understanding trophodynamics and the influence of trophic interactions on larval growth variability throughout ontogenetic development (Pepin and Dower, 2007; Laiz-Carrión et al., 2019; Quintanilla et al., 2020).
Differences between isotopic signatures between preflexion and postflexion ontogenetic stages reflect transgenerational maternal transmission of the nitrogen isotopic signature (Uriarte et al., 2016; Laiz-Carrión et al., 2019). Preflexion ABT larvae have higher nitrogen values, reflecting the maternal ABT adult signature (Quintanilla et al., 2023). Consequently, the trophic information based on SIA (TP, isotopic niche width, and overlap analyses) should only include postflexion tuna larvae. Laiz-Carrión et al. (2015) observed trophic ecology disparities for ABT larvae between MED and GoM. These studies called for further research to investigate and evaluate the implications of these trophic differences on daily growth variability. In this way, a direct relationship between isotopic signatures and growth strategies in larval stages can be determined, providing a useful method to analyze the trophic influence of trophic pathways on growth variability (Laiz-Carrión et al., 2011; Pepin et al., 2015; Quintanilla et al., 2015; Quintanilla et al., 2020).
This study generated growth curves for the 2014 ABT spawning season in the GoM and MED by ageing larval otoliths collected from the respective spawning grounds and developed rigorous protocols for age-at-length estimates for larval ABT in the Atlantic Basin. In addition, a detailed comparison of otolith measurements between readers and among otoliths were tested to standardize ageing of larval tunas in general. Finally, potential density-dependence and trophodynamics using bulk δ15N and δ13C were compared using recent otolith growth for postflexion larvae using a General Additive Model (GAM) to examine the variability of larval growth in conjunction with trophic variables for each corresponding spawning ground.
Two surveys collected larval ABT in the GoM and the MED during the peak spawning seasons in 2014 (Table 1). In the GoM, the in situ SST from CTD vertical profiling and surface flow-through thermosalinograph measurements guided sampling to target suitable larval ABT habitat at approximately 15- to 25-n.m. intervals. The GoM survey avoided both warm temperatures (> 28 °C) indicative of Loop Current water and cooler temperatures (< 22° C) (Muhling et al., 2010). In the MED, stations were located over a grid of approximately 10-n.m. intervals in the Balearic archipelago region following historical ichthyoplankton surveys targeting ABT larvae described by Alemany et al. (2010) and specifically defined for the 2014 survey in Uriarte et al. (2019). The transient gradients created by the mixing between resident Mediterranean waters and warmer incoming Atlantic Ocean waters has been previously indicative of positive larval ABT habitat (Muhling et al., 2013).
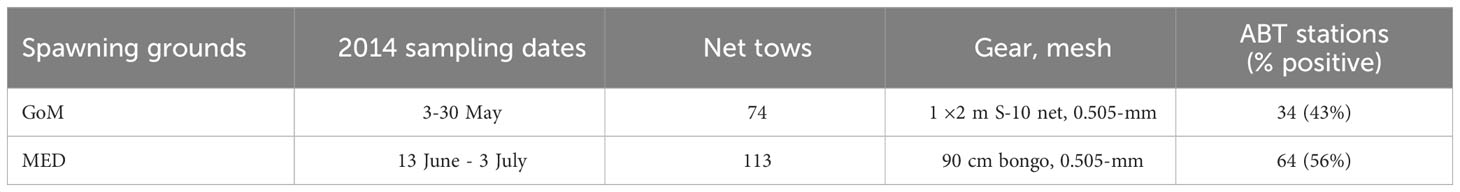
Table 1 Survey dates, number of net tows, gear types and positive Thunnus thynnus (ABT) stations during each sampling effort in the Gulf of Mexico (GoM) and the Mediterranean Sea (MED, Balearic Sea) during the 2014 spawning season.
These two surveys were part of a collaborative project (ECOLATUN1) that intended to standardize sampling techniques and examine the larval ecology at each corresponding study area. In the first effort, 76 stations were sampled aboard the R/V F.G. Walton Smith from 28 April to 25 May 2014 in the northern GoM using an “S-10” net (1 × 2 m frame fitted with 0.5-mm mesh net) towed in the upper 10 m of the water column for ~10 minutes (Habtes et al., 2014). During the second effort, 98 stations were sampled aboard the R/V SOCIB from 17 June to 3 July in the Balearic Sea in the western Mediterranean (MED dataset henceforth). In the MED, a squared-mouth Bongo net (90-cm diameter) fitted with 0.5-mm mesh was towed obliquely from ~30 m to the surface. Both frames were fitted with a flowmeter (2030, General Oceanics) positioned at the center of the mouth of each net to measure the volume of water filtered (m3).
Unpreserved plankton samples were examined at-sea for presence (or absence) of larval ABT using taxonomic keys including Richards (2006) and stereomicroscopes (0.8 – 10×). When larval ABT were present, they were removed, assigned an identifier number that did not contain any morphometric information, and were immediately stored in liquid nitrogen to preserve tissues for later isotopic analysis. These ABT larvae were subsequently stored at -80°C at each respective laboratory. During the surveys, the remainder of the plankton sample was fixed in 95% ethanol and in the GoM, the sample was transferred to fresh 95% ethanol 24h later. At each respective laboratory, body length (BL) was measured to the end of the notochord for preflexion larvae, or up to the base of caudal peduncle in postflexion larvae. BL was measured to the nearest 0.05 mm using the image analysis software Image J (Schneider et al., 2012). The remaining larval fishes collected in the surveys were identified to the lowest taxonomic level. In the GoM, larvae within the flexion stage were combined in subsequent analyses with postflexion fish because they were > 6 mm. Total larval abundances were tabulated for each survey and were standardized by dividing the abundance collected at each station by the corresponding volume filtered during the net tow for each study area. In the 2014 GoM samples, additional ABT larvae were found among the ichthyoplankton assemblage during the identification process and specimens of certain body sizes that were underrepresented in the frozen dataset were added to the GoM’s 2014 dataset (n=15 ABT larvae). For these ethanol-preserved larvae, BLs were adjusted for ethanol-induced shrinkage by the following formula derived from GoM ABT (Malca et al., 2022):
Hydrographic data including temperature and salinity were collected at each sampling station using a Seabird SBE 9/11 Plus CTD profiler deployed to a target depth of 300 m or within 10 m of the seabed at shallow stations. In the MED, depths of up to 600 m were sometimes used to define the localized geostrophic currents. A handful of stations lacked water profiles, thus the shipboard flow-through measurements for temperature (SST) and salinity (SSS) were extracted from the nearest (in time) net deployment in either spawning ground.
Prior to ageing the 2014 GoM and MED otoliths, two readers examined ABT otoliths to standardize ageing practices including nomenclature, otolith preparation, increment reads, and best practices for the interpretation of daily increments. Briefly, the protocol examined ~50 ABT sagittal otoliths glued to microscope slides with a compound microscope at 400× to 1000× using immersion oil under transmitted light. Subsequently, the 2014 dataset calibration was conducted independently by two experienced readers at different laboratories that examined the same set of ABT otoliths from each 2014 study area (GoM and MED). Reader-1 examined the otoliths first (Leica DM4 P microscope and LAS X imaging software, Leica-Microsystems), then Reader-2 read the same set of otoliths following the same protocols with (a Zeiss A.1 microscope, Zeiss Microscopy and Image Pro Plus 7 software, Media Cybernetics).
First, sagittal and lapilli otoliths (when possible) were extracted from larval ABT using minutien pins or sharpened glass probes. Otoliths were cleaned of any debris, dried and transferred into one drop of mounting medium (nail lacquer or Flo-Texx™), with the distal side of the sagittal otolith facing up. The otoliths were placed on a microscope slide labeled with the corresponding identifier number. Sagittal otoliths were chosen for ageing because they are the largest. However, for younger and less developed larvae, the sagittae and lapilli resembled each other in shape, size and topography; therefore, the otolith with the larger otolith radius (OR) was designated to be the sagittal otolith when it was not visually apparent. Each read was conducted at least one day apart to avoid reader bias. Age estimates were compared from the left and right sagittae from the same fish to examine possible within-otolith differences for a subset of larvae from each study area. Although previous ageing studies conducted for a variety of fishes found no significant differences between age estimates derived from the left versus the right sagittae (Jenkins and Davis, 1990; Campana, 1999), this comparison had not been done for ABT larval otoliths. The OR was measured from the center of the primordium to the otolith margin at the longest axis (Brothers et al., 1983; García et al., 2013; Malca et al., 2017). An increment was determined to be complete when it was continuous for at least 50% and if the beginning of the subsequent L-zone was visible. Daily otolith increment widths (IW, μm) were measured from the primordium to the end of the D-zone manually along the OR using image analysis software at 1000× magnification.
Age estimations of larval tunas (Thunnus) should consider that the first daily increment is not always equivalent to day-1 of life. An age correction was implemented to account for an optically “diffuse zone” made of a discontinuous region that is not representative of daily growth, yet likely includes otolith accretion prior to the beginning of exogenous feeding (Brothers et al., 1983; Itoh et al., 2000; Watai et al., 2017).
Age corrections were conducted as follows and final age estimates are days posthatch (dph). First, a theoredical otolith size at hatch (hatchrad) was assumed at 7 µm from the center of the primordium. The hatchrad estimate was based on previous ABT otolith reads (n = 403, hatchrad = 7.00 µm ± 0.58, mean ± SD) from “TUNIBAL” surveys conducted in the western MED (Balearic Sea during 2003, 2004, and 2005) reported by García et al. (2013). Second, the radius of the first observed increment (inc1obs) was subtracted from the hatchrad (7 µm) and “predicted” increments (incpred) were added until reaching the radius of the (inc1obs) following two rules: a) the IW of the (incpred) ≤ the IW of the inc1obs, and b) the IW of these initial incpred must be biologically realistic (~1 µm). Lastly, if the IW of the last completed incobs was smaller than the distance between the OR and the last incobs, a terminal incpred was added.
Measurements of precision within reads and between readers were calculated using the coefficient of variation (CV) for dph (Chang, 1982) where each read was either accepted (or excluded) following Table 2. Back-calculated spawning events were calculated by subtracting observed ages (dph) from the day of collection.
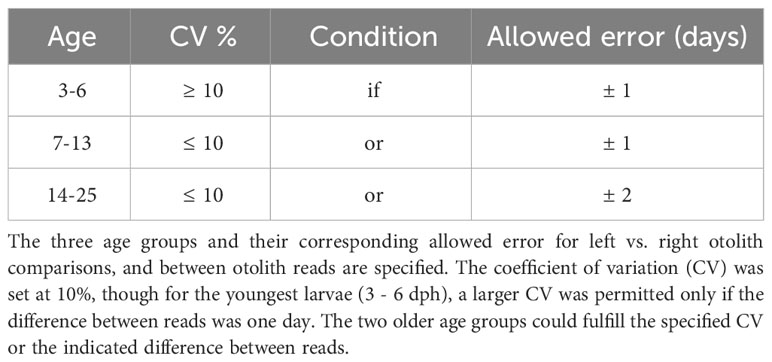
Table 2 Criteria for otolith ageing for Thunnus thynnus between 3 – 25 days post hatch (dph).
Least squares regressions were calculated for best fit of age (dph) at length, OR, and weight (mg). Analyses of covariance (ANCOVA) were carried out using age as a continuous covariate and log-transformed biometric variables when required to meet normality assumptions. Recent otolith growth was calculated as the mean of the last three completed IWs. Individual larval metrics are listed in Supplementary Table 1.
Lastly, IW differences were tested between the two study areas using permutational multivariate analysis of variance (PERMANOVA) in Primer 6 (Anderson, 2001; Clarke and Gorley, 2001; Anderson and Robinson, 2003). Multivariate analyses used Eucledian distance matrices for IW, and significance was tested using permutation. Individual IW were included if that daily total had at least five observations for each increment measured (1-14 dph) from each corresponding study area.
Zooplankton SIA measurements are necessary to interpret larval SIA data. Small zooplankton fractions were collected using a Bongo net (20-cm diameter, hereafter, bongo-20) fitted with 0.05- and 0.2 –mm mesh nets to target small (50-200 µm) and large (>200 µm) sizes of zooplankton. These zooplankton fractions have been utilized in previous studies (Laiz-Carrión et al., 2015; Laiz-Carrión et al., 2019; Quintanilla et al., 2020) as a proxy of prey for larval fishes. In the MED, the bongo-20 was attached to the bongo-90 and was towed concurrently. In the GoM, a separate tow was carried out for ~5 minutes from 0 to 10 m in an undulating manner and towed at least once during local daytime and nighttime throughout the survey immediately following the bongo-90 tow. In both surveys, the bongo-20 was fitted with a flowmeter to calculate volume of water filtered (m3), consistent with the bongo-90 sampling procedures mentioned above. Both nets were fractioned through a 0.2-mm mesh sieve to exclude any larger plankton. All zooplankton was frozen at -20 °C at sea. Dry weights (nearest 1 µg) of small and large (microzooplankton and mesozooplankton, hereafter) were measured in the laboratory and standardized to mg m-3 by dividing with the volume filtered by each net.
ABT larvae selected for ageing were also analyzed for SIA. After extracting otoliths, larvae were dehydrated in a freeze dryer for 24 h and then dry weighed (mg). Next, the stomachs were removed and the remaining larval tissues were packed in tin vials (0.03 ml). Natural abundance of δ15N and δ13C were measured using an isotope-ratio spectrometer (Thermo-Finnigan Delta-plus) coupled to an elemental analyzer (FlashEA1112 Thermo-Finnigan) at the Instrumental Unit of Analysis of the University of Coruña. Ratios of 15N/14N and 13C/12C were expressed in conventional delta notation (δ), relative to the international standard, Atmospheric Air (N2) and Pee-Dee Belemnite (PDB) respectively, using acetanilide as standard (Fry, 2006). A lipid content correction was applied to the δ13C values used for this species following Laiz-Carrión et al. (2015) and hereafter, δ13C refers to lipid-corrected values.
Trophic position (TP) estimates were calculated only for postflexion larvae to avoid artificial enrichment provided by the ABT maternal influence on the δ15N values as reported by Uriarte et al. (2016):
δ15Nlarva are the isotopic signatures for individual ABT larvae and δ15Nmicrozoo are the isotopic values of microzooplankton of the same or closest station to larval collection. TPbasal is the base consumer trophic position represented by the microzooplankton (0.05 - 0.2 mm), which consisted of primary producers and primary consumers, and has a designated value of 2 (Coll et al., 2006; Bode et al., 2007; Laiz-Carrión et al., 2015; Quezada-Romegialli et al., 2018; Laiz-Carrión et al., 2019). The mean value of 1.46 ‰ (parts per thousand) was used as an experimental nitrogen isotopic discrimination factor for (Δ15N) proposed by Varela et al. (2012) for ABT juveniles.
Isotopic niche analyses followed Laiz-Carrión et al. (2019). Briefly, standard ellipse areas were calculated using the variance and covariance of δ13C and δ15N values with a sample-size correction following (Jackson et al., 2011; Jackson et al., 2012). The overlap of these sample-size-corrected standard ellipse areas (SEA) provides an estimate of the isotopic niche overlap. In this study, this approach compared overlap between postflexion ABT larvae from the GoM and MED. Isotopic niche widths and overlap analyses were conducted using the R package SIBER (stable isotope Bayesian ellipses in R) v.3.3.0 (Jackson et al., 2011; R Core Team, 2022).
This study explored the effect of several biotic and abiotic variables on recent otolith growth using generalized additive models (GAMs) with a Gaussian distribution. GAMs are non-parametric flexible models that allow researchers to fit linear and nonlinear relationships between the explanatory and response variables within the same environment (Wood, 2004; Wood, 2017). All models were estimated using the mgcv library in R (R Core Team, 2022) and variables are listed in Table 3. Three GAMs were estimated, one for all postflexion ABT larvae, and two region-specific models because some variables were unavailable for both spawning areas. The residuals of recent growth at age (Rg) was the dependent variable for the subset of larvae (n=68) with all considered metrics measured (see Table 3). In addition, larval abundances and hydrographic variables were included in the model selection process. To account for multi-collinearity, correlations (Spearman’s correlation matrix, ρ > 0.6) between all potential explanatory variables were identified and strongly correlated variables were modeled against the response in single-variable GAMs. The Akaike Information Criterion (AIC, Akaike, 1974) of the single-variable GAMs were compared between correlated variable pairs, and the variable with the lowest AIC was included in the final model selection process. After the set of non-correlated explanatory variables was identified, overall multi-collinearity was assessed using the variance inflation factor (VIF) with three as a cutoff. Smoothing functions were applied to continuous predictor variables restricted to four knots to avoid overfitting.
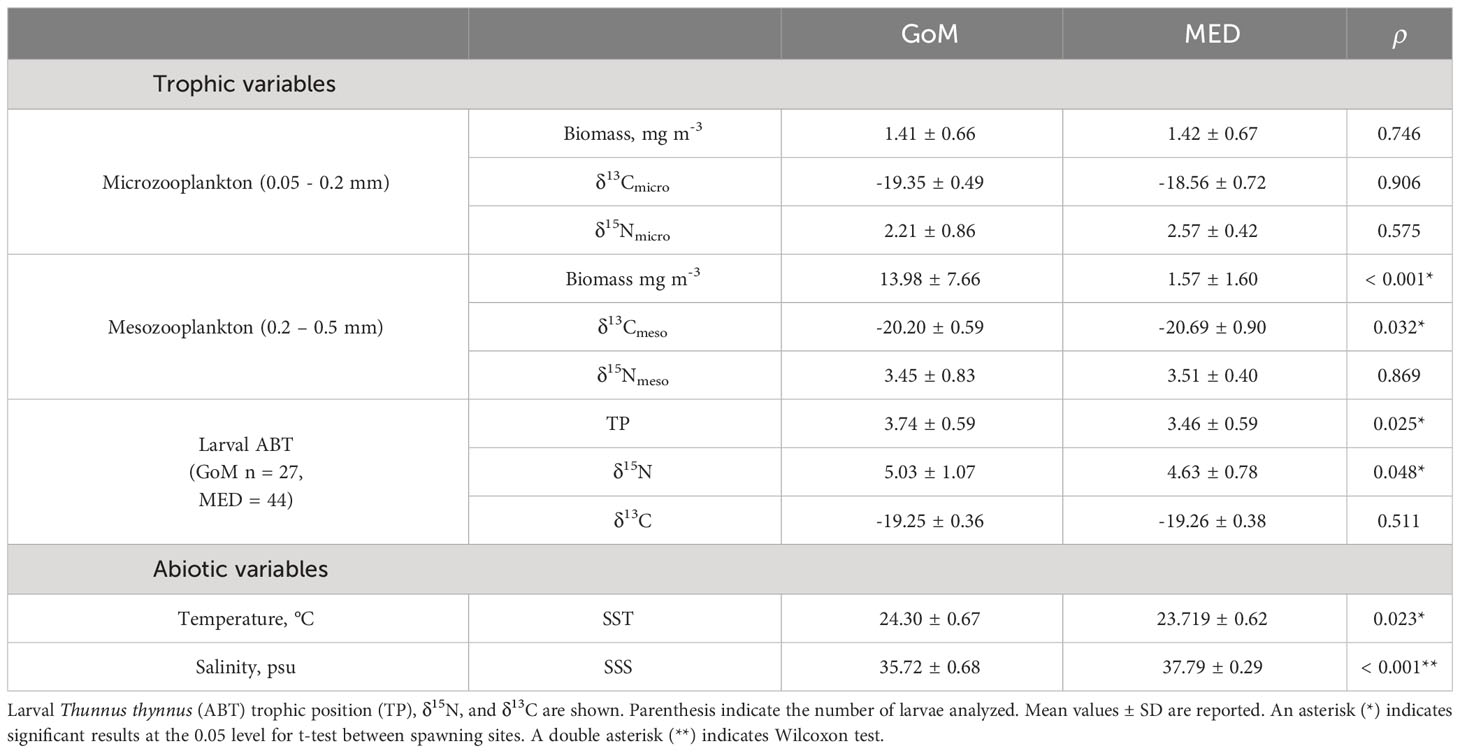
Table 3 Trophic and environmental variable summary for the Gulf of Mexico (GoM) and Mediterranean Sea (MED) during the 2014 spawning season.
To select a final model, several factors were considered. First, the restricted maximum likelihood (REML) method was used as it applies a double penalty to smooth terms and allows for removal of variables with minor predictive values (Marra and Wood, 2011). Second, model diagnostics and residuals were checked for potential deviations from normality and homogeneity of variance, and finally, smooth plots were examined for ecological context prior to final model selections.
In the GoM sporadic but positive catches began on 3 May up until 30 May 2014 as sampling advanced from east to west and then towards the northeast, with 50 stations completed in the east and 27 stations completed in the west (using 90° W to divide the GoM), see Figure 1B. Positive ABT catches occurred when SST exceeded 22.24 °C, up to a maximum of 26.55 °C. In the MED, ABT positive catches were mostly from a relatively small geographic region (~90 km2) located to the south of the Balearic Islands (Figure 1A). The MED survey collected ABT larvae for a total of 15 days beginning on 18 June 2014, when mean daily SST approached 23 °C.
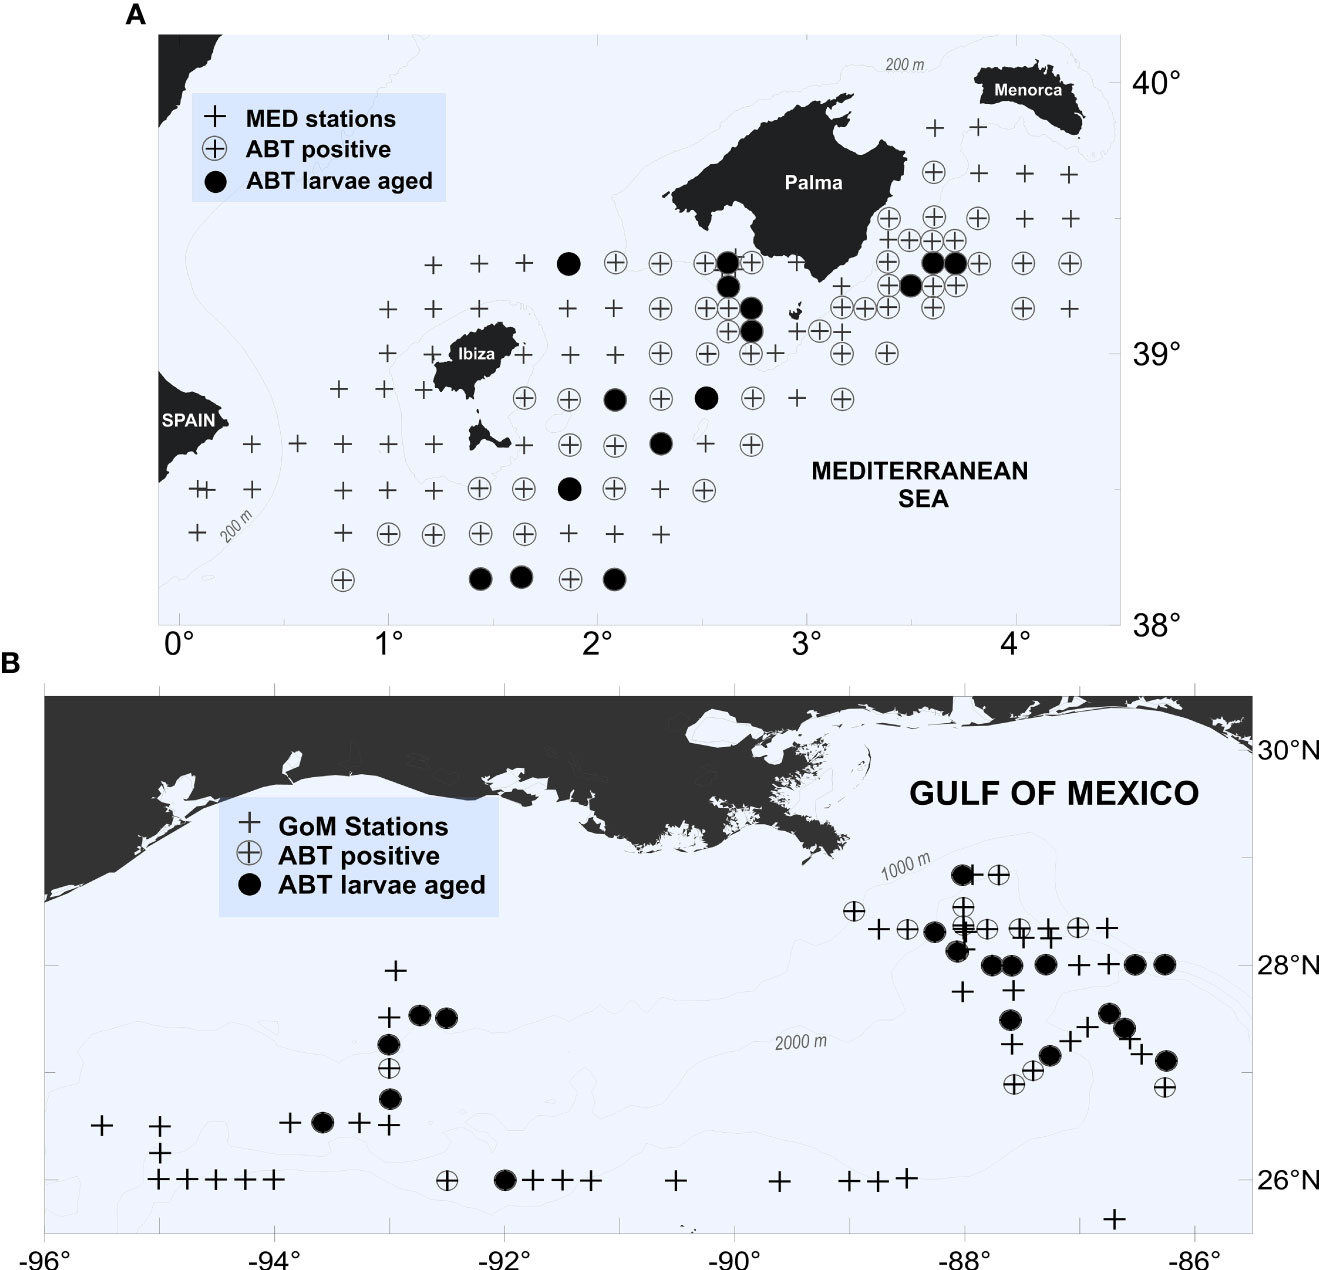
Figure 1 Station locations, presence/absence, and location of aged larval bluefin tuna (Thunnus thynnus) from (A) western Mediterranean (MED) and (B) Gulf of Mexico (GoM) during the 2014 spawning season.
Larval ABT catches were highly variable and significantly different (Wilcoxon, ρ< 0.05) between spawning areas (see Table 4). ABT abundances (ind. 1000-1 m-3) were almost 1.5 orders of magnitude lower in the GoM than in the MED. There was only one station in the northern GoM with > 100 ind. 1000-1 m-3. There was no observed relationship between scombrid abundances and ABT abundances in the GoM stations (not shown). The MED abundances for ABT were 603 ind. 1000 -1 m-3, with five stations having > 1000 ind. 1000-1 m-3 and there was also no observed relationship between overall larval fish abundance and ABT abundance, however there was a significant correlation between combined scombrid abundance and ABT abundance (r(12) = 0.99, ρ< 0.05) in the MED. In the five most ABT-abundant stations, ABT dominated the larval fish assemblage (See Supplementary Figure 1).
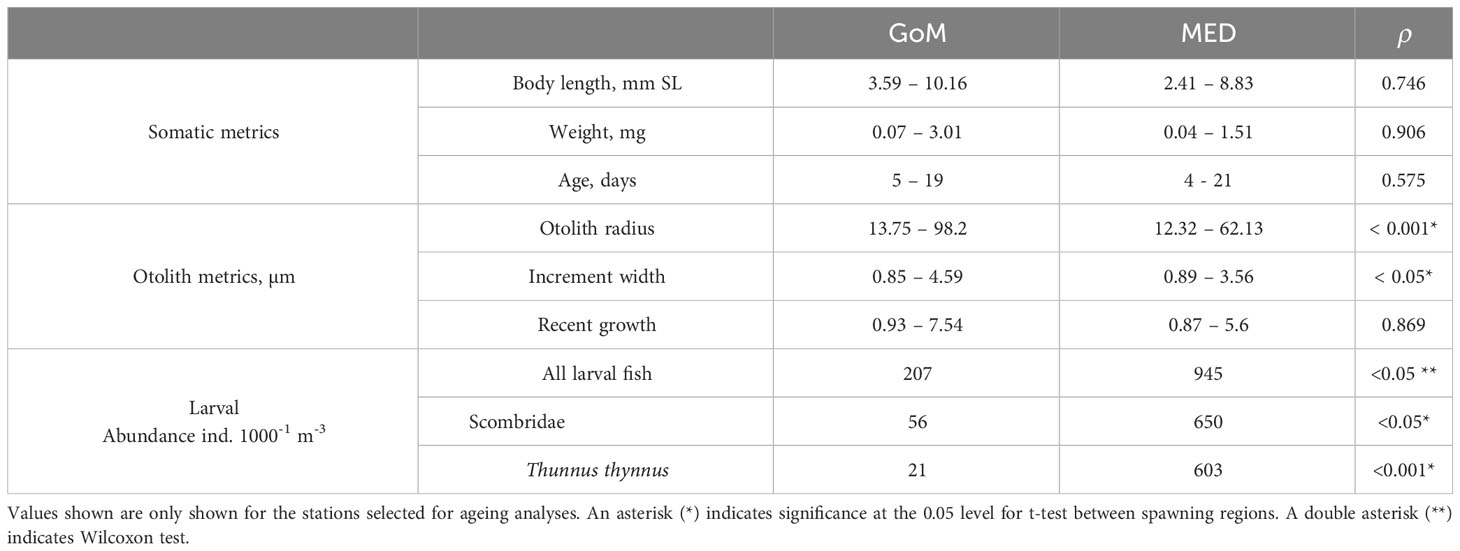
Table 4 Summary of somatic, otolith metrics, and mean ABT larval abundance (1000-1 m-3) for the Gulf of Mexico (GoM) and Mediterranean Sea (MED) during the 2014 spawning season.
Larval somatic metrics were similar between spawning grounds for BL and DW distribution (Figure 2; Table 4). Lengths were not significantly different between spawning areas (t-test, ρ > 0.05, Figure 2, see Supplementary Table 1 for individual larval metrics). Larger larvae were less abundant in both spawning areas. Larval ABT weights were also higher for the GoM (0.45 ± 0.4 vs. 0.39 ± 0.3), however the MED had nine larvae at ages 17-21 dph compared to the GoM (n = 2) (Figure 3). The least squares regressions for age-at-length residuals vs. OR-at-age residuals between spawning areas suggest that despite some differences between them, somatic growth was relative to otolith growth and can be compared (see Supplementary Figure 2).
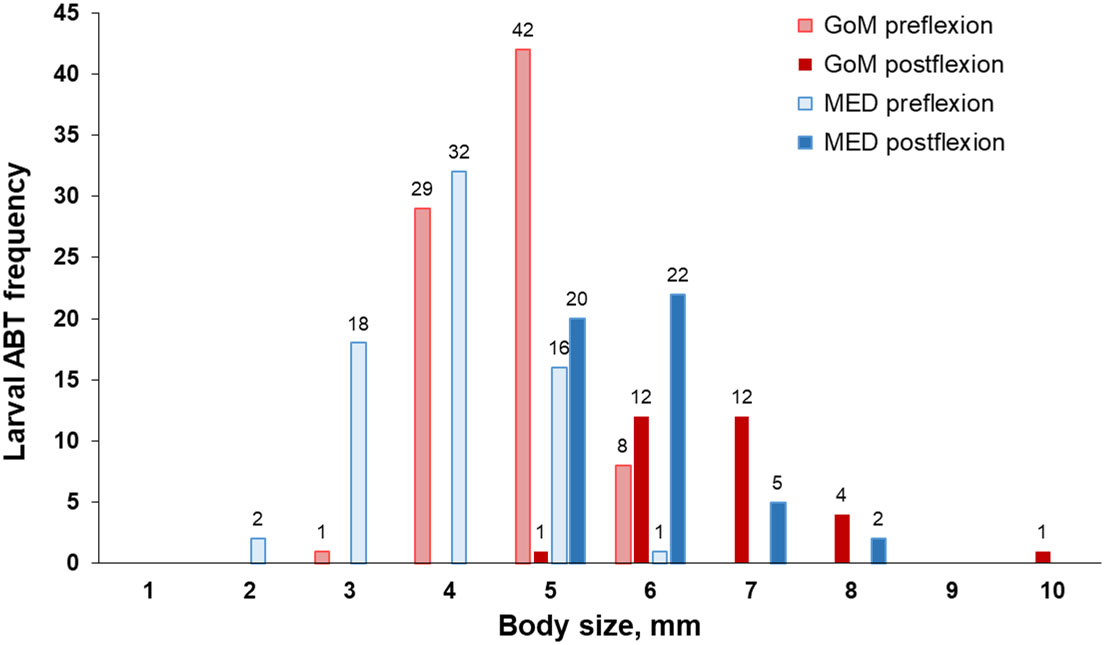
Figure 2 Histograms of body size (mm) for aged larval Thunnus thynnus otoliths from the Gulf of Mexico (GoM, n = 111) and the western Mediterranean Sea (MED, n = 118). Preflexion and postflexion larval stages are also specified. Numbers above bars indicate the number of larvae grouped at 1-mm intervals.
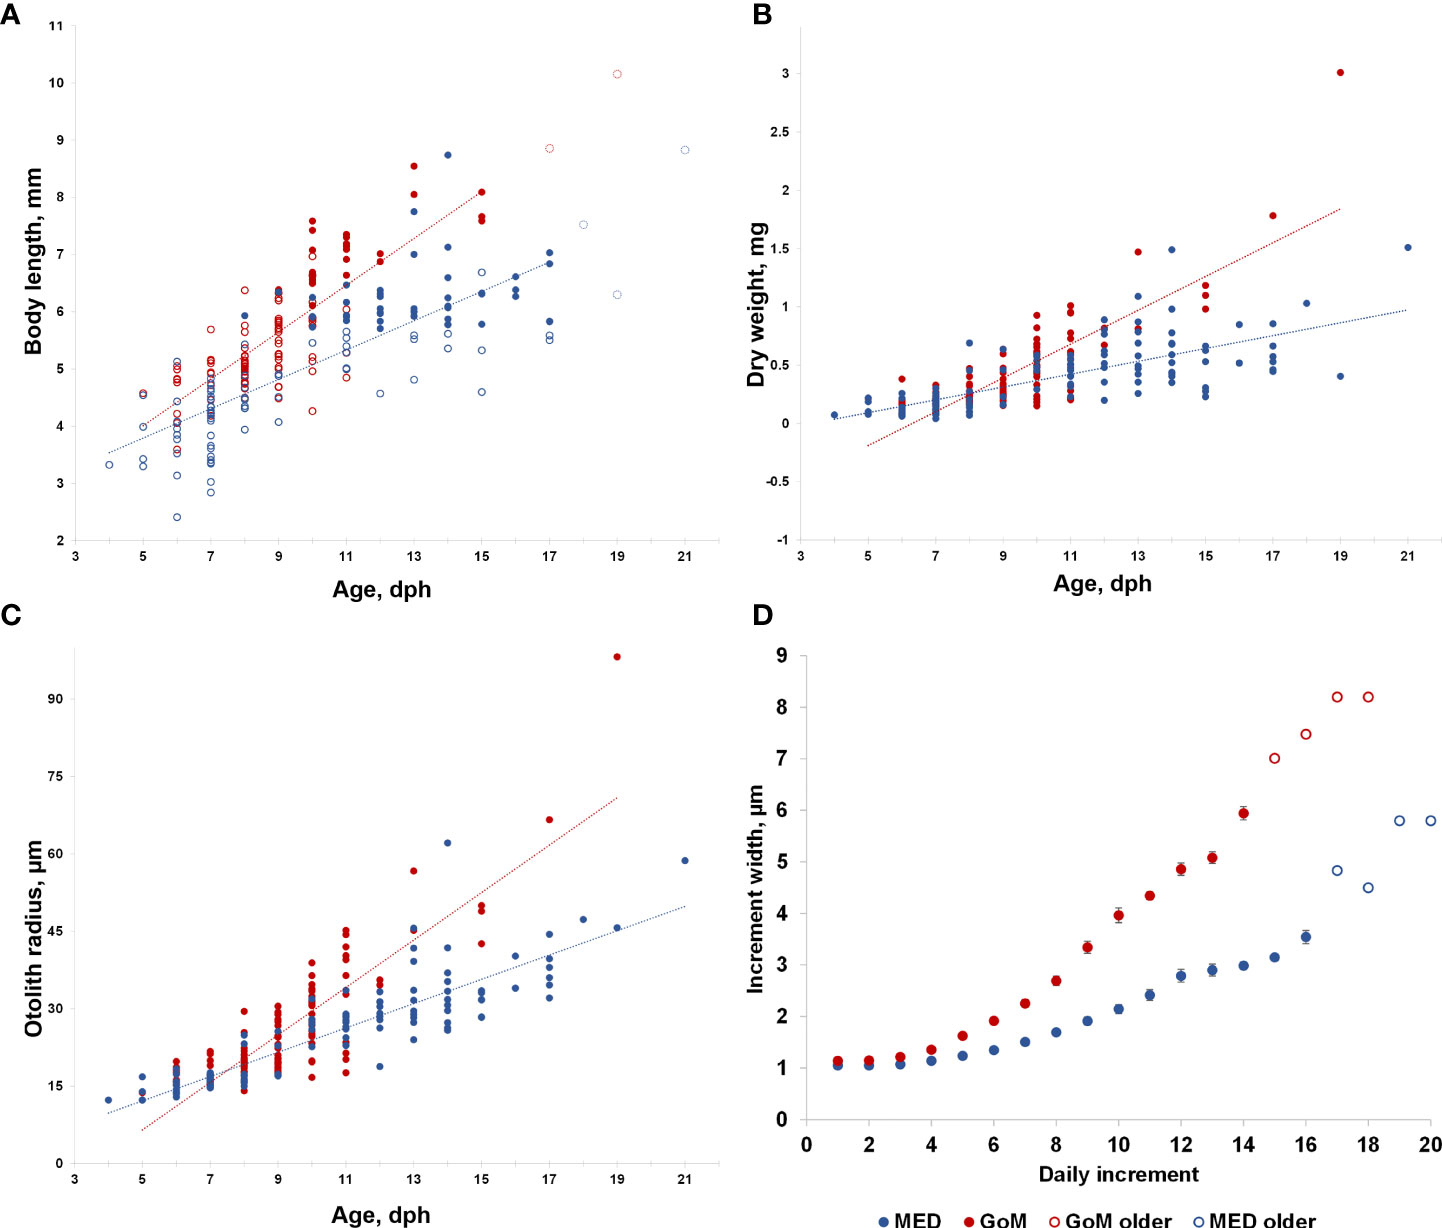
Figure 3 (A) Age at length, (B) age at body weight, and (C) age at otolith radius, µm for 228 larval bluefin tuna (Thunnus thynnus) aged from the Mediterranean Sea (MED) and Gulf of Mexico (GoM) during the 2014 spawning season. The dotted lines are the least squares regressions in the linear form (y = m + b) indicated in A (GoM: m = 0.409, b = 1.963, r2 = 0.592, MED: m = 0.256, b = 2.514, r2 = 0.611), B (GoM: m = 0.145, b = −0.914, r2 = 0.682, MED: m = 0.055, b = −0.184, r2 = 0.517), and C excluding the oldest larvae with open dotted symbols which indicate < 2 observations at each given age. For panel A, developmental stages (preflexion and postflexion) are indicated with an open symbol (blue and red, respectively). (D) Mean values for all observed daily increment widths at-age for the corresponding larvae for each spawning grounds, with standard error bars; open symbols indicate < five observations at each given age.
Larval growth rates were much larger for GoM when compared to the MED (0.41 vs. 0.26 mm SL d-1, Figure 3A) as well as for age-at-DW (0.14 vs. 0.06, Figure 3B). Among the otolith biometrics, similar trends were observed between populations with greater age-at-OR and age-at-IW (Figures 3C, D). A linear relationship best explained the age-at-length data and the least squares regression for the growth curves (Figure 3A). Significant differences (ANCOVA, ρ< 0.001) were found between the somatic and otolith metrics analyzed between the GoM and MED with the GoM having larger otoliths, yet the MED had larger mean IW (Figures 3C, D). IW were significantly different between the GoM and MED (PERMANOVA, F1, 13 = 620.07, ρ = 0.001). Pairwise PERMANOVA indicated that IW were significantly different during 1-14 dph (ρ< 0.001). Although older larvae were aged, insufficient observations at each day (n< 5) were not observed for 15-17 dph. GoM larvae had larger IWs at the same age throughout ontogeny, for example, a mean IW of 3 µm was reached at ~9 dph for GoM ABT larvae, while the MED reached mean IW of 3 µm at ~12 dph. Mean overall recent growth did not differ between spawning areas (t-test, ρ > 0.05 with 2.55 ± 1.25 GoM, 2.16 ± 1.01 MED), but GoM larvae had larger recent growth-at-age (> 10% for larvae 6 dph up until 15 dph).
Back-calculated spawning took place throughout the sampling period in both spawning areas yet developmental stages were unevenly represented (Figure 2), with preflexion fish dominating (64%) catches in both spawning grounds. Postflexion larvae ranged from 5.71 to 10.16 mm. In the GoM, seven flexion stage larvae ranged from 6.11 to 7.08 mm, and they overlapped in size with preflexion and postflexion larvae.
Sea surface temperature and salinity differed between spawning grounds (t-test, ρ > 0.05 and Wilcoxon test, ρ > 0.05 respectively with the GoM being on average 0.61°C warmer than the MED. Overall, salinity values were much higher in the MED when compared to the GoM (mean salinities: 37.81 vs. 35.67) and did not overlap at all (Table 3). These two variables were considered when examining growth variability in the GAM modeling approach.
The within-otolith comparisons (left vs. right otolith) between reader-1 and reader-2 yielded no significant differences between daily age increments derived by either reader independently (Table 5). Individual otolith reads from this subset of the full ageing dataset (~40%) were significantly and positively correlated, first between the two reads conducted by each reader, and again when comparing between readers (ρ > 0.05, r = 0.98 and r = 0.99, respectively). Reader-1 aged left and right otoliths for 77 ABT (32 from the GoM and 45 from the MED) while reader-2 aged 75 ABT (35 from the GoM and 40 from the MED). This otolith-calibration exercise concluded that reads from left and right sagittal otoliths were comparable.
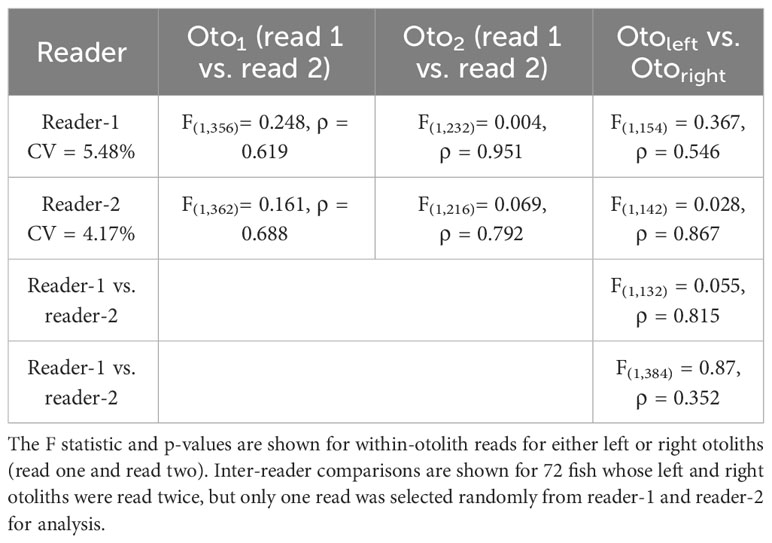
Table 5 Summary of ANCOVA for age comparisons derived from Atlantic bluefin tuna larval otoliths (Oto) from the 2014 spawning season in the Gulf of Mexico and Mediterranean Sea.
In total, 1,186 otolith reads were generated by both readers and no significant differences (ANCOVA, ρ > 0.05) were found between the age-estimates derived by either reader independently (Table 5). Reader-1 aged 115 and 106 otoliths from the GoM and MED respectively, while reader-2 aged 112 and 106, respectively. The precision of reads generated by both readers was ~5% CV (Table 5). Finally, for all otolith reads that passed the ageing criteria, one randomly selected read represented the otolith for subsequent analysis. A total of 2.8% of all reads did not pass the established protocols in Table 2 because they were either physically damaged, had microscopy-related artifacts, and/or were simply unable to be interpreted consistently by either reader. For reader-1, seven GoM and ten MED otoliths did not pass the ageing protocol, while for reader-2, seven GoM and seven MED failed the protocol. When this was the case, those reads were not considered for random selection of the representing otolith read. However, none of the otoliths were discarded because if one of the reads passed the protocols, the otolith was allowed to remain in the dataset.
Mean age corrections were 3.01 ± 0.95 (mean ± SD) and include incpred from the otolith “diffuse zone” (2.8 ± 0.89) as well as terminal increments added. Terminal increments were added to larvae from all ages, but were more frequent for older larvae (> 12 dph) from the GoM. One terminal increment was added to 83 GoM reads and to 50 MED reads by readers, while only two instances were recorded in which two terminal increments were added to an otolith read.
Zooplankton were analyzed for the subset of stations that coincided with aged ABT larvae from each spawning region (See Supplementary Table 1 for geographic position of zooplankton net tows from ABT positive stations). For example, although the bongo-20 was towed 36 times in the GoM, only 12 stations’ zooplankton parameters are represented in this study. Similarly, in the MED, 10 stations are represented in this study. Microzooplankton was similar between regions for biomass, δ13C, and δ15N values (Table 3). The δ15Nmicro were the most depleted values when compared to mesozooplankton and to larval ABT δ15N values in both regions (Figures 4A, B), thus permitting the use of the microzooplankton fraction as the isotopic baseline of the food chain in each respective ecosystem. The δ13Cmicro were lower in the GoM when compared to the MED, however values overlapped with larval δ13CABT. Mesozooplankton biomass was significantly different between regions (t-test, ρ< 0.001), with the GoM having nine times more mesozooplankton biomass (mg m-3). Although, δ13Cmeso was significantly different (ρ< 0.05), the ranges overlapped between regions. In contrast, δ15Nmeso did not differ between regions (ρ > 0.05).
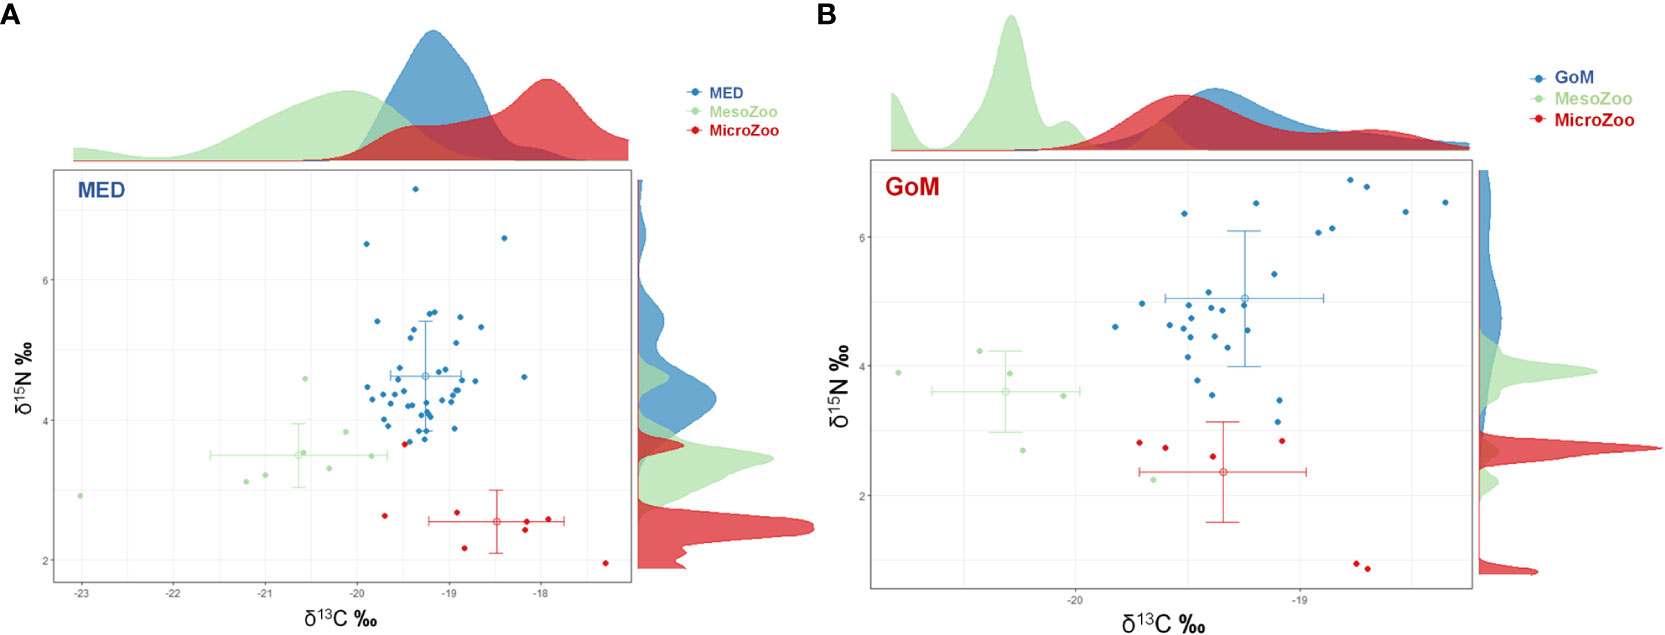
Figure 4 Biplot of δ15N and δ13C and standard deviation for Atlantic bluefin tuna (ABT) larvae and their potential prey in the (A) Gulf of Mexico (GoM) and (B) Mediterranean Sea (MED) during the 2014 spawning season. Postflexion ABT are shown in blue symbols, microzooplankton (0.05 – 0.2 mm) in red symbols, and mesozooplankton (0.2 – 0.5 mm) in green. Corresponding distributions for ABT, microzooplankton, and mesozooplankton are shown for each variable along the corresponding axes.
The stable isotope signatures for all larvae (preflexion and postflexion ABT combined) yielded no statistically significant differences between δ15N and δ13C between the GoM and MED, (ρ > 0.05, Table 3). Overall, the youngest larvae had the larger δ15N values, particularly for the MED larvae. In the MED, the δ15N values followed a parabolic trend, with younger larvae (4 - 6 dph) starting out with high δ15N (> 7‰) that decreased to on average ~5‰ and increased again to ~5.5‰ for the oldest larvae (17 - 21 dph). The youngest larvae in the GoM (5 - 6 dph) also started out with relatively lower δ15N values (~5.8‰) and although these values also decreased, the increase observed for the MED was not observed in the GoM cohort analyzed.
When excluding preflexion larvae, postflexion stages from the GoM were significantly higher (ρ< 0.05) for both δ15N values (Figure 4) and TP when compared to the MED (Table 3). The ranges for δ13CABT values were similar between regions (Figure 4; Table 3) with different trends within each spawning area. In addition, TP was significantly different (ρ< 0.05) and higher at-age for GoM postflexion larvae when compared to the MED, however, within the GoM, TP was highly variable. For example, larval recent growthlog decreased with age for GoM larvae, while the opposite was observed for MED larvae (Figure 5A). In the GoM, despite a 15% narrower range of δ13CABT values when compared to the MED, δ13CABT values increased with larval BL (and age) (ρ< 0.05) yet recent growthlog was similar (Figure 5B). In the MED, δ13C did not have an association with larval BL or recent growthlog (Figure 5B). However, within each of the spawning areas, δ13CABT values had statistically significant associations with larval ontogeny.
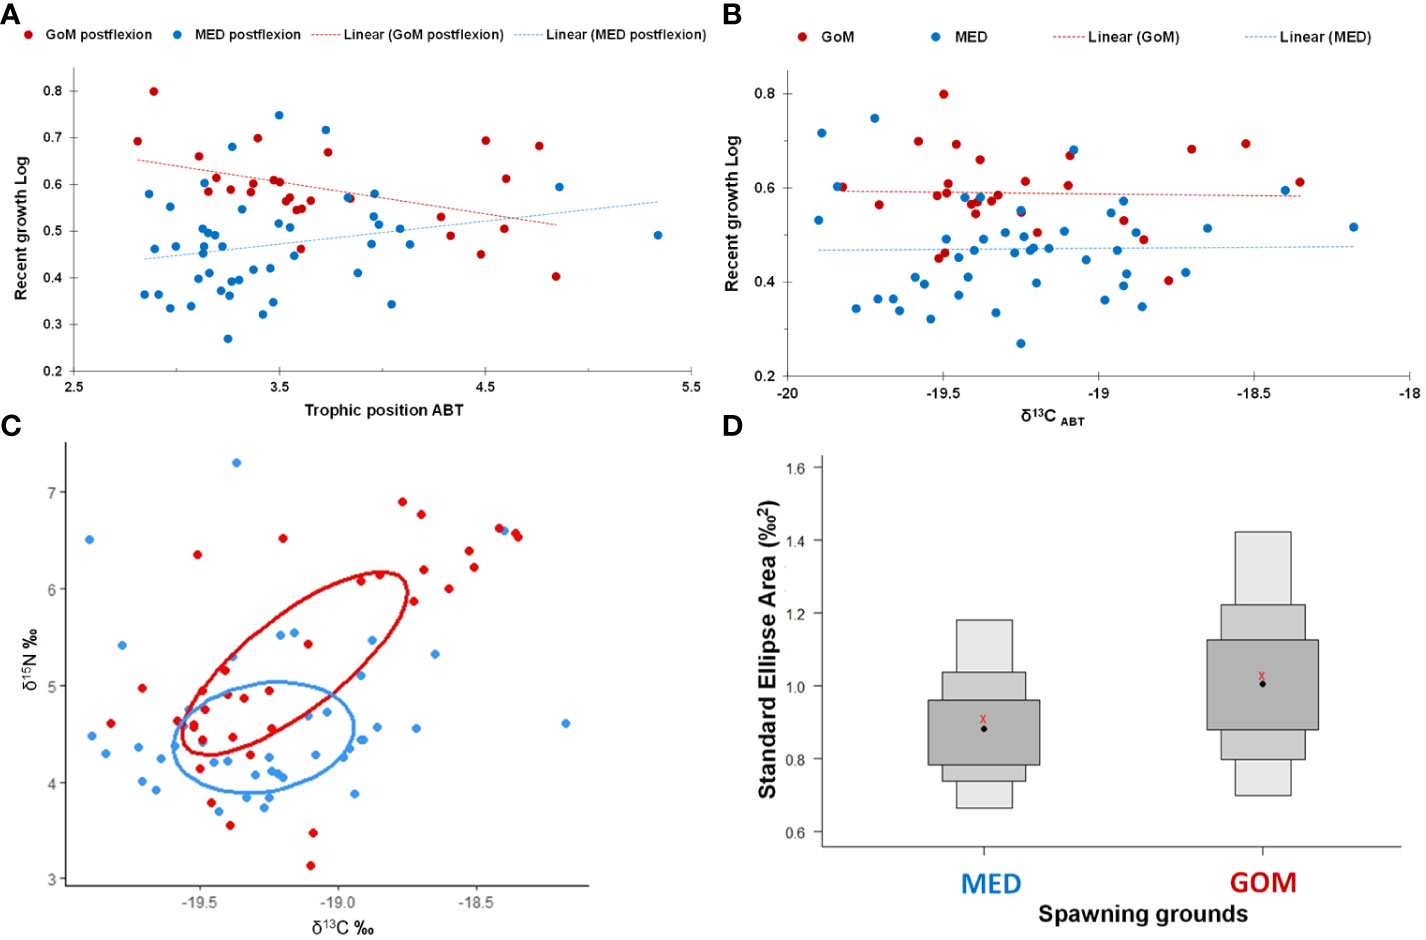
Figure 5 Trophic results for postflexion larval Thunnus thynnus (ABT) from the Gulf of Mexico (GoM, red symbols) and the Mediterranean Sea (MED, blue symbols) during the 2014 spawning season: (A) estimated trophic position (TPABT); (B) δ13CABT vs. observed recent otolith growth (µm, log-transformed); (C) scatter biplot of δ15N and δ13C with ellipses that represent the isotopic niche width for each region; and, (D) Boxplot of the standard ellipse area (SEAB) for the trophic niche of each region. Boxplot shows the confidence intervals of the SEAB corresponding to 95%, 75% and 50%. The red symbols (x) indicate the mean value for each population analyzed.
Isotopic niche widths differed for larval ABT from the GoM when compared to the MED with wider standard ellipse areas (SEAc) in the GoM (Figures 5C, D). Trophic niche widths were 1.05‰ and 0.93‰ for the GoM and MED, respectively. There was a 62.3% trophic niche overlap between regions (Figure 5C) with the GoM’s width ~11% larger than the MED.
Among the variables examined, one of the trophic variables (TP, δ15NABT, or δ15Nmesozoo) was consistently selected in all best-performing GAMs (Table 6). For the combined GoM and MED postflexion larvae, the model with the highest explanatory power (57.2% variance explained) included three variables: OR, δ15NABT, and δ15Nmesozoo (Figure 6; Table 6). The most important explanatory variable was OR (48% and 26.8%, respectively) which had a positive, although non-linear association with recent growth (Figure 6A). In the best model, the second most important variable, δ15NABT explained 36% of the variance while it had a negative association with recent growth (Figure 6B). Lastly, δ15Nmesozoo explained 27.7% of the variance and it had a positive association recent growth (Figure 6C).
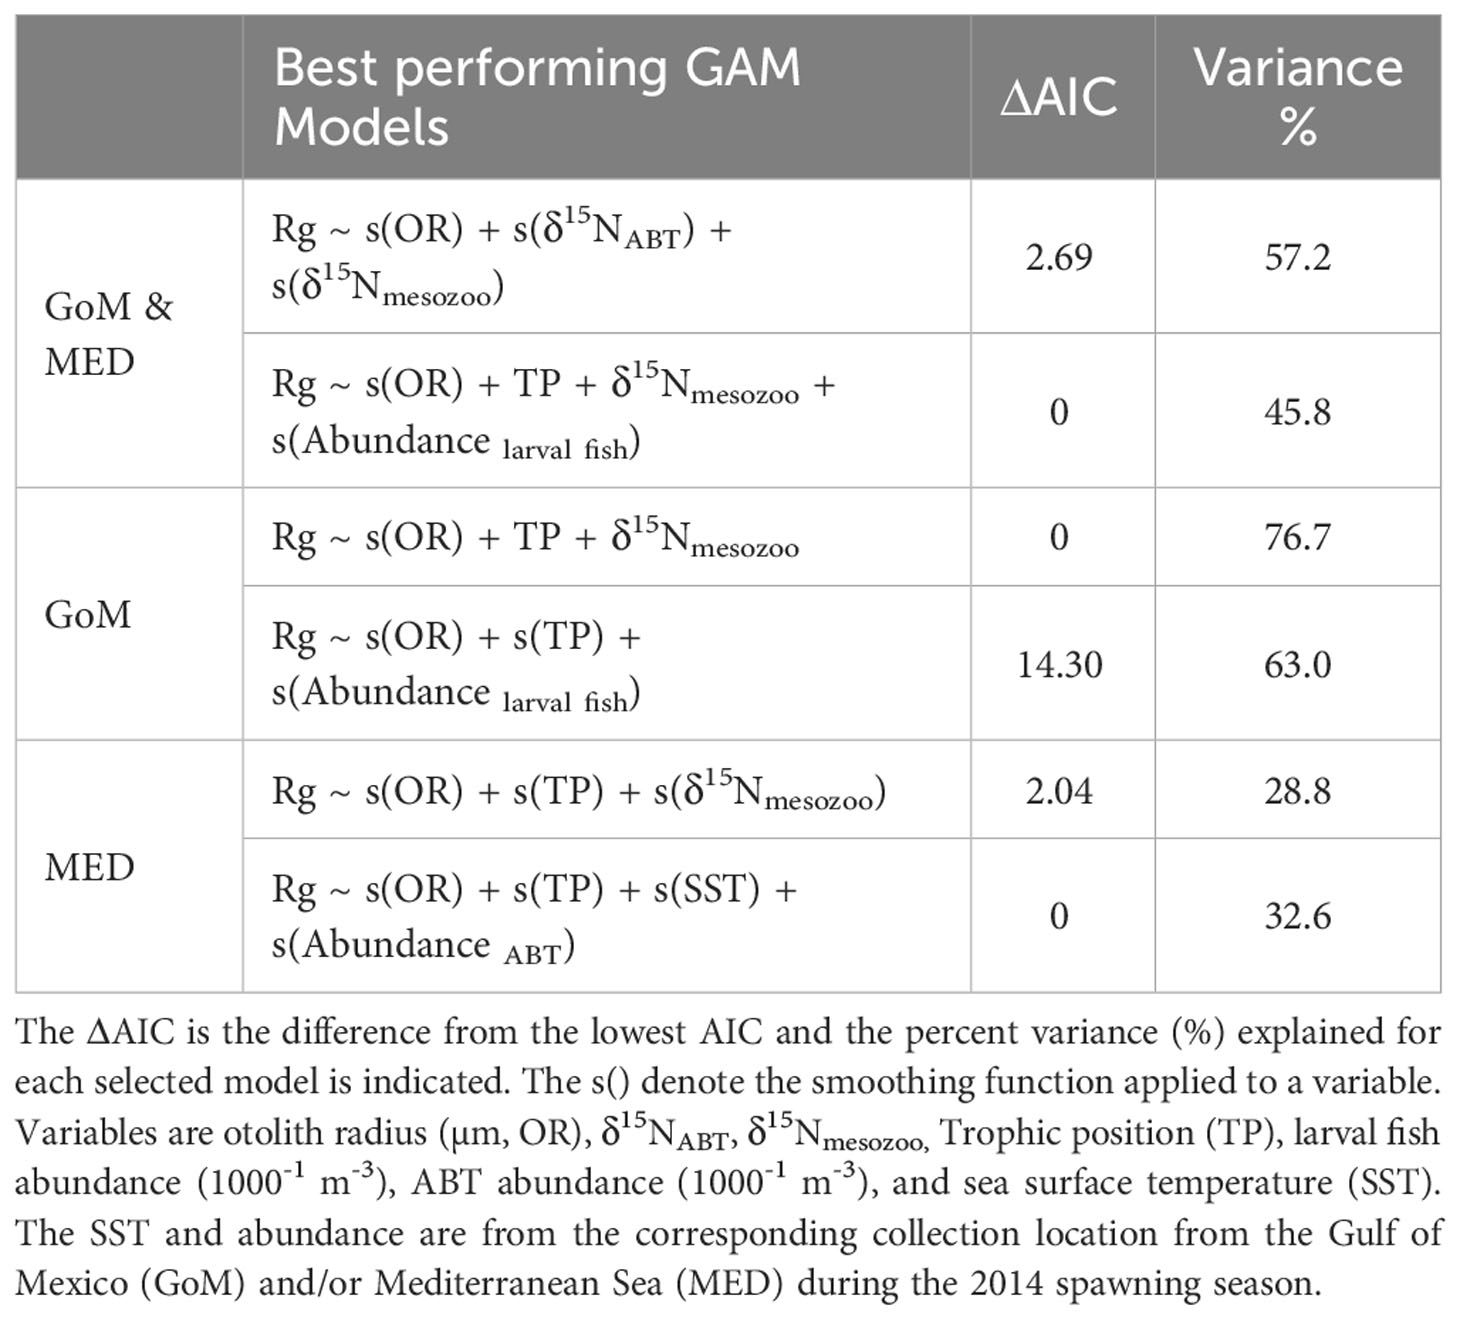
Table 6 Akaike information criterion (AIC) for the best-performing generalized additive models (GAMs) for the residuals of recent growth at-age (Rg) for postflexion larval Thunnus thynnus (ABT).

Figure 6 Selected model results of the partial effect of (A) otolith radius, µm, (B) δ15NABT, and (C) δ15Nmesozoo on the average width of the last three daily increments (µm) (recent growth at-age residuals) of postflexion ABT. The model’s AIC = 110.64, while deviance explained was 57.2%. The dashed lines indicate 95% confidence intervals. The whiskers on the x-axis indicate observations for that covariate. All covariates have statistical significance at the 0.05 level.
The best-performing model for the GoM included three variables that significantly explained the majority of the recent growth variance (76.7%): δ15Nmesozoo, OR, and TP. These variables explained 33.3%, 27%, and 14.8% of the variance, respectively (Figures 7A-C). In the second-best model, OR, TP and larval fish abundance explained 8%, 8%, 5.5% of the variance, respectively. Next, OR had a positive association with recent growth. The abundance of larval fish had a positive association with recent growth, and although it improved the model fit, it was not a significant influence.
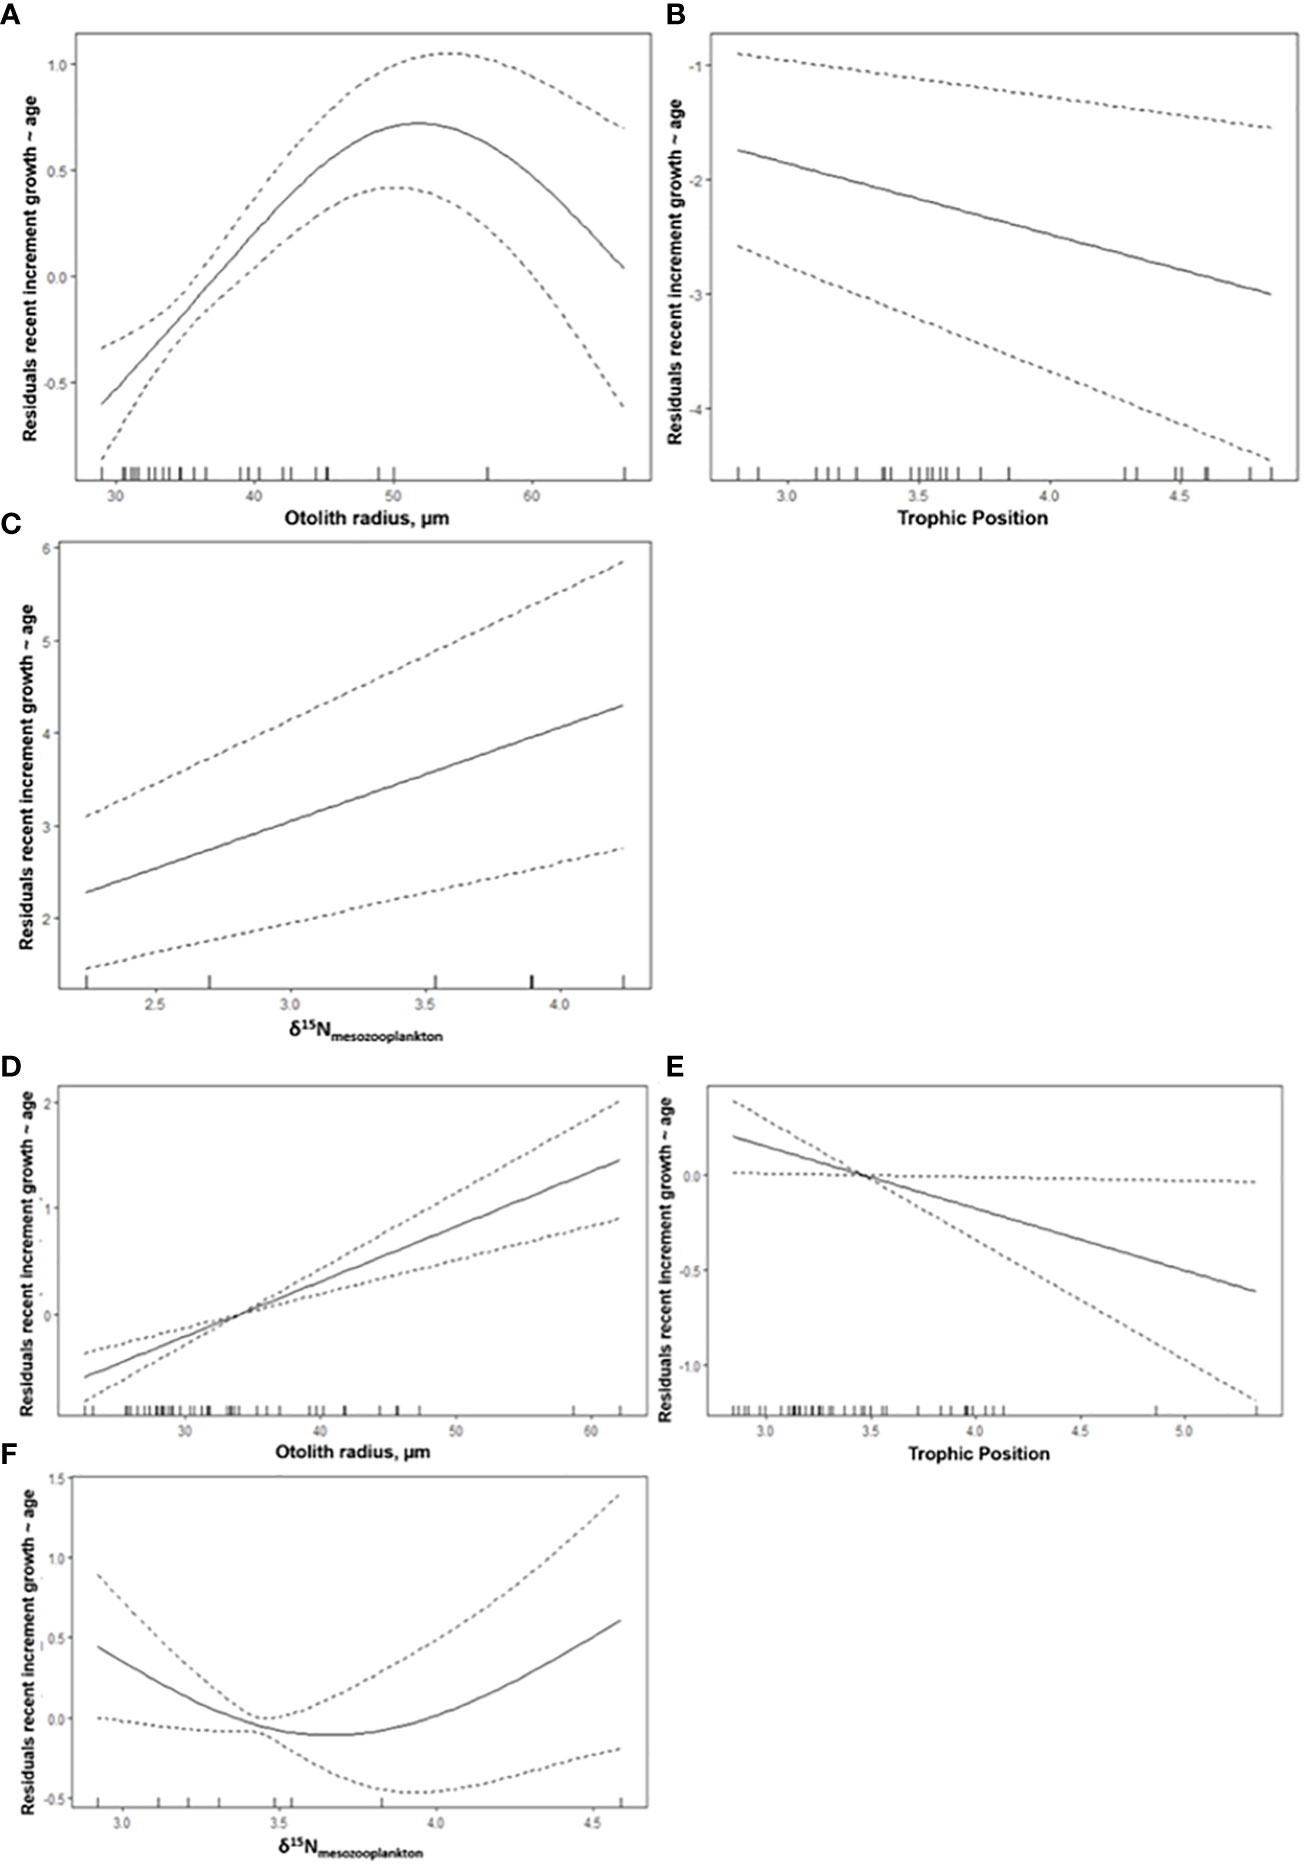
Figure 7 Selected model results of the partial effect of (A, E) otolith radius, µm, (B, E) trophic position and (C, F) larval fish abundance (1000-1 m-3) for the Gulf of Mexico (GoM, n=27) spawning region (A-C) and the western Mediterranean Sea (MED, n=44) (D-F). The response variable is the average width of the last three daily increments (µm), recent growth at-age residual for postflexion Thunnus thynnus. The dashed lines indicate 95% confidence intervals. The whiskers on x-axis indicate observations for that covariate. All covariates have statistical significance at the 0.05 level.
The best-performing model for the MED included the same variables as for the GoM’s best-performing model. However, OR, δ15Nmesozoo, and TP together only explained 28.8% of the variance (Table 6). In the second-best model, SST explained 10.9% of the variance, while ABT abundance did not have explanatory power. Temperature had a negative association with recent growth, however it appears that overfitting occurred as half of the larvae were sourced from the same MED station with SST at 24.4°C, while eight larvae were from a station with 23.1°C.
In the MED, ABT abundance (1000-1 m-3) increased with recent growth, but its influence on recent growth was not statistically significant (ρ > 0.05). This variable should fall out of the model, however when it was removed, the overall variance explained fell to 26.6% and the model’s performance decreased (AIC marginally increased ~2 points). Consequently, ABT abundance was retained in the second-best MED model.
Otolith-derived metrics inform fisheries stock assessments and are used to back-calculate spawning sites and times (Richardson et al., 2016; Russo et al., 2022), estimate survival and recruitment (Sponaugle, 2010; Gleiber et al., 2020b), as well as examine spatiotemporal dynamics (Campana, 1999). Understanding the early life history dynamics of bluefin tuna spawning grounds is crucial for effective and adaptive management (Satoh et al., 2008; Watai et al., 2017). This study is among the first to use larvae collected during the same spawning season (2014) from the GoM and MED to standardize methodologies, compare larval growth, and relate SIA with growth using GAMs in the two main ABT spawning areas. Larval growth was comparatively faster for the GoM, but there were fluctuating relationships between recent somatic growth and trophic variables. Furthermore, specific trophic characteristics (δ15N, TP and δ15Nmesozoo) consistently explained recent larval growth variance. Finally, for the first time, evidence of a density-dependent association between larval fish, ABT abundances and larval growth are also discussed.
Adult ABT forage in North Atlantic feeding grounds during the spring bloom (Block et al., 2005). Tagging, otolith chemistry, and genomics (Block et al., 2005; Rooker et al., 2007; Rodríguez-Ezpeleta et al., 2019) indicate that after feeding, ABT begin the long- distance migration to their respective spawning areas. Thermodynamics combined with the timing of ABT arrival into adequate spawning habitat limits the reproductive seasons to ~2 months, with tagged adults returning to feeding grounds approximately in July and August for the GoM and MED, respectively (Block et al., 2005; Wilson et al., 2015). Given this relatively short spawning window when compared to tropical tunas that spawn ~6 months (Muhling et al., 2017), every day of the spawning season contributes towards successful fertilization and subsequent larval survival (Muhling et al., 2017). While the MED survey sampled approximately ~90 km2 of the Balearic archipelago, the GoM survey sampled an extensive portion of the northern GoM (Figures 1A, B), and yet the catches were very different (Supplementary Figure 1).
Larval distribution and abundance differed significantly in 2014 between the two spawning areas (Table 4). In the MED, larval ABT catches accounted for the discrepancy (Uriarte et al., 2019). In the GoM, ABT contributed only ~10% to the total larval assemblage (Laiz-Carrión et al., 2019). Despite these disparities, the GoM survey’s ABT catches were comparable to previous years (1990-2006) because only ~20-35% of the northern GoM has favorable ABT spawning conditions (Domingues et al., 2016) and 11% ± 4.9 of stations sampled were ABT-positive (Muhling et al., 2010). Larval bluefin tuna aggregate in patches (Satoh et al., 2014; Gerard et al., 2022) and in frontal regions (Alemany et al., 2010; Domingues et al., 2016). These fronts will concentrate prey, intra-larval competition, and predator abundance. For example, during the MED survey, at high ABT abundances (> 35 ABT) that coincided with a large size range, cannibalism was observed (Uriarte et al., 2019). In the GoM, ABT co-occurred with at least six other scombrids (Laiz-Carrión et al., 2019). In the MED, larval ABT abundances were almost 1.5 orders of magnitude higher and ABT dominated both the scombrid assemblage and the combined larval fish assemblage (64%). Comparable to Alemany et al. (2010), when larval ABT overlapped with other scombrids, it was most often with the congener (T. alalunga) and with Auxis spp. The trends observed within the same 2014 spawning season confirm previous larval assemblage comparisons from different years observed for scombrids between the GoM and MED (García et al., 2017; Alvarez et al., 2021) and within the MED alone (Uriarte et al., 2019).
In addition, relatively cooler temperatures in 2014 (< 23°C) may have influenced low ABT catches in the GoM (Muhling et al., 2010). Surface waters reached > 23.5°C only after 7 May, where in previous years, this threshold temperature for the onset of ABT spawning (Muhling et al., 2010) was reached in late April (SEAMAP, 2023)). During the 2014 spawning seasons, temperature ranges within ABT-positive stations were very narrow (2.6°C and 2°C in the GoM and MED, respectively), and thus any temperature-induced influences on larval growth may be difficult to determine.
For the first time ABT larval growth comparisons are reported from the same spawning season (2014) in the two main spawning grounds. The calibration exercise between laboratories was successful and yielded confirmatory CVs (5%). Age estimates between left and right sagittae from the same fish found no statistical differences in the estimates (between and within two readers) and is reported for the first time for ABT larvae. In addition, the ethanol-induced shrinkage equation utilized in this study allowed a comparison between growth curves derived from ethanol-preserved larvae and from freshly thawed larvae. Comparisons between growth studies are common and age-at-length estimates are obtained from larvae preserved in various preservatives. Low larval catches or size ranges often limit studies to smaller sample sizes. This was avoided in this study due to inclusion of additional larvae to supplement the GoM’s ageing estimates.
Despite obtaining good CV values, there are several reasons why individual reads did not conform to the ageing criteria. Most often, reads had age estimates that differed by more than two days. In addition, for a handful of otoliths, the primordium was difficult to discern because additional otolith material accreted within the diffuse region and thus the starting point of the OR could had been slightly off-center. Marking the end point of the OR was also difficult for older and more robust otoliths due to artificial microscopy-induced shadows obstructing the edge of the otolith. Multiple images were evaluated to avoid misrepresenting OR length. Interestingly, otolith size did not appear to influence the difficulty in age estimation for both readers, however older fish were more time-consuming to age due to uncertainty in marking the edge of the D-zones for wider increments.
Variations in estimating larval age (dph) during the first week of larval life can result in different growth rates and introduce error into already variable abundance estimates (Ingram et al., 2017). The first daily increment forms soon after the opening of the bluefin tuna mouth and coincides with the onset of exogenous feeding in ~4 d (Brothers et al., 1983; Itoh et al., 2000). Previous age estimates for larval ABT concluded that adding between two to four days was a suitable correction (Brothers et al., 1983; Malca et al., 2017) to calculate days post hatch from increments counted along the OR. In this paper, the proposed age-adjustment added ~3 d to the observed increment counts and ranged from adding one day up to five days. This approach towards age correction fits into the morphological development of ABT (Yúfera et al., 2014). In addition, the theoretical hatch proposed (7 µm) for ABT larvae has also been observed at a similar distance from the primordium in T. maccoyii otoliths (Jenkins and Davis, 1990). Utilizing observed individualized otolith-based trends could provide a more consistent and adequate estimate than simply adding x-number of days.
Larval fishes experience strong selection pressures to grow quickly in order to survive (Bakun, 2012; Pepin et al., 2015; Watai et al., 2018; Robert et al., 2023). Larval growth rates in the GoM were 0.40 mm d-1 and were smaller than reported by Malca et al. (2017) from the northern GoM (2000-2012, 0.46 mm SL increment-1). However, those age estimates utilized raw increment counts and were not adjusted for dph (Malca et al., 2017). In contrast, the growth rates reported for the 2014 GoM cohort are similar to those reported by Malca et al. (2022) (0.39 and 0.37 mm d-1), which also used the same age-adjustment protocol utilized in this study. Malca et al. (2022) aged ABT larvae from ethanol-preserved larvae collected in two contrasting habitats in the north and northeast GoM in 2017 and 2018, respectively. Adjusting for the shrinkage that occurs upon larval preservation and adjusting for the inflated growth rate (~7%, n = 288), the adjusted-growth rates from the GoM (2000-2012) were ~0.43 mm d-1. After this shrinkage adjustment, the larval growth rates from that study are comparable to those reported by Malca et al. (2022). This similarity between inter-annual growth rates among several years in the GoM (2012, 2014, and 2022) may point to a consistent early life history pattern that may imprint natal homing for the larvae born in the GoM (western ABT stock).
Larval growth rates in the MED were lower (0.26 mm d-1) than previously reported (0.35-0.41 mm increment-1) for the Balearic archipelago in 2003-2005 (García et al., 2013). In this case, both the MED 2014 larvae and the 2003-2005 MED larvae were preserved similarly, however García et al. (2013) did not correct for dph. Adjusting the inflated growth rate reduces the García et al. (2013) estimates by approximately 7% and despite this adjustment (now 0.33-0.38 mm d-1 for 2003-2005), the MED 2014 cohort appears to be growing at a slower rate. Unusually warm SST (26°C ± 0.54) during the 2003 spawning season resulted in higher relative growth rates for MED larvae (García et al., 2006; García et al., 2013), however during the 2004 and 2005 spawning seasons, larvae experienced representative MED temperatures (23.87°C ± 0.31, 24.96°C ± 0.83, see Table 5 in García et al., 2013). Thus, the slower growth observed in the MED 2014 is not explained. Temperature is directly related to tuna larval growth (García et al., 2013; Gleiber et al., 2020a; Gleiber et al., 2020b). That said, higher temperatures would also require sufficient food to support faster metabolic demands until eventually compromising larval growth (Gleiber et al., 2020b). In the GoM, temperature has been shown to influence growth when higher biomasses of preferred prey (cladocerans and copepod nauplii) were present (Shiroza et al., 2021; Malca et al., 2022). In this study, microzooplankton biomasses were similar between spawning areas, while the mesozooplankton biomass was much lower in the MED, pointing to a more food-limited habitat. Even within the MED, mesozooplankton (1.57 mg m-3) biomass was lower than previous years however the range was within observed values reported from the epipelagic MED (Siokou-Frangou et al., 2010). Uriarte et al. (2019) reported cannibalism within the same MED cohort that was aged in this study. Perhaps the slower growing MED larvae aged in this study (which included at least 40 larvae from the same station that Uriarte et al. (2019) found cannibals), were experiencing food-limited conditions (slower growth) prior to collection. Larval ABT exhibit piscivorous behavior starting at > 13 dph (Malca et al., 2022), so it is plausible that cannibalism may help the overall survival of older larvae in food-limited conditions when size- and density-dependent factors occurred (Dahl et al., 2018).
Individual instantaneous growth rates (mm d-1) and increment size (µm) increased with larval ontogeny within the GoM between preflexion and postflexion larvae. In the MED preflexion larvae also had a positive trend, however, the observed acceleration in instantaneous growth (and increment size) for postflexion GoM larvae was not observed in postflexion MED otoliths (Figures 3A, D). These different microstructural (daily-scale) patterns mirror differences in overall growth strategies between spawning areas. For example, preflexion larvae between the ages of six to nine days had instantaneous growth rates that were 15% higher in the GoM when compared to the MED. Similarly, instantaneous growth was also higher for postflexion in the GoM vs. the MED, though slightly less pronounced (13%), probably hinting at a flattening of larval growth acceleration beginning to occur between spawning areas. Different processes can influence growth at various size classes. Unfortunately, due to the limited number of postflexion larvae collected and aged in this study, this comparison was limited, and was only possible for larvae between 10 and 11 dph. Larval GoM increments were 12.5% wider than those from the MED, with individual increment widths increasing at different rates in both spawning areas. In the GoM, there was a robust increase in daily growth (six to 12 dph), ranging from 2% to 24%, and even up to 42% at 15 dph. In the MED, daily increment deposition was less accelerated and some daily increment widths remained relatively similar or even decreased at times. Focusing on recent somatic growth (~3 d) prior to collection, a similar pattern emerges. Recent growth was 22% higher for preflexion GoM larvae when compared to the MED. Postflexion larvae had wider increments in both spawning areas, but these increments grew 32% wider in the GoM when compared to the MED. These findings along with previously reported otolith metrics for the GoM and MED (Malca et al., 2017) point to differential early life history trajectories between the two ABT spawning grounds.
Nitrogen (δ15N) levels increase with increasing trophic steps (Post, 2002; Montoya, 2007). Microzooplankton and mesozooplankton δ15N values from this study followed this enrichment pattern (Table 3; Figure 4). Similarly, larval δ15N values should increase with body size. Although this enrichment pattern was observed for other tuna species in the GoM (Laiz-Carrión et al., 2019) and in the MED (García et al., 2017), larval ABT hatch with high δ15N due to maternal influence (Uriarte et al., 2016). In a rearing experiment with MED ABT larvae, Uriarte et al. (2016) reported that these elevated values decrease with age until larval flexion begins and δ15N increases after ~15 dph. The opposite trend for δ13C was reported in the same study (see Figure 3 in Uriarte et al. (2016)). It takes approximately two weeks (15 dph) for the larval ABT skeletal muscles and their corresponding δ15N and δ13C signatures to shed the maternal influence. In the wild, isotope signatures are likely more variable and at least in the GoM, this pattern may not closely follow lab experiments conducted with MED larvae. Yet evidence of the maternal influence has been observed especially in younger larvae collected in the GoM (Laiz-Carrión et al., 2019) and in the MED (García et al., 2017). In this study, preflexion larvae were excluded from SIA, however relatively few ABT larvae (n = 32) were > 15 dph. In the GoM, faster growers (positive residuals of size at-age and positive residuals of otolith size at-age) had high δ15N with marginally higher TP, while in the MED, faster growers had lower δ15N values and lower TP. At least in the MED, the lower δ15N may support the hypothesis that the 2014 cohort was feeding on prey with lower δ15N values and were consequently growing slower.
Unlike previous larval ABT trophic position estimations, this study utilized an updated nitrogen discrimination factor (Δ15Nmuscle =1.46 ‰) from Varela et al. (2012). Previous studies have utilized a higher value (1.64 ‰) from Varela et al. (2011). The recent value was derived from larval ABT that were reared until the juvenile stage and analyzed upon termination of the experiment and although not ideal, it is more suitable for this larval comparison. This minor discrepancy between Δ15N prevents a direct comparison of the TP estimates derived in this study to previously reported TP estimates (Laiz-Carrión et al., 2015; Laiz-Carrión et al., 2019). However, when utilizing the higher discrimination factor (from Varela et al. (2011)), TP estimates were 3.55 and 3.30 for the GoM and MED, respectively. These now-comparable values are higher than the TP reported from the GoM in 2012 and from the MED in 2013 (Laiz-Carrión et al., 2015). The adjusted TP estimations in this study are also higher than reported in Laiz-Carrión et al. (2019) for larvae from the same survey (2014) in the GoM, likely due to a different set of stations selected for ageing analysis.
A larger range of δ13C was observed in the MED compared to the GoM (Δδ13CABT = 3.02 and 0.9, respectively). The MED survey sampled throughout the Balearic archipelago, which is influenced by continental carbon sources (Sabatés et al., 2007) and localized upwelling at fronts and eddies (Alemany et al., 2010; Muhling et al., 2013). In the GoM survey, all of the stations were offshore (> 200 nm) and away from the Loop Current. Higher δ13C values for larger-at-age larvae followed opposite trends in the two spawning areas. In the GoM, larvae grew faster with higher values, whereas in the MED, the opposite was true. The δ13C overlapped between spawning areas, and the range was narrow within each spawning area, indicating that overall, larval ABT consume prey within a similar range of carbon values. Coincidentally, the faster growing MED larvae’s δ13C values overlapped the most with the slowest growing GoM larvae, again highlighting differential larval growth strategies. Piscivorous ABT larvae would be expected to have larger δ13C values and higher increment widths, but instances of piscivory are rare in wild collections (Uriarte et al., 2019). For example, Shiroza et al. (2021) observed only five larval fish prey in over 150 larval ABT guts. However, there is likely a lag between food ingestion, digestion and increment deposition. The MED otoliths examined in this study did not yet show wider increment widths.
Isotopic niches represented by Bayesian ellipses (Figure 5C) further support that postflexion ABT larvae from both the GoM and MED were feeding on prey with similar δ13C ranges but mostly differentiated by δ15N values. Standard Ellipse Area (SEA) (Figure 5D) specified broader isotopic niche (11% larger) for GoM larvae, suggesting a more diverse diet (euryphagy) than those from MED (stenophagy). When comparing these distinct geographic areas, the large overlap (64%) reported indicates that larvae have comparable trophic niches in their respective spawning areas.
The differences in larval growth strategies and trophic positions further affirm that larvae from these environmentally dissimilar and geographically distant locations have distinct trophic characteristics. Larval growth may be faster in the GoM when compared to the MED but this does not imply that the GoM produces higher quality (or more abundant) recruits when compared to the MED. The eastern ABT adult stock is more than one order of magnitude larger than the western ABT stock (NOAA, 2019). Larval ABT shared a similar isotopic niche in each spawning area and though adult ABT position larvae in oligotrophic environments, it appears that these habitats are suitable for larval survival within each spawning area (Bakun, 2012). In addition to copepods, ABT diet has been shown to include cladocerans, ciliates, and appendicularians (Catalán et al., 2011; Tilley et al., 2016; Shiroza et al., 2021) that utilize the microbial food web. Thus, the length and efficiency of food webs in these oligotrophic habitats will influence trophic position estimates (Stukel et al., 2022).
The association between recent growth (residual of recent growth-at-age, Rg) and trophic characteristics (δ15N and TP) in all models provides an explanation for recent growth variability. Trophic variables (δ15NABT, δ15Nmesozoo, TP) explained a larger portion of the variance. During the model selection process, most trophic variables were significantly correlated, especially microzooplankton and mesozooplankton biomass though SIA had higher explanatory influence. Therefore, these two variables were not included in the model estimates. The ABT larval δ13C values had no obvious trends in either region (Figure 5B) and as a result, δ13C values were excluded as a potential explanatory variable in the model. Although temperature and salinity were significantly different between regions, salinity correlated with multiple trophic metrics and was not included in the final model selections.
In the combined model, otolith radius (OR) was the most important variable. Otolith size has not always been positively coupled with increasing increment width, particularly in food-limited conditions (Gleiber et al., 2020a) or in the deep sea (Slayden, 2020). The OR largely explained variances in the combined model and in each region-specific model, pointing to regular accretion of increments in both regions. Region-specific GAMs were informative because the relationship between recent larval growth and larval isotopic signatures was significantly different (ANCOVA, ρ< 0.05) between δ15N, δ13C, and TP between regions. Importantly, δ15Nmesozoo consistently and significantly explained at least some of the recent growth variance (7 – 33%, Figures 6, 7), confirming that larval growth is influenced by the δ15N values of the associated prey fields. Trophic position explained 14.8 and 6.9% of the variance in the GoM and MED, respectively. The different contribution of TP between spawning areas may indicate that the GoM cohort was more vulnerable to the trophic position of their prey than in the MED. In warmer temperatures, the ABT within the GoM may have higher metabolic requirements than ABT within the MED. In the MED, faster growing larvae were feeding on prey with lower δ15N values and had lower TP. This would agree with the hypothesis that MED larvae were in a more oligotrophic habitat.
This study has shown that there are distinct growth strategies in the two main spawning regions. Combining recent growth and SIA explains some of these differences and captures habitat qualities for fast-growing larvae. In addition to larval metrics (measurements of length and age) for each spawning area, the environmental gradients including prey quality and quantity should be factored into management efforts.
The original contributions presented in the study are included in the article/Supplementary Material. Further inquiries can be directed to the corresponding author.
Ethical approval was not required for the study involving animals in accordance with the local legislation and institutional requirements because at-sea plankton sampling was conducted by standard net collection and preservation methods that include deceased icthyoplankton. Ethical approval was not required as per guidance from “Use of Fishes in Research Committee (joint committee of the American Fisheries Society,” the American Institute of Fishery Research Biologists, and the American Society of Ichthyologists and Herpetologists), (2014). Guidelines for the use of fishes in research. American Fisheries Society, Bethesda, Maryland. https://fisheries.org/policy-media/science-guidelines/guidelines-for-the-use-of-fishes-in-research/.
EM, JQ, RL-C, TG, JL, AG made substantial contributions to the conception, design of the work, funding acquisition, and project execution. TS and FA provided interpretation of data, and critical contributions to the manuscript. All authors contributed to the article and approved the submitted version.
The author(s) declare financial support was received for the research, authorship, and/or publication of this article. Funding for collections, analyses, and lab work were provided through a collaborative framework between multiple partners. These partners include the National Oceanic and Atmospheric Administration (NOAA), the Spanish Institute of Oceanography (IEO-CSIC, ECOLATUN CTM2015-68473-R to RLC, BLUEFIN TUNA, and TUNAGEN) projects in collaboration with the Balearic Island Observing and Forecasting System (SOCIB). This research was carried out in part under the auspices of the Cooperative Institute for Marine and Atmospheric Studies (CIMAS), a Cooperative Institute of the University of Miami and NOAA under cooperative agreement NA20OAR4320472. In addition, the Fish Florida Scholarship Program to EM provided doctoral support.
We thank the crew of the research ships R/V F.G. Walton Smith and R/V SOCIB for their support in conducting the corresponding surveys and thank Sarah Privoznik for her assistance in organizing the Gulf of Mexico survey. We acknowledge M. en C. Lourdes Vasquez-Yeomans for assistance identifying ichthyoplankton samples, and Jason Mostowy for providing data science support.
The authors declare that the research was conducted in the absence of any commercial or financial relationships that could be construed as a potential conflict of interest.
All claims expressed in this article are solely those of the authors and do not necessarily represent those of their affiliated organizations, or those of the publisher, the editors and the reviewers. Any product that may be evaluated in this article, or claim that may be made by its manufacturer, is not guaranteed or endorsed by the publisher.
The Supplementary Material for this article can be found online at: https://www.frontiersin.org/articles/10.3389/fmars.2023.1233249/full#supplementary-material
Supplementary Figure 1 | Station locations, aged larvae, and larval bluefin tuna (Thunnus thynnus) abundances (1000-1 m-3) from (A) western Mediterranean (MED) and (B) Gulf of Mexico (GoM) during the 2014 spawning season.
Supplementary Figure 2 | Biplot of residuals of age at length and residuals of age at otolith radius for larval bluefin tuna (Thunnus thynnus) aged from the Gulf of Mexico (red symbols) and western Mediterranean (blue symbols).
Akaike (1974). A new look at the statistical model identification Vol. 19 (Springer, New York, NY, United States: IEEE Trans. Automat. Contr.), 716–723. doi: 10.1109/TAC.1974.1100705
Alemany F., Quintanilla L., Velez-Belchí P., García A., Cortés D., Rodríguez J. M., et al. (2010). Characterization of the spawning habitat of Atlantic bluefin tuna and related species Balearic Sea (western Mediterranean). Prog. Oceanogr. 86, 21–38. doi: 10.1016/j.pocean.2010.04.014
Alvarez I., Rasmuson L. K., Gerard T., Laiz-Carrión R., Hidalgo M., Lamkin J. T., et al. (2021). Influence of the seasonal thermocline on the vertical distribution of larval fish assemblages associated with Atlantic bluefin tuna spawning grounds. Oceans 2, 64–83. doi: 10.3390/oceans2010004
Anderson M. J. (2001). A new method for non-parametric multivariate analysis of variance. Austral. Ecol. 26, 32–46. doi: 10.1111/j.1442-9993.2001.01070.pp.x
Anderson M. J., Robinson J. (2003). Generalized discriminant analysis based on distances. Aust. N. Z. J. Stat. 45, 301–318. doi: 10.1111/1467-842X.00285
Anonymous (2021). Report of the Standing Committee on Research and Statistics (SCRS). (Madrid, Spain: International Commission for the Conservation of Atlantic Tunas), 287.
Anonymous (2023). Report of the Standing Committee on Research and Statistics (SCRS) (Madrid, Spain: International Commission for the Conservation of Atlantic Tunas), 364.
Bakun A. (2012). Ocean eddies, predator pits and bluefin tuna: implications of an inferred ‘low risk–limited payoff’ reproductive scheme of a (former) archetypical top predator. Fish Fish. 14, 424–438. doi: 10.1111/faf.12002
Balbín R., López-Jurado J. L., Flexas M. M., Reglero P., Vélez-Velchí P., González-Pola C., et al. (2014). Interannual variability of the early summer circulation around the Balearic Islands: Driving factors and potential effects on the marine ecosystem. J. Mar. Syst. 138, 70–81. doi: 10.1016/j.jmarsys.2013.07.004
Benedetti F., Ayata S. D., Irisson J. O., Adloff F., Guilhaumon F. (2019). Climate change may have minor impact on zooplankton functional diversity in the Mediterranean Sea. Divers. Distrib. 25, 568–581. doi: 10.1111/ddi.12857
Block B. A., Teo S. L. H., Walli A., Boustany A., Stokesbury M. J. W., Farwell C. J., et al. (2005). Electronic tagging and population structure of Atlantic bluefin tuna. Nature 434 (7037), 1121–1127. doi: 10.1038/nature03463
Bode A., Álvarez-Ossorio M. T., Cunha M. E., Garrido S., Benito Peleteiro J., Porteiro C., et al. (2007). Stable nitrogen isotope studies of the pelagic food web on the Atlantic shelf of the Iberian Peninsula. Prog. Oceanogr. 74, 115–131. doi: 10.1016/j.pocean.2007.04.005
Bodin N., Pethybridge H., Duffy L. M., Lorrain A., Allain V., Logan J. M., et al. (2021). Global data set for nitrogen and carbon stable isotopes of tunas. Ecology 102 (3), e03265. doi: 10.1002/ecy.3265
Brothers E. B., Prince E. D., Lee D. W. (1983). “Age and growth of young-of-the-year blue fin tuna, Thunnus thynnus, from otolith microstructure,” in Procedures of the international workshop on age determination of oceanic pelagic fishes: tunas, billfishes, and sharks, vol. 8. Eds. Prince E. D., Pulos L. M. (NOAA Tech. Repos., N. M. F. S.), 49–60.
Campana S. E. (1999). Chemistry and composition of fish otoliths: pathways, mechanisms and applications. Mar. Ecol. Prog. Ser. 188, 263–297. doi: 10.3354/meps188263
Campana S. E., Jones C. (1992). “Analysis of otolith microstructure data,” in Otolith microstructure examination and analysis, vol. 117 . Eds. Stevenson D. K., Campana S. E., 73–100.
Catalán I. A., Alemany F., Morillas A., Morales-Nin B. (2007). Diet of larval albacore Thunnus alalunga (Bonnaterre 1788) off Mallorca Island (N.W. Mediterranean). Sci. Mar. 71 (2), 347–354. doi: 10.3989/scimar.2007.71n2347e
Catalán I. A., Tejedor A., Alemany F., Reglero P. (2011). Trophic ecology of Atlantic bluefin tuna Thunnus thynnus larvae. J. Fish. Biol. 78, 1545–1560. doi: 10.1111/j.1095-8649.2011.02960.x
Caut S., Angulo E., Courchamp F. (2009). Variation in discriminant factors (Δ15N and Δ13C): the effect of diet isotopic values and applications for diet reconstruction. J. Appl. Ecol. 46, 443–453. doi: 10.1111/j.1365-2664.2009.01620.x
Chang W. Y. B. (1982). A statistical method for evaluating the reproducibility of age determination. Can. J. Fish. Aquat. Sci. 39, 1208–1210. doi: 10.1139/f82-158
Clemmesen C. (1994). The effect of food availability, age or size on the RNA/DNA ratio of individually measured herring larvae: laboratory calibration. Mar. Biol. 118, 377–382. doi: 10.1007/BF00350294
Coll M., Palomera I., Tudela S., Sarda F. (2006). Trophic flows, ecosystem structure and fishing impacts in the South Catalan Sea northwestern Mediterranean. J. Mar. Syst. 59, 63–96. doi: 10.1016/j.jmarsys.2005.09.001
Collette B., Amorim A. F., Boustany A., Carpenter K. E., de Oliveira L. Jr, et al. (2011) The IUCN Red List of Threatened Species 2011. Available at: https://www.iucnredlist.org/species/21860/9331546.
Dahl K. A., Portnoy D. S., Hogan J. D., Johnson J. E., Gold J. R., Patterson W. F. (2018). Genotyping confirms significant cannibalism in northern Gulf of Mexico invasive red lionfish, Pterois volitans. Biol. Invasions 20, 3513–3526. doi: 10.1007/s10530-018-1791-3
Daly K. L., Remsen A., Outram D. M., Broadbent H., Kramer K., Dubickas K. (2021). Resilience of the zooplankton community in the northeast Gulf of Mexico during and after the Deepwater Horizon oil spill. Mar. Pol. Bul. 163, 1–28. doi: 10.1016/j.marpolbul.2020.111882
Diaz-Arce N., Gagnaire P. A., Richardson D., Walter J., Arnaud-Haond S., Fromentin J. M., et al. (2023). In Review. Unidirectional trans-Atlantic gene flow and a mixed spawning area shape the genetic connectivity of Atlantic bluefin tuna (Authorea). doi: 10.22541/au.168742629.93690601/v1
Domingues R., Goni G., Bringas F., Muhling B., Lindo-Atichati D., Walter J. (2016). Variability of preferred environmental conditions for Atlantic bluefin tuna (Thunnus thynnus) larvae in the Gulf of Mexico during 1993–2011. Fish. Oceanogr 25, 320–336. doi: 10.1111/fog.12152
Ferguson M. (2022). Zooplankton Biodiversity in the Northeast Gulf of Mexico and on the West Florida Shelf from 2005 - 2014". (Tampa, FL, United States: University of South Florida). Available at: https://digitalcommons.usf.edu/etd/9349.
Feuilloley G., Fromentin J. M., Saraux C., Irisson J. O., Jalabert L., Stemmann L. (2022). Temporal fluctuations in zooplankton size, abundance, and taxonomic composition since 1995 in the North Western Mediterranean Sea. ICES J. Mar. Sci. 79 (3), 882–900. doi: 10.1093/icesjms/fsab190
Fromentin J. M., Powers J. E. (2005). Atlantic bluefin tuna: population dynamics, ecology, fisheries and management. Fish Fish. 6, 281–306. doi: 10.1111/j.1467-2979.2005.00197.x
García A., Cortés D., Quintanilla J., Rámirez T., Quintanilla L., Rodríguez J. M., et al. (2013). Climate-induced environmental conditions influencing interannual variability of Mediterranean bluefin (Thunnus thynnus) larval growth. Fish. Oceanogr. 22 (4), 273–287. doi: 10.1111/fog.12021
García A., Cortés D., Ramírez T., Rifika F., Alemany F., Rodríguez J. M., et al. (2006). First data on growth and nucleic acid and protein content of field-captured Mediterranean bluefin (T. thynnus) and albacore (T. alalunga) larvae: a comparative study. Sci. Mar. 70, 67–78. doi: 10.3989/scimar.2006.70s267
García A., Laiz-Carrión R., Uriarte A., Quintanilla J., Morote E., Rodriguez J., et al. (2017). Differentiated stable isotopes signatures between pre- and post-flexion larvae of Atlantic bluefin tuna (Thunnus thynnus) and of its associated tuna species of the Balearic Sea (NW Mediterranean). Deep. Sea. Res. Part II 140, 18–24. doi: 10.1016/j.dsr2.2017.02.006
Gerard T., Lamkin J. T., Kelly T. B., Knapp A. N., Laiz-Carrión R., Malca E., et al. (2022). Bluefin larvae in Oligotrophic Ocean Foodwebs, Investigations of Nutrients to Zooplankton: overview of the BLOOFINZ-Gulf of Mexico program. J. Plankton Res. 44 (5), 600–617. doi: 10.1093/plankt/fbac038
Gleiber M. R., Sponaugle S., Cowen R. K. (2020b). Some like it hot, hungry tunas do not! Implications of temperature and plankton food web dynamics on growth and diet of tropical tuna larvae. ICES J. Mar. Sci. 77 (7-8), 3058–3073. doi: 10.1093/icesjms/fsaa201
Gleiber M. R., Sponaugle S., Robinson K., Cowen R. (2020a). Food web constraints on larval growth in subtropical coral reef and pelagic fishes. Mar. Ecol. Prog. Ser. 650, 19–36. doi: 10.3354/meps13217
Gordoa A., Fraile I., Arrizabalaga H., Raventós N. (2021). Growth of Mediterranean young-of-the-year bluefin tuna Thunnus thynnus (Scombridae): regional differences and hatching periods. Scien. Mar. 85 (2), 61–69. doi: 10.3989/scimar.05108.006
Habtes S., Muller-Karger F., Roffer M., Lamkin J. T., Muhling B. A. (2014). A comparison of sampling methods for larvae of medium and large epipelagic fish species during spring SEAMAP ichthyoplankton surveys in the Gulf of Mexico. Limnol. Oceanog. Meth. 12, 86–101. doi: 10.4319/lom.2014.12.86
Hernández C. M., Richardson D. E., Rypina I. I., Chen K., Marancik K. E., Shulzitski K., et al. (2021). Support for the Slope Sea as a major spawning ground for Atlantic bluefin tuna: evidence from larval abundance, growth rates, and particle-tracking simulations. Can. J. Fish. Aquat. Sci. 79, 814–824. doi: 10.1139/cjfas-2020-0444
Hildebrand R. (2022). Feeding ecology of highly migratory epipelagic offshore predators in the western North Atlantic Ocean. (Davie, FL, USA: Nova Southeastern University), 69.
Ingram G. W. Jr., Alvarez-Berastegui D., Reglero P., Balbín R., García A. (2017). Incorporation of habitat information in the development of indices of larval bluefin tuna (Thunnus thynnus) in the Western Mediterranean Sea, (2001–2005 and 2012–2013). Deep Sea Res. Part II 140, 203–211. doi: 10.1016/j.dsr2.2017.03.012
Ingram G. W., Richards W. J., Lamkin J. T., Muhling B. A. (2010). Annual indices of Atlantic bluefin tuna (Thunnus thynnus) larvae in the Gulf of Mexico developed using delta-lognormal and multivariate models. Aqua. Living. Res. 23, 35–47. doi: 10.1051/alr/2009053
Itoh T., Shiina Y., Tsuji S., Endo F., Tezuka N. (2000). Otolith daily increment formation in laboratory reared larval and juvenile bluefin tuna Thunnus thynnus. Fish. Sci. 66 (5), 834–839. doi: 10.1046/j.1444-2906.2000.00135.x
Jackson M. C., Donohue I., Jackson A. L., Britton J. R., Harper D. M., Grey J. (2012). Population-level metrics of trophic structure based on stable isotopes and their application to invasion ecology. PloS One 7 (2), e31757. doi: 10.1371/journal.pone.0031757
Jackson A. L., Inger R., Parnell A. C., Bearhop S. (2011). Comparing isotopic niche widths among and within communities: SIBER – Stable Isotope Bayesian Ellipses in R. J. Anim. Ecol. 80, 595–602. doi: 10.1111/j.1365-2656.2011.01806.x
Jenkins G. P., Davis T. L. O. (1990). Age, growth rate, and growth trajectory determined from otolith microstructure of southern bluefin tuna Thunnus maccoyii larvae. Mar. Ecol. Prog. Ser. 63, 93–104. doi: 10.3354/meps063093
Kovalev A. V., Kideys A. E., Pavlova E. V., Shmeleva A. A., Skryabin V. A., Ostrovskaya N. A., et al. (1999). “Composition and abundance of zooplankton of the Eastern Mediterranean Sea,” in The Eastern Mediterranean as a Laboratory Basin for the Assessment of Contrasting Ecosystems, vol. 51 . Eds. Malanotte-Rizzoli P., Eremeev V. N. (Dordrecht: Springer). doi: 10.1007/978-94-011-4796-5_7
Laiz-Carrión R., Gerard T., Suca J. J., Malca E., Uriarte A., Quintanilla J. M., et al. (2019). Stable isotope analysis indicates resource partitioning and trophic niche overlap in larvae of four tuna species in the Gulf of Mexico. Mar. Ecol. Prog. Ser. 619, 53–68. doi: 10.3354/meps12958
Laiz-Carrión R., Gerard T., Uriarte A., Malca E., Quintanilla J. M., Muhling B. A., et al. (2015). Trophic ecology of Atlantic bluefin tuna (Thunnus thynnus) larvae from the Gulf of Mexico and NW Mediterranean spawning grounds: a comparative stable isotope study. PloS One. doi: 10.1371/journal.pone.0133406
Laiz-Carrión R., Quintanilla J., Mercado J., García A. (2011). Combined Study of daily growth variability and nitrogen-carbon isotopic signature analysis of Alborán Sea schooling sardine Sardina pilchardus (Walbaum 1792) larvae. J. Fish Biol. 79, 896–914. doi: 10.1111/j.1095-8649.2011.03048.x
Laiz-Carrión R., Quintanilla J. M., Torres A. P., Alemany F., García A. (2013). Hydrographic patterns conditioning variable trophic pathways and early life dynamics of bullet tuna Auxis rochei larvae in the Balearic Sea. Mar. Ecol. Prog. Ser. 475, 203–212. doi: 10.3354/meps10108
Lindo-Atichati D., Bringas F., Goni G., Muhling B., Muller-Karger F. E., Habtes S. (2012). Varying mesoscale structures influence larval fish distribution in the northern Gulf of Mexico. Mar. Ecol. Prog. Ser. 463, 245–257. doi: 10.3354/meps09860
Llopiz J. K., Hobday A. J. (2015). A global comparative analysis of the feeding dynamics and environmental conditions of larval tunas, mackerels, and billfishes. Deep Sea Res. II 113, 113–124. doi: 10.1016/j.dsr2.2014.05.014
Llopiz J. K., Richardson D. E., Shiroza A., Smith S. L., Cowen R. K. (2010). Distinctions in the diets and distributions of larval tunas and the important role of appendicularians. Limnol. Oceanogr. 55, 983–996. doi: 10.4319/lo.2010.55.3.0983
Logan J., Haas H., Deegan L., Gaines E. (2006). Turnover rates of nitrogen stable isotopes in the salt marsh mummichog, Fundulus heteroclitus, following a laboratory diet switch. Oecologia 147 (3), 391–395. doi: 10.1007/s00442-005-0277-z
Long J. M., Porta M. J. (2019). Age and growth of stocked juvenile Shoal Bass in a tailwater: Environmental variation and accuracy of daily age estimates. PloS One 14 (10), e0224018. doi: 10.1371/journal.pone.0224018
Malca E., Muhling B. A., Franks J., García A., Tilley J., Gerard T., et al. (2017). Age and growth of larval bluefin tuna (Thunnus thynnus): comparison of the Gulf of Mexico to the Straits of Florida, and Balearic Sea (Mediterranean). Fish. Res. 190, 24–33. doi: 10.1016/j.fishres.2017.01.019
Malca E., Shropshire T. M., Landry M. R., Quintanilla J. M., Laíz-Carrión, Shiroza A., et al. (2022). Influence of food quality on larval growth of Atlantic bluefin tuna (Thunnus thynnus) in the Gulf of Mexico. J. Plankton Res. 44 (5), 474–762. doi: 10.1093/plankt/fbac024
Marra G., Wood S. N. (2011). Practical variable selection for generalized additive models. Comput. Stat. Data Anal. 55, 2372–2387. doi: 10.1016/j.csda.2011.02.004
Mazzocchi M. G., Licandro P., Dubroca L., Di Capua I., Saggiomo V. (2011). Zooplankton associations in a Mediterranean long-term time-series. J. Plankton Res. 33 (8), 1163–1181. doi: 10.1093/plankt/fbr017
Montoya J. P. (2007). “Natural abundance of 15N in marine planktonic ecosystems,” in Stable Isotopes in Ecology and Environmental Science. Eds. Michener R., Lajtha K. (Hoboken, New Jersey: Wiley-Blackwell, USA), 176–194.
Muhling B. A., Lamkin J. T., Alemany F., García A., Farley J. H., Ingram G. W. Jr., et al. (2017). Reproduction and larval biology in tunas, and the importance of restricted area spawning grounds. Rev. Fish. Biol. Fish. 27, 697–732. doi: 10.1007/s11160-017-9471-4
Muhling B. A., Lamkin J. T., Roffer M. A. (2010). Predicting the occurrence of bluefin tuna (Thunnus thynnus) larvae in the northern GOM: Building a classification model from archival data. Fish. Oceanogr. 19, 526–539. doi: 10.1111/j.1365-2419.2010.00562.x
Muhling B. A., Reglero P., Ciannelli L., Alvarez-Berastegui D., Alemany F., Lamkin J. T., et al. (2013). Comparison between environmental characteristics of larval bluefin tuna Thunnus thynnus habitat in the GOM and western Mediterranean Sea. Mar. Ecol. Prog. Ser. 486, 257–276. doi: 10.3354/meps10397
NOAA (2019). Western Atlantic Bluefin Tuna (US Department of Commerce). Available at: www.fisheries.noaa.gov/species/western-atlantic-bluefin-tuna.
Pannella G. (1971). Fish otoliths: daily growth layers and periodical patterns. Science 173, 1124–1127. doi: 10.1126/science.173.4002.1124
Pepin P., Dower J. F. (2007). Variability in the trophic position of larval fish in a coastal pelagic ecosystem based on stable isotope analysis. J. Plank. Res. 29, 727–737. doi: 10.1093/plankt/fbm052
Pepin P., Robert D., Bouchard C., Dower J. F., Falardeau M., Fortier L., et al. (2015). Once upon a larva: revisiting the relationship between feeding success and growth in fish larvae. ICES J. Mar. Sci. 72 (2), 359–373. doi: 10.1093/icesjms/fsu201
Peterson B. J., Fry B. (1987). Stable isotopes in ecosystem studies. Ann. Rev. Ecol. Syst. 18, 293–320. doi: 10.1146/annurev.es.18.110187.001453
Pinnegar J. K., Polunin N. V. C. (1999). Differential fractionation of δ13C and δ15N among fish tissues: implications for the study of trophic interactions. Funct. Ecol. 13, 225–231. doi: 10.1046/j.1365-2435.1999.00301.x
Polis G., Strong D. R. (1996). Food web complexity and community dynamics. Am. Nat. 147, 813–846. doi: 10.1086/285880
Post D. M. (2002). Using stable isotopes to estimate trophic position: models, methods and assumptions. Ecology 83, 703–718. doi: 10.1890/0012-9658(2002)083[0703:USITET]2.0.CO;2
Quezada-Romegialli C., Jackson A. L., Hayden B., Kahilainen K. K., Lopes C., Harrod C. (2018). tRophic Position, an r package for the Bayesian estimation of trophic position from consumer stable isotope ratios. Methods Ecol. Evol. 9, v1592–v1599. doi: 10.1111/2041-210X.13009
Quintanilla J. M., Laiz-Carrión R., García A., Quintanilla L. F., Cortés D., Gómez-Jakobsen F., et al. (2020). Early life trophodynamic influence on daily growth patterns of the Alboran Sea sardine (Sardina pilchardus) from two distinct nursery habitats (Bays of Málaga and Almería) in the Western Mediterranean Sea. Mar. Env. Res. 162, 105195. doi: 10.1016/j.marenvres.2020.105195
Quintanilla J., Laiz-Carrión R., Uriarte A., García A. (2015). Influence of trophic pathways on daily growth patterns of Western Mediterranean anchovy (Engraulis encrasicolus) larvae. Mar. Ecol. Prog. Ser. 531, 263–275. doi: 10.3354/meps11312
Quintanilla J. M., Malca E., Gerard T., Lamkin J. T., García A., Laiz-Carrión R. (2023). Evidence of isotopic maternal transmission for bluefin tuna (Thunnus thynnus) larval growth. Mar. Env. Res. 190, 106112. doi: 10.1016/j.marenvres.2013.106112
Rathmell K. (2007) The influence of the Loop Current on the diversity, abundance, and distribution of zooplankton in the Gulf of Mexico. (Tampa, FL, USA: University of South Florida). Available at: https://scholarcommons.usf.edu/etd/2334.
R Core Team (2022). R: A language and environment for statistical computing (Vienna, Austria: R Foundation for Statistical Computing). Available at: http://www.R-project.org/.
Restrepo V. R., Diaz G. A., Walter J. F., Neilson J. D., Campana S. E., Secor D., et al. (2010). Updated estimate of the growth curve of Western Atlantic bluefin tuna. Aquat. Livi. Res. 23, 335–342. doi: 10.1111/faf.12774
Richards W. J. (Ed.) (2006). Early stages of Atlantic fishes. An identification guide for the Western Central North Atlantic. (Boca Ratón, FL, USA: CRC, Taylor and Francis Group L.L.C), 2591.
Richards T. M., Sutton T. T., Woodstock M. S., Judkins H., Wells D. R. J. (2023). Body size, depth of occurrence, and local oceanography shape trophic structure in a diverse deep-pelagic micronekton assemblage. Prog. Oceanogr. 213, 102998. doi: 10.1016/j.pocean.2023.102998
Richardson D. E., Marancik K. E., Guyon J. R., Lutcavage M. E., Galuardi B., Lam C. H., et al. (2016). Discovery of a spawning ground reveals diverse migration strategies in Atlantic bluefin tuna (Thunnus thynnus). PNAS 113, 3299–3304. doi: 10.1073/pnas.1525636113
Robert D., Castonguay M., Fortier L. (2007). Early growth and recruitment in Atlantic mackerel Scomber scombrus: discriminating the effects of fast growth and selection for fast growth. Mar. Ecol. Prog. Ser. 337, 209–219. doi: 10.3354/meps337209
Robert D., Shoji J., Sirois P., Takasuka A., Catalán I. A., Folkvord A., et al. (2023). Life in the fast lane: Revisiting the fast growth—High survival paradigm during the early life stages of fishes. Fish Fish. 24, 863–888. doi: 10.1111/faf.12774
Rodríguez-Ezpeleta N., Díaz-Arce N., Walter J. F., Richardson D. E., Rooker J. R., Nøttestad L., et al. (2019). Determining natal origin for improved management of Atlantic bluefin tuna. Front. Ecol. Env. 17 (8), 439–444. doi: 10.1002/fee.2090
Rooker J. R., Alvarado, Bremer J. R., Block B. A., Dewar H., De Metrio G., et al. (2007). Life history and stock structure of atlantic bluefin tuna (Thunnus thynnus). Rev. Fish. Sci. 15, 265–310. doi: 10.1080/10641260701484135
Russo S., Torri M., Patti B., Musco M., Masullo T., Di Natale M. V., et al. (2022). Environmental conditions along tuna larval dispersion: Insights on the spawning habitat and impact on their development stages. Water 14, 1568:1–156816. doi: 10.3390/w14101568
Sabatés A., Olivar M. P., Salat J., Palomera I., Alemany F. (2007). Physical and biological processes controlling the distribution of fish larvae in the NW Mediterranean. Prog. Oceanogr. 74, 355–376. doi: 10.1016/j.pocean.2007.04.017
Satoh K., Masujima M., Tanaka Y., Okazaki M., Kato Y., Shono H. (2014). Transport, distribution and growth of larval patches of Pacific bluefin tuna (Thunnus orientalis) in the northwestern Pacific Ocean. Bull. Fish. Res. Agency Jpn. 38, 81–86.
Satoh K., Tanaka Y., Iwahashi M. (2008). Variations in the instantaneous mortality rate between larval patches of Pacific bluefin tuna Thunnus orientalis in the northwestern Pacific Ocean. Fish. Res. 89, 248–256. doi: 10.1016/j.fishres.2007.09.003
Schneider C. A., Rasband W. S., Eliceiri K. W. (2012). NIH Image to ImageJ: 25 years of image analysis. Nat. Methods 9, 671–675. doi: 10.1038/nmeth.2089
Scott G. P., Turner S. C., Grimes C. B., Richards W. J., Brothers E. B. (1993). Indices of larval bluefin tuna, Thunnus thynnus, abundance in the GOM: Modeling variability in growth, mortality, and gear selectivity: Ichthyoplankton methods for estimating fish biomass. Bull. Mar. Sci. 53, 912–929.
SEAMAP (2023) ACCESS database, Hydrographic sea surface temperature, 5 m depth Available at: http://www.seamap.org.
Secor D. H., Dean J. M., Campana S. E. (1995). Recent developments in fish otolith research (Columbia, S.C., USA: Univ. of South Carolina Press).
Secor D. H., Wingate R. L., Neilson J. D., Rooker J. R., Campana S. E. (2008) Growth of Atlantic bluefin tuna: direct age estimates Col. Vol. Sci. Pap.
Shiroza A., Malca E., Lamkin J. T., Gerard T., Landry M. R., Stukel M. R., et al. (2021). Diet and prey selection in developing larvae of Atlantic bluefin tuna (Thunnus thynnus) in spawning grounds of the Gulf of Mexico. J. Plank. Res. 44 (5), 728–746. doi: 10.1093/plankt/fbab020
Siokou-Frangou I., Christaki U., Mazzocchi M. G., Montresor M., Ribera d'Alcalá M., Vaqué D., et al. (2010). Plankton in the open Mediterranean Sea: a review. Biogeosciences 7, 1543–1586. doi: 10.5194/bg-7-1543-2010
Slayden N. (2020). Age and growth of predatory mesopelagic fishes in a low- latitude oceanic ecosystem. (Davie, FL, USA: Nova Southeastern University), 73.
Sponaugle S. (2010). Otolith microstructure reveals ecological and oceanographic processes important to ecosystem-based management. Environ. Biol. Fish. 89, 221–238. doi: 10.1007/s10641-010-9676-z
Stukel M. R., Gerard T., Kelly T. B., Knapp A. N., Laiz-Carrión R., Lamkin J. T., et al. (2022). Plankton food webs in the oligotrophic Gulf of Mexico spawning grounds of Atlantic bluefin tuna. J. Plankton Res. 44 (5), 763–781. doi: 10.1093/plankt/fbab023
Tilley J. D., Butler C. M., Suárez-Morales E., Franks J. S. (2016). Feeding ecology of larval Atlantic bluefin tuna, Thunnus thynnus, from the central Gulf of Mexico. Bull. Mar. Sci. 92, 321–334. doi: 10.5343/bms.2015.1067
Uriarte A., García A., Ortega A., de la Gándara F., Quintanilla J., Laiz-Carrión R. (2016). Isotopic discrimination factors and nitrogen turnover rates in reared Atlantic bluefin tuna larvae (Thunnus thynnus): effects of maternal transmission. Sci. Mar. 80 (4), 447–456. doi: 10.3989/scimar.04435.25A
Uriarte A., Johnstone C., Laiz-Carrión R., García A., Llopiz JK., Shiroza A., et al. (2019). Evidence of density-dependent cannibalism in the diet of wild Atlantic bluefin tuna larvae (Thunnus thynnus) of the Balearic Sea (N.W. Mediterranean). Fish. Res. 212, 63–71. doi: 10.1016/j.fishres.2018.12.013
Varela J. L., Cañavate J. P., Medina A., Mourente G. (2019). Inter-regional variation in feeding patterns of skipjack tuna (Katsuwonus pelamis) inferred from stomach content, stable isotope and fatty acid analyses. Mar. Env. Res. 152 (104821). doi: 10.1016/j.marenvres.2019.104821
Varela J. L., de la Gándara F., Ortega A., Medina A. (2012). 13C and 15N analysis in muscle and liver of wild and reared young-of-the-year (YOY) Atlantic bluefin tuna. Aquac. 354-355, 17–21. doi: 10.1016/j.aquaculture.2012.04.040
Varela J. L., Larrañaga A., Medina A. (2011). Prey-muscle carbon and nitrogen stable isotope discrimination factors in Atlantic bluefin tuna (Thunnus thynnus). J. Exp. Mar. Biol. Ecol. 406, 21–28. doi: 10.1016/j.jembe.2011.06.010
Vélez-Belchí P., Tintoré J. (2001). Vertical velocities at an ocean front. Sci. Mar. 65 (1), 291–300. doi: 10.3989/scimar.2001.65s1291
Watai M., Hiraoka Y., Ishihara T., Yamasaki I., Ota T., Ohsimo S., et al. (2018). Comparative analysis of the early growth history of Pacific bluefin tuna Thunnus orientalis from different spawning grounds. Mar. Ecol. Prog. Ser. 607, 207–220. doi: 10.3354/meps12807
Watai M., Ishihara T., Abe O., Ohshimo S., Strussmann C. A. (2017). Evaluation of growth-dependent survival during early stages of Pacific bluefin tuna using otolith microstructure analysis. Mar. Freshw. Res. 68, 2008–2017. doi: 10.1071/MF16337
Wilson S. G., Jonsen I. D., Schallert R. J., Ganong J. E., Castleton M. R., Spares A. D., et al. (2015). Tracking the fidelity of Atlantic bluefin tuna released in Canadian waters to the Gulf of Mexico spawning grounds. Can. J. Fish. Aquat. Sci. 72, 1–18. doi: 10.1139/cjfas-2015-0110
Wood S. N. (2004). Stable and efficient multiple smoothing parameter estimation for generalized additive models. J. Am. Stat. Assoc. 99 (467), 673–686. doi: 10.1198/016214504000000980
Wood S. N. (2017). Generalized Additive Models: An Introduction with R, 2 edition (Boca Ratón, FL, USA: Chapman and Hall/CRC).
Yúfera M., Ortiz-Delgado J. B., Hoffman T., Siguero I., Urup B., Sarasquete C. (2014). Organogenesis of digestive system, visual system and other structures in Atlantic bluefin tuna (Thunnus thynnus) larvae reared with copepods in mesocosm system. Aquac. 426-427, 126–137. doi: 10.1016/j.aquaculture.2014.01.031
Keywords: otolith microstructure, general additive models, early life history, stable isotope analysis, postflexion stage, bluefin tuna, highly migratory species
Citation: Malca E, Quintanilla JM, Gerard T, Alemany F, Sutton T, García A, Lamkin JT and Laiz-Carrión R (2023) Differential larval growth strategies and trophodynamics of larval Atlantic bluefin tuna (Thunnus thynnus) from two discrete spawning grounds. Front. Mar. Sci. 10:1233249. doi: 10.3389/fmars.2023.1233249
Received: 01 June 2023; Accepted: 10 October 2023;
Published: 06 November 2023.
Edited by:
Josipa Ferri, University of Split, CroatiaReviewed by:
Guido Plaza, Pontificia Universidad Católica de Valparaíso, ChileCopyright © 2023 Malca, Quintanilla, Gerard, Alemany, Sutton, García, Lamkin and Laiz-Carrión. This is an open-access article distributed under the terms of the Creative Commons Attribution License (CC BY). The use, distribution or reproduction in other forums is permitted, provided the original author(s) and the copyright owner(s) are credited and that the original publication in this journal is cited, in accordance with accepted academic practice. No use, distribution or reproduction is permitted which does not comply with these terms.
*Correspondence: Estrella Malca, ZW1hbGNhQG1pYW1pLmVkdQ==
Disclaimer: All claims expressed in this article are solely those of the authors and do not necessarily represent those of their affiliated organizations, or those of the publisher, the editors and the reviewers. Any product that may be evaluated in this article or claim that may be made by its manufacturer is not guaranteed or endorsed by the publisher.
Research integrity at Frontiers
Learn more about the work of our research integrity team to safeguard the quality of each article we publish.