 Lili Zhang
 Hongyuan Shi
 Hao Xing
 Pingping Li1
94% of researchers rate our articles as excellent or good
Learn more about the work of our research integrity team to safeguard the quality of each article we publish.
Find out more
METHODS article
Front. Mar. Sci., 12 September 2023
Sec. Coastal Ocean Processes
Volume 10 - 2023 | https://doi.org/10.3389/fmars.2023.1232060
This article is part of the Research TopicAdvances in Monitoring and Modelling Spatial and Temporal Dynamics of Estuarine EcosystemsView all 8 articles
The coastline of the Yellow River Delta has undergone continual alterations due to both natural forces and human activity. Studying these changes is crucial for promoting economic growth and preserving the region’s ecological balance. Based on imagery captured by the Landsat5 and Landsat8 satellites, this study uses statistical data from the Digital Shoreline Analysis System (DSAS), including Net Shoreline Movement (NSM), End Point Rate (EPR), and Linear Regression Rate (LRR), to analyze the changes in the Yellow River Delta coastline from 2009 to 2019. This being the case, a hydrodynamic model under different shoreline conditions was established using Delft3D to compare and analyze the impact of shoreline changes on the tidal current field. From 2009 to 2019, the coastline in the study area exhibited an average movement distance of 1285m (NSM) and an annual change rate of 127.7m/a (LRR). The average increase in the area of the current estuary was 7.68km2/a, while the average decrease in the area of the old estuary was 4.91km2/a. Shoreline evolution is primarily influenced by the influx of water and sediment into the ocean. Following the implementation of water and sediment regulation, the existing estuary’s shoreline experienced a rapid initial accumulation of silt, which subsequently decelerated over time. Conversely, the former estuary has consistently undergone erosion. The greater the change in shoreline, the closer to the coast, and the greater the change in the tide. From 2009 to 2019, flow velocity and direction in the Yellow River Delta generally showed a decreasing trend, with changes ranging from 0.34% to 25.94%. The residual flow velocity near the current estuary gradually increased by about 2cm/s, while that near the abandoned old estuary gradually decreased by about 1cm/s, with no significant changes offshore. The sediment transported by the Yellow River is deposited at the current estuary, causing the coastline to move northeastward. In the abandoned estuary, there is erosion, causing the coastline to retreat.
The coastline is a zone formed by the interaction of the atmosphere, hydrosphere and lithosphere, and has the characteristics of complexity, sensitivity and variability (Mahapatra et al., 2014; Xu et al., 2016). The change of the shoreline are a result of both natural and human influences. Due to various factors such as nearshore currents, waves, tides, sediment transport, and human intervention, the coastal zone is constantly undergoing dynamic changes (Mujabar and Chandrasekar, 2011; Chen et al., 2019). Exploring the evolution of coastlines and their driving factors can provide scientific information for land use, ecological protection and sustainable development in coastal areas.
The Yellow River Delta which is located between Bohai Bay and Laizhou Bay, is a terrestrial sediment-dominated delta with weak tide (Zhan et al., 2017; Shi et al., 2020). Its shoreline and geomorphology undergo frequent alterations (Huang et al., 2019). The primary reasons of these changes are the vast sediment discharged by the Yellow River and the effects of oceanic currents eroding the coastline (Cui and Li, 2011; Kong et al., 2015). The impact of river flow on delta coastline changes is greater than wave energy (Fan et al., 2018). However, as the length of the shoreline increases, its evolution is increasingly affected by human activities (Jiang et al., 2017; Wang, 2019). The sediment in the Yellow River Delta is mainly derived from the fine-grained sediment carried by the Yellow River. The implementation of water and sediment diversion project has enabled the Yellow River to transport approximately one-fifth of its annual runoff and two-fifths of its sediment to the sea within a short period of time (Yu et al., 2011). Prior to the implementation of the project, the overall coastline of the Yellow River estuary was in a state of erosion. After the project began, the initial accretion rate of the current estuarine coastline was fast, but the subsequent rate gradually slowed down. Meanwhile, the old estuary continued to erode (Liu et al., 2022). These anthropogenic intervention measures have caused significant changes in the evolutionary process of the coastline in the Yellow River Delta. Therefore, analyzing the evolution of the Yellow River Delta coastline and exploring changes in estuarine dynamic environment are crucial for understanding how the coastline responds to natural and human influences.
Early studies often relied on on-site field measurements and photogrammetry for coastline analysis. However, these methods were labor-intensive, inefficient, and time-consuming. They were also limited by geographical and surveying conditions, making it difficult to achieve dynamic monitoring of the coastline (Wilkowski et al., 2017). Monitoring coastlines based on remote sensing images has become the main method for studying shoreline evolution (Mahamoud et al., 2023) because of its advantages of wide coverage, high temporal and spatial resolution (Mujabar and Chandrasekar, 2013). It can be combined with the Digital Shoreline Analysis System (DSAS) to analyze changes of the coastline (Bheeroo et al., 2016; Mondal et al., 2020; Sam and Gurugnanam, 2022; Siyal et al., 2022). By calculating the indexs such as changes in coastline length and area, rates of change, and morphological changes, the specific changes in the actual coastline can be inferred (Hossen and Sultana, 2023). There have been numerous studies on the spatio-temporal changes of the coastline in the Yellow River Delta. However, the existing studies have not considered the impact of coastline changes on hydrodynamic fields and their evolution trends. The interaction between coastline changes and the hydrodynamic field is strong (Jia et al., 2019). Investigating this interaction can help reveal the dynamic mechanisms driving coastline changes and provide a scientific basis for managing and protecting the coastline of the Yellow River Delta. Exploring the erosion and accretion processes of coastline changes is of great significance for engineering construction in coastal areas (Chrysanti et al., 2019).
In this paper, we obtained coastlines based on Landsat TM/OLI_TIRS satellite remote sensing images and calculated the changes in the Yellow River Delta coastline from 2009 to 2019 by using DSAS. In addition, we also used Delft3D to simulate the hydrodynamic field and sediment transport in the Yellow River Delta. We qualitatively analyzed the impact of coastline evolution on the tidal current field and predicted the trend of coastline changes. These discoveries could deepen our understanding of the changes occurring along the Yellow River Delta coastline and provide valuable scientific suggestions for managing the coast and promoting sustainable development in the estuary of the Yellow River.
Originating from the Qinghai-Tibet Plateau, the Yellow River traverses several provinces before ultimately reaching the Bohai Sea. The Yellow River has undergone several channel shifts. In 1996, the artificial diversion project was implemented at the Qingshuigou cross-section, redirecting the flow of the Yellow River to the Qing8 channel(Q8 channel) towards the sea (Figure 1). In 2007, the estuary changed its orientation from east to north, and in 2013, it shifted from the current flow path to the northern and eastern outlets, forming the current geomorphological pattern of the estuary. The Yellow River’s sediment originates from the Loess Plateau, consisting primarily of silt and clay. Under the influence of tidal currents, the sediment from the Yellow River is transported and deposited, resulting in the forming of the Yellow River Delta. The nearshore waters of the delta are impacted by the tidal dynamics of the Bohai Sea, which is divided into two currents. One current moves northward into Liaodong Bay while the other one moves southward into Laizhou Bay. The incident tidal wave and the reflected tidal wave from the top of the bay superimpose to form an M2 tidal node. The coastal tides are mainly irregular semidiurnal tides, and near the M2 tidal node, they appear as irregular diurnal tides. The maximum annual tidal range in the delta can reach 152 cm, while the average tidal range is 76 cm. The hydrographic environment of the Yellow River Delta is primarily governed by wind-driven waves, which exhibit pronounced fluctuations and clear seasonal patterns. The dominant wind direction is northeast, while the prevailing wind direction is south and north. In nearshore waters, the maximum wave height can reach up to 6.25 m, while the average wave height stands at 0.58 m. The strongest wave direction throughout the year is NE-NNE, followed by N-NNW.
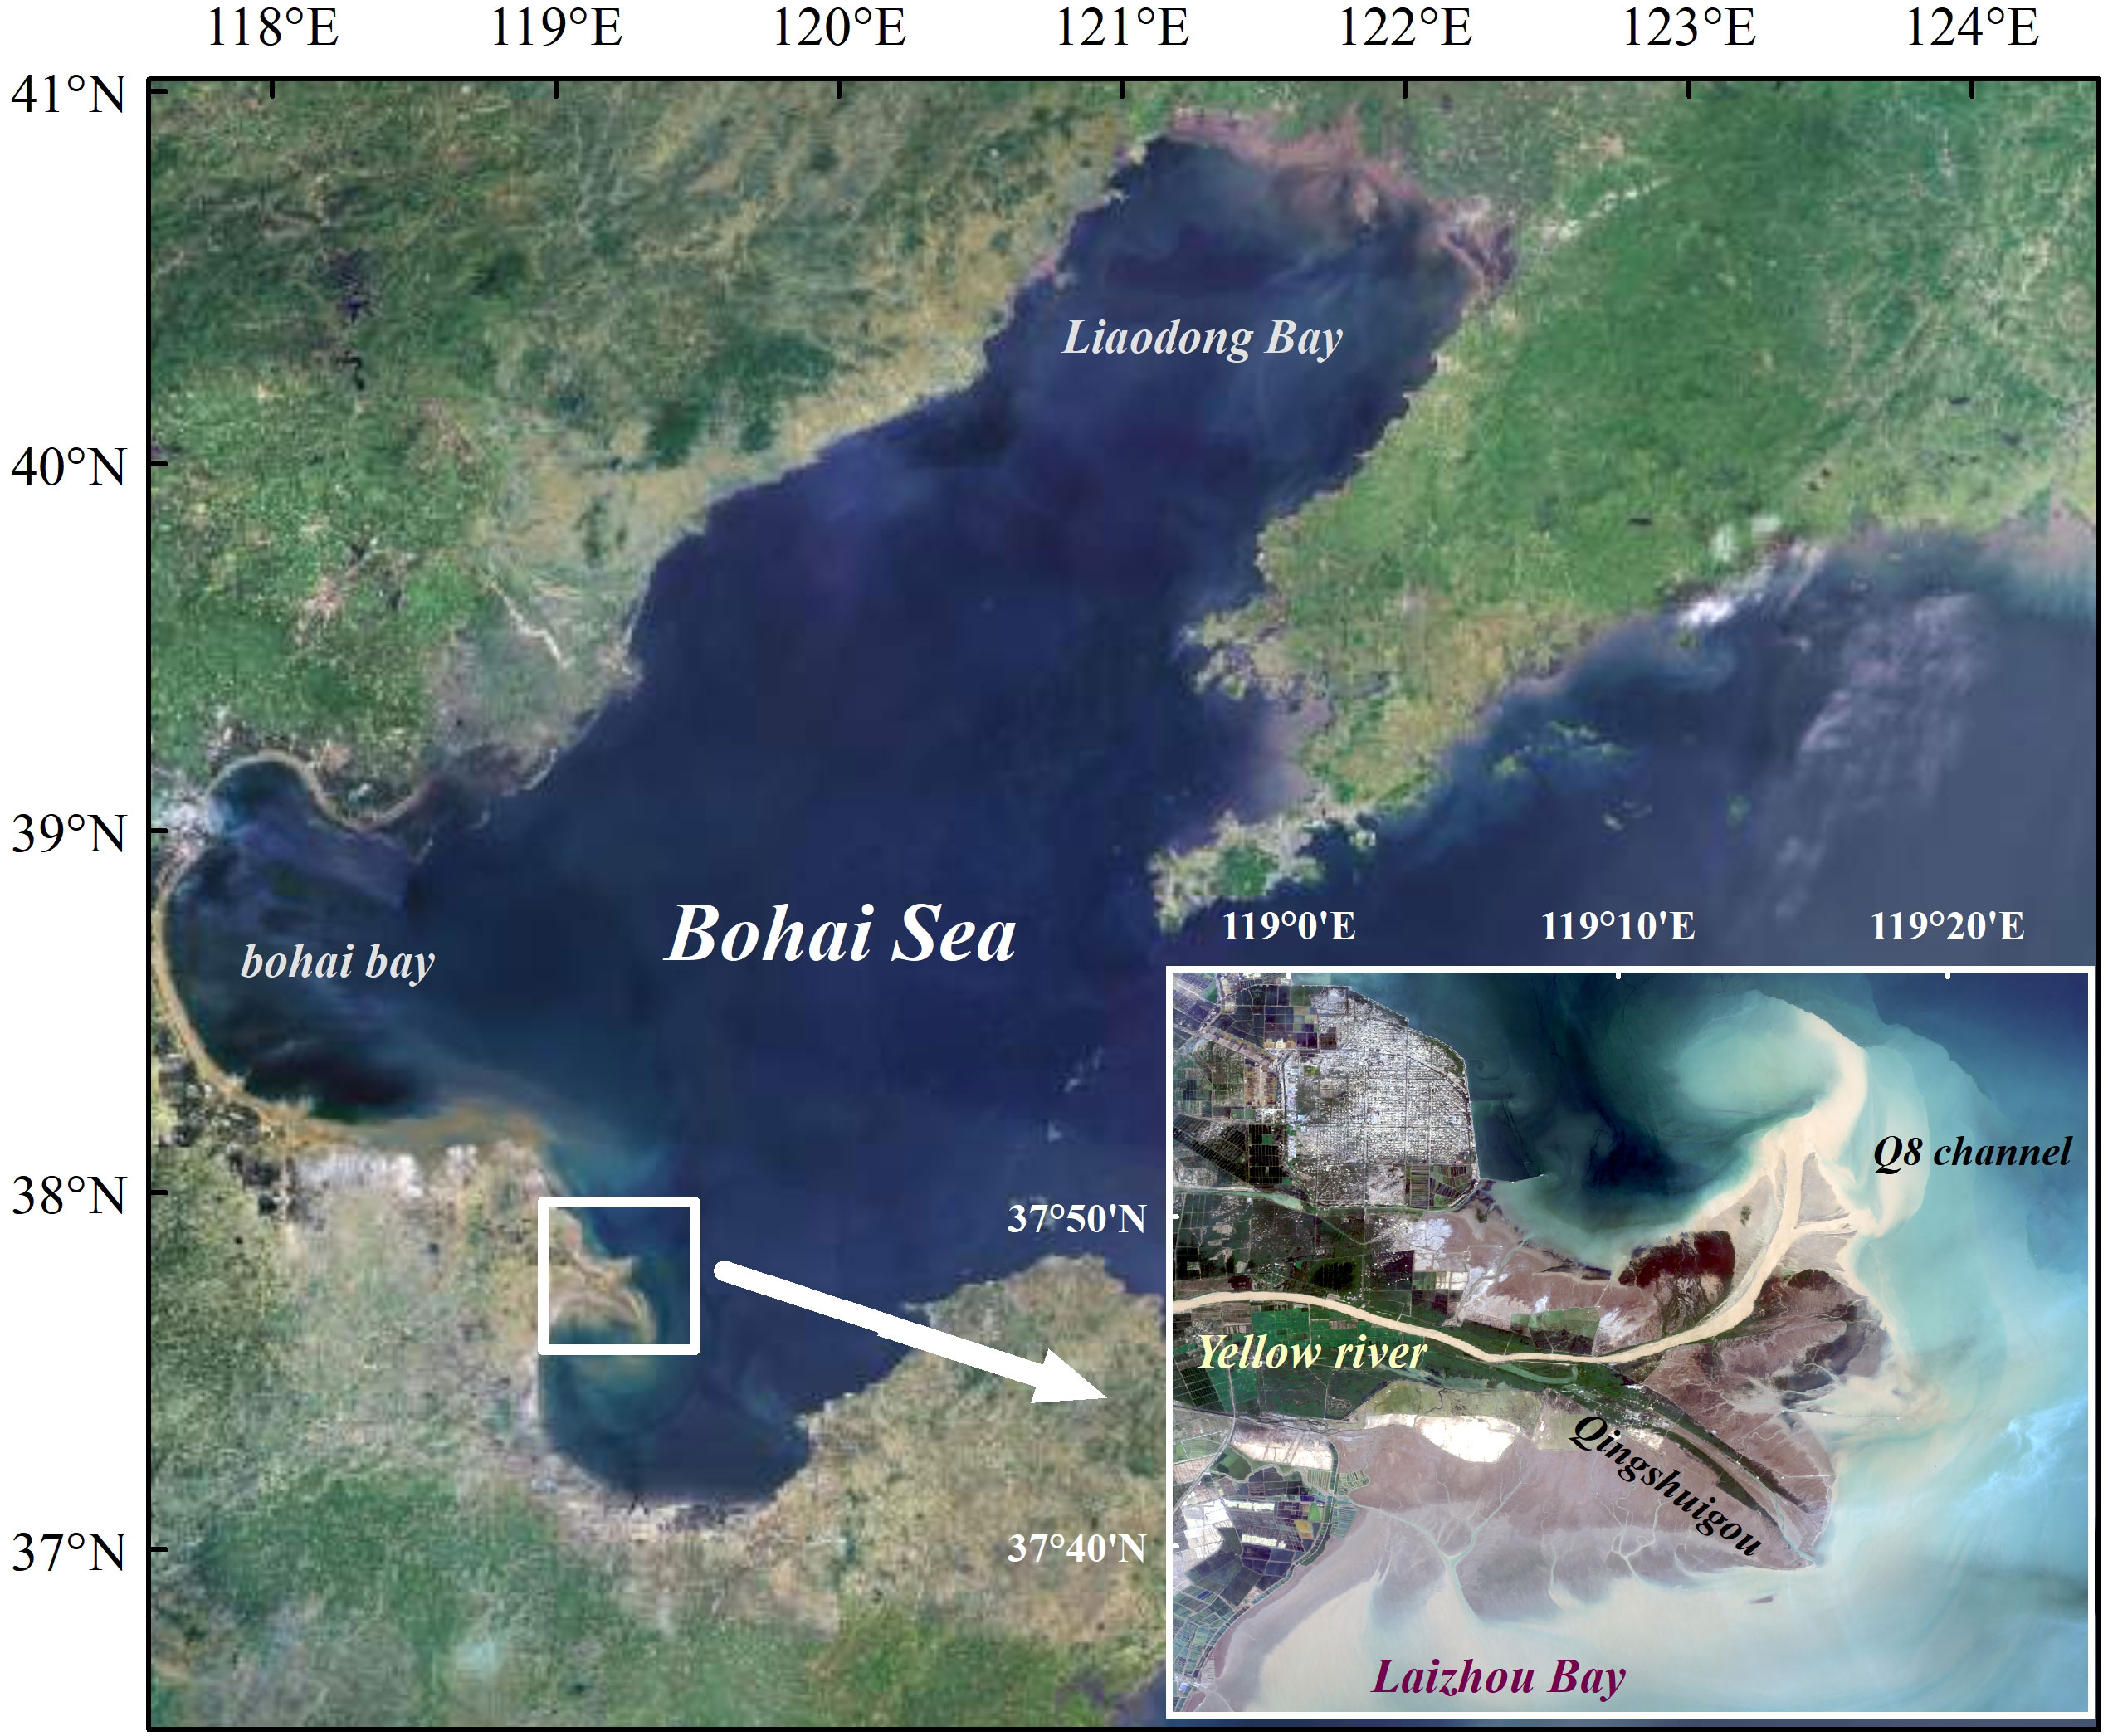
Figure 1 Map of the modern Yellow River Delta.
Remote sensing data is obtained from the Geospatial Data Cloud Platform (http://www.gscloud.cn/), with Landsat TM/OLI_TIRS satellite images are selected as the data source, including images obtained from Landsat 5 and Landsat 8 land satellites. When selecting images, the cloud coverage is ensured to be no more than 10%. Images from the same year are selected with a time difference of no more than 1 month (Table 1). ENVI is a remote sensing image processing software developed by using the interactive data language (IDL). It allows for comprehensive and efficient extraction of relevant information from remote sensing images and provides a complete set of tools for processing and analyzing remote sensing data (Khosravi et al., 2020; Song, 2021). The remote sensing images are processed by using ENVI for tasks such as cropping, radiometric correction, and atmospheric correction. The Normalized Water Index (NDWI) (McFeeters, 1996) can highlight water information in images, but does not consider the impact of soil background. The Modified Normalized Water Index (MNDWI) (Xu, 2005) is effective in reducing the impact of non-water information and reducing errors in shoreline extraction. Its calculation formula is as follows:
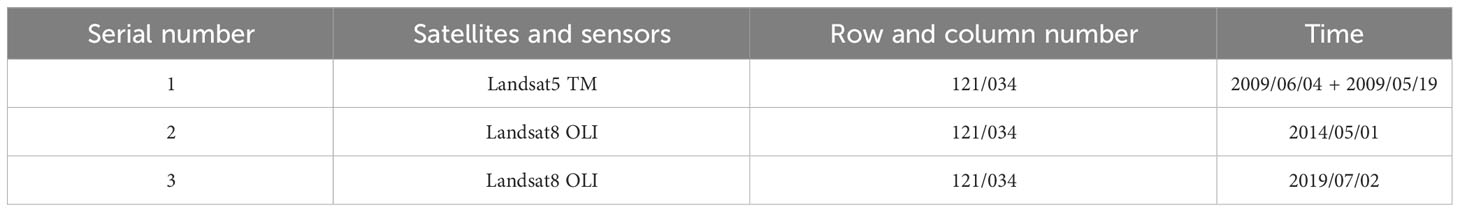
Table 1 Data source of remote sensing images.
Where is the reflectance of the green band and is the reflectance of the mid-infrared band. The image is then binarized to obtain a black and white raster map, which is imported into ArcGIS for vectorization to obtain the water edge line. Finally, visual interpretation is used to obtain the coastline (Figure 2), The process diagram for obtaining the coastline is shown in Figure 3. In total, 200 sampling points are taken along the coastline in the study area. We use Google Earth satellite imagery to determine the marine/land attributes of each sampling point and validate the accuracy of the extracted coastline. The spatial resolution of Google Earth satellite imagery is typically higher than that of Landsat satellite imagery, ranging from 1m to 15m. After calculation, the accuracy rates of the three shoreline land-sea attribute classifications are 86.4%, 91.2%, and 89.6%, respectively. This indicates a good accuracy in coastline extraction.

Figure 2 Processing of satellite imagery in the study area.

Figure 3 Coastline Extraction Process Diagram.
The Digital Shoreline Analysis System (DSAS) is an application software for the ArcGIS system platform. It can systematically calculate the rate of coastline change and quantitatively analyze long-term and short-term coastline changes (Liu et al., 2020). Extracted shorelines are imported into a personal geodatabase, and buffers are established around the shoreline. Choose a suitable baseline based on the morphology of the coastline. Generate tangents from the baseline towards the coastline, and adjust overlapping and intersecting tangents. We analyzed the erosion and siltation of the Yellow River Delta coastline from 2009 to 2019 by calculating the Net Shoreline Movement (NSM), End Point Rate (EPR), and Linear Regression Rate (LRR) based on the coastlines in 2009, 2014, and 2019.
Net Shoreline Movement (NSM) refers to the calculation of the distance separating the most recent coastline from the ancient coastline The calculation formula is as follows:
Where represents the distance from the baseline to the youngest coastline and represents the distance from the baseline to the oldest coastline.
The End Point Rate (EPR) is determined by dividing the Net Shoreline Movement (NSM) by the time interval between the two coastlines. The calculation formula is as follows:
Where represents the time of the youngest coastline and represents the time of the oldest coastline.
The Linear Regression Rate (LRR) is calculated based on least squares fitting through the intersection of transects and coastlines and requires coastlines at three or more time points (Himmelstoss et al., 2018). The calculation formula is as follows:
Where y is the spatial position of the coastline, is the year of the coastline, is the fitted constant intercept, and is the regression slope, i.e., LRR.
Using the DSAS, we selected the current and abandoned estuary shorelines of the Yellow River Delta in 2009, 2014, and 2019. A total of 772 cross-sections were generated from north to south along the baseline at intervals of 100m (Figure 4). The calculated LRR and EPR are shown in Figure 5.
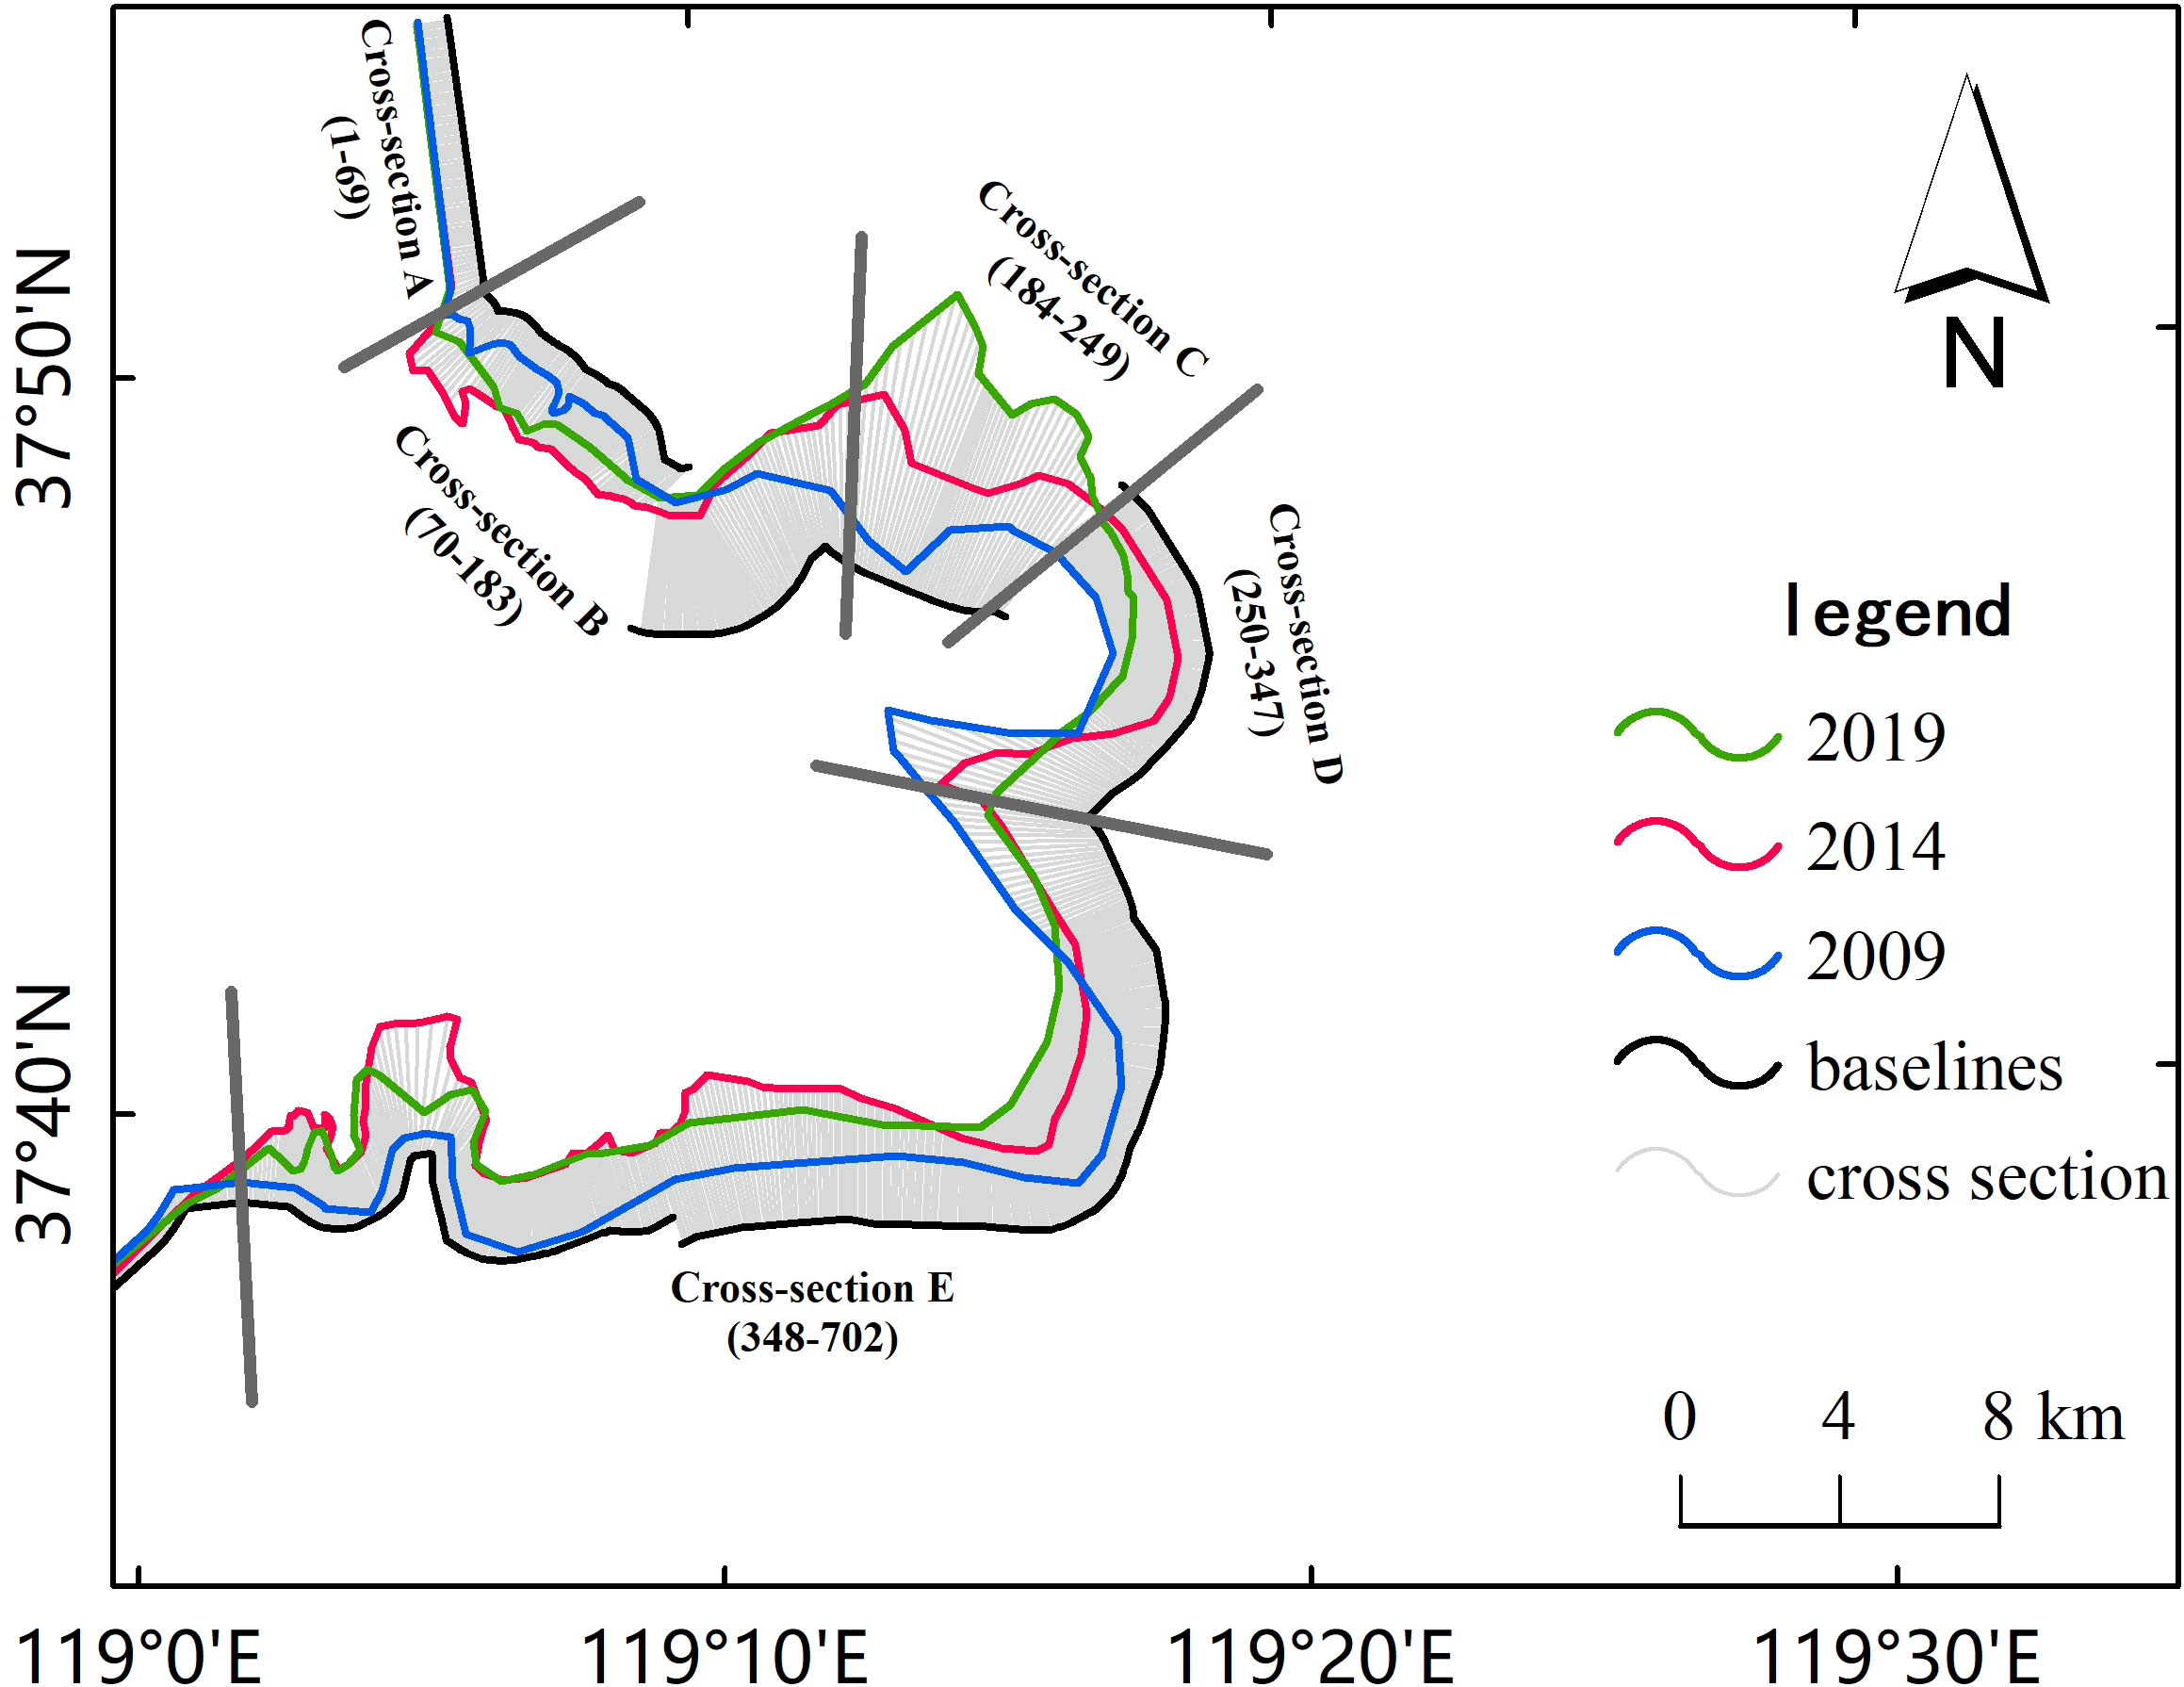
Figure 4 Coastal changes in different periods of the study area.
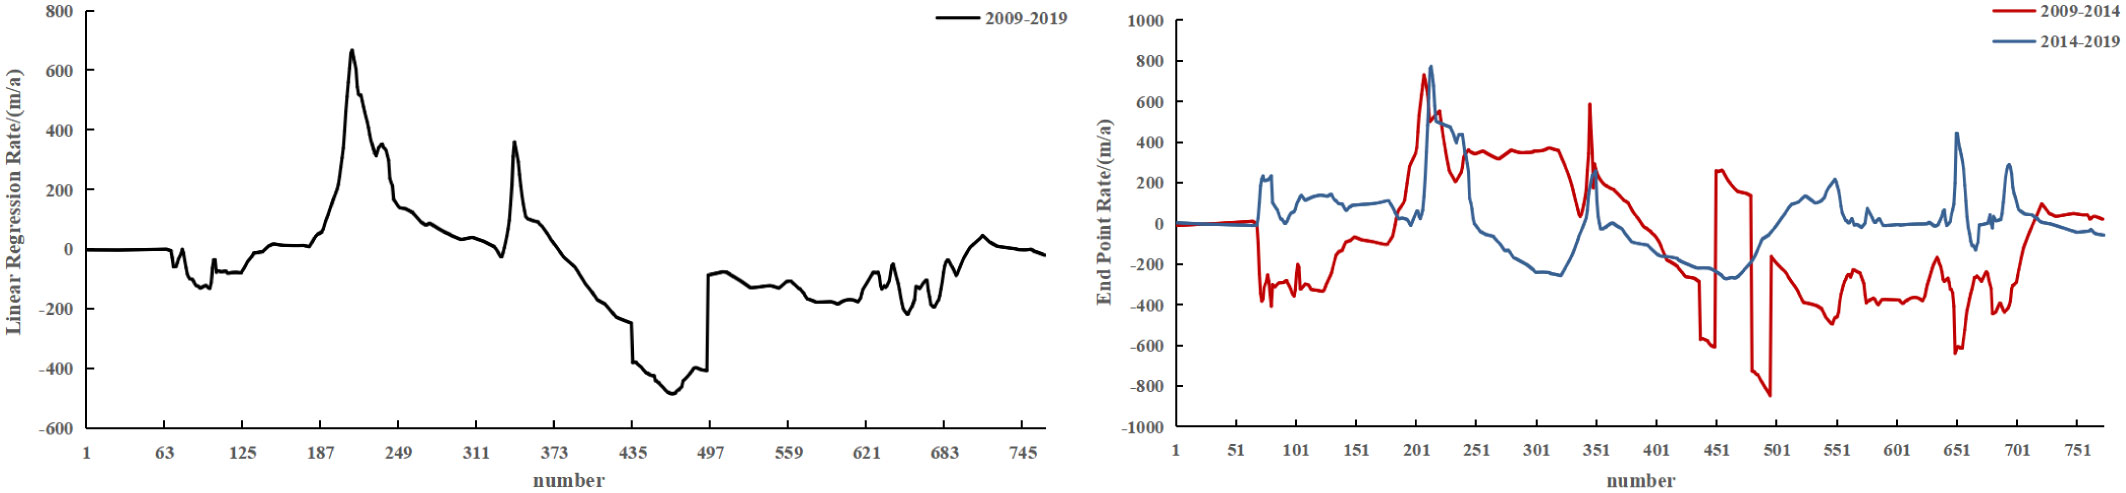
Figure 5 Calculated LRR and EPR by DSAS.
From 2009 to 2014, the coastline near Shenxian Gou to Gudong Seawall (cross-section A and B) was basically eroded, with an average erosion rate of 206m/a. The current estuary area (cross-section C and D) showed an overall trend of silting towards the sea. The coastline advanced an average of 404m, with a maximum shoreline movement rate of 731m/a. The abandoned old estuary area was generally in a state of erosion, with an average erosion of 955m and a maximum shoreline movement rate of 847m/a. The coastline at the estuary (cross-section number C, D and E) changed dramatically, with a maximum change of 3954m. The change rate in other areas was basically stable and did not exceed 408m/a. From 2014 to 2019, the current estuary area was mainly in a state of siltation. Cross-sections B changed from an eroded state to a silted state, with a maximum shoreline movement rate of 233m/a. Cross-sections D changed from a silted state to an eroded state, with a maximum shoreline movement rate of 256m/a. The coastline changes in the abandoned old estuary area were relatively gentle, with only a small part of the coastline showing erosion. The erosion and siltation range was less than that from 2009 to 2014. The average coastline movement was 483m and the maximum shoreline movement rate was 443m/a. From 2009 to 2014, the current estuary increased by an average of 7.7km2/a per year, and from 2014 to 2019 it increased by an average of 7.22km2/a. From 2009 to 2019, the coastline in the study area exhibited an average movement distance of 1285 m (NSM) and an annual change rate of 127.7 m/a (LRR). Among them, the maximum growth and annual change rate of the shoreline were respectively 6.59km (NSM) and 668m/a (LRR), while the maximum erosion and annual change rate were respectively 4.7km (NSM) and 485m/a (LRR). The average increase in the area of the current estuary was 7.68km2/a, while the average decrease in the area of the old estuary was 4.91km2/a.
The dynamic evolution of the delta coastline is determined by the interaction between river inputs and ocean dynamics, with the inflow of seawater and sediment being the main source of shaping the morphology of the delta coastline (Ji et al., 2018). Figure 6 displays the changes in water and sediment discharge from the Yellow River between 2009 and 2019, and the data was obtained from the Sediment Bulletin of the Yellow River Conservancy Commission.
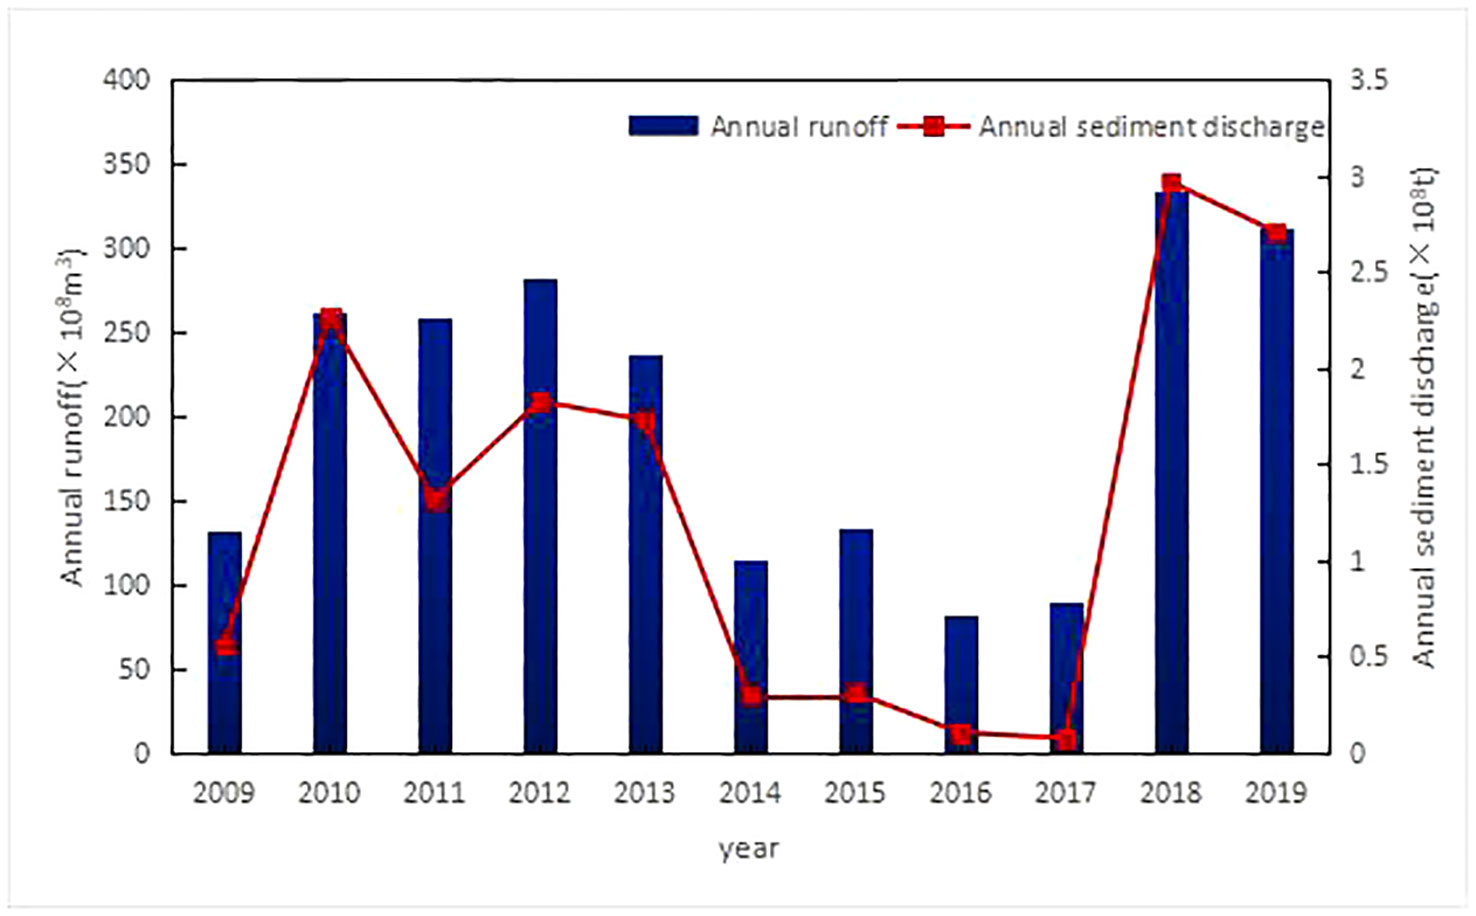
Figure 6 The changes in water and sediment discharge into the sea.
The water and sediment discharge of the Yellow River is continuously changing due to the influence of climate change and human activities. Between 2009 and 2014, the direction of siltation at the estuary shifted towards the north and the extent of shoreline siltation gradually expanded, due to water and sediment management measures. From 2016 to 2017, the interruption of water and sediment regulation resulted in a decrease in the discharge of water and sediment into the ocean. As a result, the primary factor driving changes in the shoreline was replaced by waves. In 2018, water and sediment regulation was resumed, resulting in the increase of the siltation rate at the current estuary and made water and sediment discharge to be the major factor once again for affecting shoreline changes. From 2014 to 2019, the implementation of water and sediment management resulted in a pronounced accumulation of sediment in the study region. In the old estuary area, ocean dynamics were the dominant force, resulting in continuous shoreline erosion. During this period, although sediment discharge could accelerate shoreline evolution, its impact on the shoreline was gradually weakened due to ocean dynamic. The coast of the Yellow River Delta is impacted by the interaction of water and sediment discharged into the ocean, as well as the dynamic of the surrounding sea.
Delft3D is a powerful computer software package developed by the Delft Hydraulics Research Institute (WL Delft Hydraulics), designed for conducting water environment simulation research in various scenarios. The Delft3D-FLOW model is based on Navier-Stokes equations and numerical solution by adopting Alternating Direction Implicit method (ADI).
(1) Continuity equation
Where U and V are the average velocities in the and directions in the curved coordinate system, respectively; Q is the change in volume due to water inflow, outflow, evaporation or precipitation per unit area; P and E represent precipitation and evaporation, respectively; and represent the inflow and outflow of water per unit volume, respectively; and represent the conversion factors from the curved coordinate system and to the x and y directions in the rectangular coordinate system; is the total water depth; represents the coordinate system, which is defined as follows: z is the vertical coordinate in physical space; is the free surface elevation above the reference plane (at z = 0).
(2) Dynamic equation
Where is the vertical velocity in the sigma coordinate system; is the Coriolis force parameter; and are the flow velocities in the and directions; is the reference density of water; and are the hydrostatic pressure gradients in the and directions, respectively; and are the turbulent momentum fluxes in the and directions, respectively; is the vertical turbulent viscosity coefficient; and are source/sink terms for momentum in the and directions, respectively.
Using the Delft3D model, hydrodynamic models were constructed under the shoreline conditions of 2009, 2014, and 2019, respectively. The model uses an orthogonal curvilinear grid. The grid range is between 117° E~122° E, 37° N~41° N, covering the entire Bohai Sea and the western region of the Yellow Sea. In the Yellow River Delta area, the grid is refined and aligned with the shoreline to optimize its utilization and reduce computational time. The model grid is shown in Figure 7. The offshore bathymetry data used in the model is obtained from the ETOPO database, which provides bathymetry data for a large regional area with a resolution of 1′. The bathymetry data for the study area is derived from nautical charts with a precision of 500 m. The offshore boundary is defined by water level boundaries, driven by eight constituents including M2, S2, N2, K2, K1, O1, P1, and Q1. To simulate the Yellow River estuary, a runoff boundary is implemented by using daily discharge data obtained from the Lijin station of the Yellow River Conservancy Commission, which operates under the Ministry of Water Resources, China. The model adopts cold start method with a Manning coefficient of 0.014 and a time step of 2 minutes. To establish a sediment transport model, the model includes the sediment type of cohesive sediment. Excluding sediment input from external sources, all sediment input comes from the Yellow River. The sediment data is sourced from the Lijin station’s sediment concentration and sediment report. The settling velocity is 0.2 mm/s, the critical shear stress for settling is 0.16 N/m2, and the critical shear stress for erosion is 0.15 N/m2.
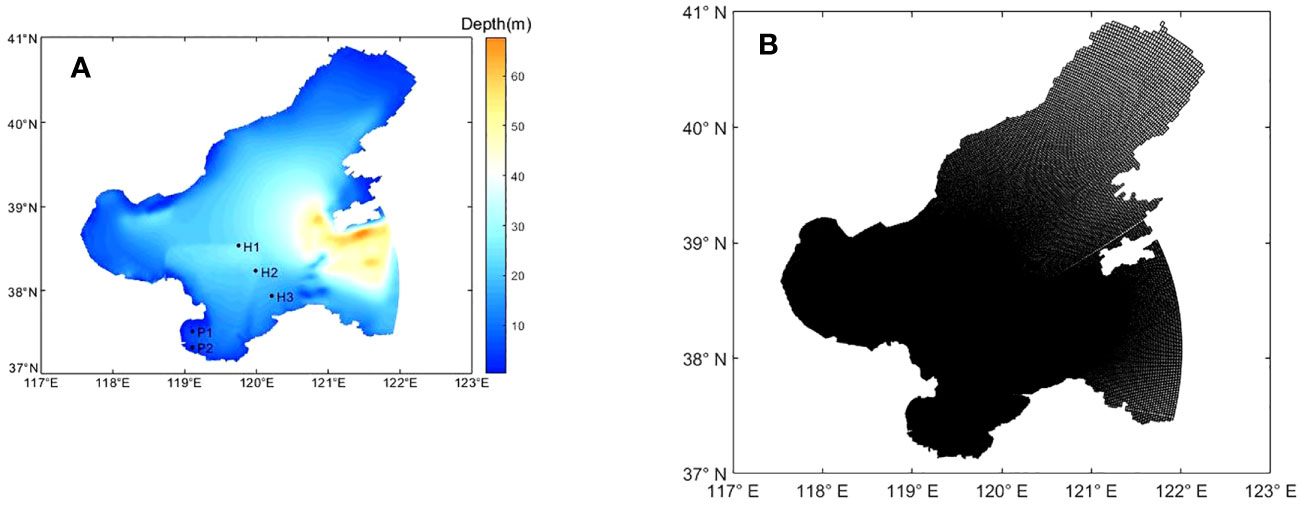
Figure 7 The topography and locations of the observation stations (A) and the grid (B).
The tide and current data are selected from three stations named H1 (119°45’5”, 38°32’21”), H2 (119°59’16”, 38°14’11”), and H3 (120°12’44”, 37°56’7”) in the Bohai Sea area. The sediment data are measured at two stations near the Yellow River Delta at P1 (119°6.376′, 37°30.466′) and P2 (119°6.43′, 37°18.979′). The simulation time ranges from October 1st to October 12th, 2018. To verify the accuracy of the simulation, three parameters are used for statistical analysis: Skill Score (SS), Root Mean Square Error (RMSE), and Correlation Coefficient (CC). Their calculation formulas are as follows:
Where and are the model simulation values and field measured values, respectively; and are the arithmetic means of the simulation and measured values, respectively; is the number of statistical variables. An SS value greater than 0.65 suggests a very high level of accuracy, while a range of 0.5 to 0.65 indicates good accuracy. SS values falling between 0.2 and 0.5 represent fair accuracy, and an SS value below 0.2 indicates poor accuracy. After verification, the simulated data fit well with SS above 0.91 for tide verification and the RMSE above 0.74. The RMSE for current was less than 0.09m/s and the RMSE for flow direction was less than 37°.The overall trends of flow velocity magnitude,direction and suspended sediment concentration were consistent (Figure 8). This indicated that the model had high reliability and could be used for our study.
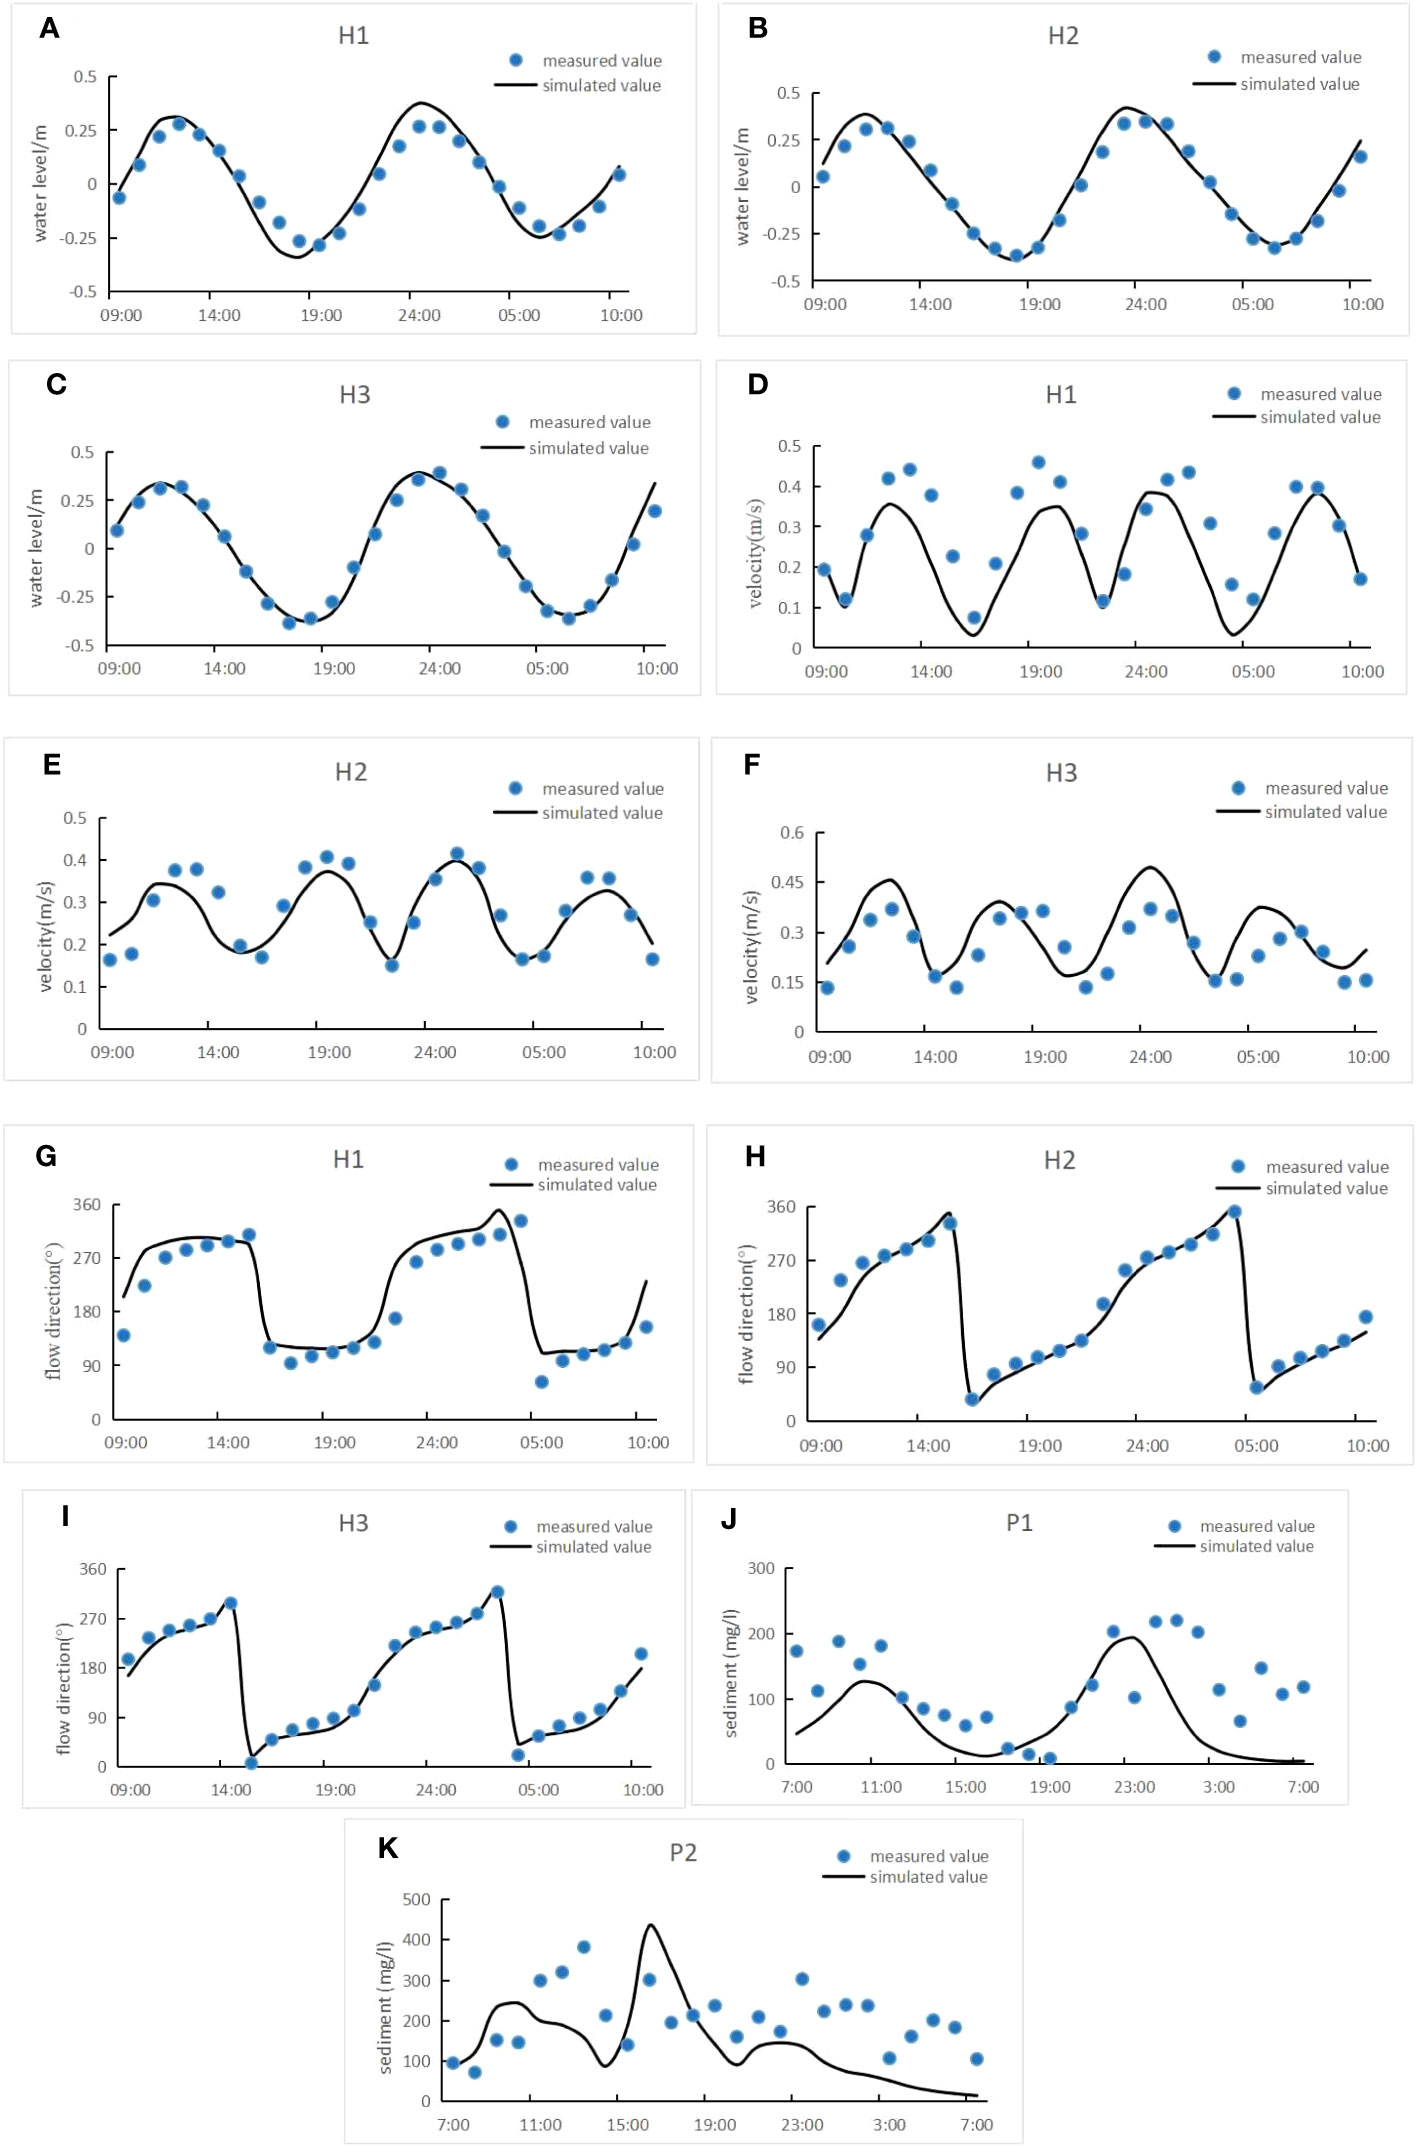
Figure 8 Comparison between measured values and simulated values. (A–C) represent tidal level comparison; (D–I) represent flow velocity and direction comparison; (J) and (K) represent sediment concentration comparison.
This study set up 26 representational measurement points in the Yellow River Delta and Laizhou Bay to intuitively analyze the impact of shoreline changes on ocean dynamics (Seen in Figure 9). Points 1-9 are close to the shoreline while points 10-26 gradually extend towards the open sea. We selected the same time during high tide and low tide to compare flow velocity changes under different shoreline conditions (Figure 10) and calculated change rates (Table 2).
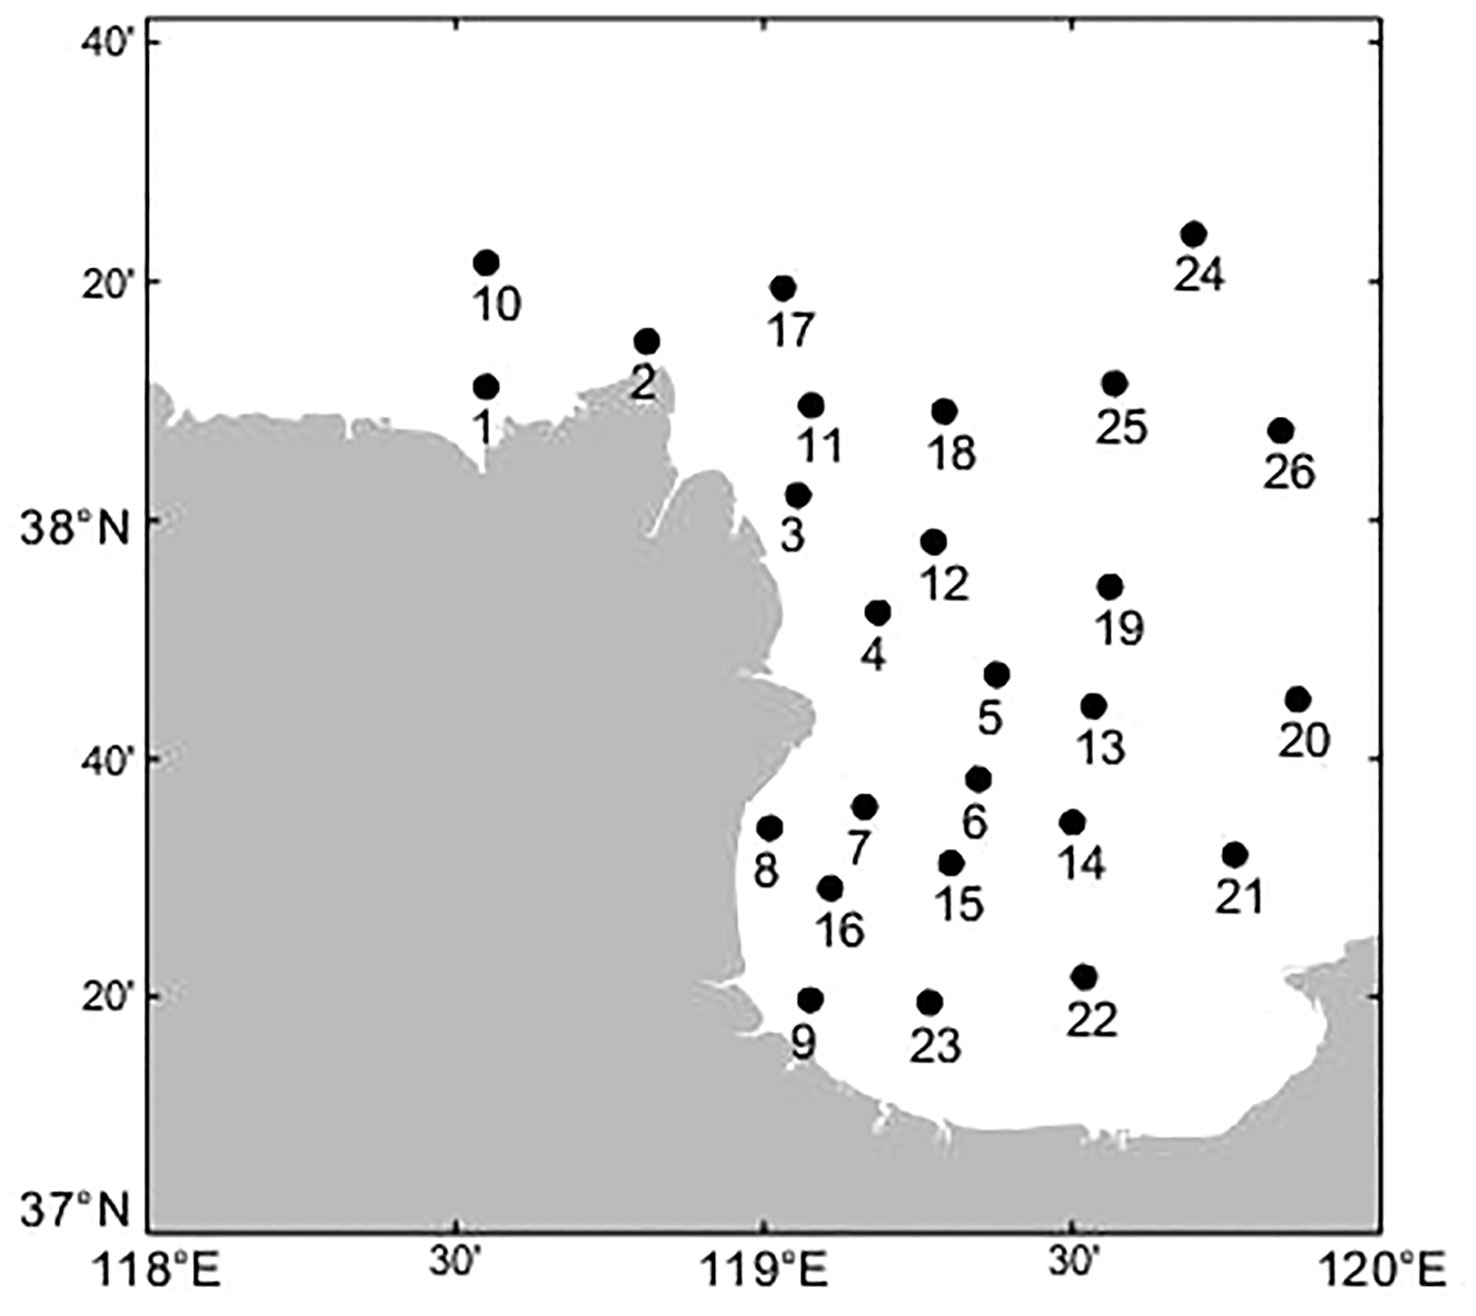
Figure 9 Distribution of characteristic measurement points.
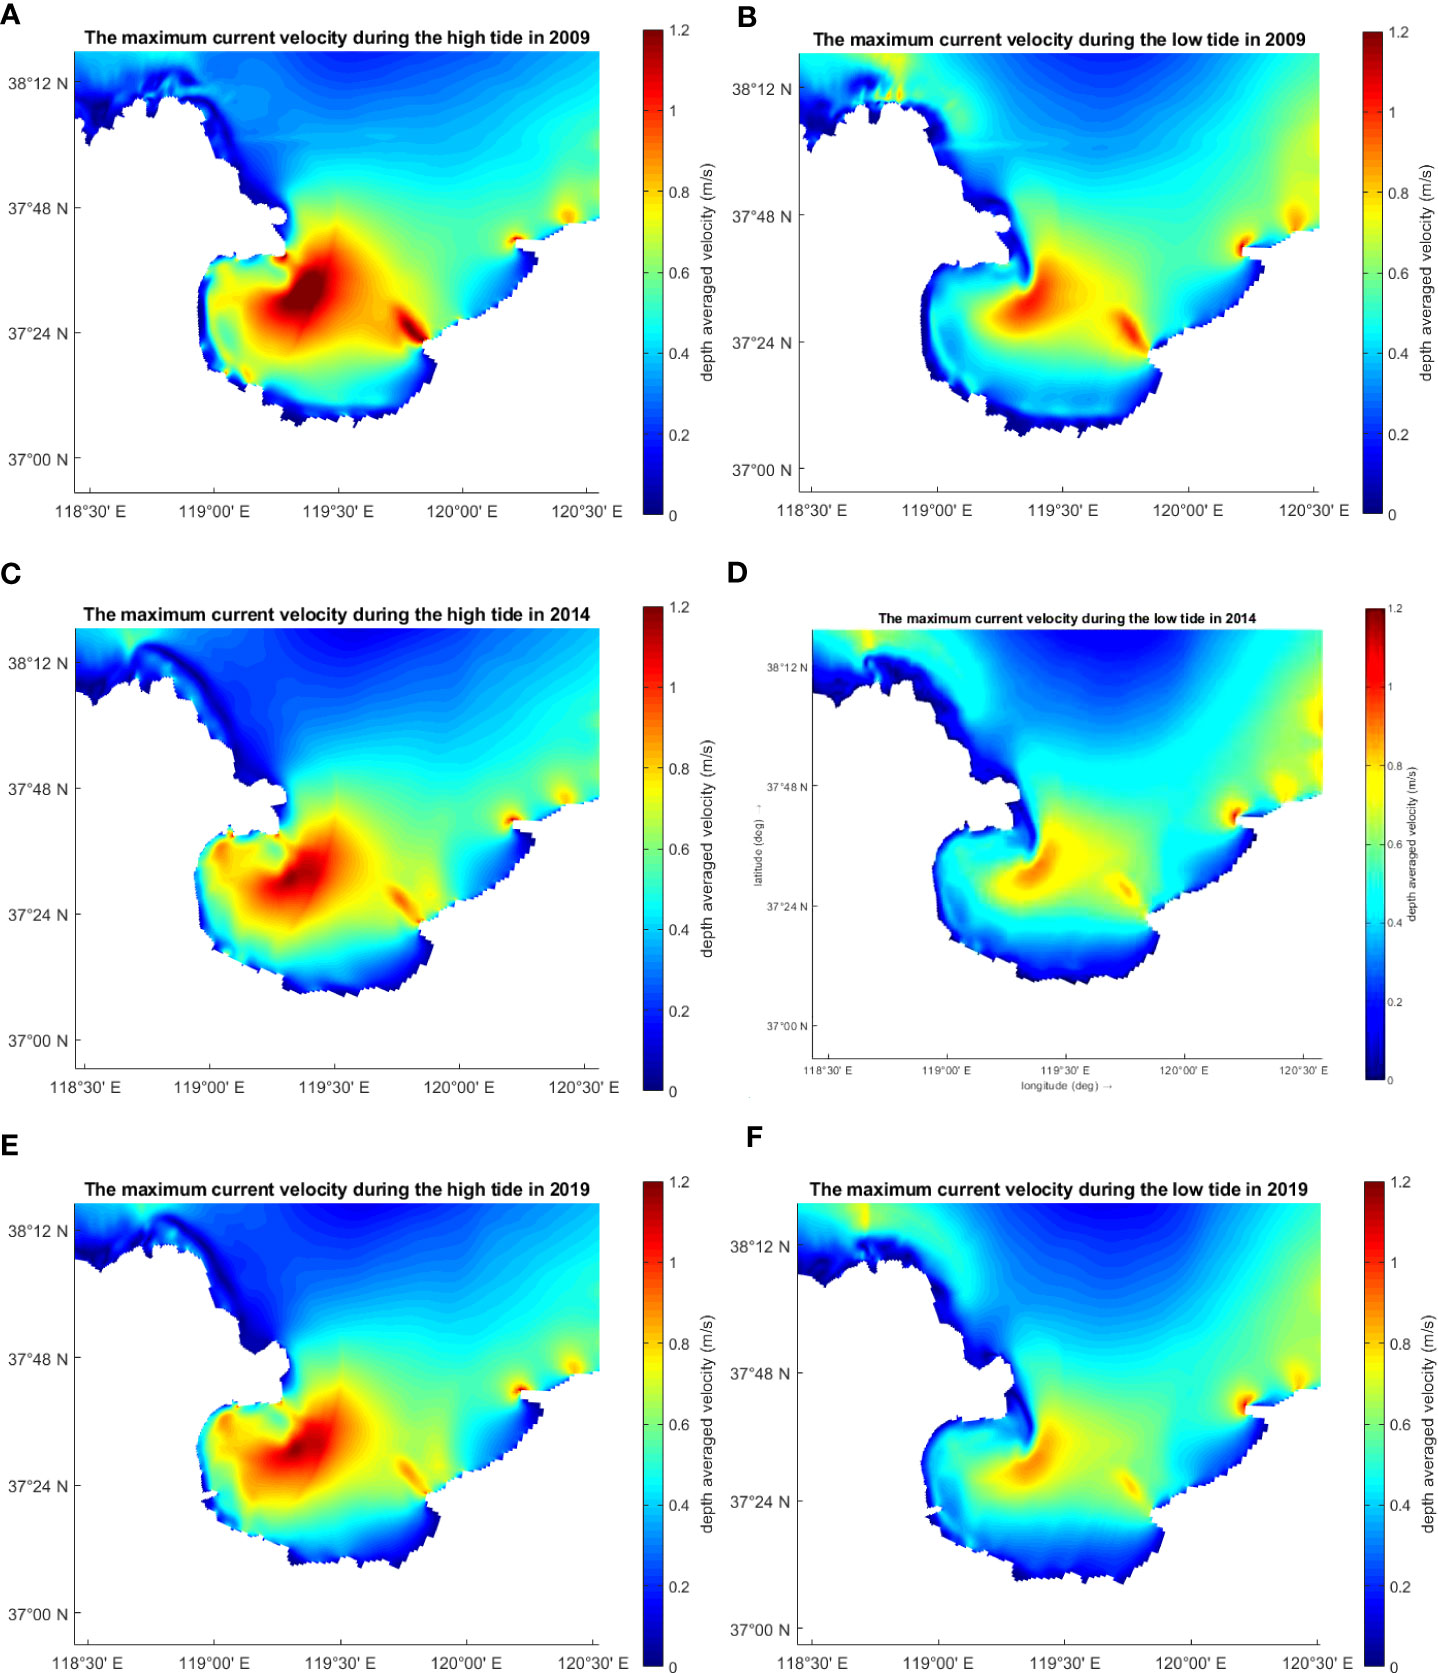
Figure 10 The maximum tidal current velocity during high and low tides in different years.
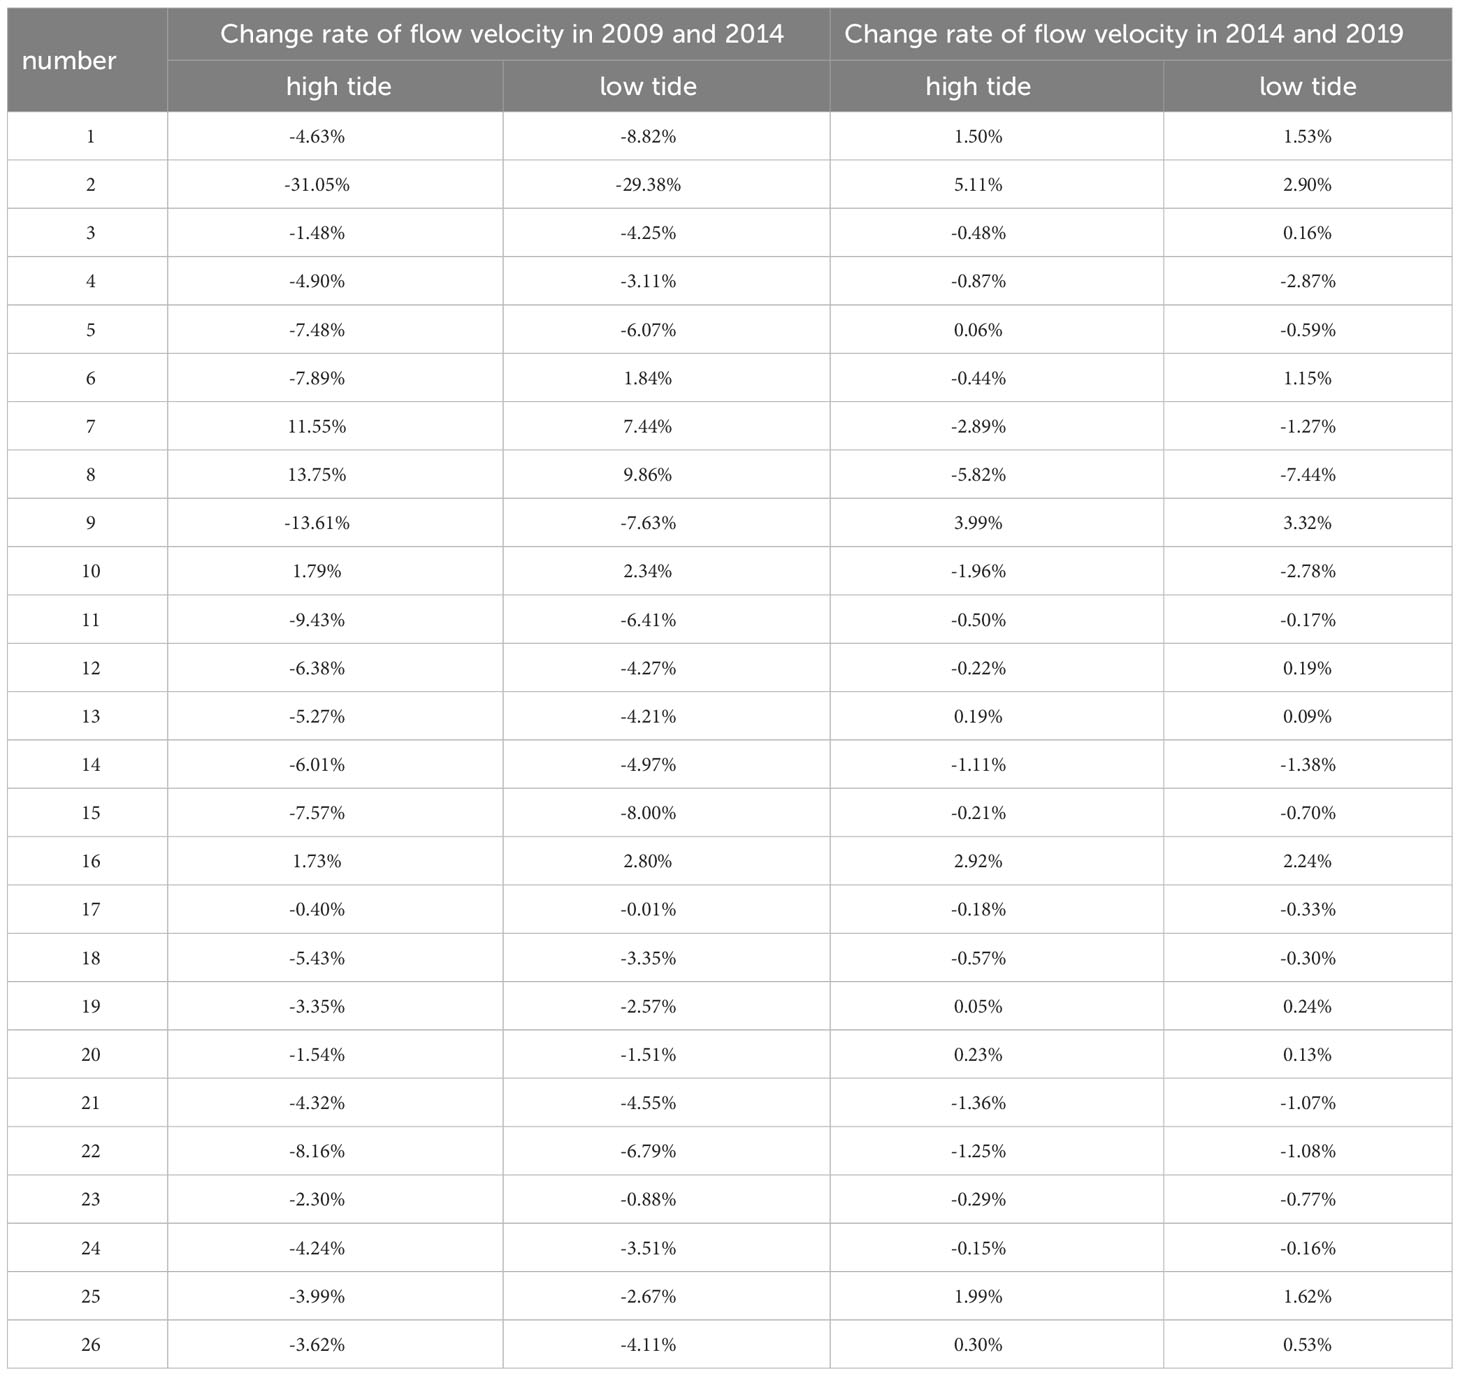
Table 2 The change rate of flow from 2009 to 2019.
Overall, the results of flow velocity changes are mostly negative, with velocity in high tide period generally greater than that in low tide period. The measurement points that located near the Yellow River estuary, specifically between point 4 and point 9, are susceptible to changes in the shoreline and river discharge. The changes of flow velocity magnitude are relatively significant. Among them, points 4 and point 5 are located in the current estuary, with flow velocity above 0.5 m/s. From 2009 to 2019, the current estuarine coastline gradually extended outward, resulting in shallower water depths and a continuous decrease in flow velocity, with a decrease range of approximately 0.03 to 0.09 m/s. Points 7 and point 8 are located in the abandoned estuary. From 2009 to 2019, the abandoned estuarine coastline underwent erosion, resulting in a deepening of the seabed. The flow velocity initially increased significantly by approximately 0.08 to 0.11 m/s, and then gradually decreased by 0.03 to 0.06 m/s. From 2009 to 2014, there was significant siltation along the northern coastline of Dongying, which resulted in a decrease in flow velocity at point 1 and point 2, with the maximum value of 0.3 m/s. Measuring points from 24 to 26 are located near the interior of the Bohai Sea and are relatively far from the coastline. They are minimally influenced by the changes of the Yellow River estuary coastline, with flow velocity variations below 0.03 m/s. Due to the topography, the measuring points within Laizhou Bay generally exhibit higher flow velocity, exceeding 0.4 m/s. Due to the siltation at the Yellow River estuary, the width of Laizhou Bay gradually increases. This leads to a decrease in flow velocity. In Laizhou Bay, the flow velocity decreased rapidly from 2009 to 2014, with a maximum change rate of 13.61%. From 2014 to 2019, the flow velocity showed a slow decrease tendency. From 2009 to 2014, changes in the coastline of the Yellow River Delta had a more pronounced impact on the speed of high tide in comparison to low tides. From 2014 to 2019, shoreline changes were relatively small and flow velocity changes were also relatively small, with a maximum change rate of 7.44% and a minimum of 0.05%. Overall, shoreline changes can have an impact on tidal currents within nearshore areas. The more dramatic the shoreline changed and the closer to the coast, the greater the impact showed.
Due to friction, seabed topography, boundary conditions and other reasons, residual currents caused by nonlinearity in tidal currents are called tidal-induced residual currents. Nonlinear effects are stronger closer to the coast (Wang, 2012). Eulerian tidal residual current refers to the average vector at a fixed location over one or more tidal cycles and is expressed as:
Where is Eulerian tidal residual current; is statistical time; is tidal current velocity at spatial point.
Based on simulation results for one spring tide cycle, we calculated surface residual currents in three years and obtained differences between residual currents for each year as shown in Figure 11.
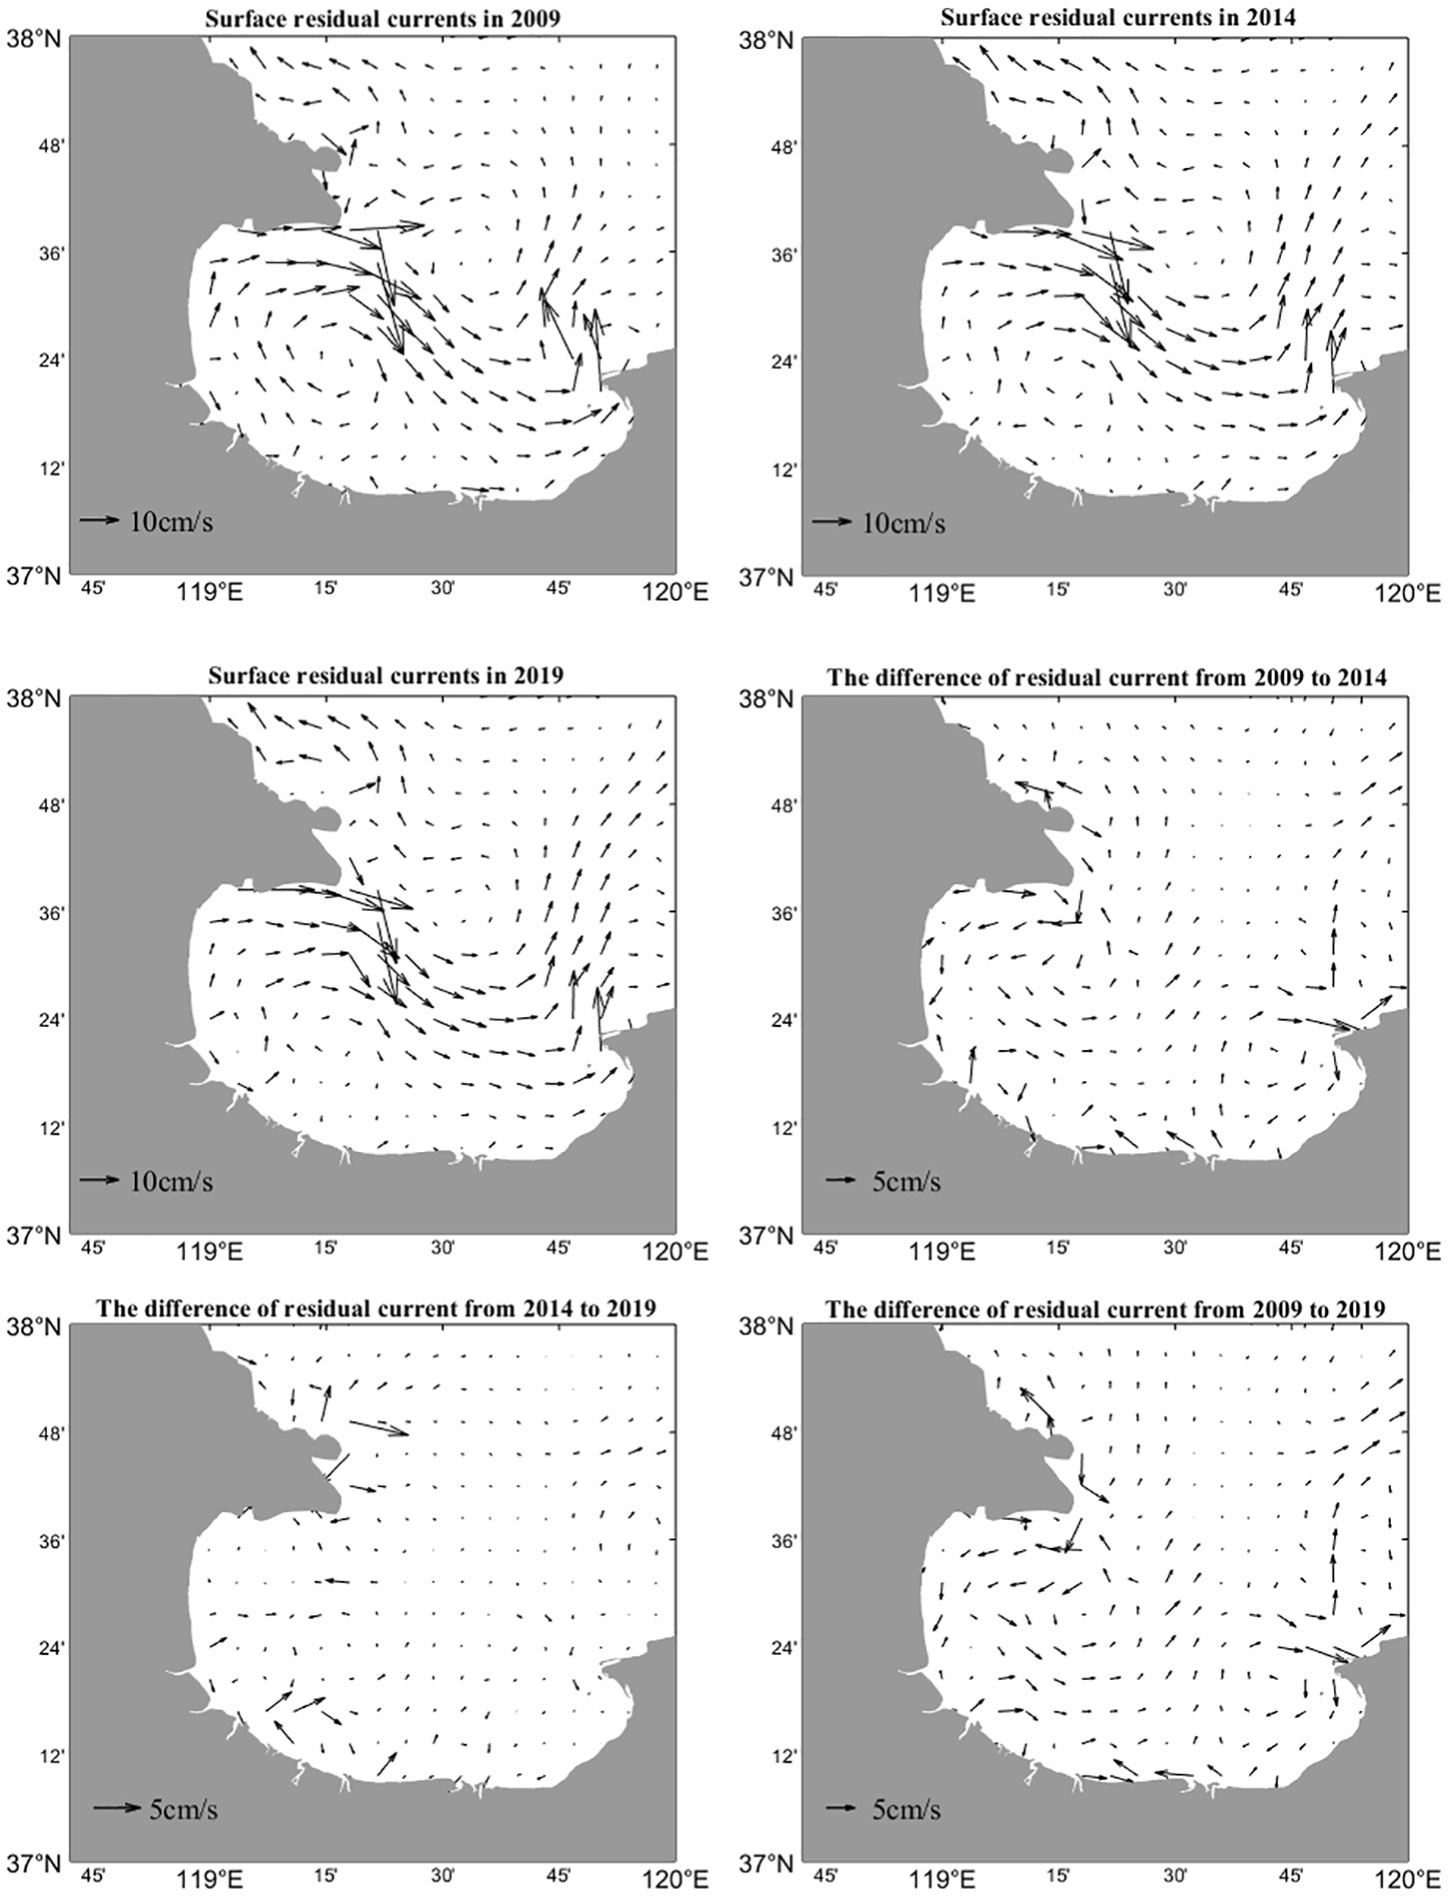
Figure 11 Residual current calculation results.
Sediment from the Yellow River subsides in the estuary channel, intertidal zone, and coastal area and is transported by residual currents to extend the shoreline of the current estuary towards the sea. Residual currents are influenced by many factors such as water depth, tides, shoreline and wind field, among which the most important factors are shoreline and water depth. The Bohai Sea region experiences minimal residual current, whereas Laizhou Bay and the Yellow River estuary area encounter strong residual current, averaging of 3-20cm/s. The residual currents primarily flow offshore, and the prominent coastline of the Yellow River estuary affects the magnitude and direction of the residual currents. To the north of the Yellow River estuary, the residual currents exhibit a northwest direction, while south of the estuary, the residual currents flow in a southeast direction. The surface residual currents are generally greater than those in other layers. From 2009 to 2019, the residual currents near the current estuary gradually increased by approximately 2 cm/s, while the residual currents near the abandoned old estuary decreased by approximately 1 cm/s. Along the coast of Laizhou Bay, there was an average decrease of 3-6 cm/s in the residual currents. However, in the southeast direction near Diaolongkou, the residual currents exhibited an increase tendency. The residual currents near the estuary and coastal areas are notably impacted by variations in the coastline. They generally exhibit speeds ranging from 10 cm/s to 25 cm/s and tend to maintain relatively stable flow directions. Residual current variations in the offshore areas are relatively small, with an average increase of 0.5 cm/s.
The coastline of 2019 is used for simulation. The model simulation is conducted for a period of one year. By adjusting the acceleration factor, the sedimentation and erosion changes are calculated for one year, two years, five years, and ten years, respectively. The results are shown in Figure 12. The simulation results for a period of one to two years indicate that the current estuary area is showing signs of sediment accumulation. Due to the water flow from the Yellow River, the sedimentation at the estuary is relatively small. There is only slight erosion in the abandoned estuary, with an erosion rate of less than 0.15 m/a. The calculation results for erosion and siltation over a period of five to ten years indicate that there is significant siltation in the nearshore area within 15.45 km of the current estuary. The sediment thickness can reach up to 8 m after ten years. Erosion has intensified at the abandoned estuary, and erosion phenomena have appeared within a 17.7km away from the Yellow River Delta. The maximum erosion thickness can reach up to 2 m. Under the dynamics of tidal currents, the sediment carried by the Yellow River mainly accumulates at the current estuary. The shorter the distance to the estuary, the greater the degree of sedimentation. The abandoned old estuary area is experiencing erosion in the coastal area, with the greatest erosion intensity observed at the estuary. To the north of the Yellow River Delta, there is a counterclockwise circulation, while to the south, there is a clockwise circulation. Influenced by the direction of residual currents, sediment deposition is occurring in the northeast direction, gradually shifting towards the northern region.
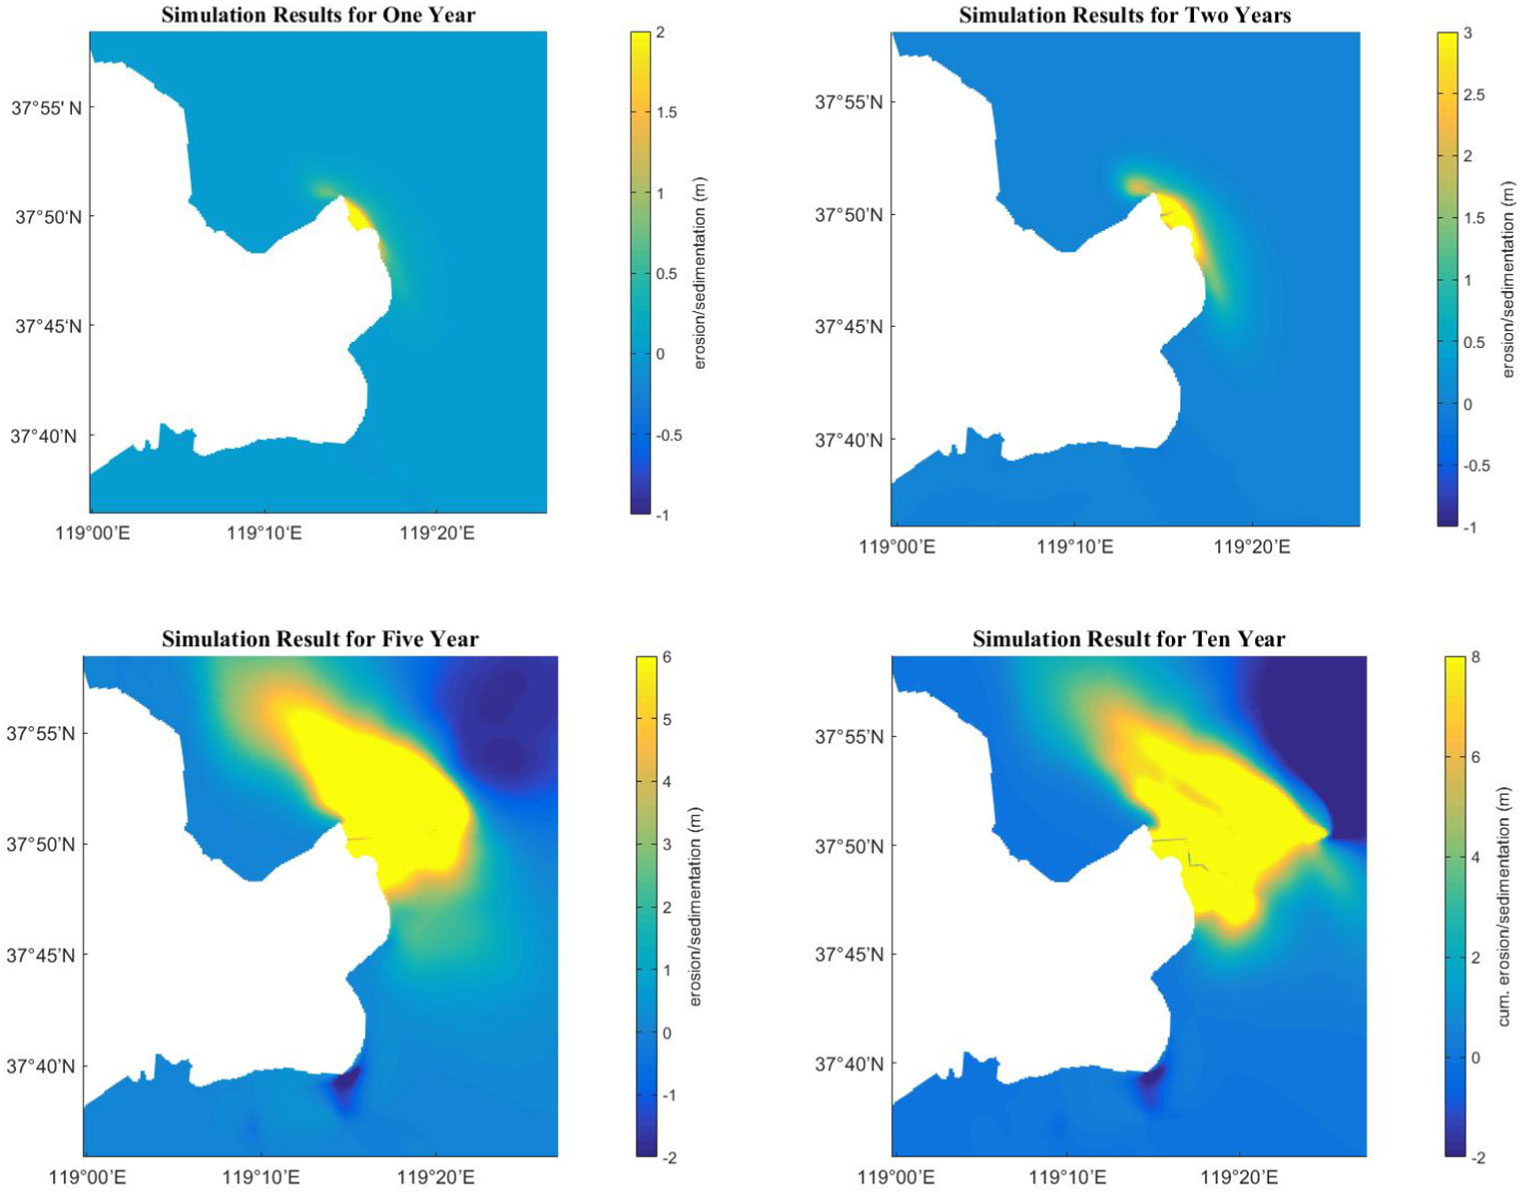
Figure 12 The Calculation Results of Bed Evolution.
The Yellow River Delta has the widest and most complete coastline in China, which has been studied by many scholars (Niu and Wang, 2020; Zhu et al., 2021). When investigating the coastal evolution of the Yellow River Delta, Liu et al. (2021) and Li et al. (2020) found that over a long-term scale, as a result of the Yellow River’s artificial diversion, sediment is primarily transported to the northeast of Qingshuigou, while the southeast region loses sediment supply and undergoes continuous erosion due to seawater intrusion. Tidal action and insufficient inland sediment supply are the two main factors causing coastal erosion in the Yellow River Delta. These results align with our research findings, where we observed through remote sensing imagery and DSAS calculations that the Yellow River Delta is gradually accreting towards the northeast at a decreasing rate, while the abandoned estuary continues to erode. These studies indicate that human activities have had long-term and profound impacts on coastal evolution. With the intensification of global climate change, rising sea levels, and increasing frequency and intensity of extreme weather events, the impacts on coastal evolution will become even more complex. Therefore, it is necessary to strengthen research on the evolution of the Yellow River Delta coast in order to better understand and adapt to these changes and implement appropriate protection measures.
Currently, most research on the Yellow River Delta focuses on analyzing overall changes in the coastline, with limited studies on the impacts of coastline changes and future trends in shoreline evolution. This paper further explores the response of tidal currents to coastline evolution and uses this as a basis for predicting coastline changes. Previous studies have mainly used traditional coastline morphology prediction systems and combined gray models with technologies such as remote sensing, GIS, and cellular automata to simulate coastline changes (Thottolil et al., 2020; Laksono et al., 2022). However, these methods often overlook key influencing factors such as water and sediment discharges, river channel position, seabed topography, and ocean dynamics. In comparison, numerical models have the advantage of simulating the erosion and accretion evolution processes of coastlines. In this study, the Delft3D model is used to simulate the hydrodynamic field under different coastline conditions. Sedimentation and erosion trends in the Yellow River Delta region are investigated by setting an acceleration factor. Lu et al. (2022) found that overall residual currents in the Bohai Sea are increasing due to coastal land reclamation and natural sedimentation, with varying degrees of increase near the Yellow River estuary and Laizhou Bay. However, this differs from our research results because we specifically focused on the coastal changes in the Yellow River Delta region. To control variables, we did not consider the influence of coastline changes in other regions on the tidal current field. Additionally, the use of different models and data sources can lead to significant discrepancies in results. Jia et al. (2018) investigated the impact of coastline changes caused by port construction on the hydrodynamics of the Bohai Bay. The protruding coastline weakened the flow velocity and caused a deviation in flow direction, reducing the transport capacity of substances in the water. The deviation in flow directions also altered the pathways and distribution patterns of materials. Chen et al. (2008) found that the sediment transported by the Yellow River mostly settles near the estuary, making it difficult to be transported to farther ocean areas. Zhang et al. (2016) found that the abandoned Yellow River estuary is in an eroding state, and the sediment is transported to other places as a source of sediment. This study also confirms this result, with the Yellow River Delta coastline showing a clear response to the sediment transport of the Yellow River, while residual currents play an important role in sediment transport. Dong et al. (2020) compared two scenarios with and without wave action and found that waves have a strong impact on the evolution of abandoned river mouths. Waves are an important factor influencing geomorphological evolution. However, in this study, only sediment transport under tidal currents is considered, which has certain limitations. In future research, more factors will be considered to establish a more comprehensive model for investigating the geomorphological evolution of the Yellow River Delta.
The combination of DSAS and satellite data has been successfully applied to analyze coastal line changes in delta regions. This study establishes hydrodynamic and sediment transport models using the Delft3D, and the following conclusions are drawn:
(1) The coastline of the Yellow River Delta is unstable and is easily influenced by sediment discharge and ocean dynamics. From 2009 to 2019, the current estuarine coastline showed an overall trend of accretion, with the accretion area mainly located at the current estuary, and the average shoreline migration rate was 174.9m/a. The erosion area was mainly located near the abandoned estuary, with an annual rate of change of -140.77m/a.
(2) From 2009 to 2019, the flow velocity changes in the study area showed negative values, and the flow velocity in the estuarine area showed a large range of changes. The overall residual current in the Bohai Sea was small, while the residual current in the Yellow River estuary was relatively large, with an average size of 3~20cm/s. The residual current velocity at the current estuary has been continuously increasing, with an average increase of 2cm/s. The residual current near the abandoned estuary has decreased by approximately 1cm/s. The closer to the coast, the greater the impact of shoreline changes, with less impact on the central part of the Bohai Sea.
(3) Sediment transport is influenced by residual currents, with sediment accreting towards the northeast at the current estuary and gradual erosion near the abandoned estuary, leading to shoreline movement. These studies provide scientific support for coastal management and development protection.
The original contributions presented in the study are included in the article/supplementary material. Further inquiries can be directed to the corresponding author.
LZ- writing, data analysis, figures, study design, literature search. HX- data analysis, study design PL- data analysis, data collection. PM-data collection, literature search. HS- paper review, study design. All authors contributed to the article and approved the submitted version.
This research was funded by the Major Research Grant (No. U1906231, U1806227) and the Natural. Science Foundation of China (No. 51909114) from the Natural Science Foundation of China (NSFC).
The authors declare that the research was conducted in the absence of any commercial or financial relationships that could be construed as a potential conflict of interest.
The reviewer WQ declared a shared affiliation with the authors to the handling editor at the time of review.
All claims expressed in this article are solely those of the authors and do not necessarily represent those of their affiliated organizations, or those of the publisher, the editors and the reviewers. Any product that may be evaluated in this article, or claim that may be made by its manufacturer, is not guaranteed or endorsed by the publisher.
Bheeroo R. A., Chandrasekar N., Kaliraj S., Magesh N. S. (2016). Shoreline change rate and erosion risk assessment along the Trou Aux Biches–Mont Choisy beach on the northwest coast of Mauritius using GIS-DSAS technique. Environ. Earth Sci. 5 75, 1–12. doi: 10.1007/s12665-016-5311-4
Chen C., Bu J., Zhang Y., Zhuang Y., Chu Y., Hu J., et al. (2019). The application of the tasseled cap transformation and feature knowledge for the extraction of coastline information from remote sensing images. Adv. Space Res. 64 (9), 1780–1791. doi: 10.1016/j.asr.2019.07.032
Chen X., Chen S., Dong P., Li X. (2008). Temporal and spatial evolution of the coastal profiles along the yellow river delta over last three decades. Geojournal 71 (2-3), 185–199. doi: 10.1007/s10708-008-9155-7
Chrysanti A., Adityawan M. B., Widyaningtyas., Yakti B. P., Tanaka H. (2019). Prediction of shoreline change using a numerical model: case of the kulon progo coast, central java. MATEC Web Conferences 270 (1), 4023. doi: 10.1051/matecconf/201927004023
Cui B., Li X. (2011). Coastline change of the Yellow River estuary and its response to the sediment and runoff, (1976–2005). Geomorphology. 127 (1-2), 32–40. doi: 10.1016/j.geomorph.2010.12.001
Dong C., Zhan C., Lin Z., Yi F., Zhu J., Shi H., et al. (2020). Numerical study on the difference in geomorphic dynamics between current and abandoned estuarine coasts of the yellow river delta. J. Coast. Res. 99 (sp1). 227–235. doi: 10.2112/SI99-033.1
Fan Y., Chen S., Zhao B., Pan S. Q., Jiang C. (2018). Shoreline dynamics of the active Yellow River delta since the implementation of Water-Sediment Regulation Scheme: A remote-sensing and statistics-based approach. Estuarine Coast. Shelf Science 200, 406–419. doi: 10.1016/j.ecss.2017.11.035
Himmelstoss E. A., Henderson R. E., Kratzmann M. G., Farris A. S. (2018). Digital shoreline analysis system (DSAS) version 5.0 user guide (No. 2018-1179). US Geological Survey.
Hossen M. F., Sultana N. (2023). Shoreline change detection using DSAS technique: Case of Saint Martin Island, Bangladesh. Remote Sens. Applications: Soc. Environ. 30, 100943. doi: 10.1016/J.RSASE.2023.100943
Huang B., Lin H., Ren Y. (2019). “Estuary shifting and the impacts on coastline changes in the yellow river delta,” in IOP Conference Series: Earth and Environmental Science (IOP Publishing), Vol. 227 (5), 052021. doi: 10.1088/1755-1315/227/5/052021
Ji H., Chen S., Pan S., Xu S., Jiang C., Fan C., et al. (2018). Morphological variability of the active Yellow River mouth under the new regime of riverine delivery. J. Hydrology. 564, 329–341. doi: 10.1016/j.jhydrol.2018.07.014
Jia H., Shen Y. M., Su M., Yu C. X. (2018). Numerical simulation of hydrodynamic and water quality effects of shoreline changes in Bohai Bay. Front. Earth Sci. 3). doi: 10.1007/s11707-018-0688-x
Jia G., Wang R., Stacey T. M. (2019). Investigation of impact of shoreline alteration on coastal hydrodynamics using Dimension REduced Surrogate based Sensitivity Analysis. Adv. Water Resour. 126, 168–175. doi: 10.1016/j.advwatres.2019.03.001
Jiang C., Pan S., Chen S. (2017). Recent morphological changes of the Yellow River (Huanghe) submerged delta: Causes and environmental implications. Geomorphology 293, 93–107. doi: 10.1016/j.geomorph.2017.04.036
Khosravi M. R., Bahri-Aliabadi B., Salari R., Samadi S., Karimi V. (2020). A tutorial and performance analysis on ENVI tools for SAR image despeckling. Curr. Signal Transduction Ther. 15 (2), 215–222. doi: 10.2174/1574362413666181005101315
Kong D., Miao C., Borthwick A., Duan Q., Liu H., Sun Q., et al. (2015). Evolution of the Yellow River Delta and its relationship with runoff and sediment load from 1983 to 2011. J. Hydrology. 520, 157–167. doi: 10.1016/j.jhydrol.2014.09.038
Laksono F. A. T., Borzì L., Distefano S., Stefano A. D., Kovács János. (2022). Shoreline prediction modelling as a base tool for coastal management: the catania plain case study (Italy). J. Mar. Sci. Eng. 10 (12), 1988. doi: 10.3390/JMSE10121988
Li C., Zhu L., Dai Z., Wu Z. (2021). Study on spatiotemporal evolution of the yellow river delta coastline from 1976 to 2020. Remote Sensing. 13 (23), 4789. doi: 10.3390/rs13234789
Liu X., Chen S., Li P., Fu Y., Zhang C. (2022). Dynamic evolution and influencing factors of the shoreline of the Huanghe River Estuary from 1996 to 2020. Mar. Sci. Bull. 41 (04), 436–450. doi: 10.11840/j.issn.1001-6392.2022.04.009
Liu Y., Li X., Hou X. (2020). Spatiotemporal changes to the river channel and shoreline of the Yellow River delta during a 40 -year period, (1976-2017). J. Coast. Res. 36 (1), 128–138. doi: 10.2112/JCOASTRES-D-19-00012.1
Liu Z., Xu N., Wang J. (2020). Satellite-observed evolution dynamics of the yellow river delta in 1984-2018. IEEE J. Selected Topics Appl. Earth Observations Remote Sensing 13, 6044–6050. doi: 10.1109/JSTARS.2020.3026708
Lu J., Zhang Y., Lv X., Shi H. (2022). The temporal evolution of coastlines in the Bohai Sea and its impact on hydrodynamics. Remote Sens. 14 (12), 5549. doi: 10.3390/RS14215549
Mahamoud A., Maher G., Mohamed N. A., Hamada S. H., Montacer M. (2023). Monitoring shoreline change using remote sensing, GIS, and field surveys: a case study of the Ngazidja Island Coast, Comoros. Arabian J. Geosciences 16 (2), 114. doi: 10.1007/S12517-023-11200-Y
Mahapatra M., Ratheesh R., Rajawat A. S. (2014). Shoreline change analysis along the coast of south gujarat, India, using digital shoreline analysis system. J. Indian Soc. Remote Sens. 42 (4), 869–876. doi: 10.1007/s12524-013-0334-8
McFeeters S. K. (1996). The use of the NorMalized Difference Water Index(NDWI) in the delineation of open water features. Int. J. Remote Sens. 17 (7), 1425–1432. doi: 10.1080/01431169608948714
Mondal I., Thakur S., Juliev M., Bandyopadhyay J., De T. K. (2020). Spatio-temporal modelling of shoreline migration in sagar island, west bengal, India. J. Coast. Conserv. 24 (50), 1–20. doi: 10.1007/s11852-020-00768-2
Mujabar S., Chandrasekar (2011). A shoreline change analysis along the coast between Kanyakumari and Tuticorin, India, using digital shoreline analysis system. Geo-spatial Inf. Sci. 14 (4), 282–293. doi: 10.1007/s11806-011-0551-7
Mujabar P. S., Chandrasekar N. (2013). Shoreline change analysis along the coast between Kanyakumari and Tuticorin of India using remote sensing and GIS. Arabian J. geosciences 6, 647–664. doi: 10.1007/s12517-011-0394-4
Niu M., Wang J. (2020). Spatiotemporal heterogeneity of Shoreline changes in Dongying section of the Yellow River Delta based on Landsat. Water Resour. Prot. 36, 26–33. doi: 10.3880/j.jssn.10046933.2020.04.005
Sam S. C., Gurugnanam B. (2022). Coastal transgression and regression from 1980 to 2020 and shoreline forecasting for 2030 and 2040, using DSAS along the southern coastal tip of Peninsular India. Geodesy Geodynamics 13 (06), 585–594. doi: 10.1016/j.geog.2022.04.004
Shi H., Li Q., Sun J., Gao G., Sui Y., Qiao S., et al. (2020). Variation of yellow river runoff and its influence on salinity in laizhou bay. J. Ocean Univ. China (Oceanic Coast. Sea Research) 19 (6), 10. doi: 10.1007/s11802-020-4413-5
Siyal A. A., Solangi G. S., Siyal Z. A., Siyal P., Babar M. M., Ansari K. (2022). Shoreline change assessment of Indus delta using GIS-DSAS and satellite data. Regional Stud. Mar. Sci. 53, 102405. doi: 10.1016/j.rsma.2022.102405
Song R. (2021). Vegetation coverage evaluation of Yangtze River great protection based on envi software - A case study of Maanshan City. J. Physics: Conf. Ser. 1744 (3), 032208. doi: 10.1088/1742-6596/1744/3/032208
Thottolil R., Shreedhara V., Gouda K. C. (2020). Monitoring and modeling of shoreline changes in mangalore coastal zone management: A case study from karnataka, India. Int. J. Environ. Res. 2 (1), 52–60. doi: 10.21275/ART20201813
Wang K. (2019). Evolution of yellow river delta coastline based on remote sensing from 1976 to 2014, China. Chin. Geographical Sci. 29 (2), 181–192. doi: 10.1007/s11769-019-1023-5
Wilkowski W., Lisowski M., Wyszyński M., Wierzbicki D. (2017). The use of unmanned aerial vehicles (drones) to determine the shoreline of natural watercourses. J. Water Land Dev. 35 (1), 259. doi: 10.1515/jwld-2017-0092
Xu H. (2005). A study on information extraction of water body with the modified norMalized difference water index (MNDWI). J. Remote Sens. 9 (5), 589–595. doi: 1007-4619(2005)05-0589-07
Xu N., Gao Z., Ning J. (2016). Analysis of the characteristics and causes of coastline variation in the Bohai Rim, (1980–2010). Environ. Earth Sci. 75, 1–1. doi: 10.1007/s12665-016-5452-5
Yu J., Fu Y., Li Y., Han G., Wang Y., Zhou D., et al. (2011). Effects of water discharge and sediment load on evolution of modern Yellow River Delta, China, over the period from 1976 to 2009. Biogeosciences 8 (9), 2427–2435. doi: 10.5194/bg-8-2427-2011
Zhan C., Yu J. B., Wang Q., Li Y. Z., Zhou D., Xing Q. H., et al. (2017). Remote sensing retrieval of surface suspended sediment concentration in the Yellow River Estuary. Chin. Geographical Science. 27 (6), 934–947. doi: 10.1007/s11769-017-0921-7
Zhang L., Chen S., Yi L. (2016). The sediment source and transport trends around the abandoned yellow river delta, China. Mar. Georesources Geotechnology 34 (5), 440–449. doi: 10.1080/1064119X.2015.1025928
Keywords: yellow river delta, coastline, remote sensing, DSAS, Delft3D
Citation: Zhang L, Shi H, Xing H, Li P and Ma P (2023) Analysis of the evolution of the Yellow River Delta coastline and the response of the tidal current field. Front. Mar. Sci. 10:1232060. doi: 10.3389/fmars.2023.1232060
Received: 31 May 2023; Accepted: 28 August 2023;
Published: 12 September 2023.
Edited by:
João Miguel Dias, University of Aveiro, PortugalReviewed by:
Fangfang Zhu, The University of Nottingham Ningbo, ChinaCopyright © 2023 Zhang, Shi, Xing, Li and Ma. This is an open-access article distributed under the terms of the Creative Commons Attribution License (CC BY). The use, distribution or reproduction in other forums is permitted, provided the original author(s) and the copyright owner(s) are credited and that the original publication in this journal is cited, in accordance with accepted academic practice. No use, distribution or reproduction is permitted which does not comply with these terms.
*Correspondence: Hongyuan Shi, aHlzaGlAbGR1LmVkdS5jbg==
Disclaimer: All claims expressed in this article are solely those of the authors and do not necessarily represent those of their affiliated organizations, or those of the publisher, the editors and the reviewers. Any product that may be evaluated in this article or claim that may be made by its manufacturer is not guaranteed or endorsed by the publisher.
Research integrity at Frontiers
Learn more about the work of our research integrity team to safeguard the quality of each article we publish.