 Shuo Li
 Bin Wang
 Zengan Deng
 Chaoqun Dang2
 Zhaohui Chen
95% of researchers rate our articles as excellent or good
Learn more about the work of our research integrity team to safeguard the quality of each article we publish.
Find out more
ORIGINAL RESEARCH article
Front. Mar. Sci. , 27 June 2023
Sec. Physical Oceanography
Volume 10 - 2023 | https://doi.org/10.3389/fmars.2023.1228560
This article is part of the Research Topic Air-Sea Interaction and Oceanic Extremes View all 31 articles
The exchange of heat and momentum between the ocean and the atmosphere greatly affects the growth of typhoons. Utilizing the meteorological and oceanic variables observed by a Drifting Air-sea Interface Buoy (DrIB) during Typhoon Molave, a new air-sea turbulent fluxes product (referred to as DrIB product) is developed with the consideration of the thermal and dynamic effects of sea spray in the Coupled Ocean Atmosphere Response Experiment algorithm. The performances of two reanalysis products, ERA5 and MERRA2, under typhoon conditions are evaluated by comparing them to the DrIB observations. In particular, the air-sea turbulent fluxes during Typhoon Molave are systematically studied. The averaged heat (momentum) flux of the DrIB product is ~200% (~30%) higher than the reanalysis. However, the reanalysis products have higher latent heat than the DrIB product, because the reanalysis products have lower wind speed, smaller air-sea temperature difference, and drier atmosphere. The sea spray-induced mean heat (momentum) flux increase is ~1% (8%) in normal weather and is ~5% (17%) at the during-typhoon stage. Sea spray amplifies the dominance of wind speed on heat fluxes and weakens the contribution of air-sea temperature and humidity differences to heat fluxes. Sea spray starts to obviously contribute to the heat fluxes at a 10-m wind speed of ~10 m/s, and it non-linearly accelerates the air-sea heat exchange at a 10-m wind speed of ~20 m/s. When the 10-m wind speed is less than 20 m/s, the basic momentum flux (without sea spray effects) at the air-sea interface is roughly one or two orders of magnitude higher than the sea spray-induced momentum flux. Including the sea spray effects, the maximum momentum flux can even double at the 10-m wind speed of ~30 m/s.
The development of typhoons is accompanied by complex air-sea exchanges of momentum and heat. These momentum, sensible heat, and latent heat fluxes are continuously transferred between the ocean and the atmosphere through turbulent transport, which profoundly affects the structural development and intensity changes of typhoons and plays an essential role in their formation, growth, and extinction (Emanuel, 1999; DeMaria et al., 2005; D’Asaro et al., 2011; Duan et al., 2014). However, typhoon intensity forecasting has been challenging due to a lack of a comprehensive understanding of the dynamics and thermal details at the air-sea interface during typhoons. Although the Coupled Ocean-Atmosphere Response Experiment (COARE) algorithm has usually used to estimate the air-sea fluxes based on the key meteorological and oceanic variables at the air-sea interface (Fairall et al., 2003), multiple uncertainties in the estimation persist. These uncertainties are mainly attributed to the accuracy of the input physical variables, and the empirical parameters in the algorithm (Weare, 1989; Gleckler and Weare, 1997; Grist and Josey, 2003; Yu, 2019). Accurately quantification of the air-sea turbulent fluxes during the typhoon process is of great significance to various aspects such as improving the numerical weather prediction models, enhancing typhoon forecasting skills, and mitigating the meteorological and oceanic disasters (Shan et al., 2020).
Chen et al. (2007) pointed out that the inability to predict typhoon intensity may be due to incomplete consideration of the physical processes of the air-sea interface under typhoon conditions. Typhoons result in strong wind stress, which generates sea spray at the air-sea interface from broken bubbles in the whitecap and the foam of wave crests torn by the wind. When droplets evaporate or fall back into the ocean, they significantly affect the heat and momentum fluxes (Li, 2004). In terms of heat fluxes, the evaporation of sea spray leads to a substantial cooling in the atmosphere a few meters above the sea surface, intensifying the exchange of sensible heat fluxes and thus enhancing the storm’s intensity (Andreas and Emanuel, 2001). When the 10-m wind speed reaches ~11-13 m/s, sea spray can contribute to the sensible and latent heat flux accounting for a large portion of the total heat fluxes (Andreas et al., 2008). Jeong et al. (2012) showed that the exchange coefficients of heat fluxes tend to increase with wind speed at lower wind speeds (5-25 m/s) and saturate when the wind speed exceeds 25 m/s due to sea spray. Xu et al. (2022) found that sea spray reduces heat fluxes at the larger radii and increases heat fluxes at the smaller radii of typhoon Olwyn. For momentum flux, typhoon disturbance increases the effective roughness length of the sea surface, thereby increasing the drag coefficient and the rate of kinetic energy dissipation (Andreas and Emanuel, 2001). Sea spray droplets are accelerated by the wind and complete the top-down transfer of momentum flux when they fall back into the ocean (Sroka and Emanuel, 2022; Shi et al., 2023). The total air-sea momentum fluxes consist of the effective and sea spray-induced momentum fluxes (Shi et al., 2021). Exploring the physics and parameterization of sea spray is beneficial to enhance the applicability of the COARE algorithm and improve the estimation of air-sea fluxes during typhoons. Andreas (1998) constructed a sea spray model to explain how sea spray droplets participate in heat exchange. Zhang L. et al. (2021) established a dynamic roughness length including the sea spray effect at full wind speed range and introduced it into the COARE algorithm, extending the applicable wind speed of the algorithm to more than 60 m/s.
Due to the difficulty of real-time observations under extreme typhoon conditions, most studies of air-sea turbulent fluxes during typhoons rely on reanalysis products and remote sensing data with large spatial coverage. However, there are significant uncertainties in these off-site data (Yu, 2019), accounting for another critical reason that hinders the accurate understanding of the development mechanism of typhoons. Therefore, there is a need to evaluate the accuracy and reliability of the normally used reanalysis products under typhoon weather conditions. Using observations to evaluate the air-sea flux products is an effective way to check their biases. Xu and Gao (2012) evaluated the heat fluxes of Objectively Analyzed air-sea Flux (OAFlux) product using a ship-measured flux database and showed that the latent heat fluxes of OAFlux are generally higher than the ship observations, and the difference between the two increases with the increasing wind speed. Song et al. (2021) compared the air-sea fluxes from the tropical Indian Ocean buoy observations with three reanalysis products during three tropical cyclones and found that the simulations of high-frequency net heat fluxes from reanalysis are generally closer to the buoy observations, however, the deviations are more significant under typhoon conditions.
This study focuses on two main aspects to improve the accuracy of air-sea turbulent fluxes during Typhoon Molave. First, we use near-real-time in situ observations of air-sea variables during typhoons to effectively reduce the input error of the COARE algorithm. Second, the thermal and dynamic effects of sea spray are introduced into the air-sea fluxes to improve the rationality of the physical processes during typhoons. Utilizing the meteorological and oceanic data observed by the Drifting Air-Sea Interface Buoy (DrIB), and including the sea spray parameterization scheme into the COARE algorithm, we developed a new product of air-sea turbulent fluxes (referred to as DrIB product) during Typhoon Molave. The reliability of the DrIB product has been verified with two typical reanalysis products, ERA5 and MERRA2. On the other side, the performance of the two reanalysis products during Typhoon Molave has also been evaluated based on the DrIB product. The effects of sea spray on air-sea fluxes under normal and typhoon weather conditions, as well as the characteristics of the air-sea fluxes during Typhoon Molave, have been systematically analyzed and discussed.
DrIB is a small-sized, lightweight, and low-cost buoy innovatively developed by National Ocean Technology Center, China, for measuring vital air-sea variables in real-time. No. 3390 DrIB, which is selected for this study, continuously drifted from the South China Sea downstream to the waters near Vietnam from 30 September 2020 to 12 November 2020, with a sampling interval of 1 hour (Figure 1). A total of 1064 records were collected, including variables of sea surface temperature (SST), wave height, wave direction, wave period and wind speed, wind direction, air pressure at 3 m above the sea surface, air temperature, and relative humidity at 2.8 m above the sea surface. The sensors and measurement indexes of DrIB are listed in Table 1.
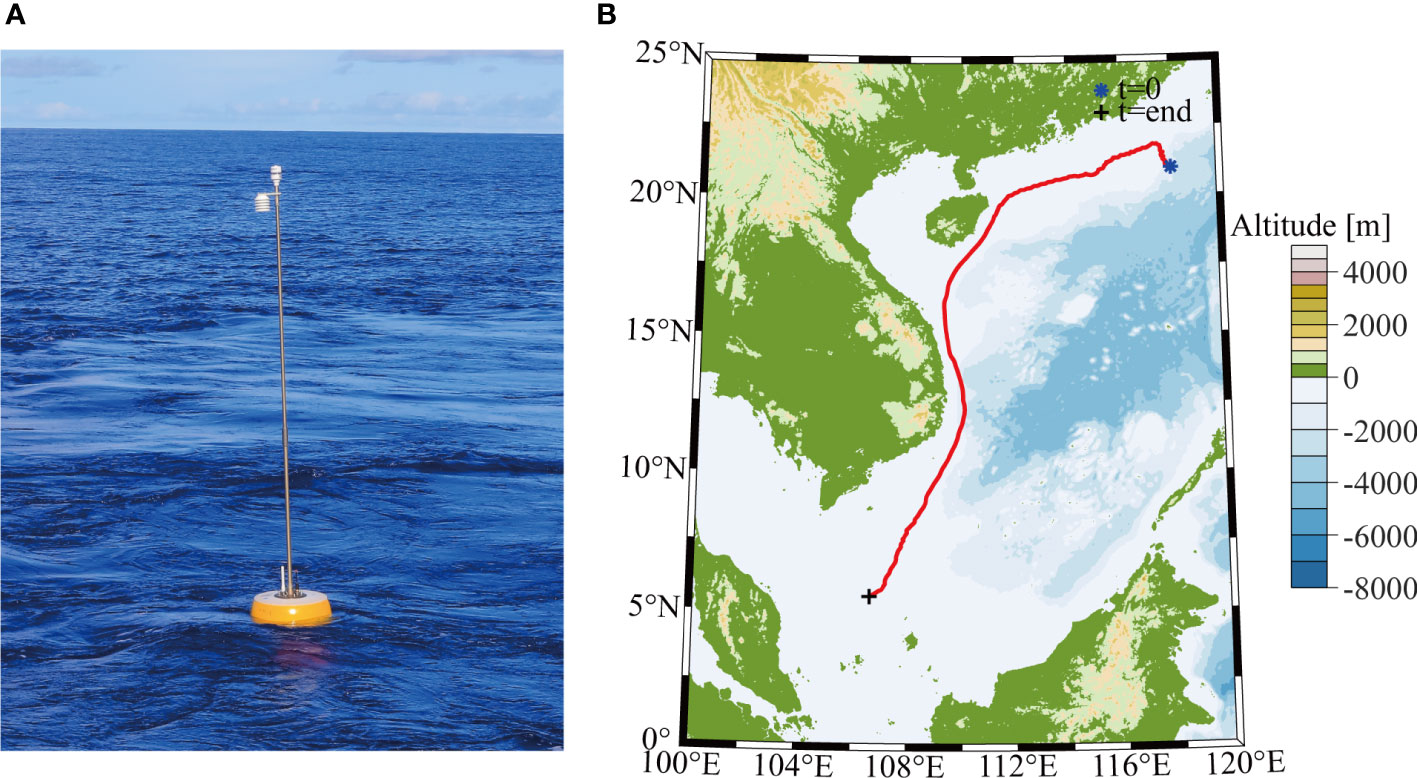
Figure 1 The Observation scene (A) and drifting trajectory (B) of No. 3390 DrIB.
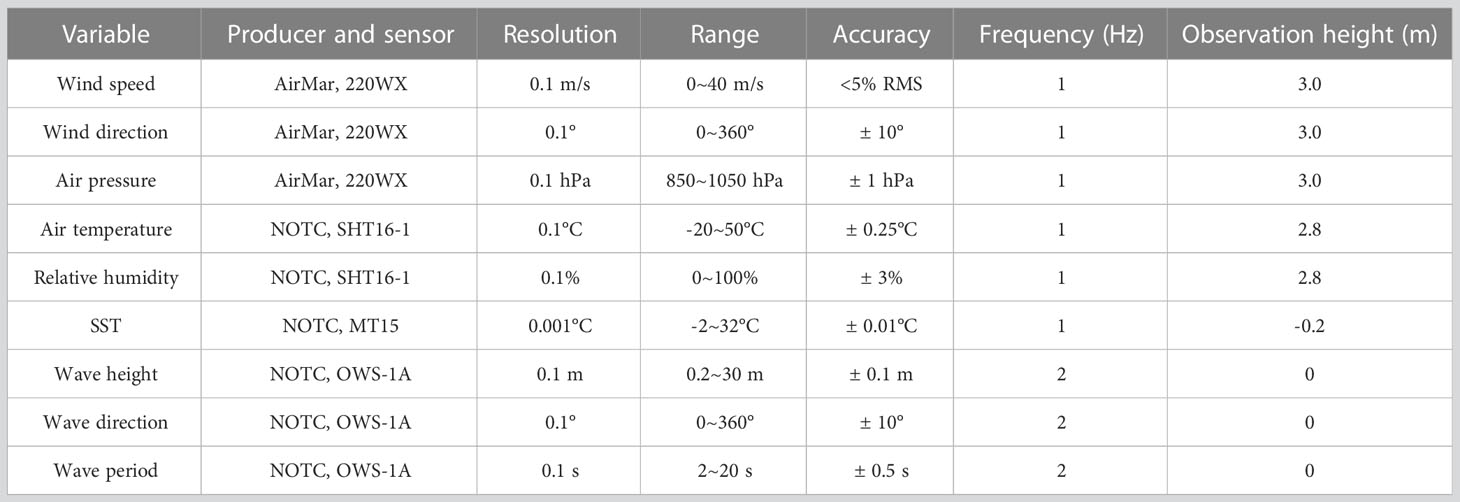
Table 1 Sensors and measurement indexes for observations of DrIB.
Quality control including repetition check, time increment check, range inspection, and continuity check, has been performed on the DrIB observations to identify and exclude the abnormal values. The repetition check aims to remove duplicate observations. A total of 26 duplicate observation records are removed. The time increment check ensures that the DrIB works normally by discerning the monotonic increment of the observation time. The range inspection checks whether the data are expected based on the reasonable range of the observed variables and the observation capabilities of DrIB. For example, the air pressure range is usually 850~1050 hPa and the sea surface temperature is -4°C~44°C. It detects one missing measurement stored at -999.999 on each of 14 October and 31 October. According to the differential theory, the continuity check finds the spikes that exceed the continuity rules of the time series. Among them, one abnormal data is detected in each of the time series of sea surface temperature, air pressure, and air temperature, and two anomalies are detected in the time series of wind speed. To keep the continuity of DrIB observations, the linear interpolations of the nearest samples are used to replace the missing and anomalous values, resulting in a total of 1038 records available for this study.
Two typical reanalysis products, ERA5 and MERRA2, were evaluated using the quality-controlled DrIB observations. The reanalysis data has a temporal resolution of 1 hour, which is consistent with the sampling interval of DrIB. ERA5 is the fifth generation of global atmospheric reanalysis produced by ECMWF, covering the period from 1940 to the present. ERA5 applies advanced numerical models and data assimilation systems to integrate historical observations into global estimates, providing hourly estimates of atmospheric, terrestrial, and oceanic variables. The ERA5 reanalysis covers the Earth in a grid of 30 km with a spatial resolution of 0.25°×0.25° for the atmosphere and 0.5°×0.5° for sea waves. MERRA2 is an atmospheric reanalysis dataset produced by the National Aeronautics and Space Administration (NASA), USA, since 1980, which replaces the previous MERRA reanalysis product using an updated model (Molod et al., 2015) and global statistical interpolation analysis scheme (Wu et al., 2002), and variables are provided on the original vertical grid (72 layers or 73 edges) or interpolated to 42 standard pressure layers. The spatial resolution of the MERRA2 dataset is 0.625° (longitude)×0.5° (latitude). To avoid the interference of grid averaging or spatial interpolation with the extreme values during the typhoon, the nearest grid data of the reanalysis products to the buoy location at the observation time were selected for comparison.
The information on typhoon track and intensity was obtained from the China Meteorological Administration (CMA) tropical cyclone best track dataset. The dataset provides the location and intensity of tropical cyclones in the northwest Pacific Ocean (covering the South China Sea, the region north of the equator and west of 180°E) every 6 hours since 1949 (Ying et al., 2014; Lu et al., 2021).
The widely used COARE algorithm, which is based on the Monin-Obukhov similarity theory (MOST), was adopted to estimate air-sea turbulent fluxes. The exchange coefficients were first calculated by applying the key meteorological and oceanic variables at the air-sea interface, and then the turbulent fluxes were estimated. Currently, the applicable wind speed has extended from 12 m/s to 20 m/s in the COARE algorithm. The equations for estimating sensible heat, latent heat, and momentum fluxes are shown below.
where , , and represent sensible heat, latent heat and momentum flux respectively. is atmospheric density. is atmospheric specific heat at constant pressure. is latent heat of evaporation. , , and denote exchange coefficients of sensible heat, latent heat and momentum flux respectively. is wind speed. and represent SST and atmospheric temperature respectively. and represent sea surface specific humidity and atmospheric specific humidity respectively. and represent surface current velocity and wind speed component respectively. Because of the lack of direct observation of sea surface current and low surface current velocity relative to wind speed, the required surface current velocity is set to 0 (Zhang et al., 2017; Zhang L. et al., 2021).
According to MOST,
where can be the u and v components of the wind speed, the potential temperature, the specific humidity, or the mixing ratio of some atmospheric tracers. is the exchange coefficient corresponding to the variable ( corresponds to the wind speed), and is the total exchange coefficient. is the mean air-sea difference of , and represents the wind speed relative to the sea surface consisting of the mean vector and the gust . The dependence of the exchange coefficients on the surface stability is as follows.
The subscript represents the neutral stability, that is, is 0. is the measured height of the mean value , is the von Karman constant, represents the parameter of roughness length, which describes the neutral transmission performance of the variable . is the parameter of MOST stability and is calculated as follows.
where is the temperature, is the gravitational acceleration, denotes the component of current direction, and , , and represent the friction velocity, friction temperature, and friction humidity, respectively. is an empirical function to characterize the stability of mean profile. For stable conditions, ; for unstable conditions (Businger et al., 1971),
In the COARE algorithm, the roughness length is calculated by the Charnock relation (Smith, 1988).
where represents the air viscosity and is the Charnock parameter, which is a piecewise function determined by the wind speed .
Here we applied the Charnock parameterization scheme established by Zhang L. et al. (2021) instead of equation 13 to include the effects of sea spray on turbulent fluxes in terms of the roughness length, to further extend the applicable wind speed of the COARE algorithm and improve its applicability under typhoon conditions.
where and are wave constant parameters of -1.03 and 0.42, respectively. is the modulation factor of the sea spray acting on the logarithmic velocity profile, and denotes the speed at which the sea spray droplets are on the verge of falling, which is 0.64 m/s. is the wave age, which can be approximated from the significant wave height .
Low pressure and heavy precipitation are the typical features of typhoons. In the DrIB observation period, the air pressure showed regular periodic fluctuations. However, it plummeted to a minimum of ~980 hPa at 0800 UTC, 28 October, followed by a rapid recovery to normal levels, consistent with the characteristics of a passing typhoon. The precipitation data from ERA5 and MERRA2 have been used for further verification, supplemented by the DrIB observations of air temperature and relative humidity. Figure 2 indicates that DrIB, ERA5, and MERRA2 can all capture this extreme weather process. On 28 October, the maximum precipitation was close to 23 mm/h, the air temperature dropped by ~4°C in 4 hours, and the relative humidity of the sea surface atmosphere peaked for some time. It is noted that the three datasets show slight differences during the typhoon, which may be caused by the temporal-spatial matching and their different resolutions. The comparison with the CMA tropical cyclone best track data further confirms that Typhoon Molave, the 18th typhoon in 2020, passed over the region around DrIB on 28 October 2020. It is manifested that No. 3390 DrIB observations completely recorded the typhoon process of Molave.
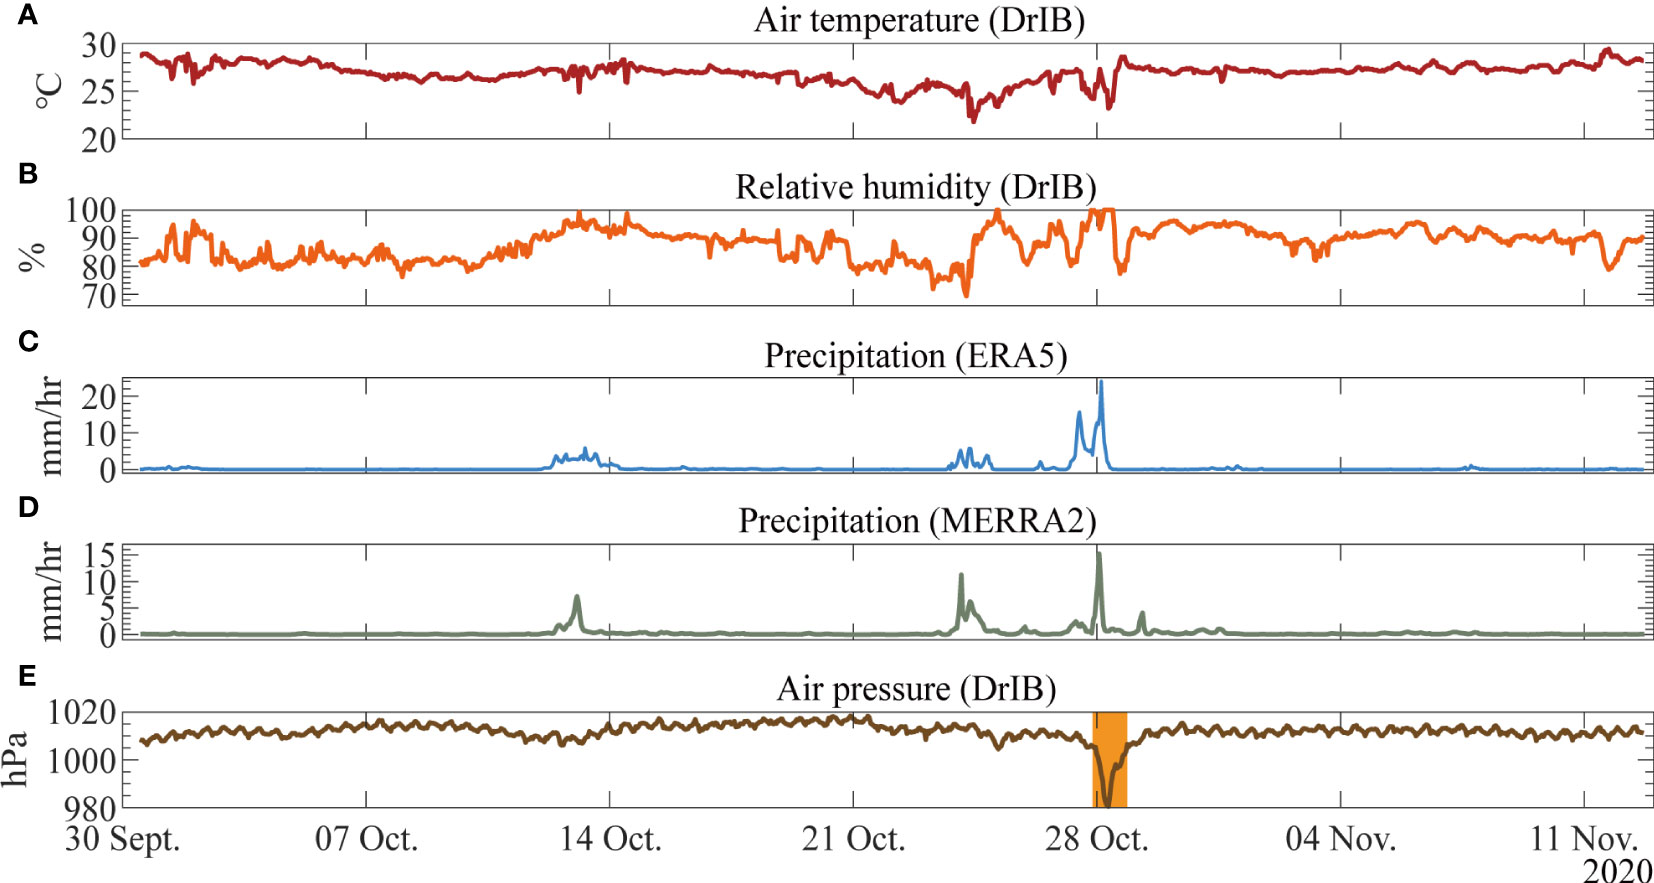
Figure 2 Time series of air temperature (A), relative humidity (B), and air pressure (E) observed by DrIB and precipitations (C, D) from reanalysis products.
Figure 3 shows the relative positions of DrIB and Typhoon Molave at 0800 UTC each day from 24 to 31 October 2020, in the study sea area of 105°E-120°E and 10°N-20°N. On 25 October, Typhoon Molave began to affect the region around DrIB. On 26 and 27 October, it entered the study area and gradually approached DrIB while its power and coverage diameter was further increased. On 28 October, Typhoon Molave passed over DrIB. Based on the observed wind speed, air pressure, and the distance from the typhoon center, DrIB was probably located in the spiral rain band outside the cloud wall at 0800 UTC, 28 October. This study focuses on the period that the typhoon was captured by DrIB (from 25 to 31 October), during which a total of 168 observations were recorded. The periods of 25-27 October, the whole day of 28 October, and 29-31 October are respectively specified to represent the before-, during-, and after-typhoon stages.
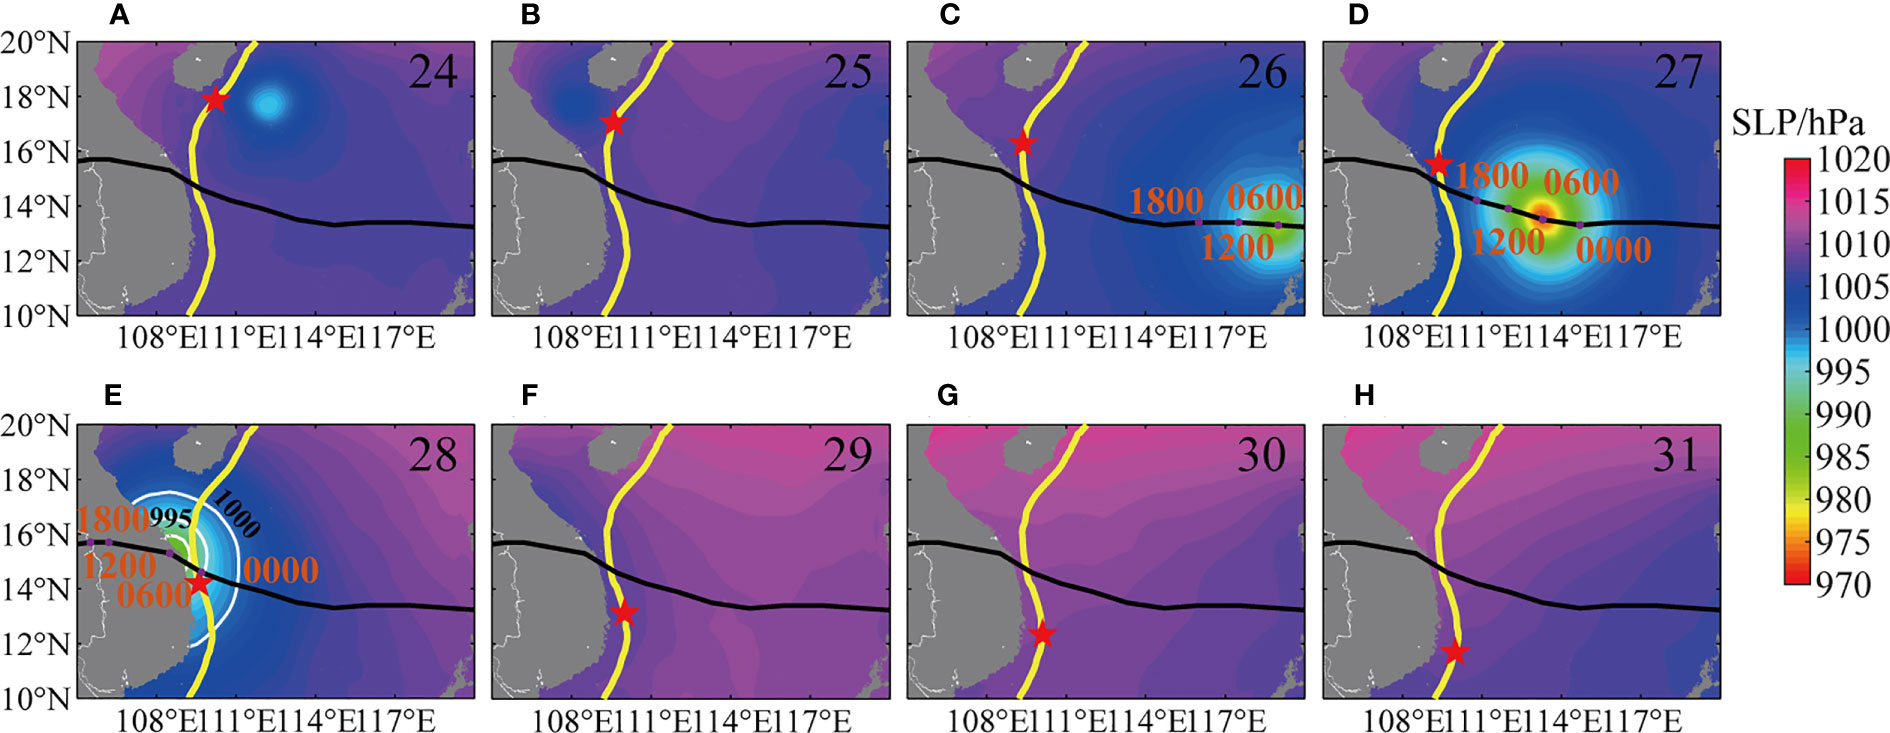
Figure 3 The position of DrIB and sea level pressure at 0800 each day from 24 to 31 October (A–H). The yellow line is the drifting track of DrIB, the pentagram represents the position of the buoy, and the black line is the track of Typhoon Molave, indicating the typhoon center every 6 hours. The data of sea level pressure are from ERA5 reanalysis.
We developed a DrIB product during Typhoon Molave by both using the DrIB in situ observations and incorporating the effect of sea spray in the calculation. Comparison between the DrIB product and reanalysis is a meaningful way to evaluate the performance of the reanalysis data, particularly under extreme typhoon weather conditions. On the other side, the comparison can also verify the general quality of the DrIB product.
Figure 4 shows the time series of meteorological and oceanic variables at the air-sea interface observed by DrIB during Typhoon Molave. At 0800 UTC, 28 October, when the air pressure dropped to the minimum of ~980 hPa, the wind speed reached a maximum of ~27 m/s. Correspondingly, the significant wave height grew to a maximum of nearly 8 m. The low pressure and intense wind stress triggered a divergence and the vertical mixing (entrainment) of the upper water and thus the upwelling of the lower cold seawater, resulting in a cooling of the sea surface and a large area of cold wake along the typhoon track. DrIB observed a decrease in SST of ~0.4°C, which is consistent with the result of D’Asaro et al. (2007). The cooling of the air temperature is much greater than that of the SST, causing a greater air-sea temperature difference, thus producing more heat fluxes transferring to the atmosphere from the ocean. In addition, the meteorological variables affected by Typhoon Molave recovered rapidly and returned to the states at the before-typhoon stage on 28 October. On the contrary, due to the high specific heat capacity of the ocean, the recovery of SST was relatively slow, and the cold wake continued until 30 October.
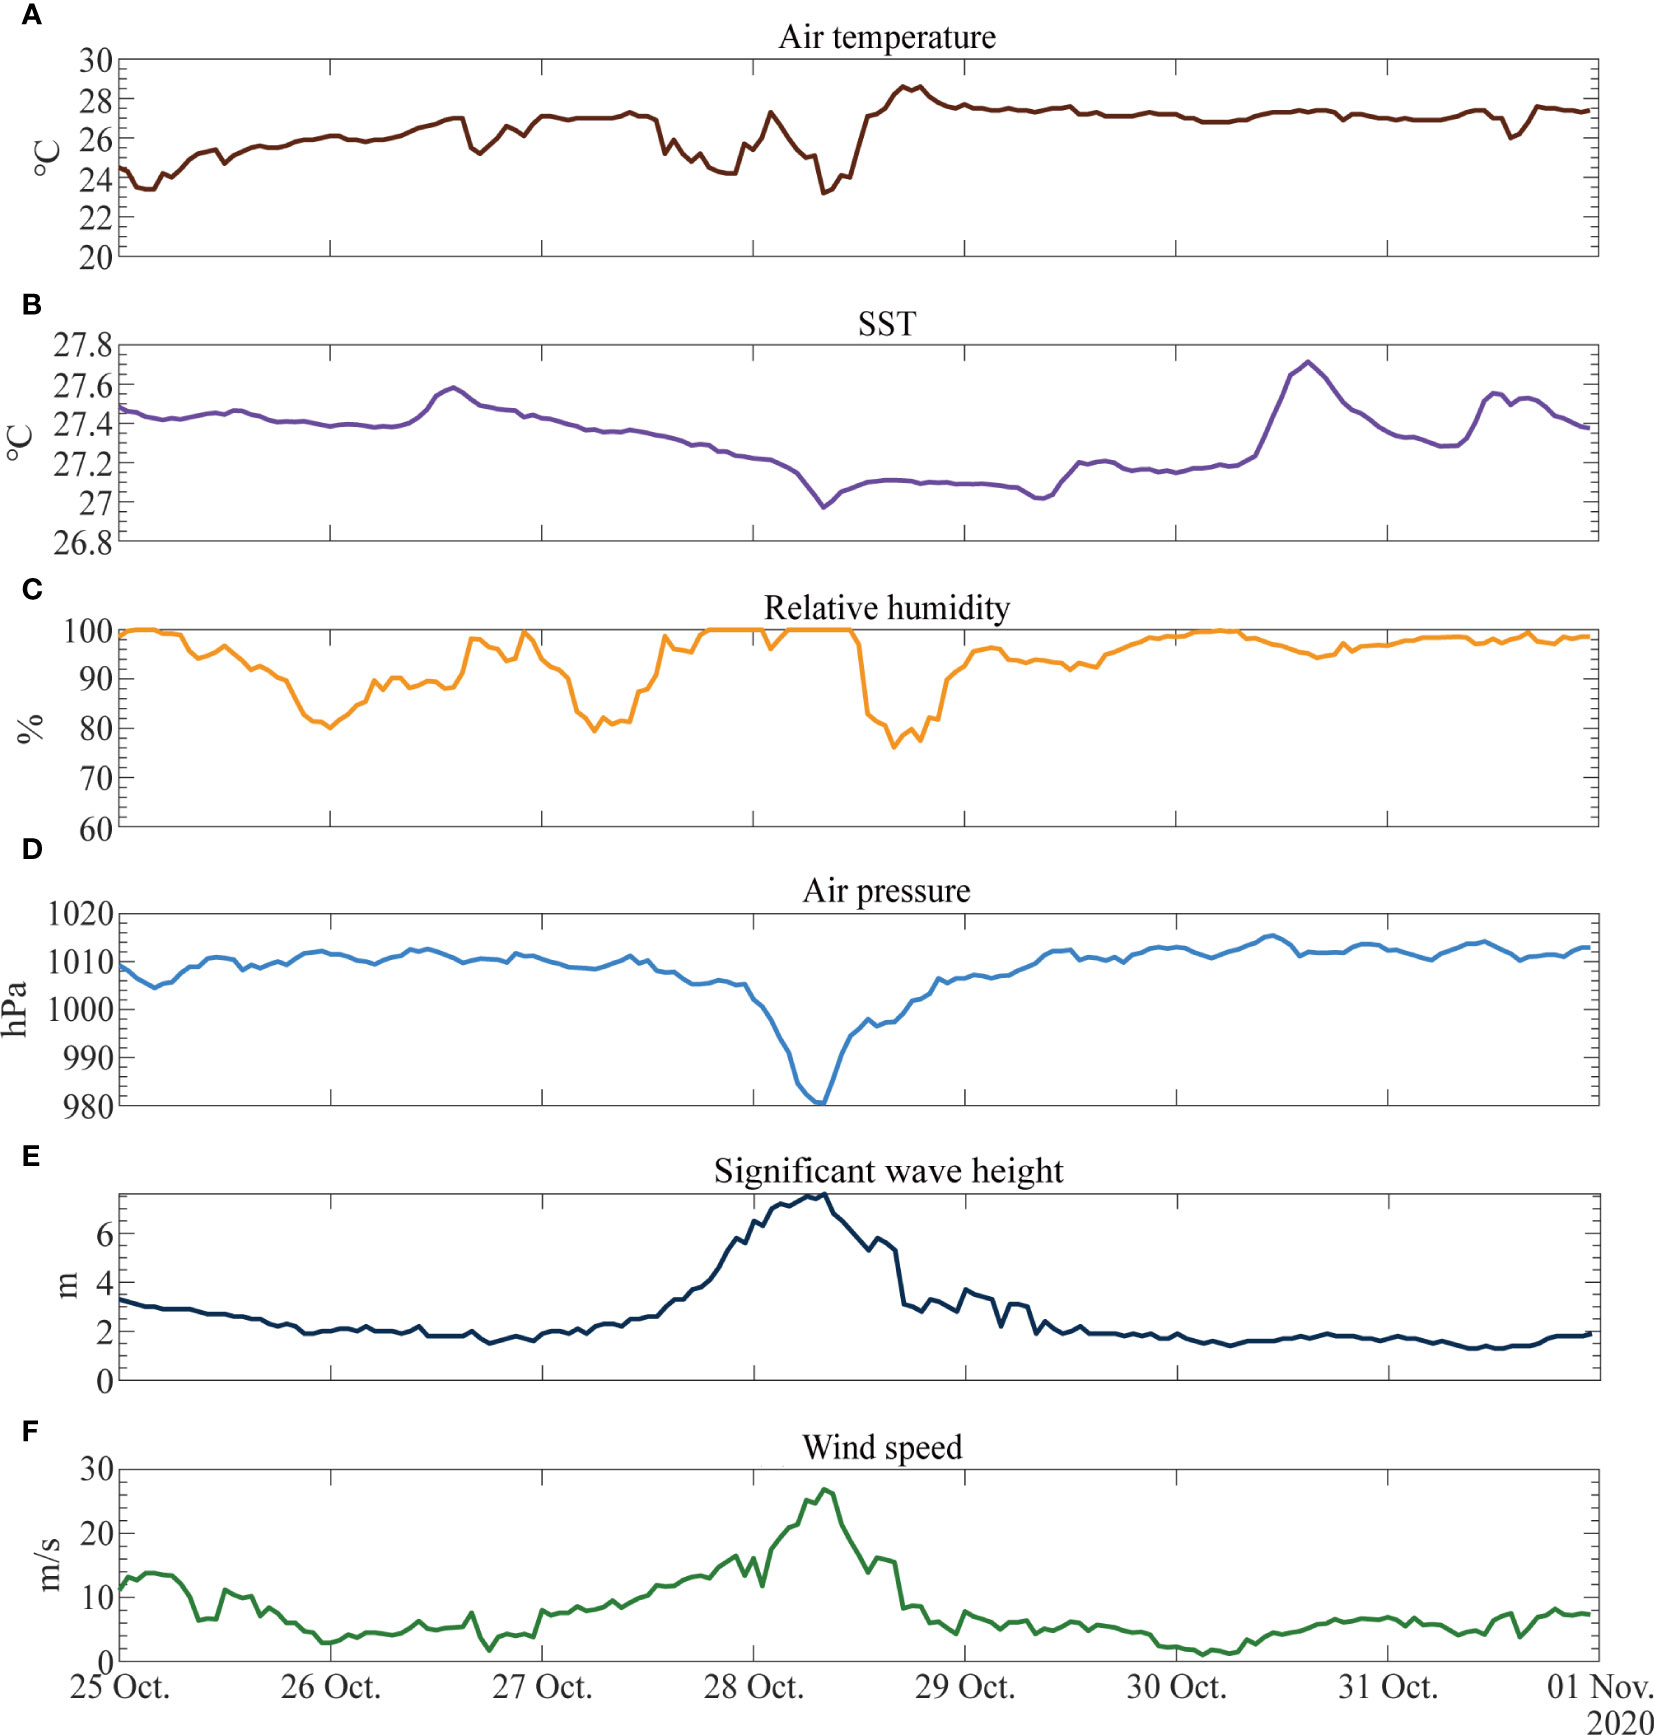
Figure 4 Time series of air temperature (A), SST (B), relative humidity (C), air pressure (D), significant wave height (E), and wind speed (F) observed by DrIB.
The evaluation was performed on two reanalysis products, ERA5 and MERRA2. Figure 5 shows the time series of the air-sea fluxes and the associated deviations (the transmission directions have been unified, positive values indicate that the atmosphere absorbs heat fluxes from the ocean and momentum fluxes are transferred from the atmosphere to the ocean; negative values indicate the contrary). During 25-31 October, when Molave passed over DrIB, the latent heat fluxes of the two reanalysis products are generally higher than those of the DrIB product, while the reanalysis sensible and momentum fluxes are generally lower than the observations. The averaged sensible heat fluxes of the DrIB product, ERA5, and MERRA2 are 17.9 W/m2, 9.4 W/m2, and 3.3 W/m2, and the mean latent heat fluxes are 82.2 W/m2, 140.3 W/m2, and 113.5 W/m2, respectively. Overall, the averaged heat flux of the DrIB product is ~200% higher than that of the reanalysis products during Typhoon Molave. The averaged momentum fluxes of the DrIB, ERA5, and MERRA2 products are 0.30 N/m2, 0.25 N/m2, and 0.22 N/m2, respectively, and the mean momentum flux of the DrIB product is ~30% higher than the reanalysis. The deviations between the DrIB product and reanalysis are minimal during 25-26 and 29-31, and the biases of the sensible and momentum fluxes vary smoothly around the level of 0, generally verifying the reliability of the DrIB observations. The deviations of latent heat fluxes are relatively large, indicating a large atmospheric humidity bias existed in the reanalysis products. The differences increased during 27-28 October when Molave passed over DrIB. The sensible heat, latent heat, and momentum fluxes of the DrIB product are larger than those of ERA5 (MERRA2), with the maximum deviations of 226.2 (244.9) W/m2, 251 (360) W/m2, and 4.35 (4.6) N/m2, respectively. The above results indicate that the fig accurate and stable observations of DrIB can better reflect the details of air-sea fluxes under typhoon conditions, and the incorporation of sea spray effects improves the rationality of the physical processes at the air-sea interface during Typhoon Molave. The performance of reanalysis products during typhoons is inadequate.
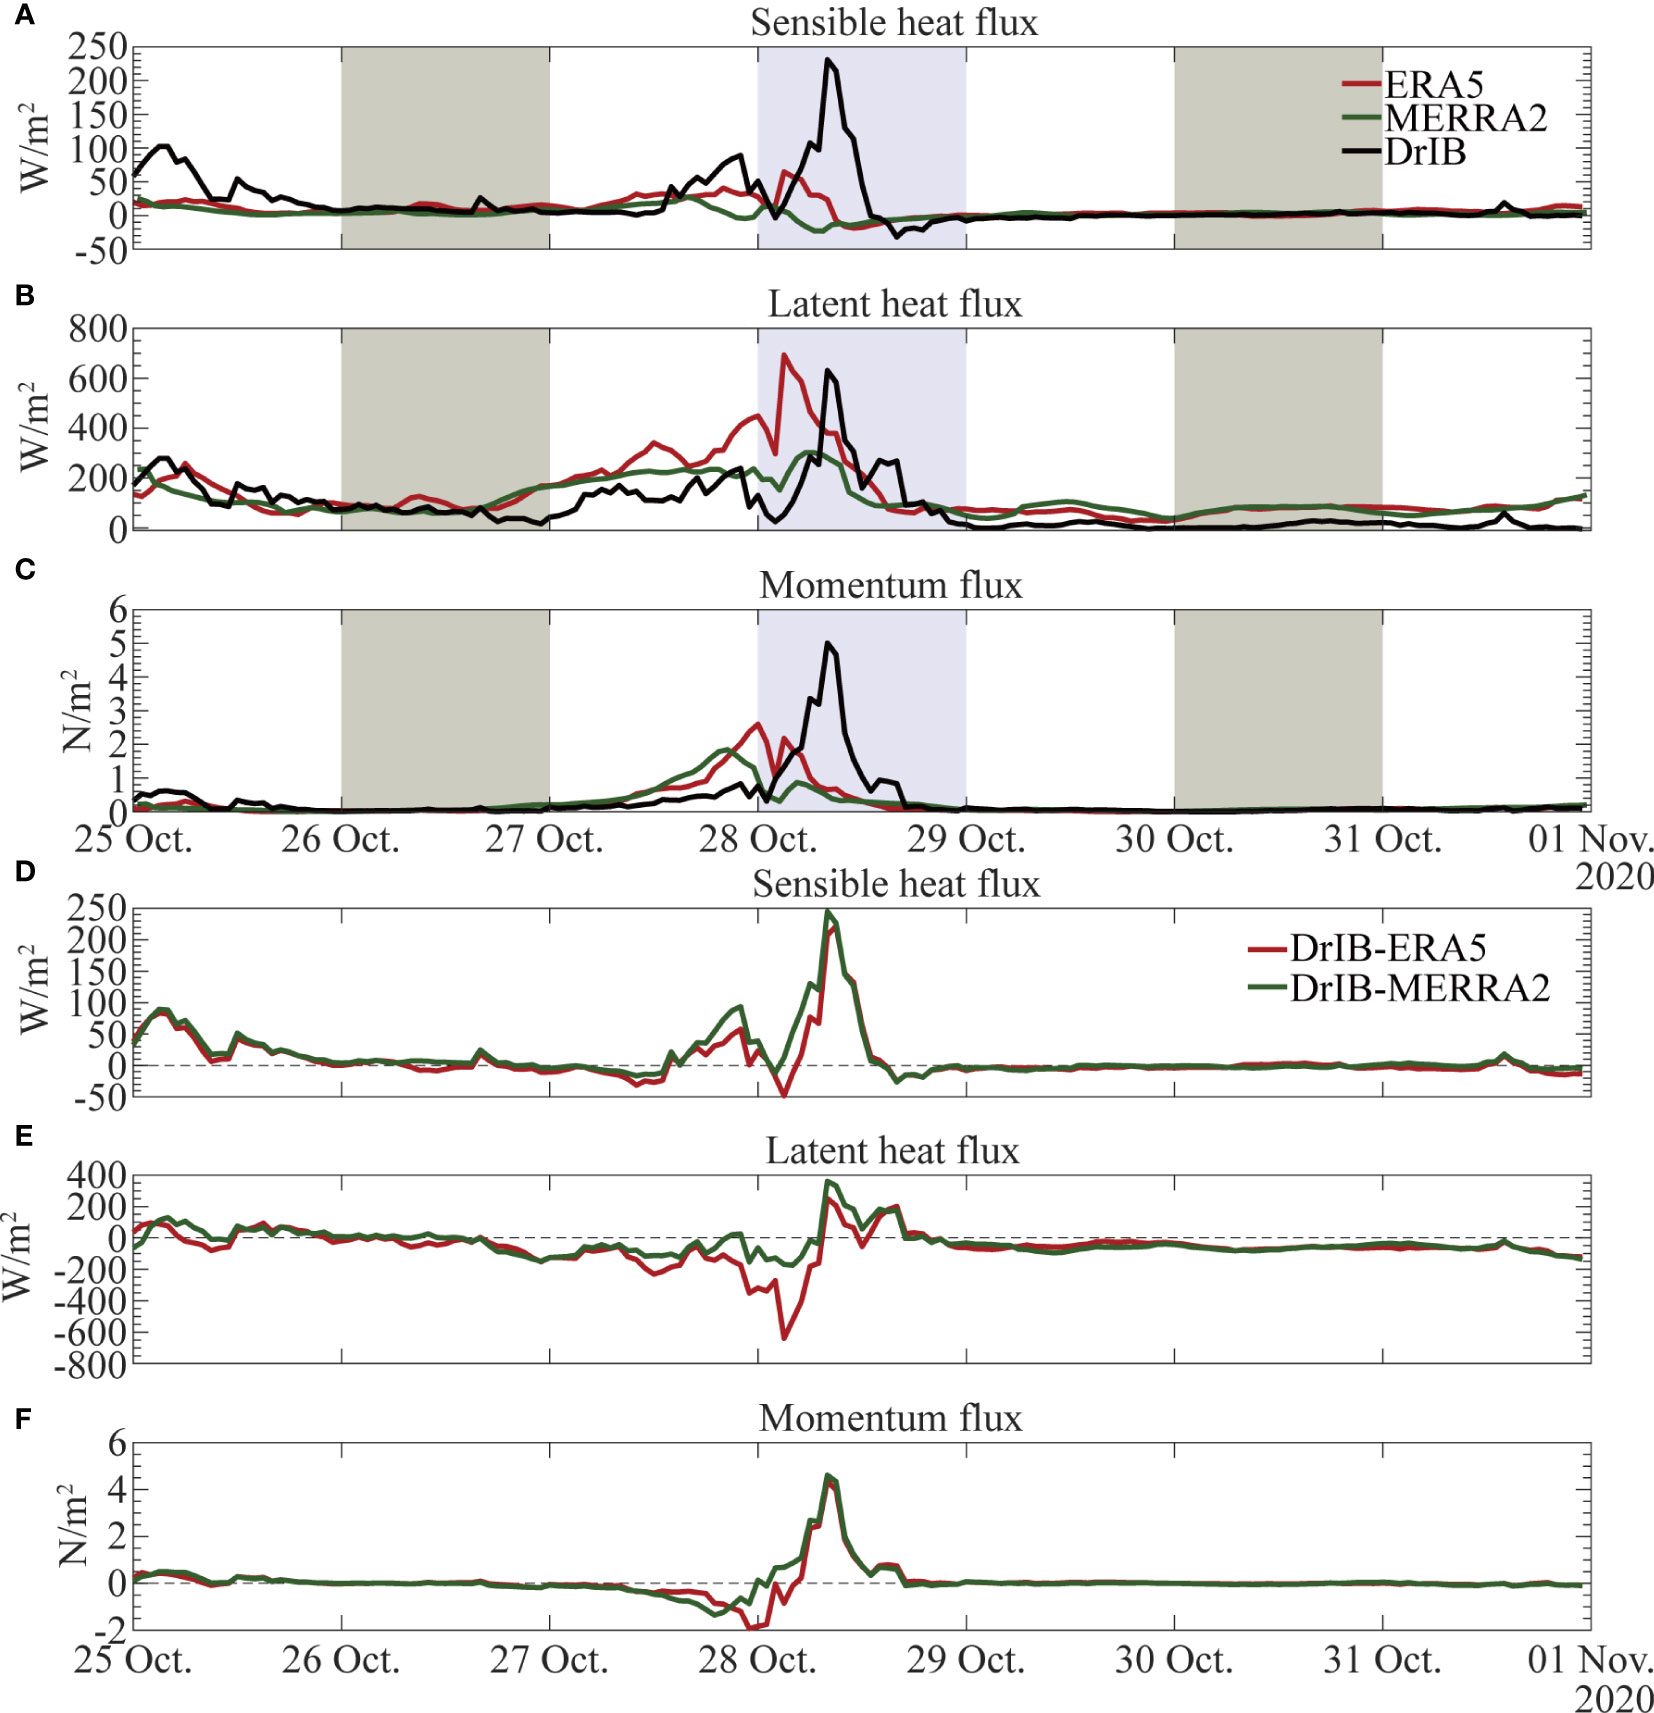
Figure 5 Time series (A–C) and biases (D–F) of air-sea fluxes from DrIB observations and reanalysis products.
It is noticed that different flux calculation schemes are adopted in the three products. COARE algorithm is used in our DrIB product, whereas the Louis scheme (Louis, 1979) and Helfand and Schubert scheme (Helfand and Schubert, 1995) are respectively applied in ERA5 and MERRA-2. To investigate the performances of the three schemes, we recalculated the air-sea fluxes based on the meteorological and oceanic variables provided by the two reanalysis products during Typhoon Molave (hereafter referred to as Re-ERA5 and Re-MERRA2) by applying the COARE algorithm (as shown in Figure 6), aiming to directly compare with our DrIB product. It is shown that the air-sea fluxes based on different schemes do not differ significantly and they all vary consistently with good correlation. The Re-ERA5 sensible heat flux, Re-MERRA-2 sensible heat flux, and Re-MERRA-2 momentum flux show almost no deviation from the original reanalysis (ERA5 and MERRA-2), under both normal and typhoon conditions. The latent heat and momentum fluxes of ERA5 are slightly higher than that of the Re-ERA5 during Typhoon Molave, while they are almost indistinguishable in normal weather conditions. The latent heat flux of MERRA-2 is slightly higher than that of Re-MERRA-2, ~30 W/m2 on average. The differences between the two flux schemes are smaller for MERRA-2 than for ERA5, which may be due to the fact that both the COARE algorithm and Helfand and Schubert scheme are based on the MOST.
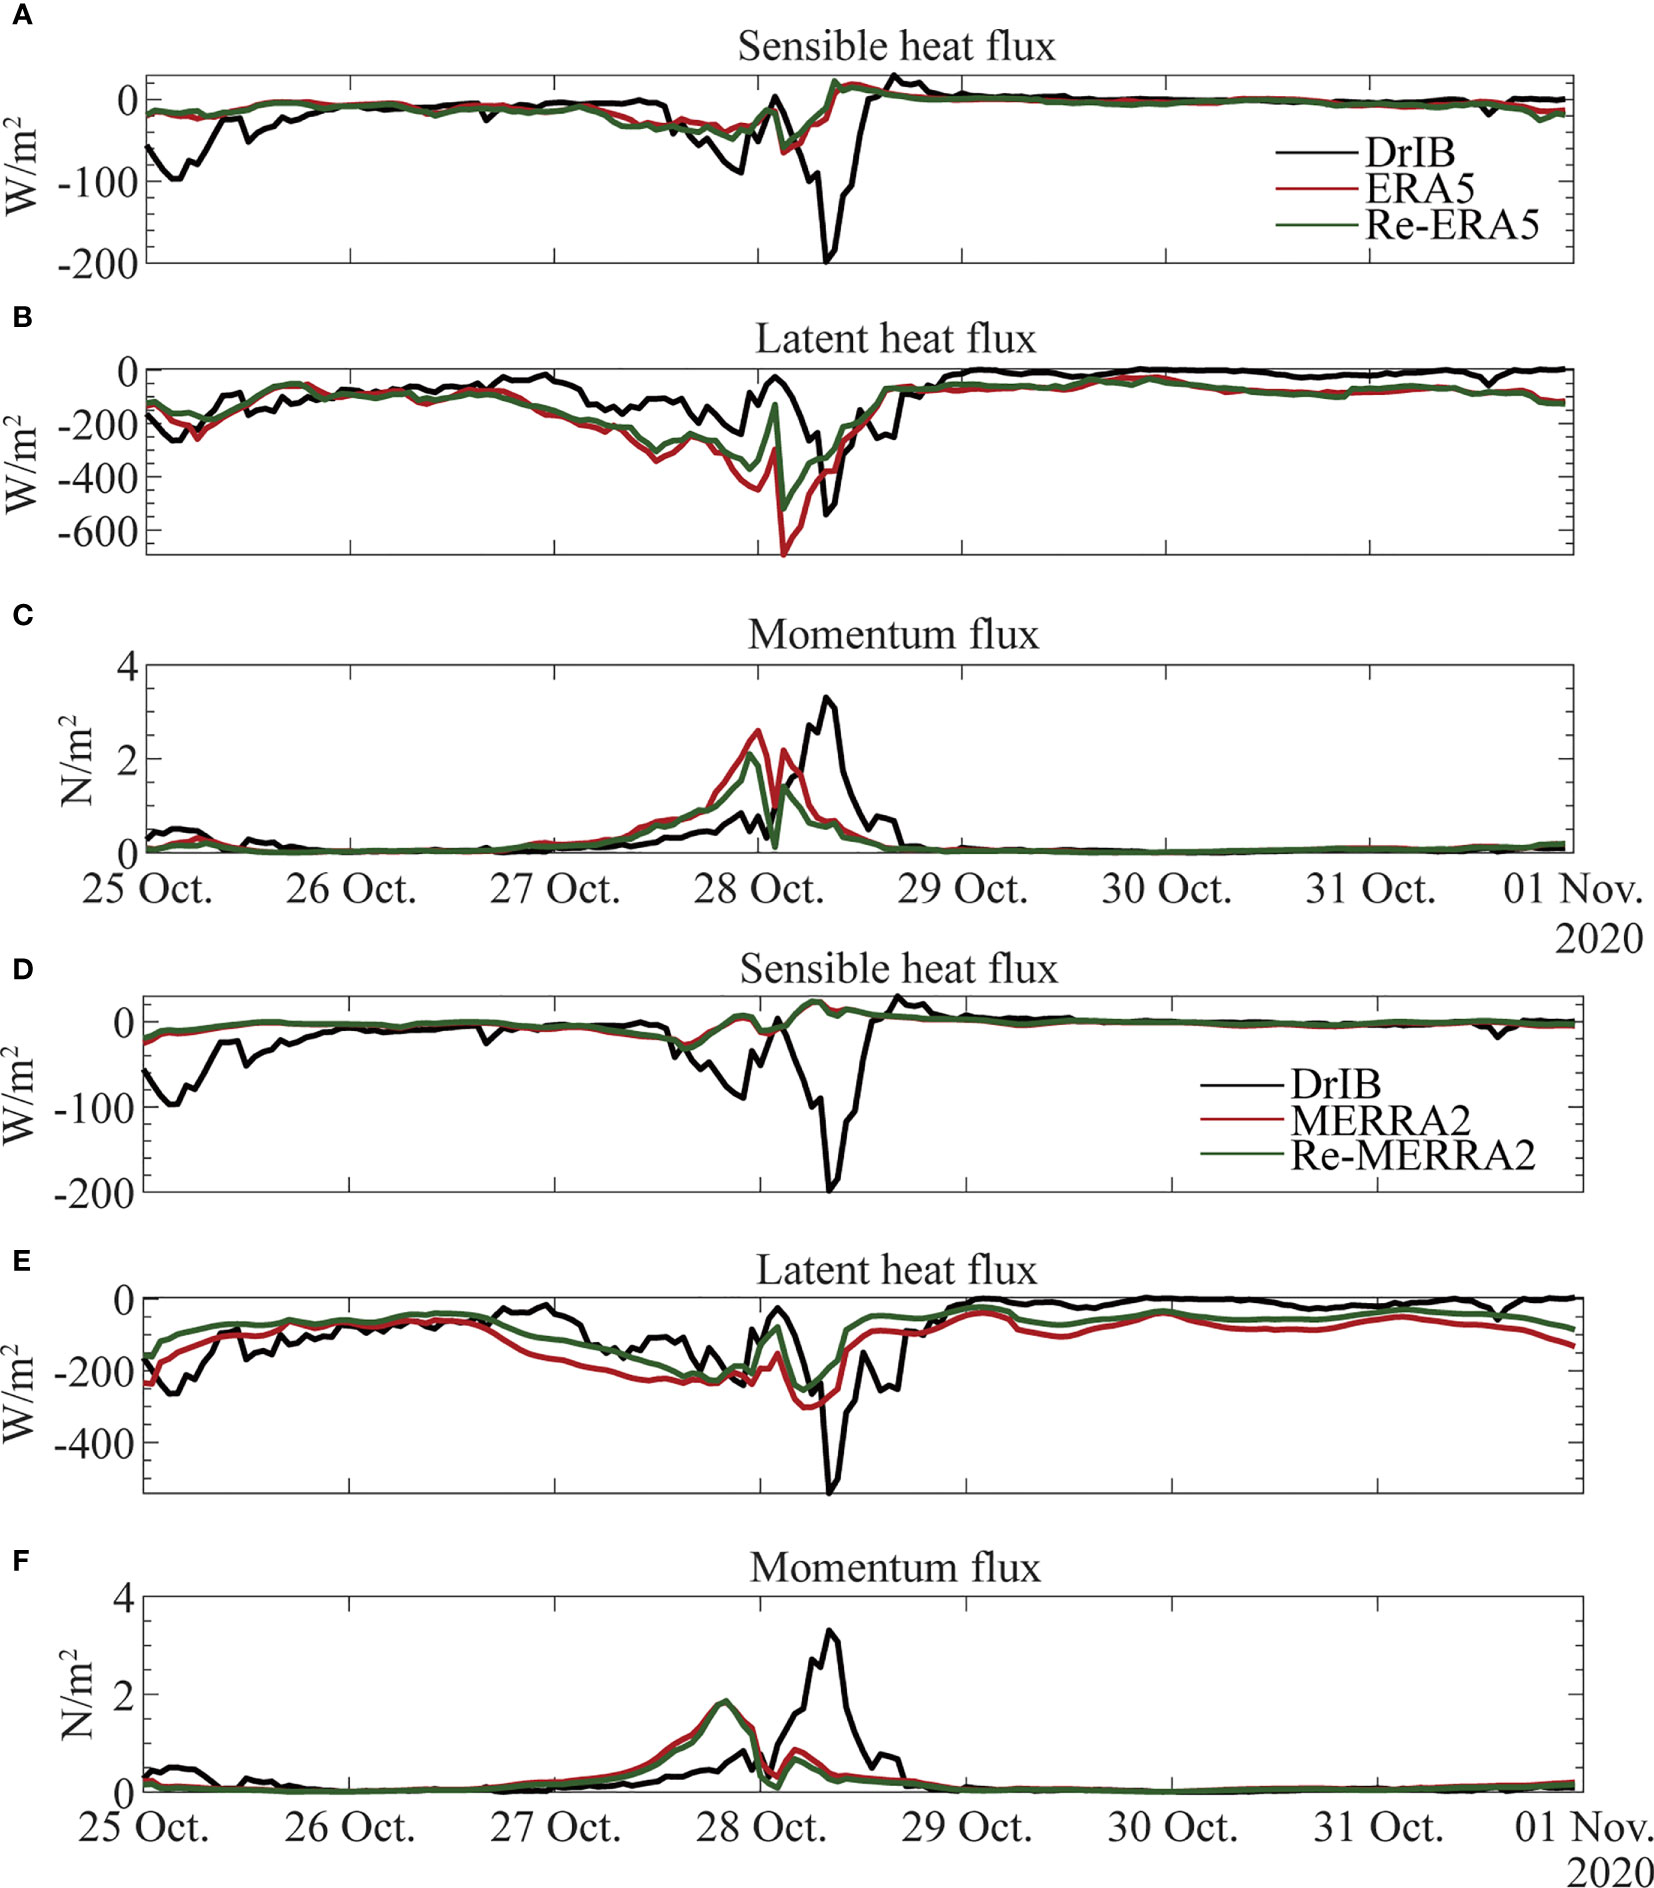
Figure 6 Recalculated ERA5 (A–C) and MERRA2 (D–F) air-sea turbulent fluxes using COARE algorithm.
The air-sea turbulent fluxes are closely related to the environments at the air-sea interface. Due to the different observing heights of meteorological variables in the three products, both the 3-m meteorological variables observed by DrIB and the 2-m meteorological variables in ERA5 are transformed to the 10-m height. Figure 7 shows the time series of variations and biases of wind speed, air temperature, SST, and specific humidity of DrIB observations and the two reanalysis products. Except for the specific humidity, the biases for all other variables are smaller in normal weather than in typhoon conditions. During Typhoon Molave, the maximum wind speed recorded by DrIB is about 16 (20) m/s higher than that from ERA5 (MERRA2). The inability of the reanalysis products to adequately represent the high wind speed situation is the main reason why the reanalysis air-sea fluxes are much lower than those based on DrIB observations during typhoon Molave. In addition, the reanalysis products fail to fully represent the effects exerted by the typhoon on air temperature and SST. The air temperature and SST of the reanalysis products are lower than the DrIB observations, for ~4.5°C and ~0.5°C, respectively, resulting in a smaller air-sea temperature difference, hindering the transport of sensible heat to the atmosphere. As for the specific humidity, the atmospheric specific humidity of the reanalysis products is generally lower than that observed by DrIB in both normal and typhoon weathers. The buoy observation-based latent heat flux is intense when Typhoon Molave was passed. However, the drier atmosphere in the reanalysis products increases the air-sea specific humidity difference, which is key to that the latent heat fluxes from the reanalysis products are mostly higher than that from our DrIB product in normal weather conditions.

Figure 7 Time series (A–D) and biases (E–H) of air-sea variables from DrIB observations and reanalysis products.
Statistics have been used to further evaluate the reanalysis products by quantifying the correlations and deviations. The statistical factors include correlation coefficient , mean absolute error , maximum absolute error , and root mean square error , which are defined as follows.
where represents the number of paired data, is the DrIB observation, is the reanalysis data, represents the arithmetic mean of the DrIB observations, and represents the arithmetic mean of the reanalysis data.
Table 2 shows the statistics between the two reanalysis products and our DrIB product. Overall, the correlation coefficients between ERA5 reanalysis and DrIB product are higher, and the root mean square errors of ERA5 are lower than that of MERRA-2. The ERA5 reanalysis is closer to the DrIB product, which may be attributed to its higher spatial resolution, as well as the fact that ERA5 assimilated more in situ observations than MERRA-2. In addition, to investigate the influences of Typhoon Molave, the averages of the variables for the remaining 6 days except for 28 October are calculated (as shown in Table 3). The correlations of most averaged variables between the two reanalysis products and the DrIB product are improved, and the biases of all averaged variables are reduced by up to ~50% by excluding the direct effect of Typhoon Molave. The correlation coefficients of meteorological variables are improved by about 10%-200%, and the correlation coefficients of air-sea fluxes are greater than 0.6 except for the sensible heat fluxes of MERR2. The above findings indicate that the uncertainties of the reanalysis products during typhoons are greater than those in normal weather and that it is more difficult for the reanalysis products to reproduce the extremely nonlinear processes during typhoons. The performance of the reanalysis air-sea fluxes under typhoon conditions is inadequate.
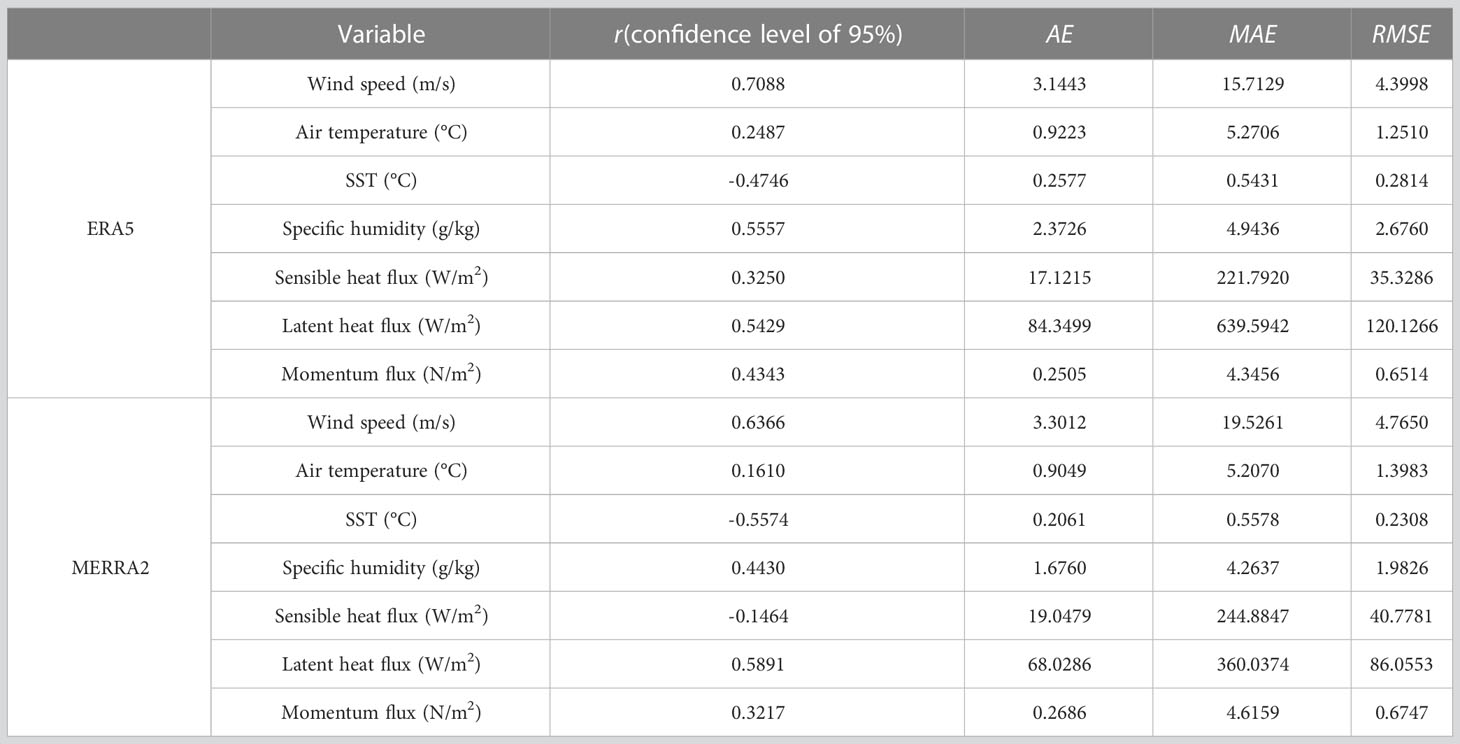
Table 2 Comparison of DrIB observed variables and reanalysis products.
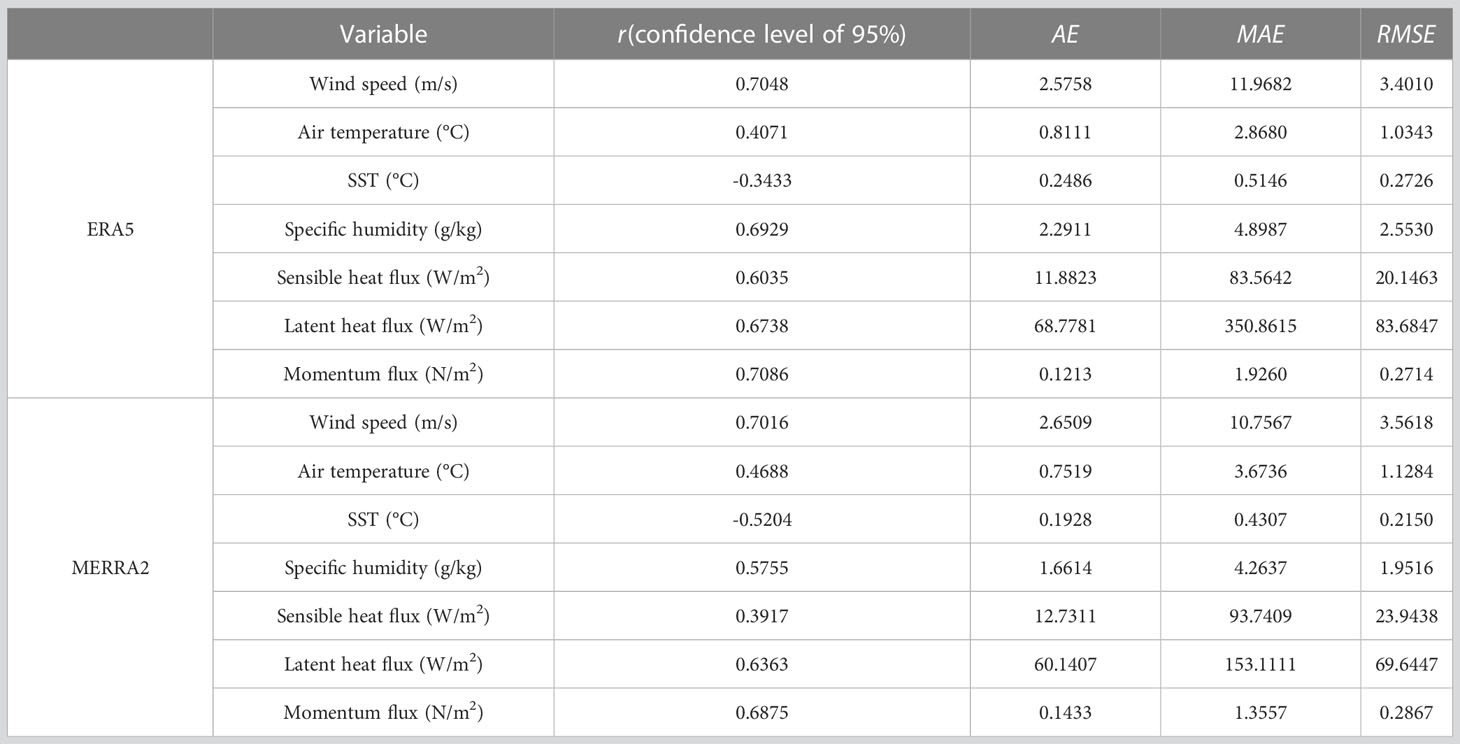
Table 3 Comparison of six-day averages of DrIB observed variables and reanalysis products excluding 28 October.
The stability of the atmospheric boundary layer is a crucial factor in determining the air-sea turbulence, which can be classified according to the stability parameter estimated by the COARE algorithm. denotes the Monin-Obukhov length, and < -0.4, -0.4< < 0.1, and > 0.1 characterize the unstable, near-neutral, and stable stations, respectively (Song, 2020).
is the Reynolds stress caused by temperature perturbation and vertical motion perturbation. During the observational period, the near-neutral conditions are dominant. In particular, during the period from 27 to 29 October, when Typhoon Molave passed over the DrIB, the atmospheric boundary layer maintains a near-neutral level and continues to absorb heat from the ocean.
Here we systematically analyze the variability of air-sea fluxes and detect the role of sea spray, particularly under typhoon conditions. The fluxes calculated with the original COARE algorithm are the basic (or original) fluxes, and those adding the sea spray effects are the total fluxes. The differences between the basic and total fluxes are the sea spray-induced fluxes. On 26 and 30 October, the observed variables change smoothly without great fluctuations. They are generally not affected by typhoon Molave or other weather processes, and the sea spray-caused changes are minimal, similar to the situation of normal weather conditions. Figure 8 shows the changes of sensible, latent, and momentum fluxes at the before-, during-, and after-typhoon stages and Table 4 lists the fluxes for different weather conditions. The time series of the basic fluxes are basically consistent with the total fluxes. Overall, the total fluxes are higher than the basic ones. The energy exchange is dominated by heat transfer from the ocean to the atmosphere, especially the latent heat. Including the sea spray effects, the maximum total latent heat flux is ~630 W/m2, almost three times the maximum total sensible heat flux. The sea spray intensifies the heat and momentum exchange, significantly contributing to the momentum flux. Considering the sea spray effect, the total sensible and latent heat fluxes are respectively increased by 0.92 W/m2 and 3.51 W/m2 on average, with the maxima of 32.61 W/m2 and 89.02 W/m2. Sea spray contributes slightly greater to the growth of latent heat flux than that of the sensible heat flux, consistent with the thermodynamic phase transformation. With the growth of wind speed, the air-sea interface is filled with a large amount of sea spray droplets. On one hand, the evaporation of the sea spray droplets cools the air temperature near the sea surface, increases the air-sea temperature difference, and promotes the transfer of sensible heat from the ocean to the atmosphere (Andreas et al., 2008). On the other hand, the warm and humid water vapor formed by the evaporation flows toward the center of the typhoon, releasing a lot of latent heat in the processes of rising with the convergence of low-pressure airflow and condensing with cold, which is an important source of energy supply to sustain and further develop the typhoon (Zhang J. et al., 2021). However, the atmosphere also provides part of the absorbed sensible heat to evaporate the sea spray, so the contribution of sea spray to the latent heat flux is greater than that of the sensible heat flux. The momentum is transferred when the droplets at the bottom of the sea spray region are accelerated by the wind and then fell back into the ocean again. The total momentum flux increases by an average of 0.052 N/m2 (~11.9%) and a maximum of 1.70 N/m2 (~51.75%) by including the effect of sea spray. At the before- and after-typhoon stages, sea spray droplets are scarce, and there is little difference between the basic and total heat fluxes. The momentum flux has a stronger dependence on wind speed, therefore, it can be influenced by sea spray more importantly than the heat flux, under both normal and typhoon weather conditions. Abundant sea spray droplets are formed on the sea surface as the increase of wind speed and air-sea temperature and humidity differences. When Typhoon Molave passes the DrIB, the sea spray impacts on heat and momentum fluxes cannot be ignored. The sea spray-caused increase in heat (momentum) flux is ~1% (~8%) in normal weather conditions, and is more than 5% (17%) at the during-typhoon stage. The maximum sea spray-induced sensible and latent fluxes in normal weather conditions are both ~1 W/m2, while they can be over 32 W/m2 and 89 W/m2 under typhoon conditions, respectively. The peak of the sea spray-induced momentum flux can even be nearly equal to the basic momentum flux. It is emphasized that the role of sea spray in the air-sea energy transfer is greatly important in typhoon conditions.
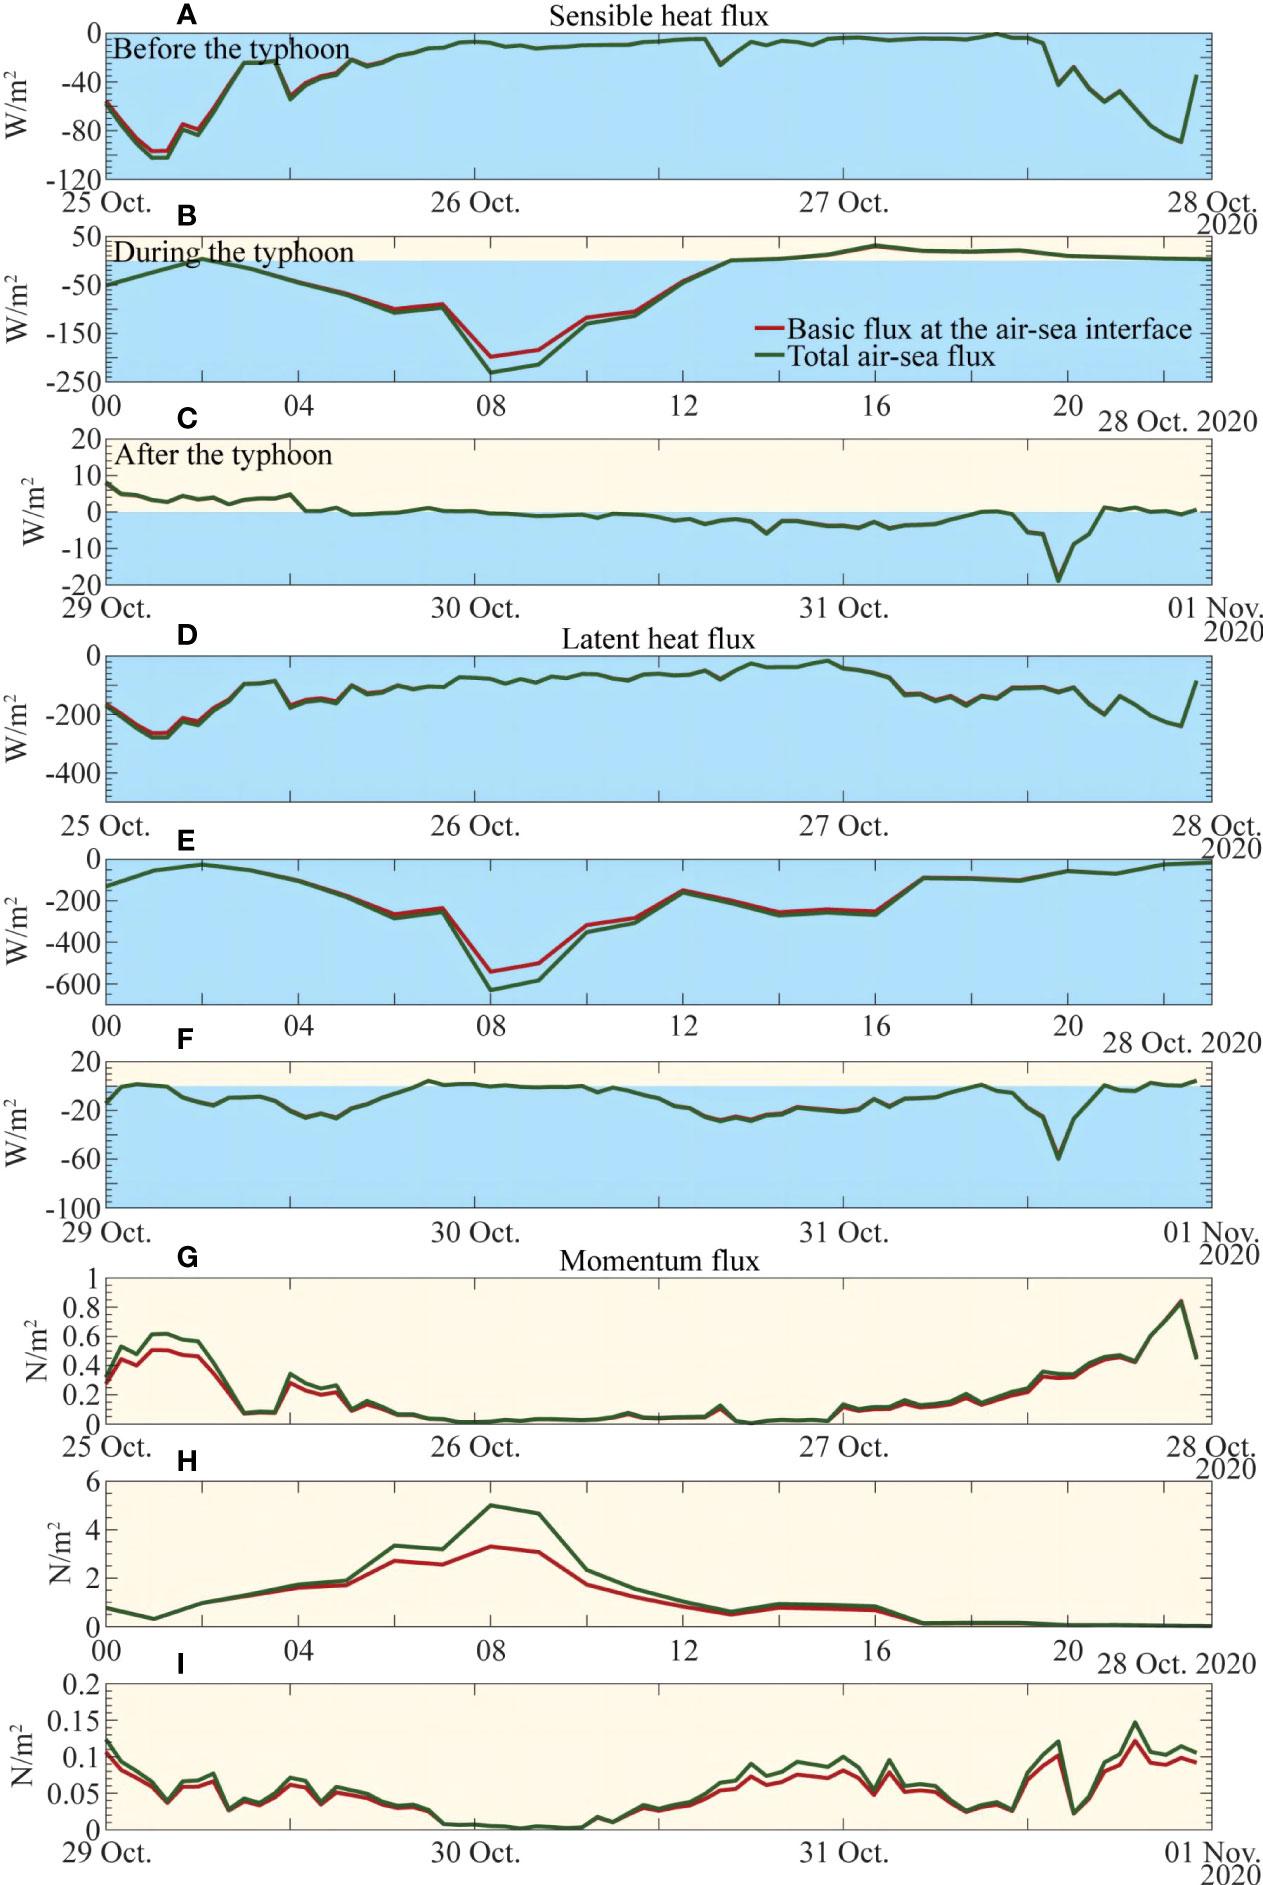
Figure 8 Time series of sensible heat flux (A–C), latent heat flux (D–F), and momentum flux (G–I) observed by DrIB.
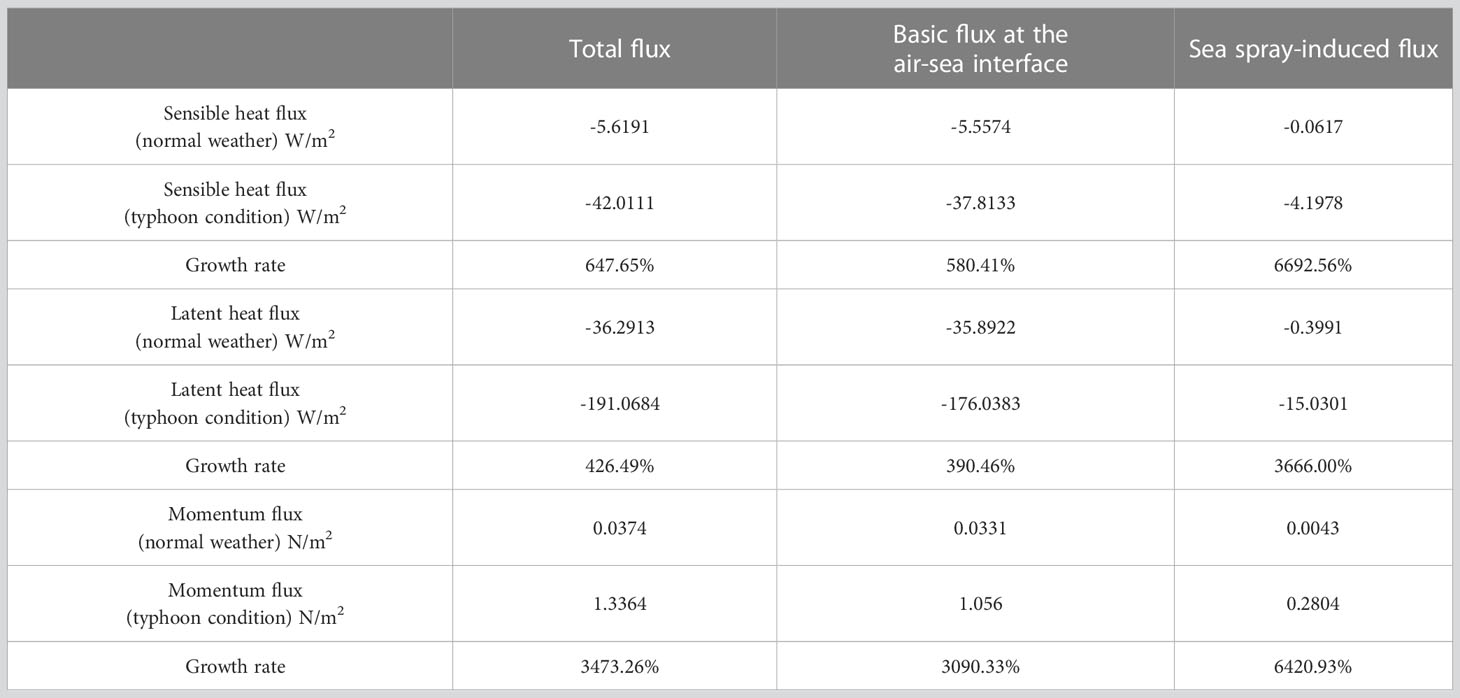
Table 4 Comparison of mean air-sea turbulent fluxes under common weather and typhoon conditions.
The linear correlation between the basic and total heat fluxes is better than that between the basic and total momentum fluxes (Figures 9A–C), with the sea spray-induced sensible and latent heat fluxes mainly within the ranges of 0-10 W/m2 and 0-30 W/m2, respectively. As the heat loss from the ocean intensifies, the scatter points become more inclined to the total fluxes, indicating the increased contribution of sea spray to the heat fluxes. For the momentum flux, the slope of the scatter points toward the total momentum flux is more significant, suggesting that they are previously more influenced by the sea spray. The wind is essential in the formation of sea spray and also acts directly on the turbulent fluxes. Within the wind speed range observed by DrIB, both the heat and momentum fluxes are positively correlated with the wind speed (Figures 9D–F). The actions of sea spray droplets are delimited at wind speeds of ~10 m/s and ~20 m/s, respectively corresponding to the stage they begin to contribute to the heat fluxes and the stage they accelerate the heat fluxes at a non-linear rate, which is consistent with the previous findings (Andreas et al., 2008). When the wind speed is below 20 m/s, the sea spray-induced momentum flux is roughly one to two orders of magnitude lower than the basic momentum flux. However, when the wind speed reaches ~30 m/s, the sea spray-induced momentum flux and the basic momentum flux are almost equivalent, and the basic momentum flux is ~1.5 N/m2 higher than the sea spray-induced momentum flux. Sea spray significantly enhances the transport of momentum from the atmosphere to the ocean with the growing winds.
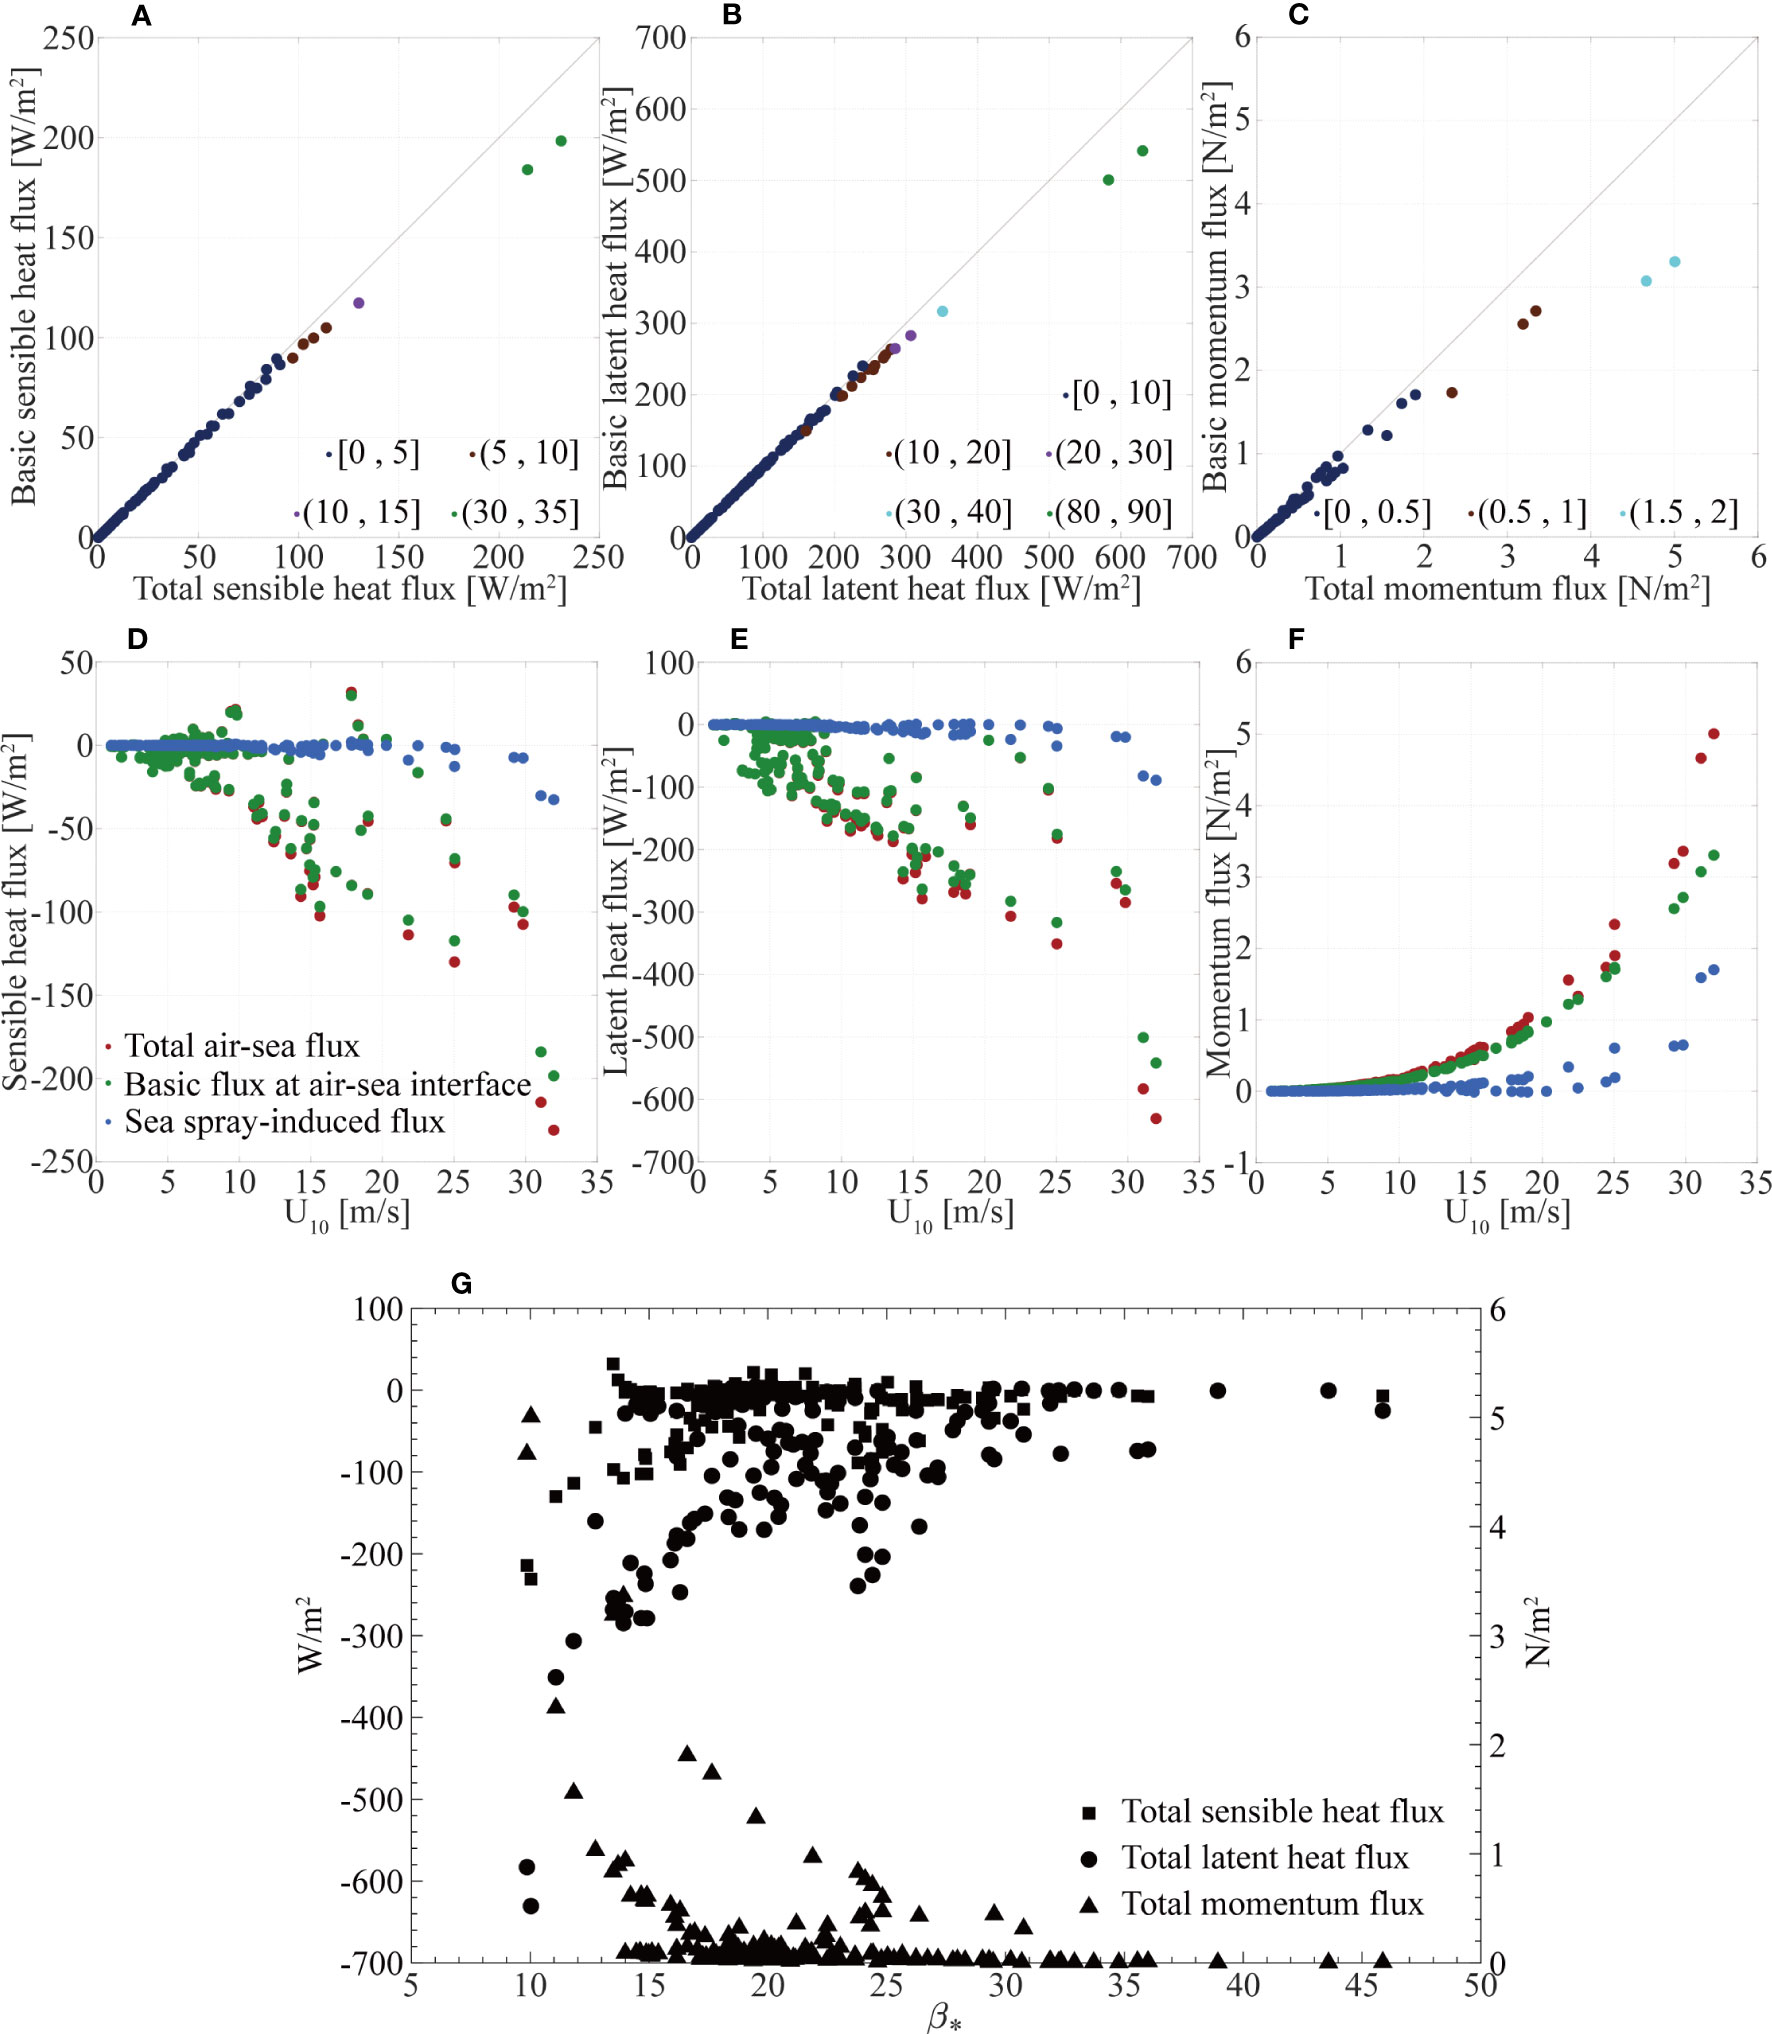
Figure 9 The distribution between the basic fluxes and the total fluxes (A–C) and the variation of air-sea fluxes with wind speed at 10 m (D–F) and the variation of air-sea fluxes with wave age (G).
According to Figure 9G, the energy exchange between the ocean and the atmosphere shows a strong negative correlation with the wave age and the total sensible, latent, and momentum fluxes decrease with the increase of wave age. The younger the wave age, the rougher the sea surface is, and the greater the exchange coefficients of air-sea fluxes under the influence of sea spray. When the wave age is less than 20, the total sensible, latent, and momentum fluxes decrease at a non-linear rate with increasing wave age. When the wave age increases to 30, the sea surface roughness decreases greatly and the total heat and momentum fluxes generally remain constant.
According to the MOST, the sensible and latent heat fluxes are determined by the variables of wind speed, air-sea temperature, and specific humidity. In order to detect the effects of those variables on the heat fluxes during Typhoon Molave, the perturbation method (Alexander and Scott, 1997; Tanimoto et al., 2003) is used to quantify the impact of each variable on the heat fluxes in the cases with and without the sea spray effects.
A perturbation is applied to the terms in equations (1) and (2), respectively, to linearize the formulas for calculating heat fluxes.
Therefore,
Eventually, the heat flux perturbation is transformed to a summation of several terms, where the bar represents the average, and the apostrophe indicates the perturbation. For equations (29) and (30), the first terms on the right side of the equal sign represent the effect of the air-sea temperature (specific humidity) difference perturbation on the sensible (latent) heat fluxes perturbation under the condition of mean wind speed; the second terms represent the effect of the wind speed perturbation on the sensible (latent) heat flux perturbation under the condition of mean air-sea temperature (specific humidity) difference. The last two terms give the nonlinear relationship between them, which is usually neglected.
The regression coefficients of the perturbation of each influencing factor to the heat flux perturbation are shown in Table 5. The sensible (latent) heat fluxes are positively correlated with wind speed and air-sea temperature (specific humidity) differences during Typhoon Molave. Wind speed is the main factor controlling the variation of sensible and latent heat fluxes, while the effects of the air-sea temperature and specific humidity differences are secondary. As an extension of wind acting on the ocean surface, sea spray to some extent amplifies the dominance of wind speed on heat fluxes and weakens the contributions of the air-sea temperature and specific humidity differences to heat fluxes.
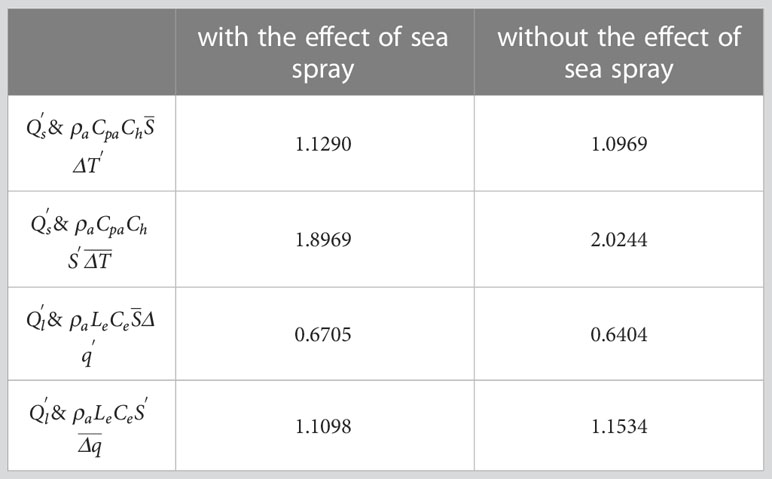
Table 5 Regression coefficients of the perturbation of each influencing factor to the perturbation of heat fluxes.
The exchange of heat and momentum between the atmosphere and the ocean is the key to sustaining or limiting the development of typhoons. In situ observations at the air-sea interface are necessary for improving the estimates of the air-sea turbulent fluxes thus the energy transfer under typhoon conditions. To this end, we utilized the meteorological and oceanic variables observed by DrIB during the passage of Typhoon Molave from 25 to 31 October 2020 and developed a new air-sea flux product (DrIB product) that incorporated the effects of the sea spray. The performances of two widely used reanalysis products, ERA5 and MERRA-2, were evaluated against our buoy observation-based product. This comparison and evaluation also served as a validation of the DrIB product. The air-sea turbulent fluxes during Typhoon Molave were systematically studied by using those products together.
Under normal weather conditions, the deviation of latent heat flux between the DrIB product and the reanalysis is larger than that of the sensible and momentum fluxes, indicating that the atmospheric humidity from the reanalysis products may have non-trivial biases. During Typhoon Molave, the differences between the reanalysis data and the DrIB product increase significantly, and the sensible heat, latent heat, and momentum fluxes from DrIB product (including the sea spray effect) are higher than those from ERA5 (MERRA-2) by about 226.2 (244.9) W/m2, 251 (360) W/m2, and 4.35 (4.6) N/m2 at the maximum, respectively. The averaged sensible heat and momentum fluxes of the DrIB product are ~250% and ~30% higher, while the mean latent heat flux is ~35% lower than the reanalysis products. The reasons for that could be: (1) inadequate representation of the high wind speed of typhoon in the reanalysis products; (2) the reanalysis products fail to characterize the reductions of air temperature and SST during the typhoon; and (3) a drier atmosphere provided by the reanalysis. Overall, ERA5 is found to be closer to the DrIB product than MERRA-2. The uncertainty of the reanalysis products under typhoon conditions is greater than that in normal weather, indicating the need for further improvements in adequately representing the extremely air-sea turbulent fluxes during typhoons. Thus, it is important to optimize the scheme of the air-sea flux parameterization as well as to improve the accuracy of variables at the air-sea interface such as the wind speed, air temperature, and humidity.
The comparison with the reanalysis products also verifies the overall reliability of DrIB observations and shows that the consideration of sea spray effects improves the rationality of the physical processes at the air-sea interface during typhoons. According to DrIB observations, near-neutral conditions dominate the atmospheric boundary layer during Typhoon Molave. The ocean supplies a large number of heat fluxes to sustain the typhoon, with the latent heat flux dominating. For normal weather with low wind speeds, sea spray contributes relatively insignificantly to air-sea fluxes, adding ~1% and ~8% to the total heat and momentum fluxes, respectively. However, under typhoon conditions, the sea spray-induced heat and momentum fluxes can be significant. At the during-typhoon stage, sea spray adds more than 5% and 17% of heat and momentum fluxes, with a maximum increase of 51.75% in the total momentum flux. The linear correlation between the basic and total heat fluxes is better than that of the momentum fluxes, and the role of sea spray involved in heat exchange increases as the intensifying of heat loss from the ocean. Sea spray droplets start to contribute to heat fluxes at the 10-m wind speed of ~10 m/s, and they non-linearly accelerate the heat fluxes at ~20 m/s. If the wind speed is less than 20 m/s, the sea spray-induced momentum flux is roughly one to two orders of magnitude lower than the basic momentum flux at the air-sea interface, and when the wind speed reaches ~30 m/s, the magnitudes of the sea spray-induced momentum flux and the basic momentum flux are almost equivalent. Wind speed is the main factor controlling the variation of sensible and latent heat fluxes, while the air-sea temperature and specific humidity differences are secondary. Sea spray to some extent amplifies the dominance of wind speed on heat fluxes and weakens the contributions of air-sea temperature and humidity differences to heat fluxes.
The results presented in this study are based on a single typhoon process that was fully recorded by DrIB. The parameterization scheme of sea spray is applicable at ultra-high wind speeds of ~60 m/s. However, due to the limitation of the observation sample, the cases beyond the observed maximum wind speed are not discussed in this study. In the future, we will apply a coupled typhoon-ocean model to further explore the extremely air-sea fluxes at higher wind speeds.Data availability statement
The raw data supporting the conclusions of this article will be made available by the authors, without undue reservation.
BW and ZD contributed to conception and design of the study. SL conducted the experiments and wrote the first draft of the manuscript. CD organized the data. YL, DS, and ZC supervised experiments and reviewed the manuscript. All authors contributed to manuscript revision, read, and approved the submitted version.
This work was supported by National Natural Science Foundation of China (No. 42176020), National Key Research and Development Program (2022YFC3105002) and Key Laboratory of Ocean Observation Technology Foundation of Ministry of Natural Resources of China (2022klootB01).
We thank Dr. Ting Yu and Prof. Xuefeng Zhang for their meaningful suggestions on the research. We also thank ECMWF, NASA and CMA for providing reanalysis data and information on typhoons.
The authors declare that the research was conducted in the absence of any commercial or financial relationships that could be construed as a potential conflict of interest.
All claims expressed in this article are solely those of the authors and do not necessarily represent those of their affiliated organizations, or those of the publisher, the editors and the reviewers. Any product that may be evaluated in this article, or claim that may be made by its manufacturer, is not guaranteed or endorsed by the publisher.
Alexander M. A., Scott J. D. (1997). Surface flux variability over the North Pacific and North Atlantic oceans. J. Clim. 10 (11), 2963–2978. doi: 10.1175/1520-0442(1997)010<2963:SFVOTN>2.0.CO;2
Andreas E. L. (1998). A new sea spray generation function for wind speeds up to 32 m s-1. J. Phys. Oceanogr. 28 (11), 2175–2184. doi: 10.1175/1520-0485(1998)028<2175:ANSSGF>2.0.CO;2
Andreas E. L., Emanuel K. A. (2001). Effects of sea spray on tropical cyclone intensity. J. Atmos. Sci. 58 (24), 3741–3751. doi: 10.1175/1520-0469(2001)058<3741:EOSSOT>2.0.CO;2
Andreas E. L., Persson P. O. G., Hare J. E. (2008). A bulk turbulent air-sea flux algorithm for high-wind, spray conditions. J. Phys. Oceanogr. 38 (7), 1581–1596. doi: 10.1175/2007JPO3813.1
Businger J. A., Wyngaard J. C., Izumi Y., Bradley E. F. (1971). Flux-profile relationships in the atmospheric surface layer. J. Atmos. Sci. 28 (2), 181–189. doi: 10.1175/1520-0469(1971)028<0181:FPRITA>2.0.CO;2
Chen S. S., Price J. F., Zhao W., Donelan M. A., Walsh E. J. (2007). The CBLAST-hurricane program and the next-generation fully coupled atmosphere-wave-ocean models for hurricane research and prediction. Bull. Am. Meteorol. Soc 88 (3), 311–317. doi: 10.1175/BAMS-88-3-311
D’Asaro E., Black P., Centurioni L., Harr P., Jayne S., Lin I. I., et al. (2011). Typhoon-ocean interaction in the western North Pacific: part 1. Oceanography 24 (4), 24–31. doi: 10.5670/oceanog.2011.91
D’Asaro E. A., Sanford T. B., Niiler P. P., Terrill E. J. (2007). Cold wake of hurricane frances. Geophys. Res. Lett. 34 (15), L15609. doi: 10.1029/2007GL030160
DeMaria M., Mainelli M., Shay L. K., Knaff J. A., Kaplan J. (2005). Further improvements to the statistical hurricane intensity prediction scheme (SHIPS). Weather Forecast. 20 (4), 531–543. doi: 10.1175/WAF862.1
Duan Y., Wu R., Yu R., Liang X. (2014). Erratum to: numerical simulation of changes in tropical cyclone intensity using a coupled air-sea model. J. Meteorol. Res. 28 (2), 324–324. doi: 10.1007/s13351-013-0506-z
Emanuel K. A. (1999). Thermodynamic control of hurricane intensity. Nature 401 (6754), 665–669. doi: 10.1038/44326
Fairall C. W., Bradley E. F., Hare J., Grachev A. A., Edson J. B. (2003). Bulk parameterization of air-sea fluxes: updates and verification for the COARE algorithm. J. Clim. 16 (4), 571–591. doi: 10.1175/1520-0442(2003)016<0571:BPOASF>2.0.CO;2
Gleckler P. J., Weare B. C. (1997). Uncertainties in global ocean surface heat flux climatologies derived from ship observations. J. Clim. 10 (11), 2764–2781. doi: 10.1175/1520-0442(1997)010<2764:UIGOSH>2.0.CO;2
Grist J. P., Josey S. A. (2003). Inverse analysis adjustment of the SOC air-sea flux climatology using ocean heat transport constraints. J. Clim. 16 (20), 3274–3295. doi: 10.1175/1520-0442(2003)016<3274:IAAOTS>2.0.CO;2
Helfand H. M., Schubert S. D. (1995). Climatology of the simulated great plains low-level jet and its contribution to the continental moisture budget of the United States. J. Clim. 8 (4), 784–806. doi: 10.1175/1520-0442(1995)008<0784:COTSGP>2.0.CO;2
Jeong D., Haus B. K., Donelan M. A. (2012). Enthalpy transfer across the air-water interface in high winds including spray. J. Atmos. Sci. 69 (9), 2733–2748. doi: 10.1175/JAS-D-11-0260.1
Li W. (2004). Modelling air-sea fluxes during a western pacific typhoon: role of sea spray. Adv. Atmos. Sci. 21 (2), 269–276. doi: 10.1007/BF02915713
Louis J. F. (1979). A parametric model of vertical eddy fluxes in the atmosphere. Bound-Lay. Meteorol. 17 (2), 187–202. doi: 10.1007/BF00117978
Lu X., Yu H., Ying M., Zhao B., Zhang S., Lin L., et al. (2021). Western North Pacific tropical cyclone database created by the China meteorological administration. Adv. Atmos. Sci. 38 (4), 690–699. doi: 10.1007/s00376-020-0211-7
Molod A., Takacs L., Suarez M., Bacmeister J. (2015). Development of the GEOS-5 atmospheric general circulation model: evolution from MERRA to MERRA2. Geosci. Model. Dev. 8 (5), 1339–1356. doi: 10.5194/gmd-8-1339-2015
Shan X., Jing Z., Gan B., Wu L., Chang P., Ma X., et al. (2020). Surface heat flux induced by mesoscale eddies cools the kuroshio-oyashio extension region. Geophys. Res. Lett. 47 (1), e2019GL086050. doi: 10.1029/2019GL086050
Shi J., Feng Z., Sun Y., Zhang X., Zhang W., Yu Y. (2021). Relationship between sea surface drag coefficient and wave state. J. Mar. Sci. Eng. 9 (11), 1248. doi: 10.3390/jmse9111248
Shi H., Li Q., Wang Z., Zhang X., Li H., Xing H., et al. (2023). The influence of sea sprays on drag coefficient at high wind speed. J. Ocean Univ. China 22 (1), 21–27. doi: 10.1007/s11802-022-5050-y
Smith S. D. (1988). Coefficients for sea surface wind stress, heat flux, and wind profiles as a function of wind speed and temperature. J. Geophys. Res. Oceans 93 (C12), 15467–15472. doi: 10.1029/JC093iC12p15467
Song X. (2020). The importance of relative wind speed in estimating air-sea turbulent heat fluxes in bulk formulas: examples in the bohai Sea. J. Atmos. Ocean. Technol. 37 (4), 589–603. doi: 10.1175/JTECH-D-19-0091.1
Song X., Ning C., Duan Y., Wang H., Li C., Yang Y., et al. (2021). Observed extreme air-sea heat flux variations during three tropical cyclones in the tropical southeastern Indian ocean. J. Clim. 34 (9), 3683–3705. doi: 10.1175/JCLI-D-20-0170.1
Sroka S., Emanuel K. (2022). Sensitivity of sea-surface enthalpy and momentum fluxes to sea spray microphysics. J. Geophys. Res. Oceans 127 (1), e2021JC017774. doi: 10.1029/2021JC017774
Tanimoto Y., Nakamura H., Kagimoto T., Yamane S. (2003). An active role of extratropical sea surface temperature anomalies in determining anomalous turbulent heat flux. J. Geophys. Res. Oceans 108 (C10), 3304. doi: 10.1029/2002JC001750
Weare B. C. (1989). Uncertainties in estimates of surface heat fluxes derived from marine reports over the tropical and subtropical oceans. Tellus A 41 (4), 35–37. doi: 10.3402/tellusa.v41i4.11846
Wu W. S., Purser R. J., Parrish D. F. (2002). Three-dimensional variational analysis with spatially inhomogeneous covariances. Mon. Weather Rev. 130 (12), 2905–2916. doi: 10.1175/1520-0493(2002)130<2905:TDVAWS>2.0.CO;2
Xu X., Gao Z. (2012). Testing OAFlux field by using the shipborne heat flux measurements. Climatic Environ. Res. (in Chinese) 17 (3), 281–291. doi: 10.3878/j.issn.1006-9585.2011.10096
Xu X., Voermans J. J., Moon I. J., Liu Q., Guan C., Babanin A. V. (2022). Sea Spray impacts on tropical cyclone olwyn using a coupled atmosphere-ocean-wave model. J. Geophys. Res. Oceans 127 (8), e2022JC018557. doi: 10.1029/2022JC018557
Ying M., Zhang W., Yu H., Lu X., Feng J., Fan Y., et al. (2014). An overview of the China meteorological administration tropical cyclone database. J. Atmos. Ocean. Technol. 31 (2), 287–301. doi: 10.1175/JTECH-D-12-00119.1
Yu L. (2019). Global air-sea fluxes of heat, fresh water, and momentum: energy budget closure and unanswered questions. Ann. Rev. Mar. Sci. 11, 227–248. doi: 10.1146/annurev-marine-010816-060704
Zhang L., Zhang X., Chu P. C., Guan C., Fu H., Chao G., et al. (2017). Impact of sea spray on the yellow and East China seas thermal structure during the passage of typhoon rammasun, (2002). J. Geophys. Res. Oceans 122 (10), 7783–7802. doi: 10.1002/2016JC012592
Zhang L., Zhang X., Perrie W., Guan C., Dan B., Sun C., et al. (2021). Impact of sea spray and sea surface roughness on the upper ocean response to super typhoon haitang, (2005). J. Phys. Oceanogr. 51 (6), 1929–1945. doi: 10.1175/JPO-D-20-0208.1
Keywords: drifting buoy, air-sea fluxes, sea spray, Typhoon Molave, COARE algorithm
Citation: Li S, Wang B, Deng Z, Dang C, Li Y, Sun D and Chen Z (2023) The role of sea spray in air-sea fluxes during Typhoon Molave: a study based on drifting buoy observations. Front. Mar. Sci. 10:1228560. doi: 10.3389/fmars.2023.1228560
Received: 25 May 2023; Accepted: 14 June 2023;
Published: 27 June 2023.
Edited by:
Jinbao Song, Zhejiang University, ChinaReviewed by:
Zhongshui Zou, Sun Yat-sen University, ChinaCopyright © 2023 Li, Wang, Deng, Dang, Li, Sun and Chen. This is an open-access article distributed under the terms of the Creative Commons Attribution License (CC BY). The use, distribution or reproduction in other forums is permitted, provided the original author(s) and the copyright owner(s) are credited and that the original publication in this journal is cited, in accordance with accepted academic practice. No use, distribution or reproduction is permitted which does not comply with these terms.
*Correspondence: Bin Wang, bm90Y19id2FuZ0AxNjMuY29t; Zengan Deng, ZGVuZ3plbmdhbkAxNjMuY29t
Disclaimer: All claims expressed in this article are solely those of the authors and do not necessarily represent those of their affiliated organizations, or those of the publisher, the editors and the reviewers. Any product that may be evaluated in this article or claim that may be made by its manufacturer is not guaranteed or endorsed by the publisher.
Research integrity at Frontiers
Learn more about the work of our research integrity team to safeguard the quality of each article we publish.