 Wenjie Fan
 Zhihao Xu
 Qian Dong1
 Yanpeng Cai
95% of researchers rate our articles as excellent or good
Learn more about the work of our research integrity team to safeguard the quality of each article we publish.
Find out more
ORIGINAL RESEARCH article
Front. Mar. Sci. , 10 August 2023
Sec. Marine Ecosystem Ecology
Volume 10 - 2023 | https://doi.org/10.3389/fmars.2023.1226234
This article is part of the Research Topic Degradation, Ecological Restoration and Adaptive Management of Estuarine Wetlands under Intensifying Global Changes, volume II View all 11 articles
Climate change and intensive anthropogenic activities have severely challenged the water quality of China’s Pearl River Estuary (PRE). Further investigations into long-term water quality variation and associated driving mechanisms are therefore necessary to support the sustainable development of the PRE’s Greater Bay Area (GBA). This study used remote sensing retrieval to address long-term spatiotemporal chlorophyll-a (Chl-a) variation characteristics in the PRE and the relationship between Chl-a concentrations and socioeconomic/environmental indicators. Three decades of Landsat satellite images and measured data were collected, and a two-band global algorithm was used to retrieve Chl-a concentration data. Results reveal significant spatiotemporal variability in Chl-a concentrations. The space-averaged Chl-a concentration exhibited a slight downward trend during the past three decades, and the multi-year mean value was 5.20 mg/L. Changes to environmental protection policies in recent years have improved overall PRE water quality. The western section of the PRE had the highest Chl-a concentration (i.e., 5.92 mg/L average) while the eastern section had the lowest (i.e., 3.98 mg/L average). This discrepancy was likely caused by the western section’s more intensive industrial activities, resulting in a higher overall wastewater discharge volume. Affected by climatic conditions, winter Chl-a concentrations were evenly distributed while summer concentrations were significantly higher. Additionally, Chl-a concentrations significantly and positively correlated with total phosphorus (TP), total nitrogen (TN), ammonia nitrogen (NH3-N), and the biotic oxygen demand (BOD5). Chl-a concentrations also correlated with external factors (i.e., climate and anthropogenic activities). Among these factors, industrial wastewater discharge and the proportion of primary industries in coastal cities significantly and positively correlated with water quality. This study is intended to help direct water quality improvement management and urban sustainable development in the GBA.
Although Estuaries are among the most productive ecosystems in the world, they are vulnerable to climate change and anthropogenic activities (Scanes et al., 2020; Burford and Faggotter, 2021). Located at the land-ocean interface, estuaries are vulnerable to nutrient inputs from surrounding agricultural, industrial, and urban development (Jeffries et al., 2016). Meanwhile, the withdrawal of potable water from upstream catchments can significantly decrease freshwater inflow while facilitating nutrient accumulation in estuaries (Jiang et al., 2014). Additionally, estuarine eutrophication has become a global issue, causing multiple environmental issues, including harmful algal blooms, hypoxic “dead zones”, and habitat degradation, which have affected species richness (Testa et al., 2018; Wurtsbaugh et al., 2019; Montefiore et al., 2023). On average, in China’s coastal regions, there have been over 60 red tide events annually over the past two decades (Wang et al., 2018). To improve estuary sustainability, it is important to clarify long-term water quality variation and associated driving factors in eutrophic estuaries.
Satellite-based remote sensing provides an efficient and cost-effective way to monitor environmental changes in aquatic systems (Gholizadeh et al., 2016; Jay et al., 2017; Chawla et al., 2020), which is becoming increasingly attractive because of its high monitoring frequency and spatiotemporal coverage (Tong et al., 2022). It has been widely used in retrieval of various water quality indicators, such as chlorophyll-a (Chl-a), total suspended solid (TSS), dissolved oxygen (DO), nutrients, and chromophoric dissolved organic matter (CDOM) (Ross et al., 2019; Kim et al., 2020). Specifically, Chl-a is a key indicator used to evaluate algal conditions and eutrophication status in freshwater and marine environments (Tong et al., 2022). Significant advancements have been made in Chl-a concentration research. For example, many relevant studies have used remote sensing algorithms to estimate Chl-a concentrations. These include fluorescence peak algorithms, artificial neural network algorithms, and blue-green band ratio and near-infrared-red band ratio (Gilerson et al., 2010; Ioannou et al., 2013; Beck et al., 2016; O'Reilly and Werdell, 2019). The application of these algorithms improves the accuracy and universality of Chl-a estimates through remote sensing. Much attention has been paid to long-term spatiotemporal variation in Chl-a concentrations and associated driving factors. Researchers have employed various remote sensing techniques and water quality monitoring methods to comprehensively analyze the spatiotemporal evolution of Chl-a concentrations (Zhang et al., 2013; Moradi and Kabiri, 2015; Wang et al., 2015). External driving factors, such as climate, anthropogenic activities (Conley et al., 2009; Paerl and Huisman, 2009), ENSO effects (i.e., climatic oscillations), and water mass transportation (Durack, 2015; Guo et al., 2017; Lao et al., 2022; Lao et al., 2023) have all been found to be extremely important factors that affect Chl-a variation. Changes in temperature, precipitation, and water pollution have a particularly impactful influence on Chl-a concentrations in estuarine zones (Ding et al., 2015; Shrestha et al., 2018; Li et al., 2022).
The Pearl River Estuary (PRE) is one of China’s regions where anthropogenic activities and natural factors converge and conflict, particularly over the past three decades (Cao et al., 2022). Therefore, it is vital that we investigate long-term spatiotemporal variation and associative driving factors in PRE water quality (Chen et al., 2021). Extensive relevant research has focused on the methods used to retrieve PRE water quality data (Zheng and DiGiacomo, 2017), including the three-band model (Chen et al., 2011), red-peak algorithms (Liu and Tang, 2019), and deep learning (Ye et al., 2021). Other studies have focused on analyzing spatiotemporal water quality variation in the PRE, such as spatiotemporal variation in Chl-a concentrations (Gao et al., 2020), total phosphorus (TP) (Lu et al., 2020), total nitrogen (TN) (Guo et al., 2022), dissolved organic carbon (DOC) (Liu et al., 2015), TSS (Wang et al., 2018), and CDOM (Chen et al., 2004). Some studies have even explored the combined impact of natural factors and anthropogenic activities on PRE water quality. These studies have examined various factors, including air temperature, precipitation, reclamation initiatives, and industrial and agricultural activity development within the vicinity of water (Wang et al., 2019; Cao et al., 2022; Shen et al., 2022). The aim of these studies was to understand the complex interactions that occur between natural processes and human interventions that subsequently influence estuarine water quality. Chl-a research has been especially extensive. This is due to its influencing factors, such as seasonality, tides, estuarine mixing, and seasonal changes in terrestrial nutrient inputs (Qiu et al., 2010; Ye et al., 2016; Tao et al., 2020; Liang et al., 2021). Moreover, Chl-a concentrations in the PRE exhibit distinct seasonal and interannual variation as well as significant spatial heterogeneity across different sections. Collectively, this pattern closely correlates to natural factors and anthropogenic activities (Sigman and Hain, 2012; Xu et al., 2022). However, there is a lack of comprehensive research on long-term spatiotemporal dynamics in the PRE prior to 2000, while relationships between Chl-a concentrations and internal and external factors remain unclear. Therefore, it is critical that we investigate long-term spatiotemporal dynamics and associative driving mechanisms of PRE water quality.
The aim of this study was to analyze the spatiotemporal evolution of PRE water quality over the past 30 years and explore its associative driving factors. For this study the PRE was divided into four regions where we collected water quality data, meteorological data, socio-economic development data, and satellite imagery products. Moreover, we built a Chl-a concentration retrieval model to analyze spatiotemporal variability within the PRE. Both statistical analysis and correlation analysis were used to investigate the relationship between Chl-a concentrations and associative driving factors in conjunction with spatial and temporal variability.
The Guangdong-Hong Kong-Macao Greater Bay Area (GBA), more commonly referred to as the GBA, is one region in China with the highest urbanization and industrialization rates (Zhou et al., 2018). Along with the GBA’s rapid economic development, a large amount of nitrogen (N) and phosphorus (P) pollutants from industrial and agricultural wastewater and domestic sewage is discharged into the PRE (Huang et al., 2003; Tao et al., 2021). The PRE’s water surface area, which the GBA surrounds, is approximately 1700 km2. Its longitudinal and latitudinal coordinates are 113°44′43.1″ E and 22°34′38.25″ N, respectively (Yuan et al., 2022). The PRE’s complex hydrological network and diverse environmental conditions have made it a prominent research focus within the scientific community (Wu et al., 2016). Under the influence of its subtropical monsoon climate, river flow and wind speed are manifested by pronounced seasonal variation (Lu and Gan, 2015). Most annual discharge from the Pearl River (approx. 80%) occurs during the rainy season (Ye et al., 2017). This causes considerable disparity in river flow between the dry season (October to April) and the rainy season (May to September), with average values of approximately 1500 m3/s and 20000 m3/s, respectively (Liu et al., 2012). In the PRE, weak southwesterly winds predominant during the summer, whereas strong northeastern winds dominate during the winter (Zhang et al., 2019). Seasonal variations in hydrodynamic conditions have a considerable influence on seasonal water quality dynamics in the PRE. In brief, climate change and rapid urbanization exert a heavy strain on PRE water quality, posing significant challenges to its ecological well-being. The PRE is a large aquatic region. Anthropogenic activities in many of its cities throughout its different sections cause varying degrees of pollution and nutrient inputs, which significantly impact Chl-a concentrations. In this study, we divided the PRE into four sections based on its coastal cities to analyze spatiotemporal evolutionary features (Figure 1). These four sections were specifically divided into the northern section (adjacent to Guangzhou and Dongguan), the eastern section (adjacent to Shenzhen), the western section (adjacent to Zhuhai and Zhongshan), and the southern section (adjacent to the open sea).
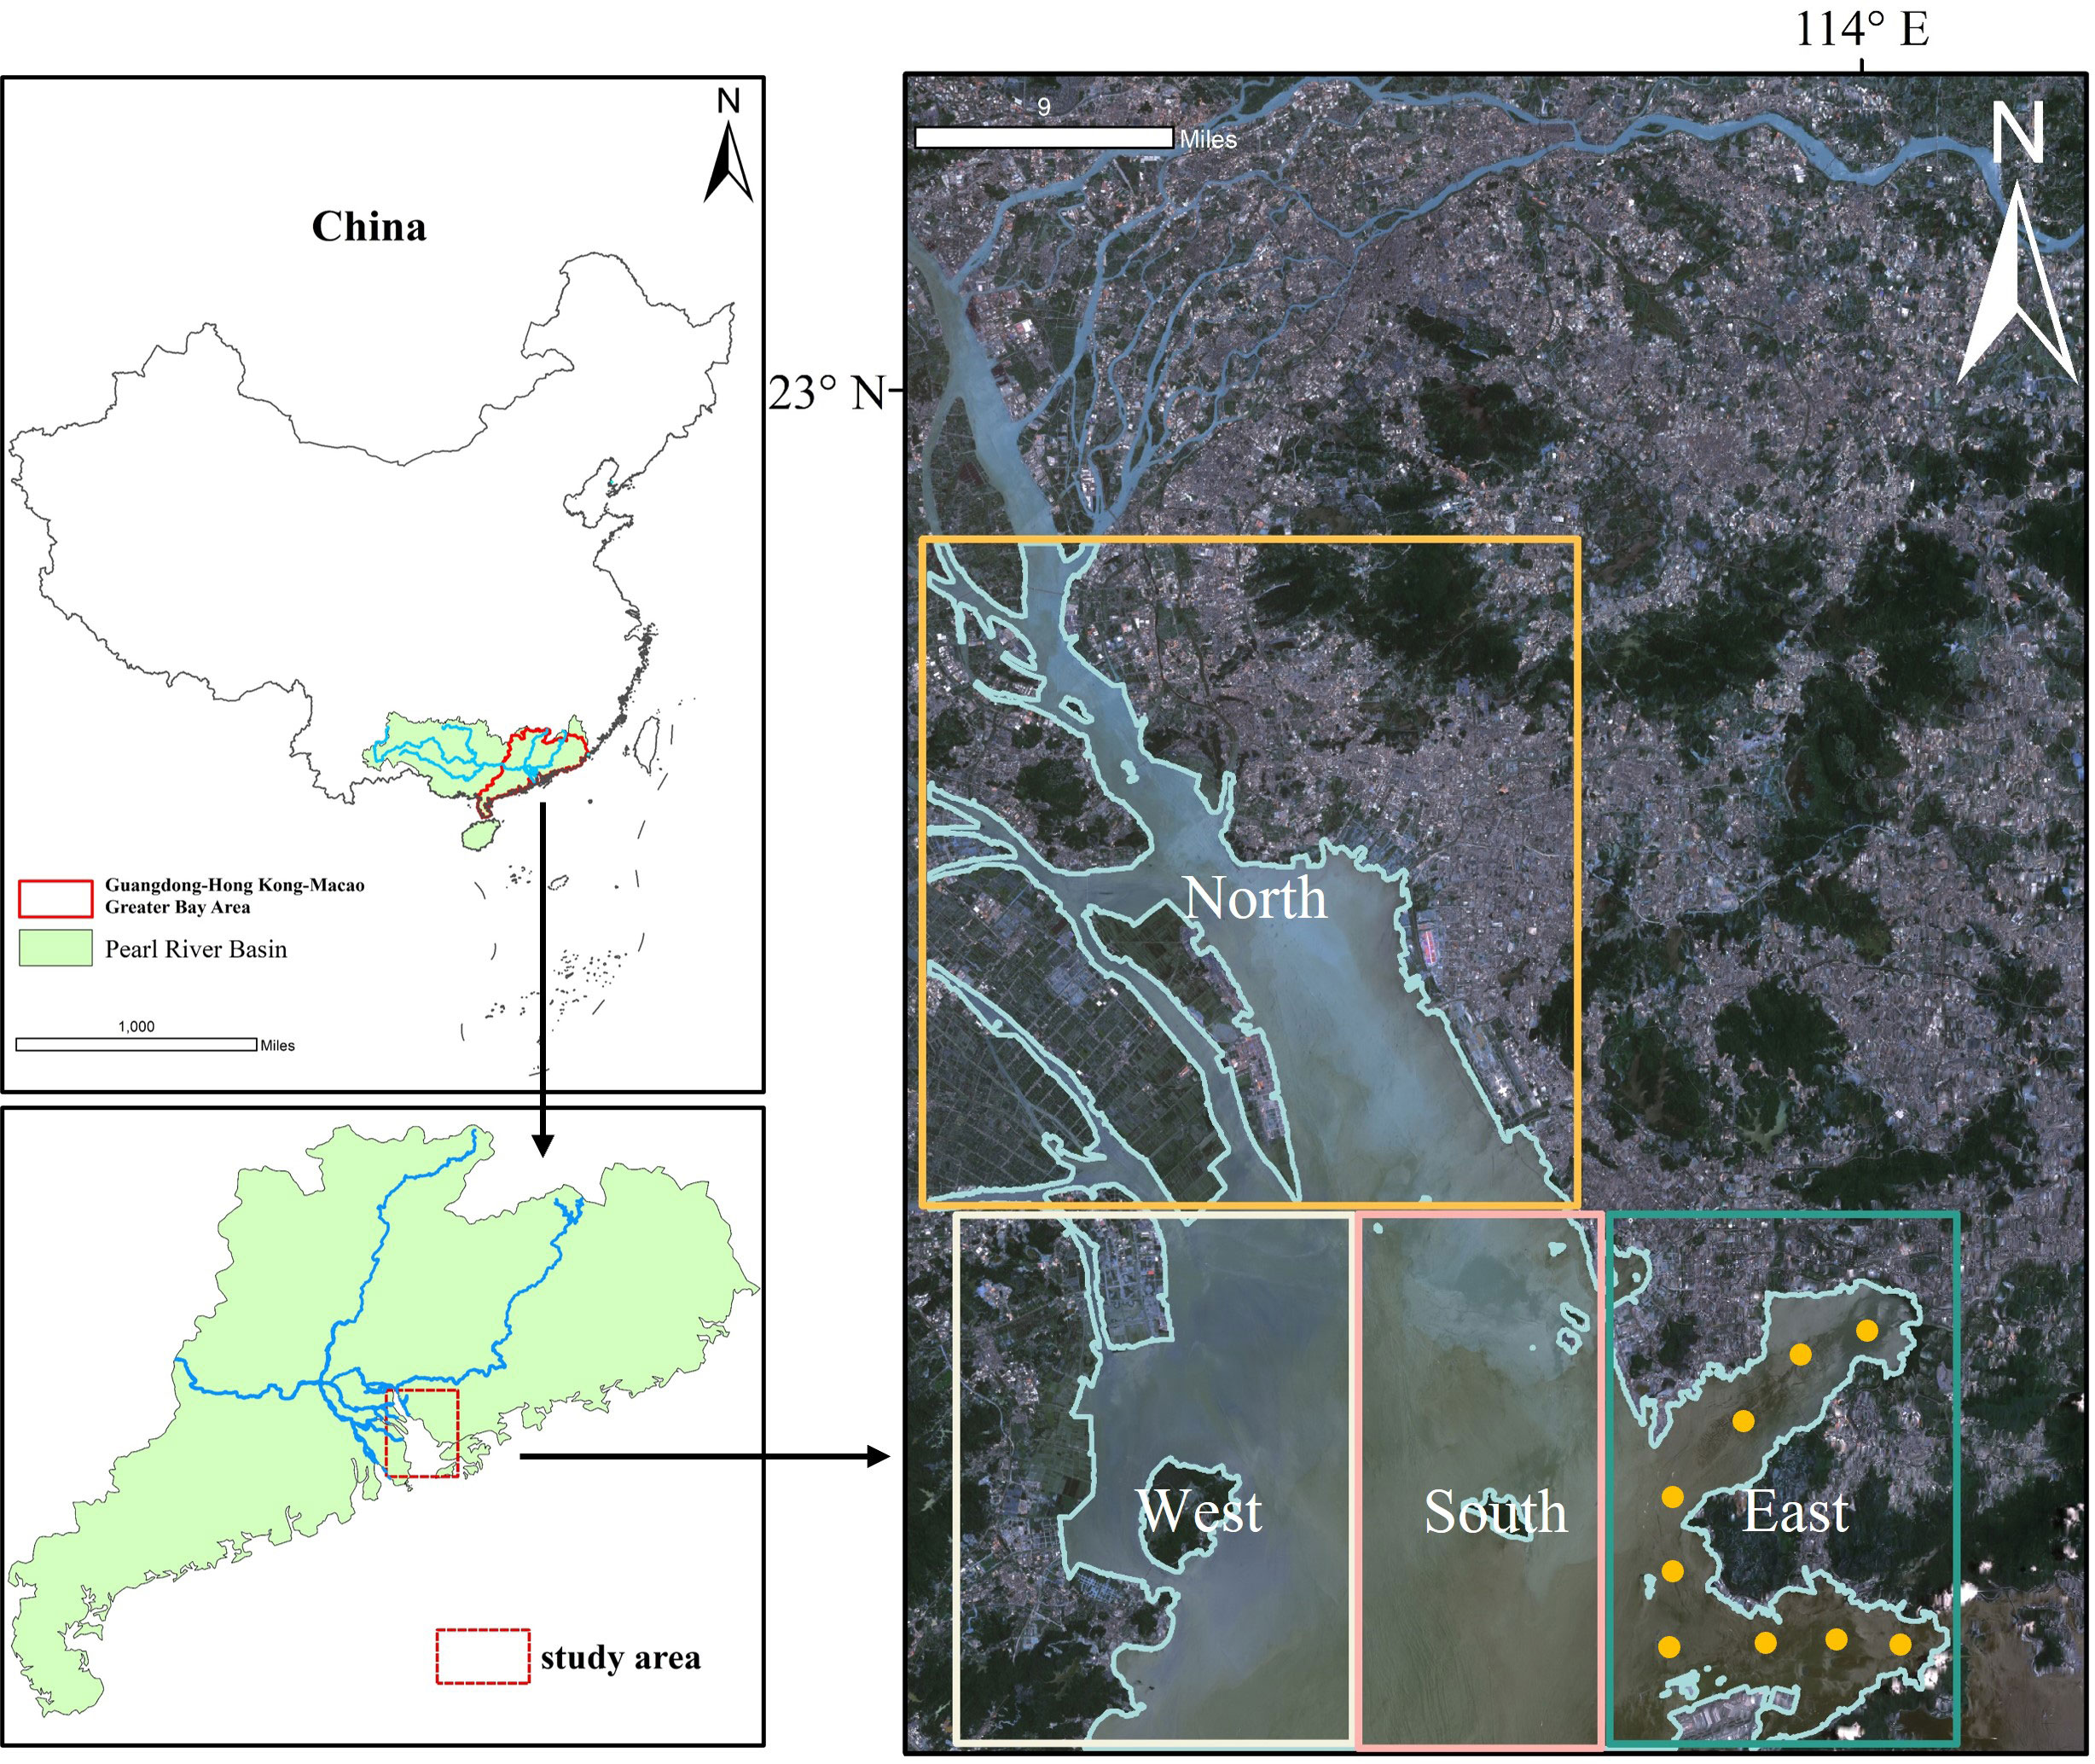
Figure 1 Location and sectional divisions of the study area. The locations where data were measured are marked with points.
Since 1986, the Environmental Protection Department (EPD) of Hong Kong has measured water quality monthly within its coastal waters. This study uses water quality indicators, including Chl-a, TP, TN, ammonia nitrogen (NH3-N), and biotic oxygen demand (BOD5). Long-term data on these water quality indicators were collected between 1989–2019, which we sourced from 9 EPD meteorological stations (Figure 1). For detailed information on water quality, please refer to the EPD website. (https://www.epd.gov.hk).
Precipitation and temperature fluctuations can give rise to alterations in the physical and chemical attributes of aquatic environments. Anthropogenic activities, including the discharge of industrial wastewater and the agricultural development of urban areas, exert a considerable influence on water quality, which are as significant as external factors (Liu et al., 2022). A higher proportion of primary industries is indicative of a developed agricultural sector within urban areas. Therefore, this study selected temperature, precipitation, industrial wastewater discharge, and the proportion of primary industries as driving factors. Given the limited availability of historical water temperature data within the study area, we used temperature data from cities near the PRE between 1989–2019, which we obtained from meteorological websites (http://data.cma.cn/). The precipitation data used in this study derive between 1989–2019, which we obtained from the daily global precipitation measurement dataset provided by the National Aeronautics and Space Administration (NASA) (https://disc.gsfc.nasa.gov). Socio-economic development factors considered in this study include the industrial wastewater discharge, and the proportion of the primary industry in the cities neighboring the PRE between 1989–2019. Urbanization data used in this study primarily derive from statistical yearbooks, which were obtained from various regions.
This study uses satellite imagery products, including digital products from the Landsat 5 and Landsat 7 satellites. The Landsat series satellites are jointly developed by NASA and the United States Geological Survey (USGS) which were launched in 1972. These satellites have a revisit period of 16 days and a spatial resolution of 30 m. Considering sampling time and cloud cover on satellite acquisition dates, we collected approximately 100 surface reflectance images of the PRE between 1989–2019. Satellite imagery products are obtained from USGS (https://earthexplorer.usgs.gov).
The satellite images used in this study included both water and land information. However, only water information was used during the retrieval process. It was necessary to extract water information and remove land information. Google Earth Engine (GEE) platform offers a geospatial processing service. Users can perform large-scale geospatial processing provided by Google Cloud Platform support. Landsat 5 Collection 2 Tier 1 calibrated top-of-atmosphere reflectance (TOA) reflectance images were directly downloaded from the GEE platform (Mutanga and Kumar, 2019). Because the GEE platform eliminates the need for radiometric calibration and atmospheric correction, we used it to preprocess Landsat 5 images between 1989–2011, including cropping, cloud removal, and band manipulation.
To ensure research analysis accuracy and improve the extraction precision of satellite image information, it was necessary to use atmospheric correction to remove interference caused by atmospheric scattering and other factors on land features. In this study, ENVI 5.3 software was used to preprocess Landsat 7 images between 2012–2019, including cropping, striping removal, radiometric calibration, atmospheric correction, and band calculations. The FLAASH atmospheric correction tool was used for atmospheric correction, which ENVI 5.3 provides. It offers high multispectral data accuracy correction, and it has widely been used in atmospheric correction models. Additionally, digital numbers recorded by the sensor must be converted to radiance values. The radiometric calibration tool in ENVI 5.3 was used for conversions, applying the following formula:
where L is radiance; DN is the recorded sensor grayscale values; a represents gain; L0 represents the offset value.
Chl-a concentration remote sensing retrieval is a process of estimating Chl-a concentrations from satellite images by utilizing its spectral reflectance characteristics. Chl-a exhibits strong absorption and reflection in the blue wavelength range(450-495nm) and green wavelength range(495-570nm) (O'Reilly et al., 1998). Both bands strongly correlate with Chl-a. Most empirical algorithms use them to establish models for Chl-a concentration retrieval.
Two-band (OC2v4) and four-band (OC4v4) global algorithms were developed by NASA; however, they tend to systematically overestimate Chl-a concentrations (D'Ortenzio et al., 2002). The OC2_D’Ortenzio algorithm is an improved version of OC2v4. It performs well when applied to biogeochemical measurements or satellite data (Pan et al., 2010). Considering the dynamic nature of the study area, we used the OC2_D’Ortenzio algorithm to construct a Chl-a concentration retrieval model. This algorithm is based on a nonlinear relationship, improved by a cubic polynomial function, between ocean reflectance and in-situ Chl-a concentrations measurements.
where C is the Chl-a concentration; B is the land-surface reflectance ratio; Rrs490 and Rrs555 were obtained from 490 nm and 555 nm land surface reflectance; a = 0.217, −2.728, 0.704, 0.297, and −0.035, which are algorithm constants.
To evaluate model accuracy, the statistical metrics used for validation were the coefficient of determination (R2), the root-mean-square error (RMSE), and biases. The following equations show the formulae used:
where n is the sample size; Sest,i is the value fitting curve obtained; Xobs,i is the in-situ data obtained; obs,i is the average of Xobs,i; Xest,i is the estimated data obtained.
Relationships among water quality factors (TP, TN, NH3-N, and BOD5) and external driving factors are examined through Pearson correlation analysis and regression analysis. Pearson correlation coefficient is used to measure the correlation between various variables and Chl-a concentrations in the PRE. Pearson correlation coefficient ranges from −1 to +1, where −1 denotes no negative correlation, +1 denotes a positive correlation, and 0 denotes no correlation. A significance level<0.05 (P< 0.05) was considered statistically significant. Data preparation for Pearson correlation analysis was conducted using IBM SPSS Statistics 27 software.
Partial least squares regression (PLS regression) models were used to analyze driving factors. PLS regression is a statistical modeling method used to establish predictive models between input variables and output variables. Its advantage is its ability to manage highly correlated input variables. By constructing latent variables, it decouples relationships between input variables and output variables. Additionally, PLS regression can effectively manage small sample sizes. PLS regression effectiveness can be evaluated using Variable Importance in Projection (VIP) scores. VIP scores indicate the importance of each predictor variable in explaining the response variable. If the VIP score of a predictor variable is >1.0, the variable has a significant impact on explaining the response variable. On the other hand, if the VIP score is<0.5, the variable does not contribute significantly to explaining the response variable. Values between 0.5 and 1.0 indicate a moderate level of importance. PLS regression was constructed using IBM SPSS Statistics 27 software.
This study validates the performance of a remote sensing retrieval model used to estimate Chl-a concentrations by comparing simulated values with a dataset of measured data. The measured data spans from 1989 to 2019, with a total of 113 observations. Measured data were obtained from the EPD of Hong Kong and is considered highly reliable. Simulated Chl-a concentration values derived from satellite images. Simulated values and measured data correspond closely in time and geographical coordinates. The RMSE of the model was 2.55 mg/L, with a bias of −1.39 mg/L. A scatter plot (Figure 2) was generated using measured values as the independent variable and the simulated values as the dependent variable. Outliers that deviate significantly from other data points were removed, resulting in a total of 110 data points. The data points are relatively clustered, and the R2 values between the linear regression line (i.e., the blue solid line) and the data points was 0.7155. Difference among verification results and that from other relevant PRE studies were within an acceptable range (Ma et al., 2022). This strongly indicates that this model used in this study can estimate PRE Chl-a concentrations.
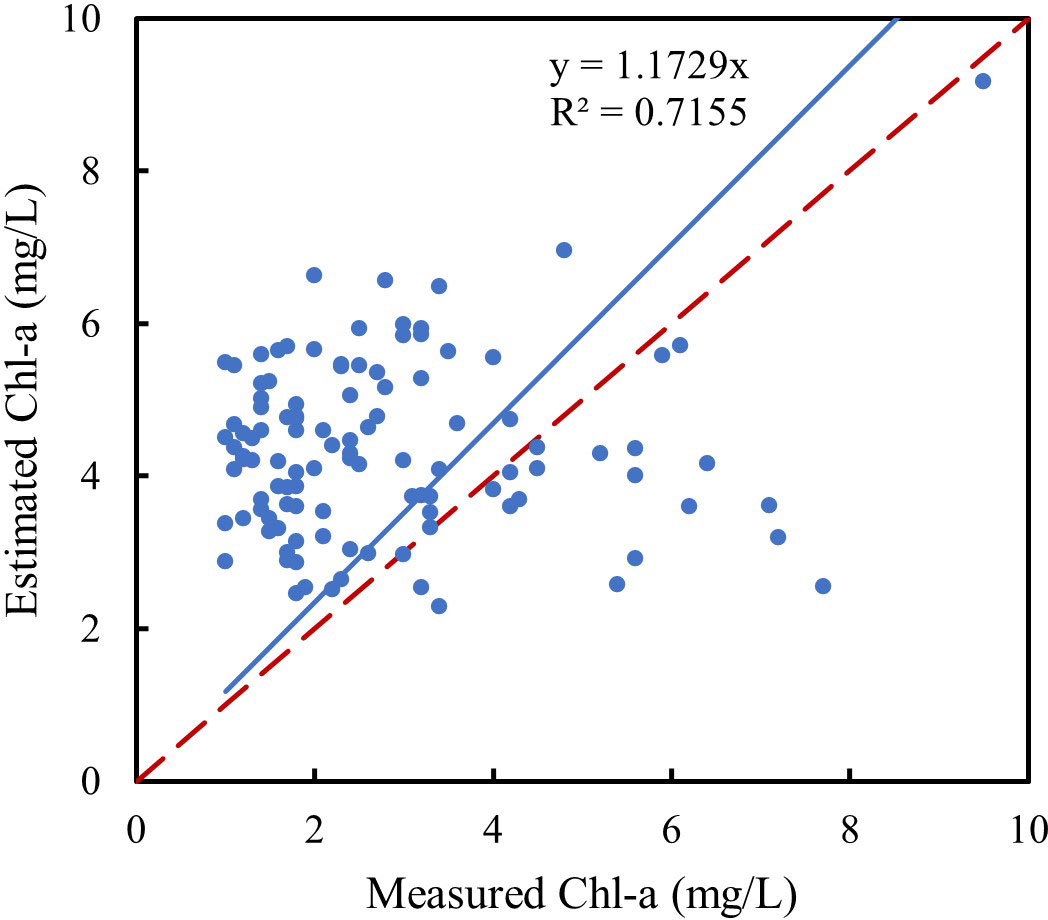
Figure 2 Comparison of estimated and measured Chl-a concentrations.
This study analyzed annual spatial distribution characteristics in PRE Chl-a concentrations using images taken in the spring (March to May), summer (June to August), autumn (September to November), and winter (December to February) of 2010 (Figure 3). The spatial distribution of PRE Chl-a concentrations exhibited distinct patterns across the various seasons. Average Chl-a concentrations in spring, summer, autumn, and winter were 5.07 mg/L, 6.15 mg/L, 4.29 mg/L, and 3.11 mg/L, respectively. Standard deviations were 2.59 mg/L, 1.52 mg/L, 2.25 mg/L, and 0.68 mg/L. In spring and autumn, the western and eastern sections exhibited high Chl-a concentrations while the northern and southern regions exhibited lower Chl-a concentrations. Elevated Chl-a concentrations were found near the coastline but gradually decreased the further inland they were. During winter, due to lower water temperatures and slower phytoplankton growth, Chl-a concentrations in the water column was relatively low. Furthermore, the mixing of water masses within the PRE was influenced by strong northeasterly monsoons and tidal currents, resulting in a relatively uniform Chl-a concentration phytoplankton in the water column. In summer, areas with high Chl-a concentrations were mainly within the northern and western sections, which exhibited a decreasing trend from north to south. Additionally, we simulated summer phytoplankton growth using influencing factors (i.e., temperature and rainfall), which resulted in significantly higher Chl-a concentrations and distinct spatial distribution patterns. Accordingly, we focused on investigating the spatiotemporal Chl-a concentration variations in the PRE during summer, accounting for the distinct characteristics and relevance to ecological processes and environmental management in the region.
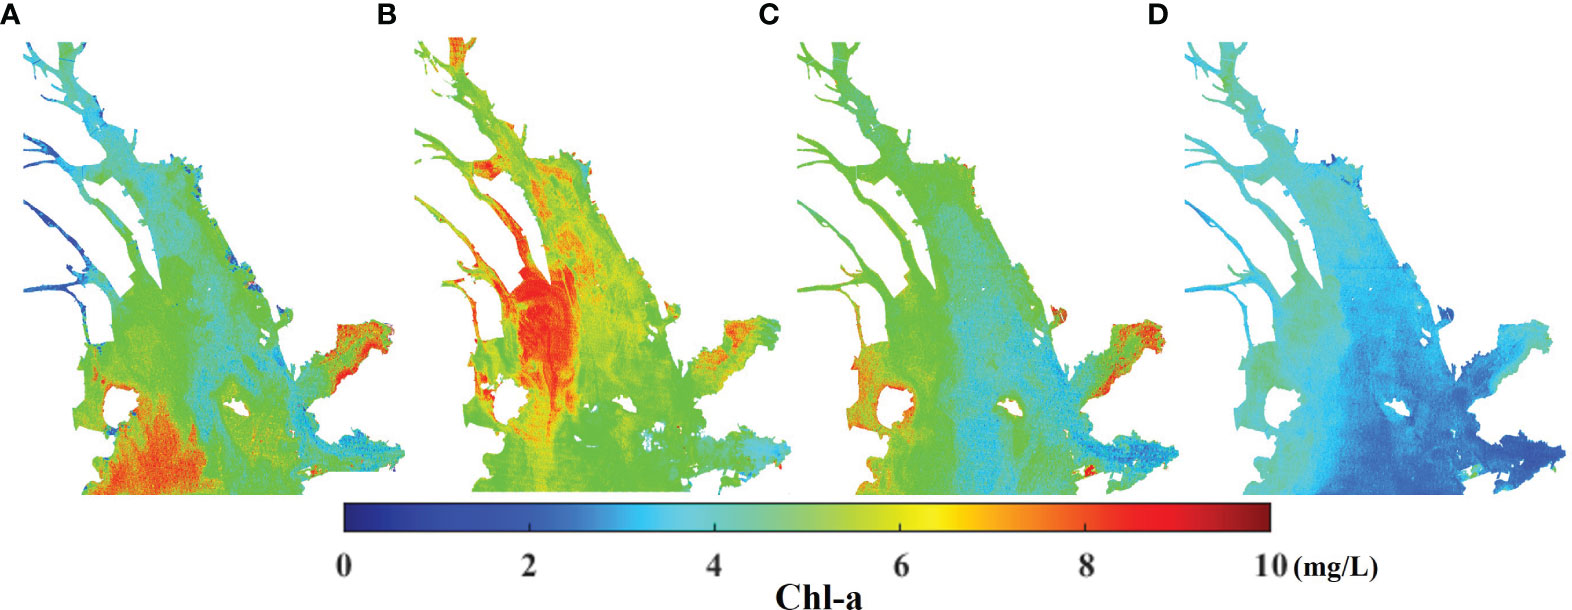
Figure 3 Distribution of Chl-a concentrations in 2010: (A) spring; (B) summer; (C) autumn; (D) winter.
Additionally, the eastern region had higher Chl-a concentrations during all four seasons, where areas with high concentrations were mainly distributed within the Shenzhen Bay area. This phenomenon is due to enclosed bays that typically have smaller openings or inlets, subsequently resulting in less water exchange compared to the surrounding open sea. This leads to nutrient accumulation via organic and inorganic substances within enclosed bay areas. These substances provide ample nutrients for phytoplankton growth. Moreover, they can contribute to an increase in phytoplankton growth within enclosed bays, resulting in higher Chl-a concentrations.
In this study, remotely sensed images taken in the summer of 1999, 2009, and 2019 were used to analyze interannual variations in spatial distribution characteristics of Chl-a concentrations in the PRE (Figure 4). The overall distribution of Chl-a concentrations in the PRE was uneven and exhibited significant spatial differences. Specifically, in the northern section, Chl-a concentrations in 1999, 2009, and 2019 were 6.48 mg/L, 5.92 mg/L, and 6.75 mg/L, respectively. In the western section, Chl-a concentrations were 5.95 mg/L, 9.48 mg/L, and 6.01 mg/L, respectively. In the eastern section, the Chl-a concentrations were 3.69 mg/L, 4.52 mg/L, and 3.88 mg/L, respectively. In the southern section, Chl-a concentrations were 4.96 mg/L, 6.38 mg/L, and 5.07 mg/L, respectively.
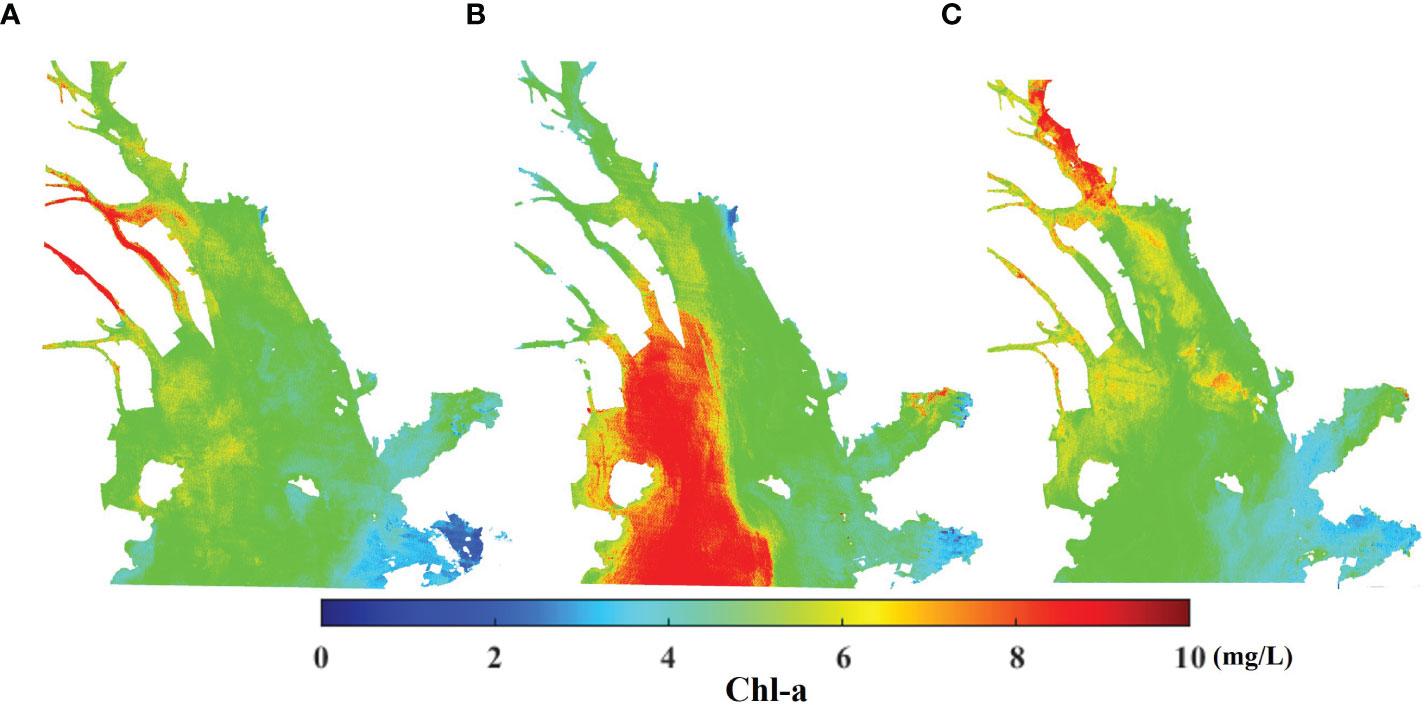
Figure 4 Distribution of mean Chl-a concentrations in summer: (A) 1999; (B) 2009; (C) 2019.
The northern and western sections had higher Chl-a concentrations, which were significantly higher compared to the other two sections. The Chl-a concentration diffusion pattern exhibited a spread from west to east and from north to south. Additionally, interannual variations in Chl-a concentrations differed among the four sections. The northern section exhibited relatively low Chl-a concentration fluctuations, with an approximate range of 0.7 mg/L. The western section exhibited greater fluctuation, where the average Chl-a concentration reached 9.48 mg/L in 2009, surpassing the other section by a large margin. The eastern and southern sections exhibited a similar magnitude of variation (i.e., approximately 1.5 mg/L). Such significant interannual differences can be explained by urbanization near the PRE, including industrial wastewater and domestic sewage. Factors such as water temperature, rainfall, and light conditions during different years can also have influenced phytoplankton growth and eutrophication over the past 30 years.
To obtain a better understanding of temporal water quality variation in the PRE, this study focused on changes in Chl-a concentrations between 1989–2019 (Figure 5). Between 1989–2019, Chl-a concentration on average exhibited significant fluctuations over time, exhibiting a slight overall decreasing trend. Over the past 30 years, the average Chl-a concentration was 5.20 mg/L. The Chl-a concentration decreased from 6.74 mg/L in 1989 to 5.56 mg/L in 2019. The highest value was measured in 1989 (i.e., 6.74 mg/L), while the lowest was measured in 2005 (i.e., 3.66 mg/L). In 2009, a sudden jump in Chl-a concentration occurred, increasing from 4.26 mg/L to 6.73 mg/L. In this study, long-term (i.e., 30 year) Chl-a concentrations variation was divided into three distinct periods. Between 1989–1999, Chl-a concentrations only exhibited small fluctuations (i.e., 5.96 mg/L average). However, compared to the other two periods, this period exhibited significantly higher Chl-a concentrations. Between 2000–2009, Chl-a concentrations exhibited higher fluctuations (i.e., 5.02 mg/L average). On the other hand, there was a notable upward trend between 2004–2009, indicating water quality degradation during this period. Between 2010–2019, the average Chl-a concentration was 4.80 mg/L, which was the lowest among the three periods and exhibited a clear downward trend, indicating a significant improvement in water quality during this period.
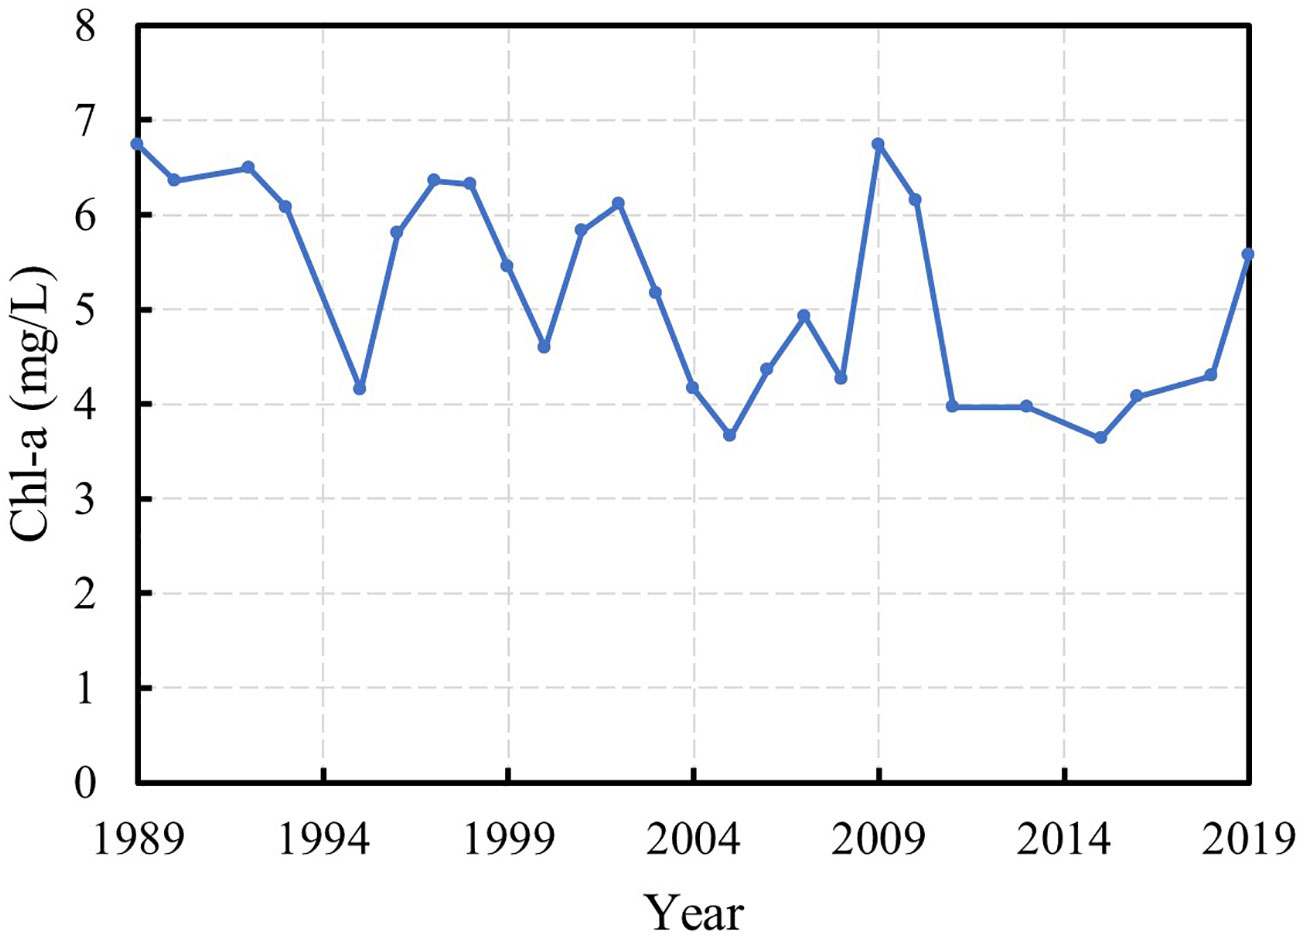
Figure 5 Changes of the mean Chl-a concentration in the PRE between 1989–2019.
In the different sections, Chl-a concentrations differed in spatial and temporal variation characteristics. This study divided the PRE into four sections to analyze each section’s specific Chl-a concentration over time (Figure 6). The western section had the highest Chl-a concentration (i.e., 5.92 mg/L average). Additionally, the Chl-a concentration in the western section fluctuated the most, reaching 9.48 mg/L in 2009, indicating a more stable water quality environment. The Chl-a concentration in the eastern section was the lowest (i.e., 3.98 mg/L average) while more stable than the other sections over the past 30 years. This indicated that the eastern section’s water quality environment was relatively good. This discrepancy was likely caused by the western section’s more intensive industrial activities than the eastern section, resulting in a higher overall wastewater discharge volume. The average Chl-a concentrations in the northern and southern sections were 5.51 mg/L and 4.98 mg/L, respectively. Additionally, changes to Chl-a concentrations in these two sections were similar, both exhibiting a significant downward trend, indicating that water quality conditions have generally improved over the past 30 years.

Figure 6 Seasonal Chl-a concentration changes in the PRE between 1989–2019.
Considering the geographical proximity of the four sections, several factors may have contributed to variations in Chl-a concentrations and the eutrophication phenomena. Natural factors can influence phytoplankton growth and eutrophication. Generally, high temperatures and rainfall can stimulate phytoplankton growth, resulting in higher concentrations. Conversely, lower water temperatures and rainfall limit phytoplankton growth. These factors can cause significant distribution variation in Chl-a concentrations during different seasons while also significantly impacting interannual variation. Agricultural and industrial activities, as well as densely populated urban areas near the PRE, can cause significant pollutant inputs into water, such as agricultural fertilizers, industrial wastewater, and domestic sewage. Over the past 30 years, the overall water quality of the PRE has improved. This improvement may be attributed to environmental protection policies that have led to a reduction of pollutants from entering its coastal areas, including industrial wastewater and domestic sewage discharge.
This study analyzed data from PRE monitoring stations over a 30-year period, using the average Chl-a concentration as the independent variable and water quality indicators as the dependent variable. Polynomial regression analysis and significance tests indicated a significant relationship between Chl-a and water quality (Figure 7). Additionally, TP and TN highly correlated with Chl-a concentrations. The R2 value for TP was >0.6, indicating a positive correlation with Chl-a concentrations (P< 0.05), whose correlation coefficient was 0.64. Similarly, Chl-a concentrations positively correlated with TN (P< 0.05), with a correlation coefficient of 0.71. Although TP and TN are important nutrients, they are often present in excessive amounts due to agricultural runoff and wastewater discharge. These nutrients can stimulate the growth of algae and aquatic plants, leading to increased Chl-a concentrations. Furthermore, Chl-a concentrations positively correlated with NH3-N (P< 0.05), with a correlation coefficient of 0.69. High levels of NH3-N can promote the growth of algae and aquatic plants, resulting in elevated Chl-a concentrations. Chl-a concentrations also positively correlated with BOD5 (P< 0.05), with a correlation coefficient of 0.54. High Chl-a concentrations in water is generally indicative of increased algal growth. More algae will consume more oxygen, resulting in decreased DO levels and elevated BOD5 in water. Therefore, a high Chl-a concentration is associated with elevated BOD5 levels in water.
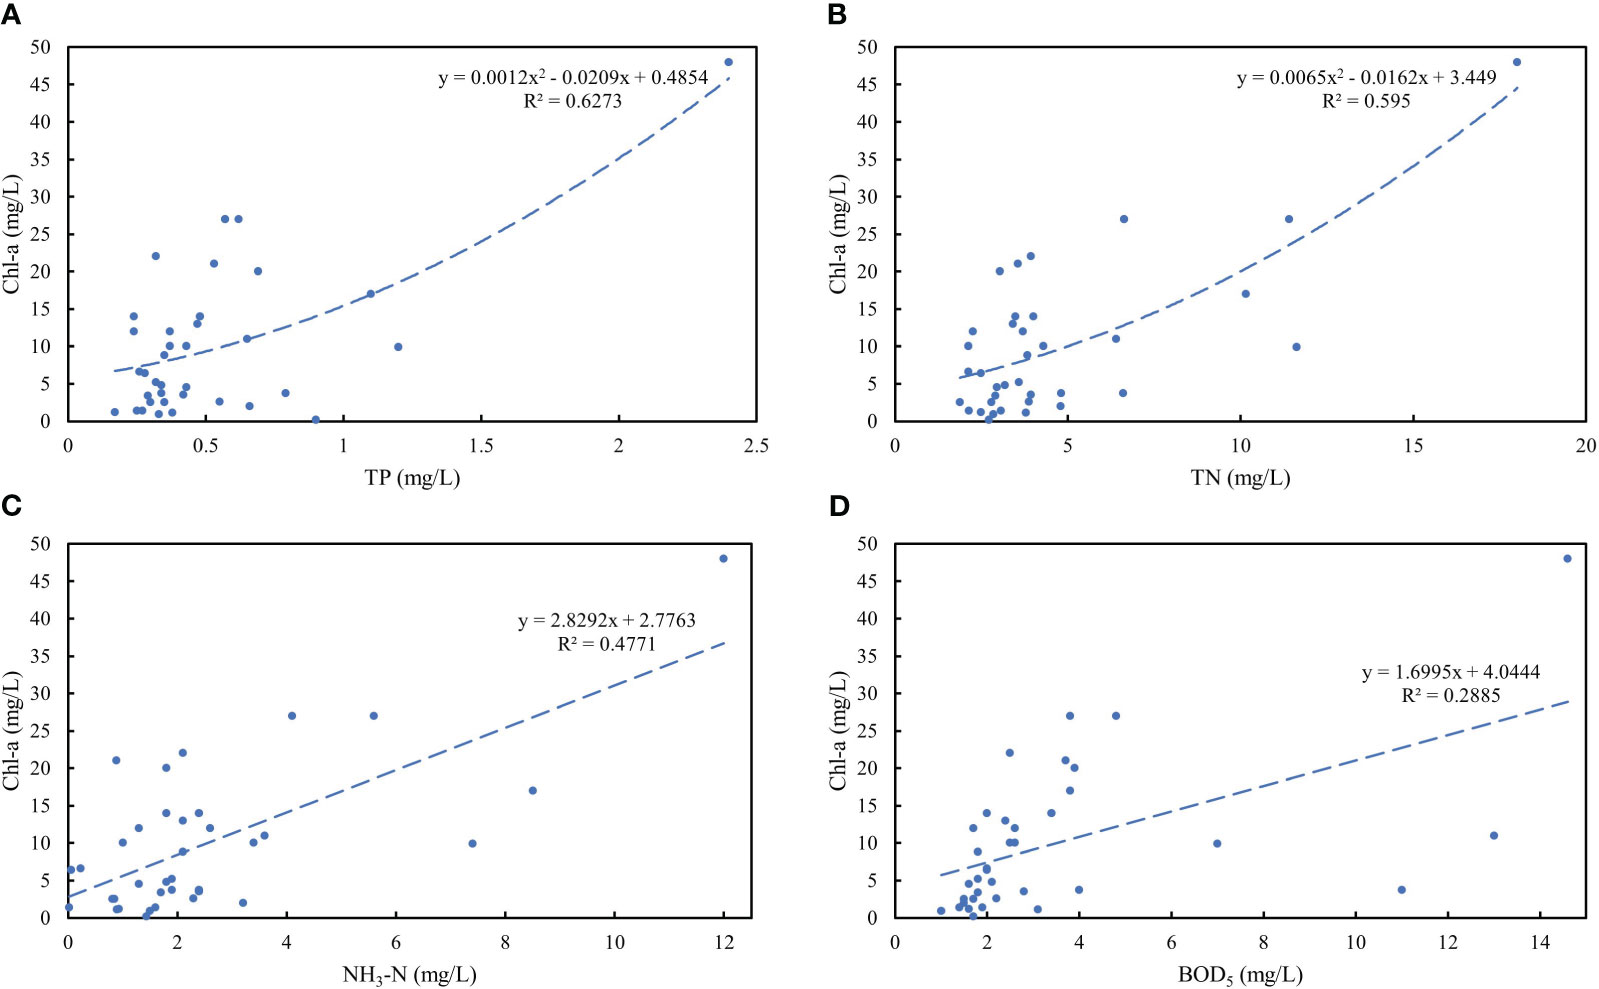
Figure 7 Relationship between Chl-a concentrations and water quality indicators: (A) TP; (B) TN; (C) NH3-N; (D) BOD5.
Suitable temperatures promote phytoplankton photosynthesis, resulting in increased phytoplankton biomass (Li et al., 2018). Between 1999–2008, Chl-a concentrations and temperatures in the northern section of the PRE significantly and positively correlated (P< 0.05), with a correlation coefficient of 0.51 (Figure 8A). Between 2009–2019, reduced rainfall in the vicinity of the PRE may have resulted in decreased nutrient absorption and a weakened water circulation, subsequently leading to an improvement in water quality. During this period, there was a significant positive correlation (P< 0.05) between Chl-a concentrations and rainfall in the northern section of the PRE, with a correlation coefficient of 0.43 (Figure 8B). Results from this study indicated that a reduction in rainfall would result in a decrease in nutrient flux into the PRE, subsequently enhancing its overall water quality. Additionally, Chl-a concentrations in the PRE exhibited a lag effect in response to climate factors (i.e., temperature and rainfall).
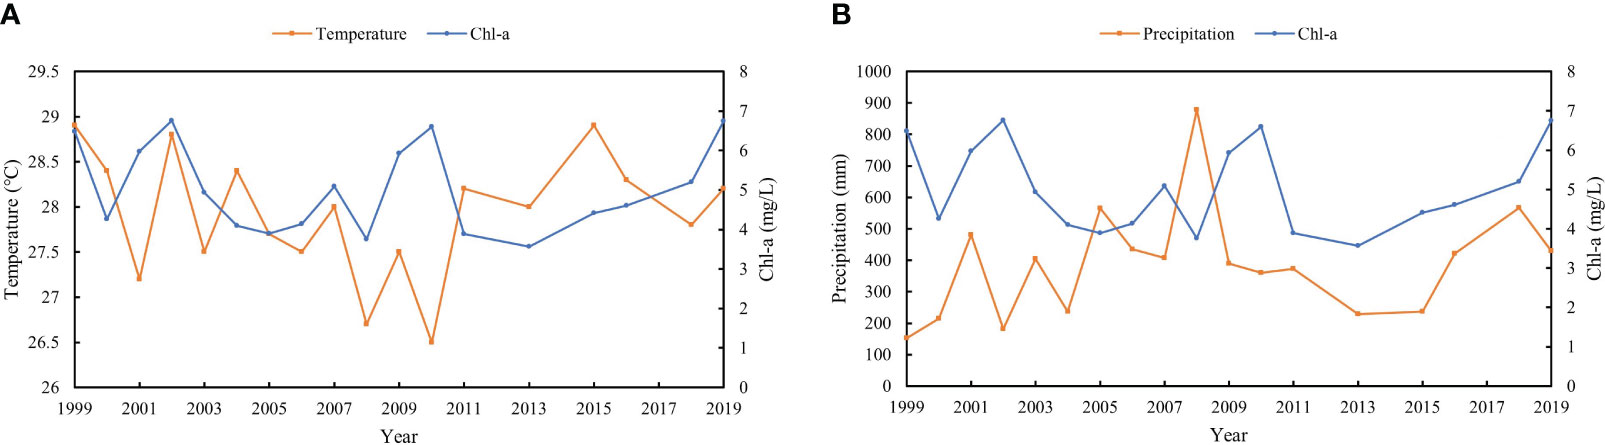
Figure 8 Correlation between Chl-a concentrations with (A) air temperature and (B) precipitation in the northern section of the PRE between 1999–2019.
Due to oceanic currents, the industrial wastewater discharged from urban areas accumulates in the PRE, leading to changes in water quality (Li et al., 2020). Between 1989–2004, a positive correlation (P< 0.05) was observed between Chl-a concentrations in the northern section of the PRE and the volume of industrial wastewater discharged from coastal cities, with a correlation coefficient of 0.53 (Figure 9A). Both variables showed a consistent downward trend on a sweeping scale, while industrial wastewater discharge had a lag effect on Chl-a concentrations. Non-point source pollution from agriculture is widely recognized as one of the main causes of water quality degradation (Evans et al., 2019). A higher proportion of primary industries results in a greater increase in agricultural land area and fertilizer usage in urban areas. Since the beginning of China’s economic reforms, the industrial structure of cities within the GBA has been optimized and adjusted, with a consecutive proportional decrease in primary industries. Between 1989–2019, there was a significant positive correlation (P< 0.05) between Chl-a concentrations in the northern section of the PRE and the proportion of primary industries in its coastal cities, with a correlation coefficient of 0.55 (Figure 9B). A general decrease in both variables was observed over the study period. Overall, the trend in PRE Chl-a concentrations is in decline, which may be attributed to a reduction in industrial wastewater discharge and a decrease in the proportion of primary industries in surrounding cities. In this study, PLS regression was constructed to assess how external driving factors influence Chl-a concentrations. The PLS factor weight and the loadings confirmed that all three PLS factors can effectively explain data variance while also demonstrating the good explanatory power of latent variables for observed variables. The contribution of the proportion of the primary industry factor within the three PLS factors was relatively high, indicating its important role in predicting Chl-a concentrations. From Table 1, it can be observed that temperature, rainfall, and the proportion of primary industries are commonly considered strong driving factors for changes in Chl-a concentrations (VIP > 1).
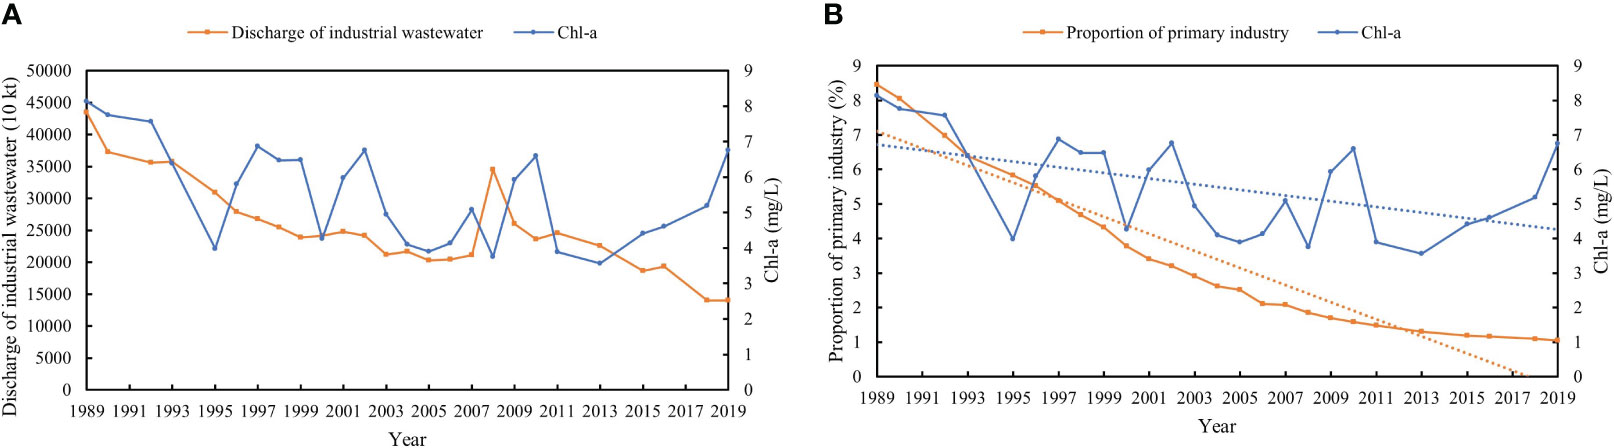
Figure 9 Correlation between Chl-a concentrations with (A) industrial wastewater discharge and (B) the proportion of primary industries in coastal cities of the PRE between 1989–2019.
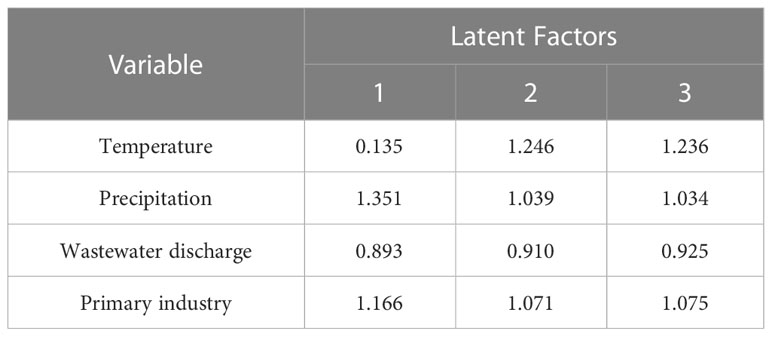
Table 1 Variable Importance in Projection (VIP). A higher VIP value indicates that the variable has greater importance.
Regular collection and analysis of water samples while monitoring key water quality indicators (i.e., NH3-N, TP, and Chl-a concentrations), are conducted. This aided in the establishment of a comprehensive water quality monitoring system, helped in the assessment of water quality conditions, and allowed for the prompt implementation of necessary management measures. Non-point source pollution from industrial and agricultural activities is one of the main causes for water quality degradation, so strengthening wastewater discharge management and improving the capacity and efficiency of wastewater treatment plants are critical. To address the poor water quality of the PRE’s northern and western sections, the Government should strengthen supervision and reduce pollutant emissions. Measures should also be taken to reduce pollution, such as ecological restoration and wetland construction, subsequently enhancing its water purification capacities. Water quality is closely linked to factors such as temperature, rainfall, and other environmental conditions. Attention should also be paid to climate change impacts within the PRE region, while adaptive measures should be taken to address extreme weather events.
Because of its subtropical monsoon climate, the PRE region experiences a high frequency of cloud cover, and data gaps resulting from such frequent cloud cover events and the limited available samples present significant challenges for satellite monitoring. However, amassing field data and using other satellites (i.e., MODIS and Sentinel) to fill satellite-based data gaps may help to resolve this issue. Additionally, the PRE is an optically complex water system, and the potential to overestimate Chl-a concentrations under conditions of water turbidity should not be ignored. Therefore, it may not be appropriate to solely rely on band ratio algorithms to estimate Chl-a concentrations in PRE water. It is necessary to consider other factors, such as seasonality and water characteristics, while establishing more complex retrieval models to analyze water quality changes in the PRE.
In this study, spatial and temporal Chl-a concentration variation was analyzed, showing distinct patterns across seasons and interannual fluctuations. Results showed a slight decreasing trend in PRE Chl-a concentrations over the study period. Compared to the other seasons, Chl-a concentrations were significantly higher in summer. The western section of the PRE consistently had higher Chl-a concentrations while the eastern section had lower concentrations. Correlation analysis between Chl-a concentrations and water quality indicators significantly correlated. Furthermore, external driving factors (i.e., climate and anthropogenic activities) influenced Chl-a concentration variation. Industrial wastewater discharge and the proportion of primary industries in coastal cities affected water quality, and results revealed a significant positive correlation. Findings from this study are intended to contribute to our understanding of Chl-a concentration dynamics in the PRE.
The original contributions presented in the study are included in the article/supplementary material. Further inquiries can be directed to the corresponding author.
WF and ZX designed the research and drafted the manuscript. WF and QD collected and processed the data. WF and WC analyzed the data. YC reviewed the manuscript. All authors contributed to the article and approved the submitted version.
This study was financially supported by the Key Program of National Natural Science Foundation of China (No. 52239005), the Program for Guangdong Introducing Innovative and Entrepreneurial Teams (No. 2019ZT08L213), and the General Program of National Natural Science Foundation of China (No. 52279059).
The authors would like to acknowledge the support provided by the National Natural Science Foundation of China and the Program for Guangdong Introducing Innovative and Entrepreneurial Teams.
The authors declare that the research was conducted in the absence of any commercial or financial relationships that could be construed as a potential conflict of interest.
All claims expressed in this article are solely those of the authors and do not necessarily represent those of their affiliated organizations, or those of the publisher, the editors and the reviewers. Any product that may be evaluated in this article, or claim that may be made by its manufacturer, is not guaranteed or endorsed by the publisher.
Beck R., Zhan S., Liu H., Tong S., Yang B., Xu M., et al. (2016). Comparison of satellite reflectance algorithms for estimating chlorophyll-a in a temperate reservoir using coincident hyperspectral aircraft imagery and dense coincident surface observations. Remote Sens. Environ. 178, 15–30. doi: 10.1016/j.rse.2016.03.002
Burford M. A., Faggotter S. J. (2021). Comparing the importance of freshwater flows driving primary production in three tropical estuaries. Mar. pollut. Bull. 169, 112565. doi: 10.1016/j.marpolbul.2021.112565
Cao B., Qiu J., Zhang W., Xie X., Lu X., Yang X., et al. (2022). Retrieval of suspended sediment concentrations in the pearl river estuary using multi-source satellite imagery. Remote Sens. 14 (16), 3896. doi: 10.3390/rs14163896
Cao C., Zhu K., Cai F., Qi H., Liu J., Lei G., et al. (2022). Vulnerability evolution of coastal erosion in the Pearl River estuary Great Bay area due to the influence of human activities in the past forty years. Front. Mar. Sci. 9. doi: 10.3389/fmars.2022.847655
Chawla I., Karthikeyan L., Mishra A. K. (2020). A review of remote sensing applications for water security: Quantity, quality, and extremes. J. Hydrol. 585, 124826. doi: 10.1016/j.jhydrol.2020.124826
Chen S., Fang L., Li H., Chen W., Huang W. (2011). Evaluation of a three-band model for estimating chlorophyll-a concentration in tidal reaches of the Pearl River Estuary, China. ISPRS J. Photogrammet. Remote Sens. 66 (3), 356–364. doi: 10.1016/j.isprsjprs.2011.01.004
Chen X., Lee R. M., Dwivedi D., Son K., Fang Y., Zhang X., et al. (2021). Integrating field observations and process-based modeling to predict watershed water quality under environmental perturbations. J. Hydrol. 602, 125762. doi: 10.1016/j.jhydrol.2020.125762
Chen Z., Li Y., Pan J. (2004). Distributions of colored dissolved organic matter and dissolved organic carbon in the Pearl River Estuary, China. Continental Shelf Res. 24 (16), 1845–1856. doi: 10.1016/j.csr.2004.06.011
Conley D. J., Paerl H. W., Howarth R. W., Boesch D. F., Seitzinger S. P., Havens K. E., et al. (2009). Controlling eutrophication: nitrogen and phosphorus. Science 323 (5917), 1014–1015. doi: 10.1126/science.1167755
D’Ortenzio F., Marullo S., Ragni M., d'Alcalà M. R., Santoleri R. (2002). Validation of empirical SeaWiFS algorithms for chlorophyll-a retrieval in the Mediterranean Sea: A case study for oligotrophic seas. Remote Sens. Environ. 82 (1), 79–94. doi: 10.1016/S0034-4257(02)00026-3
Ding J., Jiang Y., Fu L., Liu Q., Peng Q., Kang M. (2015). Impacts of land use on surface water quality in a subtropical River Basin: a case study of the Dongjiang River Basin, Southeastern China. Water 7 (8), 4427–4445. doi: 10.3390/w7084427
Durack P. J. (2015). Ocean salinity and the global water cycle. Oceanography 28 (1), 20–31. doi: 10.5670/oceanog.2015.03
Evans A. E., Mateo-Sagasta J., Qadir M., Boelee E., Ippolito A. (2019). Agricultural water pollution: key knowledge gaps and research needs. Curr. Opin. Environ. sustainability 36, 20–27. doi: 10.1016/j.cosust.2018.10.003
Gao N., Ma Y., Zhao M., Zhang L., Zhan H., Cai S., et al. (2020). Quantile analysis of long-term trends of near-surface chlorophyll-a in the Pearl River plume. Water 12 (6), 1662. doi: 10.3390/w12061662
Gholizadeh M. H., Melesse A. M., Reddi L. (2016). A comprehensive review on water quality parameters estimation using remote sensing techniques. Sensors 16 (8), 1298. doi: 10.3390/s16081298
Gilerson A. A., Gitelson A. A., Zhou J., Gurlin D., Moses W., Ioannou I., et al. (2010). Algorithms for remote estimation of chlorophyll-a in coastal and inland waters using red and near infrared bands. Optics Express 18 (23), 24109–24125. doi: 10.1364/OE.18.024109
Guo Y., Deng R., Li J., Hua Z., Wang J., Zhang R., et al. (2022). Remote sensing retrieval of total nitrogen in the pearl river delta based on landsat8. Water 14 (22), 3710. doi: 10.3390/w14223710
Guo L., Xiu P., Chai F., Xue H., Wang D., Sun J. (2017). Enhanced chlorophyll concentrations induced by Kuroshio intrusion fronts in the northern South China Sea. Geophys. Res. Lett. 44 (22), 11–565. doi: 10.1002/2017GL075336
Huang X. P., Huang L. M., Yue W. Z. (2003). The characteristics of nutrients and eutrophication in the Pearl River estuary, South China. Mar. pollut. Bull. 47 (1-6), 30–36. doi: 10.1016/S0025-326X(02)00474-5
Ioannou I., Gilerson A., Gross B., Moshary F., Ahmed S. (2013). Deriving ocean color products using neural networks. Remote Sens. Environ. 134, 78–91. doi: 10.1016/j.rse.2013.02.015
Jay S., Maupas F., Bendoula R., Gorretta N. (2017). Retrieving LAI, chlorophyll and nitrogen contents in sugar beet crops from multi-angular optical remote sensing: Comparison of vegetation indices and PROSAIL inversion for field phenotyping. Field Crops Res. 210, 33–46. doi: 10.1016/j.fcr.2017.05.005
Jeffries T. C., Schmitz Fontes M. L., Harrison D. P., Van-Dongen-Vogels V., Eyre B. D., Ralph P. J., et al. (2016). Bacterioplankton dynamics within a large anthropogenically impacted urban estuary. Front. Microbiol. 6. doi: 10.3389/fmicb.2015.01438
Jiang Z., Liu J., Chen J., Chen Q., Yan X., Xuan J., et al. (2014). Responses of summer phytoplankton community to drastic environmental changes in the Changjiang (Yangtze River) estuary during the past 50 years. Water Res. 54, 1–11. doi: 10.1016/j.watres.2014.01.032
Kim Y. H., Son S., Kim H. C., Kim B., Park Y. G., Nam J., et al. (2020). Application of satellite remote sensing in monitoring dissolved oxygen variabilities: A case study for coastal waters in Korea. Environ. Int. 134, 105301. doi: 10.1016/j.envint.2019.105301
Lao Q., Liu S., Ling Z., Jin G., Chen F., Chen C., et al. (2023). External dynamic mechanisms controlling the periodic offshore blooms in Beibu Gulf. J. Geophys. Res.: Oceans. 128(6), e2023JC019689. doi: 10.1029/2023JC019689
Lao Q., Zhang S., Li Z., Chen F., Zhou X., Jin G., et al. (2022). Quantification of the seasonal intrusion of water masses and their impact on nutrients in the Beibu Gulf using dual water isotopes. J. Geophys. Res.: Oceans 127 (7), e2021JC018065. doi: 10.1029/2021JC018065
Li D., Gan J., Hui R., Liu Z., Yu L., Lu Z., et al. (2020). Vortex and biogeochemical dynamics for the hypoxia formation within the coastal transition zone off the Pearl River Estuary. J. Geophys. Res.: Oceans 125 (8), e2020JC016178. doi: 10.1029/2020JC016178
Li Y., Wang H., Deng Y., Liang D., Li Y., Shen Z. (2022). How climate change and land-use evolution relates to the non-point source pollution in a typical watershed of China. Sci. Total Environ. 839, 156375. doi: 10.1016/j.scitotenv.2022.156375
Li Y., Zhang Y., Shi K., Zhou Y., Zhang Y., Liu X., et al. (2018). Spatiotemporal dynamics of chlorophyll-a in a large reservoir as derived from Landsat 8 OLI data: understanding its driving and restrictive factors. Environ. Sci. pollut. Res. 25, 1359–1374. doi: 10.1007/s11356-017-0536-7
Liang B., Xiu P., Hu J., Li S. (2021). Seasonal and spatial controls on the eutrophication-induced acidification in the Pearl River Estuary. J. Geophys. Res.: Oceans 126 (5), e2020JC017107. doi: 10.1029/2020JC017107
Liu S., Fu R., Liu Y., Suo C. (2022). Spatiotemporal variations of water quality and their driving forces in the Yangtze River Basin, China, from 2008 to 2020 based on multi-statistical analyses. Environ. Sci. pollut. Res. 29 (46), 69388–69401. doi: 10.1007/s11356-022-20667-3
Liu D., Fu D., Xu B., Shen C. (2012). Estimation of total suspended matter in the Zhujiang (Pearl) River estuary from Hyperion imagery. Chin. J. Oceanol. Limnol. 30 (1), 16–21. doi: 10.1007/s00343-012-0148-5
Liu D., Pan D., Bai Y., He X., Wang D., Wei J. A., et al. (2015). Remote sensing observation of particulate organic carbon in the Pearl River Estuary. Remote Sens. 7 (7), 8683–8704. doi: 10.3390/rs70708683
Liu F., Tang S. (2019). Evaluation of red-peak algorithms for chlorophyll measurement in the Pearl River Estuary. IEEE Trans. Geosci. Remote Sens. 57 (11), 8928–8936. doi: 10.1109/TGRS.2019.2923754
Lu S., Deng R., Liang Y., Xiong L., Ai X., Qin Y. (2020). Remote sensing retrieval of total phosphorus in the pearl river channels based on the GF-1 remote sensing data. Remote Sens. 12 (9), 1420. doi: 10.3390/rs12091420
Lu Z., Gan J. (2015). Controls of seasonal variability of phytoplankton blooms in the Pearl River Estuary. Deep Sea Res. Part II: Topical Stud. Oceanog. 117, 86–96. doi: 10.1016/j.dsr2.2013.12.011
Ma C., Zhao J., Ai B., Sun S., Yang Z. (2022). Machine learning based long-term water quality in the turbid pearl river estuary, China. J. Geophys. Res.: Oceans 127 (1), e2021JC018017. doi: 10.1029/2021JC018017
Montefiore L. R., Nelson N. G., Staudinger M. D., Terando A. (2023). Vulnerability of estuarine systems in the contiguous United States to water quality change under future climate and land-use. Earth's Future 11 (3), e2022EF002884. doi: 10.1029/2022EF002884
Moradi M., Kabiri K. (2015). Spatio-temporal variability of SST and Chlorophyll-a from MODIS data in the Persian Gulf. Mar. pollut. Bull. 98 (1-2), 14–25. doi: 10.1016/j.marpolbul.2015.07.018
Mutanga O., Kumar L. (2019). Google earth engine applications. Remote Sens. 11 (5), 591. doi: 10.3390/rs11050591
O’Reilly J. E., Maritorena S., Mitchell B. G., Siegel D. A., Carder K. L., Garver S. A., et al. (1998). Ocean color chlorophyll algorithms for SeaWiFS. J. Geophys. Res.: Oceans 103 (C11), 24937–24953. doi: 10.1029/98JC02160
O'Reilly J. E., Werdell P. J. (2019). Chlorophyll algorithms for ocean color sensors-OC4, OC5 & OC6. Remote Sens. Environ. 229, 32–47. doi: 10.1016/j.rse.2019.04.021
Paerl H. W., Huisman J. (2009). Climate change: a catalyst for global expansion of harmful cyanobacterial blooms. Environ. Microbiol. Rep. 1 (1), 27–37. doi: 10.1111/j.1758-2229.2008.00004.x
Pan Y., Tang D., Weng D. (2010). Evaluation of the SeaWiFS and MODIS chlorophyll a algorithms used for the Northern South China Sea during the summer season. TAO: Terrestrial Atmospheric Oceanic Sci. 21 (6), 9. doi: 10.3319/TAO.2010.02.11.01(Oc
Qiu D., Huang L., Zhang J., Lin S. (2010). Phytoplankton dynamics in and near the highly eutrophic Pearl River Estuary, South China Sea. Continental Shelf Res. 30 (2), 177–186. doi: 10.1016/j.csr.2009.10.015
Ross M. R., Topp S. N., Appling A. P., Yang X., Kuhn C., Butman D., et al. (2019). AquaSat: A data set to enable remote sensing of water quality for inland waters. Water Resour. Res. 55 (11), 10012–10025. doi: 10.1029/2019WR024883
Scanes E., Scanes P. R., Ross P. M. (2020). Climate change rapidly warms and acidifies Australian estuaries. Nat. Commun. 11 (1), 1803. doi: 10.1038/s41467-020-15550-z
Shen Y., Zhang H., Tang J. (2022). Hydrodynamics and water quality impacts of large-scale reclamation projects in the Pearl River Estuary. Ocean Eng. 257, 111432. doi: 10.1016/j.oceaneng.2022.111432
Shrestha S., Bhatta B., Shrestha M., Shrestha P. K. (2018). Integrated assessment of the climate and landuse change impact on hydrology and water quality in the Songkhram River Basin, Thailand. Sci. Total Environ. 643, 1610–1622. doi: 10.1016/j.scitotenv.2018.06.306
Sigman D. M., Hain M. P. (2012). The biological productivity of the ocean. Nat. Educ. Knowledge 3 (10), 21. Available at: https://www.nature.com/scitable/knowledge/
Tao W., Niu L., Dong Y., Fu T., Lou Q. (2021). Nutrient pollution and its dynamic source-sink pattern in the pearl river estuary (South China). Front. Mar. Sci. 8. doi: 10.3389/fmars.2021.713907
Tao W., Niu L., Liu F., Cai H., Ou S., Zeng D., et al. (2020). Influence of river-tide dynamics on phytoplankton variability and their ecological implications in two Chinese tropical estuaries. Ecol. Indic. 115, 106458. doi: 10.1016/j.ecolind.2020.106458
Testa J. M., Murphy R. R., Brady D. C., Kemp W. M. (2018). Nutrient-and climate-induced shifts in the phenology of linked biogeochemical cycles in a temperate estuary. Front. Mar. Sci. 5. doi: 10.3389/fmars.2018.00114
Tong Y., Feng L., Zhao D., Xu W., Zheng C. (2022). Remote sensing of chlorophyll-a concentrations in coastal oceans of the Greater Bay Area in China: Algorithm development and long-term changes. Int. J. Appl. Earth Observat. Geoinformat. 112, 102922. doi: 10.1016/j.jag.2022.102922
Wang C., Li W., Chen S., Li D., Wang D., Liu J. (2018). The spatial and temporal variation of total suspended solid concentration in Pearl River Estuary during 1987–2015 based on remote sensing. Sci. Total Environ. 618, 1125–1138. doi: 10.1016/j.scitotenv.2017.09.196
Wang M. X., Liang L. N., Siu W. S., Fan D., Sun H. R., Zhao H. H., et al. (2019). Loss accounting of environmental pollution within Pearl River Delta region, South China. Environ. pollut. 249, 676–685. doi: 10.1016/j.envpol.2019.03.081
Wang B., Xin M., Wei Q., Xie L. (2018). A historical overview of coastal eutrophication in the China Seas. Mar. pollut. Bull. 136, 394–400. doi: 10.1016/j.marpolbul.2018.09.044
Wang J., Zhang Y., Yang F., Cao X., Bai Z., Zhu J., et al. (2015). Spatial and temporal variations of chlorophyll-a concentration from 2009 to 2012 in Poyang Lake, China. Environ. Earth Sci. 73, 4063–4075. doi: 10.1007/s12665-014-3691-x
Wu C. S., Yang S., Huang S., Mu J. (2016). Delta changes in the Pearl River estuary and its response to human activities, (1954–2008). Quaternary Int. 392, 147–154. doi: 10.1016/j.quaint.2015.04.009
Wurtsbaugh W. A., Paerl H. W., Dodds W. K. (2019). Nutrients, eutrophication and harmful algal blooms along the freshwater to marine continuum. Wiley Interdiscip. Reviews: Water 6 (5), e1373. doi: 10.1002/wat2.1373
Xu S., Liu Y., Fan J., Xiao Y., Qi Z., Lakshmikandan M. (2022). Impact of salinity variation and silicate distribution on phytoplankton community composition in Pearl River estuary, China. Ecohydrol. Hydrobiol. 22 (3), 466–475. doi: 10.1016/j.ecohyd.2022.01.004
Ye F., Guo W., Shi Z., Jia G., Wei G. (2017). Seasonal dynamics of particulate organic matter and its response to flooding in the P earl River Estuary, China, revealed by stable isotope (δ13 C and δ15 N) analyses. J. Geophys. Res.: Oceans 122 (8), 6835–6856. doi: 10.1002/2017JC012931
Ye F., Jia G., Xie L., Wei G., Xu J. (2016). Isotope constraints on seasonal dynamics of dissolved and particulate N in the P earl R iver E stuary, south China. J. Geophys. Res.: Oceans 121 (12), 8689–8705. doi: 10.1002/2016JC012066
Ye H., Tang S., Yang C. (2021). Deep learning for Chlorophyll-a concentration retrieval: A case study for the Pearl River Estuary. Remote Sens. 13 (18), 3717. doi: 10.3390/rs13183717
Yuan X., Wang S., Fan F., Dong Y., Li Y., Lin W., et al. (2022). Spatiotemporal dynamics and anthropologically dominated drivers of chlorophyll-a, TN and TP concentrations in the Pearl River Estuary based on retrieval algorithm and random forest regression. Environ. Res. 215, 114380. doi: 10.1016/j.envres.2022.114380
Zhang G., Cheng W., Chen L., Zhang H., Gong W. (2019). Transport of riverine sediment from different outlets in the Pearl River Estuary during the wet season. Mar. Geol. 415, 105957. doi: 10.1016/j.margeo.2019.06.002
Zhang X., Shi Z., Liu Q., Ye F., Tian L., Huang X. (2013). Spatial and temporal variations of picoplankton in three contrasting periods in the Pearl River Estuary, South China. Continental Shelf Res. 56, 1–12. doi: 10.1016/j.csr.2013.01.015
Zheng G., DiGiacomo P. M. (2017). Remote sensing of chlorophyll-a in coastal waters based on the light absorption coefficient of phytoplankton. Remote Sens. Environ. 201, 331–341. doi: 10.1016/j.rse.2017.09.008
Keywords: estuary water quality, remote sensing, retrieval algorithm, chlorophyll-a concentration, spatiotemporal dynamics, driving factor
Citation: Fan W, Xu Z, Dong Q, Chen W and Cai Y (2023) Remote sensing-based spatiotemporal variation and driving factor assessment of chlorophyll-a concentrations in China’s Pearl River Estuary. Front. Mar. Sci. 10:1226234. doi: 10.3389/fmars.2023.1226234
Received: 21 May 2023; Accepted: 24 July 2023;
Published: 10 August 2023.
Edited by:
Tian Xie, Beijing Normal University, ChinaReviewed by:
Jingwen Zhang, University of Illinois at Urbana-Champaign, United StatesCopyright © 2023 Fan, Xu, Dong, Chen and Cai. This is an open-access article distributed under the terms of the Creative Commons Attribution License (CC BY). The use, distribution or reproduction in other forums is permitted, provided the original author(s) and the copyright owner(s) are credited and that the original publication in this journal is cited, in accordance with accepted academic practice. No use, distribution or reproduction is permitted which does not comply with these terms.
*Correspondence: Zhihao Xu, emhpaGFveHVAZ2R1dC5lZHUuY24=
Disclaimer: All claims expressed in this article are solely those of the authors and do not necessarily represent those of their affiliated organizations, or those of the publisher, the editors and the reviewers. Any product that may be evaluated in this article or claim that may be made by its manufacturer is not guaranteed or endorsed by the publisher.
Research integrity at Frontiers
Learn more about the work of our research integrity team to safeguard the quality of each article we publish.