 Brecht Stechele1*
 Leo Barbut2
 Geneviève Lacroix2Luca A. van Duren3
 Vera Van Lancker2
 Steven Degraer2
 Giacomo Montereale Gavazzi2
 Peter Bossier1Annelies M. Declercq1
 Nancy Nevejan1
- 1Department of Animal Sciences and Aquatic Ecology, Ghent University, Gent, Belgium
- 2Operational Directorate Natural Environment, Royal Belgian Institute of Natural Sciences, Brussel, Belgium
- 3Deltares, Delft, Netherlands
Introduction: European and member state legislation encourage the sustainable development of offshore environments, with the restoration or creation of flat oyster (Ostrea edulis) habitats offering potential solutions to enhance biodiversity and provide ecosystem services. The site selection and identification of suitable habitats for flat oyster habitat restoration projects remains a significant knowledge gap.
Methods: By combining seabed substrate information with a coupled population (Dynamic Energy Budget - Individual-Based Models) and particle tracking model (for larvae dispersal), critical insights can be gained into the spatial distribution of suitability indicators such as population growth, fitness, reproduction, and self-recruitment. By applying this model to the English Channel and the North Sea over a ten-year period, suitable locations for flat oyster habitat restoration, restorative aquaculture, or oyster-related nature-inclusive designs can be identified. Comparing historical oyster bed locations with model outputs offers insights into why these locations were suitable for oyster bed development and allows for validation of the proposed approach.
Results and discussion: Coastal and nearshore environments are generally more suitable for flat oyster habitat restoration, and populations will grow more quickly in these areas. Offshore restoration in the North Sea presents challenges if it relies solely on self-recruitment. Besides site selection purposes, the model can be used to evaluate the effect of management strategies (e.g., initial population size) or environmental pressures (e.g., climate change, pollution) on restorations success.
1 Introduction
European (EU) frameworks, such as the Marine Strategy Framework Directive, the EU Green Deal, the EU Biodiversity Strategy 2030 and the upcoming Nature Restoration Law, mandate EU member states to protect and restore marine biodiversity, habitats and ecosystems. Additionally, nature restoration and protection are becoming key prerequisites for tenders in the offshore energy and marine infrastructure sector, thereby commercially incentivizing nature restoration and creation.
Oyster beds and reefs provide essential ecosystem functions within coastal and offshore ecosystems around the world, providing structural complexity leading to numerous ecosystem services, as well as contributing to coastal economies for centuries (Beck et al., 2011). In Europe, flat oysters (Ostrea edulis) have been identified as a priority species for protection and habitat restoration (Haelters and Kerckhof, 2009) due to their potential to engineer habitats (Todorova et al., 2009; Kregting et al., 2020), and promote biodiversity (Christianen et al., 2018; Lown et al., 2021; Hemraj et al., 2022). As such, they are the focus of several flat oyster nature-based solution projects, restorative flat oyster aquaculture projects (Bertolini and Pastres, 2022; H2020 UNITED, Horizon ULTFARMS) and a multitude of habitat creation or restoration projects in many European countries. (https://noraeurope.eu).
Upscaling of oyster bed restoration efforts has been difficult and large-scale projects have only been on-going in the USA (Schulte et al., 2009), Australia (Gillies et al., 2015), and Europe (Pogoda et al., 2020). These are mainly situated inshore, in coastal or protected areas, although Europe’s largest beds were historically located offshore (Houziaux et al., 2008; Bennema et al., 2020). Implementation of offshore oyster habitat restoration is limited due to high operational costs and logistical and legal issues, such as access to restricted areas (e.g., wind farms). Almost all locations where historical beds were present, including most European MPAs with a designated Natura 2000 habitat directive status, are regularly impacted by bottom trawling and hence unsuitable for oyster restoration efforts. However, offshore renewable energy projects have successfully excluded bottom disturbing activities from the concession zones to protect their underwater infrastructure. Consequently, offshore wind farms have received a status as quasi-marine protected areas (Hammar et al., 2015) and are considered suitable areas for large scale offshore nature restoration projects including flat oyster bed restoration (Kamermans et al., 2018). Nevertheless, how to evaluate the suitability of the offshore environment for flat oyster bed restoration remains a key knowledge gap (zu Ermgassen et al., 2020).
To this end, the Native Oyster Restoration Alliance (NORA) established the Site Selection Working Group to support flat oyster restoration projects. In response to questionnaires, the NORA Site Selection Checklist (Hughes and zu Ermgassen, 2021; Hughes et al., 2023) was produced and aggregated factors relevant for flat oyster site suitability studies into essential and desirable categories, each of which was further divided into five thematic categories including (1) threats to habitat restoration, (2) project logistics, (3) socioeconomic factors, (4) biotic factors and (5) abiotic factors. While most factors can be addressed through management strategies, biotic and abiotic factors constitute fundamental requirements that are, in most cases, impossible to alter. Consequently, understanding these biotic and abiotic factors serves as a prerequisite for the development of niche models that can be utilized in site selection for these restoration projects.
The spatial allocation of oyster habitat restoration projects is commonly achieved through assignment of restoration efforts in the vicinity of local beds, or organization of restoration efforts on sites where beds historically existed. However, historical absence-presence data, such as the Olsen fisheries map (Olsen, 1883) are often inaccurate for offshore habitats (Bennema et al., 2020), and the environment has changed significantly over the last hundreds of years (Bindoff et al., 2019). Furthermore, historical beds often do not coincide with areas designated as Marine Protected Areas (MPAs) or locations for offshore wind which provide adequate protection from human disturbances. When envisioning oyster habitat creation instead of habitat restoration, one cannot solely rely on historical absence presence data, but should include ecological knowledge in the site selection process.
A fundamental niche model (species-environment interactions) for the European flat oyster has been developed by Stechele et al. (2022) and is defined as a set of sediment type, temperature, salinity, and food availability. Fundamental niche models for individuals can evaluate if the environment supports the individual’s life cycle (Kearney et al., 2010; Hale et al., 2019) including settlement, survival, growth, and reproduction (Glover et al., 2021; Stechele et al., 2022; Stechele et al., 2023). Other environmental factors such as oxygen, turbidity, current speed, or wave action also define the fundamental niche but the impact of these variables on the metabolism of flat oysters is insufficiently understood. However, it is likely that several of these factors are key in determining where oysters can proliferate and where not.
When performing site selection for restoration, one should understand the suitability of a location for flat oyster populations, more than only for flat oyster. By integrating self-recruitment data to population models, it becomes clear at which locations populations will thrive and where restoration efforts are can become self-supportive.
This work establishes a realistic niche model (which include species-environment interactions and in addition, inter and intra species interactions) for flat oyster habitat restoration and applies the model to the English Channel and the North Sea to indicate suitable areas for offshore flat oyster habitat restoration.
2 Methods
2.1 Geographical scale and environmental data layers
The research domain encloses the North Sea and the English Channel 48.5° N to 57° N (resolution 0.0417° N) and -4° E to 9° E (resolution 0.0833° E). The area encompasses some important historical offshore flat oyster beds and restoration projects, and partly corresponds to the geographical range of the North Atlantic offshore oyster populations (Launey et al., 2002). Environmental drivers (chlorophyll a, temperature, salinity) were extracted from Copernicus Marine Service (European Union-Copernicus Marine Service, 2020a; European Union-Copernicus Marine Service, 2020b) for the geographical range of interest with a daily time step. Depth profiles of the environmental drivers were converted to bottom values by extraction of the deepest numerical value. Products were daily 25-hour, de-tided, averages from 1/1/2000 to 31/12/2009. The horizontal and vertical resolution of the products (0.111° × 0.067°) were interpolated to the resolution of the research domain used in this study using a nearest-neighbour interpolation algorithm. The Copernicus Marine Environment Monitoring Service (CMEMS) products do not cover inshore or estuarine locations and therefore this study is only applicable to nearshore (0 – 20 km from the shore) and offshore (>20 km from the shore) locations. European Marine Observation and Data Network (EMODnet) multiscale substrate maps (combination of 250k and higher resolutions, where available) (EMODnet Geology, 2023) were extracted. Folk 5 classification, geographically most widely available, was chosen to depict the distribution of mud to muddy sands, sands, mixed sediments, coarse substrate, as well as rock and boulders (Kaskela et al., 2019). Locations of historical beds were collected by the NORA historical ecology working group (extracted 27/01/2023). References to countries, provinces, regions, cities or offshore areas are mapped in Stechele et al. (2023). Designation of offshore regions is done according to Met OfficeSea Areas and Coastal Weather Stations referred to in the Shipping Forecast.
2.2 Larvae dispersal model
The LARVAE&CO model is an Individual-Based Model (IBM) that simulates egg and larval dispersal in the Eastern English Channel and the North Sea. It results from the coupling between a 3D hydrodynamic model and a Lagrangian particle-tracking module (Savina et al., 2010). This model, originally developed for sole and described in Lacroix et al. (2013) has been adapted for European flat oyster.
The 3D hydrodynamic NOS (North Sea) model, based on the COHERENS model (Luyten, 2006), has been implemented in the area between 48.5° N, 57° N, 4° W, 9° E. The model domain contains a 157 x 205 horizontal grid with a resolution of 5’ in longitude and 2.5’ in latitude (approximately 5 x 5 km) and 20 σ-coordinate vertical layers. Two open boundaries are located at the northern and western limit (at 4°W and 57°N) and the model includes daily river discharges of 14 rivers. The model is forced by weekly sea surface temperature (SST) data on a 20 × 20 km grid interpolated in space and time according to the model resolution (Bundesamt für Seeschifffahrt und Hydrographie, BSH, Germany) (Loewe, 2003) and by six-hourly surface wind and atmospheric pressure fields (provided by the Royal Meteorological Institute of Belgium based on the forecast data of the UK Met Office Global Atmospheric Model) (Hi Res, Walters et al., 2017). Details about the model implementation can be found in Savina et al. (2010) and Lacroix et al. (2013).
Larval trajectories were calculated online using the particle tracking model. The vertical diffusion was modelled by the random walk technique (Visser, 1997). Because in the North Sea vertical turbulent diffusion is considered to be the dominant horizontal diffusion mechanism (Christensen et al., 2007), explicit representation of horizontal diffusion was neglected. Specific details on the implementation can be found in Lacroix et al. (2013). Because current oyster bed distribution is unknown, connectivity between sites was not considered and only self-recruitment was modelled.
2.2.1 The individual-based model
In this implementation, only one pelagic stage was considered representing the pelagic larvae, from the swarming up to the settlement. The swarming period was identified to be temperature dependent just like the Pelagic Larval Duration (PLD). Larvae were passive and neutrally buoyant: no swimming behaviour or vertical migrations were considered. No natural mortality other than that due to loss by dispersal was included.
2.2.2 Parameterization
2.2.2.1 Spawning grounds
All the grid cells of the North Sea were potentially considered as spawning areas to allow to determine potential dispersal. To determine spawning grounds, a clustering method was applied based on the day where the temperature reached 15°C (corresponding to the first day of fertilisation), which was computed each year (over the period 2000-2009) for all grid cells. In the case where 15°C was not reached in a particular cell for a specific year, the day of the highest annual temperature was chosen. Numbers of the first spawning days were grouped by clustering method. Composition and the numbers of time clusters were determined with KMEANS algorithm with the package mclust in R (Scrucca et al., 2016) (Figure 1).
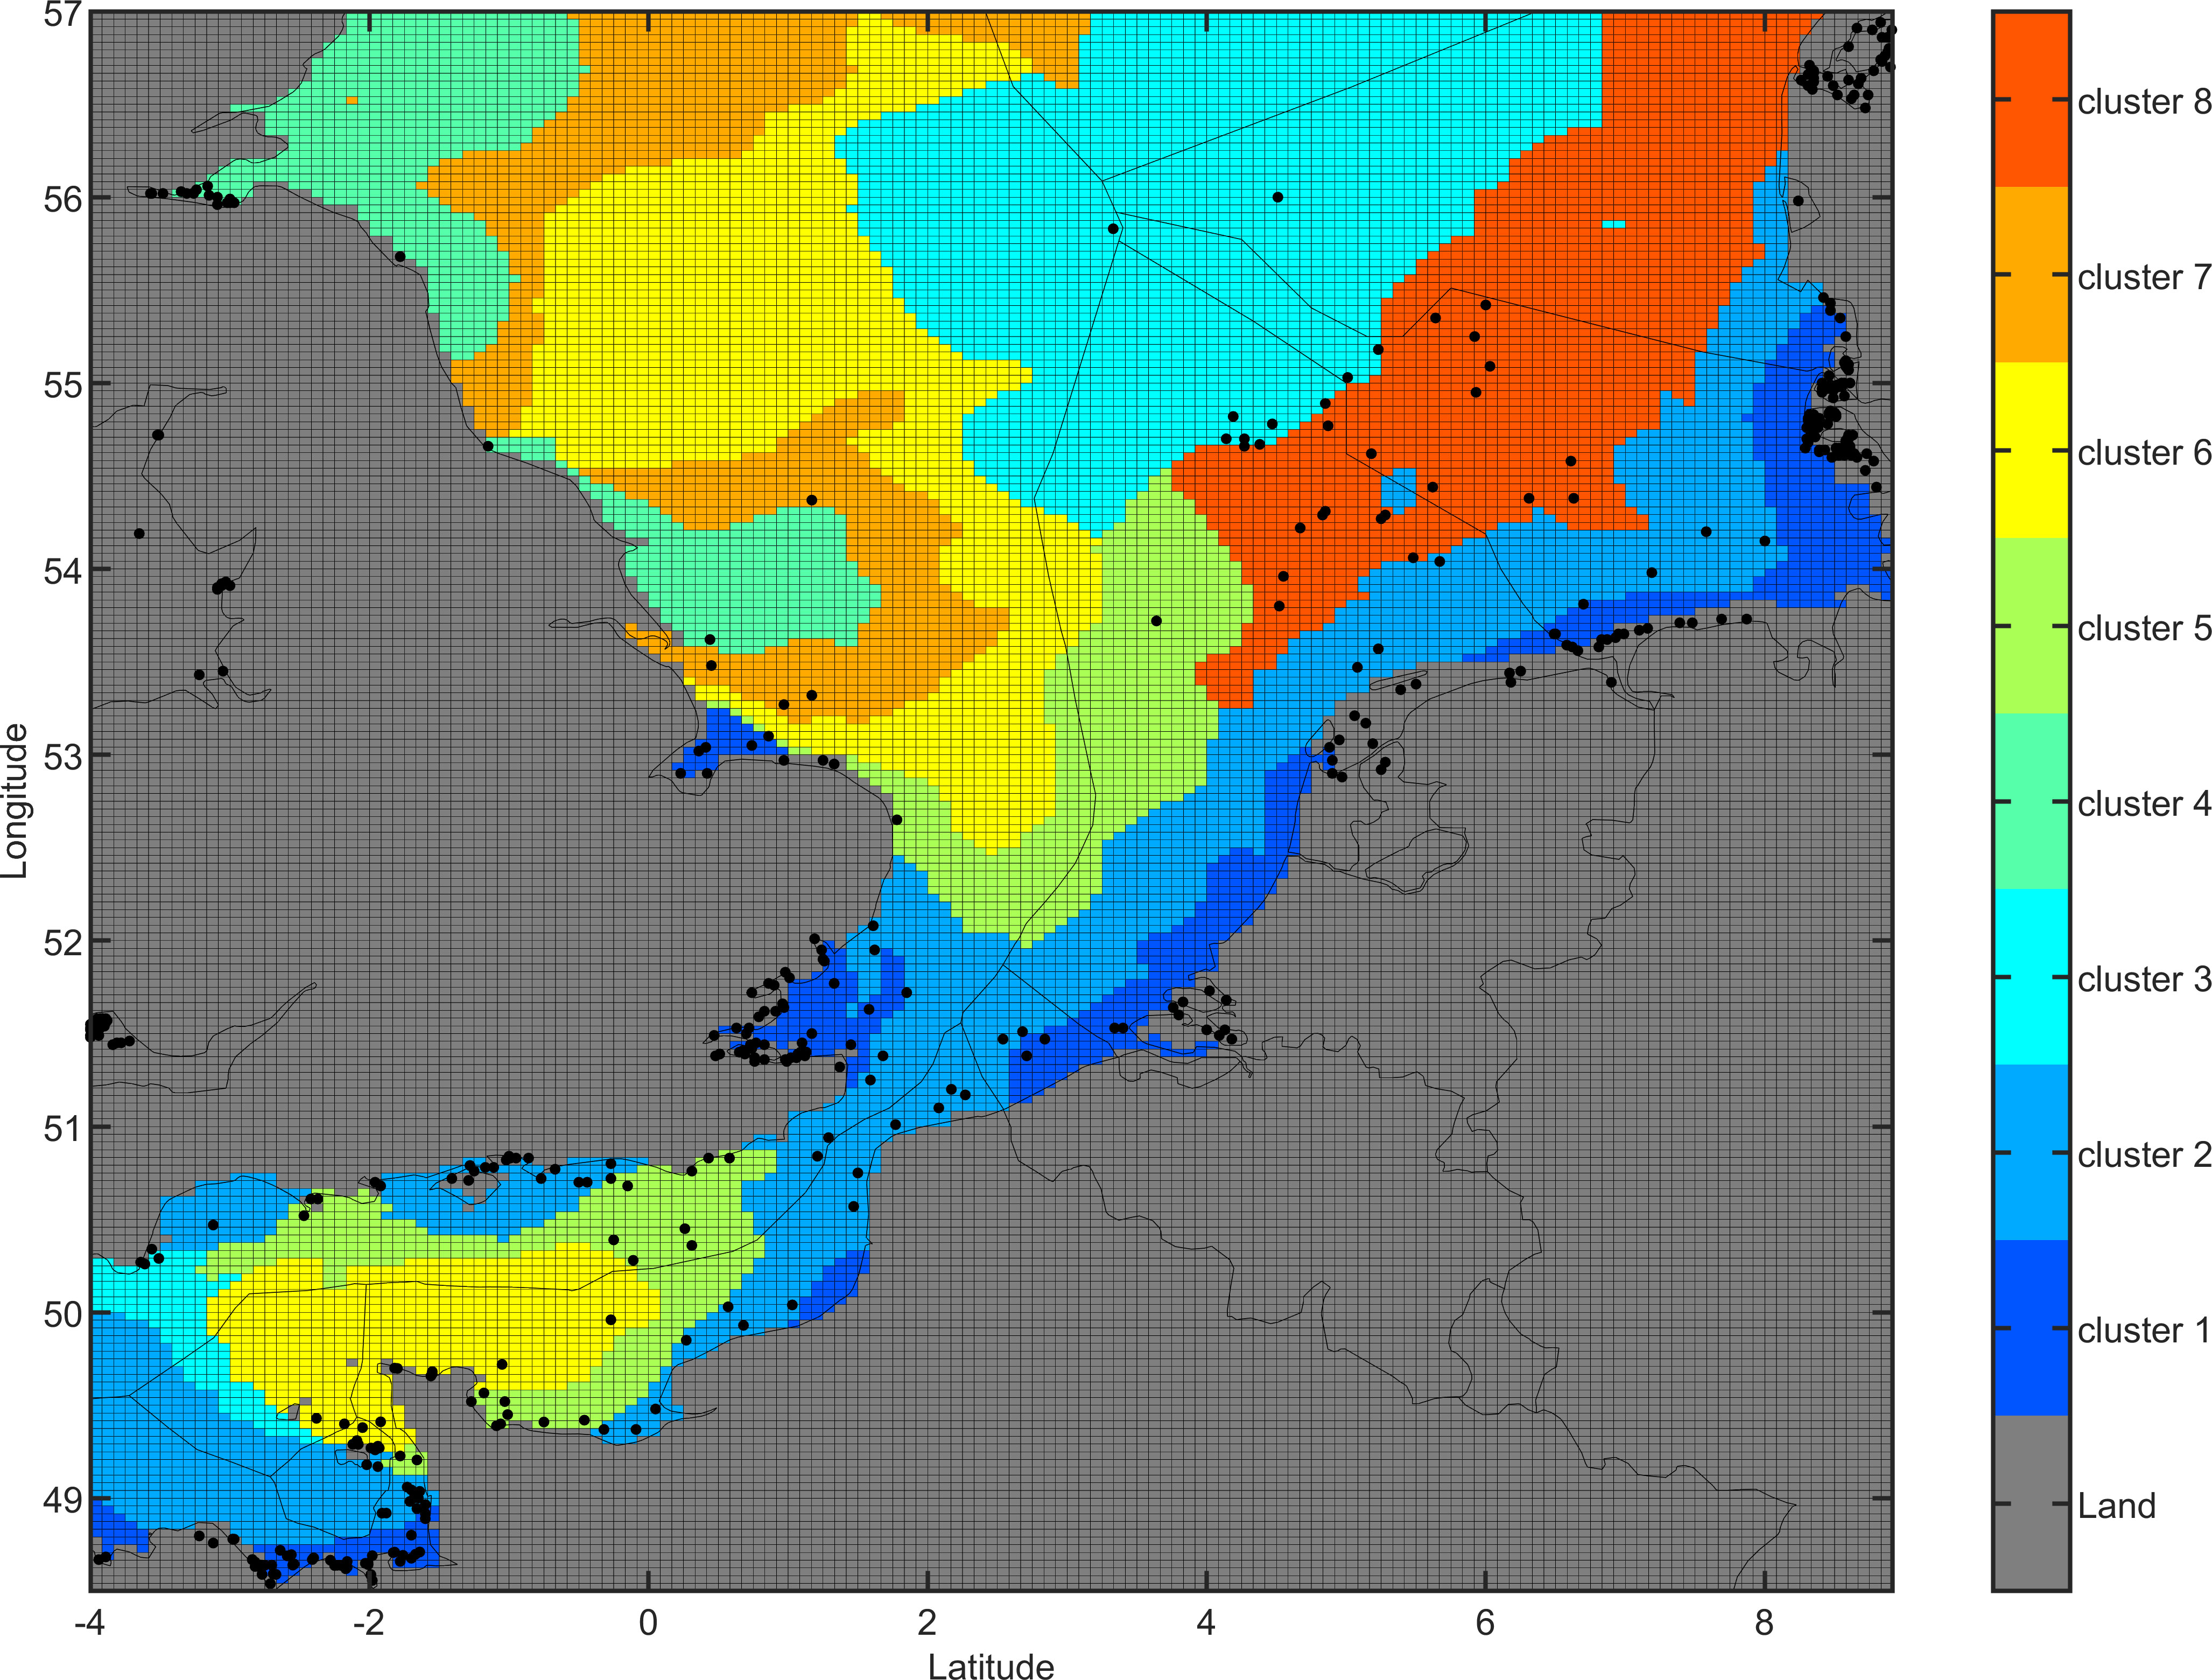
Figure 1 Release areas for European flat oyster. Each color represents an area with a similar spawning period (cluster). Spawning periods are computed each year (over the period 2000-2009) on each grid cell, and then aggregated using a clustering method. Dots indicate locations of historical oyster beds (Thurstan, 2023).
2.2.2.2 Release period
Eggs are fertilized within the females when temperature reaches 15°C (reproduction) within the cluster. Larvae are then released after a brooding period of ten days (De Mesel et al., 2018 and refs in). Release of larvae occurs over the course of a period of 10 days (De Mesel et al., 2018and refs in). Release intensity increases during the two first days and decreases during the eight following days. The timing of release (Julian day of the year) for the researched years, the release clusters and the release intensity is added in the Supplementary Materials Data Sheet 1.
2.2.2.3 Pelagic larval duration
Larval stage duration is a function of temperature according to the equation where T is the temperature (in degrees Celsius). Published data on the duration of the larval stages, obtained from laboratory experiments and in situ measurements (De Mesel et al., 2018 and ref in) were used to estimate α and β parameters: .
2.2.3 Set of simulations
The model has been run over a period of 10 years (2000-2009) corresponding with the time scale of the North-Atlantic Oscillation; this to be representative for the broad range of hydrodynamic and environmental conditions in the area under consideration. The number of particles released in every grid cell is 632, which corresponds to a total of 9.153256 ×10⁶ particles released in the model domain. This number has been chosen based on a prior sensitivity study to arbitrarily ensure a good representation of the dispersal pattern.
2.3 DEB-IBM population model
2.3.1 General
The Dynamic Energy Budget (DEB) theory (Kooijman, 2010) provides a mechanistical framework that enables understanding the interaction between individuals, populations and ecosystems and the environment. In DEB-IBM population models (Martin et al., 2012) each individual of the population is represented as a unique entity by a set of state variables, unique DEB parameters (to account for inter-individual variability) and unique attributes. State variables are updated based on DEB theory to represent the individual change (growth, development, reproduction, and fitness) over the lifecycle of the individual. Population dynamics emerge from individual behaviour and interaction between individuals such as reproduction.
The state variables of the individual include energy reserve, (J), structural volume, (cm3), reproductive energy, (J), maturity level, (J), aging acceleration, (d-2), age-related hazard rate, (d-1) and age, (d). The DEB model which is used to update the state variables is described by Stechele et al. (2022) and is an asj-model that accounts for metabolic acceleration from settlement onwards. Besides these DEB state variables, individuals are characterized by an individual-specific zoom factor which accounts for inter-individual variability in metabolic performance (Stavrakidis-Zachou et al., 2019). The structural length at settlement, (cm) and the structural length at the end of metamorphosis, (cm) are also individual-specific attributes that define the metamorphosis (metabolic acceleration in DEB terminology). The list of the individuals and their state variables, parameters and attributes represent the population.
2.3.2 DEB-IBM
Simulations start with 10 healthy adults. The state variables of the individuals are updated daily based on the environmental forcings. Mortality is checked daily, and dead individuals are removed from the populations. Mortality occurs when the individual’s energy reserve is empty , when individuals are preyed upon () or when accumulated tissue damage is too high for survival (), with a random number between 0 and 1 and the non-specific predation probability. Reproduction, larval release and swarming is triggered by water temperature (see 2.2.3). During reproduction, female eggs are fertilized and develop into larvae during the brooding phase. The release of larvae is distributed according to the release intensity which is given in Supplementary Materials Data Sheet 1. The number of larvae that are released and are self-recruited by the population, are calculated accordingly:
Where, is the sum of the for all mature individuals of the population, the fraction of individuals that are females, the energy content of one egg (J), and according to the distribution given in Supplementary Materials Data Sheet 1. Recruitment depends on the number of released larvae, the survival of the larvae through their pelagic drift phase (), and during the first year of life (, Walne, 1961). Survival during the first year of life (background survival) is integrated in the larval mortality rates to save on computation time. represents the fraction of larvae that stay in the pixel of release, while represents the fraction of larvae that drift away from location of release but return to the pixel of release due to current patterns. Larvae that drift away of the pixel of origin and arrive in another pixel (connectivity) are not considered. Temperature and food availability during the 20 days prior to settlement is averaged and is used to quantify the state variable of the recruited larvae. The age and length at settlement, (d) and (cm) were computed using the dget_ts function of the DEBtool. Other initial state variables of the recruited individuals include ]. An individual-specific zoom factor is given randomly to each newly settled individual according to a normal distribution of . The settling larvae that are integrated in the population behave as the other individuals and follow DEB rules during further development. When young individuals reach the end of the metamorphosis, is recorded individually as an attribute of the individual. and define the acceleration factor and individuals that are underfed during the early development will therefore grow slower and reach a smaller ultimate length.
The DEB-IBM model is linked to the larvae dispersal model (LDM) through the following parameters: (1) the timepoints at which reproduction occurs, (2) the timepoints at which release occurs, (3), the timepoints at which larvae arrive back in the pixel of release and (4) the fraction of released larvae that return to the pixel of origin (self-recruitment). For each location, population size, average fitness of all individuals (population fitness), larval release, and recruitment were recorded on a daily basis. The DEB-IBM parameters are presented in Supplementary Materials Data Sheet 2. The model assumptions are given in Table 1.
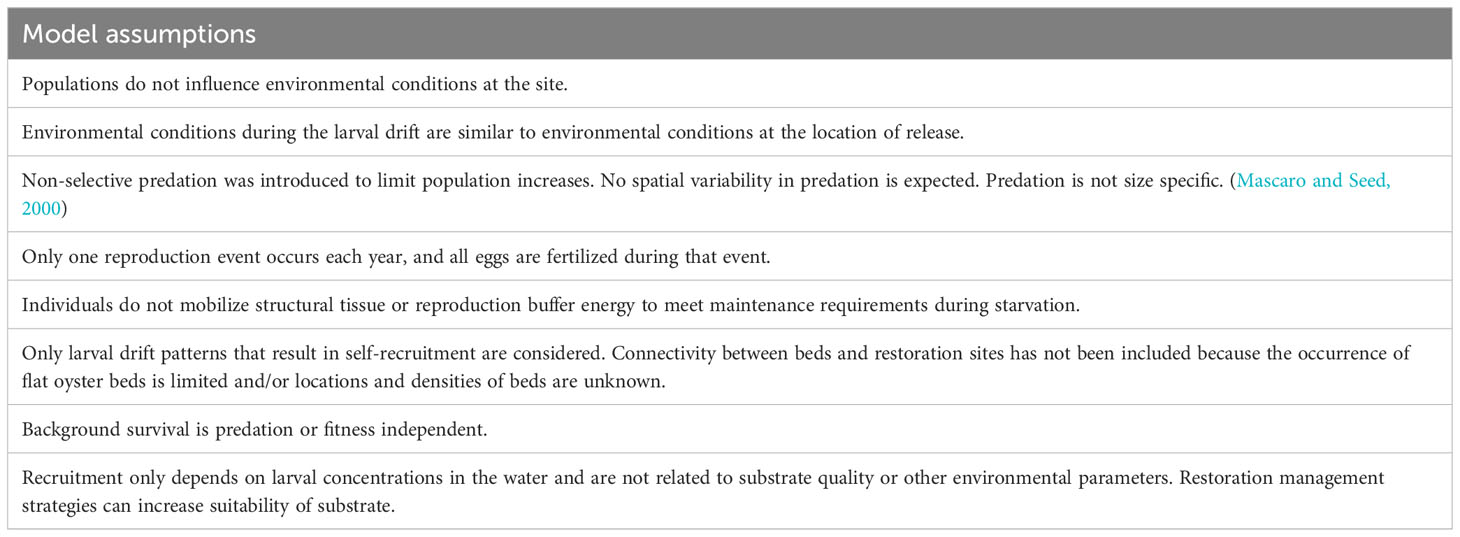
Table 1 Model assumptions of the coupled DEB-IBM-LDM.
2.4 Suitability indicators, validation, initial conditions and sensitivity analysis
When envisioning restoration, one is generally interested in allocating restoration efforts to locations where population growth is fast and suitable substrate is present. Pixels with high (i) population increase, expressed as final population size after 10 years of growth are therefore considered suitable for restoration. Nevertheless, historical beds are not necessarily located at locations with high population increase. Other indicators for suitable locations for restoration include (ii) population fitness expressed as minimum average population fitness of all individuals of the population over a 10-year period (Stechele et al., 2023), (iii) population reproductivity expressed as the total larval release by the population over a 10-year period, and (iv) population self-recruitment expressed as the total number of larvae (over a 10-year period) that, after drift, arrive in the same location as where they were released. These suitability indicators are outcomes of the model and can be linked to the success of certain flat oyster populations. The values of these population suitability indicators are categorized as high, average, and low (quantification is given in the Results section). Pixels with a high or average suitability indicator value receive a suitability indicator score of 1, while pixels with low suitability indicator values receive a suitability indicator score of 0. Suitability indicator scores are summed to reach a total suitability score for each pixel. For larvae to settle, and populations to develop, (v) suitable substrate is an additional key requirement. Oyster populations generally do well on coarse substrates (including shells), stable sands, and stiff muds that provide a solid foundation. Therefore, soft muds and shifting sandy substrates are unsuitable (Héral and Deslous-Paoli, 1991; Smaal et al., 2017; Rodriguez-Perez et al., 2019; Hughes et al., 2023).
The probability of encountering a historical bed in a pixel with a certain suitability indicator value was used as a way to validate the results of this study. The validation was performed for each suitability indicator and for the total suitability score.
A sensitivity analysis of the model was conducted, involving the variation of several parameter values, including larval survival during drift , non-specific predation probability , background survival , and standard larval retention . During the sensitivity analysis, population parameters were subjected to a positive and negative 20% variation. The primary objective was to observe the impact of these variations on the suitability indicator values, which serves as the main model outputs. Also, the impact of the initial conditions on the initial suitability indicator values was evaluated. The effect of the introduced adults was tested across a range of 10 to 10,000 individuals. Notably, only first-order impacts were examined, with each parameter being altered independently.
The sensitivity analysis and the impact of initial population size was carried out at two distinct locations since they are location dependent. Location 1 (55.1250° N, 8.4167° E) was identified as a site with low population increase, and after a 10-years development period, the population size was estimated to reach 306 individuals. In contrast, Location 2 (50.0833° N, 1.4167° E) supported higher population increases, and following a similar 10-year growth period, the population is expected to comprise 4647 individuals.
Matlab R2020a and its Mapping toolbox were used to perform simulations and generate plots.
3 Results
3.1 Suitability indicators
Population densities are expected to change over time, with population increases (Figure 2A) ranging from 0 to 5.5 × 10¹⁰ added individuals, which corresponds to an increased density of 0 to 1.1 × 10⁸ oysters/km2 over a period of 10 years, depending on the location. Large population increases (>106 individuals) are expected to occur in sheltered nearshore areas in the Wash (UK), around Isle of Wight (UK), on the north coast of Finistère (FR), Côte Fleurie (FR) all along the coast of Haute Normandie from Fécamp to Le Tréport (FR), around Dunkerque (FR) and at some locations in the Eastern and Western Frisian Islands (DE). An average increase (104 – 106 individuals) in population size is expected in the vicinity of areas with high population increase, in the Firth of Forth (UK), the coastal and nearshore Thames estuary (UK), Baie des Veys (FR), north coast of Nord-Pas-de-Calais-Picardie (FR), in the Scheldt estuary (BE, NL), around Noord Holland, and around German West and East Frisian islands (DE). Offshore locations with an average population increase are expected to be patchy in the English Channel but to be absent in the North Sea except for the area around Helgoland (DE). Expected population increases in the offshore North Sea area in general are low (< 103 individuals).
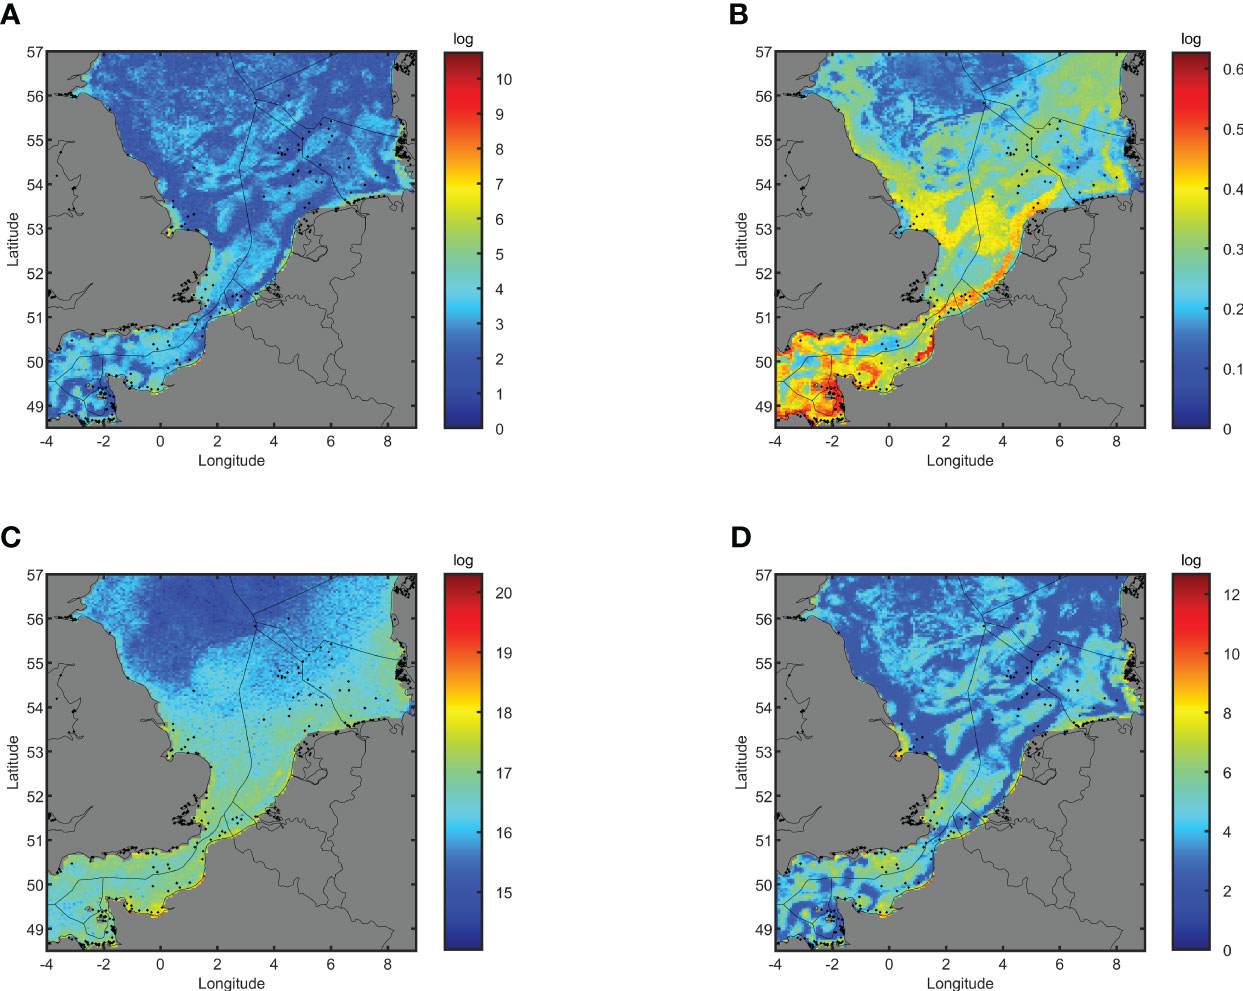
Figure 2 Expected distribution of suitability indicators (based on flat oyster populations during a 10-year period 2000-2010). (A) Population increases (log scale). (B) population fitness (0-1). (C) population reproductivity (log scale). (D) population self-recruitment (log scale). Dots indicate locations of historical oyster beds (Thurstan, 2023).
The population fitness (Figure 2B), expressed as the minimum fitness (0 - 1, averaged over all individuals of the population) over a 10-year period, is expected to range between 0.10 and 0.63. The population fitness is expected to be high (> 0.5) in the nearshore areas of the English Channel including around South Devon (UK), Dorset (UK), Isle of Wight (UK), the north coast of Brittany (FR), the wider Bay of Saint Malo (FR), around the Channel Islands (UK) and the coastline of Haute Normandie and Picardie (FR). Population fitness is average (0.3 - 0.5) in most areas of the English Channel (Plymouth, Portland, Wight and Dover) and in some areas of the North Sea (Tyne, Humber and Fisher). Low population fitness (< 0.3) is expected to occur in large areas of the North Sea including the offshore areas of Thames, the German Bight, Forties, Dogger and Forth.
The populations reproductivity, expressed as the number of larvae released by the population over a 10-year period (Figure 2C), is expected to range between 1.1 × 10¹⁴ and 2.0 × 10²⁰. Total population reproductivity is uniform in the English Channel (Plymouth, Portland, Wight, Dover), the Southern Bight of the North Sea (Thames, Humber), and the German Bight. Larval production is high (> 1017) along all the coastlines, except for the Elbe estuary and in nearshore areas, while being average (1016 – 1017) in the offshore areas, except for the offshore areas of Forth, Forties, Dogger and Fisher (< 1016) The self-recruitment (Figure 2D), expressed as the number of recruited larvae over the 10-year period, ranges from 2.0 102 to 4.7 1012. High self-recruitment (>107) occurs in the Wash (UK), in the Thames estuary (UK), around Isle of Wight (UK), the Bay of Saint-Malo (FR), the Côte Fleurie (FR), all along the coast of Haute Normandie (FR), the north coast of Nord-Pas-de-Calais-Picardie (FR), all along the Belgian and Dutch coast and around the North and West Frisian Islands (DE). Average self-recruitment (105-107) is patchy in the western offshore English Channel (Plymouth, Portland), in almost all the offshore areas of the eastern English Channel, all over the Southern Bight of the North Sea, except for the territorial waters of Belgium and The Netherlands (with the exception of the coastal areas as mentioned above). Low self-recruitment (< 105) is expected to occur along the North Sea coast of West-England (Tyne), the central and northern parts of the North Sea (Dogger, Forties and Forth), and off the coast of northern Denmark (Fisher). All datasets can be found in Supplementary Materials Data Sheet 3.
3.2 Suitability index score and validation
The total suitability indicator score (number of suitability indicators that are average or high) evaluates the suitability of locations for flat oyster populations. The flat oyster niche can be based on population dynamics (Figure 3A), or a combination of population dynamics and suitable sediment (Figure 3B).
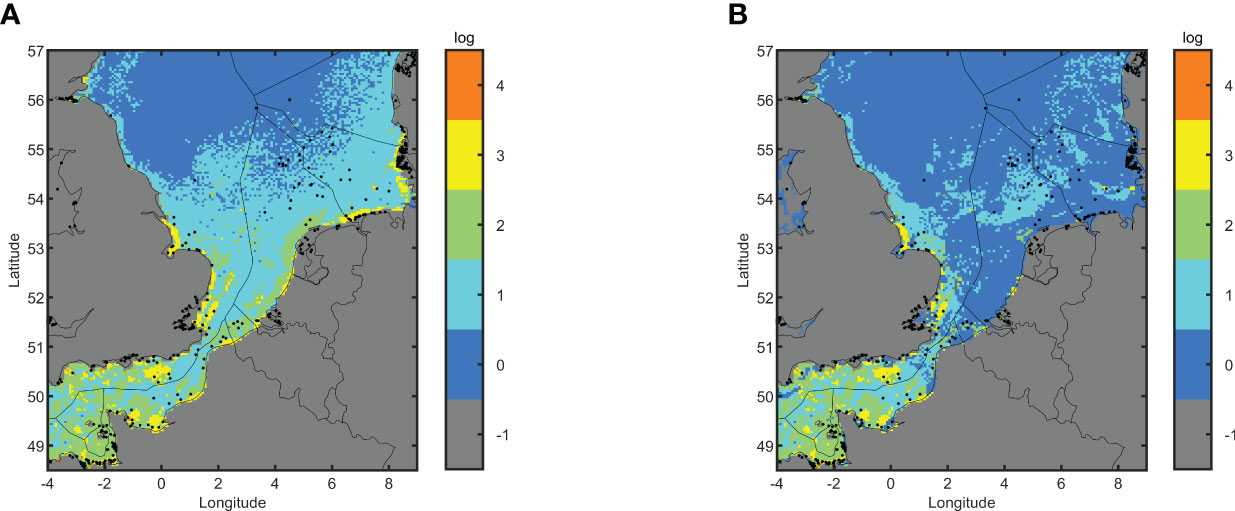
Figure 3 Spatial variability of the total suitability indicator score based on population dynamics (A) and both sediment type and population dynamics (B). Dots indicate locations of historical oyster beds (Thurstan, 2023).
Restoration hotspots (total suitability indicator score = 4) are located in the Wash (UK), all along the coast of East England and the outer Thames estuary (UK), in the offshore mid Channel south of the Island of Wight (Wight), around the Isle of Wight (UK), all along the coast of Dorset and Devon (UK), all along the coast from Saint-Brieuc (FR) to Le Mont-Saint-Michel (FR), Côte Fleurie (FR) all along the coast of Haute Normandie from Fécamp to Le Tréport (FR), around Dunkerque (FR), in the Northern parts of the Scheldt Estuary (NL), off the coast of Noord-Holland (NL), in and around both the Western and Eastern Frisian Islands (DE) and around Helgoland (DE).
Suitability indicators scores can be linked to the occurrence of historical beds. Historical beds generally (>5% coverage) collocate with locations that have a high total suitability indicator score (Figure 4). There is a 10% chance of encountering a historical bed at a location with a total suitability indicator score of 3, while there is a 33% probability of encountering a historical bed at a location with a total suitability indicator score of 4 (Figure 4E). In locations with lower total suitability indicator scores, one has a lower probability of finding historical habitats. This both validates the results of this study and might explain why some historical habitats prospered at certain locations.
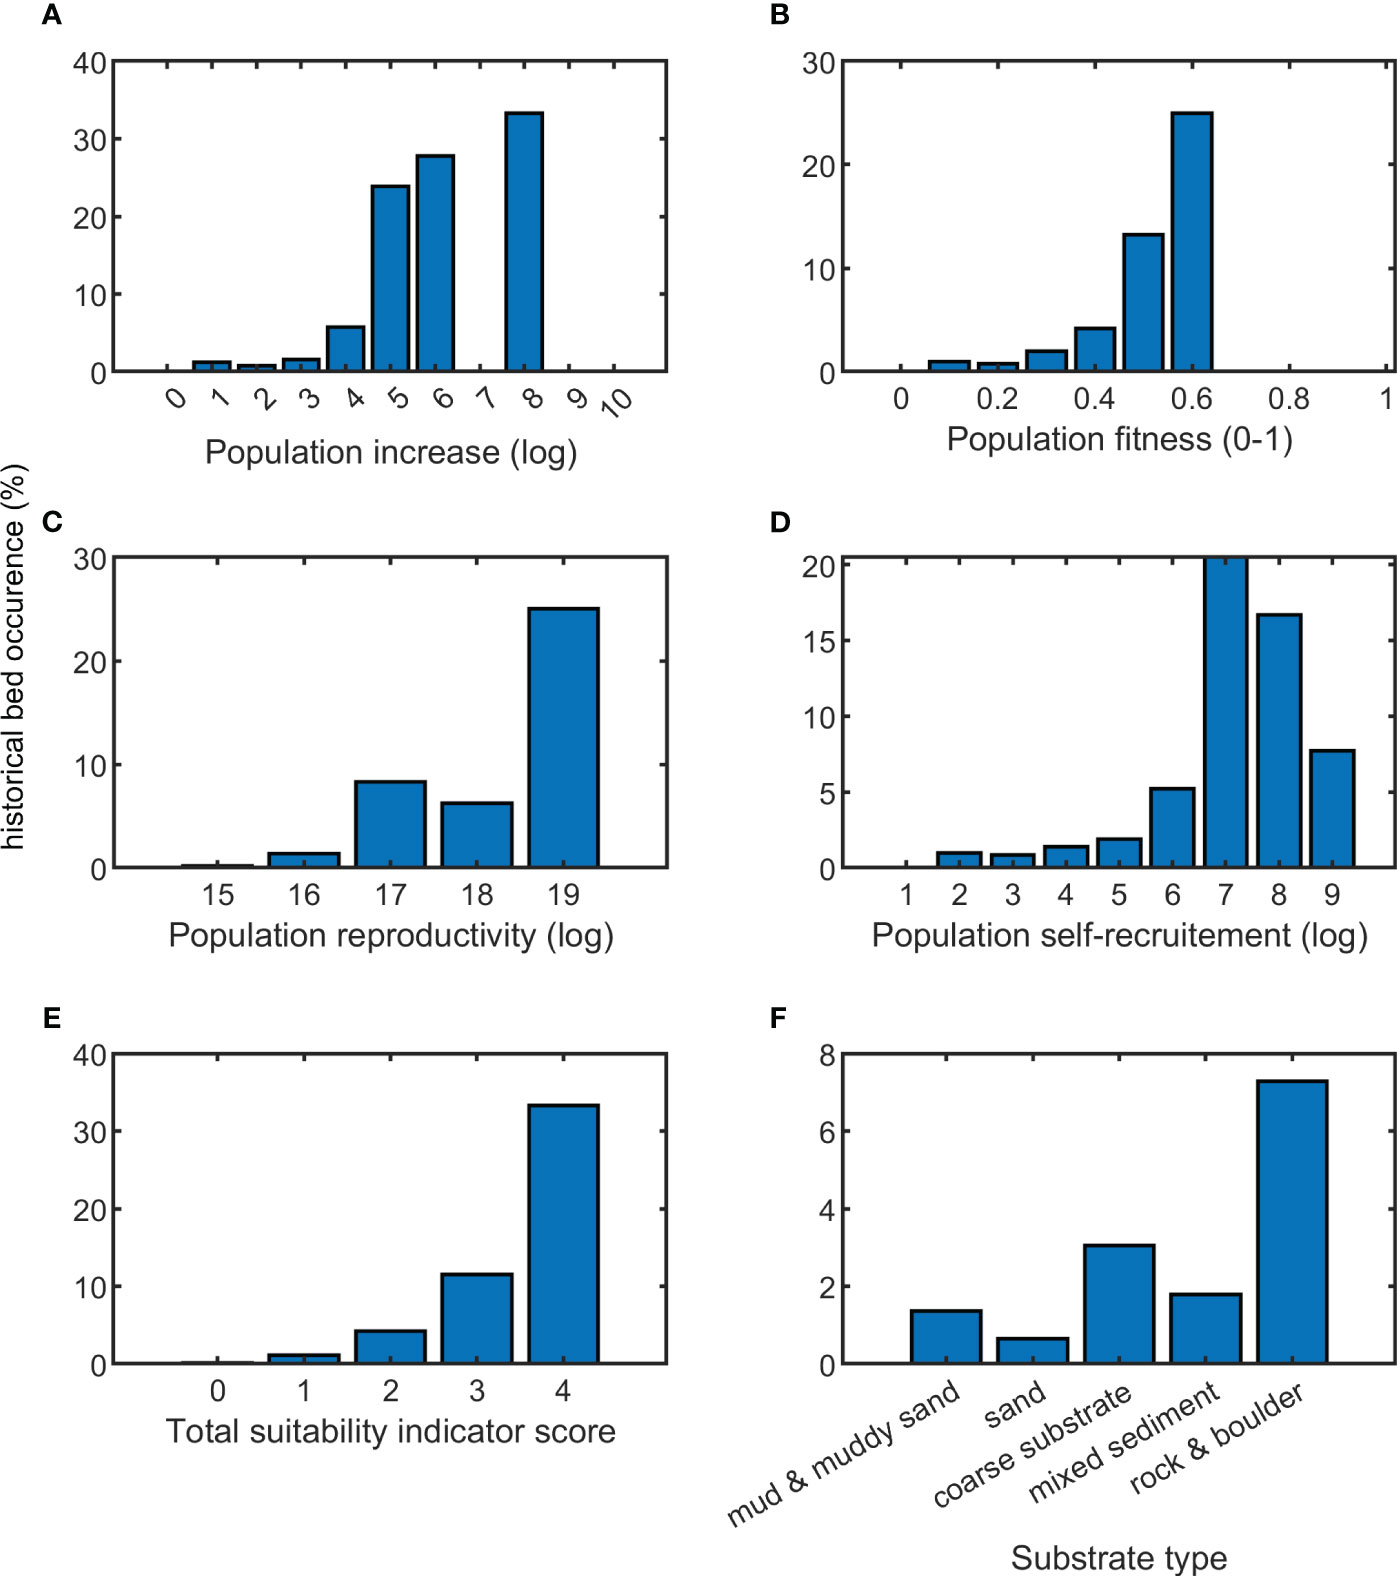
Figure 4 Validation of suitability indicator values against presence of historical oyster beds (probability of finding an oyster bed in a pixel with a certain suitability indicator value). Suitability indicators include population increase (A), population fitness (B), population reproductivity (C), population self-recruitment (D), and total suitability indicator score (E). The probability of finding oyster populations also depends on sediment type (F).
There is a probability of 6 to 33% to encounter historical beds in pixels with an average or high population increase. The probability of encountering a historical bed increases when the expected population increases. Similarly, the probability of encountering historical beds increases for pixels with high population fitness. In pixels with a minimum population fitness > 0.6, one has a 25% probability of encountering historical beds. Historical beds generally occurred in location where larval production is estimated to be average or high (>1016) and where population self-recruitment is average or high (105). In relation to substrate type, historical habitats coincide most with areas composed of rocks, boulders, coarse substrate, mixed sediment, mud and sand, in order of priority, and most likely aligns with the stability of the substrate as well.
3.3 Sensitivity analysis and the effect of initial population size
The model results are influenced by forcings, model parameters and initial conditions. The influence of population parameter values on the suitability indicators is given in the sensitivity analysis (Table 2). Population fitness is generally unsensitive to population parameter variations. The other suitability indicators do are sensitive to variations in population parameter values.
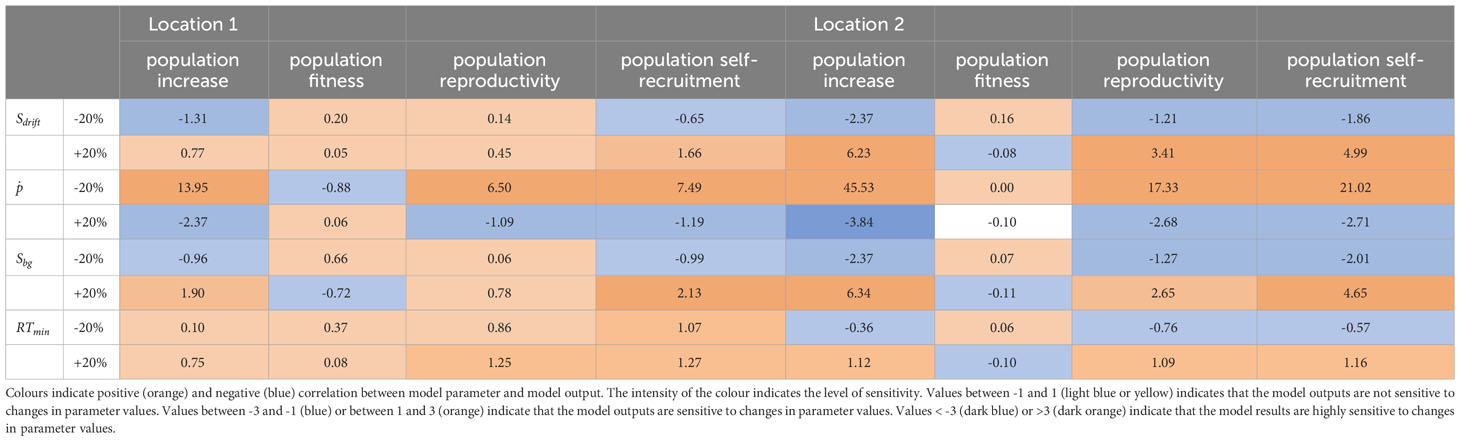
Table 2 Sensitivity analysis for the DEB-IBM population parameters for a location with low population increase (Location 1; 55.125° N, 8.4167° E) and average population increase (Location 2; 50.0833° N, 1.4167° E).
Variations in result in a low to moderate impact on the population increase, reproduction, and self-recruitment. These suitability indicators are highly sensitive to variations in and and unsensitive to variations in . Model outcomes generally become more sensitive to variations in parameter values when the environmental conditions are more suitable.
The population size at the start of the simulation affects the model outcomes. The positive effects of additional broodstock introduction becomes more important when environmental conditions are suitable. For a location where low population increase is expected (Location 1), increasing the initial population size from 101 individuals to 104 resulted in a doubling of the final population size (from 306 to 595 final population size). In a more suitable location (Location 2), on the other hand, population size increased with a factor 42 (from 4647 individuals to 197104 individuals). The impact of initial population is therefore location dependent.
4 Discussion
4.1 General
The performance of organisms is strongly connected to their physical environment and their ability to cope with the fluctuations in their environment. Knowledge about the ecological niche of a species has been a key element in conservation and restoration efforts (Peterson, 2003; Peterson and Robins, 2003).
General trends in site suitability for flat oysters, not for flat oyster populations, are given in Stechele et al. (2023) and include; (1) coastal areas are rich in nutrients and support fast growth and high fitness, (2) low salinities due to river runoff are unsuitable, (3) offshore locations have more constant temperature profiles but lower food availability, (4) environments under Atlantic influence are characterized by low nutrients and therefore do not support flat oyster populations, (5) locations at higher latitudes in the northern North Sea, have low temperatures and do not reach the spawning threshold.
By extending the species model to a population model, the results of Stechele et al. (2023) are finetuned. The new trends that emerge restrict suitability in comparison to the Stechele et al. (2023) results. Spatial variability in site suitability for restoration depends on the environmental conditions at the site, including the food availability, salinity, and temperature dynamics as well as substrate type and hydrodynamics. Analyzing these factors on a site-by-site basis is needed to understand the reason why the location is suitable for restoration. However, the site suitability indicators (population increase, population fitness, reproductivity and self-recruitment) provide more understanding.
The high suitability for flat oysters (Stechele et al., 2023) all along the French coast of Brittany and Normandy translates into a patchy pattern of suitability for restoration. The coastline between Saint-Malo and the Mont Saint Michel for example, is estimated to be more suitable than the Côte des Isles in the west of Normandy. The reason for this can be found in the suitability indicators, and in this case relates to lower reproductivity and lower self-recruitment.
The use of ecological niche models and species distribution models allows one to explore the patterns behind observed species distribution. A comprehensive understanding of species distributions and site suitability is essential for successful habitat restoration initiatives which have grown in prevalence recently (Sillero et al., 2021). Correlative approaches are typically employed to evaluate species distribution; however, correlative niche models lack the capacity to explain the processes behind the observations and are thus limited in various applications, such as site selection for habitat creation (habitat creation involves the creation of ecosystem at locations where these systems previously did not occur), evaluating the effect of climate change on niche distribution, and understanding migration patterns of invasive species. In general, these models lack physiological knowledge as to why certain factors are linked to the presence or absence of a species (Kearney and Porter, 2009). Mechanistic niche models, as developed and applied in this study, are of particular importance when one envisions understanding flat oyster habitats distribution because (1) precise records of past bed locations are often incorrect, (2) the historical environment has changed significantly and will continue to change and (3) there is an increasing interest in flat oyster nature-inclusive-designs with the aim of restoring flat oyster habitat functions on locations where protection measures have been in place (e.g., offshore wind farms, MPAs, offshore infrastructures).
4.1.1 Advantages of the methodology
This work presents a novel method of evaluating site suitability using a realistic niche model that is supported by a generic and mechanistic approach. The generic nature of DEB implies that the methodology proposed here is applicable to other species (Kooijman, 2010; Kearney, 2012). Species specific parameters can be found in the Add-My-Pet collection, and by applying these, one can use the same modelling approach for other sedentary species. The mechanistic nature of the DEB model, which forms the basis of this current ecological niche model, has the capacity to explain the behaviour of individuals and population in variable environmental conditions. Simulating state variables of individuals in a population, describes processes such as growth, starvation, mortality and successful or failed reproduction events. By including inter-individual variability and individual interactions one surpasses the individual level. Mechanistic population models become relevant in explaining population traits such as population dynamics, population density, reproductivity or self-recruitment as well as quantifying regulating ecosystem services (water quality regulation and nutrient removal) and evaluating supporting services (habitat provision, biodiversity, sediment biogeochemistry alterations and food web structure) (Rullens et al., 2019).
The proposed methodology additionally has the benefit of being straightforward to comprehend, modify, or enhance. DEB extensions to include the effects of hypoxia (Thomas et al., 2019), filtration inhibition by particulate matter (Kooijman, 2010), or gonadal development (Bourlès et al., 2009) would increase the explanatory power of the model, but these DEB extensions have not yet been parameterized for flat oysters. The DEB model for flat oyster individuals has been parameterized and validated (Stechele et al., 2022).
As done in this study, these mechanistical population models can easily be validated using presence/absence datasets, in contrast to correlative niche models which often stay unvalidated (Theuerkauf and Lipcius, 2016).
4.1.2 Limitations
Although the methodology is applicable on all time and space scales, the application discussed in this work is limited by both scales. The applied timeline (10-years) accounts for the North-Atlantic Oscillation’s typical variability. It does not account for rare environmental events that might have an implication on flat oyster populations (e.g., the severe winter of 1962/1963 caused a reduction of the flat oyster stock by 97% in the Eastern Scheldt estuary, rare storm surges or current shifts have implications on water temperature or plankton distribution) (Drinkwaard, 1998; Smaal et al., 2022). Spatially, the model is applied at mega (basin) and macro scale (km). Suitability at meso (m) and micro (>m) scale are important to consider and are known to impact model recruitment parameters ( and ) (Hofstede et al., 2023). Applying the model to finer resolution data is essential when evaluating site suitability characterized by steep gradients such as estuaries or dynamic coastal environments (Bergquist et al., 2006) or even at smaller scales such as artificial habitats (Bartol and Mann, 1997).
Another important limitation of this study is the valuation of important parameters. For example, mortality of individuals is assumed when their energy reserve (fitness) is empty (). Oysters are known to re-allocate reproductive energy to cover maintenance needs during starvation periods (not included in this model) (Flye-Sainte-Marie et al., 2009; Liu et al., 2010). On the other hand, weak individuals might be more susceptible to disturbances (such as temporary burial, disease, exposition to toxic algae or pollution) and mortality might occur at fitness levels higher than zero () (Mcdonald et al., 2023). Valuation of the recruitment parameter, depends on meso- and microscale relief of the site and the substrate and is therefore difficult to assess, although it can influence the suitability indicator population self-recruitment. Another important parameter which is difficult to value is the fraction of individuals which are female (), a parameter that impacts larval release (impacts suitability indicator population reproductivity). The flat oyster is an asynchronous hermaphrodite organism which changes sexuality over the year. The mechanism of sex change is poorly understood (da Silva et al., 2009). To overcome the limitations related to the valuation of important parameters, suitability indicators have been developed in this study. These suitability indicators are closely linked to parameters that are difficult to quantify. Locations that support good population fitness (fitness > 0.4), are more likely to harbor successful oyster beds restoration, since these beds are well fed and therefore more resilient to environmental disturbances. Similar reasonings can be followed in case of the other suitability indicators. The sensitivity analysis clearly shows that the valuation of the population parameters is important when using quantitative model results. The model outcome results are highly sensitive to variations in the parameters , and , indicating that more research is needed to quantify and understand survival and predation characteristics of sites.
The relation between the occurrence of historical habitats and Folk 5 substrate types (mud, sand, mixed sediment, coarse substrate, rocks, and boulders) generally aligns with the degree of stability that is expected from these beds. Whilst this is clear for the hard substrate types, more variables are into play for the soft substrates. In Folk 5, the sand class is most narrowly defined as a sediment with less than 10% mud and no gravel fraction, hence it is the most mobile, and indeed least suitable. The mud class can have up to 90% mud and can vary largely in composition (muddy sand to clay). Importantly, one should consider the substrate beneath the active layer, that is often very thin (mm to cm) (van der Spek et al., 2022), and overtopping more compact, and often older geological layers that would provide the necessary stability and firmness. Depending on the thickness of the active layer, time dependent seabed samples represent approximatively these more compact layers. Hitherto, this is not mappable at larger scales. Mechanistically accounting for seabed stability is difficult since it implies accounting for several hydrodynamic factors such as tidal and residual currents, depth, and storm surges, together orchestrating the dynamicity of the seafloor geomorphology and the substrates composed of variable grain sizes. Seabed mobility can be approximated using proxies such as depth, bed shear stress or mud content in sandy sediment (Damen et al., 2018). The percentage of mud in a sandy sediment may be indicative of relatively stable conditions, if consolidation can occur, e.g., where fine silt and clay particles can settle (Borsje et al., 2013; Damen et al., 2018). Flat oysters appear to have a preference for consolidated sediment with a relatively high mud content. However, seabeds with extremely high (>50%) unconsolidated mud is unsuitable (Houziaux et al., 2008; Houziaux et al., 2011).
However, the regionally available EMODnet products result from standardization and harmonization of many datasets, using a range of methodologies and often based on sampling data which cover a wide time span (Kaskela et al., 2019). Significant improvements are expected with upcoming EMODnet products which are based on more coherent datasets and more advanced methodologies. Progress is also made in a better parameterization of the geological substrate, and sediment thickness (e.g., Hademenos et al., 2019). Incorporating better sediment parameterization in seabed mobility studies will further result in more realistic suitability predictions. Considering correlative mismatches between areas predicted as suitable and the presence of historical habitats (false positives), one should consider the reliability of the substrate/seafloor terrain variables used in this study, other missing variables, and the correctness of historical oyster bed distribution data, which were mainly drafted when overfishing was already ongoing for more than a century and the disappearance of beds was had being recorded.
Therefore, it must be noted that the EMODnet substrate dataset used in this study may not be sufficiently representative of such complex and important dynamic factors. It must also be noted that there exists a paucity of datasets with large-scale geographical coverage as applied in this study.
Observing the early life stages of oysters directly can be difficult at the North Sea scale, as they are tiny. Therefore, biophysical models are used to assess their dispersal, which implies the formulation of hypotheses about spawning periods and pelagic duration. However, the validity of these hypotheses can be discussed, especially in areas where populations are not naturally present, such as the northern part of the domain where, in the model, spawning occurs below the temperature threshold of 15°C, Nevertheless, these areas also have low suitability indicators making the hypothesis less critical (Figure 3).
The size of the grid choice also plays an important role in measuring the self-recruitment of oyster populations. Indeed, the smaller the grid size, the fewer particles will drift and remain in place. This can lead to an underestimation of self-recruitment if the grid size is too small, as particles can drift outside the grid and contribute to recruitment in another area. However, a too large grid size could overestimate self-recruitment. The grid size used (5 km x 5 km) is a compromise that balances the need to capture fine-scale details with the uncertainty in particle movement. While such a grid may not be representative of the specific restoration sites, it still provides valuable insights into self-recruitment dynamics on a regional scale.
This study, which focuses on self-recruitment only, does not consider the potential connectivity with outside areas, be it natural, cultivated or restored populations. For instance, an area might be highly favourable for oyster restoration, even with a low level of self-recruitment provided that it receives spat from outside areas, and potentially it could even be a source of spat for other areas. Taking into account all potential connections would require a thorough knowledge of the existing population (location, density, population structure) and a network strategy for designing restoration sites across the North Sea. Connectivity was not considered in this work because nearshore and offshore population are heavily degraded. Locations and densities of populations in the nearshore and offshore environment are unknown. In addition, the aim of restoring beds is to generate fully functional, self-sustaining beds. Dependence on nearby populations would make restoration sites less resilient.
An important model assumption (Table 1) is that population size does not influence the environment of the site. Oyster populations generally influence the environment by regulating food levels (Akinyemi et al., 2021; Albentosa et al., 2023), providing suitable substrate for settlement (Rodriguez-Perez et al., 2019), increasing complexity of the seabed which improves larval retention (Andutta et al., 2012) or attracting biodiversity including oyster predators. These relationships with the environment define carrying capacity or maximum population size. Although maximum population size is an important characteristic in restoration and site selection studies, it is not represented in the results of this study, and the results of this study merely relate to the rate at which populations can be restored. Large population increases (>106) as estimated by this study, correspond to small population densities (> 0.04 oysters m-²), assuming even distribution of oysters over the pixels, after 10 years. These densities do not represent oyster beds or reefs, but merely represent sporadic individual oysters which only minimally impact on food levels, substrate availability or biodiversity (zu Ermgassen et al., 2021).
4.2 Recommendations to restoration practitioners and outlook
As indicated in this study, the model provides several outputs that can serve as indicators for a scientifically informed estimation of oyster habitat restoration success. A rapid population increase is a desirable factor for restoration initiatives and is a keystone indicator of success (Glover et al., 2021). Here, high population increases are estimated to occur within sheltered and nearshore areas where reproductivity and larval retention are high. Offshore sites (especially in the North Sea) are generally characterized by low larval retention. We do not expect to see high population increases at these sites. Supplementing restoration efforts with high numbers of broodstock individuals seems self-evident at offshore sites, but hydrodynamics disperse larvae rapidly, with limited expected influence on success. Management strategies that would have more influence in the offshore environment is reducing predation, increasing complexity, to keep larvae on site, or applying large numbers of spat on shell. Scaling up restoration efforts will boost population productivity and self-recruitment.
To increase success of flat oyster habitat restoration in the offshore environment, we suggest the implementation of a basin-wide coordinated restoration effort that promotes the connectivity between natural oyster beds, restoration sites, oyster nature-inclusive-design adaptation to offshore infrastructure and aquaculture sites. Allocating these supportive activities, to locations where high self-recruitment (or high connectivity) is expected, would benefit local beds.
The method presented in this work provides the basis to quantitatively understand why certain locations are more suitable for flat oyster habitat restoration than others and can be used to scientifically gauge environmental restoration efforts. In additions, the method represents a powerful tool for investigating multiple important research gaps including the potential impacts of climate change on oyster restoration efforts, the effect of restoration efforts on the ecosystems functioning (Kotta et al., 2023) or evaluate management strategies on population dynamics.
5 Conclusion
With the growing trend of flat oyster habitat restoration, creation, and increased importance of nature inclusive designs that integrate flat oyster habitats with offshore marine infrastructure, correct site selection through suitability mapping becomes an important prerequisite of success. This work demonstrates how combining an individual-based population model (DEB-IBM) and a larval dispersal model can be used to create a niche model for flat oyster habitat restoration. Spatial variability in suitability indicators; population increase, minimum population fitness, population reproduction and population self-recruitment define the total suitability. Through the application of this model to the English Channel and the North Sea, hotspots for restoration were identified, and reasons for restoration success or failure are identified through valuation of the suitability indicators. Additionally, the model can be used to explain why certain sites are suitable for flat oyster habitats and why certain historical habitats existed in certain locations. Furthermore, the model can be used to measure the effects of management strategies and the ecosystem services provided by habitats.
Data availability statement
The raw data supporting the conclusions of this article will be made available by the authors, without undue reservation.
Ethics statement
The manuscript presents research on animals that do not require ethical approval for their study.
Author contributions
BS, LB, GL, LD and NN conceived the ideas and designed methodology. BS, LB, GL built the databases. BS, LB, GL, LD, GG analyzed the data. BS, LB, GL, VL and GG wrote the manuscript. All authors contributed to the article and approved the submitted version.
Funding
This work was supported by the Research Foundation–Flanders (FWO) through an SB PhD fellowship granted to BS [project number 1S84619N]. This project has received funding from the European Union’s Horizon 2020 Research and Innovation Programme under Grant Agreement no 862915. Views and opinions are those of authors only and do not necessarily reflect those of the European Union. Neither the European Union nor the Granting Authority can be held responsible for them.
Acknowledgments
This study has been conducted using E.U. Copernicus Marine Service Information; https://doi.org/10.48670/moi-00054 and https://doi.org/10.48670/moi-00058.
Conflict of interest
The authors declare that the research was conducted in the absence of any commercial or financial relationships that could be consstrued as a potential conflict of interest.
Publisher’s note
All claims expressed in this article are solely those of the authors and do not necessarily represent those of their affiliated organizations, or those of the publisher, the editors and the reviewers. Any product that may be evaluated in this article, or claim that may be made by its manufacturer, is not guaranteed or endorsed by the publisher.
Supplementary material
The Supplementary Material for this article can be found online at: https://www.frontiersin.org/articles/10.3389/fmars.2023.1224346/full#supplementary-material
References
Akinyemi M. I., Da-Costa F., Filgueira R., Galimany E., Ibarrola I., Albentosa M. (2021). Scope for growth of Mar Menor flat oysters under eutrophic conditions: Implications for future bioremediation actions. [Conference presentation]. NORA 4.
Albentosa M., Akinyemi M. I., Vera M., Ibarrola I., Filgueira R., Galimany E., et al. (2023). Recovery of eutrophized marine ecosystems using the European flat oyster, Ostrea edulis. Aquat. Conserv.: Mar. Freshw. Ecosys. 33 (7), 645–660. doi: 10.1002/aqc.3926
Andutta F. P., Kingsford M. J., Wolanski E. (2012). ‘Sticky water’enables the retention of larvae in a reef mosaic. Estuarine Coast. Shelf Sci. 101, 54–63. doi: 10.1016/j.ecss.2012.02.013
Bartol I. K., Mann R. (1997). Small-scale settlement patterns of the oyster crassostrea virginica on a constructed intertidal reef. Bull. Mar. Sci. 61 (3), 881–897.
Beck M. W., Brumbaugh R. D., Airoldi L., Carranza A., Coen L. D., Crawford C., et al. (2011). Oyster reefs at risk and recommendations for conservation, restoration, and management. BioScience 61 (2), 107–116. doi: 10.1525/bio.2011.61.2.5
Bennema F. P., Engelhard G. H., Lindeboom H. (2020). Ostrea edulis beds in the central North Sea: delineation, ecology, and restoration. ICES J. Mar. Sci. 77 (7–8), 2694–2705. doi: 10.1093/icesjms/fsaa134
Bergquist D. C., Hale J. A., Baker P., Baker S. M. (2006). Development of ecosystem indicators for the Suwannee River estuary: Oyster reef habitat quality along a salinity gradient. Estuaries Coasts 29 (3), 353–360. doi: 10.1007/BF02784985
Bertolini C., Pastres R. (2022). Identifying knowledge gaps for successful restorative aquaculture of Ostrea edulis: a bibliometric analysis [version 3; peer review: 2 approved]. Open Res. Europe 1, 103. doi: 10.12688/openreseurope.14074.3
Bindoff N. L., Cheung W. W. L., Kairo J. G., Arístegui J., Guinder V. A., Hallberg R., et al. (2019). “Changing ocean, marine ecosystems, and dependent communities,” in IPCC special report on the ocean and cryosphere in a changing climate. Eds. Pörtner H.-O., Roberts D. C., Masson-Delmotte V., Zhai P., Tignor M., Poloczanska E., Mintenbeck K., Alegría A., Nicolai M., Okem A., Petzold J., Rama B., Weyer N. M. (Cambridge, UK and New York, NY, USA: Cambridge University Press), 447–587. doi: 10.1017/9781009157964.007
Borsje B. W., Roos P. C., Kranenburg W. M., Hulscher S. J. M. H. (2013). Modeling tidal sand wave formation in a numerical shallow water model: The role of turbulence formulation. Continental Shelf Res. 60, 17–27. doi: 10.1016/j.csr.2013.04.023
Bourlès Y., Alunno-Bruscia M., Pouvreau S., Tollu G., Leguay D., Arnaud C., et al. (2009). Modelling growth and reproduction of the Pacific oyster Crassostrea gigas: Advances in the oyster-DEB model through application to a coastal pond. J. Sea Res. 62 (2), 62–71. doi: 10.1016/j.seares.2009.03.002
Christensen A., Daewel U., Jensen H., Mosegaard H., John M. S., Schrum C. (2007). Hydrodynamic backtracking of fish larvae by individual-based modelling. Mar. Ecol. Prog. Ser. 347, 221–232. doi: 10.3354/meps06980
Christianen M., Lengkeek W., Bergsma J., Coolen J., Didderen K., Dorenbosch M., et al. (2018). Return of the native facilitated by the invasive? Population composition, substrate preferences and epibenthic species richness of a recently discovered shellfish reef with native European flat oysters (Ostrea edulis) in the North Sea. Mar. Biol. Res. 14 (6), 590–597. doi: 10.1080/17451000.2018.1498520
Damen J. M., van Dijk T. a. G. P., Hulscher S. J. M. H. (2018). Spatially varying environmental properties controlling observed sand wave morphology. J. Geophys. Res.: Earth Surface 123 (2), 262–280. doi: 10.1002/2017JF004322
da Silva P. M., Fuentes J., Villalba A. (2009). Differences in gametogenic cycle among strains of the European flat oyster Ostrea edulis and relationship between gametogenesis and bonamiosis. Aquaculture 287 (3), 253–265. doi: 10.1016/j.aquaculture.2008.10.055
De Mesel I., Kapasakali D., Kerckhof F., Vigin L., Lacroix G., Barbut L. (2018). Ostrea edulis restoration in the Belgian part of the North Sea: Feasibility study. Royal Belgian Institute of Natural Sciences, Operational Directorate Natural Environment. Mar. Ecol. Manage. 89.
Drinkwaard A. C. (1998). Introductions and developments of oysters in the North Sea area: a review. Helgoländer Meeresuntersuchungen 52 (3), 301–308. doi: 10.1007/BF02908904
European Union-Copernicus Marine Service (2020a). Atlantic- European North West Shelf- Ocean Biogeochemistry Reanalysis.
European Union-Copernicus Marine Service (2020b). Atlantic- European North West Shelf- Ocean Physics Reanalysis.
Flye-Sainte-Marie J., Jean F., Paillard C., Kooijman S. A. L. M. (2009). A quantitative estimation of the energetic cost of brown ring disease in the Manila clam using Dynamic Energy Budget theory. J. Sea Res. 62 (2), 114–123. doi: 10.1016/j.seares.2009.01.007
Gillies C. L., Fitzsimons J. A., Branigan S., Hale L., Hancock B., Creighton C. (2015). Scaling-up marine restoration efforts in Australia. Ecol. Manage. Restor. 16 (2), 84–85. doi: 10.1111/emr.12159
Glover A., Pogoda B., Pouvreau S., Sanderson W. G., Smyth D., Preston J. (2021). European Native Oyster Habitat Restoration Monitoring Handbook (London, UK: The Zoological Society of London).
Hademenos V., Stafleu J., Missiaen T., Kint L., Van Lancker V. R. (2019). 3D subsurface characterisation of the belgian continental shelf: a new voxel modelling approach. Netherlands J. Geosciences 98, e1. doi: 10.1017/njg.2018.18
Haelters J., Kerckhof F. (2009). Background document for Ostrea edulis and Ostrea edulis beds (OSPAR COMMISSION).
Hale R., Mac Nally R., Blumstein D. T., Swearer S. E. (2019). Evaluating where and how habitat restoration is undertaken for animals. Restor. Ecol. 27 (4), 775–781. doi: 10.1111/rec.12958
Hammar L., Perry D., Gullström M. (2015). Offshore wind power for marine conservation. Open J. Mar. Sci. 6 (1), 66–78. doi: 10.4236/ojms.2016.61007
Hemraj D. A., Bishop M. J., Hancock B., Minuti J. J., Thurstan R. H., zu Ermgassen P. S. E., et al. (2022). Oyster reef restoration fails to recoup global historic ecosystem losses despite substantial biodiversity gain. Sci. Adv. 8 (47), eabp8747. doi: 10.1126/sciadv.abp8747
Héral M., Deslous-Paoli J. M. (1991). Oyster culture in European countries. Estuar. Mar. bivalve mollusk culture, 154–190.
Hofstede R.t., Williams G., van Koningsveld M. (2023). The potential impact of human interventions at different scales in offshore wind farms to promote flat oyster (Ostrea edulis) reef development in the southern North Sea. Aquat. Living Resour. 36, 4. doi: 10.1051/alr/2023001
Houziaux J.-S., Fettweis M., Francken F., Van Lancker V. (2011). Historic, (1900) seafloor composition in the Belgian–Dutch part of the North Sea: A reconstruction based on calibrated visual sediment descriptions. Continental Shelf Res. 31 (10), 1043–1056. doi: 10.1016/j.csr.2011.03.010
Houziaux J. S., Kerckhof F., Degrendele K., Roche M., Norro A. (2008). The Hinder Banks: Yet an Important Region for the Belgian Marine Biodiversity? (Belgian Science Policy Office).
Hughes A., Bonačić K., Cameron T., Collins K., da Costa F., Debney A., et al. (2023). Site selection for European native oyster (Ostrea edulis) habitat restoration projects: an expert-derived consensus. Aquat. Conserv.: Mar. Freshw. Ecosyst. 33, 721–736. doi: 10.1002/aqc.3917
Hughes A., zu Ermgassen P. S. E. (2021). European Native Oyster Habitat Restoration Site Selection Checklist (Berlin, Germany: Native Oyster Restoration Alliance).
Kamermans P., Walles B., Kraan M., Duren L. A., Kleissen F., Have T. M., et al. (2018). Offshore wind farms as potential locations for flat oyster (Ostrea edulis) restoration in the Dutch North Sea. Sustainability 10 (3942). doi: 10.3390/su10113942
Kaskela A. M., Kotilainen A. T., Alanen U., Cooper R., Green S., Guinan J., et al. (2019). Picking up the pieces–harmonising and collating seabed substrate data for european maritime areas. Geosciences 9 (2), Article 2. doi: 10.3390/geosciences9020084
Kearney M. (2012). Metabolic theory, life history and the distribution of a terrestrial ectotherm. Funct. Ecol. 26 (1), 167–179. doi: 10.1111/j.1365-2435.2011.01917.x
Kearney M., Porter W. (2009). Mechanistic niche modelling: combining physiological and spatial data to predict species’ ranges. Ecol. Lett. 12 (4), 334–350. doi: 10.1111/j.1461-0248.2008.01277.x
Kearney M., Simpson S. J., Raubenheimer D., Helmuth B. (2010). Modelling the ecological niche from functional traits. Philos. Trans. R. Soc. B: Biol. Sci. 365 (1557), 3469–3483. doi: 10.1098/rstb.2010.0034
Kooijman S. A. L. M. (2010). Dynamic energy budget theory for metabolic organisation. doi: 10.1017/CBO9780511805400
Kotta J., Stechele B., Barboza F. R., Kaasik A., Lavaud R. (2023). Towards environmentally friendly finfish farming: A potential for mussel farms to compensate fish farm effluents. J. Appl. Ecol. doi: 10.1111/1365-2664.14422
Kregting L. T., Hayden-Hughes M., Millar R. V., Joyce P. W. S., Smyth D. M. (2020). A first record of intertidal Ostrea edulis 3D structural matrices in Strangford Lough Northern Ireland - An emergent reef? J. Sea Res. 163, 101927. doi: 10.1016/j.seares.2020.101927
Lacroix G., Maes G. E., Bolle L. J., Volckaert F. A. M. (2013). Modelling dispersal dynamics of the early life stages of a marine flatfish (Solea solea L.). J. Sea Res. 84, 13–25. doi: 10.1016/j.seares.2012.07.010
Launey S., Ledu C., Boudry P., Bonhomme F., Naciri-Graven Y. (2002). Geographic structure in the european flat oyster (Ostrea edulis l.) as revealed by microsatellite polymorphism. J. Heredity 93 (5), 331–351. doi: 10.1093/jhered/93.5.331
Liu W., Li Q., Gao F., Kong L. (2010). Effect of starvation on biochemical composition and gametogenesis in the Pacific oyster Crassostrea gigas. Fish. Sci. 76 (5), 737–745. doi: 10.1007/s12562-010-0274-y
Lown A. E., Hepburn L. J., Heywood J. L., Cameron T. C. (2021). European native oysters and associated species richness in the presence of non-native species in a southern North Sea estuary complex. Conserv. Sci. Pract. 3 (5), e361. doi: 10.1111/csp2.361
Loewe P. (2003). “Weekly north sea SST analyses since 1968,” in Hydrographie. Ed. O.d.a.h.b.B.f.S.u(D-20305 Hamburg, P.O. Box 301220, Germany).
Luyten P., Andreu-Burillo I., Norro A., Ponsar S., Proctor R. (2006). A new version of the european public domain code COHERENS. Eur. Operational Oceanography: Present Future, 474.
Martin B. T., Zimmer E. I., Grimm V., Jager T. (2012). Dynamic Energy Budget theory meets individual-based modelling: a generic and accessible implementation: DEB theory in an IBM context. Methods Ecol. Evol. 3 (2), 445–449. doi: 10.1111/j.2041-210X.2011.00168.x
Mascaro M., Seed R. (2000). Foraging behaviour of Carcinus maenas (L.): Species-selective predation among four bivalve prey. J. Shellfish Res. 19 (1), 293–300.
Mcdonald P., Ratcliff S., Guo X. (2023). FITNESS OF WILD AND SELECTED EASTERN OYSTER (CRASSOSTREA VIRGINICA) LARVAE UNDER DIFFERENT CONDITIONS. J. Shellfish Res. 42 (1), 15–21. doi: 10.2983/035.042.0102
Olsen O. T. (1883). The Piscatorial Atlas of the North Sea, English and St. George's Channels, Illustrating the Fishing Ports, Boats, Gear, Species of Fish (How, Where, and When Caught), and Other Information Concerning Fish and Fisheries. The Piscatorial Atlas of the North Sea, English and St. George’s Channels. Taylor and Francis, London. 50 Maps.
Peterson A. T. (2003). Predicting the geography of species’ invasions via ecological niche modeling. Q. Rev. Biol. 78 (4), 419–433. doi: 10.1086/378926"10.1086/378926
Peterson A. T., Robins C. R. (2003). Using ecological-niche modeling to predict barred owl invasions with implications for spotted owl conservation. Conserv. Biol. 17 (4), 1161–1165. doi: 10.1046/j.1523-1739.2003.02206.x
Pogoda B., Boudry P., Bromley C., Cameron T. C., Colsoul B., Donnan D., et al. (2020). NORA moving forward: Developing an oyster restoration network in Europe to support the Berlin Oyster Recommendation. Aquat. Conserv.: Mar. Freshw. Ecosyst. 30 (11), 2031–2037. doi: 10.1002/aqc.3447
Rodriguez-Perez A., James M., Donnan D. W., Henry T. B., Møller L. F., Sanderson W. G. (2019). Conservation and restoration of a keystone species: Understanding the settlement preferences of the European oyster (Ostrea edulis). Mar. pollut. Bull. 138, 312–321. doi: 10.1016/j.marpolbul.2018.11.032
Rullens V., Lohrer A. M., Townsend M., Pilditch C. A. (2019). Ecological mechanisms underpinning ecosystem service bundles in marine environments – A case study for shellfish. Front. Mar. Sci. 6. doi: 10.3389/fmars.2019.00409
Savina M., Lacroix G., Ruddick K. (2010). Modelling the transport of common sole larvae in the southern North Sea: Influence of hydrodynamics and larval vertical movements. J. Mar. Syst. 81 (1), 86–98. doi: 10.1016/j.jmarsys.2009.12.008
Schulte D. M., Burke R. P., Lipcius R. N. (2009). Unprecedented restoration of a native oyster metapopulation. Science 325 (5944), 1124–1128. doi: 10.1126/science.1176516
Scrucca L., Fop M., Murphy T. B., Raftery A. E. (2016). mclust 5: clustering, classification and density estimation using gaussian finite mixture models. R J. 8 (1), 289–317. doi: 10.32614/RJ-2016-021
Sillero N., Arenas-Castro S., Enriquez-Urzelai U., Vale C. G., Sousa-Guedes D., Martínez-Freiría F., et al. (2021). Want to model a species niche? A step-by-step guideline on correlative ecological niche modelling. Ecol. Model. 456, 109671. doi: 10.1016/j.ecolmodel.2021.109671
Smaal A., van Hemert G., Verhaagen M. (2022). HET OESTER BOEK, Over de magie van de oester. (Tielt, Belgium: Uitgeverij Lannoo nv).
Smaal A., Kamermans P., Kleissen F., Duren L., Have T. (2017). Flat oysters on offshore wind farms: Opportunities for the development of flat oyster populations on existing and planned wind farms in the dutch section of the north sea (Issue C052/17)).
Stavrakidis-Zachou O., Papandroulakis N., Lika K. (2019). A DEB model for European sea bass (Dicentrarchus labrax): Parameterisation and application in aquaculture. J. Sea Res. 143, 262–271. doi: 10.1016/j.seares.2018.05.008
Stechele B., Hughes A., Degraer S., Bossier P., Nevejan N. (2023). Northern Europe’s suitability for flat oyster (Ostrea edulis) reef restoration: A mechanistic niche modelling approach. Aquat. Conserv.: Mar. Freshw. Ecosyst. 33, 7. doi: 10.1002/aqc.3947
Stechele B., Maar M., Wijsman J., van der Zande D., Degraer S., Bossier P., et al. (2022). Comparing life history traits and tolerance to changing environments of two oyster species (Ostrea edulis and Crassostrea gigas) through Dynamic Energy Budget theory. Conserv. Physiol. 10 (1), coac034. doi: 10.1093/conphys/coac034
Theuerkauf S. J., Lipcius R. N. (2016). Quantitative validation of a habitat suitability index for oyster restoration. Front. Mar. Sci. 3. doi: 10.3389/fmars.2016.00064
Thomas Y., Flye-Sainte-Marie J., Chabot D., Aguirre-Velarde A., Marques G. M., Pecquerie L. (2019). Effects of hypoxia on metabolic functions in marine organisms: Observed patterns and modelling assumptions within the context of Dynamic Energy Budget (DEB) theory. J. Sea Res. 143, 231–242. doi: 10.1016/j.seares.2018.05.001
Todorova V., Micu D., Klisurov L. (2009). Unique oyster reef discovered in the Bulgarian black sea. Доклади на Българската академия на науките Comptes rendus l’Acad'emie bulgare Des. Sci. 62 (7), 871–874.
van der Spek A., Forzoni A., Vermaas T. (2022). Holocene deposits at the lower shoreface and inner shelf of the Dutch coast. Ocean Coast. Manage. 224, 106203. doi: 10.1016/j.ocecoaman.2022.106203
Visser A. W. (1997). Using random walk models to simulate the vertical distribution of particles in a turbulent water column. Mar. Ecol. Prog. Ser. 158, 275–281. doi: 10.3354/meps158275
Walne P. R. (1961). Observations on the mortality of ostrea edulis. J. Mar. Biol. Assoc. United Kingdom | Cambridge Core. Observ. Mortal. Ostrea Edulis 41 (1), 113–122. doi: 10.1017/S0025315400001569
Walters D., Boutle I., Brooks M., Melvin T., Stratton R., Vosper S., et al. (2017). The met office unified model global atmosphere 6.0/6.1 and JULES global land 6.0/6.1 configurations. Geosci. Model. Dev. 10 (4), 1487–1520. doi: 10.5194/gmd-10-1487-2017
zu Ermgassen P., Bonacic K., Boundry P., Bromley C., Cameron T., Colcoul B., et al. (2020). “Forty questions of importance to the policy and practice of oyster restoration in Europe,” in Aquatic Conservation: Marine and Freshwater Ecosystems, vol. 30/11. (Wiley Online Library), 2038–2049. doi: 10.1002/aqc.3462
Keywords: European flat oyster, habitat suitability, Ostrea edulis, habitat restoration, species distribution, larvae dispersal, dynamic energy budget
Citation: Stechele B, Barbut L, Lacroix G, van Duren LA, Van Lancker V, Degraer S, Gavazzi GM, Bossier P, Declercq AM and Nevejan N (2023) Northern Europe’s suitability for offshore European flat oyster (Ostrea edulis) habitat restoration based on population dynamics. Front. Mar. Sci. 10:1224346. doi: 10.3389/fmars.2023.1224346
Received: 17 May 2023; Accepted: 17 August 2023;
Published: 07 September 2023.
Edited by:
Iñigo Muxika, Technological Center Expert in Marine and Food Innovation (AZTI), SpainReviewed by:
Anamarija Frankic, University of Zadar, CroatiaKeith Walters, Coastal Carolina University, United States
Norbert Dankers, Retired, Netherlands
Copyright © 2023 Stechele, Barbut, Lacroix, van Duren, Van Lancker, Degraer, Gavazzi, Bossier, Declercq and Nevejan. This is an open-access article distributed under the terms of the Creative Commons Attribution License (CC BY). The use, distribution or reproduction in other forums is permitted, provided the original author(s) and the copyright owner(s) are credited and that the original publication in this journal is cited, in accordance with accepted academic practice. No use, distribution or reproduction is permitted which does not comply with these terms.
*Correspondence: Brecht Stechele, YnJlY2h0LnN0ZWNoZWxlQGhvdG1haWwuY29t