 Robert L. Jenkins III
 Davina L. Passeri
 Christopher G. Smith
 David M. Thompson
 Kathryn E. L. Smith
- St. Petersburg Coastal and Marine Science Center, U.S. Geological Survey, St. Petersburg, FL, United States
The effects of interior headland restoration on estuarine sediment transport processes were assessed through process-based numerical modeling. Three proposed interior headland restoration scenarios in the Grand Bay estuary (Mississippi/Alabama) were modeled using Delft3D to understand impacts on suspended sediment concentrations, bed level morphology, and sediment fluxes under present-day conditions and a sea level rise (SLR) of 0.5 m, representing a high projection of SLR by the year 2050. Model results showed localized differences in bed levels near the restored features after a year of simulated morphologic change. The restored headland features acted as a sediment source to the immediate surroundings while also providing some non-significant sheltering effect of backshore shoals and marsh shorelines. Sediment fluxes were sensitive to wind directions and the presence of the restored headlands. However, regardless of wind direction, mean sea level, or restoration action, the greatest sediment fluxes were always export fluxes from the estuary, which were further increased with increased sea level. Suspended sediment concentrations were highly influenced by SLR in a non-linear manner. Sediment concentrations both increased and decreased depending on depth under SLR. Furthermore, SLR allowed for the suspension and deposition of sediments on the marsh platform. Overall, the influence of SLR was more impactful to changing sediment dynamics than the influence of the restoration features.
1 Introduction
Sediment processes impact strategic coastal management interests including restoration decisions, dredging, habitat suitability, aquaculture, and submerged aquatic vegetation. Barring anthropogenic influence, tide and wave dynamics govern the fate and transport of sediments and the subsequent morphologic evolution of coastal systems. In estuaries, sediment transport potential varies with local bathymetry, bottom friction, and tidal asymmetries (Leonardi et al., 2019). Sea level rise (SLR) can alter tidal hydrodynamics and resultant sediment transport particularly along low-gradient coastlines like the northern Gulf of Mexico (Passeri et al., 2015). The effects of SLR often result in increased tidal ranges, tidal velocities, and changes in flood and ebb dominance, which impact net sediment input and output in estuaries (French, 2008; Leorri et al., 2011; Pickering et al., 2012; Hall et al., 2013; Pelling et al., 2013; Valentim et al., 2013; Arns et al., 2015; Passeri et al., 2016). SLR has been associated with increases in tidal prism (Xie et al., 2022). Increases in tidal prisms can lead to higher net sediment fluxes, which, in turn, alters bed level (Leonardi et al., 2019). Increases in flood currents under higher sea levels may resuspend sediment from the bed and deposit it onto the marsh platform, while increases in ebb currents and bottom shear stresses erode sediment and transport it out of the system (Zhang et al., 2019); this effect is, in some instances, more significant for sand fractions than mud fractions (Zhang et al., 2020), where mud fractions may be deposited on and retained by the marsh.
The ecology of these systems can be adversely impacted by changes in sediment processes. Tidal inundation and sediment supply govern salt marsh productivity (Alizad et al., 2018; Ganju et al., 2019). An increase in tidal inundation can be beneficial for sediment storage in salt marshes if sediment is available; however, an increase in tidal prism and current velocities can cause erosion of bed sediments in tidal flats and channels (Zhang et al., 2020). Increased inundation on tidal flats threatens habitats for birds and shellfish (Field et al., 2017), whereas increased water depths and suspended sediment concentrations affect light availability and benthic production, as well as the growth of submerged aquatic vegetation (Lawson et al., 2007). Management of coastal systems through restoration of natural and nature-based features (NNBF) can help to mitigate adverse effects while providing benefits such as restored ecosystem habitats and reduced flooding and shoreline erosion (Sutton-Grier et al., 2015; DeAngelis et al., 2020; Palinkas et al., 2022). Sediment is a critical natural resource with applications in coastal system restoration (Parson and Swafford, 2012; Miselis et al., 2021), habitat restoration/creation using dredge spoil (Parson and Swafford, 2012), and shoreline nourishment (Suedel et al., 2021). Creation of living shorelines can help reduce lateral erosion in marshes by dampening wave energy (e.g., Polk et al., 2022). However, given the dynamic nature of NNBF, there is uncertainty in the effectiveness and resilience of restored features (Davis et al., 2021). For example, in some cases, shoreline protection strategies that are meant to prevent marsh edge erosion can hamper the marsh’s ability to accrete or starve other components of the system of regularly supplied sediment (Ganju, 2019).
Assessing the impacts of proposed restoration actions on present-day and future coastal system dynamics requires detailed observations and complex predictive models. Integrating sediment transport modeling into early phases of restoration planning aids in identifying where and under what conditions restoration will most likely be successful (Ganju, 2019). Process-based numerical models such as Delft3D are used to simulate hydrodynamics, sediment transport, and resulting morphological evolution in estuarine and coastal environments (Leonardi et al., 2019; Zhang et al., 2019; Zhang et al., 2020). This allows for detailed physics-based assessments of how natural and human drivers including restoration actions and SLR may impact estuarine physical processes to help inform management decision-making. This paper presents a companion study to Passeri et al. (2023) and focuses on the impacts of a proposed large-scale restoration effort, namely, interior headland restoration, on sediment transport and morphological evolution in a marine-dominated, open-coast estuary in Grand Bay, Alabama (AL) and Mississippi (MS). A large-scale numerical Delft3D model is used to simulate cohesive and non-cohesive sediment transport and resulting bed level change, with and without the proposed restoration over annual timescales and fair-weather conditions. The results of the study provide insight into how large-scale restoration alters the physical estuarine processes and morphology of the estuary under present-day conditions as well as higher sea levels.
2 Methodology
2.1 Study domain
The Grand Bay estuary (Figure 1) is located within the Mississippi Sound at the border of Mississippi and Alabama in the northern Gulf of Mexico and contains three bays: Point aux Chenes Bay (MS), Middle Bay (AL), and Grand Bay (AL) surrounded by an extensive salt marsh system. The bays are shallow with average water depths ranging from 0.5 m to 3.0 m (Peterson et al., 2007). The estuary currently does not have a fluvial source and is primarily driven by the hydrodynamics of the Mississippi Sound and local wind-driven water level setup (Nowacki and Ganju, 2020). The estuary contains habitats for a variety of marine life including shrimp, crabs, and oysters (Eleuterius and Criss, 1991) and is one of the few remaining extensive coastal marsh environments in Mississippi (O'Sullivan and Criss, 1998). Since the mid-1800s, high rates of shoreline erosion [between −0.50 m/year and −3.39 m/year (Terrano, 2018)] have led to the degradation of interior headlands within the estuary including Grand Batture Island, Isles aux Dames, and Marsh Island. Coastal managers have explored avenues to increase estuarine resilience including the beneficial use of dredged sediments to reconstruct the interior headlands on the Alabama side of the estuary. However, management decision-making relies on scientific evaluations to understand the impacts of large-scale restoration efforts on broader estuarine sediment transport patterns to ensure against adverse impacts to the ecology of the system.
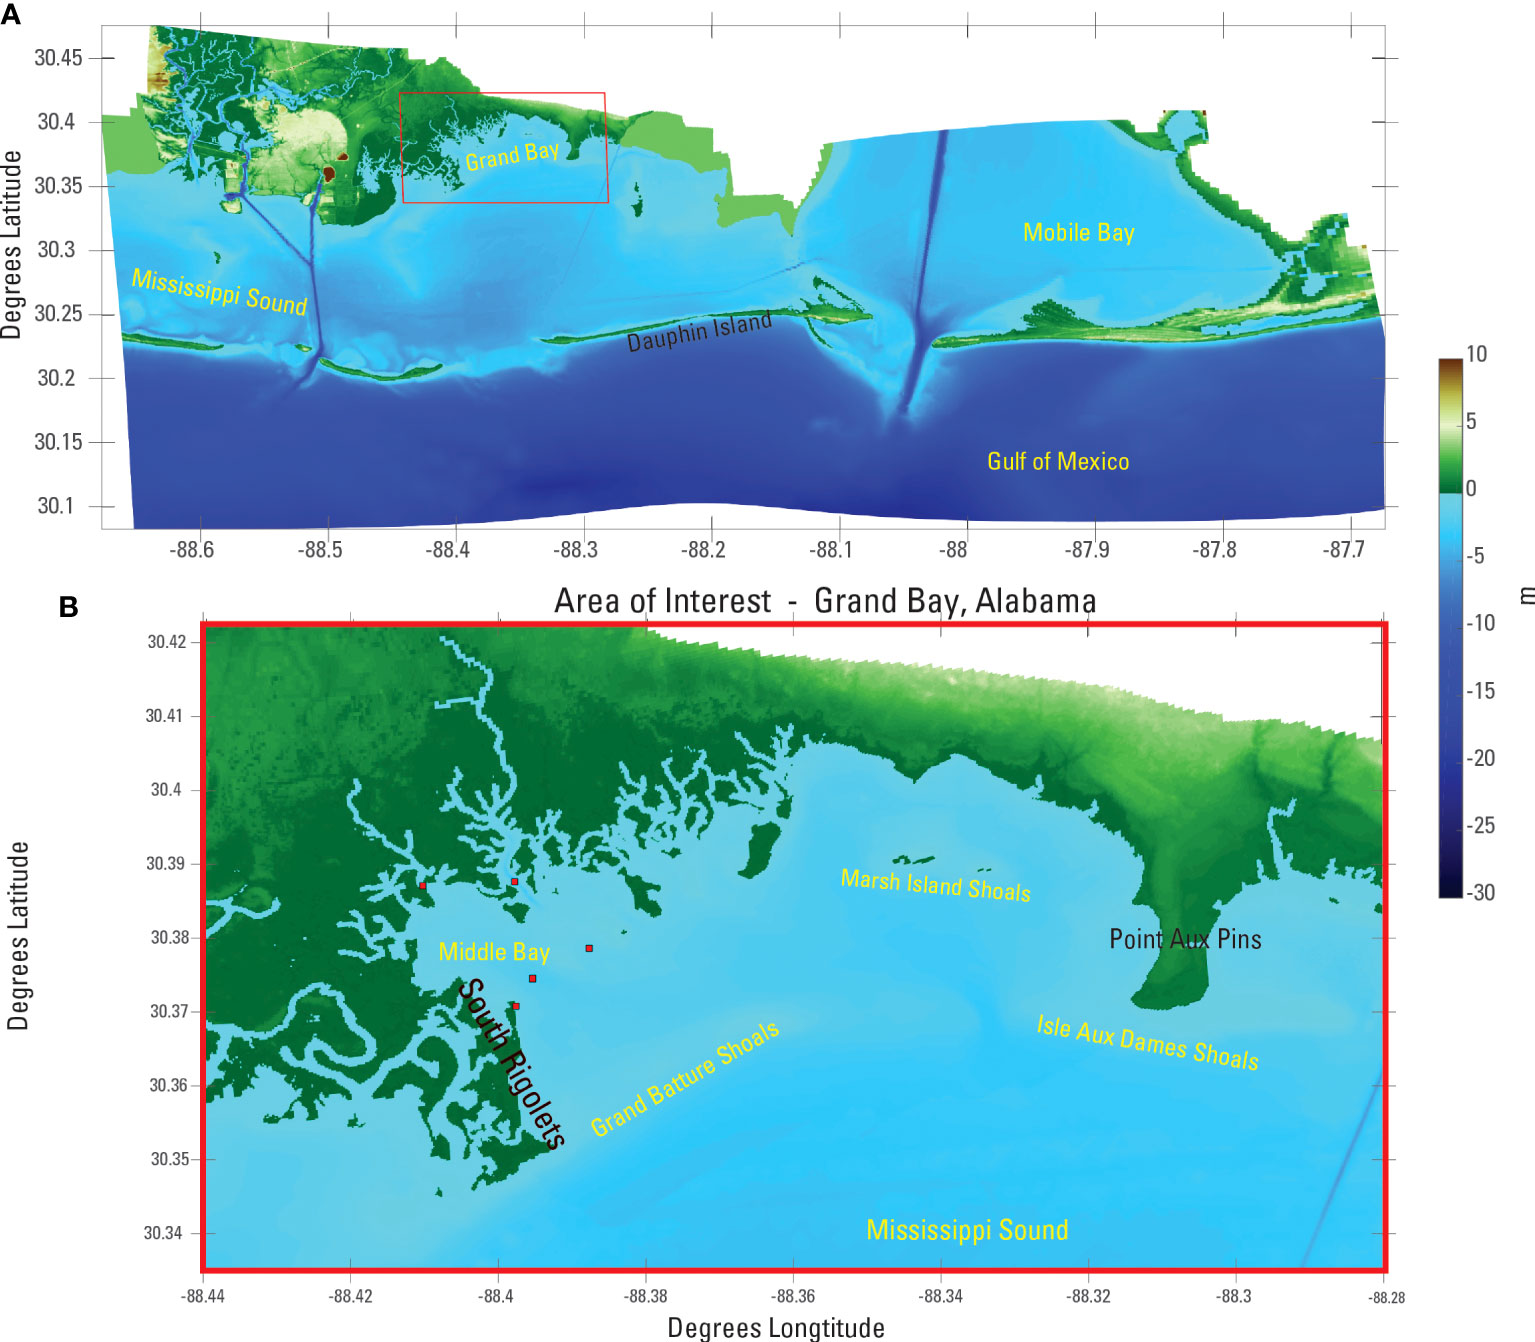
Figure 1 Delft3D model domain and modeled elevations (A). Color bar in meters. The red outlined area in (A) demarcates Grand Bay from the broader model domain, and is shown with greater detail in (B). Red squares in Middle Bay give the locations of wave and water level sensors used for model validation. Relevant landforms (South Rigolets and Point Aux Pins) are labeled in black, while bodies of water (Middle Bay, Mississippi Sound, Mobile Bay, and Gulf of Mexico) and sub-aqueous shoals (Isle Aux Dames, Grand Batture, and Marsh Island Shoals) are labeled in yellow.
2.2 Model description
Delft3D is an integrated modeling software system capable of simulating hydrodynamics, waves, sediment transport, and morphological evolution using a suite of modules that can be coupled in a variety of configurations (Lesser et al., 2004). Delft3D is commonly applied in coastal, estuarine, and riverine environments. The Delft3D-FLOW module (Deltares, 2018a) solves the nonlinear shallow water equations for incompressible free surface flows in two (depth-integrated) or three dimensions. The Delft3D-WAVE module with SWAN (Deltares, 2018b) solves the spectral action density equation and computes wave radiation stresses and gradients that drive nearshore circulation. When coupled with the FLOW module, the WAVE module accounts for the effects of water level variations and wave–current interaction processes such as frequency shifting. The sediment transport module solves for suspended and bed load transport of non-cohesive sediments (i.e., sand), and for suspended load transport of cohesive sediments (i.e., mud). Transport of suspended sediment is calculated by solving the mass-balance equation, accounting for mass concentration, eddy diffusivity, hindered settling velocity, and flow velocities. Flux of sediments to or from the bed layer as deposition or erosion accounts for wave- and flow-driven bed shear stresses. The model also accounts for the interaction of different sediment classes. Spatially varying, depth-dependent, bed friction coefficients may also be specified, further influencing bed shear stresses. Finally, the sediment transport module evolves bed morphology based on mass fluxes between suspended and bed load sediments. More detailed information on the Delft3D model is provided in Lesser et al. (2004).
2.3 Model setup and initial conditions
For this study, three computation grids were developed: a FLOW grid and two WAVE grids. The FLOW module uses a curvilinear grid with 1,850 × 850 rectangular grid cells. The east–west extent of the FLOW domain ranges from Mobile Bay, AL to Horn Island, MS to capture the hydrodynamics of the eastern Mississippi Sound (Figure 1A). The domain is bounded by the Escatawpa River to the north, including parts of Mobile Bay and the Pascagoula River, and extends to the 15–20 m depth contour offshore in the Gulf of Mexico (Figure 1A). We model this broader area to capture remote influences on Grand Bay, as well as the local forcing, while avoiding shadow zones or edge effects in Grand Bay itself. The alongshore FLOW grid resolution varies from 50 to 100 m along the offshore barrier islands and upwards of 200 m near the eastern boundary. Higher resolution on the order of 10 m and 15 m in the alongshore and cross-shore directions, respectively, is incorporated into the Grand Bay estuary. This adequately resolves boundary forcing and flow through the channels between the offshore barrier islands, while being fine enough to resolve sediment transport and morphology change in Grand Bay (Figure 1B).
The WAVE module uses two grids: a coarse outer wave grid and a fine nested inner wave grid. The outer wave grid domain matches that of the FLOW grid, although it is five times less resolved than the FLOW grid, to allow stable computation at reduced computational cost. This grid is used to propagate the wave forcing at the boundary into the domain. The inner wave grid covers Grand Bay and the Pascagoula region, with cross-shore resolution matching that of the FLOW grid and alongshore resolution half as resolved as the FLOW grid. Previous work has shown that this is sufficient to capture alongshore sediment transport due to wave action (Jenkins et al., 2020).
The model was initialized using a digital elevation model (DEM) circa 2015 to represent the existing bathymetry of the region. The DEM was derived by combining the Coastal National Elevation Database (CoNED) topobathymetric DEM for Mobile Bay (Danielson et al., 2013) and the National Geophysical Data Center (NGDC) coastal DEM (National Geophysical Data Center, N. E. S., Data, and Information Service, 2009). The NGDC coastal DEM covers the full extent of the modeling domain and was used primarily for offshore regions that were not included in the CoNED DEM, which contains more recent lidar elevations in the coastal areas. Bathymetry in Grand Bay was updated with two DEMs derived from single-beam surveys in 2017 and 2021 (DeWitt et al., 2017; Stalk et al., 2021). To correct for known biases in lidar data within marshes, an elevation correction based on biomass density was used to lower the marsh platform in the DEM and more accurately capture wetting and drying in the model (Medeiros et al., 2015; Alizad et al., 2018; Alizad et al., 2020).
Sediment classes, or sediment fractions, are the ranges of sediment types and sizes that the user can supply to the sediment transport module. Each sediment class is parameterized with the following required information: sediment type (cohesive or non-cohesive), median sediment diameter (d50), specific density, and dry bed density. Additional parameters are required in the case of cohesive sediments including saline and fresh water settling velocities. For this study, five sediment fractions were used to describe spatially varying sediment classifications within the estuary. These sediment fractions were parameterized based on grain size data for surficial sediment samples collected within Grand Bay. The geographic location, type of sampling device, and physical setting, at time of collection, have been previously reported in Marot et al. (2019). Each sample represents sediment generally collected within the uppermost 2 cm of the seabed. The raw form of the analytical grain size data summarized in Marot et al., 2019 were analyzed using AnalySize Toolbox for Matlab ©; the toolbox implements an unmixing algorithm to characterize sediment endmembers. The grain size frequency data (92 bins) for 100 estuarine seabed sediment samples from the Grand Bay region were analyzed using the unmixing algorithm. The algorithm is a constrained minimization problem, requiring a defined number of endmembers. We analyzed between three and seven endmembers, each described by three parameter General Weibull (Paterson and Heslop, 2015). Full dataset-based R-squared and angular deviation were computed for each unmixing scenario (i.e., determined by the preset number of endmembers) and presented in scree plots to aid in evaluating performance and optimal endmember numbers.
For the constrained evaluation of between three and seven endmembers, it was determined that five endmembers provided the best fit [quantitively effective (r-squared) and efficient (Δ(r-squared)) description of all samples]. The five endmembers included two mud endmembers with d50’s of 13 µm and 48 µm (modeled as cohesive sediment) and three sand endmembers with d50s of 100 µm, 136 µm, and 273 µm (modeled as non-cohesive sediment). Outside of Grand Bay, medium sand (d50 = 273 µm) was applied as the seabed size class. Additionally, spatially varying bed friction (Chezy) coefficients were parameterized based on depth and land use/land cover to capture differences in roughness between open water, marshes, and sandy islands/shoals.
A “mormerge” approach (Roelvink, 2006) of Delft3D is applied in this study as the goal was to assess changes in sediment transport during fair weather conditions over annual timescales. This configuration of the model uses multiple simulations that are run simultaneously with identical initial bed conditions but with unique wave and wind forcings. Each simulation is assigned a weight according to the percent occurrence of the wave and wind conditions from a wave/wind climatological assessment. At each half model time step, the present bathymetry from each of the simulation bins is combined using a weighted average to form a new shared bathymetry that is passed back to each simulation and applied as the bathymetry for each of the condition for the next time step. The cumulative effect is a computationally efficient way to perform longer-term (i.e., annual to decadal) morphological predictions. In this study, mormerge is applied for a 1-year simulation of hydrodynamics and sediment transport using a morphological acceleration factor of 365 (Jenkins et al., 2020). This morphological acceleration factor along with the mormerge configuration reduces computation time, allowing for 30 h of simulation time to capture 1 year of morphological evolution, which includes 6 h for model spin up before morphological evolution begins, following methods of Jenkins et al. (2020).
2.4 Boundary forcing
The mormerge approach requires a representative wave and wind climatology for model forcing. The combined wave and wind forcing was developed using output from the NOAA Wave Watch III (WW3) Hindcast and reanalysis archive (https://polar.ncep.noaa.gov/waves/hindcasts/). Significant wave height (), peak wave period (), mean wave direction (Dm), and wind velocities (u, v) from February 2005 through May 2019 from a WW3 grid point near the offshore boundary of the model domain were obtained. A modified version of the Energy Flux Method of Benedet et al. (2016) was utilized to derive a binned wind/wave climatology for the region. Rather than basing the climatology on the notion of equal wave energy flux bins as per Benedet et al. (2016), we binned the data in equal wind energy bins. This approach was taken as we assume that the wind-generated waves and currents within Mississippi Sound and Grand Bay are the dominant drivers of sediment transport there while very little wave energy from the Gulf of Mexico (i.e., at the model southern boundary) makes it into the estuary to drive forcing. The wind climate was divided into 18 bins, 6 directions, and 3 velocities, and then each bin was then defined by the wind energy. The associated mean wind direction, , , and Dm were then extracted from each bin.
Each of the 18 wind climate bins provides a wind speed and direction (nautical convention), which are applied to the model as spatially and temporally uniform wind field forcing. Deflt3D-FLOW and WAVE modules share wind forcing information, as well as bed levels, water levels, and flow velocities with a coupling interval of 180 min. The characteristic wave variables of each climate bin are applied to the WAVE model as JONSWAP spectral wave parameters along the southern open boundary, along with a 1D-SWAN derived spectral boundary conditions at the lateral boundaries following methods of Jenkins et al. (2020).
In addition to the wave forcing, tidal harmonic forcing was also applied to represent the “morphological tide” at the model boundaries to generate current velocities and morphological change associated with the neap-spring tide cycle. The morphological tide was calculated following the method of Lesser (2009), which is applicable in locations where the lunar diurnal K1 and O1 tidal constituents substantially contribute to the tidal signal, as is the case in the study domain. Tidal constituent amplitudes and phases were obtained from the National Oceanic and Atmospheric Administration (NOAA) tide gage (#8735180) at the eastern end of Dauphin Island and used to generate the amplitude and phases of the morphological tide. These were applied at the southern open boundaries of each Delft3D simulation, while lateral boundaries were treated with Neumann boundary conditions. Table 1 gives tidal amplitude, phases, and frequencies of the harmonic tidal constituents used in this study.
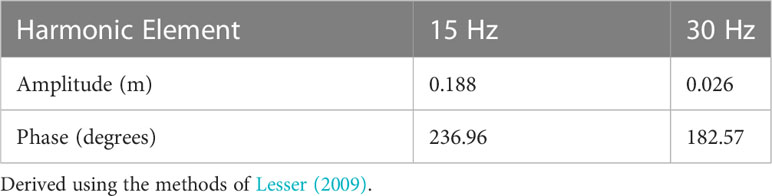
Table 1 Tidal amplitude, phases, and frequencies applied as harmonic water level forcing to the southern open boundary.
2.5 Restoration alternatives and sea level scenarios
Three restoration alternatives were considered: (1) no-action (no restoration takes place, and the system evolves naturally, herein referred to as R0 (Figure 2A)); (2) reconstruction of the Grand Batture Island (GBI) (herein referred to as R1 or Grand Batture only (Figure 2B)); and (3) reconstruction of Grand Batture Island, Isle aux Dames (IAD), and Marsh Island (MI) (herein referred to as R2, or All-Islands (Figure 2C)). The reconstructed islands and headlands are sandy features that are low in elevation (less than 1 m) (Figure 2). The restored footprint covers the historic (circa 1848) shoreline positions as they existed in the Alabama side of the estuary.
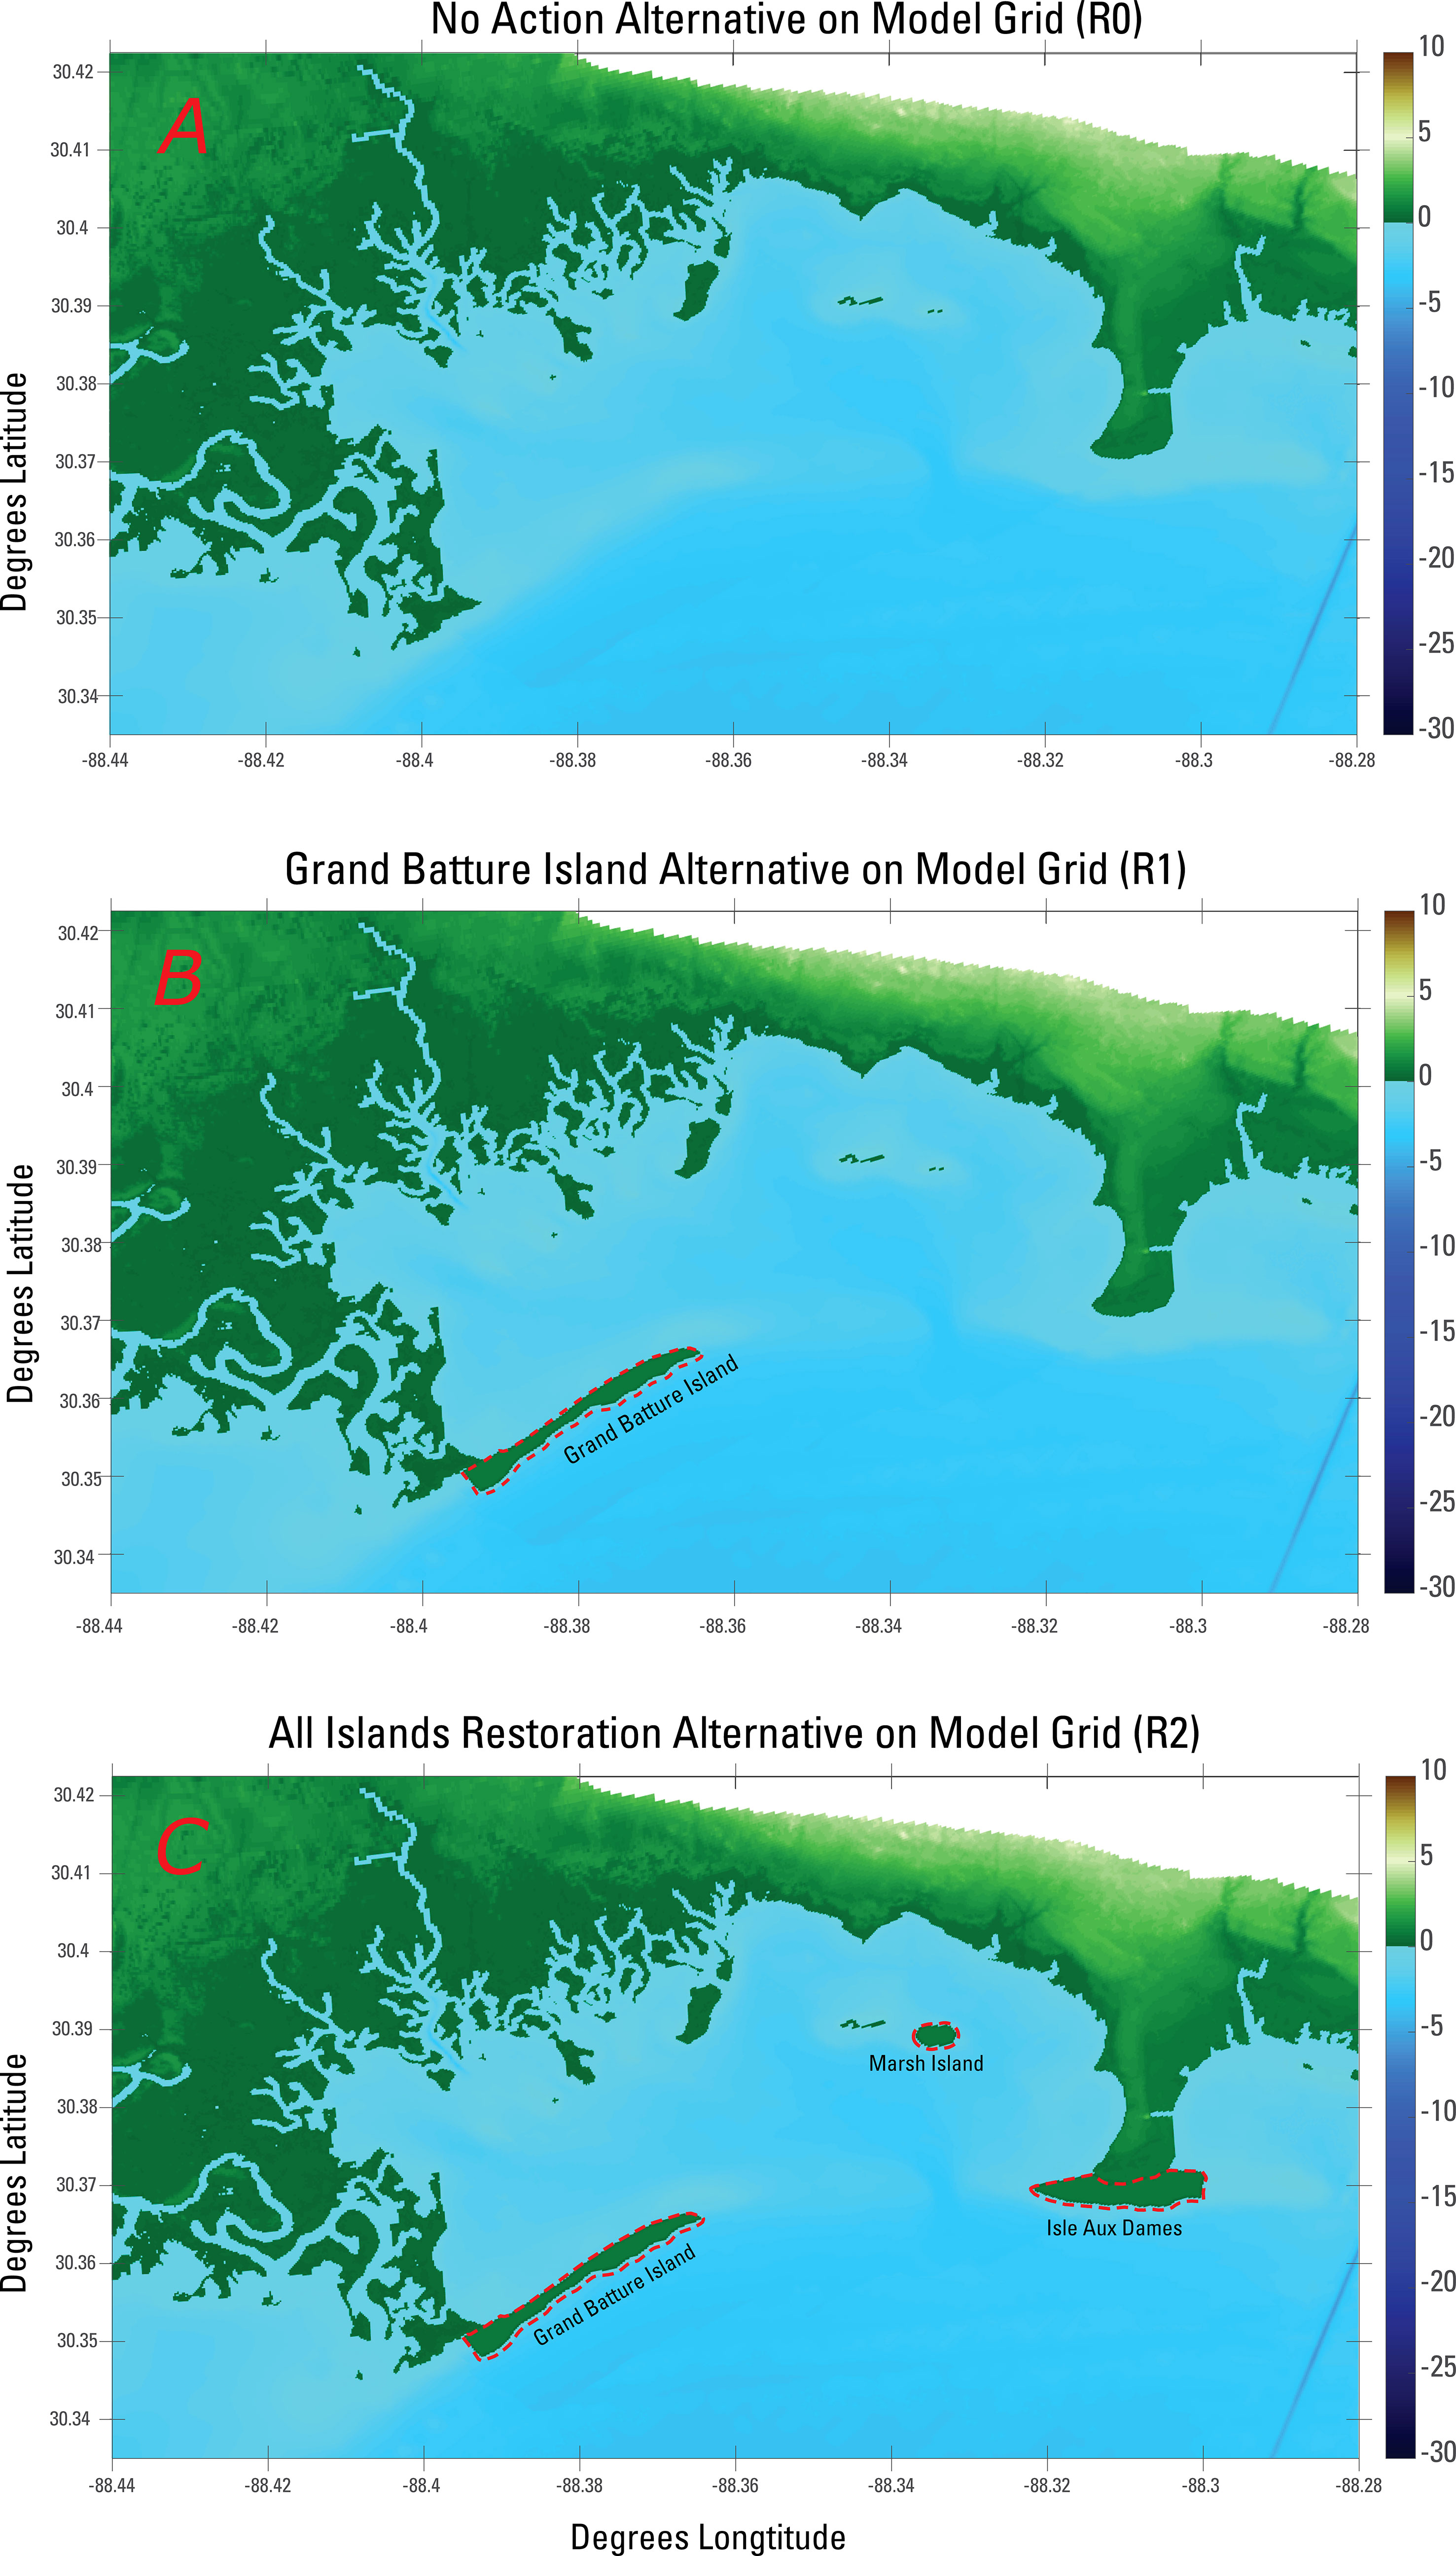
Figure 2 Elevation of restoration alternatives on Model Grid: R0 represents the no-action scenario (A), R1 represents the Grand Batture Island only scenario (B), and R2 represents the Grand Batture Island, Marsh Island, and Isle aux Dames scenario (C). Red dashed lines indicate the total sub-aerial and sub-aqueous footprint of each restored feature. Color bar in meters.
In addition to no sea level change (SL0), an SLR of 0.5 m (herein referred to as SL1) was also considered to assess the impacts of SLR on estuarine sediment transport with and without the restoration alternatives. This amount of SLR corresponds to a high projection of SLR by the year 2050 (Sweet et al., 2022). The addition of SLR was not meant to forecast a future state of the estuary, but rather to understand the behavior of the restoration alternatives and sediment transport patterns under a higher mean sea level. SLR was included by increasing water levels by 0.5 m. Inundation of the present-day marsh shoreline was allowed by this increased sea level but, as it was not the focus of this study, not allowed to dynamically respond to SLR prior to the start of the simulation. Sediments on the marsh platform were parameterized as coarse sand (d50 = 273 µm) with high settling velocities and thus are not treated as a sediment source to the estuary and bay in this analysis (i.e., we assumed a static bathymetry while assessing the effects of higher water levels on sediment dynamics). There were a total of six scenarios (three restoration: R0, R1, and R2; two sea levels: SL0 and SL1) that were simulated for the restoration assessment.
2.5.1 Data analysis methodologies
As a strict sediment balance, or sediment budget, is not well defined from the output of a Delft3D mormerge simulation, a representative value of suspended sediment concentrations is derived. Spatially varying suspended sediment concentrations () are output at each hour of model runtime. A weighted sum of time-averaged total suspended sediment concentration () (mg/L) is derived from the probabilistic model runs for each alternative, herein referred to as a “cumulative total suspended sediment concentration” (). From each individual forcing bin, a is calculated as the sum of the suspended concentrations of each sediment class (Equation 1). A time average of this is then taken for each individual bin over the model run period. Finally, a weighted sum of the time-averaged () values is calculated across all forcing conditions, which applies the “frequency of occurrence” (Table 2) associated with each bin as a weighting factor, thus producing a weighted sum of time-averaged total suspended sediment () (Equation 2). This value should be interpreted as rather a representative concentration that allows comparison of changes in sediment concentrations due to the presence of restoration alternatives and should not be taken as an in situ sediment budget for the region.

Table 2 Climatological forcing bins and associated forcing parameters for winds and waves.
where is the number of sediment classes.
where is the number of forcing bins, and is the frequency of occurrence, associated with each bin.
Morphological evolution is evaluated as a simple difference between the model end-state bed level (), and model initial bed level (), herein referred to as , as given by Equation 3.
Maps of show deposition (positive values) and erosion (negative values) for a given scenario. When considering the relative difference in end-state bed levels between any two scenarios, this is denoted as
Maps of show where the end state of one scenario is shallower (positive values) or deeper (negative values) than the end state of another scenario.
Cumulative sediment fluxes were output through seven observational cross-sections within and bounding the Grand Bay estuary (C1 through C7 in Figure 3). Cumulative suspended sediment fluxes represent the sum-over-time of sediment fluxes for each sediment class. The fluxes of all sediment classes are considered together for the purpose of understanding net sediment import and export across the estuary. Small values may indicate small or oscillating fluxes through a cross-section and the sign indicates the direction of flux through the cross-section based on the cardinal orientation (positive: east or north; negative: west or south). In this analysis, we consider a Total Cumulative Sediment Flux (), which sums the cumulative suspended sediment flux of all sediment fractions present.
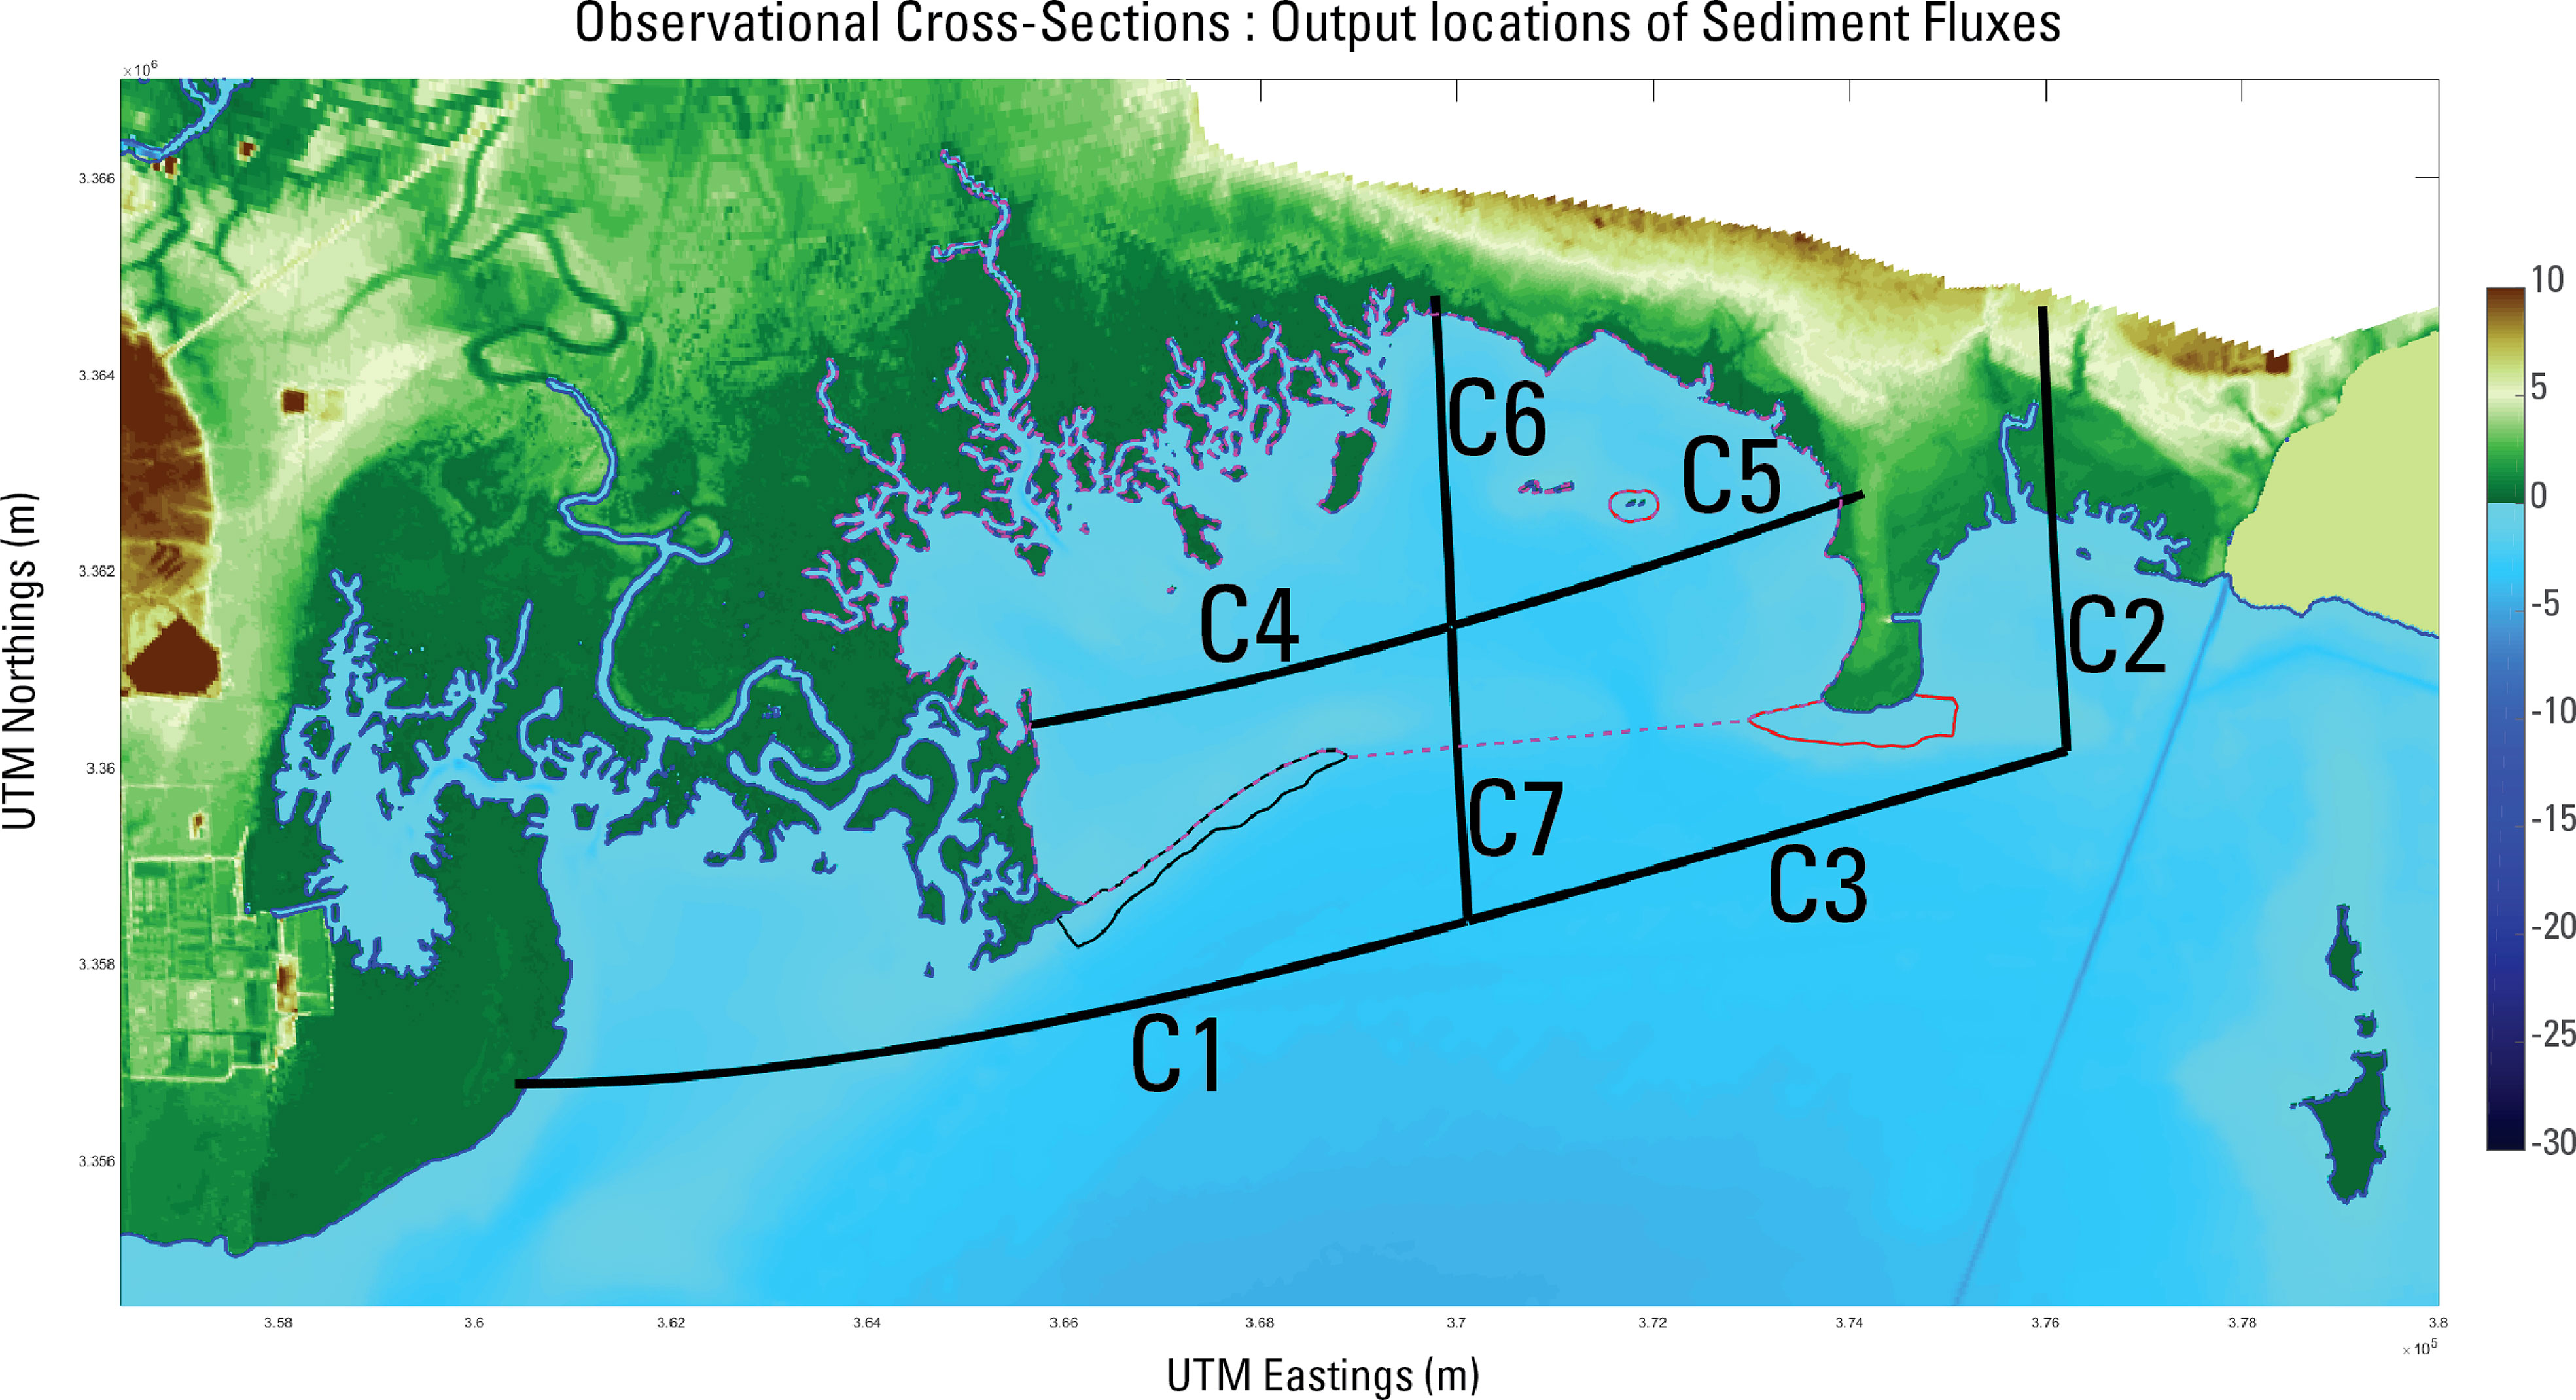
Figure 3 Observational output cross-sections in model domain, plotted over model DEM. Contours show the shorelines of each restoration scenario. R0 in blue, R1 in black, and R2 in red. The magenta dashed line shows the area considered as within Grand Bay and the estuary, for mean values presented in Table 3.
While , , and provide insight into changes in sediment transport patterns spatially, average values across the estuary are understood to be the simple arithmetic mean of all points within the dashed magenta line also given in Figure 3. The changes in sediment transport are examined relative to changes in hydrodynamic output such as significant wave height () and orbital velocity (). These outputs have also been processed according to Equation 2 to produce a representative value over the entire climatology for each scenario (i.e., they are also represented as weighted sums of time-averaged values).
3 Results
3.1 Hydrodynamic model validation
A deterministic hindcast was performed to compare modeled and observed water levels and directional waves in the estuary collected from 3 January 2017 to 23 January 2017 (Nowacki et al., 2018). Delft3D was forced with astronomic tidal water levels from a previously validated large-scale ADCIRC model (Passeri et al., 2016), and waves and winds from Wave Watch III. Astronomic tides in ADCIRC were simulated for 45 days beginning from a cold start (i.e., all quantities set to zero at initialization) with a 10-day time hyperbolic tangent ramp function. The ADCIRC model was forced with water surface elevations of eight harmonic constituents (K1, O1, M2, S2, N2, K2, Q1, and P1) along the open ocean boundary (Egbert et al., 1994; Egbert and Erofeeva, 2002). Hourly time series of water levels were output at the locations of the open-ocean boundary nodes of the Delft3D model to use as forcing. Wave Watch III 6-hourly waves and winds were extracted at a location nearest to the offshore Delft3D boundary and applied as time-varying parametric (TPAR) boundary forcing. Sediment and morphological processes were included as described in the Model setup and initial conditions section above. The Delft3D model was spun up for 12 h before the first observation.
Modeled water levels and significant wave heights were compared with observations collected at five stations located within Grand Bay over the 3–23 January 2017 period (Nowacki et al., 2018). Time-series comparison shows good agreement in matching the phase of water levels at all stations, although there is some disagreement in the peaks around 7–9 January when there was a significant drop in the observed water levels. This disagreement is likely due to the coarse resolution (spatial and temporal) of the Wave Watch III winds, which may not be resolving local wind effects affecting water levels in the estuary. Overall, the average root mean square error (RMSE) of the water level elevations was 0.18 m. Comparison of significant wave heights also indicates good agreement in the general magnitude and timing of waves, particularly in an estuarine environment with small wave heights (<0.30 m). The average RMSE for significant wave height was 0.07 m. Although there are no observed data to compare bed levels or sediment transport parameters, the hydrodynamic validation indicates that the model reproduced water levels and waves within the estuary well. Validation period model output is publicly available as a U.S. Geological Survey data release (Jenkins et al., 2023).
3.2 Assessment of alternatives
3.2.1 Suspended sediment concentrations
A baseline of produced by SL0R0 is given by Figure 4A. The greatest values of are found near shoals and along shorelines, with the highest concentration of sediments on the Grand Batture shoals (35 to 50 mg/L) and hot spots of 30–45 mg/L in the areas of open water along the Grand Bay marsh shoreline and South Rigolets shoreline, and shoals west of Marsh Island. in the upper and lower portions of Middle Bay ranges from 10 to 25 mg/L and from 5 to 20 mg/L, respectively. Along the Point aux Pins shoreline, nearshore is between 10 and 25 mg/L. Values along the northern marsh shoreline fall in this 10–25 mg/L range as well. On Isle Aux Dame Shoals, and in the southern reaches of Grand Bay, the estuary joins the Mississippi Sound ranges from 5 to 20 mg/L. It is important to note that this representative weighted-average calculation of does indicate regions with zero, or near-zero, sediment concentrations, which appear in the deeper regions of Grand Bay, Middle Bay, and further south in the Mississippi Sound. These very small values of are representative of the model initial concentrations (zero for all sediment fractions) and the relatively short simulation period. All concentrations represent just those sediments that are suspended by the processes of this simulation, though time averaged and weighted by frequency of occurrence, with no obfuscation by background concentrations. Model output was made publicly available as part of a U.S. Geological Survey data release (Jenkins et al., 2023).
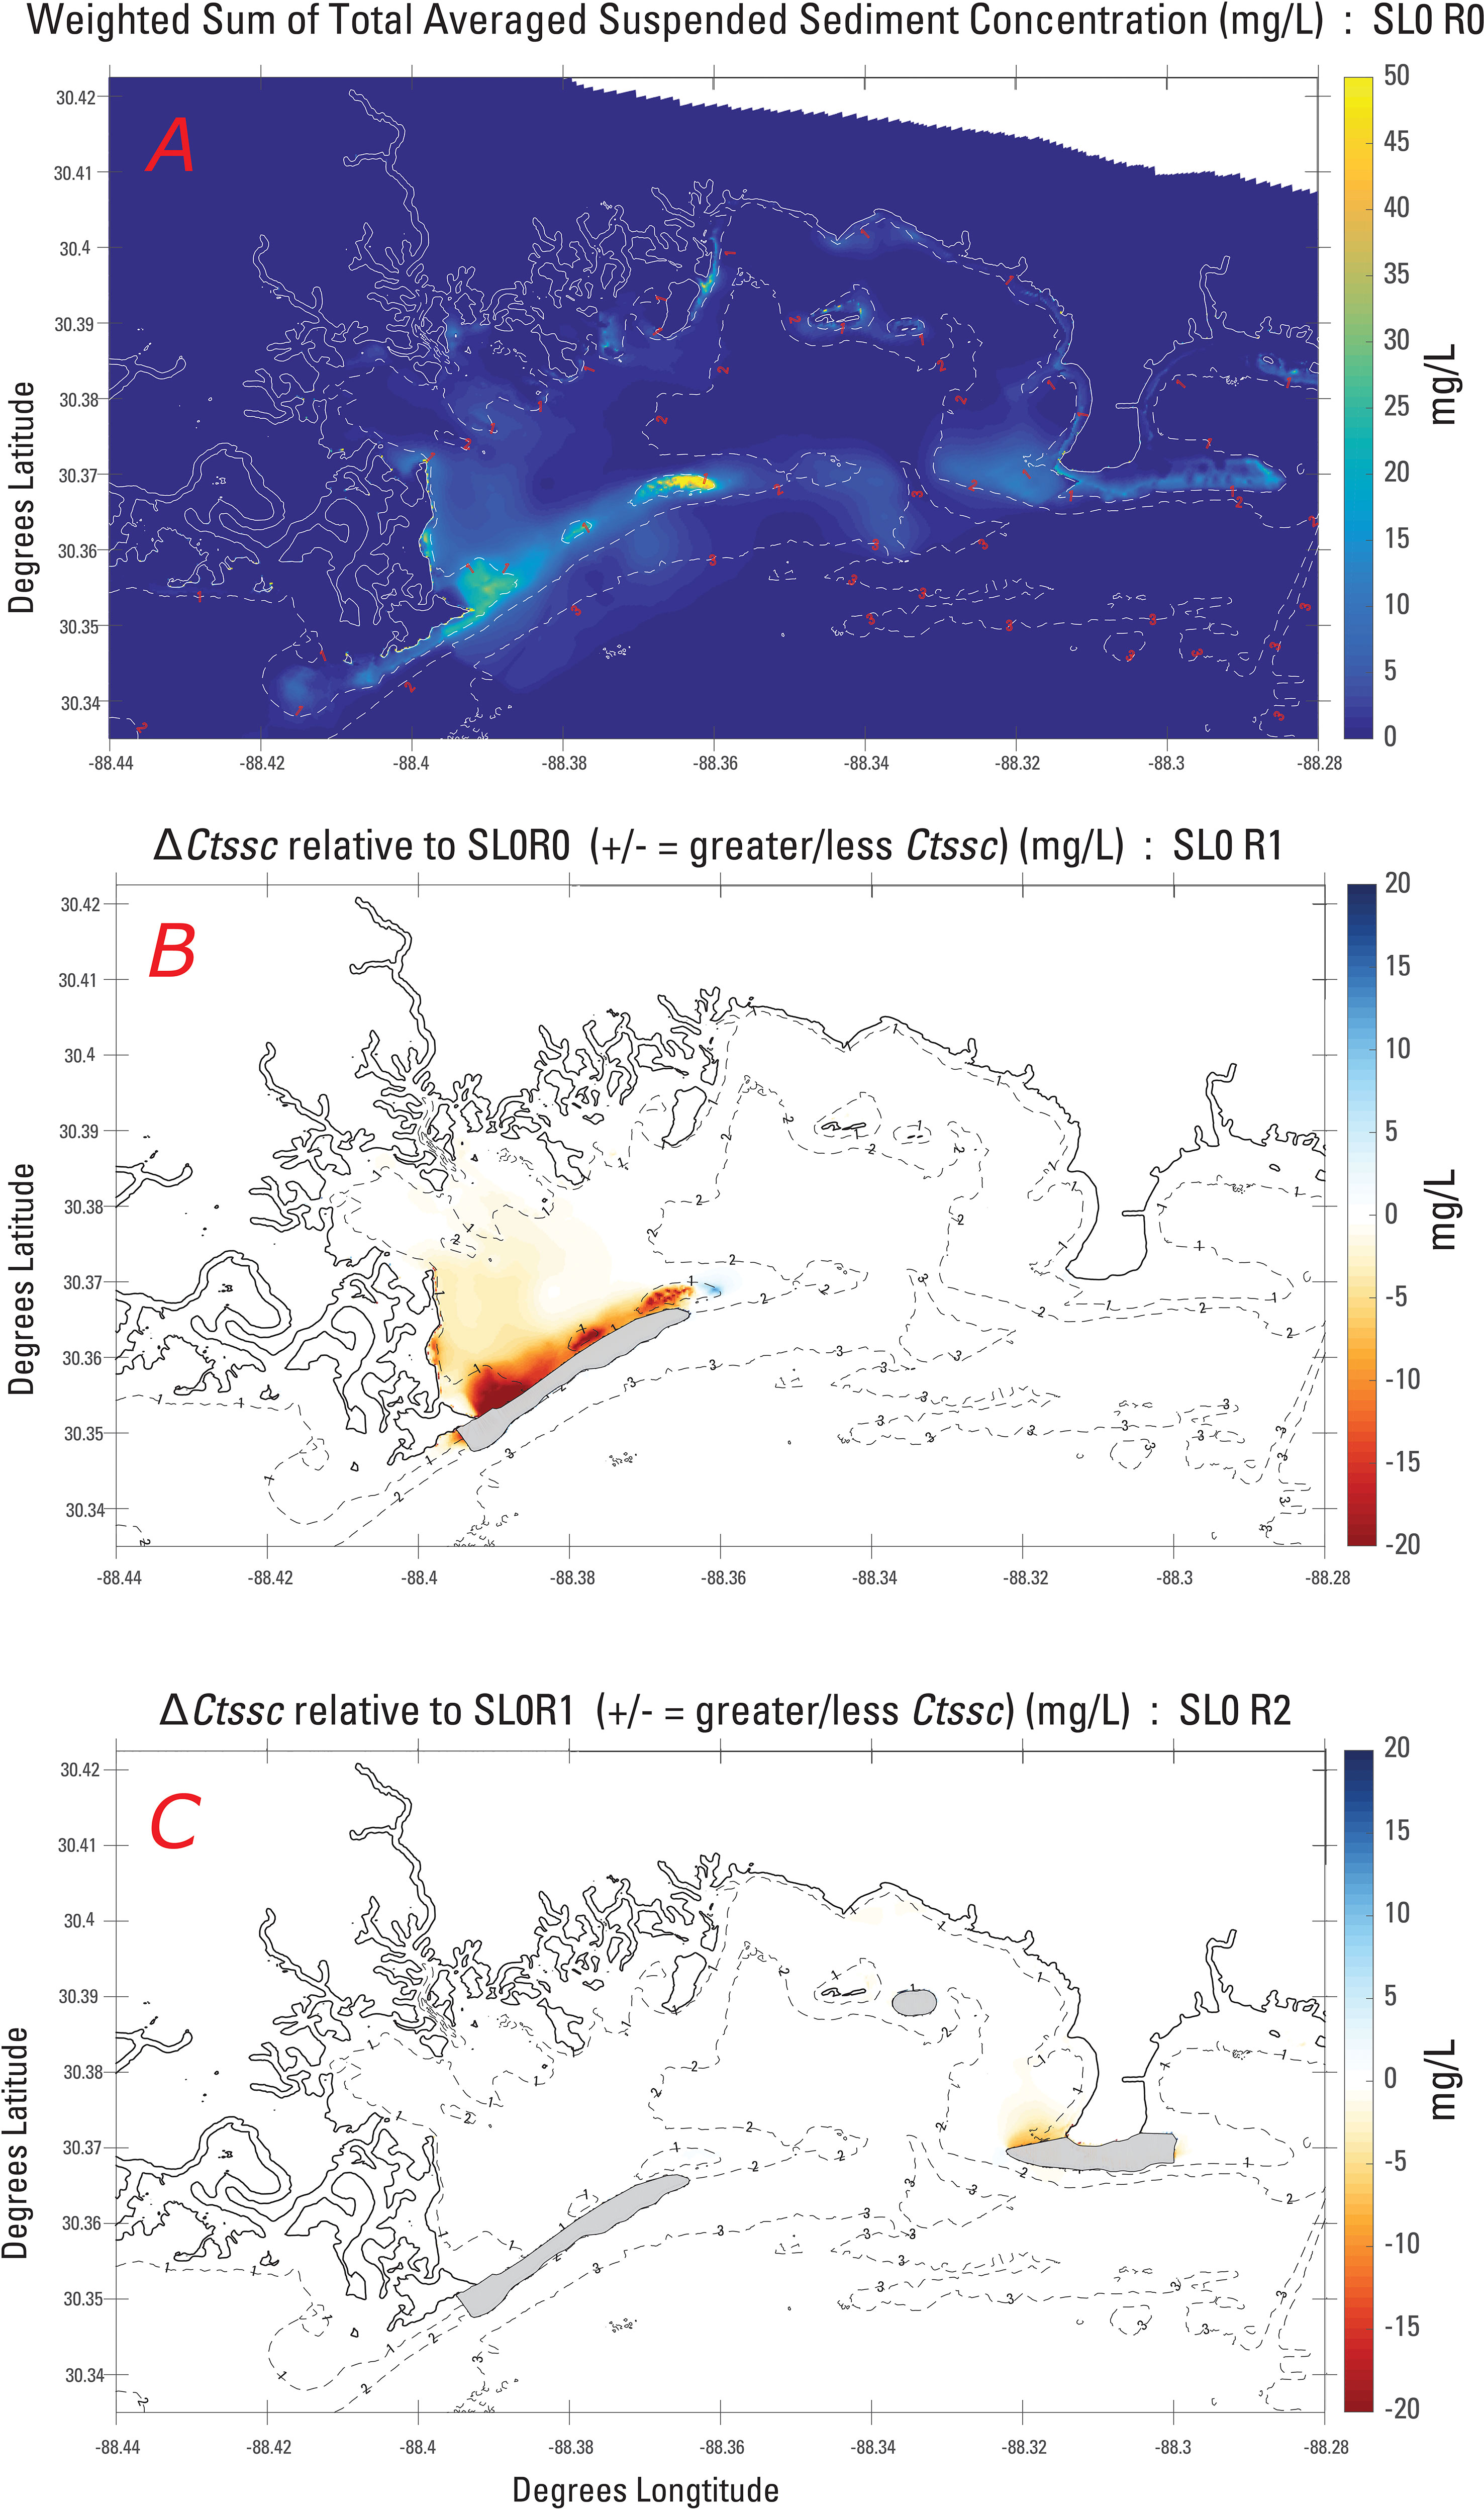
Figure 4 A baseline of spatially varying Weighted Sum of Total Averaged Suspended Sediment Concentrations () in milligrams per liter (mg/L), without sea level rise (SL0) as produced for No-action scenario (R0) (A). Difference in Weighted Sum of Total Averaged Suspended Sediment Concentrations () in mg/L across restoration alternatives for the 0.0-m sea level rise case. (B) shows between Grand Batture only (R1) and R0. (C) shows between All-Islands (R2) and R1 and isolates the influence of Isle of Dames and Marsh Island under SL0. Cool colors indicate regions with relatively higher while warm colors indicate relative decrease in .
To begin understanding the modulation of by the placement of restoration features, averages across the estuary of the derived were calculated. The results, given in Table 3, show that the restoration of GBI in SL0R1 produce an overall 30.6% decrease in . The additional placement of IAD and MI (SL0R2) reduces by a further 2%.
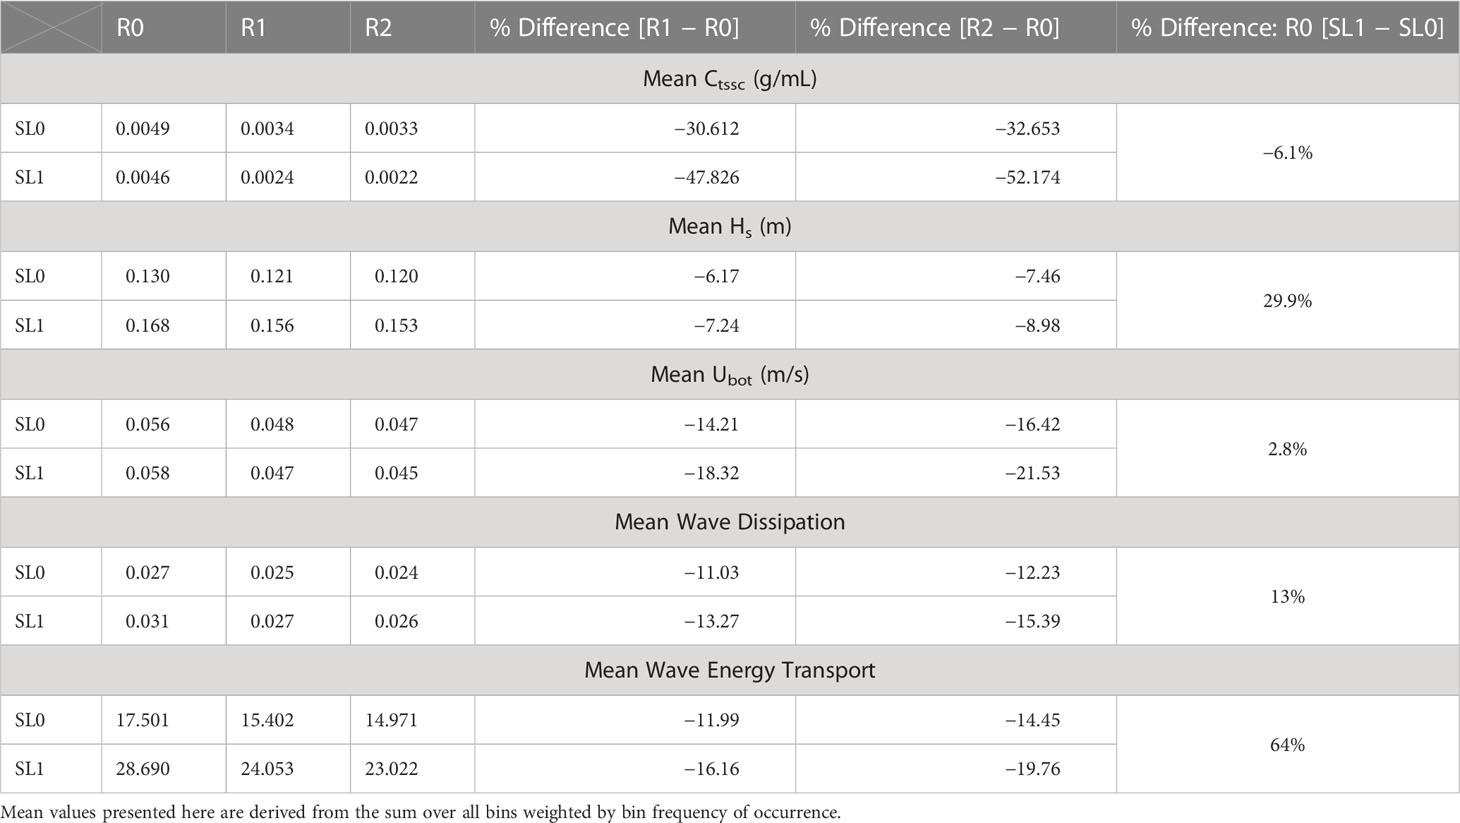
Table 3 Mean values of , , , wave dissipation, and wave energy transport, over the Grand Bay estuary, limited to just those regions north of the line formed by the eastern terminus of Grand Batture Island and Isle Aux Dames, and at a depth below the zero-meter contour.
Figure 4B gives the difference in between SL0R1 and SL0R0, showing that when GBI is placed, sediment concentrations are overall reduced in the region north of GBI by 10–20 mg/L. Figure 4C, which provides difference in between SL0R1, and SL0R2, shows that when all restorations are placed, IAD and MI reduce by 5–10 mg/L, primarily in regions local to the restored features. There is no discernable influence of in the western portion of Grand Bay by the placement of MI and IAD. Both SL0R1 and SL0R2 show one region of increased relative to SL0R0 by approximately 5 mg/L just east of the eastern terminus of the GBI feature. At the approximate boundary between Grand Bay and the Mississippi Sound, surrounding the seaward side of GBI and IAD, there is an increase in following the restored features shorelines of up to 20 mg/L shown. The increase in at these shorelines is consistent with novel wave- and current-induced shear stresses at a sub-aerial shoreface, which had not previously been present.
The changes in within Grand Bay result from the balance of settling velocities and vertical diffusion of sediments. In a two-dimensional Delft3D model, density-driven flows are not modeled, excluding changes in settling velocities as a driver of change. is dependent on modulation of either wave-induced shear stress, current-induced shear stress, or some combination thereof. Wave-induced shear stresses are a function of orbital velocities (), which is itself a function of significant wave height (). Table 3 provides time-averaged weighted mean of and , within the Grand Bay estuary, limited by the dashed magenta line shown in Figure 3. The introduction of R1 reduces estuary mean and by 14.2% and 6.17%, respectively. Reduced characteristic wave variables of , , and wave energy transport all indicate a sheltering of the bay from waves for both SL0R1 and SL0R2 (Figure 5A). Figure 5B shows a difference of time-averaged weighted water velocities (magnitude) between SL0R1 and SL0R0. With GBI present, there are decreased current velocities on the order of 1.5 cm/s in the back-shore regions of the restored feature, while there is a concurrent increase in velocities as currents speed up and diffract around the eastern terminus of GBI.
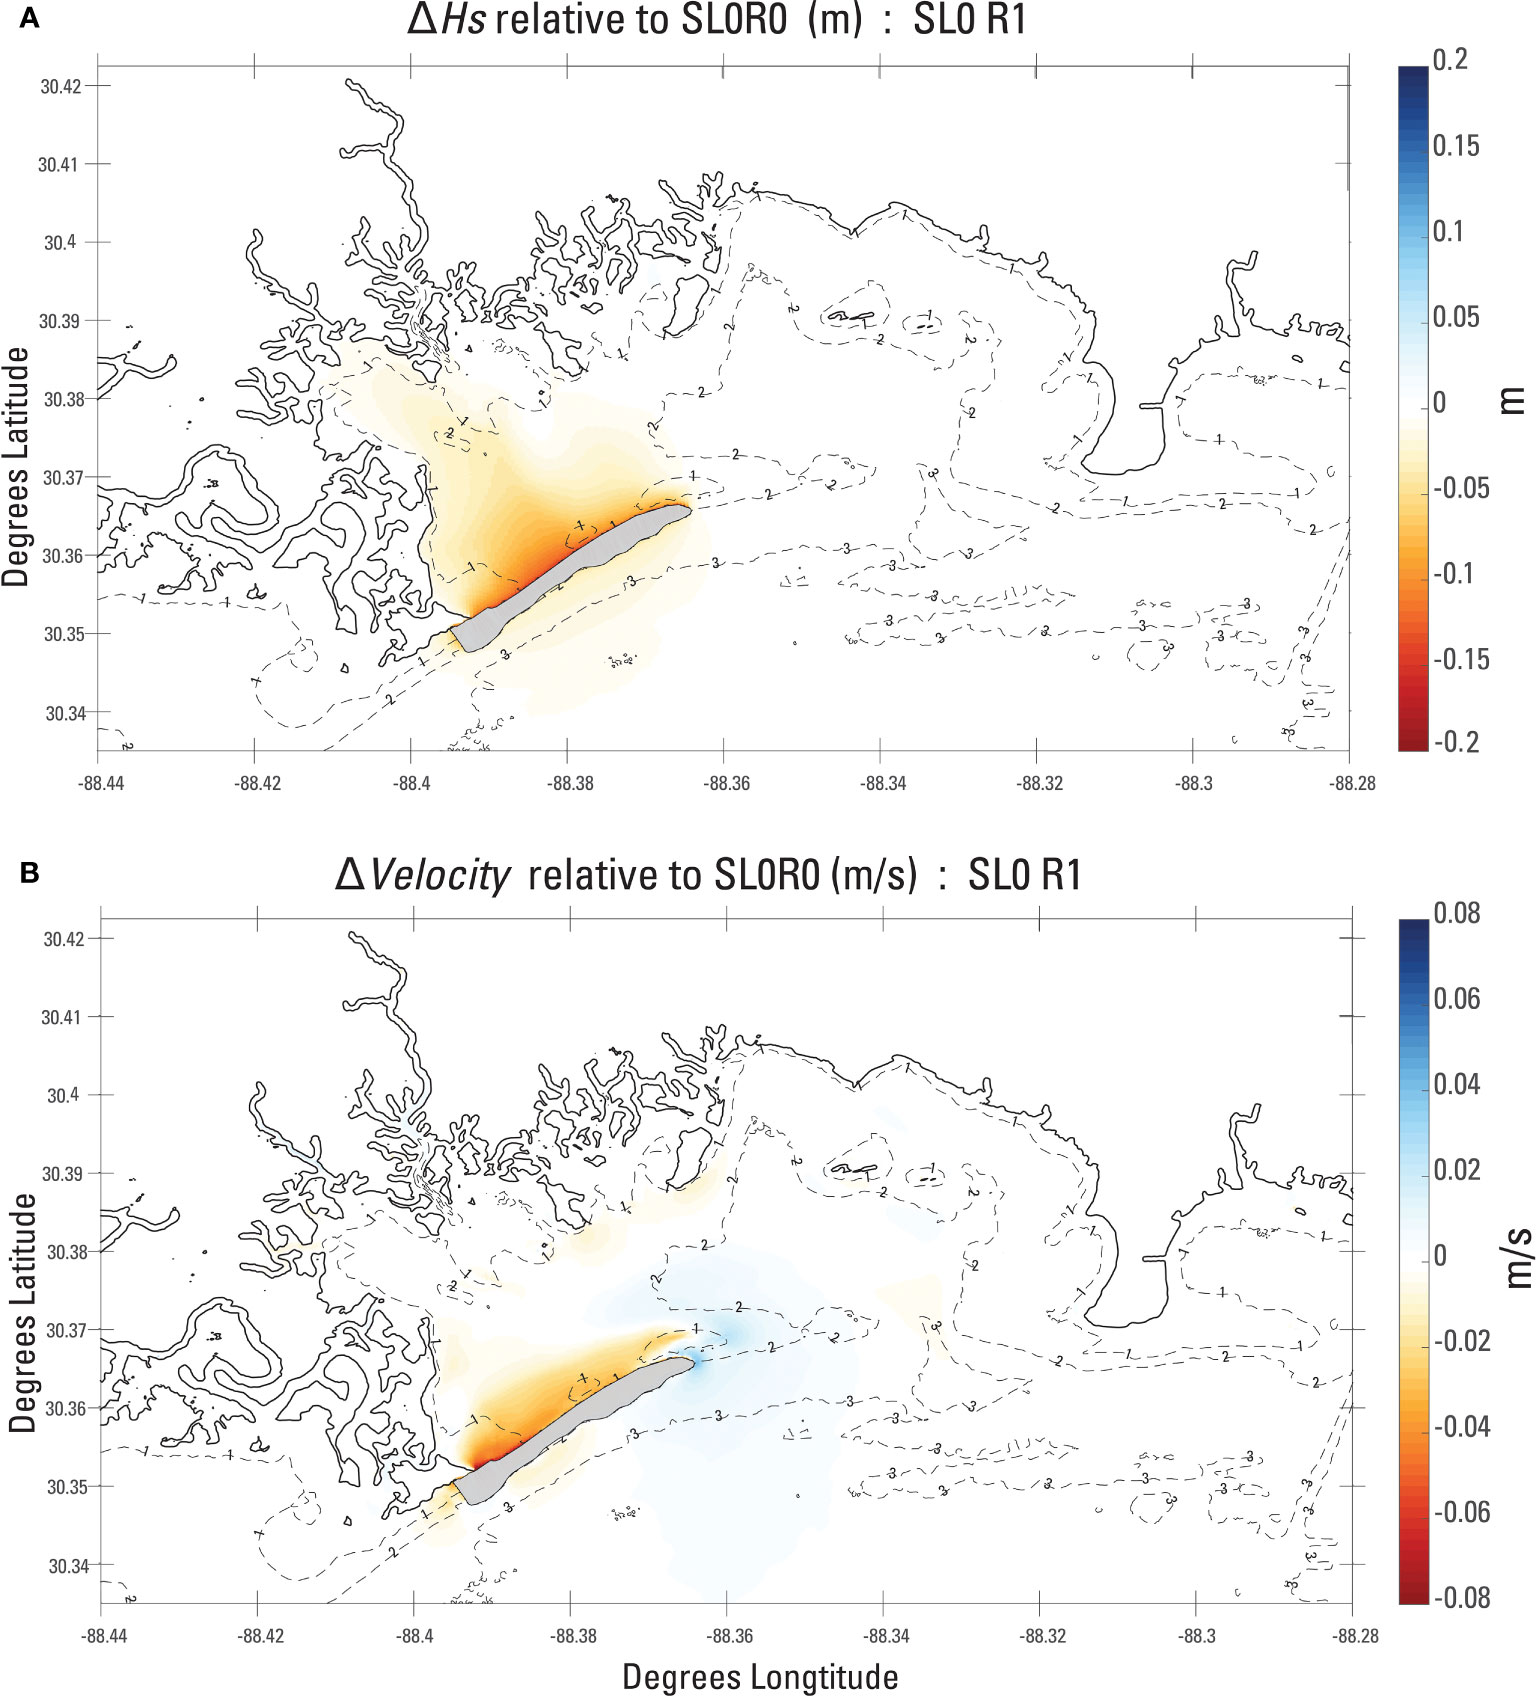
Figure 5 Panel (A) illustrates difference in significant wave height () between the Grand Batture Island only (R1), and No-action (R0) case without sea level rise (SL0) in meters. Panel (B) gives , (SL0R1–SL0R0) in meters per second. Cool colors indicate relative increases, while warm colors indicate relative decreases in weighted sums of time averaged and and , respectively.
3.2.2 Morphology
Figure 6 shows produced under each alternative without SLR. Blue areas show deposition, while orange areas show erosion. Figure 6A gives the baseline for SL0R0. We note that, overall, changes in bed levels are less than 0.5 m, largely falling in a range of 0.05 to 0.3 m for both deposition and erosion. Areas of greatest deposition and erosion occur along shoals of the remnant Grand Batture Island. Changes in bed levels on the south-facing shoreline of South Rigolets show offshore erosion between 10 and 20 cm, and coincident nearshore deposition of similar magnitude. Along the east-facing shoreline of South Rigolets, there is also an offshore band of erosion, accompanied by nearshore deposition, indicating sediment transport in the onshore direction. Within Grand Bay, there is consistent nearshore erosion of 5 cm or less and erosion less than 10 cm within the area of Middle Bay. A broad area of erosion is also shown in the deeper region between the Grand Batture shoals and Isle Aux Dames shoals of 10–15 cm. We note that in the baseline case, a region of relatively small magnitudes of deposition and erosion just outside of Grand Bay is present. This region, which follows the boundaries of the initial sediment input layer, is due to the rearrangement of available fine sediment at this boundary.
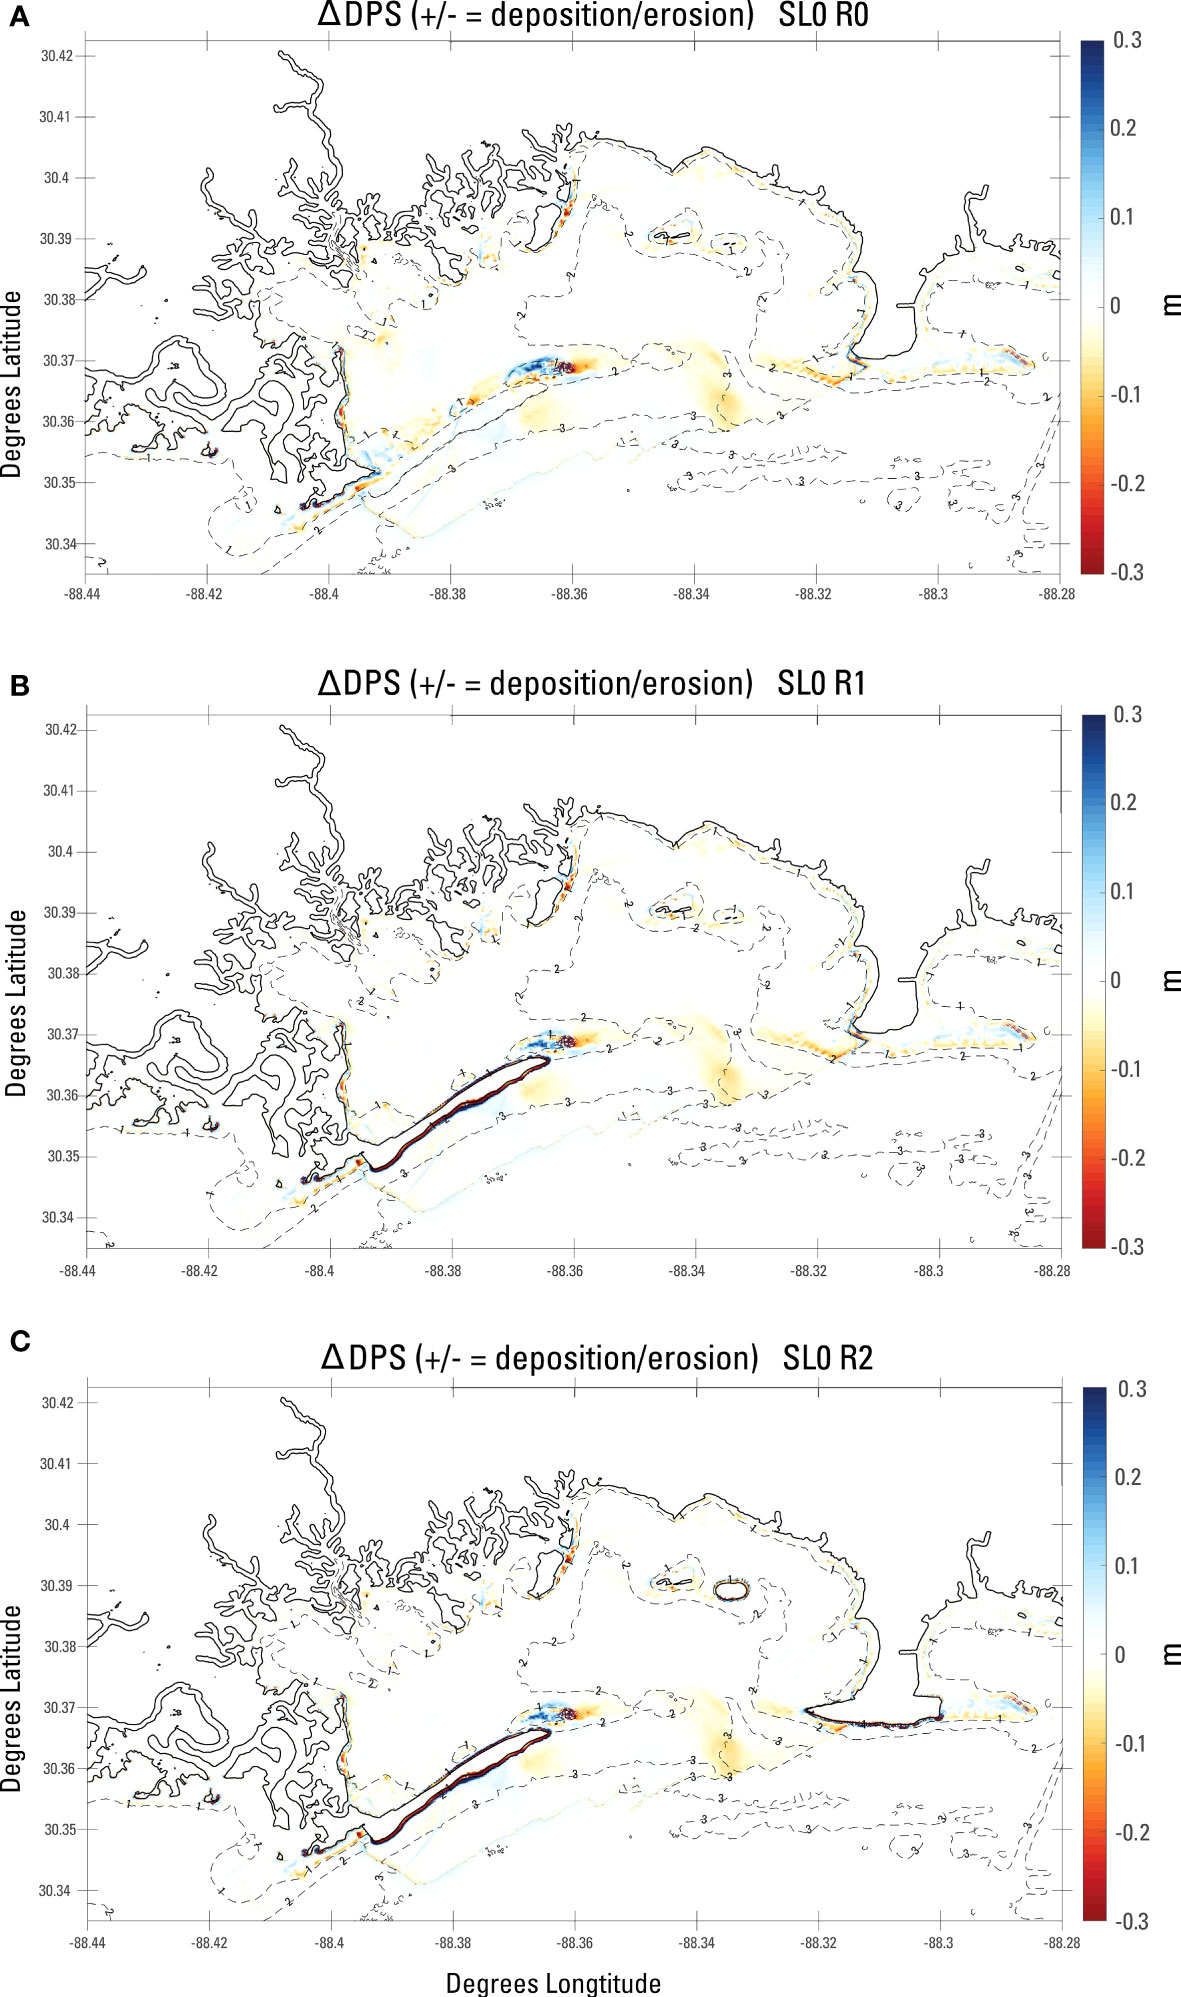
Figure 6 Change in bottom depth (DPS) following 1-year mormerge simulations without sea level rise (SL0) as produced for the no-action scenario (R0) (A), Grand Batture Island only scenario (R1) (B), and the All-Islands scenario (R2) (C). Cool colors indicate areas of deposition, while warm colors indicate areas of erosion, in meters.
When the restoration features are in place (Figures 6B, C), there is a notable slumping on the southern seaward side of the engineered headlands shown by shore-following patterns of nearshore erosion and seaward deposition of sediments in the immediate foreshore of GBI and IAD with of ±30 cm. This slumping is consistent with the design of engineered beaches as the profile equilibrates under hydrodynamic forcing (National Research Council, 1995). In each case, the slumped sediments are redeposited between the 0-m and 1-m isobaths (black and blue contours, respectively, in Figures 6B, C).
Differences in final bed levels () between SL0R0 and SL0R1 (Figure 7A) with GBI in place show that regions of Middle Bay are less eroded ( [2–6 cm]), when GBI is in place. This shallower region in SL0R1 coincides with a region of reduced behind GBI for SL0R1 (Figure 4B). In the backshore region of the restored Grand Batture Island feature, there are regions both shallower and deeper by roughly 10 cm to 20 cm. This can be linked to near-zero over Grand Batture shoals for SL0R1 (Figure 3B) while the same region is morphologically active in the baseline case (3A), as the shoal is sheltered to both waves and currents by the restored feature. In the area of South Rigolets, the between SL0R1 and SL0R0 is –5 cm, which indicates that GBI slightly reduces shoreward movement of sediments along this marsh face, which may be influenced by wind-driven currents and waves for wind directions from the north and east, as wind fetch would not be interrupted by GBI, as Figure 5A suggests sheltering north and west of the feature. Between SL0R1 and SL0R0, changes in range from −10 cm to −15 cm southwest of the restored feature along the southern shoreline of South Rigolets, which is associated with waves and currents interacting with the geometry of the feature, though there is not an obvious associated movement of these sediments shoreward, as there is no commensurate shoaling along the shoreface. Restoration of IAD and MI appears to have no further impact to the regions discussed above (Figure 7B).
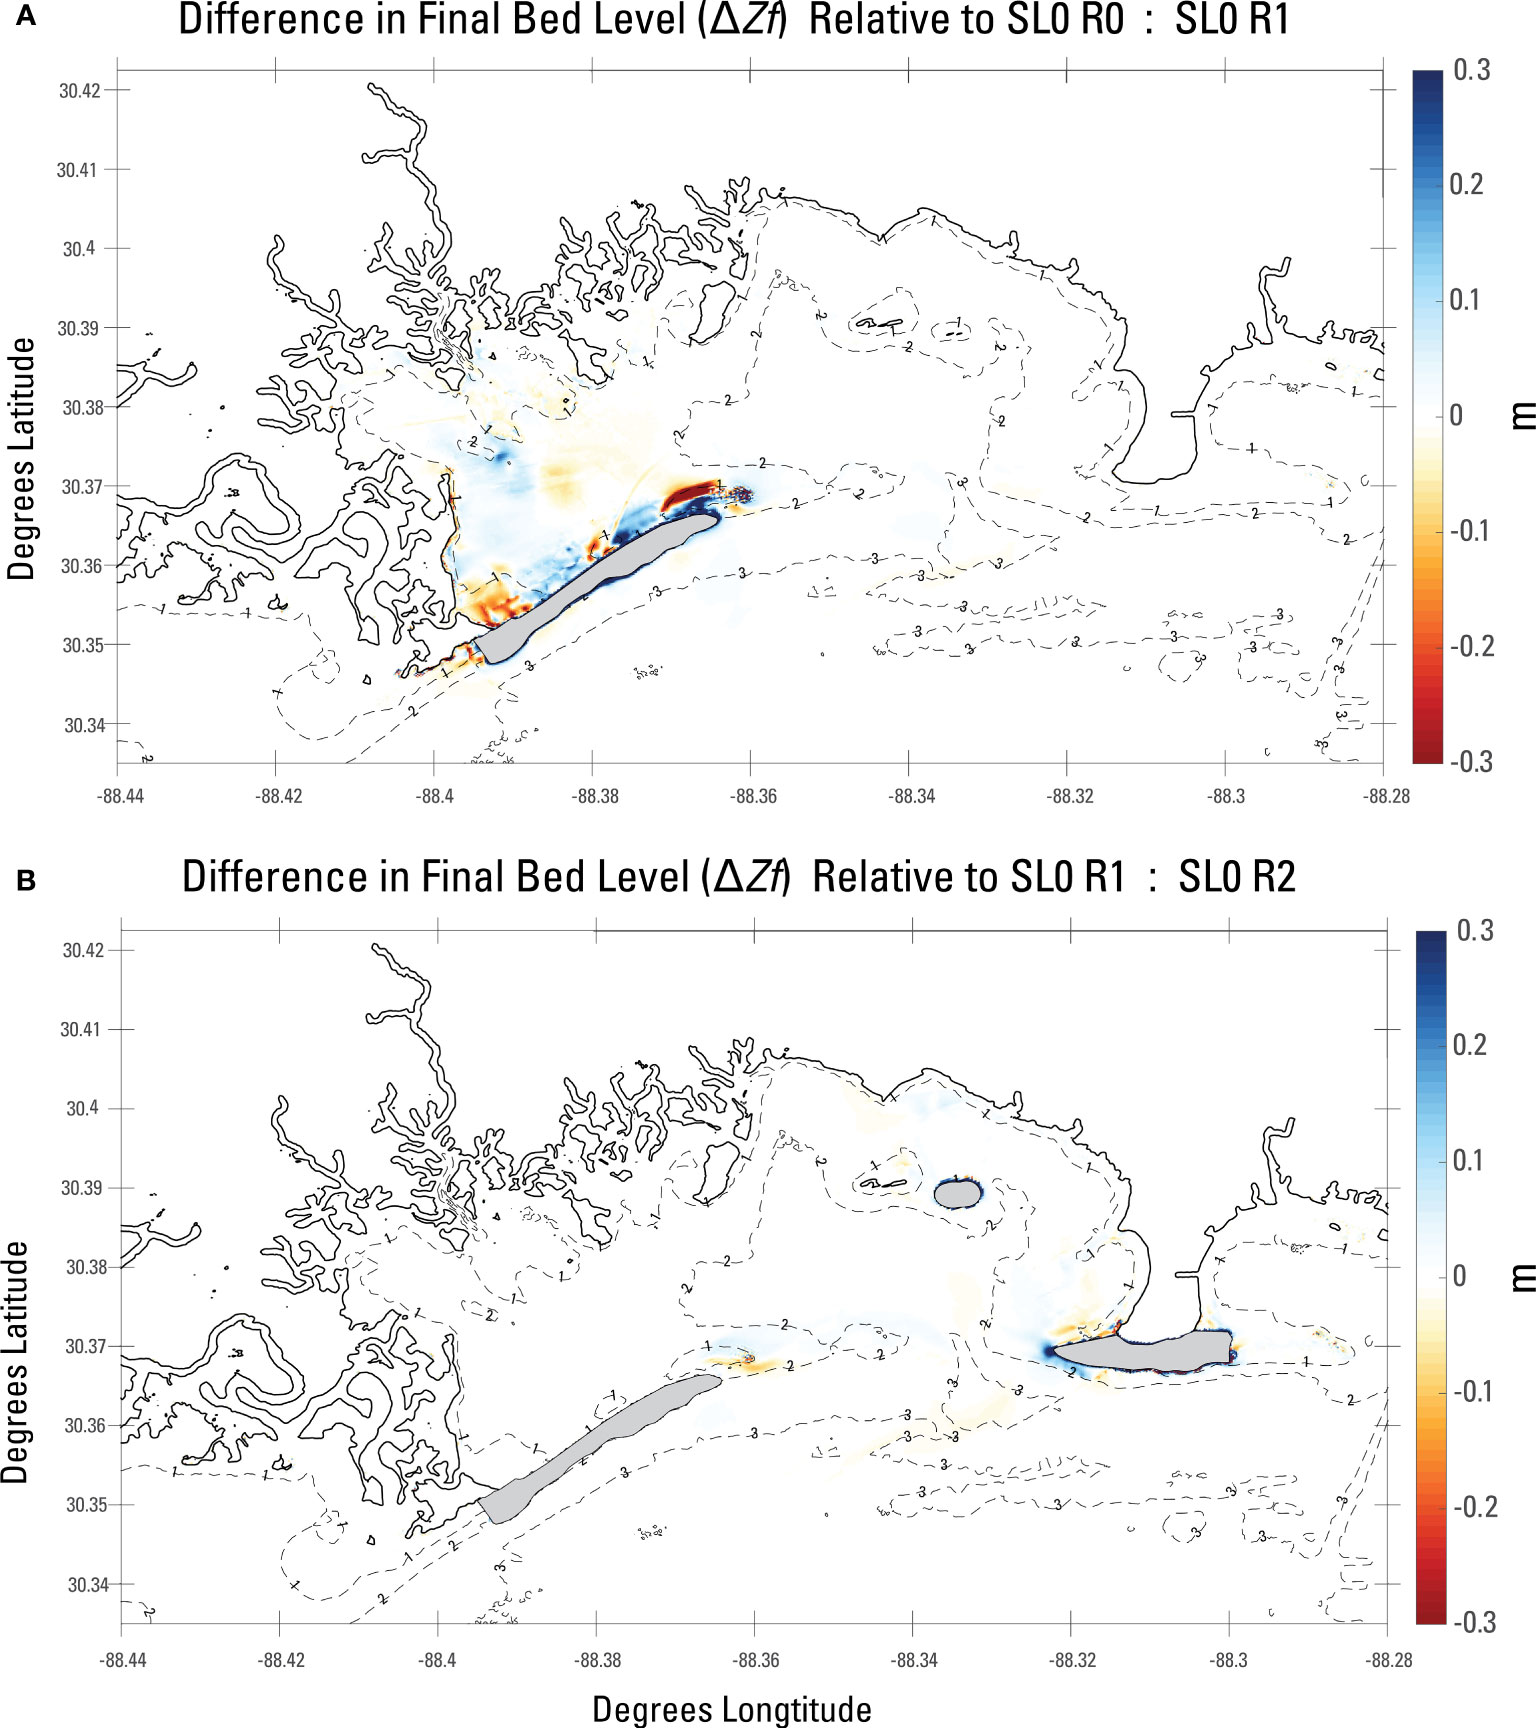
Figure 7 Difference in final bed level () given in meters (m) across restoration alternatives for the fixed 0 m (SL0) sea level rise cases. Panel (A) shows between Grand Batture Island only (R1) and No-action (R0). Panel (B) shows between All-Islands (R2) and R1, which isolates the influence of Isle of Dames (IAD) and Marsh Island (MI). Cool colors indicate regions with relatively shallower depths while warmer colors indicate areas with relatively deeper final depths (relative to the alternative noted in title).
The between SL0R2 and SL0R1 (Figure 7B) shows the isolated influence of IAD and MI from GBI. SL0R2 results in a of 2 cm to 8 cm due to limited sheltering in the region immediately north of MI and west of IAD (adjacent Point aux Pins). MI and IAD also appear to supply sediment nearshore to the placements with a up to 20 cm. There is a marginal deepening in the mouth of the bay between GBI and IAD (= −2 cm) as well as along Point Aux Pins peninsula when IAD is present. The narrowing of bay mouth by IAD influences the bed levels off the eastward tip of the restored GBI ( ± 2 cm to 4 cm) associated with increased velocities through the narrower channel (Figure 7B).
3.2.3 Sediment flux
Leonardi et al. (2016) show sensitivity of the marsh to local wave climate via wave power. Furthermore, sediment fluxes have been shown to be driven by local wind forcing in Grand Bay (Nowacki and Ganju, 2020). Passeri et al. (2023) identify three dominant wind directions in the region of the Grand Bay estuary based on long-term wind observations: northerly, southeasterly, and southwesterly winds. We compare sediment fluxes between scenarios for northerly and southeasterly winds. Southwesterly winds in the multi-annual wind climate (Passeri et al., 2023) have relatively lower wind speed, which is associated with significantly lower rates of sediment transport and flux, and so are excluded from the analysis. A check of wave directions within Grand Bay was carried out, which demonstrates alignment of wind and wave directions at eight observation stations within the estuary (see Supplementary Material). Table 4 gives the Total Cumulative Sediment Flux (TCSF) through each cross-section under the northerly wind forcing (12.6 m/s, 9°) for each scenario; Table 4 also gives the TCSF through each cross-section under the southeasterly wind condition (8.6 m/s and 143°) for each scenario. Wind forcing conditions were chosen by similarity to dominant wind direction and for wind speeds that produced significant fluxes (see Supplementary Table 1 for lower northerly wind speed produced fluxes).
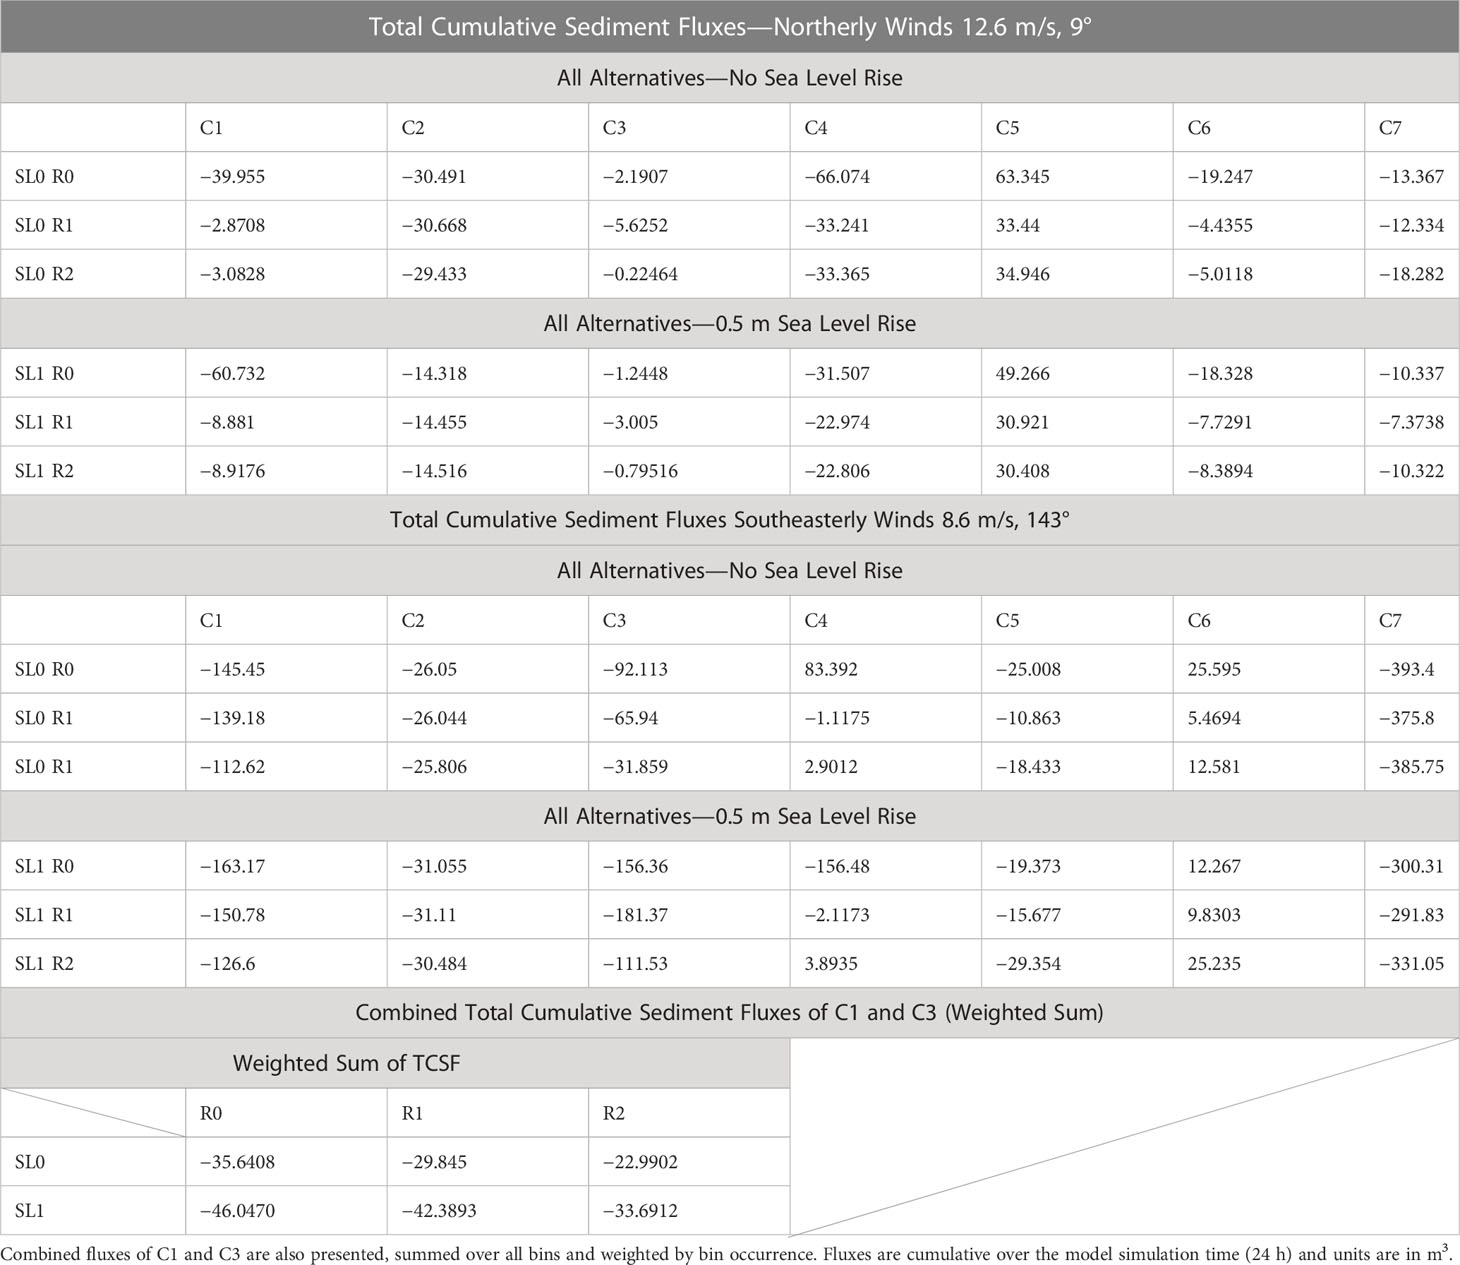
Table 4 Total cumulative sediment fluxes through seven observational cross-sections in Grand Bay forced by northerly winds at 12.6 m/s from 9°, by southeasterly winds at 8.6 m/s from 143°.
Under northerly winds, TCSF shows a general counterclockwise circulation of sediments within Grand Bay; northward through C5, westward through C6, and southward through C4. Fluxes through C7 are westward toward South Rigolets and are southward through C1 and C3 as sediments are transported out of the estuary. For the case of the southeasterly winds, the circulation of sediment fluxes appears clockwise within Grand Bay; southward through C5, eastward through C6, and northward through C4. As with the northerly wind condition, southeasterly wind forces sediment fluxes west through C7 toward South Rigolets albeit with a higher magnitude. Also, as with the northerly wind, southeasterly winds generate southward sediment fluxes through C1 and C3 out of the estuary. In all cases, sediment fluxes through C2, which falls east of Point Aux Pins (Figure 1), and outside of Grand Bay, are modulated only by wind forcing or SLR, only varying slightly with the placement of restored headlands. It is suspected that fluxes through C2 are more influenced by hydrodynamics to the region east of Grand Bay, and south of Bayou La Batre, Alabama evidenced by tidal residuals shown in Passeri et al. (2023).
For SL0 cases, and regardless of wind direction, R0 is generally associated with the largest fluxes through most cross-sections, while the introduction of restored features in R1 and R2 leads to reduced fluxes, broadly. There are two exceptions of note. First, for northerly winds, the introduction of both GBI and IAD as in R2 leads to increased TCSF through C7, toward South Rigolets. Second, for northerly winds, R1 produces increased TCSF through C3, southward out of Grand Bay, greater than both R0 and R2. For SL0, R1 generally has smaller fluxes than R2 regardless of direction except when southeasterly winds are considered, in which case R1 produces greater sediment fluxes through C1 and C3. Also of note is that independent of sea level, forcing direction, restoration, or even flux magnitude, fluxes are always in the same direction for a given cross-section, with the sole exception of C4, under southeasterly winds, and SL0, where R0 is northward, while R1 and R2 show southward fluxes through the cross-section. The introduction of 0.5 m SLR generally produces larger TCSF through all cross-sections especially through C1 and C3, with an increased export of sediments from Grand Bay. Looking at the combined TCSF of C1 and C3 weighted across all bins, we see that the baseline of sediment flux is one where sediments are exported from Grand Bay (−35.64 m3). The introduction of R1 and R2, under no-SLR conditions, reduces this export by a fraction, but neither alternative stops or reverses sediment export from Grand Bay. As was seen for the individual forcing directions, when all bins are considered, SLR significantly increases export of sediments southward from Grand Bay, for all alternatives.
3.2.4 Response to sea level rise
The influence of sea level on sediment processes and restored features is further examined in the scenarios SL1R0, SL1R1, and SL1R2. Table 3 provides averages across the Grand Bay Estuary of derived under SLR. SL1R0 is characterized by a decrease in mean , relative to SL0R0, of 6%. The presence of restoration alternatives under SLR for SL1R1 and SL1R2 decreases mean relative to SL1R0 by 47.8% and 52%, respectively.
A spatial comparison of between SL1R0 and SL0R0 (Figure 8A) shows that this decrease in mean by SL1R0 is not associated with a uniformly decreased , which could be expected if the change in concentration was due to a mere dilution of sediments by increased sea levels. Rather, SL1R0 produces lower over the subaqueous shoals (Grand Batture shoal, Isle Aux Dame shoals, Marsh Island shoals) as well as along the northern shoreline on the western side and along Point Aux Pins shoreline. These decreases are associated with decreased wave interaction with the bottom. Simultaneously, concentrations increase at points near the northern Grand Bay shoreline on the eastern side and within Middle Bay, by 2–5 mg/L and increases by 2–10 mg/L along South Rigolets. These regions of slightly increased occur in areas previously sheltered from waves by Grand Batture Shoals, which are open to southwesterly winds across the bay, and allow for larger waves to reach these relatively shallow areas, characterized by increased and increased wave energy transport (Table 3).
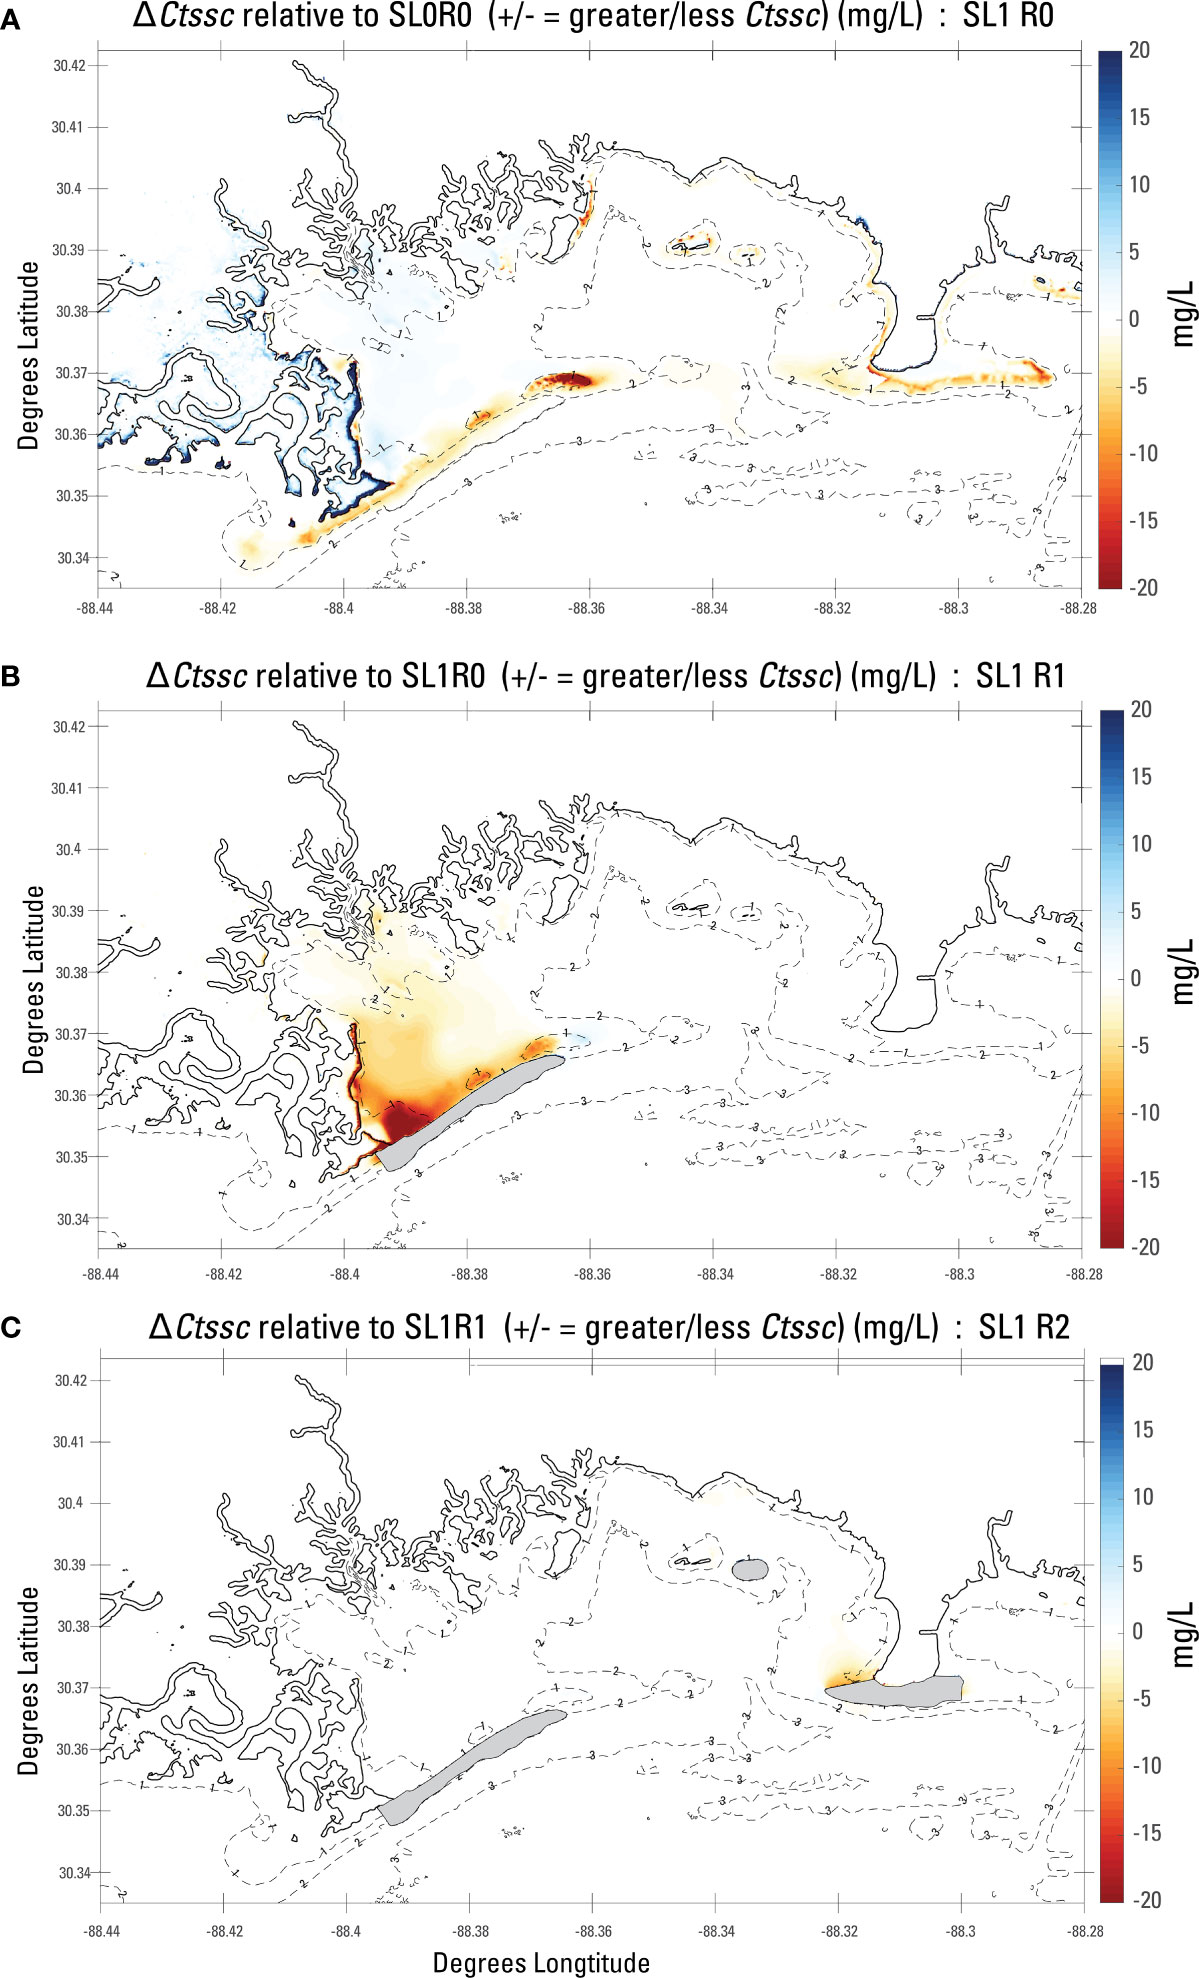
Figure 8 Difference in Weighted Sum of Total Averaged Suspended Sediment Concentrations () in milligrams per liter (mg/L) across sea level rise (SLR) conditions. Panel (A) shows between the No-action alternative (R0) with 0.5-m SLR (SL1) and with 0.0-m SLR (SL0), showing the modulation on baseline by SLR. Panel (B) shows between Grand Batture Island only (R1) and R0, showing modulation of by Grand Batture Island. Panel (C) shows between All-Islands (R2) and R1, under SL1, and isolates the influence of Isle aux Dames (IAD) and Marsh Island (MI). Cool colors indicate regions with relatively higher concentrations of sediments.
Under increased sea levels, is again modulated by the presence of restoration alternatives. Although the features of GBI, MI, and IAD are partially inundated for SL1R1 and SL1R2, their influence on is significant relative to SL1R0. Figure 8B illustrates between SL1R1 and SL1R0 and shows reduced by 10–20 mg/L behind the GBI feature, as well as along South Rigolets. In Middle Bay, there is a 2–8 mg/L reduction in . The addition of MI and IAD features under SLR, as it was for SL0R2, primarily acts to reduce concentrations local to the features ( = [−2 to −5 mg/L]), which is illustrated by between SL1R2 and SL1R1 (Figure 8C). Also shown in Figure 8C is a region of reduced concentration directly northward of MI, with = [−1 to −3 mg/L]. This analysis indicates that with an increase of sea level by 0.5 m, the open water regions of Grand Bay and northern shoreline on the eastern side experience less suspended sediments due to decreased wave-induced shear stresses. For the R0 scenario, deeper water allows larger waves to reach Middle Bay and South Rigolets, leading to greater , but the addition of GBI negates these increases by a sheltering effect.To understand changes in sediment fates under SLR, we assessed both morphology and sediment fluxes. In comparing the final depths of SL1R0 to SL0R0 (Figure 9A), we see that the Middle Bay region, which showed greater suspended sediment concentrations than SL1R0, is deeper than SL0R0 (the region is eroded in both cases); likewise, along the northern marsh shoreline, the deeper final depth for SL1R0 reflects a more eroded bottom. In other regions shown in Figure 9A, values of (both negative and positive) are associated with decreased (Figure 8A), indicating less morphologic activity relative to the SL0R0 scenario (Figure 6A). The sheltering of Middle Bay, the northern marsh shoreline, and South Rigolets, as part of the general sheltering of the GBI backshore produced by SL1R1 relative to SL1R0, is illustrated in Figure 9B. Erosion of the aforementioned regions is reduced by 6–10 cm. Figure 9B also features some regions for which SL1R1 has final bed levels deeper than SL1R0, where SL1R0 has marginal deposition. Figure 9C shows that, in addition, erosion is reduced between the restored MI and shoreline immediately north, as well as backshore of the restored IAD.
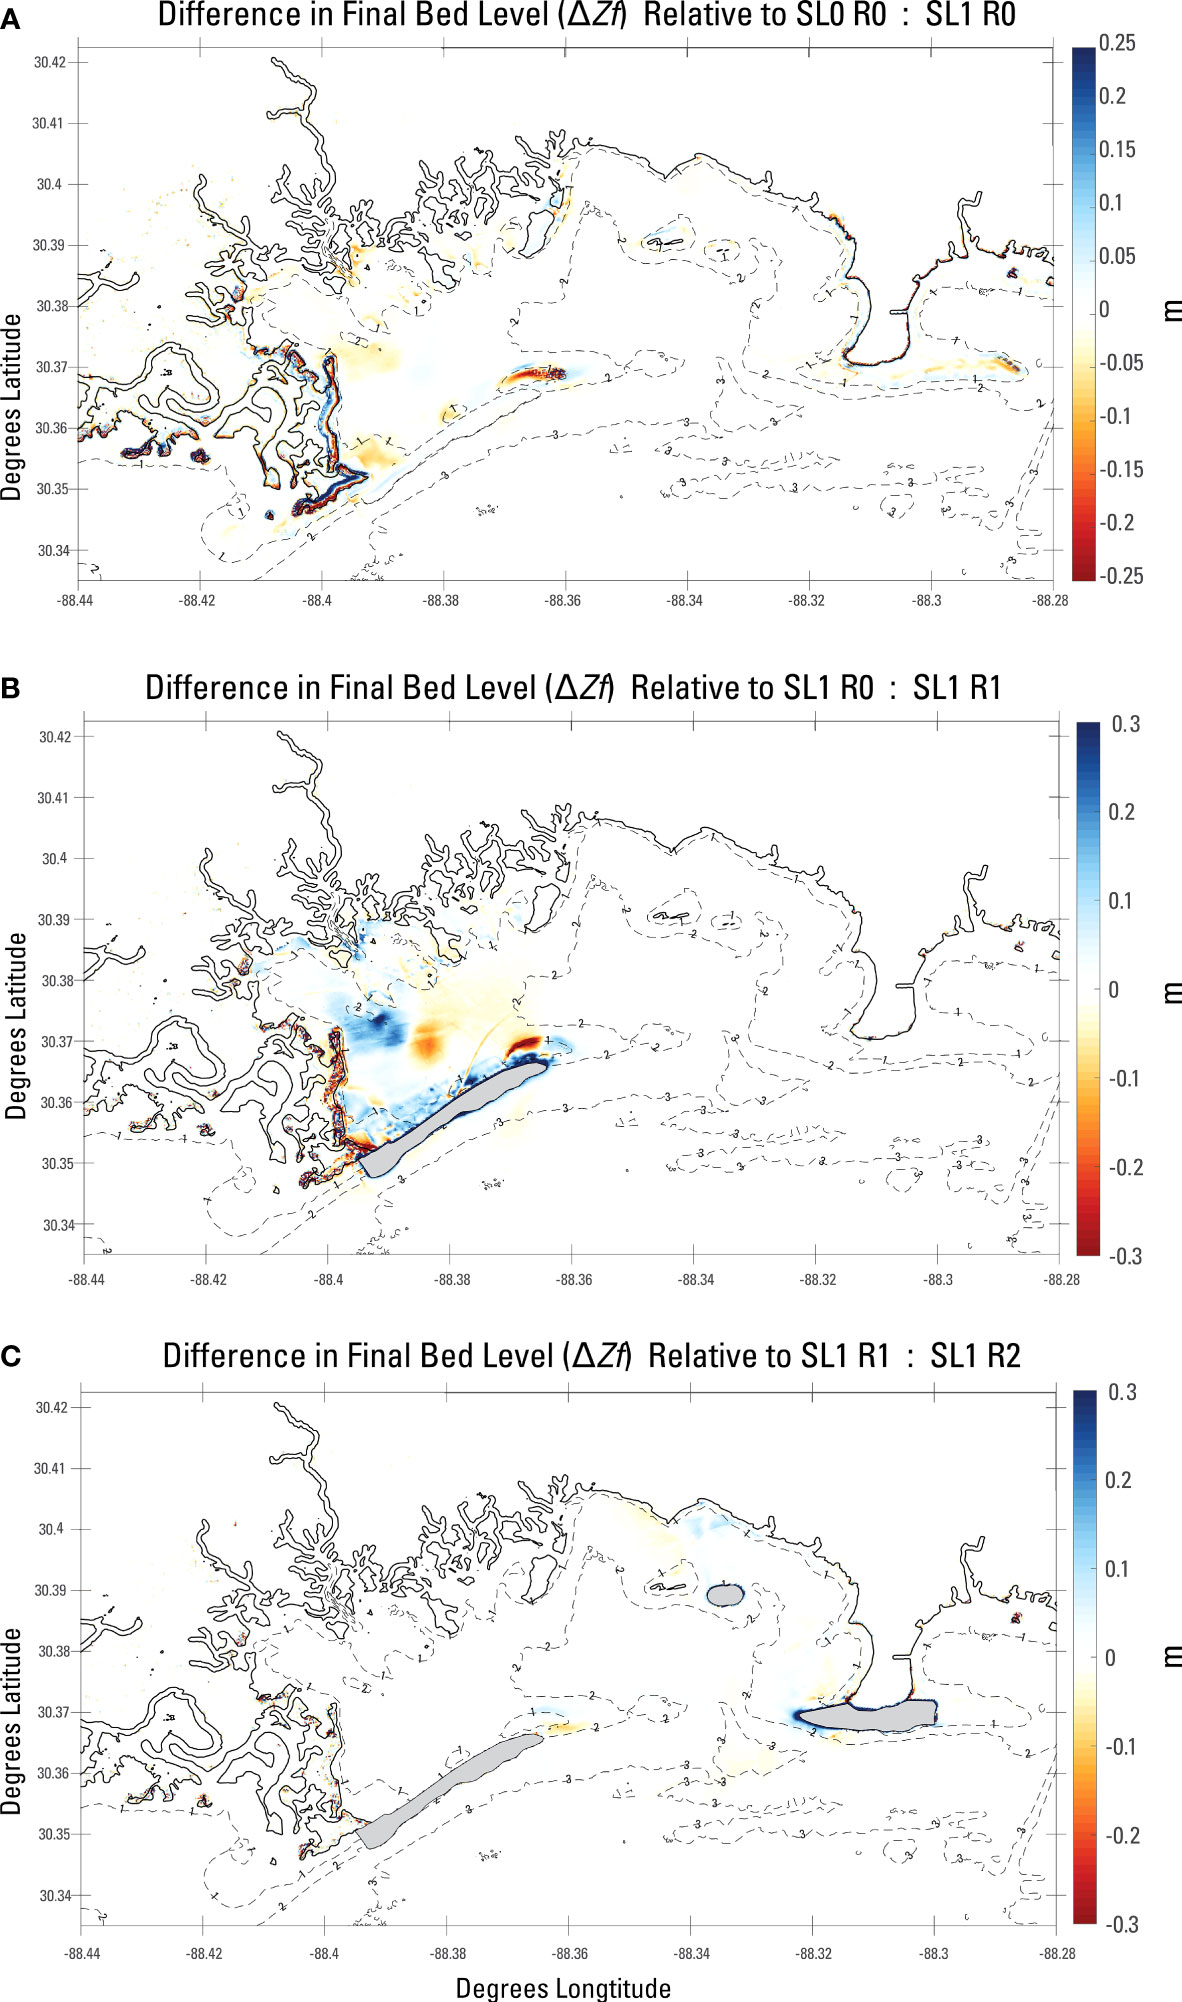
Figure 9 Difference in final bed level (, meters) across 0.5-m sea level rise (SL1) cases. Panel (A) shows between the no-action (R0) cases under SL0 and 0.0-m sea level rise (SL0). Panel (B) shows between Grand Batture only (R1) with and R0 under SL1. Panel (C) shows between All-Islands (R2) and R1 under SL1 (SL1R2 – SL1R1) and isolates the influence of Isle aux Dames (IAD) and Marsh Island (MI). Cool colors indicate regions with relatively shallower depths while warmer colors indicate areas with deeper final depths, relative to the alternative noted.
Although there is a decrease in suspended sediments across each of the SLR scenarios, coupled with the general decrease in morphological activity, results suggest that some additional portions of estuary sediments under SLR that are not deposited are exported from Grand Bay. Cross-sections C1 and C3 of Table 4 show an increased offshore flux of sediments for southeasterly winds (offshore) for all SL1 cases compared to respective SL0 cases. Across all scenarios, increased sea -level was associated with approximately 30% increase in export fluxes through the mouth of the Grand Bay (combined C1 and C3, Table 4) for all restoration alternatives, relative to the same alternative without increased sea level.
4 Discussion
In terms of morphological evolution, the presence of R1 and R2 affects the final morphology after 1 year although the effects are localized to the areas immediately adjacent to the restoration features. Differences in bed levels are generally on the order of 5 cm, with a few exeptions. While the effects of R1 and R2 are highly local, there is a non-zero influence on the final bed levels around GBI when IAD is present. This may be related to an increase in sediment flux toward South Rigolets when IAD is present, as shown by the TCSF analysis in Table 4. More impactful in determining the final bed levels regardless of restoration alternative is the presence of SLR. With higher sea levels, the presence of GBI, IAD, and MI offers some marginal sheltering to the adjacent regions, with GBI reducing erosion to Middle Bay in particular. The increase in erosion in nearshore patterns of erosion along the northern marsh shoreline under SLR suggests the influence of tidal prism enhanced by SLR, as enhanced currents rework sediments with erosion off-shore and landward infilling (Xie et al., 2022). The benefits of this sheltering effect are consistently less than 10–15 cm over the 1-year simulation. Sediment accretion rates calculated from radiochemistry of estuarine sediment cores in Grand Bay suggest an average accretion rate of 0.2 or 0.45 cm/year depending on analysis methdology (Ellis and Smith, 2021). Therefore, differences on the order of 5 cm could have a large impact over the long term.
In looking at representative suspended sediment concentrations in the Grand Bay estuary, we find that placing GBI alone causes more change in concentrations than futher placing IAD and MI as well. The placement of GBI reduces suspended sediment concentrations in Middle Bay, and in the nearshore to South Rigolets. The effect of SLR also modifies concentrations by reducing concentrations in shallow regions and making it non-zero in previously absent regions. Reductions over shoals could be due to a change in wave action in slightly deeper water, while deeper water also allows for greater transport into the Grand Bay and Middle Bay under no action. This increase in sediment concentrations in Middle Bay is lost under SLR when GBI is present.
Sediment fluxes within Grand Bay show general circulation patterns (clockwise and counterclockwise) depending on wind forcing direction. Restoration alternatives were shown to modulate these fluxes with a general reduction in flux magnitudes when the alternatives were in place. The presence of IAD, however, increased flux toward GBI when both were present, under current sea level conditions. It seems possible that offshore wind forcing, being relatively frequent in the climatology, could account for the influence of IAD on final bed levels on the eastern tip of GBI. Sediment fluxes within and exporting from Grand Bay broadly increased under the 0.5-m SLR condition, and most significantly increased in an offshore direction.
Sediment supply is a critical component of marsh accretion, and retained estuarine sediment could reduce marsh vulnerability to shoreline erosion and submergence under rising sea level (Orson et al., 1985; Ganju et al., 2017). When sediment supply is greater than coastal submergence, marsh expansion and vertical accretion occur; however, the opposite is true if supply is less than coastal submergence, resulting in marsh loss. Previous studies suggest that the majority of water column suspended material in Grand Bay is exported seaward via wind-driven circulation and tides resulting in an overall estuarine sediment deficit (Nowacki and Ganju, 2020). Both restoration scenarios examined in this study show reduced sediment flux within the estuary interior (C4, C5, and C6). Restoration scenarios also reduce bed level erosion, likely increasing estuarine sediment retention, reducing the sediment deficit, potentially increasing sediment availability for marsh shoreline accretion, particularly within Middle Bay.
Marsh shoreline erosion liberates sediment material, and therefore, the reduced suspended sediments near the Middle Bay shoreline due to reconstruction of GBI may be due to decreased shoreline erosion from the protection provided by GBI. The reduction of suspended sediment concentration is greatest along the southwestern shoreline of Middle Bay just north of GBI where shorelines are eroding approximately 2 m/year (Terrano, 2018; Smith et al., 2021). Hydrodynamic modeling suggests that a GBI-like barrier would reduce wave heights and wave power within Middle Bay (Nowacki and Ganju, 2020). Given the strong relationship of wave power to marsh shoreline erosion (Francalanci et al., 2013; Leonardi and Fagherazzi, 2014; Leonardi et al., 2016) and the protection provided by GBI from wind-driven waves, reconstruction of GBI would likely decrease marsh erosion along these shorelines. In situ measurements of annual mass of sediment eroded and deposited at this location show a net loss of eroded marsh sediments to the estuary (Smith et al., 2021). While reduced suspended sediment concentation could impact sediment supply for marsh building, the reduced suspended sediments may be offset by reduced marsh shoreline erosion. Additional modeling that takes into account the feedback processes of marsh erosion, resuspension, and deposition would be required to determine if shoreline change rates could be impacted by restoration scenarios.
5 Conclusions
A Delft3D model was developed to assess the influence of large-scale restoration actions on sediment transport in the Grand Bay estuary. Hydrodynamics, sediment transport, and resulting morphologic evolution were simulated with and without proposed interior headland restoration, for present-day and future SLR. The coupled flow-wave model was validated for water levels and waves over a 3-week observation period, and then applied in a mormerge configuration to simulate sediment transport and resulting bed level changes over a 1-year time period. Six modeling scenarios were carried out considering three restoration alternatives and two sea level scenarios.
An analysis of the differences in final bed levels, suspended sediment concentrations, and sediment fluxes was carried out and showed the following:
• The restoration of islands led to localized differences in bed levels near the features after a year of simulated morphologic change. Features acted as a sediment source to the immediate surroundings while also providing some non-significant sheltering effect of back-shore shoals and and marsh shorelines.
• Suspended sediment concentrations are highly influenced by SLR in a non-linear manner. Sediment concentrations both increased and decreased depending on depth under an increased sea level of 0.5 m. Furthermore, SLR allowed for the suspension and deposition of sediments on the marsh platform.
• Of the restoration alternatives considered, GBI has the greatest relative impact on suspended sediment fluxes regardless of SLR conditions due to the size of the feature and its position relative to the shoreline.
• Sediment fluxes within Grand Bay were influenced to a greater degree by wind directions and SLR than by the restored interior headlands. It was found that the presence of both headlands (IAD and GBI) can increase fluxes westward to GBI.
• Regardless of direction, sea level, or restoration action, the greatest sediment fluxes were always fluxes that export sediment out of Grand Bay, and increased sea level produced 30% greater export fluxes through the mouth of Grand Bay across all restoration alternatives.
Data availability statement
The datasets presented in this study can be found in online repositories. The names of the repository/repositories and accession number(s) can be found below: https://doi.org/10.5066/P986ZR6B.
Author contributions
RJ developed and applied the numerical model used in this study with advisement from DP. DP provided the tidal hydrodynamic model boundary conditions and DT provided the wind and wave climatology. CS provided the initial sediment conditions for the model. RJ performed the model analysis with input from CJ and KS. All authors contributed to the paper by reviewing and approving the text. All authors contributed to the article and the approved submitted version.
Funding
This work was funded in part by the Gulf Coast Ecosystem Restoration Council (RESTORE), NOAA’s National Centers for Coastal Ocean Science Competitive Research Program and Research under award NA20NOS4780193, and the USGS Coastal and Marine Hazards and Resources Program.
Acknowledgments
This paper is a result of the research done in collaboration with Alabama Department of Conservation of Natural Resources and Volkert, Inc. The authors would like to thank the reviewers for their input on this manuscript.
Conflict of interest
The authors declare that the research was conducted in the absence of any commercial or financial relationships that could be construed as a potential conflict of interest.
Publisher’s note
All claims expressed in this article are solely those of the authors and do not necessarily represent those of their affiliated organizations, or those of the publisher, the editors and the reviewers. Any product that may be evaluated in this article, or claim that may be made by its manufacturer, is not guaranteed or endorsed by the publisher.
Author disclaimer
Any use of trade, firm, or product names is for descriptive purposes only and does not imply endorsement by the U.S. Government.
Supplementary material
The Supplementary Material for this article can be found online at: https://www.frontiersin.org/articles/10.3389/fmars.2023.1217830/full#supplementary-material
References
Alizad K., Hagen S. C., Medeiros S. C., Bilskie M. V., Morris J. T., Balthis L., et al. (2018). Dynamic responses and implications to coastal wetlands and the surrounding regions under sea level rise. PloS One 13 (12). doi: 10.1371/journal.pone.0210134
Alizad K., Medeiros S. C., Foster-Martinez M. R., Hagen S. C. (2020). Model sensitivity to topographic uncertainty in meso- and microtidal marshes. IEEE J. Selected Topics Appl. Earth Observ. Remote Sens. 13, 807–814. doi: 10.1109/JSTARS.2020.2973490
Arns A., Wahl T., Dangendorf S., Jensen J. (2015). The impact of sea level rise on storm surge water levels in the northern part of the German Bight. Coast. Eng. 96, 118–131. doi: 10.1016/j.coastaleng.2014.12.002
Benedet L., Dobrochinski J. P. F., Walstra D. J. R., Klein A. H. F., Ranasinghe R. (2016). A morphological modeling study to compare different methods of wave climate schematization and evaluate strategies to reduce erosion losses from a beach nourishment project. Coast. Eng. 112, 69–86. doi: 10.1016/j.coastaleng.2016.02.005
Danielson J. J., Brock J. C., Howard D. M., Gesch D. B., Bonisteel-Cormier J. M., Travers L. J. (2013). Topobathymetric model of Mobile Bay (St. Petersburg, FL, USA: U.S. Geological Survey Data Series), 769. Available at: https://pubs.usgs.gov/ds/769/.
Davis J., Whitfield P., Szimanski D., Golden B. R., Whitbeck M., Gailani J. Z., et al. (2021). A framework for evaluating island restoration performance: A case study from the Chesapeake Bay. Integrated Environ. Assess. Manage. 18 (1), 42–48. doi: 10.1002/ieam.4437
DeAngelis B. M., Sutton-Grier A. E., Colden A., Arkema K. K., Baillie C. J., Bennett R. O., et al. (2020). Social factors key to landscape-scale coastal restoration: lessons learned from three U.S. case studies. Sustainability 12 (3). doi: 10.3390/su12030869
Deltares (2018a). Delft3D-FLOW-Simulation of multi-dimensional hydrodynamic flows and transport phenomena, including sediments - User Manual (ver. 3.15) (The Netherlands).
Deltares (2018b). Delft3D-WAVE- simulation of short-crested waves with SWAN - User Manual (ver. 3.05) (The Netherlands).
DeWitt N. T., Stalk C. A., Smith C. G., Locker S. D., Fredericks J. J., McCloskey T. A., et al. (2017). Single-beam bathymetry data collected in 2015 from Grand Bay, Alabama-Mississippi: U.S (Geological Survey Data Series 1070). doi: 10.3133/ds1070
Egbert G. D., Bennett A. F., Foreman M. G. G. (1994). TOPEX/POSEIDON tides estimated using a global inverse model. J. Geophys. Res. Oceans 99 (C12), 24821–24852. doi: 10.1029/94JC01894
Egbert G. D., Erofeeva S. Y. (2002). Efficient inverse modeling of barotropic ocean tides. J. Atmos. Oceanic Technol. 19 (2), 183–204. doi: 10.1175/1520-0426(2002)019<0183:EIMOBO>2.0.CO;2
Eleuterius C. K., Criss G. A. (1991). "Point aux Chenes: past, present, and future perspective of erosion". (Ocean Springs, Mississippi, USA: Physical Oceanography Section Gulf Coast Research Laboratory)
Ellis A. M., Smith C. G. (2021). Emerging dominance of Paratrochammina simplissima (Cushman and McCulloch) in the northern Gulf of Mexico following hydrologic and geomorphic changes. Estuarine Coast. Shelf Sci. 255, 107312. doi: 10.1016/j.ecss.2021.107312
Field C. R., Bayard T. S., Gjerdrum C., Hill J. M., Meiman S., Elphick C. S. (2017). High-resolution tide projections reveal extinction threshold in response to sea level rise. Global Change Biol. 23 (5), 2058–2070. doi: 10.1111/gcb.13519
Francalanci S., Bendoni M., Rinaldi M., Solari L. (2013). Ecomorphodynamic evolution of salt marshes: Experimental observations of bank retreat processes. Geomorphology 195, 53–65. doi: 10.1016/j.geomorph.2013.04.026
French J. R. (2008). Hydrodynamic modelling of estuarine flood defence realignment as an adaptive management response to sea-level rise. J. Coast. Res. 24 (2B), 1–12. doi: 10.2112/05-0534.1
Ganju N. K. (2019). Marshes are the new beaches: integrating sediment transport into restoration planning. Estuaries Coasts 42, 917–926. doi: 10.1007/s12237-019-00531-3
Ganju N. K., Defne Z., Elsey-Quirk T., Moriarty J. M. (2019). Role of tidal wetland stability in lateral fluxes of particulate organic matter and carbon. J. Geophys. Res. Biogeosci. 124 (5), 1265–1277. doi: 10.1029/2018JG004920
Ganju N. K., Defne Z., Kirwan M. L., Fagherazzi S., D'Alpaos A., Carniello L. (2017). Spatially integrative metrics reveal hidden vulnerability of microtidal salt marshes. Nat. Commun. 8, 14156. doi: 10.1038/ncomms14156
Hall G. F., Hill D. F., Horton B. P., Engelhart S. E., Peltier W. R. (2013). A high resolution study of tides in the Delaware Bay: past conditions and future scenarios. Geophys. Res. Lett. 40 (2), 338–342. doi: 10.1029/2012GL054675
Jenkins R. L. III, Long J. W., Dalyander P. S., Thompson D. M., Mickey R. C. (2020). Development of a process-based littoral sediment transport model for Dauphin Island, Alabama. U.S. Geol. Survey Open-File Rep. 2020–1011, 43. doi: 10.3133/ofr20201011
Jenkins R. L., Passeri D. L., Smith C. G., Thompson D. M. (2023). Modeling the effects of interior headland restoration on estuarine sediment transport processes in a marine-dominant estuary: model inputs and outputs. U.S. Geol. Survey Data Release. doi: 10.5066/P986ZR6B
Lawson S. E., Wiberg P. L., McGlathery K. J., Fugate D. C. (2007). Wind-driven sediment suspension controls light availability in a shallow coastal lagoon. Estuaries Coasts 30 (1), 102–112. doi: 10.1007/BF02782971
Leonardi N., Fagherazzi S. (2014). How waves shape salt marshes. Geology 42 (10), 887–890. doi: 10.1130/G35751.1
Leonardi N., Ganju N. K., Fagherazzi S. (2016). A linear relationship between wave power and erosion determines salt-marsh resilience to violent storms and hurricanes. Proc. Natl. Acad. Sci. 113 (1), 64–68. doi: 10.1073/pnas.1510095112
Leonardi N., Li X., Carnacina I. (2019). A numerical investigation on tidally induced sediment transport and moprhological changes with changing sea level in south-east England. Geosciences 9 (3), 140. doi: 10.3390/geosciences9030140
Leorri E., Mulligan R., Mallinson D., Cearretta A. (2011). Sea-level rise and local tidal range changes in coastal embayments: An added complexity in developing reliable sea-level index points. J. Integrated Coast. Zone Manage. 11 (3), 307–314. doi: 10.5894/rgci277
Lesser G. R. (2009). An approach to medium-term coastal morphological modelling Doctoral Dissertation (Leiden, The Netherlands: CRC Press/Balkema). Available at: https://repository.tudelft.nl/islandora/object/uuid%3A27a1ffa0-580e-4eae-907b-ce6f901e652e.
Lesser G. R., Roelvink J. A., van Kester J. A. T. M., Stelling G. S. (2004). Development and validation of a three-dimensional morphological model. Coast. Eng. 51 (8-9), 883–915. doi: 10.1016/j.coastaleng.2004.07.014
Marot M. E., Smith C. G., McCloskey T. A., Locker S. D., Khan N. S., Smith K. E. L. (2019). Sedimentary data from Grand Bay, Alabama/Mississippi 2014-2016 (Reston, VA, USA: U.S. Geological Survey). doi: 10.5066/P9FO8R3Y
Medeiros S. C., Hagen S. C., Weishampel J. F., Angelo J. (2015). Adjusting lidar-derived digital terrain models in coastal marshes based on estimated aboveground biomass density. Remote Sens. 7 (4), 3507–3525. doi: 10.3390/rs70403507
Miselis J. L., Flocks J. G., Zeigler S., Passeri D. L., Smith D. R., Bourque J., et al. (2021). Impacts of sediment removal from and placement in coastal barrier island systems, U.S. Geological Survey Open-File Report. 2021–1062. doi: 10.3133/ofr20211062
National Geophysical Data Center, N. E. S, Data, and Information Service (2009) Mobile, Alabama 1/3 MHW coastal digital elevation model. Available at: https://www.ngdc.noaa.gov/metaview/page?xml=NOAA/NESDIS/NGDC/MGG/DEM/iso/xml/673.xml&view=getDataView&header=none)/.
National Research Council (1995). Beach Nourishment and Protection (Washington, DC: The National Academies Press). doi: 10.17226/4984
Nowacki D. J., Ganju N. K. (2020). Sediment dynamics of a divergent bay-marsh complex. Estuaries Coasts 44, 1216–1230. doi: 10.1007/s12237-020-00855-5
Nowacki D. J., Ganju N. K., Suttles S. E., Borden J., Nichols A. (2018). Discharge measurements made in Bayou Heron and Bayou Middle, Grand Bay, Mississippi in January 2017, U.S (Geological Survey data release). doi: 10.5066/P98NHB82
O'Sullivan W. T., Criss G. A. (1998). “Continuing erosion in Southeastern coastal Mississippi-point aux chenes bay, west grand bay, middle bay, Grande Batture islands: 1995-1997,” in Sixty-Second Annual Meeting of the Mississippi Academy of Sciences, Biloxi Mississippi.
Orson R., Panageotou W., Leatherman S. P. (1985). Response of tidal salt marshes of the U.S. Atlantic and Gulf Coasts to Rising Sea Levels. J. Coast. Res. 1 (1), 29–37.
Palinkas C. M., Orton P., Hummel M. A., Nardin W., Sutton-Grier A. E., Harris L., et al. (2022). Innovations in Coastline Management with Natural and Nature-Based Features (NNBF): Lessons learned from three case studies. Front. Built Environ., 8–2022. doi: 10.3389/fbuil.2022.814180
Parson L. E., Swafford R. (2012). Beneficial use of sediments from dredging activities in the gulf of Mexico. J. Coast. Res. 60, 45–50. doi: 10.2112/SI_60_5
Passeri D. L., Hagen S. C., Medeiros S. C., Bilskie M. V., Alizad K., Wang D. (2015). The dynamic effects of sea level rise on low-gradient coastal landscapes: a review. Earth's Future 3 (6), 159–181. doi: 10.1002/2015EF000298
Passeri D. L., Hagen S. C., Plant N. G., Bilskie M. V., Medeiros S. C., Alizad K. (2016). Tidal hydrodynamics under future sea level rise and coastal morphology in the Northern Gulf of Mexico. Earth's Future 4 (5), 159–176. doi: 10.1002/2015EF000332
Passeri D. L., Jenkins R. L. III, Poisson A., Bilskie M. V., Bacopoulos P. (2023). Modeling the effects of large-scale interior headland restoration on tidal hydrodynamics and salinity transport in an open coast, marine-dominant estuary. Front. Mar. Sci. 10 (2023). doi: 10.3389/fmars.2023.1193462
Paterson G. A., Heslop D. (2015). New methods for unmixing sediment grain size data. Geochem. Geophys. Geosys. 16, 4494–4506. doi: 10.1002/2015GC006070
Pelling H. E., Uehara K., Green A. M. (2013). The impact of rapid coastline changes and sea level rise on the tides in the Bohai Sea, China. J. Geophys. Res. Oceans 118 (7), 3462–3472. doi: 10.1002/jgrc.20258
Peterson M. S., Waggy G. L., Woodrey M. (2007). Grand Bay National Estuarine Research Reserve: An Ecological Characterization (Grand Bay National Estuarine Research Reserve, Moss Point, MS: Moss Point, Mississippi, USA), 268.
Pickering M. D., Wells N. C., Horsburgh K. J., Green J. A. M. (2012). The impact of future sea-level rise on the European Shelf tides. Continental Shelf Res. 35 (1), 1–15. doi: 10.1016/j.csr.2011.11.011
Polk M. A., Gittman R. K., Smith C. S., Eulie D. O. (2022). Coastal resilience surges as living shorelines reduce lateral erosion of salt marshes. Integrated Environ. Assess. Manage. 18 (1), 82–98. doi: 10.1002/ieam.4447
Roelvink J. A. (2006). Coastal morphodynamic evolution techniques. Coast. Eng. 53 (2-3), 277–287. doi: 10.1016/j.coastaleng.2005.10.015
Smith K. E. L., Terrano J. F., Khan N. S., Smith C. G., Pitchford J. L. (2021). Lateral shoreline erosion and shore-proximal sediment deposition on a coastal marsh from seasonal, storm and decadal measurements. Geomorphology, 389. doi: 10.1016/j.geomorph.2021.107829
Stalk C. A., Wilcox H. S., Passeri D. L., Smith C. G., Smith K. E. L., Terrano J. F. (2021). Single-beam bathymetry data collected in March 2021 from Grand Bay and Point Aux Chenes Bay, Mississippi/Alabama: U.S (Geological Survey data release: Reston, VA, USA). doi: 10.5066/P93ZM9MK
Suedel B. C., McQueen A. D., Wlkens J. L., Saltus C. L., Bourne S. G., Gailani J. Z., et al. (2021). Beneficial use of dredged sediment as a sustainable practice for restoring coastal marsh habitat. Integrated Environ. Assess. Manage. 00 (00), 1–12. doi: 10.1002/ieam.4501
Sutton-Grier A. E., Wowk K., Bamford H. (2015). Future of our coasts: the potential for natural and hybrid infrastructure to enhance the resilience of our coastal communities, economies and ecosystems. Environ. Sci. Policy 51, 137–148. doi: 10.1016/j.envsci.2015.04.006
Sweet W. V., Hamlington B. D., Kopp R. E., Weaver C. P., Barnard P. L., Bekaert D., et al. (2022). Global and regional sea level rise scenarios for the United States: Updated mean projections and extreme water level probablities along U.S (Silver Spring, MD, USA: Coastlines. Silver Spring, MD, National Oceanic and Atmospheric Administration, National Ocean Service), 111.
Terrano J. (2018). An evaluation of marsh shoreline erosion and sediment deposition in the Grand Bay National Estuarine Research Reserve (Tampa, FL, USA: Mississippi, USA. Masters Thesis, University of South Florida). Available at: https://digitalcommons.usf.edu/etd/7371.
Valentim J. M., Vaz L., Vaz N., Silva H., Duarte B., Cacador I., et al. (2013). Sea level rise impact in residual circulation in Tagus estuary and Ria de Aveiro lagoon. J. Coast. Res. Special Issue No. 65, 1981–1986. doi: 10.2112/SI65-335.1
Xie D., Schwarz C., Kleinhans M. G., Zhou Z., van Maanen B. (2022). Implications of coastal conditions and sea-level rise on mangrove vulnerability: A bio-morphodynamic modeling study. J. Geophys. Research: Earth Surface 127 (3), e2021JF006301. doi: 10.1029/2021JF006301
Zhang X., Leonardi N., Donatelli C., Fagherazzi S. (2019). Fate of cohesive sediments in a marsh-dominated estuary. Adv. Water Resour. 125, 32–40. doi: 10.1016/j.advwatres.2019.01.003
Keywords: hydrodynamics, sediment, sea level rise, estuary, restoration, modeling
Citation: Jenkins RL III, Passeri DL, Smith CG, Thompson DM and Smith KEL (2023) Modeling the effects of interior headland restoration on estuarine sediment transport processes in a marine-dominant estuary. Front. Mar. Sci. 10:1217830. doi: 10.3389/fmars.2023.1217830
Received: 05 May 2023; Accepted: 24 July 2023;
Published: 15 August 2023.
Edited by:
Jasper Leuven, Royal HaskoningDHV, NetherlandsReviewed by:
Peter M. J. Herman, Delft University of Technology, NetherlandsDanghan Xie, Boston University, United States
Copyright © 2023 Jenkins, Passeri, Smith, Thompson and Smith. This is an open-access article distributed under the terms of the Creative Commons Attribution License (CC BY). The use, distribution or reproduction in other forums is permitted, provided the original author(s) and the copyright owner(s) are credited and that the original publication in this journal is cited, in accordance with accepted academic practice. No use, distribution or reproduction is permitted which does not comply with these terms.
*Correspondence: Robert L. Jenkins III, cmxqZW5raW5zQHVzZ3MuZ292