 Zack S. Oyafuso
 Lewis A. K. Barnett
 Margaret C. Siple
 Daniel W. Cooper†
- National Oceanic and Atmospheric Administration Alaska Fisheries Science Center, Groundfish Assessment Program, National Oceanic and Atmospheric Administration National Marine Fisheries Service, Alaska Fisheries Science Center, Seattle, WA, United States
The US Chukchi Sea consists of the waters off the northwest of Alaska and is a naturally dynamic ice-driven ecosystem. The impacts from climate change are affecting the Arctic marine ecosystem as well as the coastal communities that rely on healthy marine ecosystems. In anticipation of increased ecosystem monitoring in the area, there is an opportunity to evaluate improved sampling designs for future ecological monitoring of the Chukchi Sea, an area that is sampled less comprehensively compared to other regions in Alaska. This analysis focused on standardized NOAA-NMFS-AFSC bottom trawl surveys (otter and beam trawls) and three types of survey designs: simple random, stratified random, and systematic. First, spatiotemporal distributions for 18 representative demersal fish and invertebrate taxa were fitted using standardized catch and effort data. We then simulated spatiotemporal taxon densities to replicate the three survey design types to evaluate design-based estimates of abundance and precision across a range of sampling effort. Modest increases in precision were gained from stratifying the design when compared to a simple random design with either similar or lower uncertainty and bias of the precision estimates. There were often strong tradeoffs between the precision and bias of the systematic estimates of abundance (and associated variance) across species and gear type. The stratified random design provided the most consistent, reliable, and precise estimates of abundance indices and is likely to be the most robust to changes in the survey design. This analysis provides a template for changing bottom trawl survey designs in the Chukchi Sea and potentially other survey regions in Alaska going forward and will be important when integrating new survey objectives that are more ecosystem-focused.
Introduction
The recent environmental and ecological changes occurring in the Pacific Arctic Ocean are unprecedented (Huntington et al., 2020). The diminishing extent of the sea ice observed in the past century is perhaps the most apparent of the changes occurring in the Arctic ocean (Polyak et al., 2010). The Arctic ice pack reached its lowest point in 2012 relative to 1979-2000 (Parkinson and Comiso, 2013). Sea ice and the cold conditions associated with it are important to atmospheric and oceanographic regulation (Budikova, 2009). The edges of the sea ice are active in primary and secondary production, creating important foraging habitats for fish and marine mammals (Post et al., 2013). Seals haul out on the surface of the ice to rest and nurse their pups, and polar bears and walruses depend on the ice to hunt. Many Arctic communities hunt these mammals for subsistence. Warmer waters can expand the habitat ranges of more temperate species. For example, the discovery of large populations of mature walleye pollock (a common and commercial Bering Sea species) in the Russian western portion of the Chukchi Sea (e.g., Emelin et al., 2022; Maznikova et al., 2023b) led to the development of a fishery in the region in 2021.
The US portion of the Pacific Arctic Ocean includes the eastern Chukchi Sea which is connected to the Bering Sea via the Bering Strait and extends to the Beaufort Sea to the northeast. Bottom trawl surveying of groundfish and benthic invertebrates has been conducted by the National Marine Fisheries Service (NMFS) and its predecessor, the Bureau of Commercial Fisheries, sporadically since the 1950s. Increased monitoring of the Chukchi Sea is likely, given the poleward expansion of many Bering Sea species like walleye pollock, Pacific cod, and various flatfishes into the northern Bering Sea (Stevenson and Lauth, 2019; Spies et al., 2020) and further into the Chukchi Sea (Datsky et al., 2022; Cooper et al., 2023; Levine et al., 2023; Maznikova et al., 2023b) in recent anomalously warm years.
In the past ten years, there have been increased efforts to conduct integrated ecosystem-wide monitoring across the entire Chukchi Sea (Baker et al., 2023). To increase the monitoring of groundfish and benthic invertebrates in the Chukchi Sea, it has been proposed to extend the current Bering Sea NMFS bottom trawl survey (BTS) conducted by the Alaska Fisheries Science Center (AFSC), similar to the extension of the Bering Sea survey into the northern Bering Sea since 2010. Thus, the naive assumption for future Chukchi Sea NMFS survey designs is to extend the fixed NMFS Bering Sea 20-nmi systematic grid onto the Chukchi Sea shelf as done in 2012 (Goddard et al., 2014). However, until funding is available for a groundfish survey in the Chukchi Sea, there is an opportunity to evaluate survey designs that could provide reliable abundance estimates while allowing for more flexibility in survey extent and total survey effort than a systematic survey would. Systematic sampling has its advantages, especially in survey logistics (e.g., stations are equally spaced) and variance reduction for homogeneously distributed populations. Randomized designs, especially with stratification, can allow for higher flexibility to different levels of total survey effort while providing robust and unbiased survey estimates of abundance and variance. Stratum boundaries and station allocations among strata can also be optimized to weight species of importance (Oyafuso et al., 2021).
We evaluated the bias and precision of survey estimates of abundance using a systematic fixed-grid survey design along with two types of randomized designs in the US Chukchi Sea BTS. Spatiotemporal distributions for 18 representative demersal fish and invertebrate taxa were fitted based on historical bottom trawl catch and effort data. The models used to fit these spatiotemporal relationships were then used to simulate taxon densities on which surveys under different designs could be conducted. Three conventional survey designs were evaluated: simple random sampling (SRS), stratified random sampling (STRS), and a fixed-grid systematic (SYS) grid similar to what is employed in the NMFS Bering Sea BTS. Design-based estimates of abundance and precision from the three survey designs across a range of sampling effort were calculated, from which the performance of each design was evaluated. We evaluated the advantages and tradeoffs of using a systematic grid as previously done in the NMFS Chukchi Sea BTS and then highlighted potential improvements to the survey by using randomized designs. This analysis is intended to provide a template for a modified Chukchi Sea groundfish survey design going forward and will be important when transitioning to ecosystem-focused survey objectives.
Methods
Survey area and historical datasets
The US Chukchi Sea sampling frame was defines as a 2-nmi resolution grid (N = 15,736 cells or sampling units) that extends north of the Bering Strait and is bounded by the Barrow Canyon 100-m isobath to the north, US-Russia Maritime Boundary to the west, and the 10-m isobath along the Alaska coastline to the east.
Readers are referred to Stauffer (2004) and Deary et al. (2021) for a detailed specification of the gears used in this study. We will briefly introduce and identify the major differences between the two gears used.
83-112 Eastern otter trawl (“otter trawl” hereafter): Surveys from two years, 1990 and 2012, were included in this analysis due to the consistencies in the sampling protocol. In 1990, 48 stations were sampled along 11 transect lines perpendicular to shore near Point Hope, Alaska (Barber et al., 1997). In 2012, a systematic sampling design was employed based on a 30-nmi square grid with the planned trawl stations located at the approximate center of each grid cell, resulting in a total of 73 sampling locations, 71 of which were successful and included in the analysis. The wings and throat sections of the trawl net have a 10.2 cm mesh size. The codend has a 8.9 cm mesh size and a smaller-meshed 32-mm liner for retaining smaller organisms. Otter trawl tows were trawled at a target speed of 3 knots for 15 minutes. Acoustic net mensuration sensors were used to assess trawl performance and to provide net width for calculating effort (total area swept, the product of net width and distance trawled with bottom contact).
Plumb staff beam trawl (“beam trawl” hereafter): Surveys from three years, 2012, 2017, and 2019 were included in this analysis and used the same systematic grid as the 2012 otter trawl survey. In 2012, a tickler chain preceded the trawl footrope (Gunderson and Ellis, 1986; Kotwicki et al., 2017). Beam trawl tows from 2017 and 2019 were conducted as part of the Arctic Integrated Ecosystem Survey component of the Arctic Integrated Ecosystem Research Program. The body of the trawl has 7-mm mesh with a 4-mm mesh at the cod end. In 2017 and 2019, the tickler chain was removed, and the trawl was modified with a footrope of 10.2-cm rubber discs over a steel chain as in Abookire and Rose (2005). In all beam trawl survey years, effort was calculated similar to the otter trawl, with a bottom contact sensor to determine distance fished by the trawl. Effective trawl width of the beam trawl was assumed to be 2.26 m in 2012 (Gunderson and Ellis, 1986; Kotwicki et al., 2017), and 2.1 m in 2017 and 2019 (Abookire and Rose, 2005). Beam trawl tows were trawled at a target speed of 1.5 knots for 2.9-7.5 minutes. Catch samples from the beam and otter trawls were identified and sorted to the lowest possible taxonomic group, weighed, and counted. Field identifications of a subset of age-0 gadids in 2017 and 2019 were confirmed with genetic techniques (see Wildes et al., 2022).
Species list
The set of taxa we chose to include in this analysis was influenced by cultural importance to Bering Strait and Chukchi Sea communities, commercial and ecological importance, availability in the dataset, adequate catchability to the two bottom trawl gears, and the ability to fit informative spatiotemporal distribution models to survey catch data. Taxonomic groupings were defined from a prior northern Bering Sea analysis of bottom trawl surveys conducted from 2010-2021 (Markowitz et al., 2022). These taxonomic groupings were important representatives of the demersal marine community as identified by Bering Sea native communities (Markowitz et al., 2022). We do not have similar distinctions for those communities living within the Chukchi Sea, however these taxonomic groupings represent a diverse range of fish and invertebrate taxa in an area proximal to the Chukchi Sea via the Bering Strait. Taxa were further filtered to those with reasonably high catchability for each of the two gears (Lauth et al., in review) and models were fit separately for each taxon and gear type to reflect those differences in catchability.
Conditioning and operating models
We conditioned univariate spatiotemporal distribution models on historical catch and effort survey data for a particular gear and taxon using the VAST (vector autoregressive spatio-temporal) R Package [v. 4.0.2; Thorson and Barnett (2017); Thorson (2019)]. The VAST model applied here is a spatiotemporal generalized linear mixed‐effects model where Gaussian Markov random effects describe spatial and/or spatiotemporal variation (spatial variation that is constant or time-varying, respectively) in density and temporal variation in the mean density is modeled as a fixed effect of survey year. Continuous spatial and/or spatiotemporal random fields were approximated using the INLA R package [www.r-inla.org; Rue et al. (2009)] using a mesh with 200 spatial “knots” where the values of spatial variables between knot locations are calculated via bilinear interpolation. Spatiotemporal fields were modeled as independent and identically distributed among years. If a model with spatiotemporal variation included resulted in a decreased (i.e. 2-unit decrease) AIC value relative to the model estimated with only spatial variation, it was chosen as the operating model for a given taxon/gear combination. Otherwise, a model with only estimated spatial variation was chosen. The “Poisson-link” reformulation of a conventional delta model was used (Thorson, 2018), and a gamma distribution was specified for modeling biomass density.
The density () of each taxon was predicted onto the Chukchi spatial domain based on the maximum likelihood estimates of the parameters of the chosen model for each gear type. The total abundance index () of taxon in year t was calculated using an epsilon bias-correction technique (Thorson and Kristensen, 2016) and represents the “true” abundance from which to evaluate the design-based abundance indices of the different surveys tested. Using the fitted spatiotemporal model as an operating model, population densities were simulated for each taxon with observation error to represent samples obtained by simulating surveys under different sampling designs as in the “Survey Simulation” section below.
Survey designs
Three survey designs were tested: SRS, STRS, and a fixed-station systematic grid (SYS) under a range of total sampling effort from roughly 50 - 175 total stations. Distance from shore and latitude were used as stratum variables for the STRS designs and the SamplingStrata R package Barcaroli (2014) was used to optimize the placement of stratum boundaries and allocation of effort across strata subject to user-defined pre-specified precision targets for each taxon. A full explanation of the optimization methods can be found in Barcaroli (2014) and an application of the STRS survey design optimization in the Gulf of Alaska is described in Oyafuso et al. (2021; 2022). Appendix A provides more detail into how the STRS optimization was parameterized for the Chukchi BTS. For each gear type we optimized stratum boundaries for three- and four-stratum solutions, as this range of strata created the most reasonable solutions given the range of sample sizes analyzed.
Survey simulation
The estimated abundance index for taxon in year t and associated variance for the three designs were calculated following Wakabayashi et al. (1985):
where is the mean CPUE (units ) in stratum ( total strata), taxon , and year , and is the total area (units ) of stratum .
The above equations can be used for calculating total abundance and variance under SRS and SYS by assuming one stratum, . While some studies indicate more appropriate variance estimators for systematic designs (e.g., Aune-Lundberg and Strand, 2014), the naive approach of assuming SRS estimators was used to calculate the abundance index and variance for the SYS simulations.
Each survey was replicated for iterations. It was assumed that all sampling units were available for trawling, however in practice, variation in bottom rugosity and currents may render some sampling units untrawlable (i.e., unavailable to the sampling frame). Due to the limited data used to condition the operating model, high positive outliers in density masked the trends in the performance metrics. Thus, prior to calculating the performance metrics, positive outliers greater than three standard deviations above the mean among survey replicates were removed.
Performance metrics
Three performance metrics were used to evaluate survey designs. The True CV () is the variability of the estimated abundance index across the survey replicates and is defined as the standard deviation of the estimated indices of abundance normalized by the true value, , where refers to the vector of estimated indices for taxon and year across the replicates. The True CV provides two pieces of information about the precision of the survey design: 1) if the True CV is low for simulated densities generated from one type of survey (e.g., 0.2), that is an indication that the survey is appropriate for a species with that type of distribution (i.e., the data quality is high); and 2) a very low True CV (e.g., 0.05) can indicate that any survey will have a hard time estimating the variability in the density of the target species, in which case the relative root-mean-square error (RRMSE) of the CV is a useful diagnostic for determining whether a proposed survey can provide a reliable estimate of CV. The RRMSE of CV is defined as where refers to the vector of estimated sample CVs for taxon and year across the replicates. Lastly, bias is the residual of a quantity relative to its assumed “true” value. Bias of the estimated index of abundance from a sample is relative to the assumed true index conditioned by the data. Bias of the estimated sample CVs associated with the index of abundance is relative to the True CV.
Code repository
The code used to perform this analysis and format this manuscript is currently stored in a code repository in Z. Oyafuso’s NOAA GitHub account and can be accessed at https://github.com/zoyafuso-NOAA/chukchi_survey_evaluation.
Results
Species distributions
The species included in this analysis exhibited a diversity of spatiotemporal distributions (Figure 1; see Appendix B for full spatiotemporal distributions and diagnostic plots). Alaska plaice (Figure 1L), saffron cod (Figure 1G), and yellowfin sole (Figure 1R) were restricted to the southeastern portion of the domain which includes Kotzebue Sound. Bryozoans (Figure 1N), tunicates (Figure 1Q), sculpins (Figure 1H), poachers (Figure 1E) and jellyfishes (Figure 1D) were more commonly observed in the middle of the domain around Point Hope. Purple-orange sea stars (Figure 1F) had a broad nearshore distribution along much of the coastline of the domain, whereas eelpouts (Figure 1O), snailfishes (Figure 1I), and Bering flounder (Figure 1B) had more offshore distributions along the western edge of the domain. Snails were commonly observed across the spatial domain across both gears (Appendix B14). Arctic cod were commonly observed with broad distributions across the domain (Figure 1A), although with higher densities at beam trawl stations in the northern part of the domain in 2019 compared to beam trawl stations in 2012 and 2017 (Appendix B2). Soft corals and sea anemones (primarily the sea raspberry Gersemia rubiformis and miscellaneous anemones; Figure 1C) and walleye pollock (uncommonly observed; Figure 1M) had patchier distributions. Snow crab had higher offshore densities near the western boundary of the domain (Figure 1K) but were present in high densities in the northern part of the domain as well (Appendix B15).
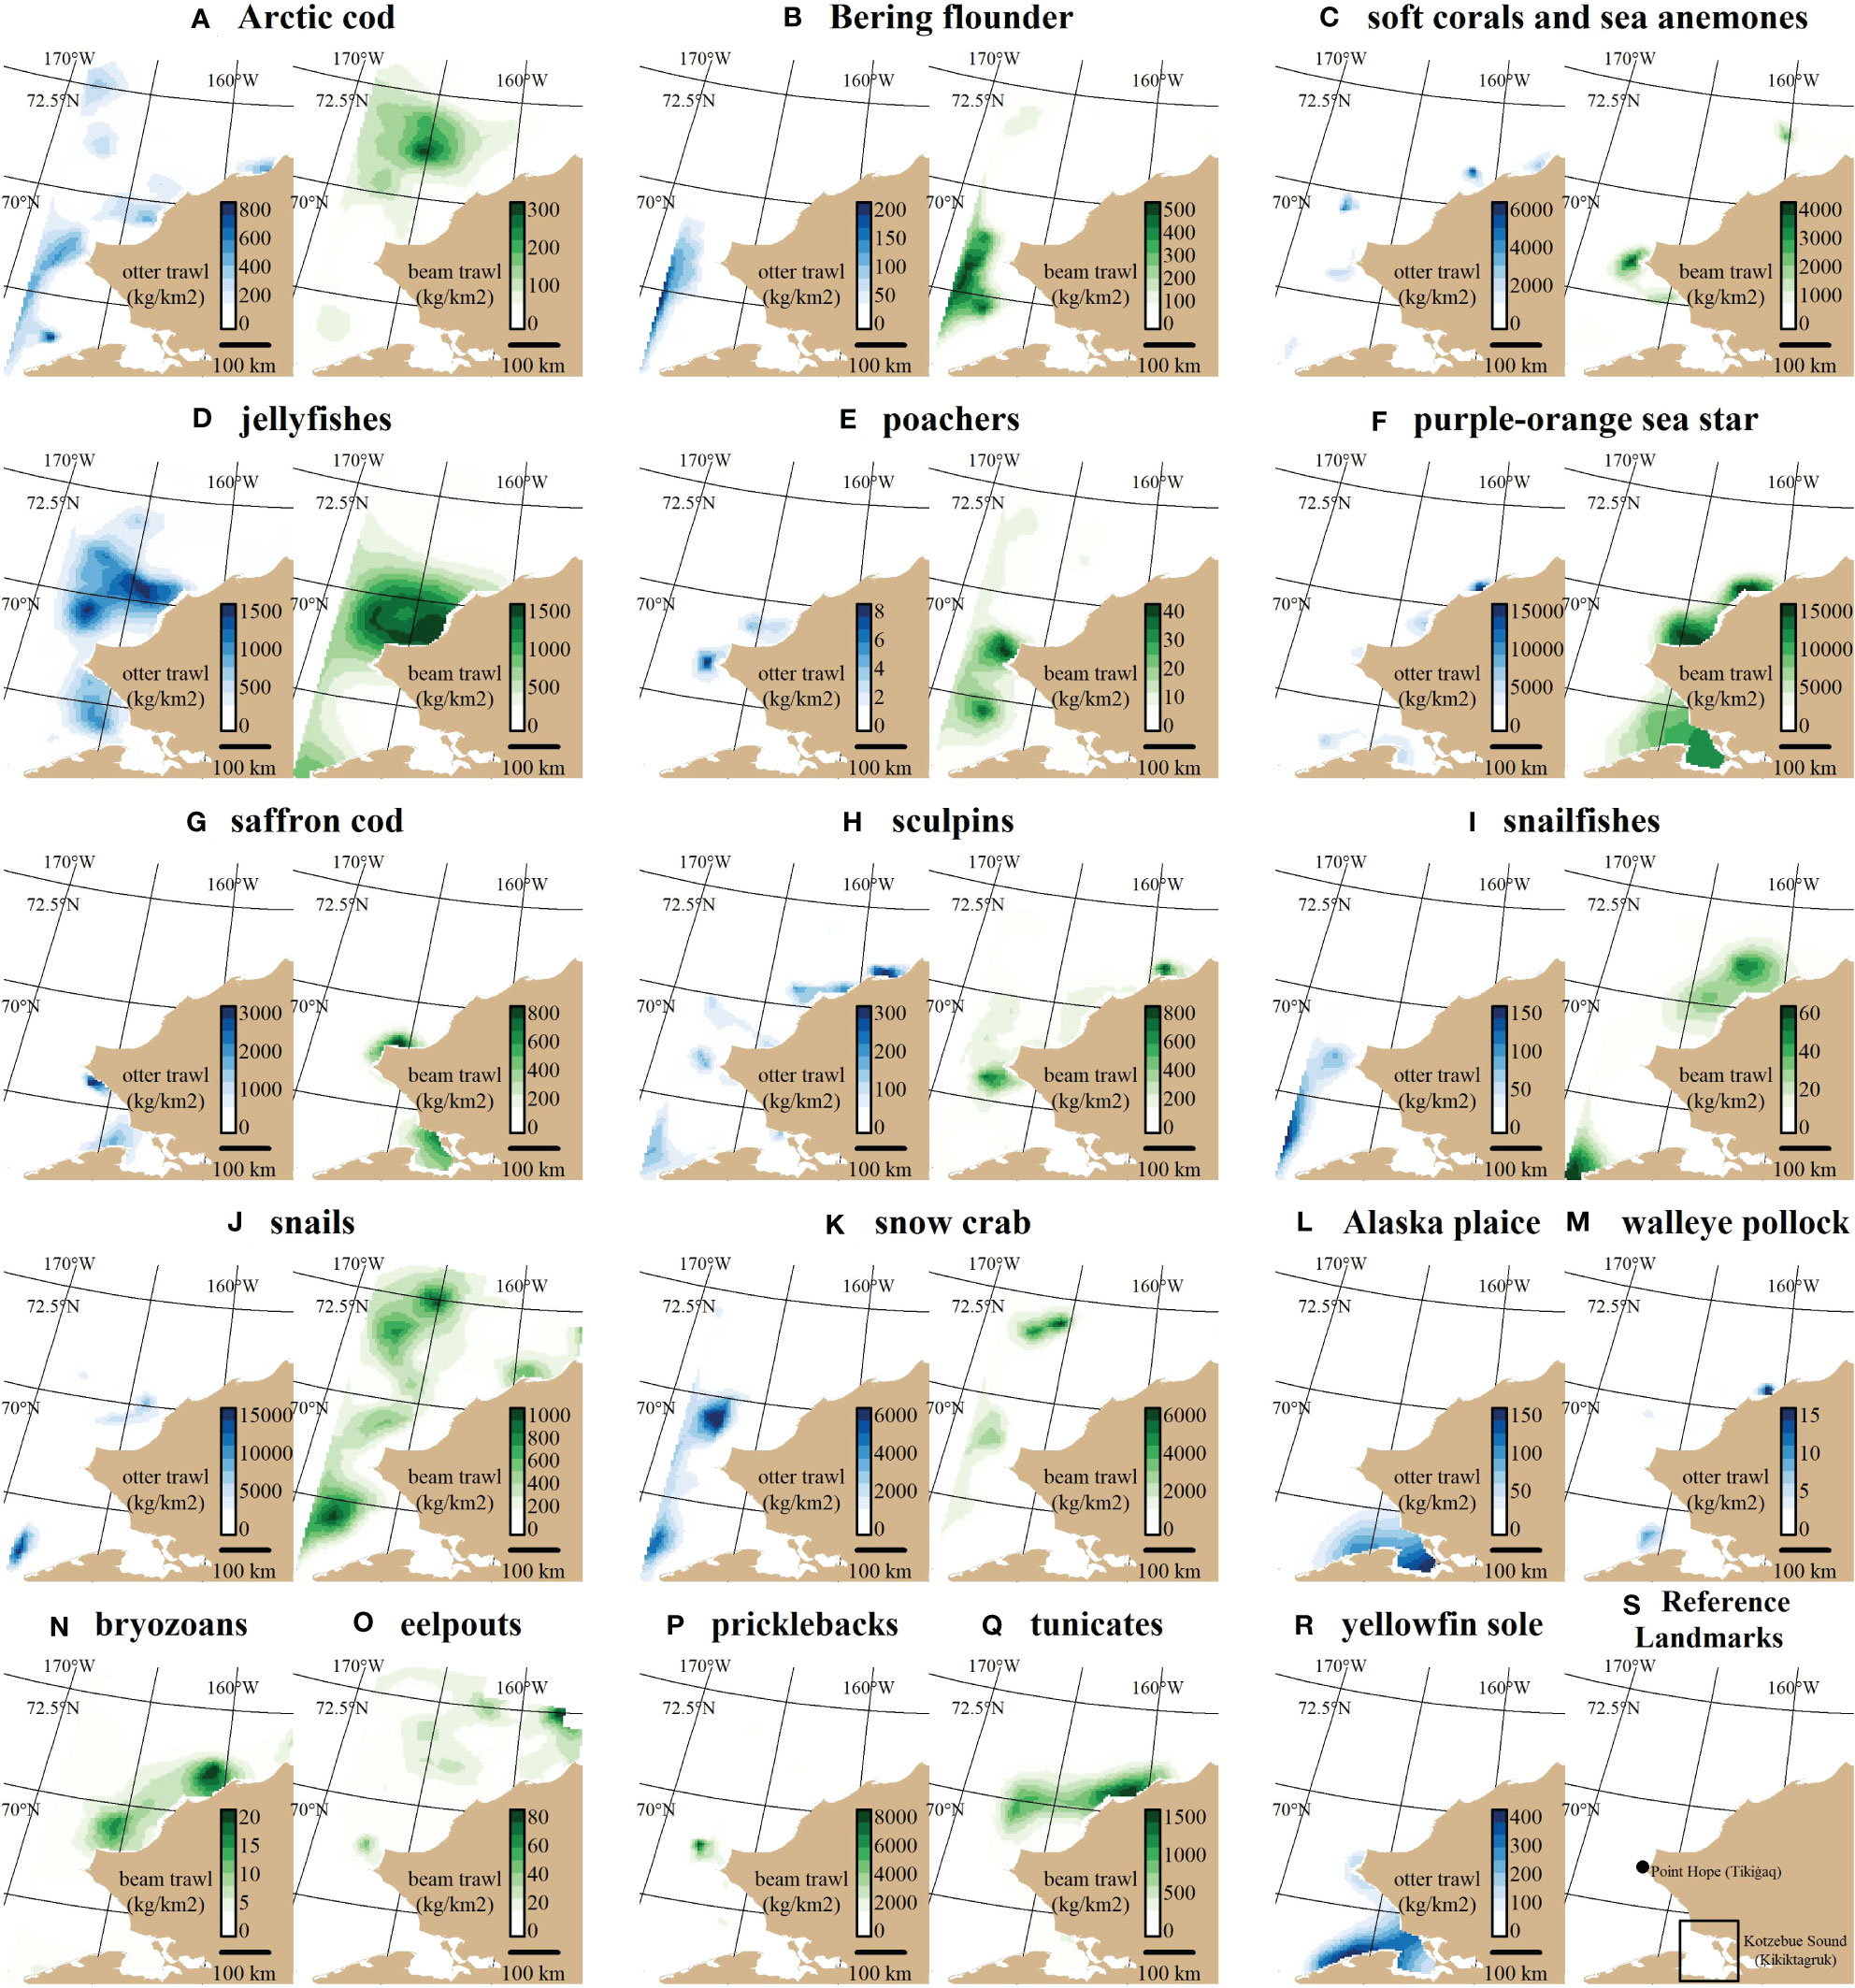
Figure 1 Predicted densities () for each taxon (A–R) under each gear type shown for the most recent survey year for a given gear type (2012 for the otter trawl (blue gradient) and 2019 for the beam trawl (green gradient)). (S) shows locations of major landmarks described in the text. Some taxa under a particular bottom trawl gear did not have an adequately fitting spatiotemporal distribution model (see Table 1 for specifications).
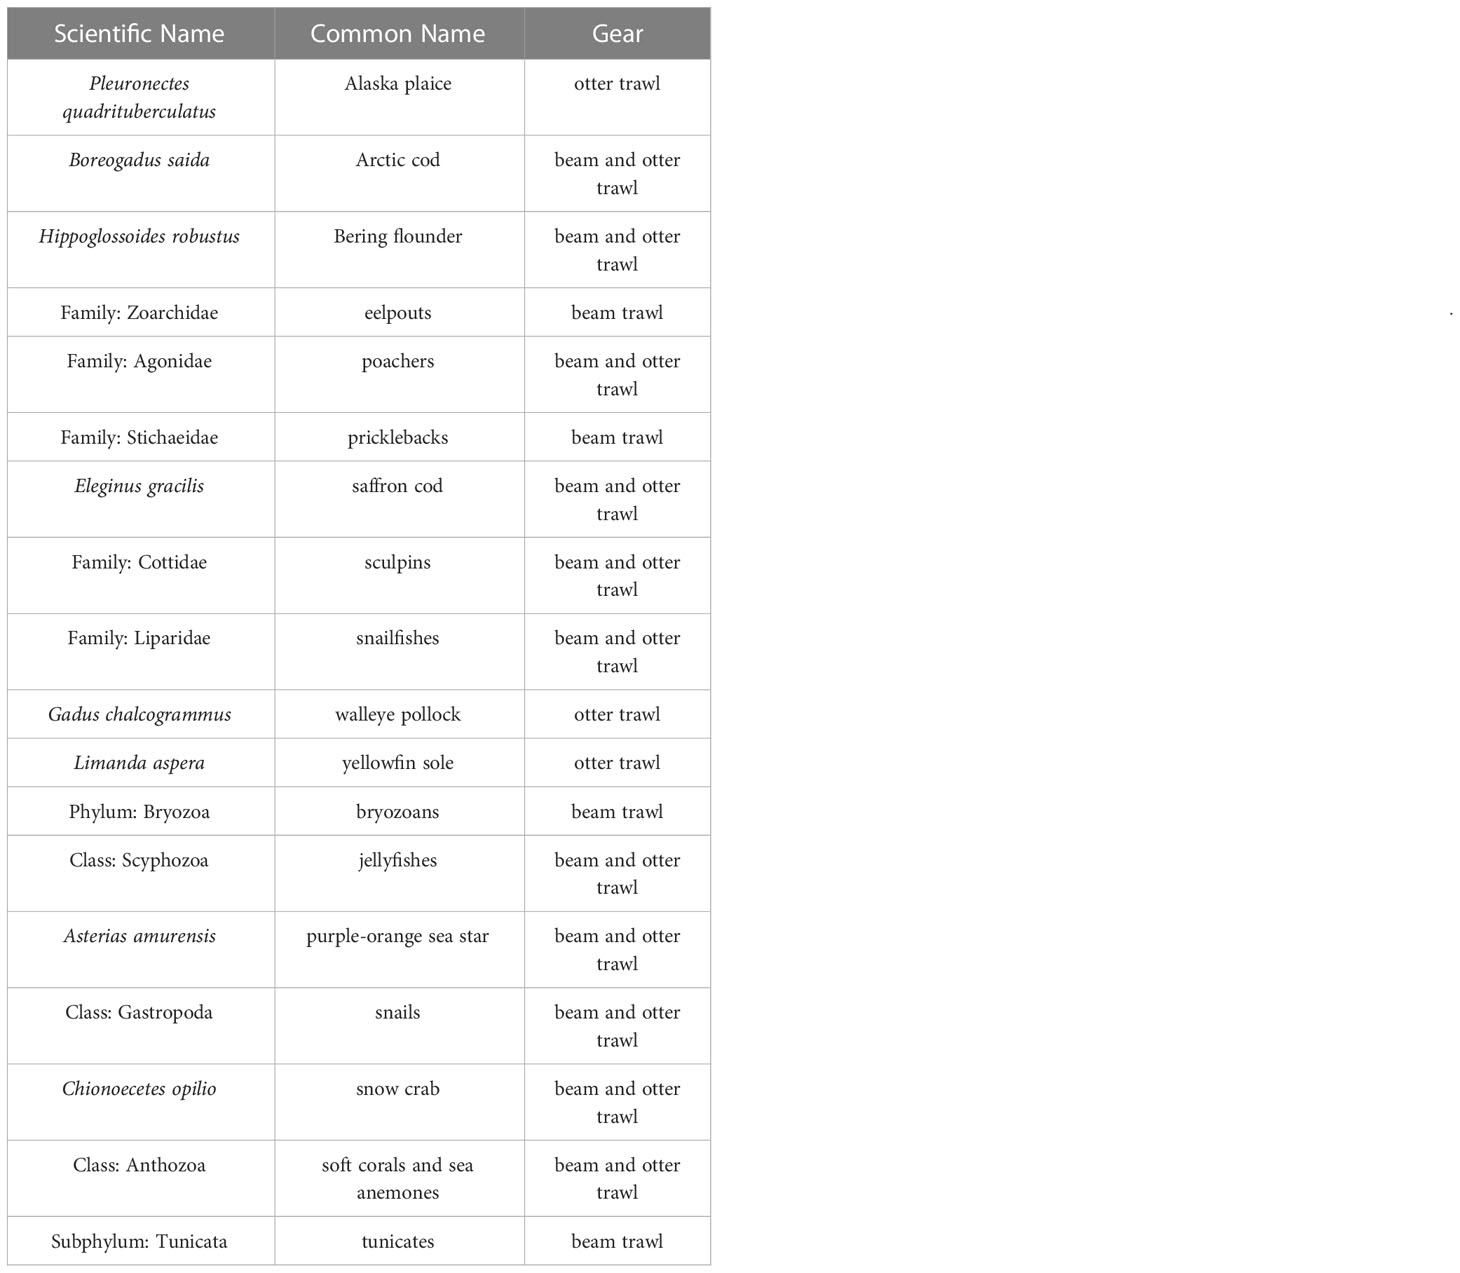
Table 1 List of the fish and invertebrate taxa and associated gears included in the analysis.
Multispecies STRS design optimization
Stratum boundaries of both otter and beam trawl survey optimizations generally separated the domain of the Chukchi Sea into two latitudinal sections split at roughly 69 and 70 degrees N latitude (Figure 2). The three-stratum otter trawl solution (Figure 2A) consists of two latitudinal boundaries at roughly 70 and 71 degrees N latitude. The four-stratum otter trawl solution (Figure 2B) shares the northern latitudinal boundary at 71 degrees N latitude but also adds a nearshore stratum in the southern part of the domain. The three-stratum beam trawl solution (Figure 2C) has a southern stratum with a northern boundary at roughly 69 degrees N latitude and two inshore/offshore strata in the northern section of the domain. The four-stratum beam trawl solution (Figure 2D) is similar to the three-stratum beam trawl solution but two inshore/offshore strata in the southern section of the domain.
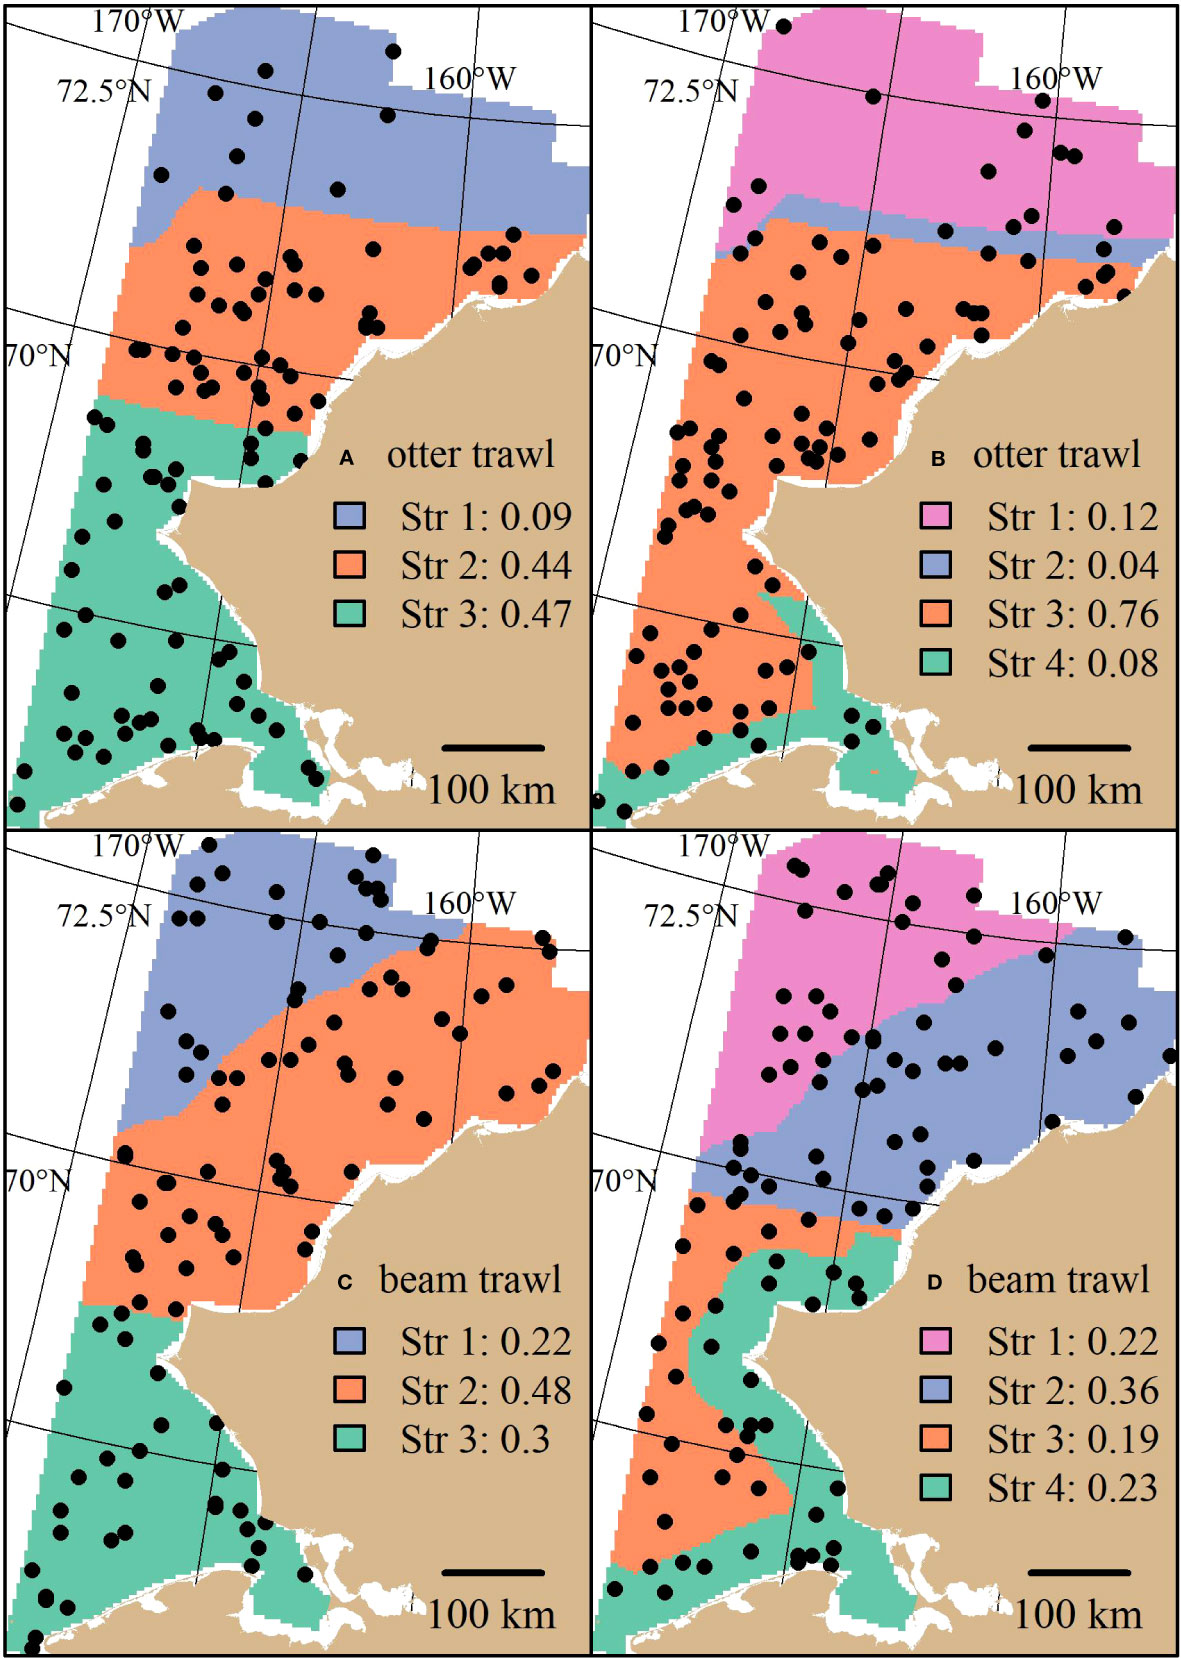
Figure 2 Stratified random designs resulting from the stratified random design optimization algorithm using three and four strata for the otter (A, B) and beam (C, D) trawl gears. Distance to shore and latitude characterize the different strata. An example of 100 stations randomly drawn from the optimal allocation are superimposed as points. The proportion of stations allocated across strata are shown in the legend.
Sampling densities for the otter trawl STRS designs were generally higher in the southern and central strata and less so in the northern strata. Sampling densities for the beam trawl solutions were proportional to stratum area. For the subsequent survey simulation section, the four-stratum solution for the beam trawl and the three-stratum solution for the otter trawl were used as the representatives of the STRS design in the survey simulations.
Survey performance
The random designs (SRS and STRS) monotonically decreased in True CV with increased sample size for both gears. Since CV and precision are conversely related (lower True CV is interpreted as higher precision and vice versa), we will describe survey performance using both terms. The STRS designs often provided lower True CVs than the SRS designs at equivalent sample sizes, especially for taxa collected via the otter trawl (Figure 3). The increase in precision from a random to a stratified design was less for the taxa sampled with the beam trawl, with many taxa performing similarly to the SRS design (Figure 4). Given the limited data used to condition the operating model, the inconsistent +/- 5% bias observed with the estimated index is fairly low (Figures 5, 6).
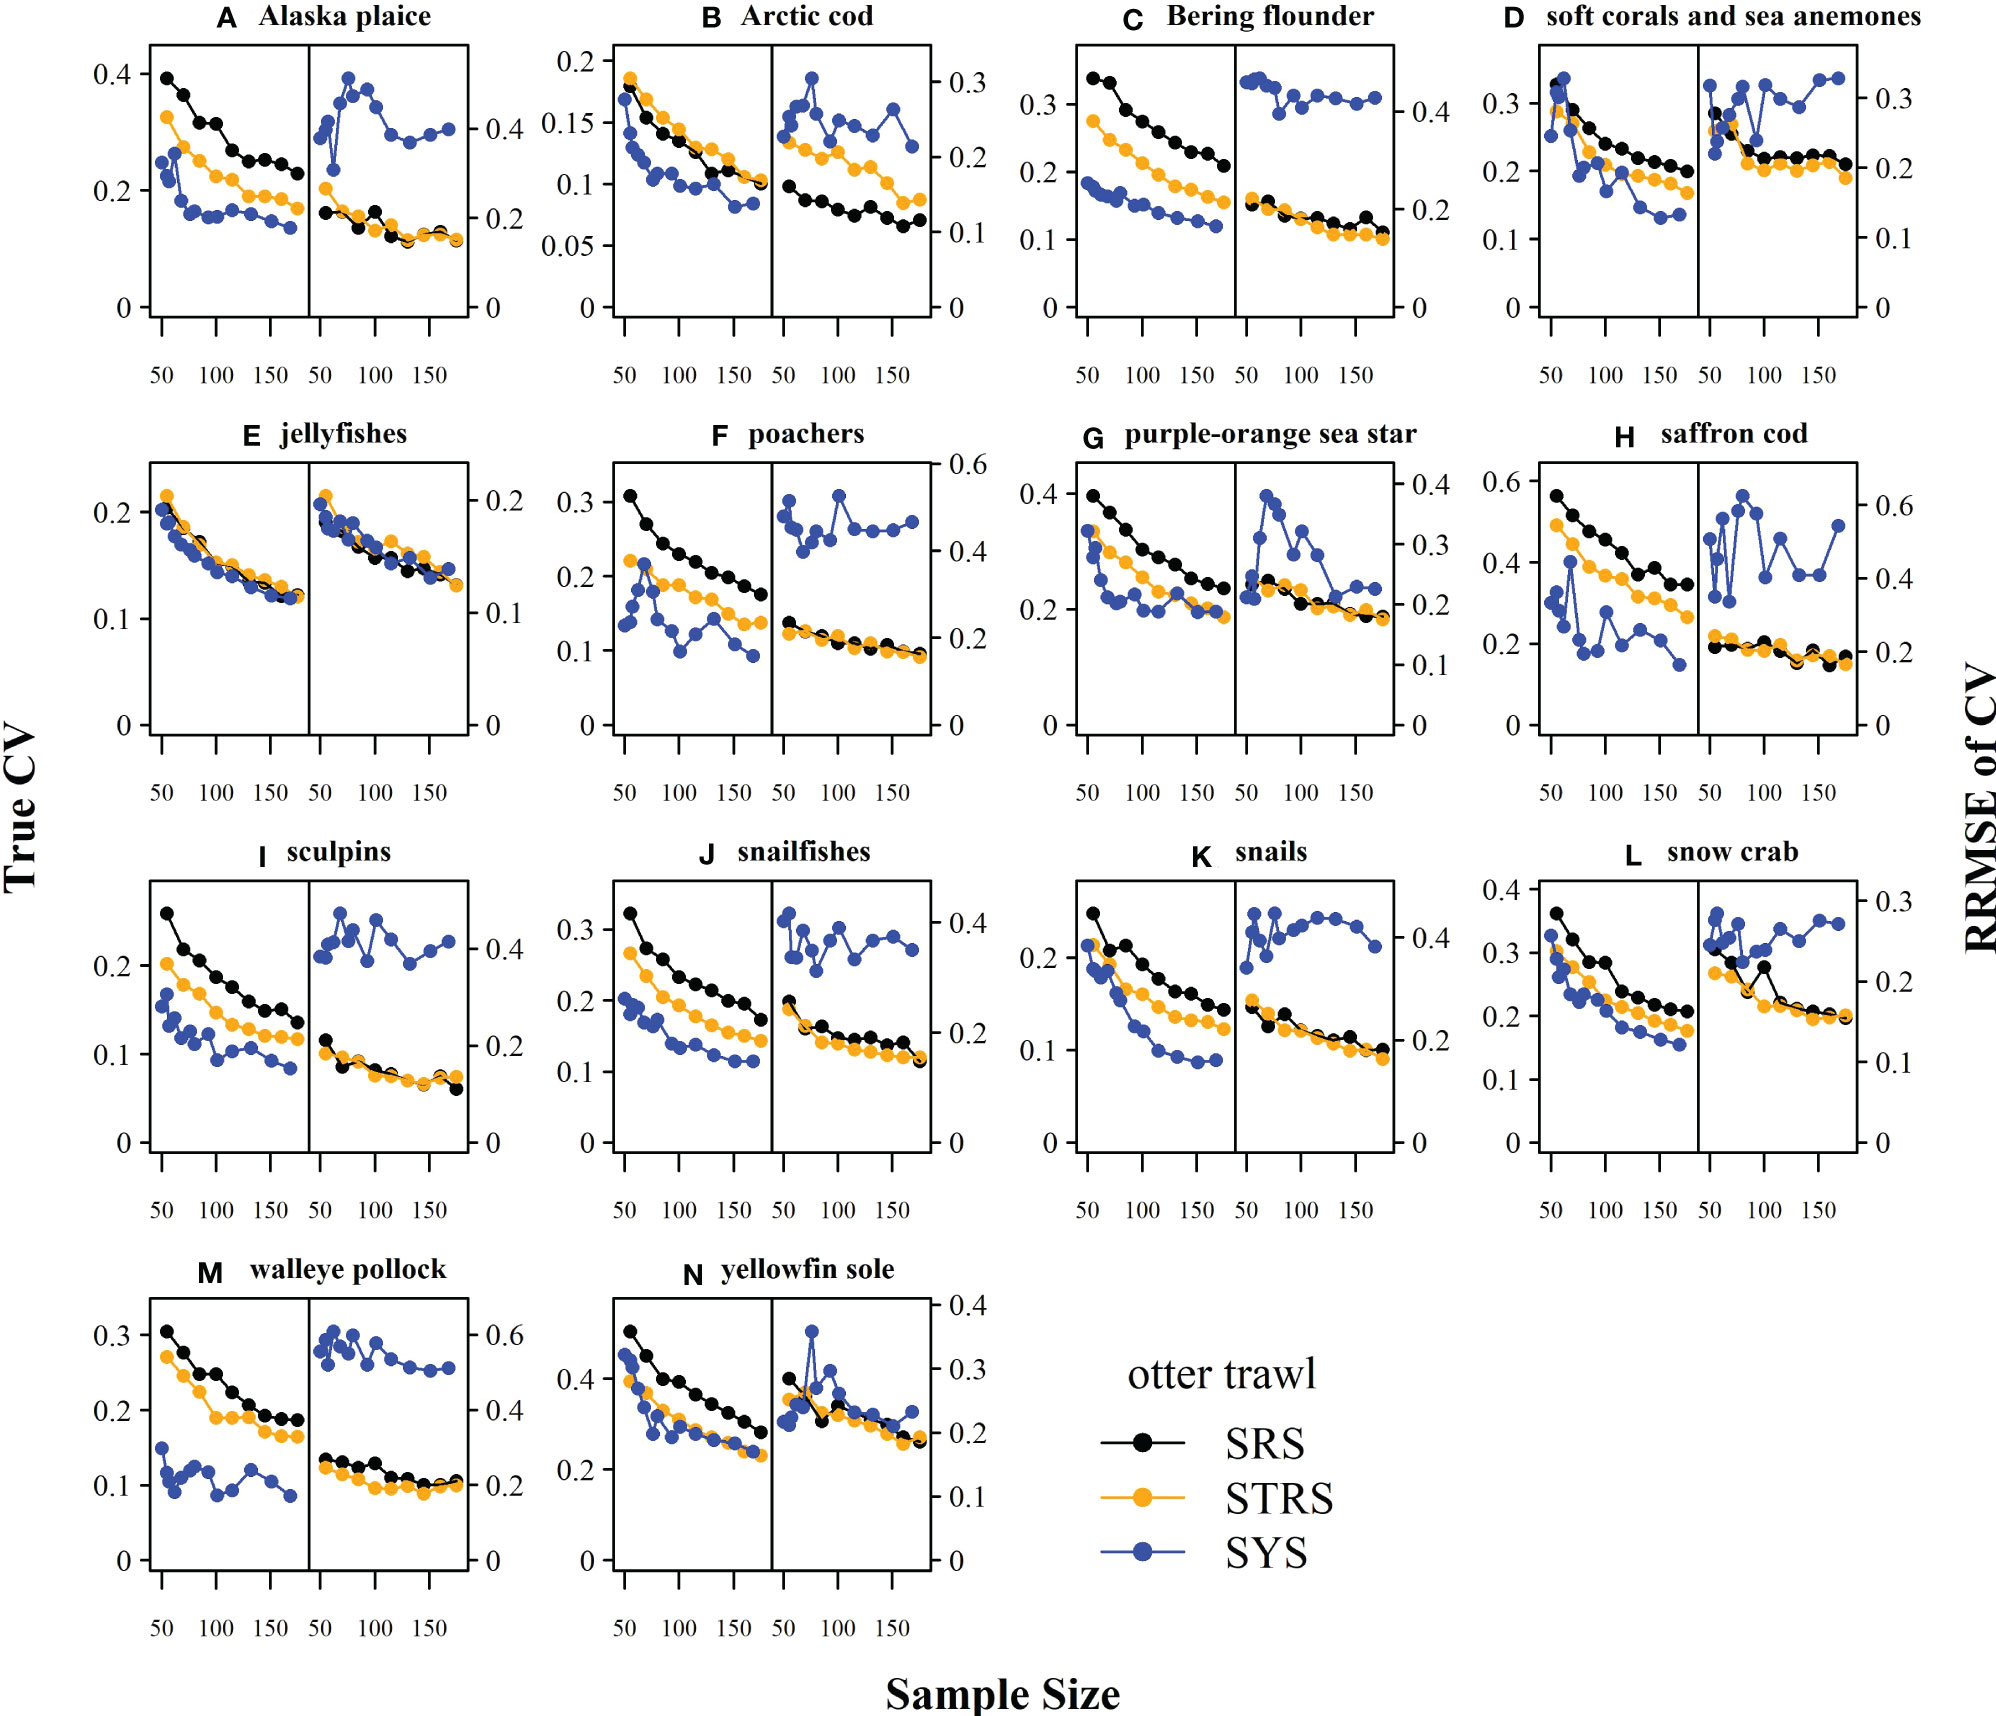
Figure 3 True CV (left-side of panel) and relative root mean square error (RRMSE) of CV (right-side of panel) across a range of total sampling effort for each taxon (A–N) and survey design for the otter trawl gear. SRS, simple random sampling; STRS, stratified random sampling optimized over the species set; SYS, fixed-grid systematic sampling.
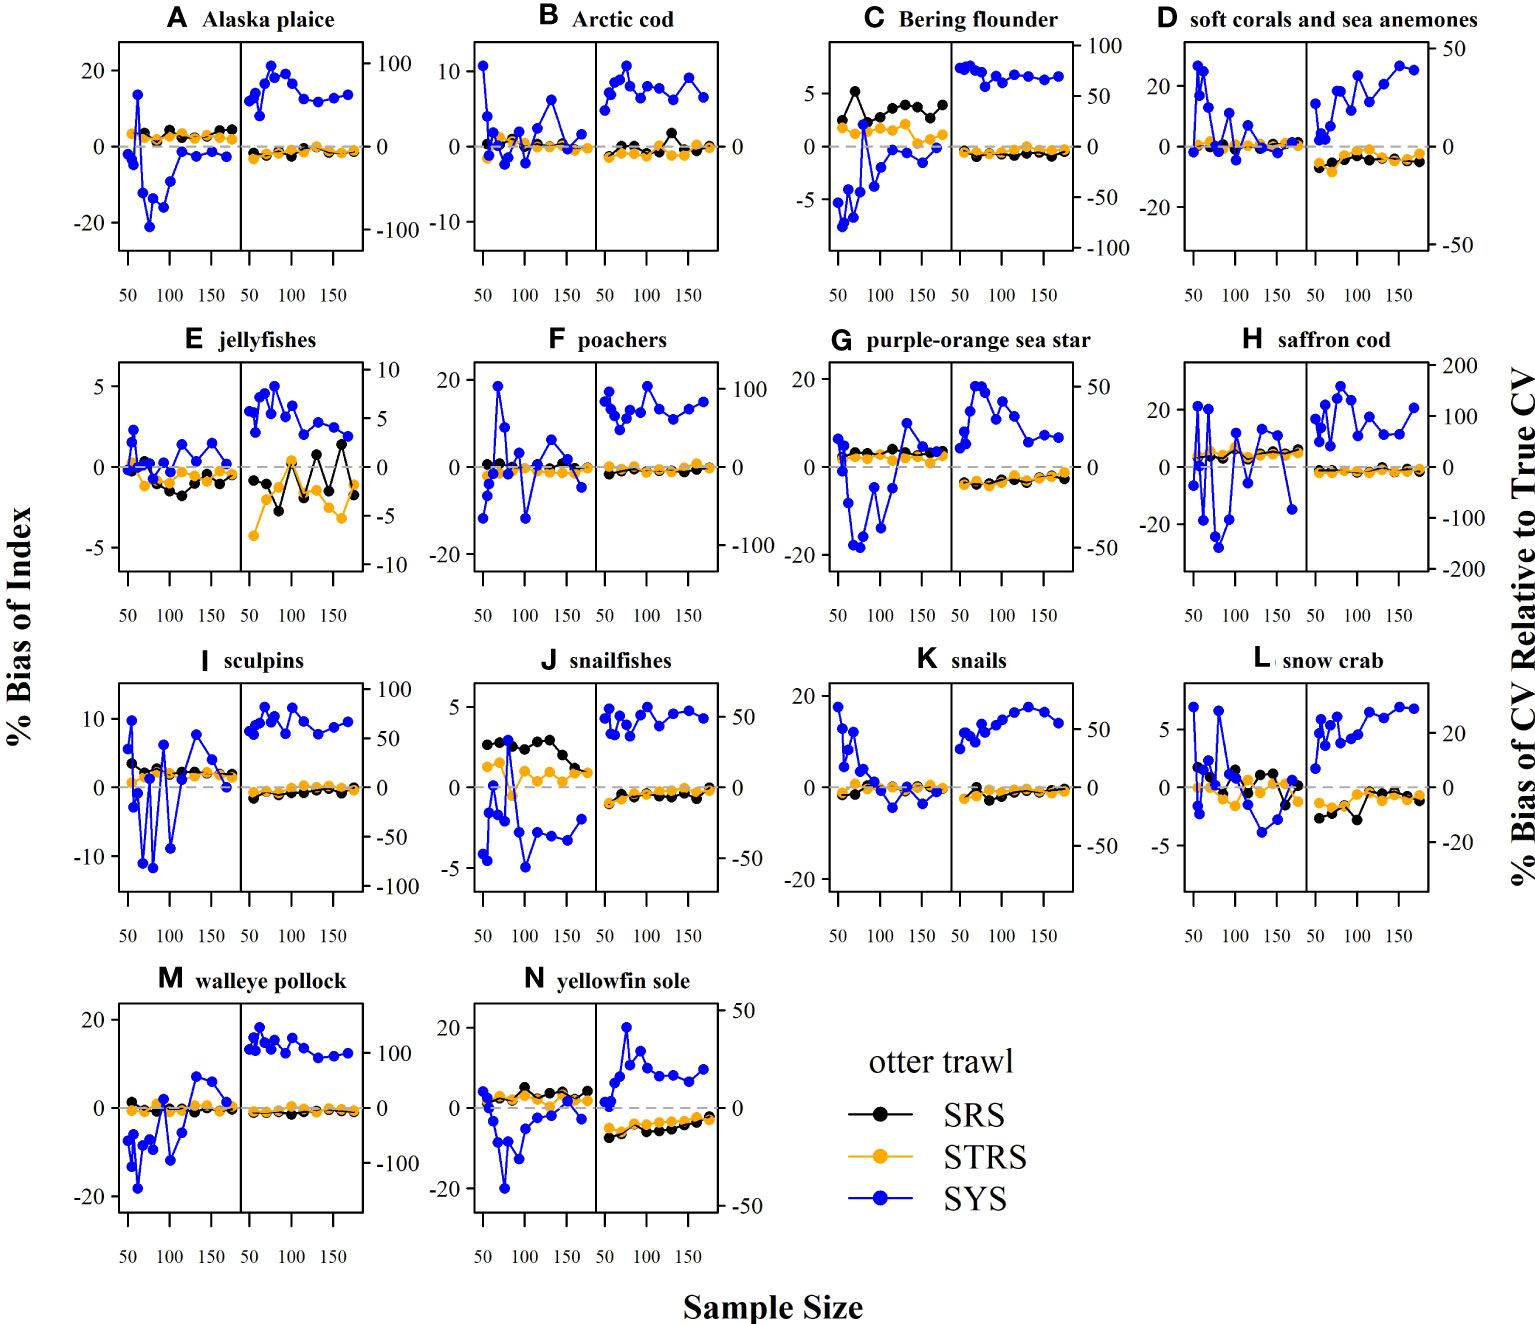
Figure 4 True CV (left-side of panel) and relative root mean square error (RRMSE) of CV (right-side of panel) across a range of total sampling effort for each taxon (A–N) and survey design for the beam trawl gear. SRS, simple random sampling; STRS, stratified random sampling optimized over the species set; SYS, fixed-grid systematic sampling.
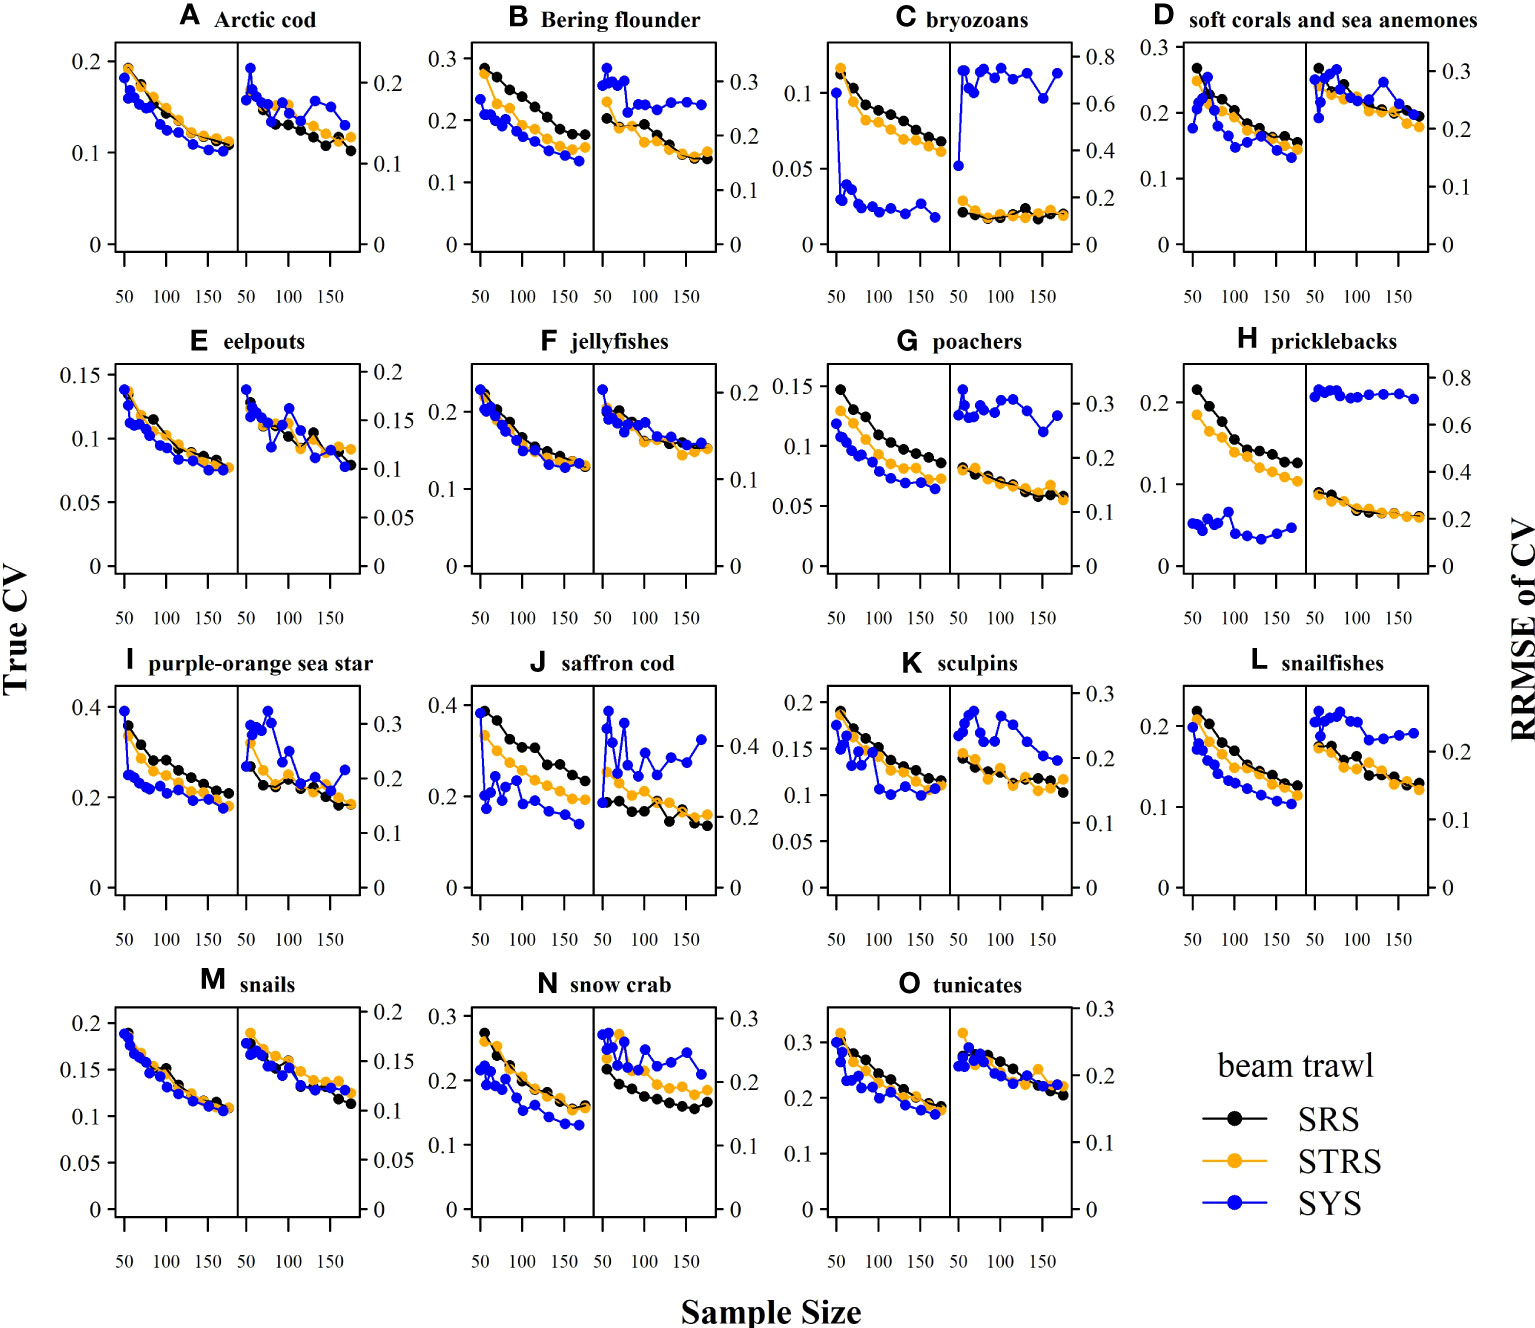
Figure 5 Average percent bias of the 1) estimated abundance relative to the true abundance (left-side of panel) and 2) estimated sample coefficient of variation (CV) relative to the True CV (right-side of panel) across sample size for each taxon (A–O) and survey design for the otter trawl gear. Dashed grey line at zero included for reference. SRS, simple random sampling; STRS, stratified random sampling optimized over the species set; SYS, fixed-grid systematic sampling.
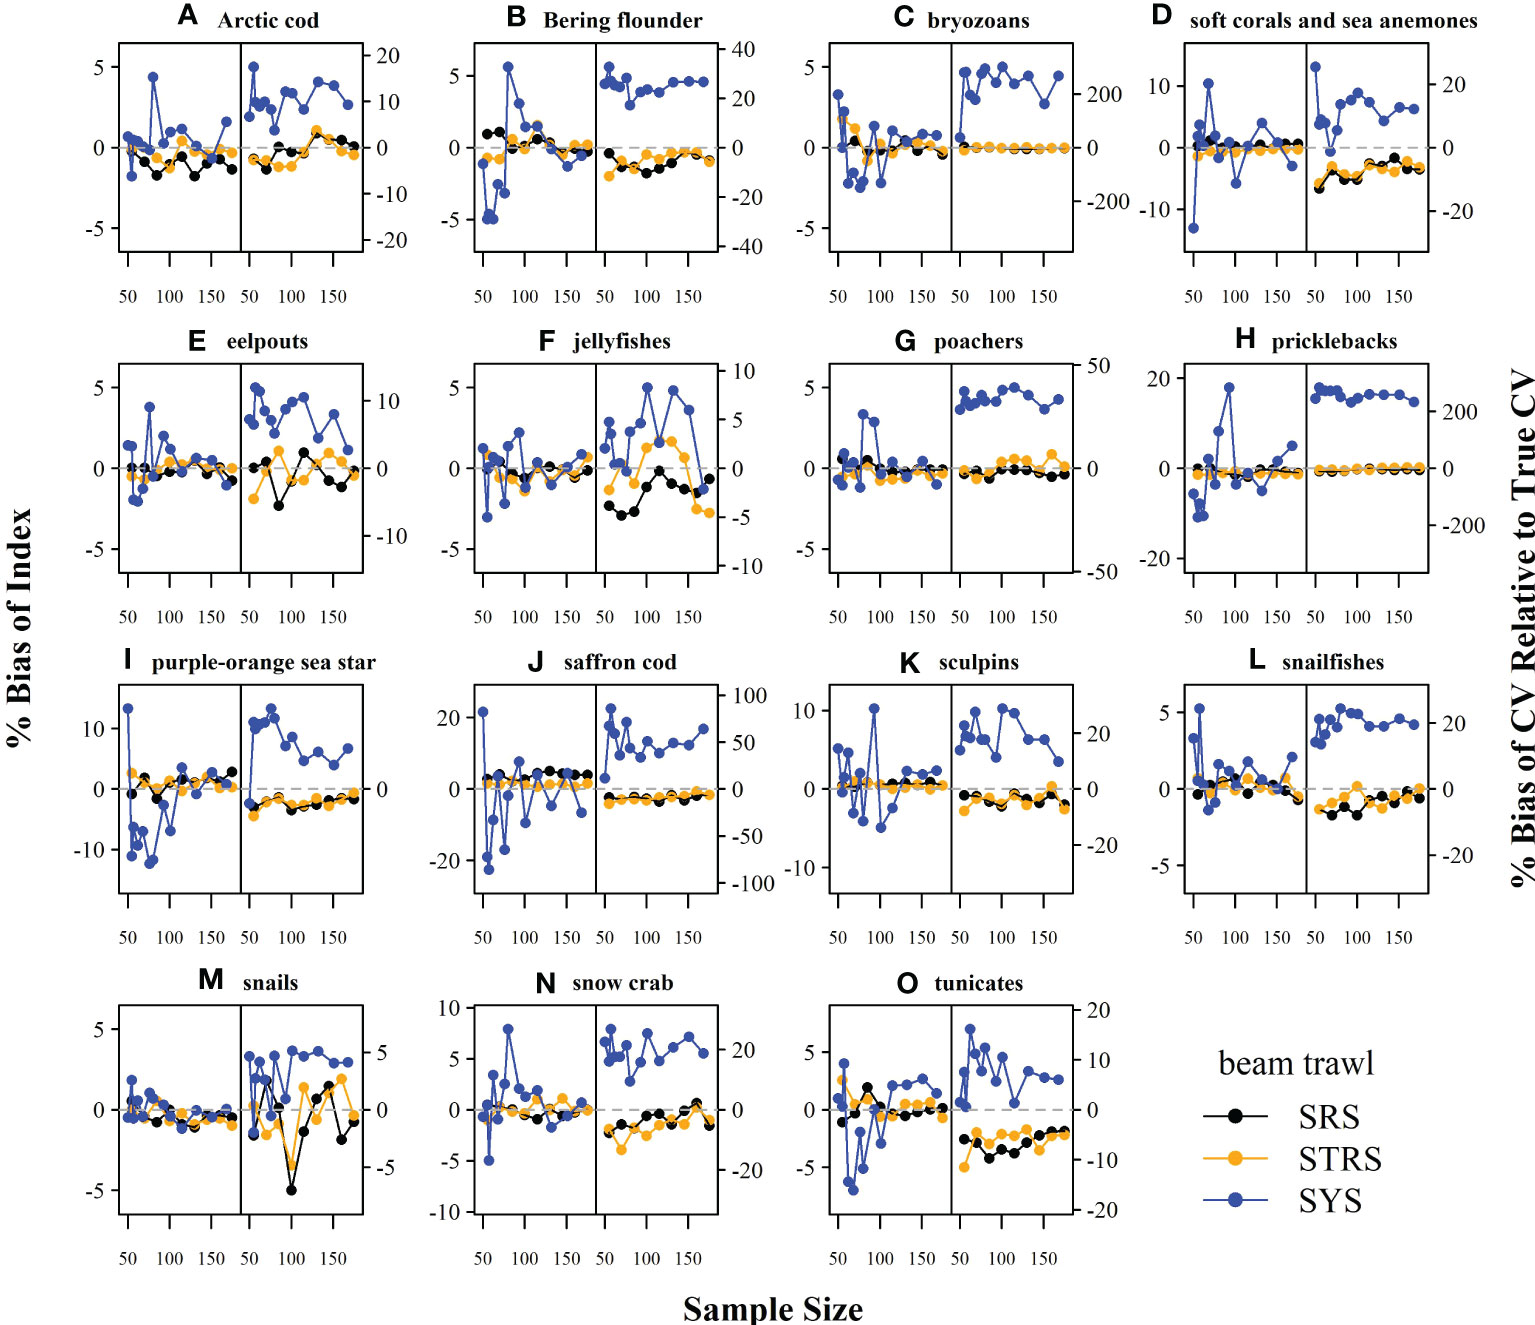
Figure 6 Average percent bias of the 1) estimated abundance relative to the true abundance (left-side of panel) and 2) estimated sample coefficient of variation (CV) relative to the True CV (right-side of panel) across sample size for each taxon (A–O) and survey design for the beam trawl gear. Dashed grey line at zero included for reference. SRS, simple random sampling; STRS, stratified random sampling optimized over the species set; SYS, fixed-grid systematic sampling.
The SYS design often provided the lowest True CVs compared to the two random designs; however, this design displayed inconsistent behavior, as the True CV did not always decrease with sample size. Furthermore, there was a tradeoff observed for many taxa under both gears, where lower True CVs were associated with much higher RRMSE of CV (Figures 3, 4). The higher RRMSE of CV of the fixed systematic grid was attributed to a high positive bias of the simulated sample CVs relative to the True CV (Figures 5, 6). The average bias of the abundance indices for the SYS designs across taxa were not consistent across total sample size, with as much as a 25% fluctuation in average bias (Figures 5, 6).
Discussion
When considering changes to ecological surveys, one must weigh the advantages of consistency with historical designs in the same or adjacent regions against potential gains in efficiency and flexibility of a new design. A SYS design, as currently implemented in the Bering Sea BTS, may be a logical choice for a Chukchi BTS as a natural extension to the established Bering Sea SYS design. Surveys conducted under a SYS design provide good spatial coverage of the sampling domain and can thus be advantageous in the early, data-limited stages of a survey time series. Having evenly spaced sampling stations is also logistically advantageous, in that the completion rate of stations per day is more consistent than with stations chosen under randomized designs. When minimizing the survey CV is the top priority, systematic survey designs should ideally be created with random starting locations to slightly vary the locations of stations within the sampling frame. However, the SYS design as currently implemented in all Bering Sea BTS is the most practical survey design due to those aforementioned logistical survey planning advantages.
The main tradeoff of the logistical advantages of the SYS design was the reduced quality of the statistical data products that might result from such a design, as observed in our simulation testing. We found that randomized designs provided more reliable estimates of abundance and precision than SYS designs for the US Chukchi Sea. While the True CVs for many taxa were lower under SYS, the estimates of the variance were less reliable (i.e., RRMSE of CV) when compared to both randomized designs. The tradeoff between the RRMSE of CV and True CV has been shown previously in the Gulf of Alaska when comparing proposed optimized STRS designs with historical STRS designs using similar simulation testing (Oyafuso et al., 2022). Variance is a critical measure of the quality of a survey and can be used as a data weight in stock assessment models, however the estimation of variance can be unreliable depending on the design of the survey, along with other considerations like variation in catchability (Kotwicki and Ono, 2019). The stratified random designs created in our analysis provided an advantageous combination of increased precision relative to SRS and increased reliability of the estimated CVs relative to the True CVs.
A challenge of designing STRS surveys in a region like the Chukchi Sea with highly dynamic oceanographic conditions is that historical data to inform the design (i.e., stratification and effort allocation across strata) may not represent the current ecosystem state, similar to the challenge of forecasting species distributions to novel environmental conditions due to climate change (Brodie et al., 2022). While the last NMFS beam trawl survey in the Chukchi Sea occurred in 2019, the most recent Chukchi Sea NMFS otter trawl survey occurred in 2012. Within the same range of time (i.e., the last ten years), there have been significant poleward shifts in the distributions of many subarctic taxa common to the Bering Sea (Kotwicki and Lauth, 2013; Stevenson and Lauth, 2019; Maznikova et al., 2023a) but previously seldom observed in the Chukchi Sea, including many Bering Sea gadids like walleye pollock (Datsky et al., 2022; Wildes et al., 2022). With continued sampling of the region, the design of a STRS survey could be easily modified to reflect the species distributions observed in more recent years. The discussion of the range of years to include when planning surveys is outside the scope of this paper, however our approach to updating STRS designs is amenable to testing and planning STRS designs that incorporate varying ranges of years to provide more weight to contemporary data.
We investigated survey designs implemented with both otter and beam trawl gears in order to anticipate survey designs consistent with the standardized bottom trawl gears used for NMFS-AFSC BTS. The patterns among survey designs previously discussed were present in both the beam and otter trawl gears. However, there were some differences in the optimized STRS designs calculated for each gear type. The STRS designs for both gears had similar stratifications that split the Chukchi spatial domain by two or three latitudinal regions and inshore/offshore strata. However, the sampling densities for the otter trawl solutions were higher in the southern and central strata compared to the northern strata, whereas the beam trawl sampling densities were nearly proportional to stratum area. As a result, the performance of the STRS beam trawl survey abundance estimates were similar to the SRS design with some improvement in True CV for a handful of taxa (e.g., Bering flounder, pricklebacks, saffron cod). We presume that the expected gains in precision that come from stratification were diminished because of the strong tradeoffs that exist when optimizing over a wide set of taxa with non-overlapping spatiotemporal distributions. Lastly, additional examination of optimal number of strata along with the choice of other relevant stratum variables (e.g., sediment type, depth, temperature, etc.) similar to (Oyafuso et al., 2021; Oyafuso et al., 2022) could further improve the statistical efficiency of a Chukchi Sea STRS BTS design.
The list of taxa to include in survey planning is an important decision process and should be a part of broader discussions about survey objectives. We curated our taxa list by first considering taxa that can be appropriately sampled by either the otter and/or beam trawl gears (Lauth at al., in review). We then considered commercial importance given the distribution shifts of commercially important Bering Sea species into the Chukchi Sea as well as species like Arctic cod that have been observed to be trophically important in the Chukchi Sea for various seabirds and marine mammals (Kokubun et al., 2015; Quakenbush et al., 2015; Florko et al., 2021). Lastly, it is critical to engage with stakeholders to consider their values and understand how to monitor species of direct and indirect (e.g., dependent prey) importance to the resources they use. In the US Chukchi Sea, the primary stakeholders are coastal Alaska Native communities. Marine mammals are important to Alaska Native communities for subsistence and cultural value and while trawl surveys cannot monitor marine mammals, they can be used to monitor prey species on which these marine mammals depend. We have used information learned from Alaska Native communities representing the northern Bering Sea (Markowitz et al., 2022) to identify species used for subsistence or other purposes. Furthermore, we have begun more extensive efforts to consult with Alaska Native communities in the US Arctic to further tailor potential monitoring efforts to align with their values. In summary, we recommend that ecosystem monitoring surveys be designed with thorough consideration of the values and objectives of all major components of the socio-ecological system and how these relate to the limitations of what can be effectively monitored with the observational methods available.
Data availability statement
Publicly available datasets were analyzed in this study. These data can be found here: https://github.com/zoyafuso-NOAA/chukchi_survey_evaluation.
Author contributions
ZO, LB, and SK conceived the idea of the research project. DC provided an additional source of data. All authors contributed to the article and approved the submitted version.
Acknowledgments
We would like to acknowledge the efforts of the NOAA AFSC Groundfish Assessment Program and Ecosystems and Fisheries-Oceanography Coordinated Investigations for successfully conducting the Chukchi Sea bottom trawl surveys. We would also like to thank NOAA-AFSC reviewers Elizabeth Logerwell, Thomas Hurst, Lukas DeFilippo, and two journal reviewers for comments that greatly improved the clarity of the manuscript.
Conflict of interest
The authors declare that the research was conducted in the absence of any commercial or financial relationships that could be construed as a potential conflict of interest.
Publisher’s note
All claims expressed in this article are solely those of the authors and do not necessarily represent those of their affiliated organizations, or those of the publisher, the editors and the reviewers. Any product that may be evaluated in this article, or claim that may be made by its manufacturer, is not guaranteed or endorsed by the publisher.
Supplementary material
The Supplementary Material for this article can be found online at: https://www.frontiersin.org/articles/10.3389/fmars.2023.1214526/full#supplementary-material
References
Abookire A. A., Rose C. S. (2005). Modifications to a plumb staff beam trawl for sampling uneven, complex habitats. Fish. Res. 71, 247–254. doi: 10.1016/j.fishres.2004.06.006
Aune-Lundberg L., Strand G.-H. (2014). Comparison of variance estimation methods for use with two-dimensional systematic sampling of land use/land cover data. Environ. Model. Soft. 61, 87–97. doi: 10.1016/j.envsoft.2014.07.001
Baker M. R., Farley E. V., Danielson S. L., Mordy C., Stafford K. M., Dickson D. M. S. (2023). Integrated research in the arctic – ecosystem linkages and shifts in the northern Bering Sea and eastern and western Chukchi Sea. Deep Sea Res. Part II: Top. Stud. Oceanog. 208, 105251. doi: 10.1016/j.dsr2.2023.105251
Barber W., Smith R., Vallarino M., Meyer R. (1997). Demersal fish assemblages of the northeastern Chukchi Sea, Alaska. Fish. Bull. 95, 195–209. Available at: https://spo.nmfs.noaa.gov/sites/default/files/pdf-content/1997/952/barber.pdf
Barcaroli G. (2014). SamplingStrata: an r package for the optimization of stratified sampling. J. Stat. Soft. 61, 1–24. doi: 10.18637/jss.v061.i04
Brodie S., Smith J. A., Muhling B. A., Barnett L. A. K., Carroll G., Fiedler P., et al. (2022). Recommendations for quantifying and reducing uncertainty in climate projections of species distributions. Global Change Biol. 28, 6586–6601. doi: 10.1111/gcb.16371
Budikova D. (2009). Role of arctic sea ice in global atmospheric circulation: a review. Global Planet. Change 68, 149–163. doi: 10.1016/j.gloplacha.2009.04.001
Cooper D. W., Cieciel K., Copeman L., Emelin P. O., Logerwell E., Ferm N., et al. (2023). Pacific cod or tikhookeanskaya treska (Gadus macrocephalus) in the Chukchi Sea during recent warm years: distribution by life stage and age-0 diet and condition. Deep Sea Res. Part II: Top. Stud. Oceanog. 208, 105241. doi: 10.1016/j.dsr2.2022.105241
Datsky A. V., Vedishcheva E. V., Trofimova A. O. (2022). Features of the biology of mass fish species in russian waters of the Chukchi Sea. 1. commercial fish biomass. family gadidae. J. Ichthyol. 62, 560–585. doi: 10.1134/S0032945222040051
Deary A. L., Vestfals C. D., Mueter F. J., Logerwell E. A., Goldstein E. D., Stabeno P. J., et al. (2021). Seasonal abundance, distribution, and growth of the early life stages of polar cod (Boreogadus saida) and saffron cod (Eleginus gracilis) in the US arctic. Polar Biol. 44, 2055–2076. doi: 10.1007/s00300-021-02940-2
Emelin P. O., Maznikova O. A., Benzik A. N., Sheibak A. Y., Trofimova A. O., Orlov A. M. (2022). Invader’s portrait: biological characteristics of walleye pollock Gadus chalcogrammus in the western Chukchi Sea. Deep-Sea Res. Part II: Top. Stud. Oceanog. 206:1–13. doi: 10.1016/j.dsr2.2022.105211
Florko K. R. N., Tai T. C., Cheung W. W. L., Ferguson S. H., Sumaila U. R., Yurkowski D. J., et al. (2021). Predicting how climate change threatens the prey base of arctic marine predators. Ecol. Lett. 24, 2563–2575. doi: 10.1111/ele.13866
Goddard P., Lauth R., Armistead C. (2014). Results of the 2012 Chukchi Sea bottom trawl survey of bottomfishes, crabs, and other demersal macrofauna (U.S. Dep. Commer., NOAA Tech. Memo. NMFS-AFSC-278), 110. Available at: https://repository.library.noaa.gov/view/noaa/4777.
Gunderson D. R., Ellis I. E. (1986). Development of a plumb staff beam trawl for sampling demersal fauna. Fish. Res. 4, 35–41. doi: 10.1016/0165-7836(86)90026-3
Huntington H. P., Danielson S. L., Wiese F. K., Baker M., Boveng P., Citta J. J., et al. (2020). Evidence suggests potential transformation of the pacific arctic ecosystem is underway. Nat. Climate Change 10, 342–348. doi: 10.1038/s41558-020-0695-2
Kokubun N., Yamamoto T., Sato N., Watanuki Y., Will A., Kitaysky A. S., et al. (2015). Foraging segregation of two congeneric diving seabird species (common and thick-billed murres) breeding on St. George island, Bering Sea. Biogeosci. Discuss. 12, 18151–18183. doi: 10.5194/bgd-12-18151-2015
Kotwicki S., Lauth R. R. (2013). Detecting temporal trends and environmentally-driven changes in the spatial distribution of bottom fishes and crabs on the eastern Bering Sea shelf. Deep Sea Res. Part II: Top. Stud. Oceanog. 94, 231–243. doi: 10.1016/j.dsr2.2013.03.017
Kotwicki S., Lauth R. R., Williams K., Goodman S. E. (2017). Selectivity ratio: a useful tool for comparing size selectivity of multiple survey gears. Fish. Res. 191, 76–86. doi: 10.1016/j.fishres.2017.02.012
Kotwicki S., Ono K. (2019). The effect of random and density-dependent variation in sampling efficiency on variance of abundance estimates from fishery surveys. Fish Fish. 20, 760–774. doi: 10.1111/faf.12375
Levine R. M., De Robertis A., Grünbaum D., Wildes S., Farley E. V., Stabeno P. J., et al. (2023). Climate-driven shifts in pelagic fish distributions in a rapidly changing pacific arctic. Deep Sea Res. Part II: Top. Stud. Oceanog. 208, 105244. doi: 10.1016/j.dsr2.2022.105244
Markowitz E. H., Dawson E. J., Charriere N. E., Prohaska B. K., Rohan S. K., Stevenson D. E., et al. (2022). Results of the 2021 eastern and northern Bering Sea continental shelf bottom trawl survey of groundfish and invertebrate fauna (U.S. Dep. Commer., NOAA Tech. Memo. NMFS-AFSC-452), 227. doi: 10.25923/g1ny-y360
Maznikova O. A., Emelin P. O., Baitalyuk A. A., Vedishcheva E. V., Trofimova A. O., Orlov A. M. (2023a). Polar cod (Boreogadus saida) of the siberian arctic: distribution and biology. Deep Sea Res. Part II: Top. Stud. Oceanog. 208, 105242. doi: 10.1016/j.dsr2.2022.105242
Maznikova O. A., Emelin P. O., Sheibak A. Y., Nosov M. A., Orlov A. M. (2023b). Can an invader support commercial fishing? a case study of walleye pollock Gadus chalcogrammus in the western Chukchi Sea. Deep Sea Res. Part II: Top. Stud. Oceanog. 207, 105222. doi: 10.1016/j.dsr2.2022.105222
Oyafuso Z. S., Barnett L. A. K., Kotwicki S. (2021). Incorporating spatiotemporal variability in multispecies survey design optimization addresses trade-offs in uncertainty. ICES J. Mar. Sci. 78, 1288–1300. doi: 10.1093/ICESJMS/FSAB038
Oyafuso Z., Barnett L., Siple M., Kotwicki S. (2022). A flexible approach to optimizing the gulf of alaska groundfish bottom trawl survey design for abundance estimation (U.S. Dep. Commer., NOAA Tech. Memo. NMFS-AFSC-434), 142 doi: 10.25923/g5zd-be29.
Parkinson C. L., Comiso J. C. (2013). On the 2012 record low arctic sea ice cover: combined impact of preconditioning and an august storm. Geophys. Res. Lett. 40, 1356–1361. doi: 10.1002/grl.50349
Polyak L., Alley R. B., Andrews J. T., Brigham-Grette J., Cronin T. M., Darby D. A., et al. (2010). History of sea ice in the arctic. Quater. Sci. Rev. 29, 1757–1778. doi: 10.1016/j.quascirev.2010.02.010
Post E., Bhatt U. S., Bitz C. M., Brodie J. F., Fulton T. L., Hebblewhite M., et al. (2013). Ecological consequences of sea-ice decline. Science 341, 519–524. doi: 10.1126/science.1235225
Quakenbush L. T., Suydam R. S., Bryan A. L., Lowry L. F., Frost K. J., Mahoney B. A. (2015). Diet of beluga whales (Delphinapterus leucas) in Alaska from stomach contents, march–november. Mar. Fish Rev. 77, 70–84. doi: 10.7755/MFR.77.1.7
Rue H., Martino S., Chopin N. (2009). Approximate bayesian inference for latent gaussian models by using integrated nested laplace approximations. J. R. Stat. soc.: Ser. b (statistical methodology) 71, 319–392. doi: 10.1111/j.1467-9868.2008.00700.x
Spies I., Gruenthal K. M., Drinan D. P., Hollowed A. B., Stevenson D. E., Tarpey C. M., et al. (2020). Genetic evidence of a northward range expansion in the eastern Bering Sea stock of Pacific cod. Evolution. Appl. 13, 362–375. doi: 10.1111/eva.12874
Stauffer G. D. (2004) NOAA Protocols for groundfish bottom trawl surveys of the nation’s fishery resources, march 16, 2003. Available at: https://spo.nmfs.noaa.gov/content/tech-memo/noaa-protocols-groundfish-bottom-trawl-surveys-nations-fishery-resources-march-16.
Stevenson D. E., Lauth R. R. (2019). Bottom trawl surveys in the northern Bering Sea indicate recent shifts in the distribution of marine species. Polar Biol. 42, 407–421. doi: 10.1007/s00300-018-2431-1
Thorson J. T. (2018). Three problems with the conventional delta-model for biomass sampling data, and a computationally efficient alternative. Can. J. Fish. Aquat. Sci. 75, 1369–1382. doi: 10.1139/cjfas-2017-0266
Thorson J. T. (2019). Guidance for decisions using the vector autoregressive spatio-temporal (VAST) package in stock, ecosystem, habitat and climate assessments. Fish. Res. 210, 143–161. doi: 10.1016/j.fishres.2018.10.013
Thorson J. T., Barnett L. A. K. (2017). Comparing estimates of abundance trends and distribution shifts using single-and multispecies models of fishes and biogenic habitat. ICES J. Mar. Sci. 74, 1311–1321. doi: 10.1093/icesjms/fsw193
Thorson J. T., Kristensen K. (2016). Implementing a generic method for bias correction in statistical models using random effects, with spatial and population dynamics examples. Fish. Res. 175, 66–74. doi: 10.1016/j.fishres.2015.11.016
Wakabayashi K. R., Bakkala G., Alton M. S. (1985). Results of cooperative U.S.-japan groundfish investigations in the Bering Sea during may-august 1979. Eds. Bakkala R. G., Wakabayashi K. (U.S. Dep. Commer., NOAA Tech. Memo. NMFS F/NWC-87), 7–29.
Keywords: bottom trawl surveys, sampling design, groundfish, Chukchi Sea, simulation testing
Citation: Oyafuso ZS, Barnett LAK, Siple MC, Cooper DW and Kotwicki S (2023) Evaluating potential changes to the US Chukchi Sea bottom trawl survey design via simulation testing. Front. Mar. Sci. 10:1214526. doi: 10.3389/fmars.2023.1214526
Received: 29 April 2023; Accepted: 22 May 2023;
Published: 06 June 2023.
Edited by:
Kyle Shertzer, NOAA Southeast Fisheries Science Center, United StatesReviewed by:
James Gartland, College of William & Mary, United StatesKai Wieland, Technical University of Denmark, Denmark
Copyright © 2023 Oyafuso, Barnett, Siple, Cooper and Kotwicki. This is an open-access article distributed under the terms of the Creative Commons Attribution License (CC BY). The use, distribution or reproduction in other forums is permitted, provided the original author(s) and the copyright owner(s) are credited and that the original publication in this journal is cited, in accordance with accepted academic practice. No use, distribution or reproduction is permitted which does not comply with these terms.
*Correspondence: Zack S. Oyafuso, emFjay5veWFmdXNvQG5vYWEuZ292
†These authors contributed equally to this work
‡Senior authorship
§First authorship