
94% of researchers rate our articles as excellent or good
Learn more about the work of our research integrity team to safeguard the quality of each article we publish.
Find out more
ORIGINAL RESEARCH article
Front. Mar. Sci., 10 January 2024
Sec. Marine Fisheries, Aquaculture and Living Resources
Volume 10 - 2023 | https://doi.org/10.3389/fmars.2023.1209311
 Joseph W. Watson1*
 Zachary Radford1Hayley Bannister1Robin Bradley2Mary Brown1
 Benjamin J. Ciotti3Derek Goodwin2
 Jennifer A. Graham1,4
 Richard D. M. Nash1William K. Roche5
 Ciara Wogerbauer5
 Kieran Hyder1,4
Year class strength is an important determinant of fish population size, but the drivers are often unknown. The northern stock of European sea bass (Dicentrarchus labrax) is an important target species for both commercial and recreational fisheries. Scientific assessments showed a rapid decline in spawning stock biomass from 2010-18 attributed to a combination of fishing mortality and poor year class strength. Recruitment to the adult stock is linked to the abundance and temporal dynamics of young bass in estuarine nursery areas, but little is known about the relative importance of environmental and biological drivers on the survival of these young life stages. In this study, we use Generalised Linear Models to attempt to identify important local environmental (sea surface temperature and river flow) and biological (chlorophyll-a concentration and predator abundance) drivers of young sea bass abundance. We focus on seven British and Irish estuarine areas that are important to the northern stock of European sea bass. In four English estuarine areas there were good model fits to the abundance of young sea bass, but predictors differed amongst these suggesting that drivers of abundance may differ among individual nursery areas. This was further demonstrated by poor fits of models generated for English estuaries to interannual patterns of abundance in the Irish nursery areas tested. The differences found in the most important abundance drivers amongst areas highlight the complex and differing dynamics between estuaries. If the number of young bass that eventually join the adult stock is dependent on survivors from a diverse set of unique nursery area conditions, then endeavours to incorporate this knowledge into fisheries management should be further explored.
Year class strength is an important determinant of fish population size, but the drivers are often unknown (Hjort, 1914; Jennings et al., 2001; Sguotti et al., 2020; Ottersen and Holt, 2023). The productivity of a fish stock is dependent on two aspects of life history, namely the early life history dynamics and the growth dynamics of the fish (Maunder and Piner, 2015). The productivity of a stock will often vary over spatial scales (e.g., latitude) and a range of temporal scales from annual to multi-decadal (Vert-pre et al., 2013). Studies of drivers of the variability in productivity, especially in early life history, are elusive, with much of the early work concentrating on the egg and larval stages of the life history (Houde, 2008). However, the subsequent juvenile stage may also play an important part in the determination of survival and resultant size/strength of a year class (Bogstad et al., 2015).
It is generally recognised that the numbers of individuals surviving through to recruitment (i.e., joining the fishable population) stems from egg production and therefore the size of the spawning stock (Kell et al., 2016). Early life history dynamics then modify the initial number of eggs or larvae produced through the pre-recruitment phase (Houde, 2008). Stock-recruitment relationships (SRR) are generally very noisy (Hilborn and Walters, 1992), mainly because the drivers of survival vary interannually. In an effort to make an SRR reflect the variability observed in the data, attempts have been made to add environmental drivers to SRRs, for example, annually varying sea surface temperature (SST) as a proxy for the inter-annual variability in mortality rates during the early life history stages (Subbey et al., 2014). As with the majority of other species, there has been no clear relationship between stock size and the number of recruits for European sea bass in UK waters (Pawson et al., 2007a), but there is potential for improved management success with a better understanding of the drivers of young sea bass abundance in nursery areas.
The European sea bass is widely distributed across the northeast Atlantic (Pickett and Pawson, 1994) and is divided into four spatially discrete management units by ICES [commonly referred to as stocks (ICES, 2020d)]. Here we focus on the northern stock covering the central and southern North Sea, English Channel, Celtic Sea and Irish Sea (ICES divisions 4.b&c, 7.a,d-h), which is assessed by ICES using Stock Synthesis (Methot and Wetzel, 2013; ICES, 2020d). Sea bass in the northern stock are characterised by relatively slow growing individuals that tend to reach maturity between the age of four and seven and have a maximum lifespan of 30 years (Pawson and Pickett, 1996). In the northern stock, mature individuals aggregate to spawn between February and June, with the timing and geographic extent of spawning thought to be heavily influenced by environmental conditions (Pawson and Pickett, 1996). For example, spawning is thought to occur only when sea temperatures reach 9°C or above (Pickett and Pawson, 1994). The pelagic phase of the life cycle lasts for 60 to 100 days (Jennings and Ellis, 2015), resulting in eggs and larvae dispersing from their spawning areas to nursery grounds that are located in sheltered coastal sites such as estuaries, harbours, and saltmarshes (Beraud et al., 2018; Graham et al., 2023). After spending the first few years of life on the nursery grounds, juveniles migrate offshore to join the adult population (Pickett et al., 2004).
Sea bass nurseries around Great Britain and Ireland are, like many other fish nurseries [e.g., European plaice, Pleuronectes platessa (Fox et al., 2006; Fox et al., 2007; Ciotti et al., 2013)], considered to be non-synchronous, semi-isolated locations with differing environmental conditions (Pickett et al., 2004). Despite being isolated from one another, it is assumed there are many important nursery habitats that contribute to recruitment in the northern seabass stock. It is therefore valuable to understand the similarities and differences in drivers of annual variability in young sea bass abundance in different nursery areas and assess how this may contribute towards overall recruitment.
Previous studies have attempted to decipher estuarine mechanisms that may drive the abundance of young European sea bass in nursery areas including: resultant river flow impact on juvenile sea bass abundance; sea surface temperature (SST); the North Atlantic Oscillation (NAO) (Vinagre et al., 2009; Bento et al., 2016); and the north-south wind component intensity (Vinagre et al., 2009). Results from these studies suggested that environmental drivers may vary between different estuaries (Bento et al., 2016), and that SST may be more important nearer to the northern limit of sea bass distribution (Vinagre et al., 2009). Since the northern stock of sea bass frequent waters towards their northern thermal limit and the stock is fed by isolated nursery areas around Great Britain and Ireland, it is important to understand variability or coherence in estuarine processes among these nurseries, in an attempt to understand their consequence to abundances of young bass found there.
Here, we fit Generalized Linear Models (GLMs) to young bass abundance data for seven study locations that represent important nursery areas for the northern stock of sea bass around the southern coasts of Great Britain and Ireland. In each of these areas we examine the relationship between indices of young sea bass abundance and the following potential drivers that are split into: 1) those that could affect the supply of larvae to the nursery areas (sea surface temperature, chlorophyll-a concentration, sea bass stock size, and the population size of possible predators of sea bass eggs and larvae in the North Sea and English Channel); and 2) those that could affect the abundance within the estuary (sea surface temperature, chlorophyll-a concentration, size of previous sea bass year class, and river flow). The outcomes of these analyses are then considered and discussed in the context of the management and assessment of the northern stock of European sea bass.
Our analysis used Generalised Linear Models to test the relationship between indices of juvenile sea bass abundance (derived from trawl/netting surveys) and selected environmental and biological drivers across seven important estuaries for the northern stock of European sea bass (Pickett et al., 2004; ICES, 2012; ICES, 2014a). Models were created for each estuarine system independently. This was done by first identifying possible drivers of young sea bass dynamics and then attempting to obtain relevant data. The chosen drivers used in analysis (see justifications later in methods section) can be split into: 1) those that could affect the supply of larvae to the nursery areas (sea surface temperature, chlorophyll-a concentration, sea bass stock size and population size of possible predators of sea bass eggs and larvae stages in the North Sea and English Channel); and 2) those that could affect the abundance within the estuary (sea surface temperature, chlorophyll-a concentration, size of previous sea bass year class, and river flow).
Both the Thames and the Solent are located in the south of Great Britain (Figure 1 and for more detailed satellite images see Supplementary Materials) and are recognised as important nursery grounds for the northern stock of European sea bass (Pickett et al., 2004; ICES, 2012; ICES, 2014a; Catherall, 2020). The Thames estuary lies on the south-east coast of England, covers an area of almost 250 km2 and is characterised by ‘semi-natural’ habitats that include open water, intertidal mudflats, sandflats, and salt marsh (Hyder et al., 2018). Under the Water Framework Directive, the ecotype of the Thames estuary is described as ‘mixed, macro, and extensively intertidal’ (Hyder et al., 2018). The Thames estuary receives saline water from the North Sea and freshwater from the River Thames and its tributaries.
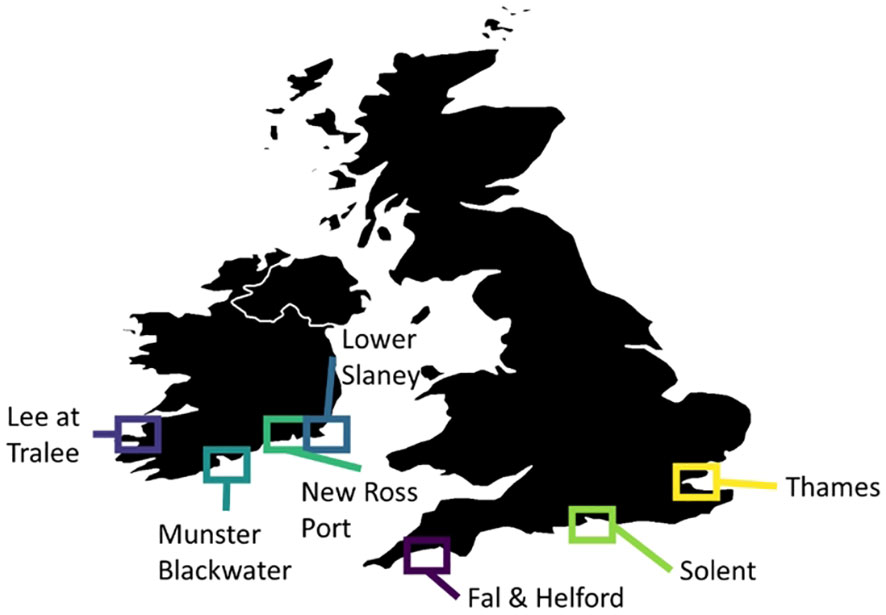
Figure 1 Locations of estuaries with existing time series of sea bass surveys aimed at assessing year class strength on nursery grounds.
The Solent is a strait that separates the Isle of Wight from the south coast of England and is associated with several estuaries and harbours. Each of these estuaries and harbours provides a large area of suitable habitat for juvenile sea bass (Hyder et al., 2018). The ecotypes of the sea bass nursery grounds in the Solent range from ‘mixed, meso, and extensively intertidal’ areas to ‘transitional lagoons’ (Hyder et al., 2018). The Solent receives saline water from the English Channel and freshwater from rivers including the Avon, Test, Itchen, and Meon.
An annual trawl surveys was conducted in both the Thames [1989 to 2009 (with a standalone survey in 2018 which was not considered for analysis in this study as the near 10 year gap was presumed unreasonable to attempt to model)] and Solent (1979 to present) estuaries to determine the distribution and abundance of juvenile sea bass (Pickett et al., 2002). The surveys were conducted in November in the Thames estuary and in May and/or September in the Solent. During each survey, around 35 stations were fished for between 5 and 20 minutes (Pickett et al., 2002; Hyder et al., 2018). All stations were fished using a high headline sea bass trawl with diagonal stretched 70 mm mesh and a 4 mm mesh cod end which was towed at 3 knots (1.54 m.s-1) (Pickett et al., 2002).
Using sea bass age and length data collected during the trawl surveys, and an annual abundance index calculated for both the Thames and Solent estuaries (see Pickett et al., 2002 for full details). However, for the Solent survey only the autumn survey was used for the index in our analysis to reflect the settlement within a particular year. Briefly, a high headline trawl was used to sample 35 stations in the Solent and Chichester Harbour for the survey. All the sea bass were counted and measured, and ages were read from scales from a sample of around 200 fish for 5 cm age classes. All abundances were standardised to 10 minute tows and combined across stations. The abundance index was then calculated using fish at ages 2–4. For each year, abundance at age estimates were normalised using the mean over the time series for that age. This resulted in three estimates of year class strength for each year, so an estimate of abundance for year y was produced from two-year-olds in year y+2, three-year-olds in year y+3, and four-year-olds in year y+4. The abundance index was then calculated from the mean of these three estimates (Pickett et al., 2002).
The abundance index for the Thames estuary was based on the abundance of juveniles between the ages of zero and three (ICES, 2014a). Conversely, the abundance index for the Solent was based on the abundance of juveniles between the ages of two and four, as age zero and age one sea bass were not routinely caught using this gear in the areas sampled (Brown, 2017; Brown, 2018). The different age classes included in the indices for the Thames and Solent could influence any direct comparison, so analysis was conducted separately for each estuary.
Both the Fal and Helford estuaries are located on the south coast of Great Britain (Cornwall) (Figure 1 and for more detailed satellite images see Supplementary Materials) where juvenile sea bass are known to occur (Catherall, 2020). An annual seine net survey has been conducted in these estuaries by volunteers since 1997 to assess sea bass year class strength. The main netting period is between May and September (inclusive), and so covers the late spring, summer and early autumn, but note that July is excluded to protect newly settling fry from net damage. Two methods are used for sampling: hauling the net up a gulley or inlet and bringing the ends together before bringing the net ashore (termed “haul”) and holding the net across the tide before bringing it ashore in a ‘J’ shape (termed “held”). Netting took place on average 14 times per year and was carried out according to tidal heights, boat availability, volunteer availability, and weather. Efforts were made to cover a range of sites in both estuaries in the spring and the summer.
To address issues with patchy or inconsistent sampling methodologies, here we use data from just the “held” samples during 2005-2019, with the abundances of sea bass then aggregated across the Fal and Helford. The abundance index was calculated by dividing the number of age 0 bass caught by the sampling duration for each sampling event. Within each year we then average across the catch per unit effort scores (CPUE) to result in in an annual mean CPUE index score of age 0 sea bass abundance for each year in the timeseries. Finally, normalisation was carried out on this age 0 CPUE index to achieve scores between 0 and 1 for sea bass abundance, as the relative changes rather than the absolute values were considered to be important and allowed values on different scales to be compared between sites (as well as reducing the potential impact of any mean biases from the input data). Normalisation was done using the following equation:
where is a normalised value of sea bass abundance, is the abundance in year i and and are the maximum and minimum sea bass abundance, respectively.
Only a limited number of estuaries along the southern coast of Ireland are known to consistently be used as juvenile bass nurseries. Surveys of year 0 sea bass (YOY) have been carried out in four rivers by Inland Fisheries Ireland: Lee at Tralee; Lower Slaney Estuary; Munster Blackwater; and New Ross Port (Figure 1 and for more detailed satellite images see Supplementary Materials). These four waterbodies report YOY sea bass annually, though note that small numbers of YOY sea bass are encountered occasionally but irregularly in other Irish estuaries (i.e., in the course of the Water Framework Directive transitional water surveys). The lower Slaney estuary is a shallow, sheltered transitional waterbody protected by a narrow estuary mouth which covers an area of 18.4 km2. This water body is situated within the Slaney River Valley Special Area of Conservation (SAC), Wexford Harbour and Slobs Special Protection Area (SPA) (Kelly et al., 2015). New Ross Port is a transitional waterbody within the Nore-Suir-Barrow estuary system and covers 6.7 km2. A number of important habitats are present within this SAC, including tidal mudflats, estuary, and floating vegetation, all of which are listed in Annex I of the EU Habitats Directive. The Lower Blackwater covers an area of 12.1 km² and is mostly mud with some areas of gravel and stones intermixed. The Lee Estuary covers an area of 3.1 km2 and is shallow with soft muddy sediment, note this estuary is outside of the northern stock area, but was included for comparison.
Sampling was completed using beach seine nets in August each year in the Lee at Tralee (2015-18, 2020), lower Slaney estuary, Munster Blackwater, and New Ross Port (2013–20). Beach seining was conducted using a 30 m x 3 m net (10 mm mesh size) with a weighted lead line to sample young of year bass in littoral areas. In brief, ropes of 30 m were attached to both ends of the head rope, the seine was cast out to its fullest extent from the shore by boat in a 'U' shape, allowed to settle and hauled to shore. On the Slaney, New Ross Port and Lee at Tralee waterbodies, a minimum of five net hauls were used to capture fish in littoral areas. On the Munster Blackwater, a seine net was used to cut off a backwater, with the net positioned at high tide and monitored until low tide. All sea bass lengths were measured, and scales taken from a subsample of fish for ageing. Total number of 0-group bass per m2 were calculated for each site per year, an annual average was then calculated for each estuary over the multiple sites and then normalised using the same approach as for the Fal and Helford to produce an index for analysis (Equation 1).
Normalisation was applied to all numerical predictors for each estuary data set to achieve scores between 0 and 1 (Equation 1). This was done as the relative changes rather than the absolute values were most important.
Sea surface temperature (SST) is well documented as a driver of post larval sea bass arrival time and abundance in nursery areas (Beraud et al., 2018; Graham et al., 2023) along with some evidence for river flow (Vinagre et al., 2009) and chlorophyll-a concentration has been used as a proxy for food as is seen in other sea bass models (Watson et al., 2022). To incorporate information about these drivers a time series data set comprising of sea surface temperature, chlorophyll-a concentration, and river flow were compiled from various sources throughout the survey period and incorporated into a GLM for each location (see below for further details).
Time series of monthly mean SST (°C) and chlorophyll-a concentration (mg.m-3) were extracted for the period 1993 to 2019, from the European Space Agency (ESA) reprocessed global ocean SST analyses (CMEMS, 2023a) and the Atlantic-European northwest shelf ocean biogeochemistry reanalysis (CMEMS, 2023b), respectively. For both SST and chlorophyll-a concentration, the mean across the four ICES statistical rectangles1 associated with each location was calculated to give a single monthly mean value for each estuary. The coordinates from which data were extracted (see Supplementary Table 1; Supplemantary Figure S1) were selected to ensure that both inshore and offshore regions were included in the time series, thus allowing us to: (1) account for the increased variability of SST and chlorophyll-a concentration near to the coast; (2) reduce the impact of potential misrepresentations of chlorophyll-a concentration in the inshore regions; and (3) avoid sampling across tidal mixing fronts, and therefore regions of differing stratification within the biogeochemistry model reanalysis (Graham et al., 2018).
Daily mean river flow (m3.s-1) for rivers in Great Britain was extracted from Hydrology Data Explorer2. For each estuary, gauge data were obtained for each of the stations closest to the mouth of the estuary (see Supplementary Materials for location maps). Where one single appropriate gauge was not available, gauges were combined from each of the available tributaries. Although there may be numerous rivers that drain into each nursery estuary, data was often not available for all of these. For example, no river flow was available for the Helford, so in this case, other rivers surrounding the Fal estuary were used as a proxy. For each estuary considered within England, the gauge data obtained were then: for the Fal, River Kennall at Ponsanooth, Carnon River at Bissoe, River Fal at Tregony, River Kenwyn at Truro; for the Thames, River Thames at Kingston, River Lee at Lee Bridge and Lee Flood Relief Channel at Walthamstow, River Roding at Redbridge; and for the Solent, River Itchen at Riverside Park, River Blackwater at Ower, and River Test at Chilbolton Total. For rivers in Ireland, five daily records were downloaded from the Office of Public Works, Ireland Hydro-Data website3. The closest station was chosen where available: for the New Ross Port waterbody, Barrow at Graiguenamanagh; for Munster Blackwater, Munster Blackwater at Ballyduff; and for the Slaney estuary, Slaney River at Scarawalsh. There are no gauges for river flow on the River Lee, so the River Galey at Inch Bridge, 27 km southwest of the Lee was used as a proxy as it was the most similar in terms of rainfall and climatology.
Monthly mean SST, chlorophyll-a concentration, and river flow were converted to annual means, annual maximums, and ‘winter’ means that cover the period between January and March and thus represent the period in which juvenile sea bass are likely to be the most vulnerable to environmental variability, particularly to periods of low SST (ICES, 2014b).
The population size of sea bass and of possible predators of sea bass eggs and larvae in the North Sea and English Channel are here presumed to be potential drivers of young of year sea bass abundance. To account for the potential impacts of changes in the population dynamics of predatory species on sea bass abundance, time series of the abundance of several pelagic species that are assumed to predate upon sea bass eggs and larvae [including sprat (Sprattus sprattus), herring (Clupea harengus), anchovy (Engraulis encrasicolus) and sardine (Sardina pilchardus)] were extracted from the Database of Trawl Surveys [(DATRAS, 2021) including: North Sea International Bottom Trawl Survey (NSIBTS), French Western and Southern Area demersal (EVHOE), and Irish Sea Groundfish Surveys (IGFS)]. For this study, NSIBTS data south of 54°N, encompassing survey areas 5 and partially covering areas 4, 6 and 10 [see (ICES, 2020b) for survey areas], were extracted for quarter 1 (January-March) in all years (1965–2020). Data from all depth strata in three sectors from the EVHOE survey (northern, central, and southern Celtic Sea) were extracted for all years (1997–2018). Data from the IGFS were extracted for ICES divisions 7 b, j, and g for all depth strata and all years (2003–2017). Annual survey indices were derived for each survey and species by averaging Catch Per Unit Effort (CPUE) for each depth strata (if relevant) in each area by year, and then averaged across each area and then across all areas to obtain a single index per year per species.
As juvenile sea bass tend to remain in their nursery grounds for several years (Pawson et al., 2007b), it is possible that cannibalism or intraspecies competition might play a role in sea bass recruitment (Henderson and Corps, 1997). The abundance of sea bass in the surveys were therefore used to produce a time series describing potential inter-cohort interactions. As sea bass are thought to move down estuaries as they get older, the potential inter-cohort interactions are likely to be strongest with the previous year class, so settlement in the previous year was used as a proxy. Sea bass spawning stock biomass (SSB) estimates were used as a proxy for egg production and were sourced from the 2020 ICES stock assessment (ICES, 2020a; ICES, 2020c).
Time series of year class strength were used to fit Generalised Linear Models (GLMs) for the Solent (1999-2018), Thames (1997-2009), and Fal and Helford (2005-2019). A separate GLM was fitted to the abundance index at each location in order to identify whether the drivers differ between nursery areas (with the exception of the Irish rivers, see details below). In all cases, the GLMs were fitted using the gamma distribution and the log link function in the R Statistical Computing Software (R Core Team, 2018). The gamma distribution was used to deal with skewed continuous data. The age aggregated index was used for the Solent and Thames and age zero index for the Fal and Helford, and Irish rivers. The dredge function of the MuMIn R package version 1.42.1 was used to explore the best-fitting models (Bartoń, 2018). This function fits multiple GLMs using different combinations of the explanatory variables and then ranks the models based on a given measure of model fit. The full model included: sea bass SSB, mean winter SST, maximum river flow, mean winter river flow, mean annual river flow, mean chlorophyll-a concentration, the size of the previous incoming sea bass year class (as a proxy for cannibalism), and the abundance of anchovy, herring, sardine, and sprat.
A version of Akaike’s Information Criterion that is corrected for small sample sizes [AICc; (Cavanaugh, 1997)] was used as a measure of model fit and any model within two units of the AICc of the best-fitting model was considered when selecting the final model. The final model was selected by taking into consideration the outputs of the dredge function and a further check of the goodness of fit was done by plotting: (1) the observations against the predictions of the GLMs; (2) the residuals against the fitted values; and (3) a Normal Q-Q plot. McFadden’s adjusted pseudo-R2, which is analogous to the adjusted R2 for ordinary least squares regression (Sapiano et al., 2012; Signorell, 2019) was used as a further check of the goodness of fit of the GLMs. The fit of the full models (i.e., the GLMs that included all possible explanatory variables) and the best-fitting models were compared using these measures to highlight improvements in fit.
Due to the relatively short length of the time series, it was not possible to fit models with sufficient numbers of variables to test the impact of physical and biological drivers for the Irish study estuaries. Instead, the best-fitting models from the Solent, Thames, and Fal and Helford were used to predict year class strength in the Irish Rivers. While the magnitude of the predictions would be different, the models could be considered to have similar factors driving variation if the relative differences between years were captured/observed. As we are interested in the comparing the trends, the relative change, rather than the absolute values were considered to be most important. To achieve this, we present the results for each series on a normalised scale from 0 to 1 (Equation 1).
The Solent survey had the longest timeseries available for analysis from 1999 to 2018, followed by 15 years of data for the Fal and Helford, and 13 years for the Thames. The Irish Rivers (Lee, New Ross Port, Slaney, and Munster Blackwater) had the shortest time series with between four and seven years of data (Figure 2). Year class strength appeared to have decreased over the period of the surveys in the Solent, with very poor settlement from 2008. For the other rivers, there was no obvious trend in year-class strength. All nursery areas showed large interannual variation in year-class strength, with large peaks in some years (Figure 2).
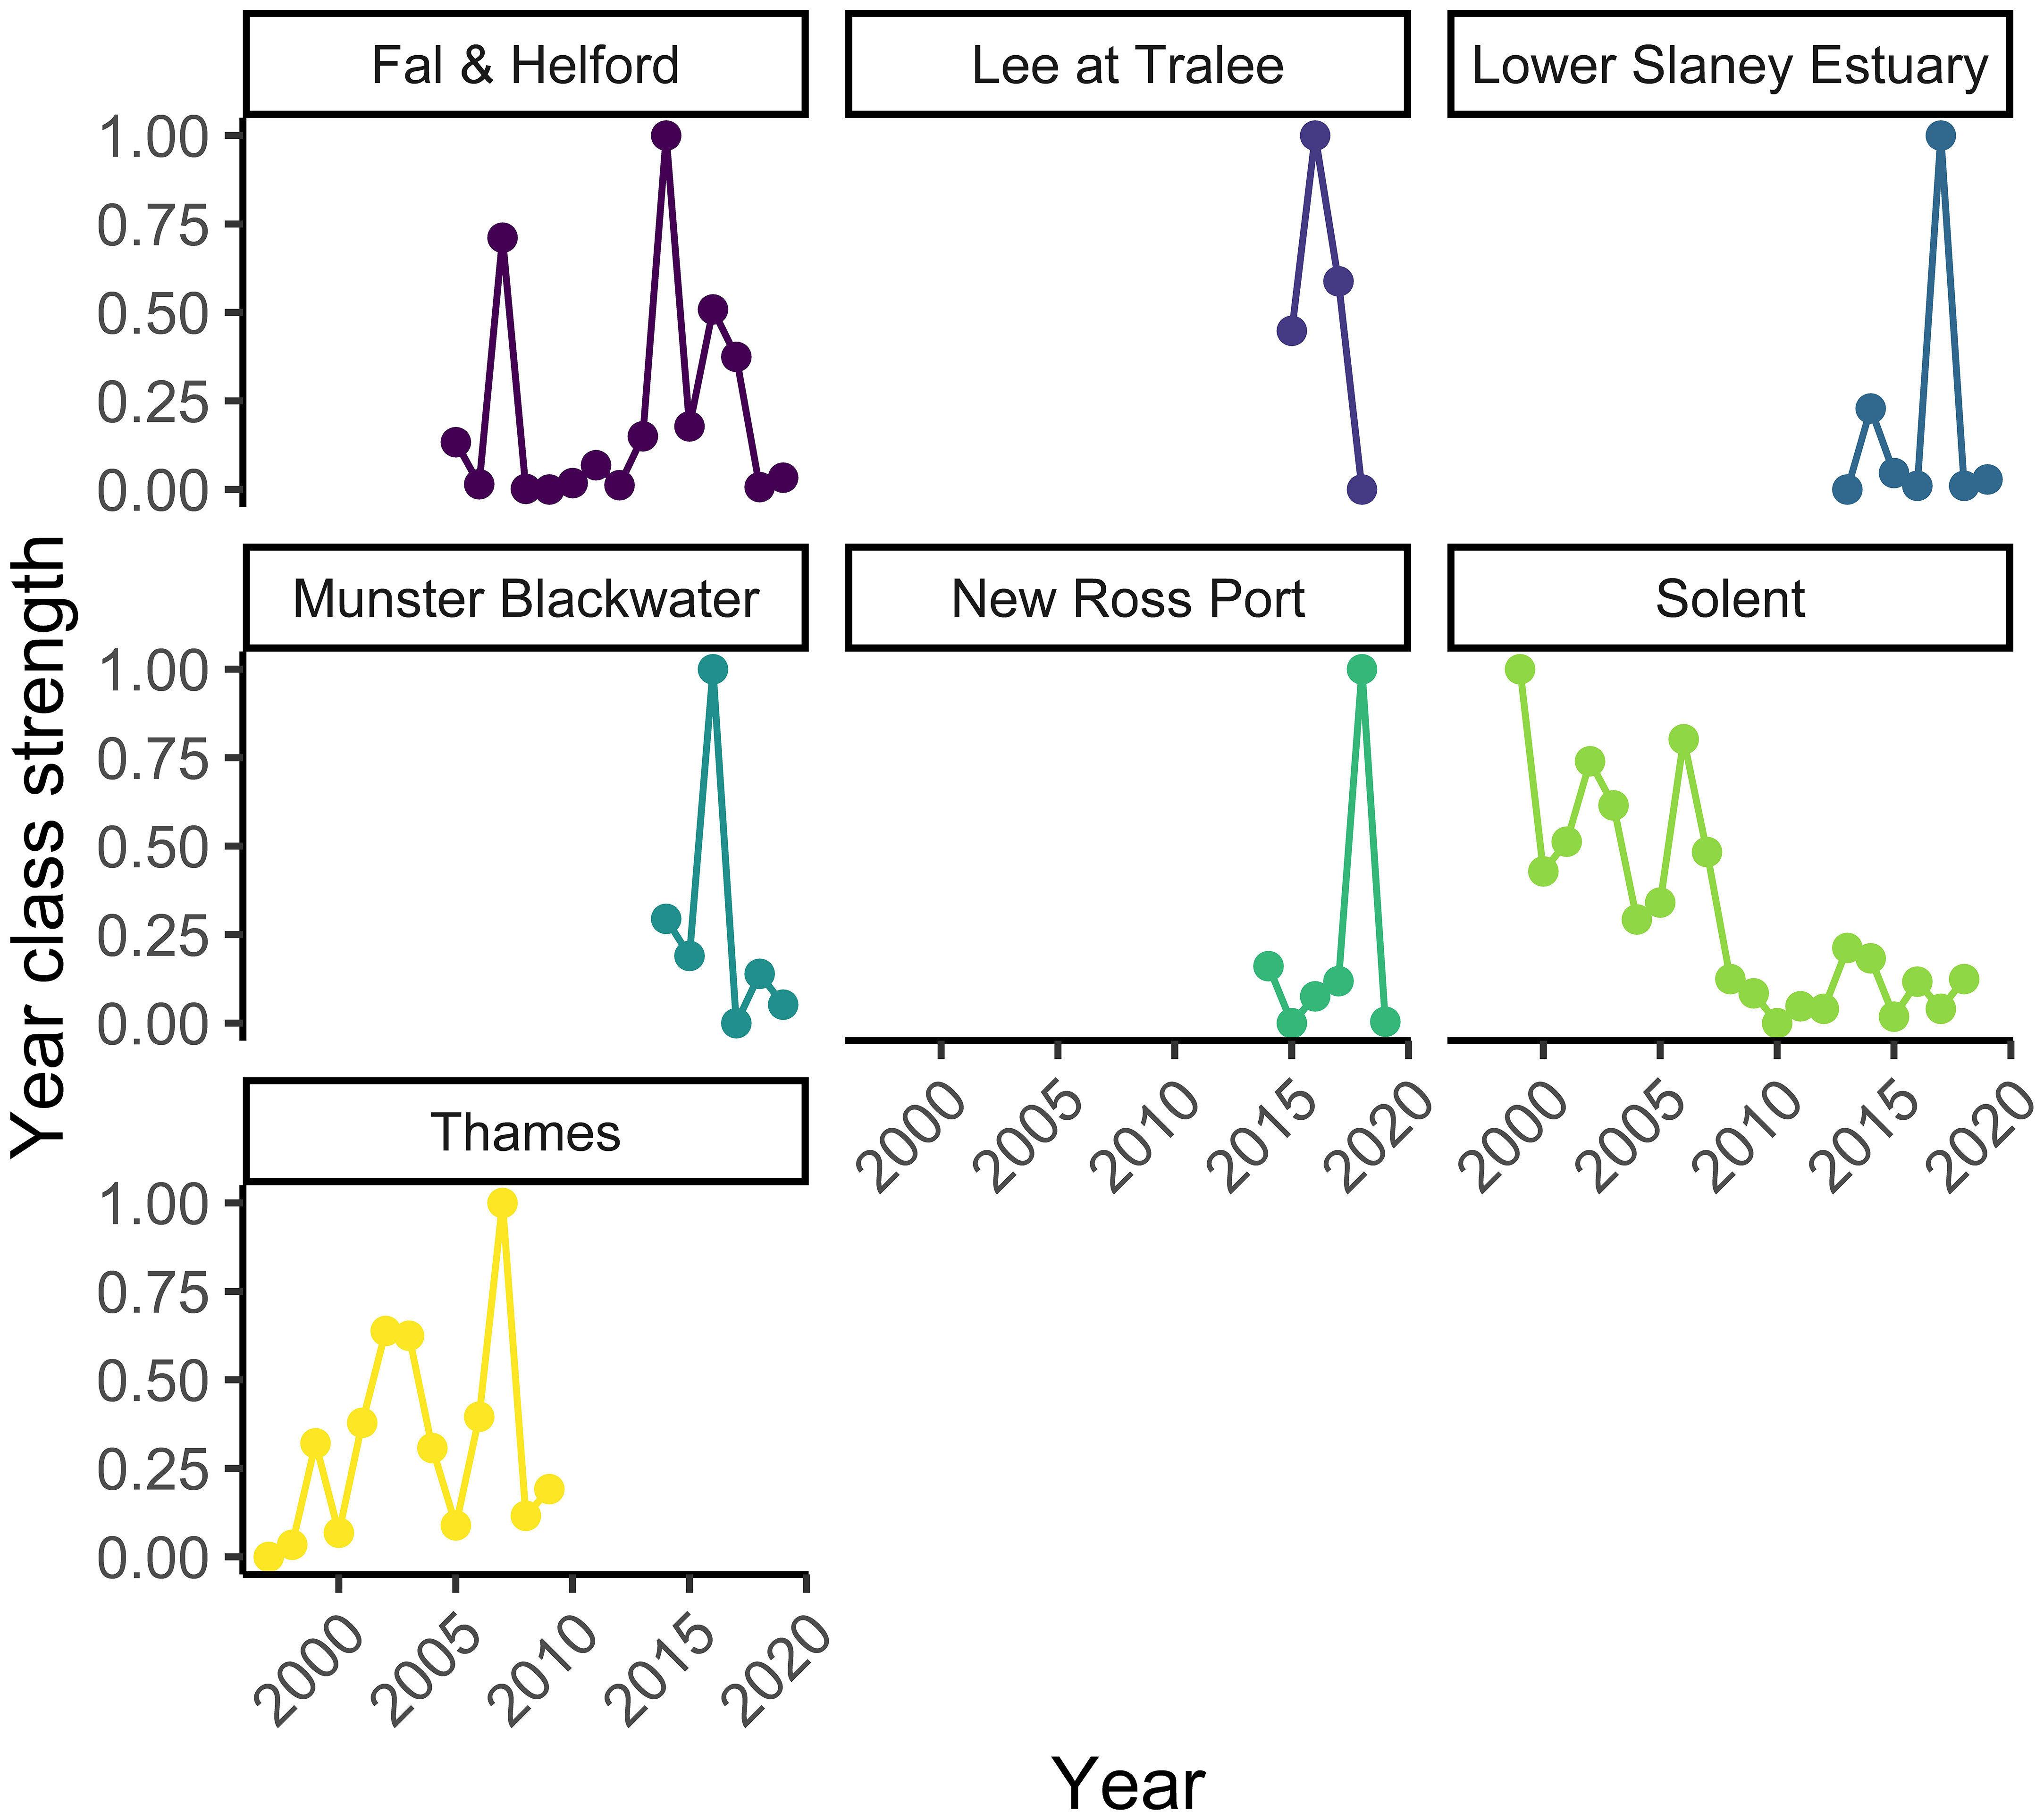
Figure 2 The settlement index for the Fal and Helford, Lee at Tralee, Lower Slaney, Munster Blackwater, New Ross Port, Solent, and Thames estuaries. See Figure 1 for locations.
The best-fitting model for the Fal and Helford had an AICc score of 23 [which is a large improvement over the full model (Supplementary Table S2)] and an adjusted pseudo-R2 of 0.81 (Figure 3; Table 1). In the best-fitting model, winter river flow, and winter SST are significant positive predictors of age zero sea bass abundance. A greater abundance of anchovy also has a positive effect on age zero sea bass abundance, but this is not statistically significant. Finally, annual river flow had a significant negative effect (Table 1).
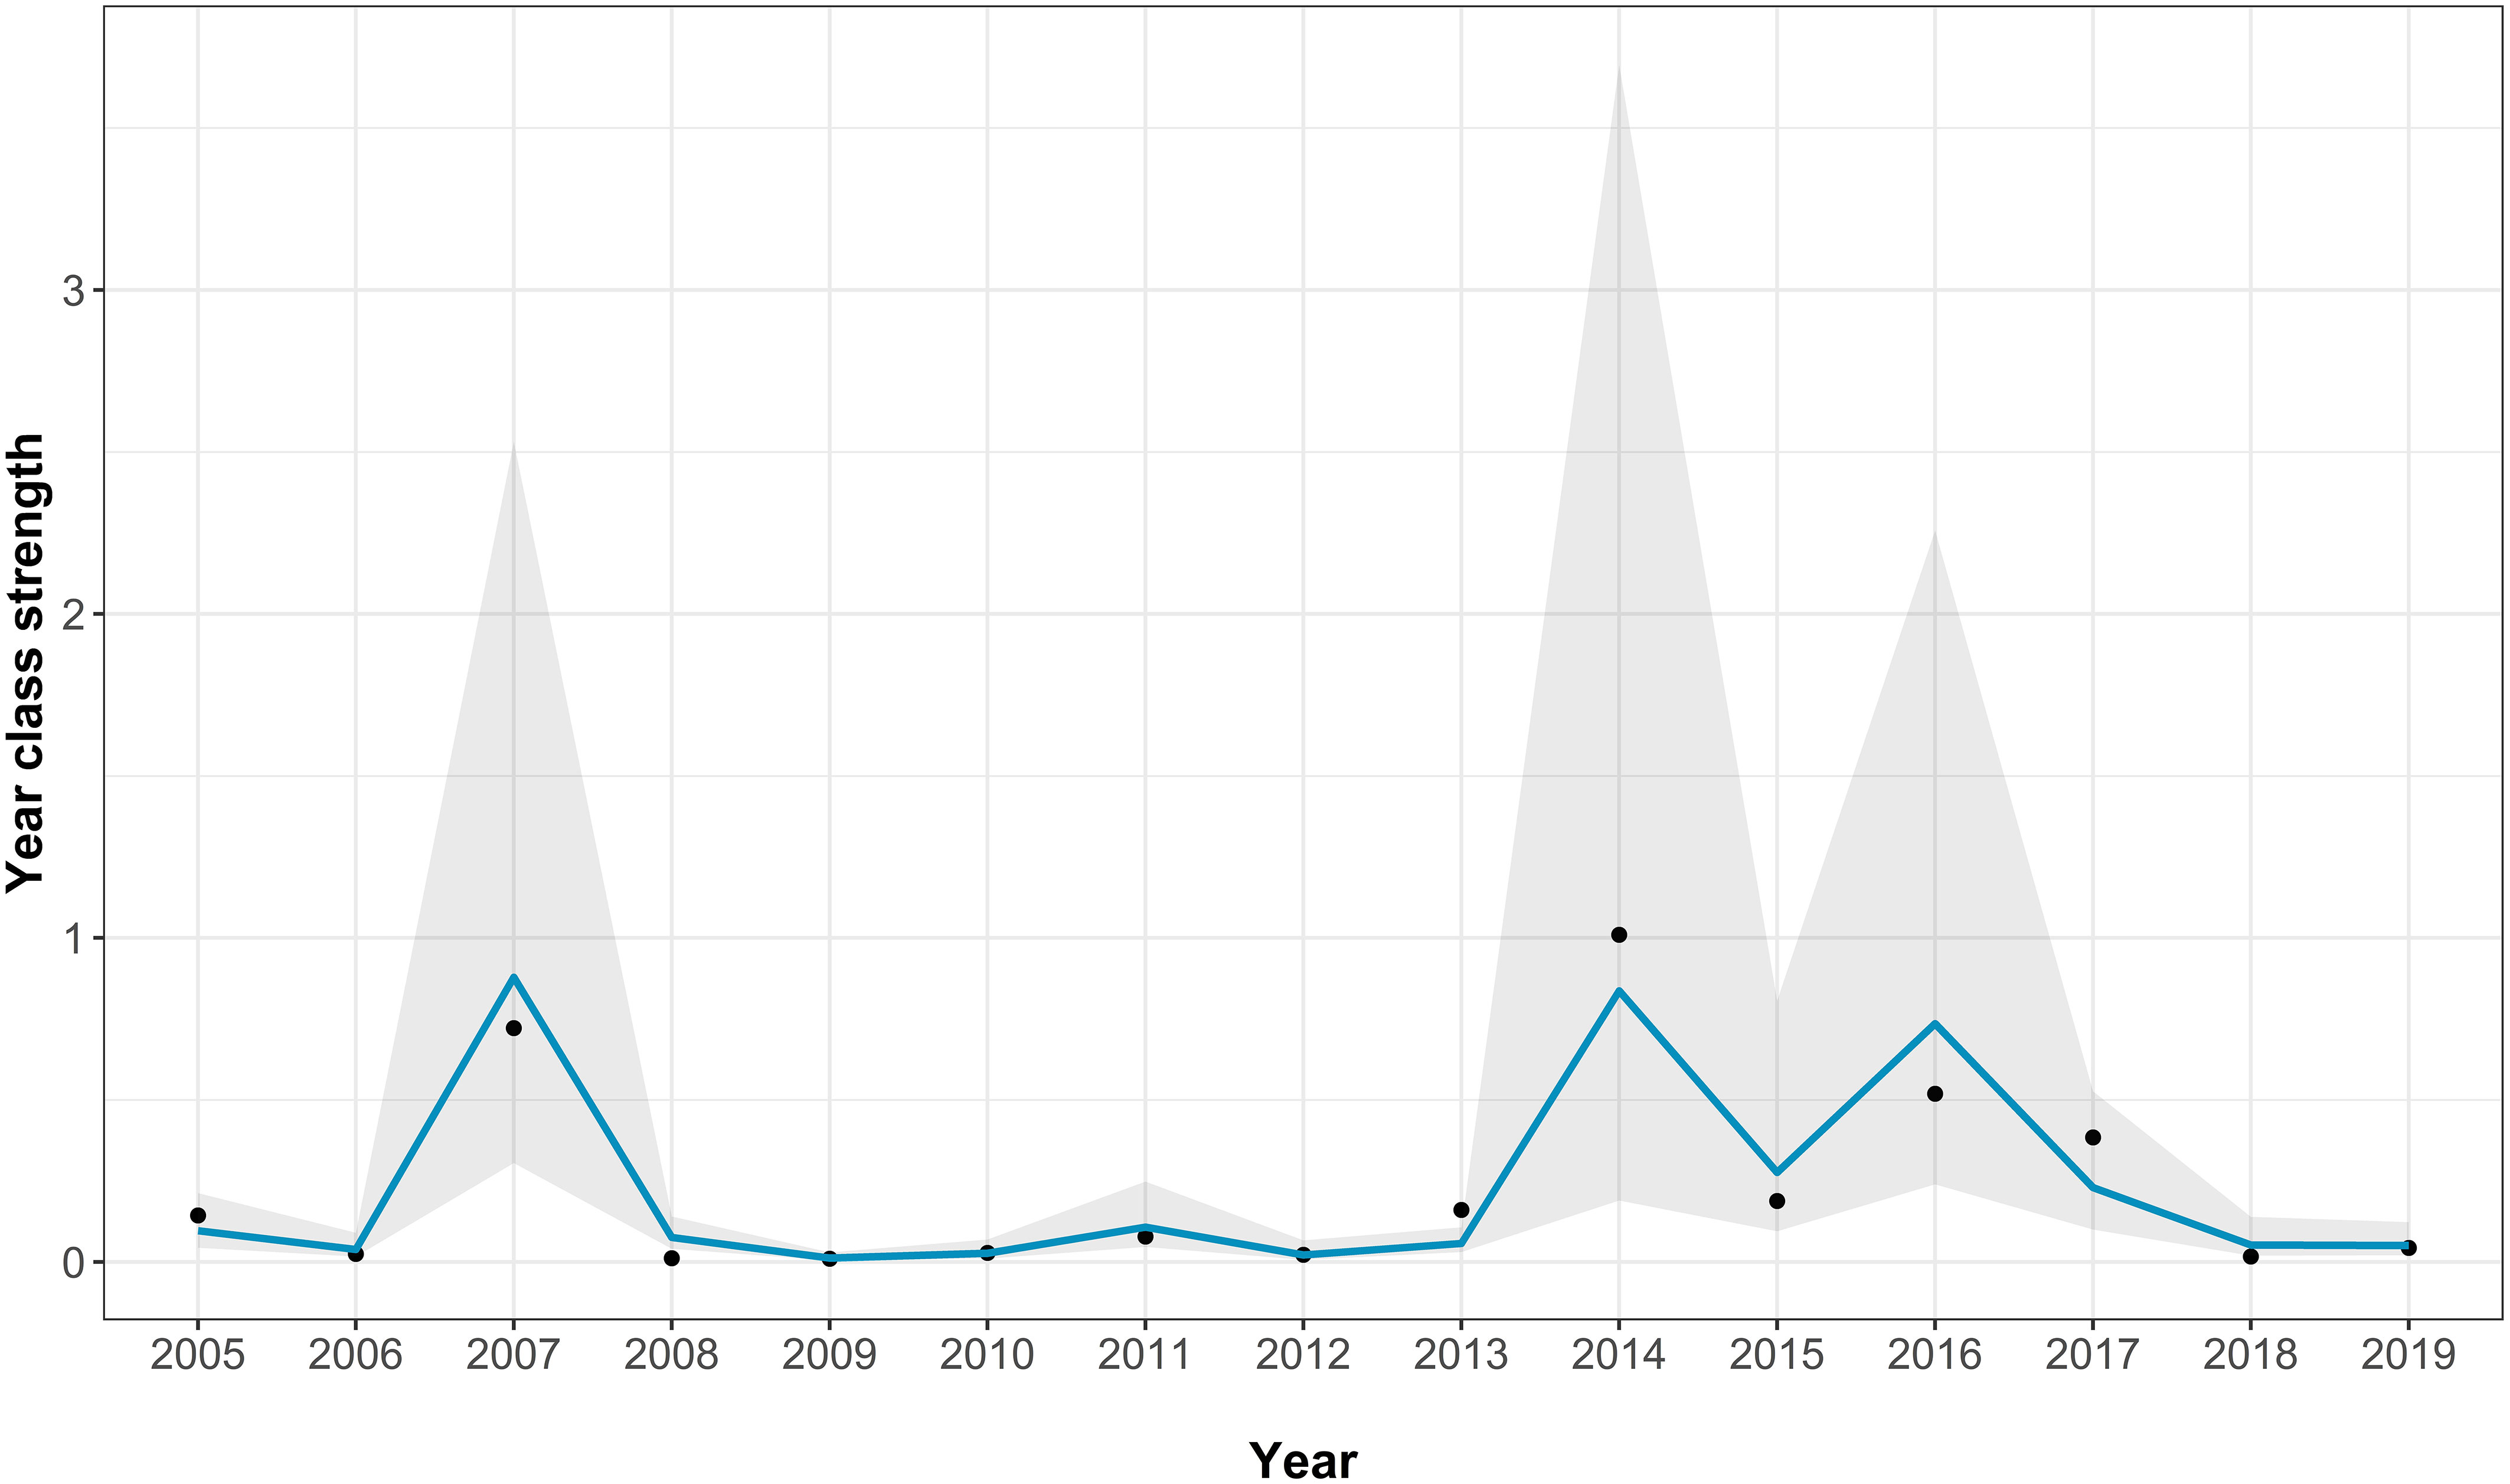
Figure 3 Fit of the best-fitting model for the Fal and Helford age 0 abundance. The points show the real abundance index, the blue line shows the model predictions, and the grey area indicating the model 95% confidence intervals.
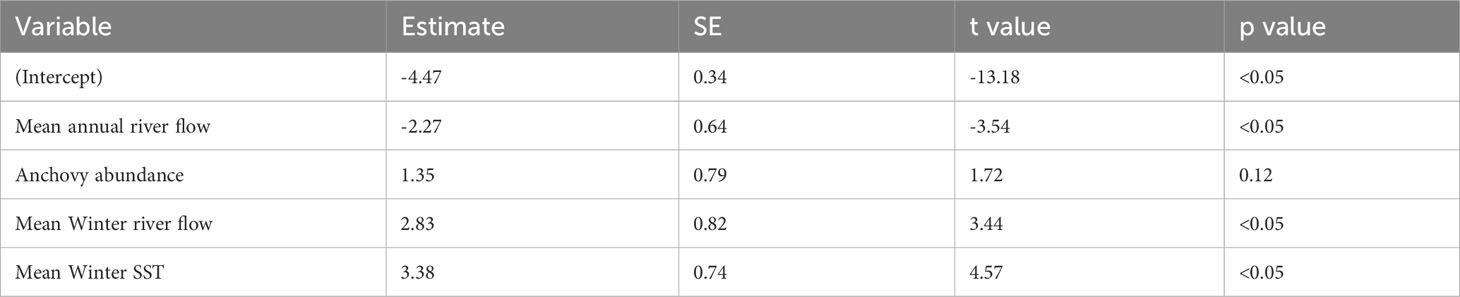
Table 1 Parameter estimates, standard error (SE), t values, and p values of the best-fitting model for the Fal and Helford.
The best-fitting model had an AICc score of 22 [which is a large improvement over the full model (Supplementary Table 2)] and an adjusted pseudo-R2 of 0.72 (Figure 4; Table 2). In the best-fitting model winter river flow had significant positive influences on the abundance of juvenile sea bass, whilst herring abundance a significant negative one. This indicates that a faster river flow and a lower abundance of herring positively influence the abundance of juvenile sea bass (Table 2).
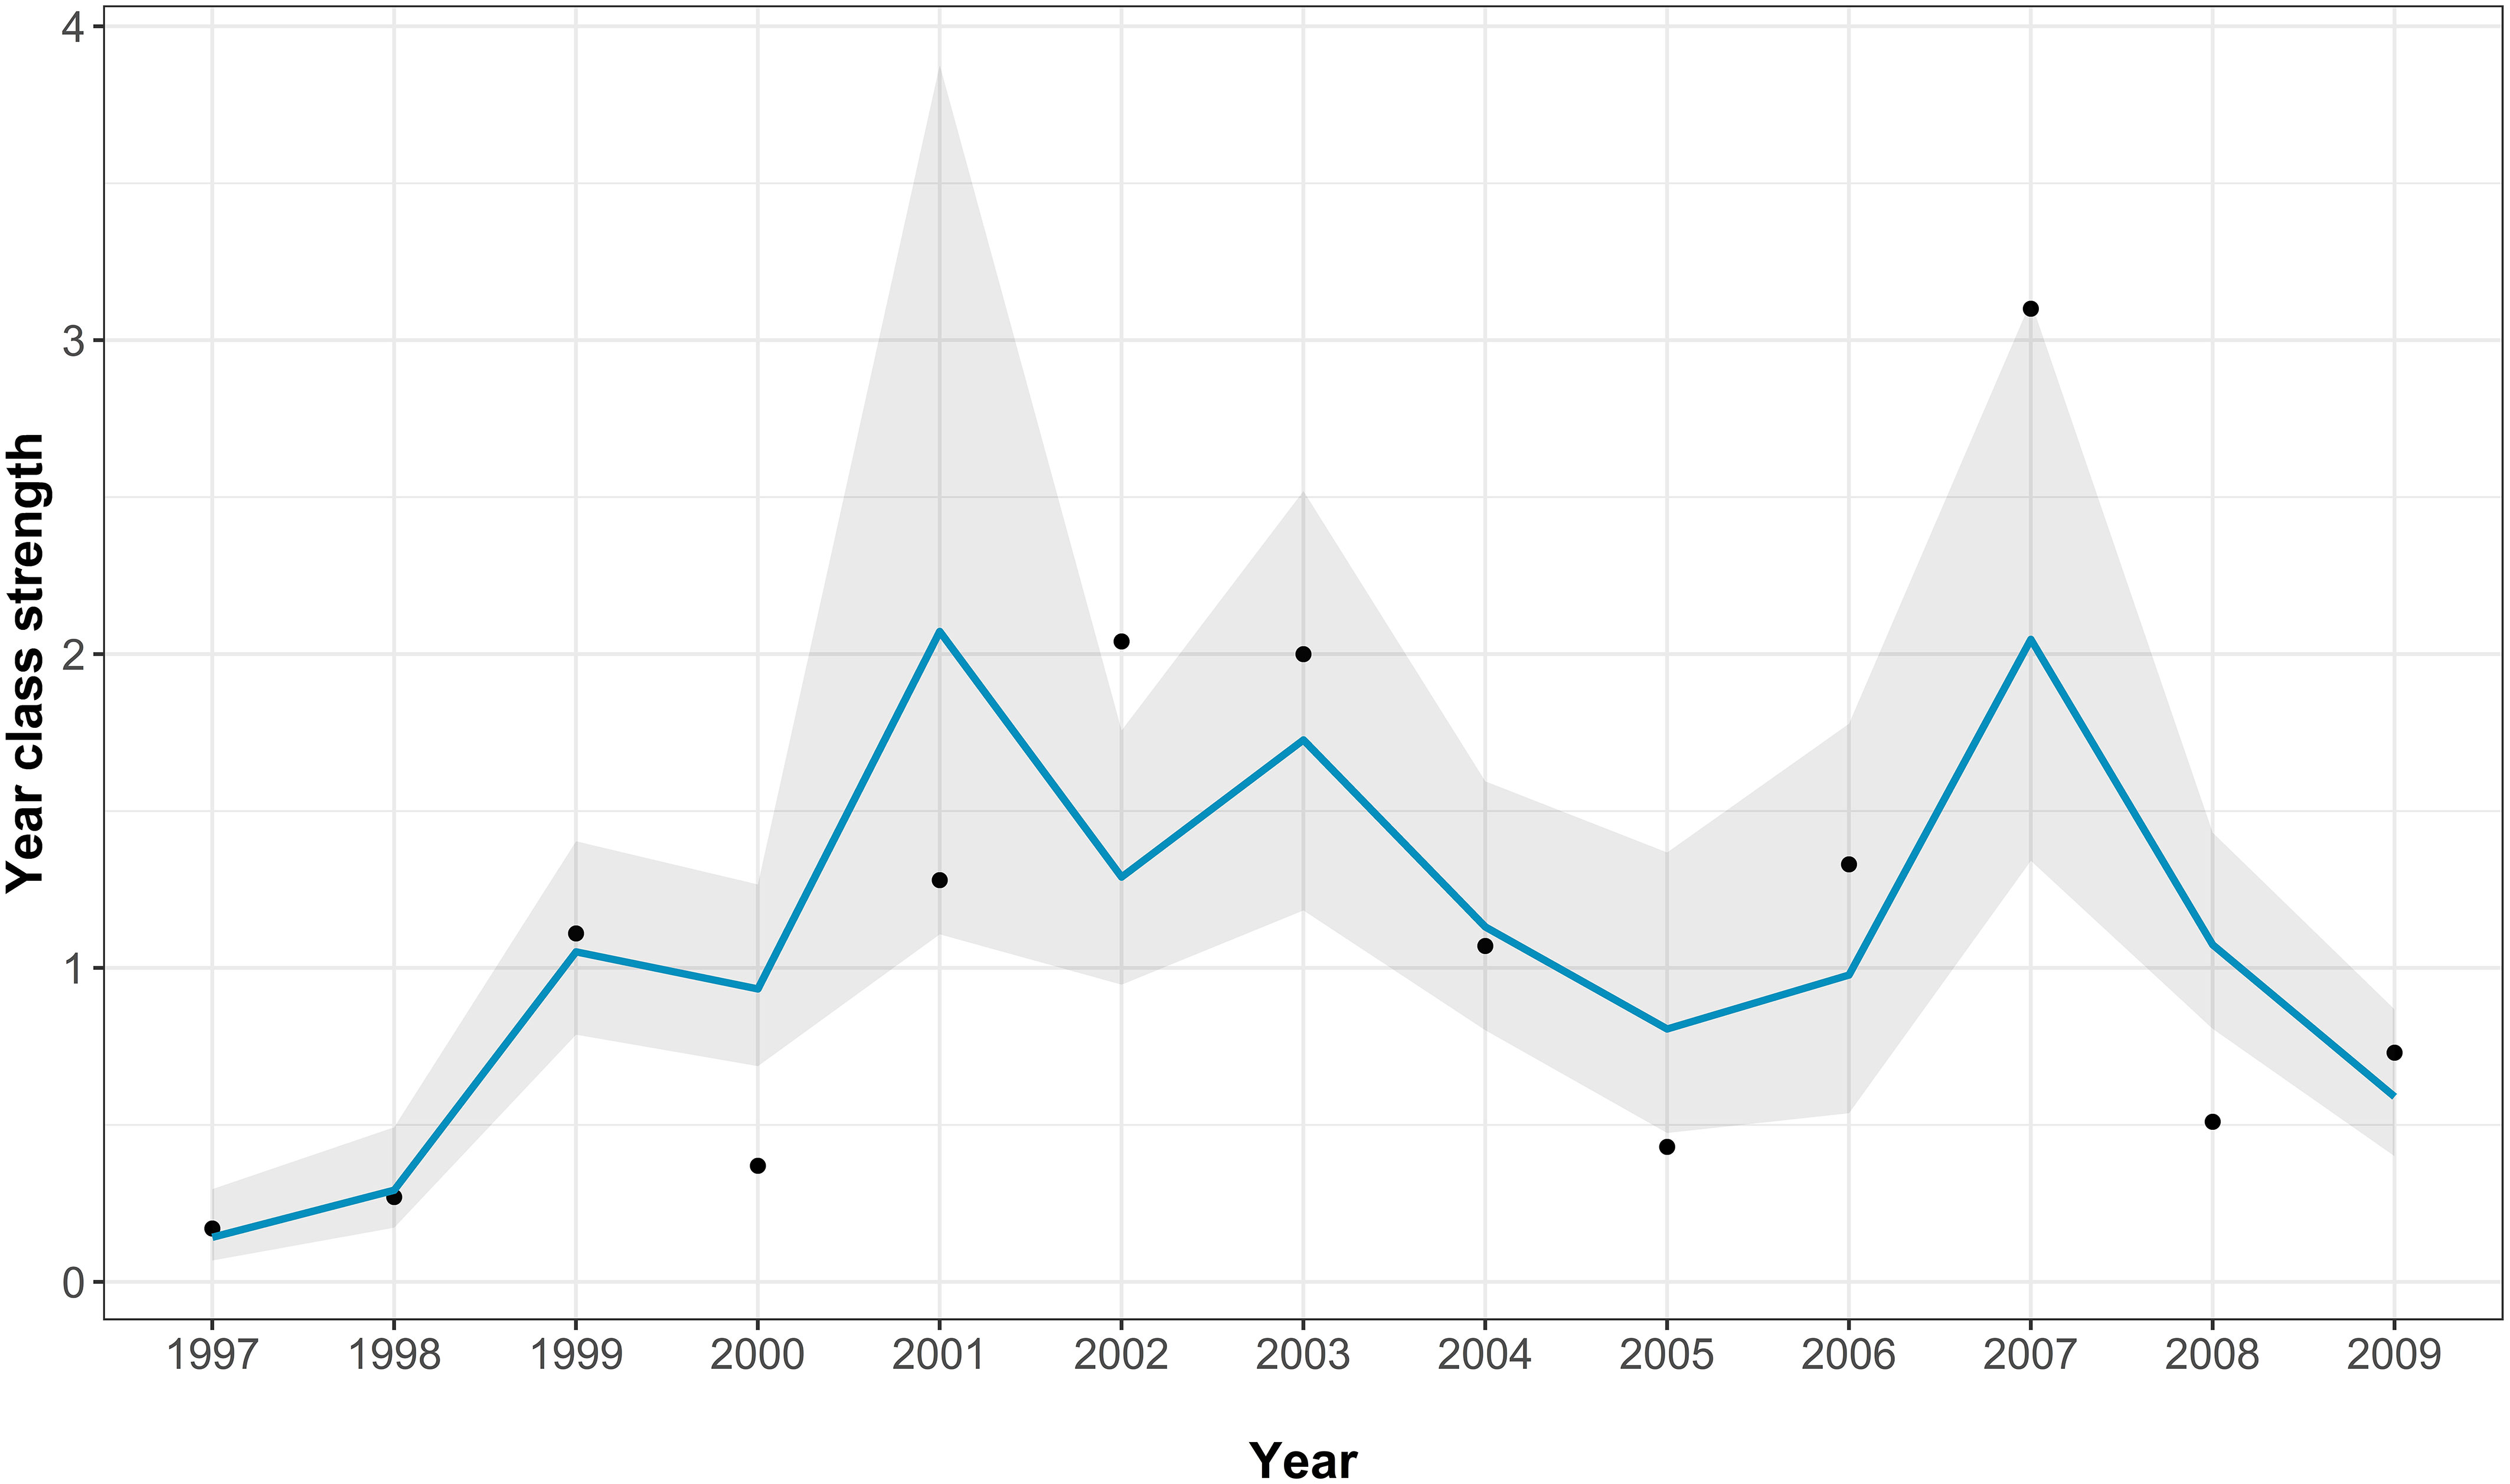
Figure 4 The Thames age aggregated juvenile abundance index model fits for the best-fitting model. The points show the real recruitment index, the blue line shows the model predictions, and the grey area indicating the model 95% confidence intervals.
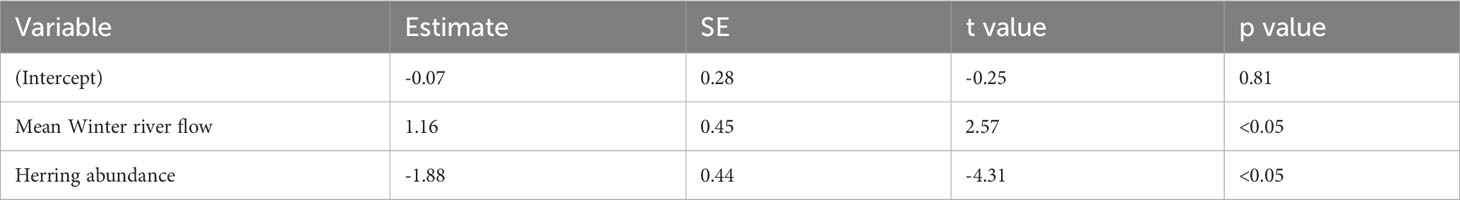
Table 2 Parameter estimates, standard error (SE), t values, and p values of the best-fitting model for the Thames.
The best-fitting model had an AICc score of 35 [which is a large improvement over the full model (Supplementary Table 2)] and an adjusted pseudo-R2 of 0.48 (Figure 5; Table 3). In the best-fitting model, herring abundance had a significant negative impact on juvenile sea bass abundance whereas the previous year’s recruits had a significant positive impact on sea bass juvenile abundance. Mean chlorophyll-a concentration has a negative relationship with juvenile sea bass abundance, but this was not statistically significant (Table 3).
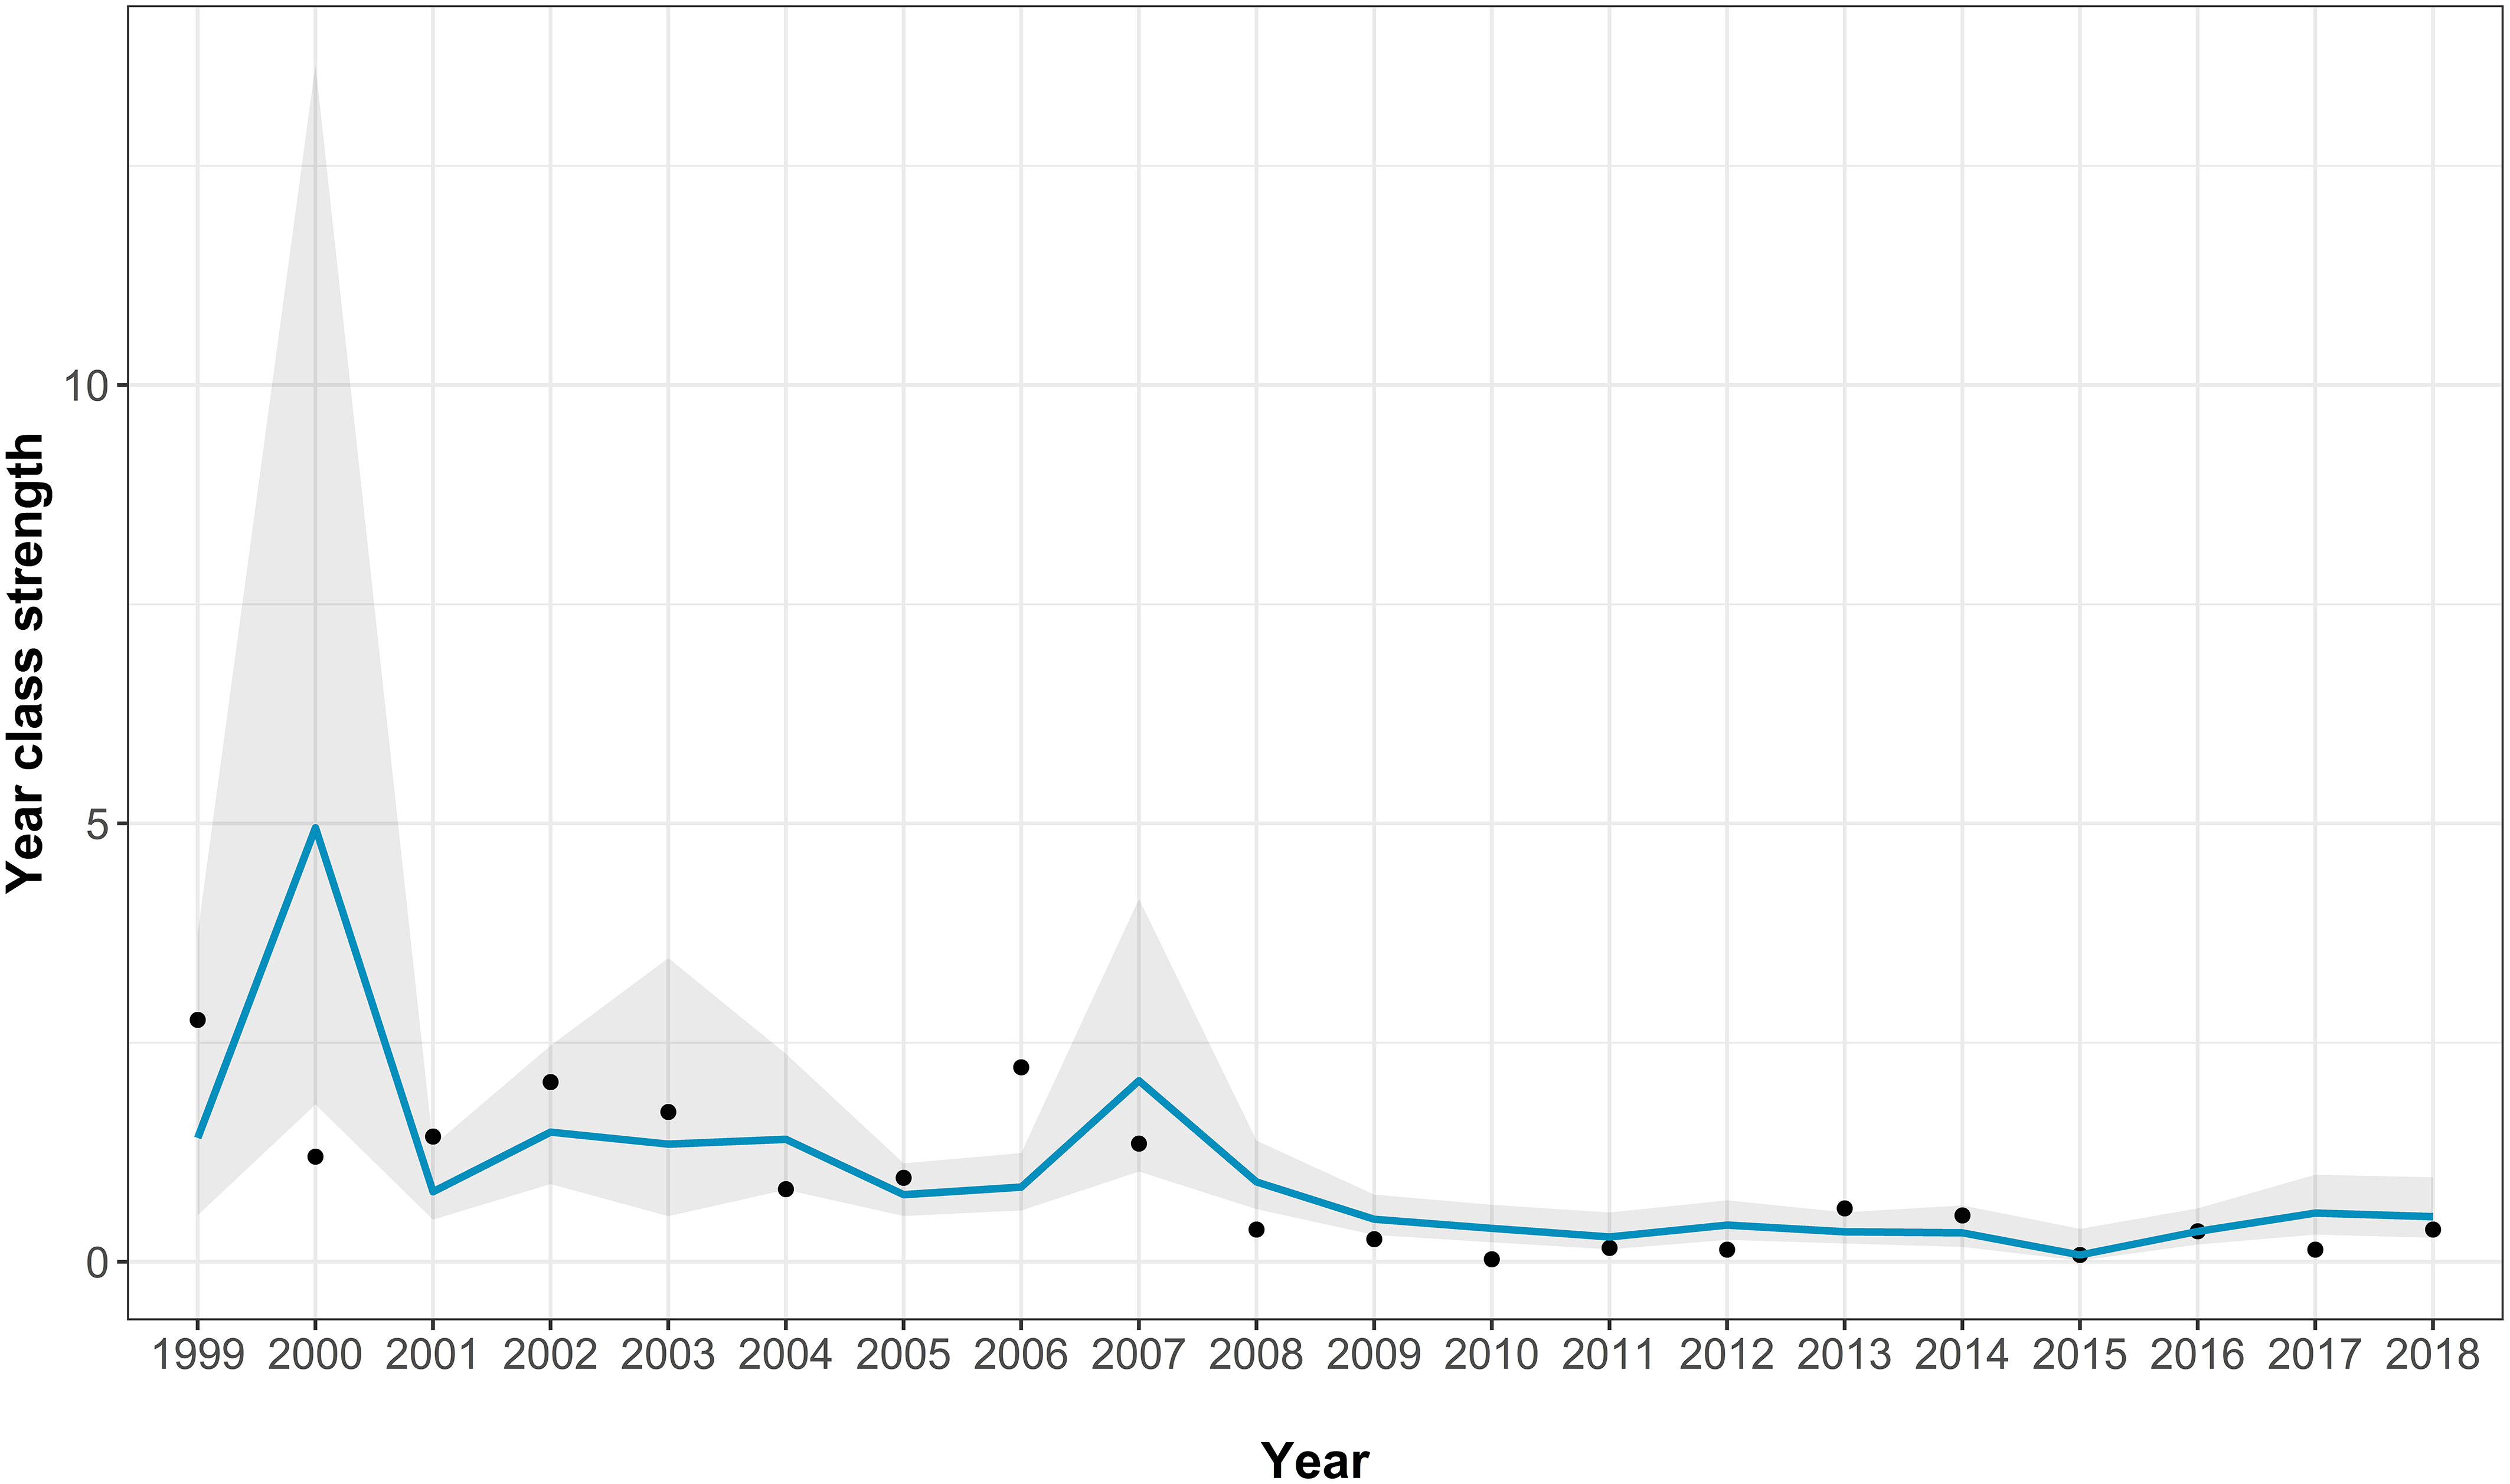
Figure 5 The Solent age aggregated recruitment index model fits for the best-fitting model. The points show the real recruitment index, the blue line shows the model predictions, and the grey area indicating the model 95% confidence intervals.
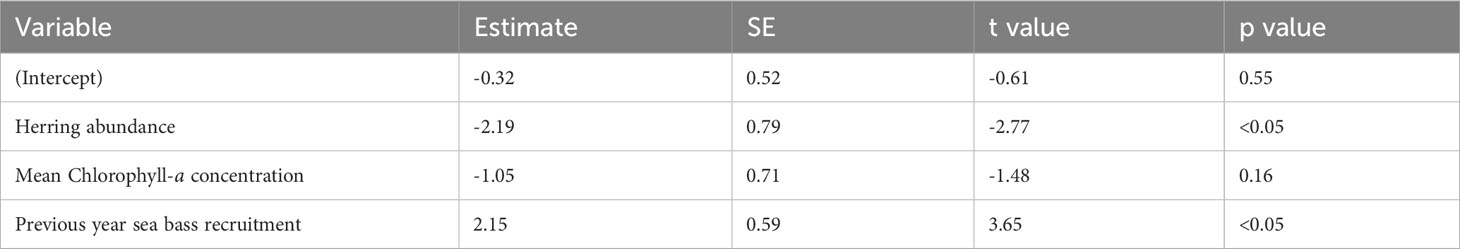
Table 3 Parameter estimates, standard error (SE), t values, and p values of the best-fitting model for the Solent.
As described in the methods section, due to the short time series of data available, it was not possible to fit models with sufficient numbers of variables for the Irish study estuaries. In addition, the best-fitting models for the Fal and Helford, Thames, and Solent also did not provide reasonable predictions of the trends observed in the Irish rivers. Figure 6 shows resultant fits for the Fal and Helford model and for other poor model fits see Supplementary Figure 11.
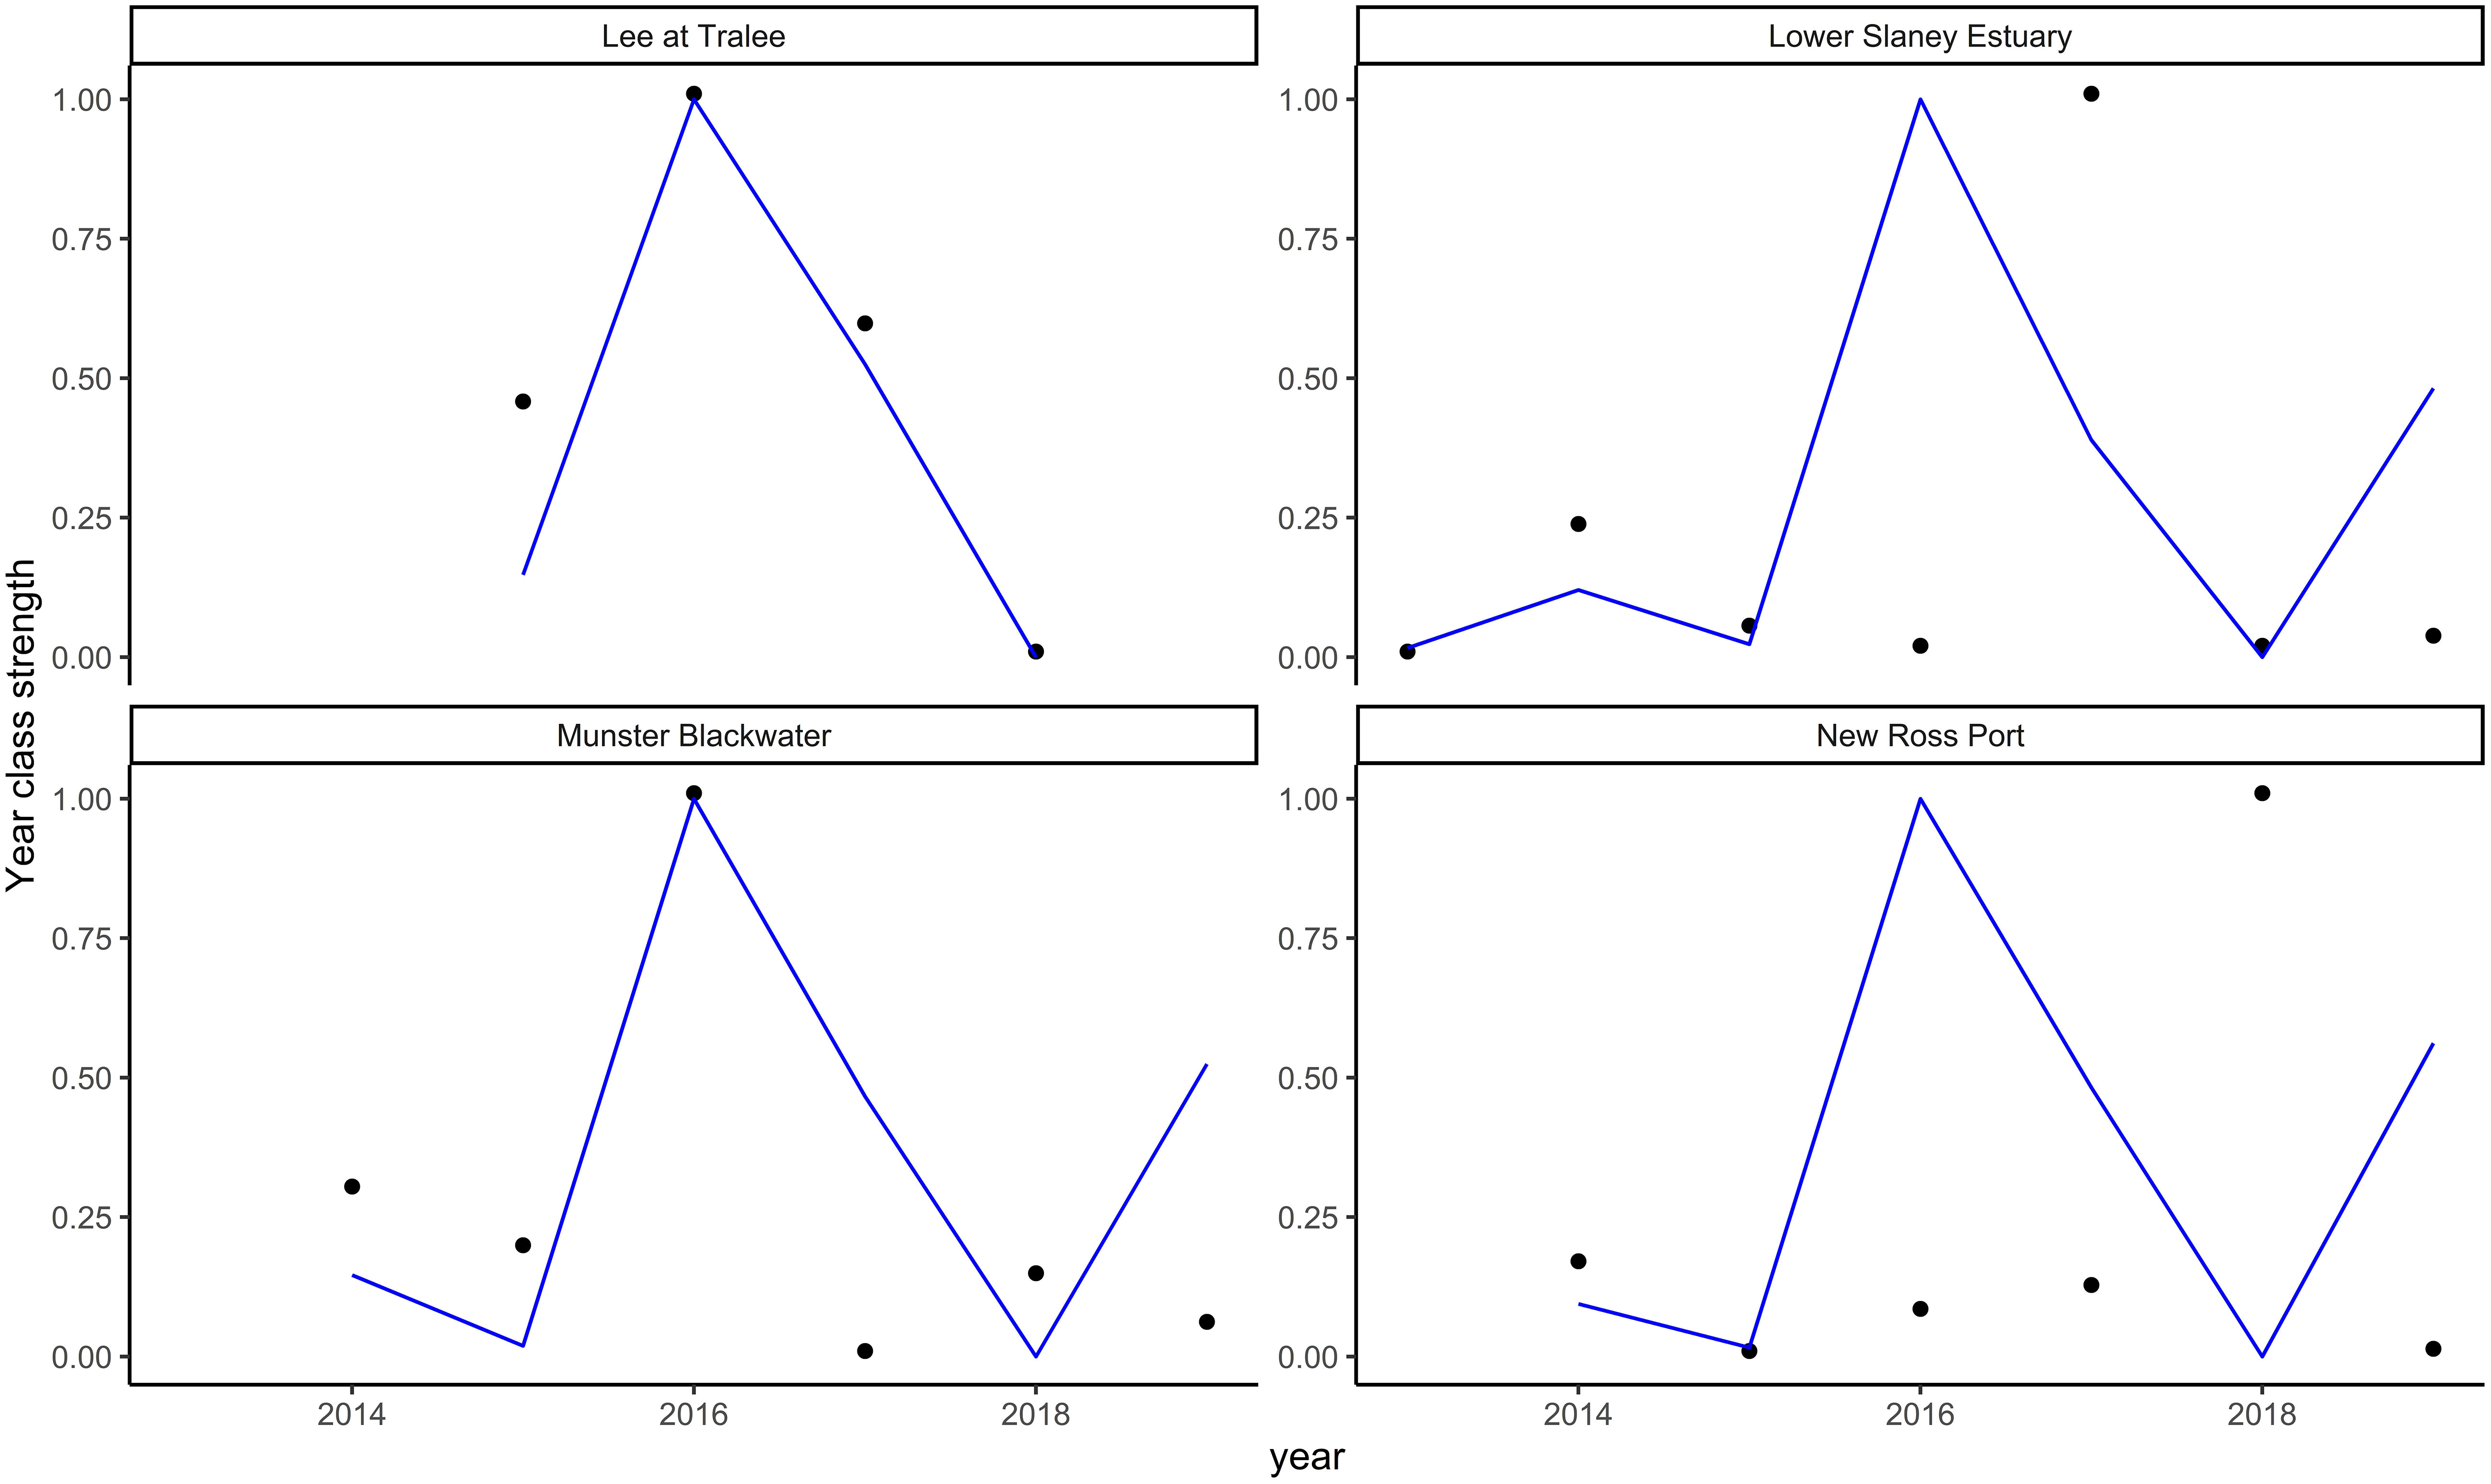
Figure 6 Sea bass year class strength predictions for the four Irish rivers (Lee at Tralee, Lower Slaney Estuary, Munster Blackwater, and New Ross Port) from the best-fitting models for the Fal and Helford. The points are observations, and the blue line represents the predicted values. The results are presented with a normalised scale (see methods) and without 95% confidence intervals as the aim was to assess the model’s ability to predict trends rather than actual values.
In this study, we used Generalized Linear Models to identify the relative importance of biological and environmental drivers of young sea bass abundance in British and Irish nursery areas important to the Northern stock of sea bass. Data availability for each study estuary differed and the length of time series affected our ability to fit models to the data, meaning that we did not generate models of Irish rivers due to the short time series (described further, later in the discussion). In comparison, there was relative success with models fitted to data from British rivers.
A primary finding from the analysis was the importance of predator abundance. The population of pelagic fish with the potential to predate on bass eggs and larvae is thought to effect supply to nursery areas alongside cannibalism pressure from the previous sea bass year bass class inside the estuary. In this study, we found that a greater herring abundance in the North Sea and English channel resulted in a significantly reduced abundance of young bass in the Solent and Thames. A less clear result was where a larger previous bass year classes in the Solent resulted in an increased abundance of juvenile sea bass. A similarly unclear result is where an increase in anchovy abundance also correlated with an increase in abundance of age 0 bass in the Fal and Helford. The mechanism for increased abundance of young bass when there is a higher potential for predation from the previous year class or pelagic predators is not clear as increased opportunity for predation/cannibalism should reduce supply/survival. Relationships between juvenile sea bass and potential cannibalism from the previous year class or predation of egg and larvae stages by anchovy could result from a correlation with other important factors for sea bass abundance not accounted for in this study. This could also be potentially linked to surveys taking place within different months, but this is considered unavoidable where surveys are designed and carried out to catch peak abundance in their respective estuaries. As the time series was limited, more data are needed to assess the robustness of these models. Research is required to determine whether the relationship between young sea bass abundance and the abundance of potential predators remains an important driver with a longer time-series.
Sea surface temperature was an important predictor in the best-fitting model for the Fal and Helford, but not the other estuaries. The lack of importance of SST in the Thames and Solent is surprising given the thermal tolerance range of adult sea bass (Person-Le Ruyet et al., 2004; Claireaux et al., 2006; Vinagre et al., 2012; Sánchez-Vázques and Muñoz-Cueto, 2014). In particular, sea temperatures of less than 9°C are believed to cause delayed maturation, reduced growth, poor settlement, and widespread juvenile mortality (Pawson, 1992; Pawson et al., 2000; ICES, 2012) which will reduce the supply of individuals to the nurseries and reduce their survival when there. Similar to the effect of predator abundance on indices on year class strength, the low impact of SST in the Thames and Solent could be due to a short time series used and/or linked to the necessary phenomenon of surveys taking place in different months across study estuaries. The time series used in the analysis captured mainly the period of poor year class strength, particularly in the Solent. Thus, the effects of temperature may only be important in determining the single very large year classes previously observed in the late 1980s and early 1990s. There was evidence to suggest that a regime shift occurred in the Northern hemisphere around the end of the 1990s (Auber et al., 2015; Beaugrand et al., 2015), which may also have impacted on the factors driving year class strength.
Winter river flow rates were an important predictor of young bass abundance in the Fal and Helford and the Thames estuaries, but not the Solent. In the Fal and Helford and the Thames, increased rate of winter river flow resulted in an increased abundance of juvenile sea bass, this differs from the Solent where winter river flow was not included in the best-fitting model. However, the opposite was true for mean annual river flow, which has a negative correlation with abundance in the Fal and Helford. Amongst many others, one explanation may be that the Solent estuary was somewhat less river dominated than the others included in this study. River flow has previously been shown to have a positive relationship with striped bass in the Chesapeake Bay USA (Martino and Houde, 2010; Millette et al., 2020) and sea bass recruitment in the Tagus estuary in Portugal (Vinagre et al., 2009). It is hypothesised that increased river flows, prior to settlement in the nursery areas, may result in enhanced settlement due to the formation of river plumes, which are thought to act as an environmental cue to pelagic larvae to direct their movement towards the nursery area (Vinagre et al., 2009). Increased river flow may also reduce the salinity of the surrounding area and increase the amount of organic matter in the water column, both of which might act as additional environmental cues to pelagic larvae (Creutzberg et al., 1978; Tanaka, 1985; Miller, 1988) and benefit juvenile growth (Johnson and Katavic, 1986; Vinagre et al., 2009). On the other hand, increased freshwater flows are typically associated with a decline in water temperature in winter and salinity. As sea bass in the northern stock live close to the lower limit of their thermal tolerance range, they may be more susceptible to the negative effects of increased river flows compared with those in Portugal that live comfortably within their thermal tolerance range. It is also possible that increased annual river flows in the Solent reflected a greater number of storm events, which may have a negative impact on juvenile survival and/or prevent larvae from reaching the nursery ground.
Sea bass SSB was not retained in any best-fitting models for any estuary, this is consistent with several studies that have shown recruitment success of sea bass to be largely independent of the stock size (Pawson et al., 2007a; ICES, 2018). As sea bass are thought to return to the same areas to spawn each year (Pawson et al., 2008), site-specific measures of SSB may be needed to better understand the relationship between SSB and recruitment in different areas. Similarly, measures of the SSB of herring or even the abundance of herring capable of predating seabass eggs and larvae over smaller spatial scales may help us to better understand the impacts of changes in the population size of herring on sea bass recruitment.
None of the models from UK Rivers predicted the trends in juvenile abundance observed in the Irish Rivers, despite their ability to predict their respective systems relatively well. The models’ inability to predict abundance trends in other locations indicates that there are either not enough data in the original models to support the trends observed, or other processes accounted for in the current models drive abundance in the Irish estuaries (or, more likely, a combination of the two). The importance of different variables for predicting sea bass abundance between estuarine systems is highlighted in this study as each estuary required a unique set of variables to predict the abundances of young sea bass. Consequently, additional data are required from the Irish estuaries before a juvenile abundance index can be derived from these locations.
The predictions made by the best-fitting models closely follow past trends in recruitment observed in the Fal and Helford, Thames, and Solent. For the Fal and Helford, the model predicted the peaks and troughs in the data with relatively high precision and accuracy, with almost all data points being within the 95% confidence interval. The high precision and accuracy of the model suggests the primary drivers, or at least proxies for these drivers, have been captured adequately in the model. The best-fitting Thames estuary model generally captured the trend in the data with most data points falling within the 95% prediction confidence intervals. The best-fitting Solent model generally captured some of the trend in juvenile sea bass abundance with around half the data points being within the 95% prediction confidence intervals. However, the best-fitting Solent model predicted a large peak in abundance in 2000 not seen in the data, alongside a large increase in the 95% confidence interval range.
In this study, we have focused on seven estuaries in southern Great Britain and Ireland that widely represent the important nursery areas for the northern stock of sea bass. However, the sites studied varied in the length of time series data available which effects uncertainly around modelling conclusions. We suggest that future focus should look to extend the analysis shown here with scope to include drivers of abundance from additional data sets (e.g., pollution) collected for other reasons [e.g., Water Framework Directive, local monitoring; (Hyder et al., 2018)] alongside data from other countries (e.g. France). It is also important to continue monitoring programmes to understand the extent and relative contribution of nursery areas for sea bass. Despite data limitations the study has identified potential drivers of sea bass abundance in the Fal and Helford, Thames, and Solent estuaries. We did not find evidence for a relationship between sea bass SSB and young bass abundance relationship in any of the estuaries where bass SSB is removed from the best-fitting model in all cases. The results highlight the challenges with developing stock recruitment relationships for sea bass and that if a SSR was to be included in the assessment of this stock then it would need to include a broad suite of drivers as identified in the study presented here. Managers can then begin to evaluate the impacts of prospective policy options on the future of the stock using a more biologically realistic model with scope to investigate impacts of climate change and other changes on future sea bass recruitment.
The raw data supporting the conclusions of this article will be made available by the authors, without undue reservation. Requests to access these datasets should be directed to am9zZXBoLndhdHNvbkBjZWZhcy5nb3YudWs=.
JW, ZR, HB, RB, MB, BC, DG, JG, RN, WR, CW, and KH made contributions as authors. JW, ZR, and KH led the writing of the manuscript. JW, ZR, HB, JG, and KH contributed to model development and all authors gave critical comments on each draft of the manuscript. RB, MB, BC, DG, WR, and CW provided survey data from nursery grounds for comparison, as well as guidance on interpretation of this data. All authors gave permission for submission having seen the final draft. All authors contributed to the article and approved the submitted version.
The author(s) declare financial support was received for the research, authorship, and/or publication of this article. This work was funded by UK Department for Environment Food and Rural Affairs (DEFRA, FRD009, FRD052).
We would also like to thank all the volunteers who gave up their time to collect data for the Fal and Helford survey.
The authors declare that the research was conducted in the absence of any commercial or financial relationships that could be construed as a potential conflict of interest.
All claims expressed in this article are solely those of the authors and do not necessarily represent those of their affiliated organizations, or those of the publisher, the editors and the reviewers. Any product that may be evaluated in this article, or claim that may be made by its manufacturer, is not guaranteed or endorsed by the publisher.
The Supplementary Material for this article can be found online at: https://www.frontiersin.org/articles/10.3389/fmars.2023.1209311/full#supplementary-material
Auber A., Travers-Trolet M., Villanueva M. C., Ernande B. (2015). Regime shift in an exploited fish community related to natural climate oscillations. PloS One 10, e0129883. doi: 10.1371/journal.pone.0129883
Bartoń K. (2018). MuMIn: multi-model inference (R package version 1.42.1). Available at: https://CRAN.Rproject.org/package=MuMIn.
Beaugrand G., Conversi A., Chiba S., Edwards M., Fonda-Umani S., Greene C., et al. (2015). Synchronous marine pelagic regime shifts in the Northern Hemisphere. Philos. Trans. R. Soc Lond. B Biol. Sci. 370, 1–16. doi: 10.1098/RSTB.2013.0272
Bento E. G., Grilo T. F., Nyitrai D., Dolbeth M., Pardal M.Â., Martinho F. (2016). Climate influence on juvenile European sea bass (Dicentrarchus labrax) populations in an estuarine nursery: A decadal overview. Mar. Environ. Res. 122, 93–104. doi: 10.1016/j.marenvres.2016.09.011
Beraud C., van der Molen J., Armstrong M., Hunter E., Fonseca L., Hyder K. (2018). The influence of oceanographic conditions and larval behaviour on settlement success—the European sea bass Dicentrarchus labrax. ICES J. Mar. Sci. 75, 455–470. doi: 10.1093/icesjms/fsx195
Bogstad B., Yaragina N. A., Nash R. D. M. (2015). The early life-history dynamics of Northeast Arctic cod: levels of natural mortality and abundance during the first 3 years of life. Can. J. Fish. Aquat. Sci. 73, 246–256. doi: 10.1139/CJFAS-2015-0093
Brown M. (2017). Cefas Solent Bass Survey in 2017, and update of bass recruitment index time series (Lowestoft, UK: Cefas). 7pp.
Brown M. (2018). Cefas Solent Bass Survey in 2018, and update of bass recruitment index time series (Lowestoft, UK: Cefas Report). 12pp.
Catherall H. (2020). Inter-annual variation in the abundance of juvenile European sea bass (Dicentrarchus labrax) in estuarine nursery habitats in Cornwall (University of Plymouth MRes thesis). 34pp.
Cavanaugh J. E. (1997). Unifying the derivations for the Akaike and corrected Akaike information criteria. Stat. Probab. Lett. 33, 201–208. doi: 10.1016/S0167-7152(96)00128-9
Ciotti B. J., Targett T. E., Burrows M. T. (2013). Spatial variation in growth rate of early juvenile European plaice Pleuronectes platessa. Mar. Ecol. Prog. Ser. 475, 213–232. doi: 10.3354/MEPS10087
Claireaux G., Couturier C., Groison A.-L. (2006). Effect of temperature on maximum swimming speed and cost of transport in juvenile European sea bass (Dicentrarchus labrax). J. Exp. Biol. 209, 3420–3428. doi: 10.1242/jeb.02346
Copernicus Marine Service Information (CMEMS) (2023). ESA SST CCI and C3S reprocessed sea surface temperature analyses. E.U. Marine Data Store (MDS). doi: 10.48670/moi-00169
Copernicus Marine Service Information (CMEMS) (2023). Atlantic- European North West Shelf- Ocean Biogeochemistry Reanalysis. E.U. Marine Data Store (MDS). doi: 10.48670/moi-00058
Creutzberg F., Eltink A., Th. G. W., van Noort G. J. (1978). The migration of plaice larvae Pleuronectes platessa into the western Wadden Sea. Physiol. Behav. Mar. Organisms: proceedings 12th European marine biological symposium. Pergamon Press, UK, pp 243–252. doi: 10.1016/B978-0-08-021548-8.50035-8
DATRAS (2021). ICES database of trawl surveys (DATRAS), extraction January-February 2021 of international bottom trawl survey (IBTS) (Copenhagen, Denmark: ICES).
Fox C. J., Geffen A. J., Taylor N., Davison P., Rossetti H., Nash R. D. M. (2007). Birth-date-selection in early life stages of plaice (Pleuronectes platessa L.) in the eastern Irish Sea (British Isles). Mar. Ecol. Prog. Ser. 345, 255–269. doi: 10.3354/MEPS06967
Fox C. J., McCloghrie P., Young E. F., Nash R. D. M. (2006). The importance of individual behaviour for successful settlement of juvenile plaice (Pleuronectes platessa L.): a modelling and field study in the eastern Irish Sea. Fish. Oceanogr. 15, 301–313. doi: 10.1111/J.1365-2419.2005.00396.X
Graham J. A., O’Dea E., Holt J., Polton J., Hewitt H. T., Furner R., et al. (2018). AMM15: a new high-resolution NEMO configuration for operational simulation of the European north-west shelf. Geosci. Model. Dev. 11, 681–696. doi: 10.5194/gmd-11-681-2018
Graham J. A., Watson J. W., García García L. M., Bradley K., Bradley R., Brown M., et al. (2023). Pelagic connectivity of European sea bass between spawning and nursery grounds. Front. Mar. Sci. 9. doi: 10.3389/fmars.2022.1046585
Henderson P. A., Corps M. (1997). The role of temperature and cannibalism in interannual recruitment variation of bass in British waters. J. Fish. Biol. 50, 280–295. doi: 10.1111/j.1095-8649.1997.tb01359.x
Hilborn R., Walters C. J. (1992). Stock and recruitment. Quantitative Fisheries Stock Assess. Springer, Boston, MA. doi: 10.1007/978-1-4615-3598-0_7
Hjort J. (1914). Fluctuations in the great fisheries of Northern Europe viewed in light of biological research. Rapp. P.-V. Reun. Cons. Perm. Int. Explor. Mer 20, 1–228.
Houde E. D. (2008). Emerging from hjort’s shadow. J. Northwest Atl. Fish 41, 53–70. doi: 10.2960/J.V41.M634
Hyder K., Scougal C., Couce E., Fronkova L., Waugh A., Brown M., et al. (2018) Presence of European sea bass (Dicentrarchus labrax) and other species in proposed bass nursery areas. Available at: www.cefas.co.uk (Accessed April 5, 2022). 120pp.
ICES (2012). Report of the working group on assessment of new MoU species (Copenhagen, Denmark: WGNEW), 5 - 9 March 2012, . ICES CM 2012/ACOM:20. 258 pp. doi: 10.17895/ices.pub.8202
ICES (2014a). Report of the inter-benchmark protocol for sea bass in the Irish sea, Celtic sea, english channel and Southern North sea (IBP bass) Vol. 45 (Copenhagen, Denmark: ICES CM. 2014/ACOM). 218pp.
ICES (2014b). Report of the working group on celtic seas ecoregion (WGCSE), 13–22 May 2014 Vol. 12 (Copenhagen, Denmark: ICES CM 2014/ACOM). 2032pp.
ICES (2018). Report of the benchmark workshop on seabass (WKBASS), 20–24 February 2017 and 21–23 February 2018 Vol. 44 (Copenhagen, Denmark: ICES CM 2018/ACOM). 283pp. doi: 10.17895/ices.pub.5344
ICES (2020a). ICES Workshop on unavoidable survey effort reduction (WKUSER). ICES Sci. Rep. 2, 72. doi: 10.17895/ices.pub.7453
ICES (2020b). Manual for the North sea international bottom trawl surveys. Series of ICES survey protocols SISP 10-IBTS 10, revision 11 (Copenhagen, Denmark), 102pp. doi: 10.17895/ices.pub.7562
ICES (2020c). Stock Annex for Sea bass (Dicentrarchus labrax) in divisions 4.b–c, 7.a, and 7.d–h (central and southern North Sea, Irish Sea, English Channel, Bristol Channel, and Celtic Sea), Last updated March 2020 (Copenhagen, Denmark: ICES Stock Annex), 111.
ICES (2020d). Working group for the Celtic Seas Ecoregion (WGCSE). ICES Scientific Reports. Copenhagen, Denmark. Report. 1461 pp. doi: 10.17895/ICES.PUB.5978
Jennings S., Ellis J. R. (2015). “Bass (Moronidae),” in Fish atlas of the Celtic Sea, North Sea, and Baltic Sea. Eds. Heessen H. J. L., Daan N., Ellis J. R. (Wageningen, Netherlands: Wageningen Academic Publishers/KNNV Publishing), 324–327.
Jennings S., Kaiser M. J., Reynolds J. D. (2001). Marine fisheries ecology: an introduction. (Oxford: Blackwell Scicence), 423.
Johnson D. W., Katavic I. (1986). Survival and growth of sea bass (Dicentrarchus labrax) larvae as influenced by temperature, salinity, and delayed initial feeding. Aquaculture 52, 11–19. doi: 10.1016/0044-8486(86)90102-X
Kell L. T., Nash R. D. M., Dickey-Collas M., Mosqueira I., Szuwalski C. (2016). Is spawning stock biomass a robust proxy for reproductive potential? Fish Fish. 17, 596–616. doi: 10.1111/FAF.12131
Kelly F. L., Connor L., Matson R., Coyne J., Feeney R., Morrissey E., et al. (2015). Water framework directive fish stock survey of transitional waters in the South Eastern river basin district – slaney estuary and north slob channels. Inland Fisheries Ireland IFI/2015/1-4248. 25 pp.
Martino E. J., Houde E. D. (2010). Recruitment of striped bass in Chesapeake Bay: spatial and temporal environmental variability and availability of zooplankton prey. Mar. Ecol. Prog. Ser. 409, 213–228. doi: 10.3354/MEPS08586
Maunder M. N., Piner K. R. (2015). Contemporary fisheries stock assessment: many issues still remain. ICES J. Mar. Sci. 72, 7–18. doi: 10.1093/ICESJMS/FSU015
Methot R. D., Wetzel C. R. (2013). Stock synthesis: A biological and statistical framework for fish stock assessment and fishery management. Fish. Res. 142, 86–99. doi: 10.1016/j.fishres.2012.10.012
Miller J. (1988). “Physical processes and the mechanisms of coastal migrations of immature marine fishes,” in American Society Symposium, Vol. 3. 68–76.
Millette N. C., Pierson J. J., North E. W. (2020). Water temperature during winter may control striped bass recruitment during spring by affecting the development time of copepod nauplii. ICES J. Mar. Sci. 77, 300–314. doi: 10.1093/icesjms/fsz203
Ottersen G., Holt R. E. (2023). Long-term variability in spawning stock age structure influences climate–recruitment link for Barents Sea cod. Fish. Oceanogr. 32, 91–105. doi: 10.1111/fog.12605
Pawson M. G. (1992). “Climatic influences on the spawning success, growth and recruitment of Bass (Dicentrarcus labrax) in British Waters,” in ICES Mar. Sci. Symp, Vol. 195. 388–392.
Pawson M. G., Brown M., Leballeur J., Pickett G. D. (2008). Will philopatry in sea bass, Dicentrarchus labrax, facilitate the use of catch-restricted areas for management of recreational fisheries? Fish. Res. 93, 240–243. doi: 10.1016/j.fishres.2008.03.002
Pawson M. G., Kupschus S., Pickett G. D. (2007a). The status of sea bass (Dicentrarchus labrax) stocks around England and Wales, derived using a separable catch-at-age model, and implications for fisheries management. ICES J. Mar. Sci. 64, 346–356. doi: 10.1093/icesjms/fsl030
Pawson M. G., Pickett G. D. (1996). The annual pattern of condition and maturity in bass, dicentrarchus labrax, in waters around England and wales. J. Mar. Biol. Assoc. 76, 107–125. doi: 10.1017/S0025315400029040
Pawson M. G., Pickett G. D., Leballeur J., Brown M., Fritsch M. (2007b). Migrations, fishery interactions, and management units of sea bass (Dicentrarchus labrax) in Northwest Europe. ICES J. Mar. Sci. 64, 332–345. doi: 10.1093/icesjms/fsl035
Pawson M. G., Pickett G. D., Witthames P. R. (2000). The influence of temperature on the onset of first maturity in sea bass. J. Fish. Biol. 56, 319–327. doi: 10.1006/jfbi.1999.1157
Person-Le Ruyet J., Mahé K., le Bayon N., le Delliou H. (2004). Effects of temperature on growth and metabolism in a Mediterranean population of European sea bass, Dicentrarchus labrax. Aquaculture 237, 269–280. doi: 10.1016/J.AQUACULTURE.2004.04.021
Pickett G. D., Brown M., Harley B., Dunn M. R. (2002). Surveying fish populations in the Solent and adjacent harbours using the Cefas bass trawl. Cefas Sci. Ser. Tech. Rep. 118, 1–16.
Pickett G. D., Kelley D. F., Pawson M. G. (2004). The patterns of recruitment of sea bass, Dicentrarchus labrax L. from nursery areas in England and Wales and implications for fisheries management. Fish. Res. 68, 329–342. doi: 10.1016/j.fishres.2003.11.013
Pickett G. D., Pawson M. G. (1994). Sea bass. Biology, exploitation and conservation Vol. 12 (London UK: Fish & Fisheries Series). 360pp.
R Core Team (2018). R: A language and environment for statistical computing (Vienna, Austria: R Foundation for Statistical Computing). Available at: https://www.R-project.org/.
Sánchez-Vázques F. J., Muñoz-Cueto J. A. (2014). Biology of European Sea Bass (1st ed.). (Boca Raton), CRC Press. 436pp. doi: 10.1201/b16043
Sapiano M. R. P., Brown C. W., Schollaert Uz S., Vargas M. (2012). Establishing a global climatology of marine phytoplankton phenological characteristics. J. Geophys. Res. Oceans 117, n/a–n/a. doi: 10.1029/2012JC007958
Sguotti C., Otto S. A., Cormon X., Werner K. M., Deyle E., Sugihara G., et al. (2020). Non-linearity in stock–recruitment relationships of Atlantic cod: insights from a multi-model approach. ICES J. Mar. Sci. 77, 1492–1502. doi: 10.1093/icesjms/fsz113
Signorell A. (2019). DescTools: Tools for descriptive statistics (R package version 0.99.27). Available at: https://cran.r-project.org/package=DescTools.
Subbey S., Devine J. A., Schaarschmidt U., Nash R. D. M. (2014). Modelling and forecasting stock–recruitment: current and future perspectives. ICES J. Mar. Sci. 71, 2307–2322. doi: 10.1093/icesjms/fsu148
Tanaka M. (1985). Factors affecting the inshore migration of pelagic larval and demersal juvenile red sea bream Pagrus major to a nursery ground. Trans. Am. Fish Soc. 114, 471–477. doi: 10.1577/1548-8659(1985)114<471:FATIMO>2.0.CO;2
Vert-pre K. A., Amoroso R. O., Jensen O. P., Hilborn R. (2013). Frequency and intensity of productivity regime shifts in marine fish stocks. Proc. Natl. Acad. Sci. U.S.A. 110, 1779–1784. doi: 10.1073/pnas.1214879110
Vinagre C., Madeira D., Narciso L., Cabral H. N., Diniz M. (2012). Effect of temperature on oxidative stress in fish: Lipid peroxidation and catalase activity in the muscle of juvenile seabass, Dicentrarchus labrax. Ecol. Indic. 23, 274–279. doi: 10.1016/j.ecolind.2012.04.009
Vinagre C., Santos F. D., Cabral H. N., Costa M. J. (2009). Impact of climate and hydrology on juvenile fish recruitment towards estuarine nursery grounds in the context of climate change. Estuar. Coast. Shelf Sci. 85, 479–486. doi: 10.1016/j.ecss.2009.09.013
Keywords: European sea bass, Dicentrarchus labrax, fisheries management, year class strength, recruitment, estuary
Citation: Watson JW, Radford Z, Bannister H, Bradley R, Brown M, Ciotti BJ, Goodwin D, Graham JA, Nash RDM, Roche WK, Wogerbauer C and Hyder K (2024) Assessing the coherence in biological and environmental drivers of young sea bass abundance across important estuarine nursery areas of the northern European sea bass stock. Front. Mar. Sci. 10:1209311. doi: 10.3389/fmars.2023.1209311
Received: 20 April 2023; Accepted: 20 December 2023;
Published: 10 January 2024.
Edited by:
Yang Jin, Johns Hopkins University, United StatesReviewed by:
Xiujuan Shan, Chinese Academy of Fishery Sciences (CAFS), ChinaCopyright © 2024 Watson, Radford, Bannister, Bradley, Brown, Ciotti, Goodwin, Graham, Nash, Roche, Wogerbauer and Hyder. This is an open-access article distributed under the terms of the Creative Commons Attribution License (CC BY). The use, distribution or reproduction in other forums is permitted, provided the original author(s) and the copyright owner(s) are credited and that the original publication in this journal is cited, in accordance with accepted academic practice. No use, distribution or reproduction is permitted which does not comply with these terms.
*Correspondence: Joseph W. Watson, am9zZXBoLndhdHNvbkBjZWZhcy5nb3YudWs=
Disclaimer: All claims expressed in this article are solely those of the authors and do not necessarily represent those of their affiliated organizations, or those of the publisher, the editors and the reviewers. Any product that may be evaluated in this article or claim that may be made by its manufacturer is not guaranteed or endorsed by the publisher.
Research integrity at Frontiers
Learn more about the work of our research integrity team to safeguard the quality of each article we publish.