
94% of researchers rate our articles as excellent or good
Learn more about the work of our research integrity team to safeguard the quality of each article we publish.
Find out more
ORIGINAL RESEARCH article
Front. Mar. Sci. , 08 January 2024
Sec. Marine Ecosystem Ecology
Volume 10 - 2023 | https://doi.org/10.3389/fmars.2023.1209093
 Davide Cicala1
 Giulia Maiello1,2
 Fabio Fiorentino3,4
 Germana Garofalo3,5
 Daniela Massi3,5
 Alice Sbrana1Stefano Mariani2Simone D’Alessandro6
 Matteo Stefani1Lucie Perrodin1
 Tommaso Russo1,7,8*
The evaluation of the status of marine communities, and especially the monitoring of those heavily exploited by fisheries, is a key, challenging task in marine sciences. Fishing activities are a major source of disruption to marine food webs, both directly, by selectively removing components at specific trophic levels (TL), and indirectly, by altering habitats and production cycles. Food web analysis can be very useful in the context of an Ecosystem Approach to Fisheries, but food web reconstructions demand large and expensive data sets, which are typically available only for a small fraction of marine ecosystems. Recently, new technologies have been developed to easily, quickly and cost-effectively collect environmental DNA (eDNA) during fishing activities. By generating large, multi-marker metabarcoding data from eDNA samples obtained from commercial trawlers, it is possible to produce exhaustive taxonomic inventories for the exploited ecosystems, which are suitable for food-web reconstructions. Here, we integrate and re-analyse the data of a recent study in which the α diversity was investigated using the eDNA opportunistically collected during fishing operations. Indeed, we collect highly resolved information on species feeding relationships to reconstruct the food webs at different sites in the Strait of Sicily (Mediterranean Sea) from eDNA and catch data. After observing that the trophic networks obtained from eDNA metabarcoding data are more consistent with the available knowledge, a set of food web indicators (species richness, number of links, direct connectance and generality) is computed and analysed to unravel differences in food webs structure through different areas (spatial variations). Species richness, number of links and generality (positively) and direct connectance (negatively) are correlated with increasing distance from the coast and fishing effort intensity. The combined effects of environmental gradients and fishing effort on food web structure at different study sites are then examined and modelled. Taken together, these findings indicate the suitability of eDNA metabarcoding to assist and food web analysis, obtain several food web-related ecological indicators, and tease out the effect of fishing intensity from the environmental gradients of marine ecosystems.
Assessing the status of marine communities, and in particular those subject to fishing exploitation, is historically conducted by analysing in detail the demographics of a few key species (Hilborn, 2011; Cowan et al., 2012). This approach may be justified by our incomplete knowledge of marine community structure and the limited availability of quantitative observations of the distribution, abundance, and life cycle of many species; however, it is not coherent with the Ecosystem-based Approach to Fisheries, which is often advocated but rarely implemented (Hilborn, 2011), except through the application of trophic network models, including mass-balance (Agnetta et al., 2022). Understanding how anthropogenic pressures interact with environmental gradients to shape community structure is crucial to support ecosystem management and conservation plans (McCann, 2007; Thompson et al., 2012). In this context, Food Webs Analysis (FWA) constitutes a fundamental component in the assessments of ‘Good Environmental Status’ (EC, 2008), but unfortunately, how the structure and functioning of food webs change in response to environmental gradients and human pressures, such as fishing pressure (Jennings et al., 2002; Preciado et al., 2019), is still unclear. Investigating the local reaction of a community to a stressor such as fishing is a crucial in addressing this challenge (Micheli et al., 2013; Ramírez et al., 2018) and an approach for food web reconstructions such as FWA could be an useful tool to community ecology studies (Dunne et al., 2002; Bascompte et al., 2005; Bascompte, 2009; Dunne, 2009). Despite its acknowledged importance in marine ecology, FWA is still under-utilised in bioassessment. FWA is not only a clear and effective way to show the architecture of biodiversity, and the structure and functions of ecosystems (Dunne et al., 2002; Thompson et al., 2012), but it also has the potential to provide informative indicators about the stability of communities (May, 1974) and their robustness to biodiversity loss (Estrada, 2007; Gilbert, 2009).
Since reconstructing food webs is complex (Thompson et al., 2012), time consuming and data demanding, its application has been limited by the lack of methods and tools that can facilitate the process of biodiversity data collection (Bohan et al., 2017). In the last decade, the development of DNA metabarcoding-based approaches has opened up new scenarios for the rapid and large-scale collection of information on the presence and distribution of marine species. This approach can be used to analyse environmental DNA (eDNA) and enables a rapid assessment of a wide range of organisms, from unicellular eukaryotes to resident small- and large-bodied animals by amplifying their DNA, reducing the dependence on traditional taxonomic approaches. Recently developed low-cost methods (Russo et al., 2021; Maiello et al., 2022; Albonetti et al., 2023; Maiello et al., 2023) that can be implemented directly on board fishing vessels suggest that the cost of collecting biological samples can be drastically reduced, even in offshore areas. DNA metabarcoding could thus progressively overcome one of the major criticisms to FWA: the scarcity of taxonomic information and resolution (Cohen et al., 1990). eDNA metabarcoding in fact emphasises the taxonomic units rather than pools and fluxes of energy, biomass or nutrients, enabling accurate and cost-effective biodiversity assessments (D’Alessandro and Mariani, 2021; Kelly et al., 2017, 201; Stat et al., 2019), which leads to Molecular Ecological Network Analysis (MENA - Deng et al., 2012; Stat et al., 2019). In this paper, we use the list of taxa data produced in Russo et al. (2021) to reconstruct the food webs at nine different locations in the Strait of Sicily. In practice, this paper presents a re-analysis of the data published in Russo et al. (2021), focused on the potential application of eDNA metabarcoding data from the slush to support the application of MENA.
The MENA process consists of three main steps: (i) reconstructing the α diversity of specific sites; (ii) mapping species interactions in terms of feeding relationships through an accurate and scrupulous literature review, and (iii) quantifying ecological network structure and properties. Here, we used catch eDNA data collected on board fishing vessels during a trawl survey (Russo et al., 2021), and applied MENA on both catch and eDNA data to reconstruct the local food webs at nine sampling sites within an important Mediterranean fishing area: the Strait of Sicily (SoS). Then, we compared the two types of food webs reconstructions (from catch and eDNA data, respectively) in terms of coherence and agreement with available knowledge. Finally, we explored the effect of fishing effort (bottom trawling) and two environmental gradients, namely distance from the coast and depth strata, on the food web structure. We used highly spatially-resolved fishing pressure data based on Vessel Monitoring Systems (VMS) data (Bastardie et al., 2010; Coll et al., 2010; Russo et al., 2011; Russo et al., 2013; Russo et al., 2016) to quantify the trawling effort (the main fishing activity affecting demersal communities). Concomitantly, species interactions (i.e. feeding relationships or trophic links) were reconstructed using the available information returned by an accurate literature review and from two databases: FishBase (Froese and Pauly, 2022) and SeaLifeBase (Palomares, 2022). α diversity and trophic links were then used to reconstruct the potential food web at each site as a set of nodes where species are connected through trophic interactions (Delmas et al., 2019). The consistency of these local reconstructed food webs was assessed by comparing the trophic level of each species estimated using the MENA with values available in the above-mentioned reference databases. The local food webs were visually explored and then characterised using the following network indicators: (1) Species Richness; (2) Number of links; (3) Direct connectance; and (4) Generality. The local food webs were compared and the response of each network indicator to the environmental gradients and the fishing effort intensity was fitted using Generalised Additive Models (GAM). Findings show that the integration of eDNA metabarcoding and trophic data (from literature) can yield a realistic reconstruction of marine food webs exploited by fisheries, and can rapidly track the effects of key environmental drivers on marine communities subjected to fisheries exploitation.
Samples were collected during the Mediterranean International Trawl Survey (MEDITS) (Bertrand et al., 2002) between July and August 2018 at nine sites (Figure 1; Table 1). We examined an area historically exploited by fisheries: the Strait of Sicily (SoS). The SoS is a biologically important area of the central Mediterranean Sea characterised by high habitat complexity and biodiversity (Di Lorenzo et al., 2018; Russo et al., 2019), which notably suffers from ecological alterations (Agnetta et al., 2019; Lauria et al., 2020).
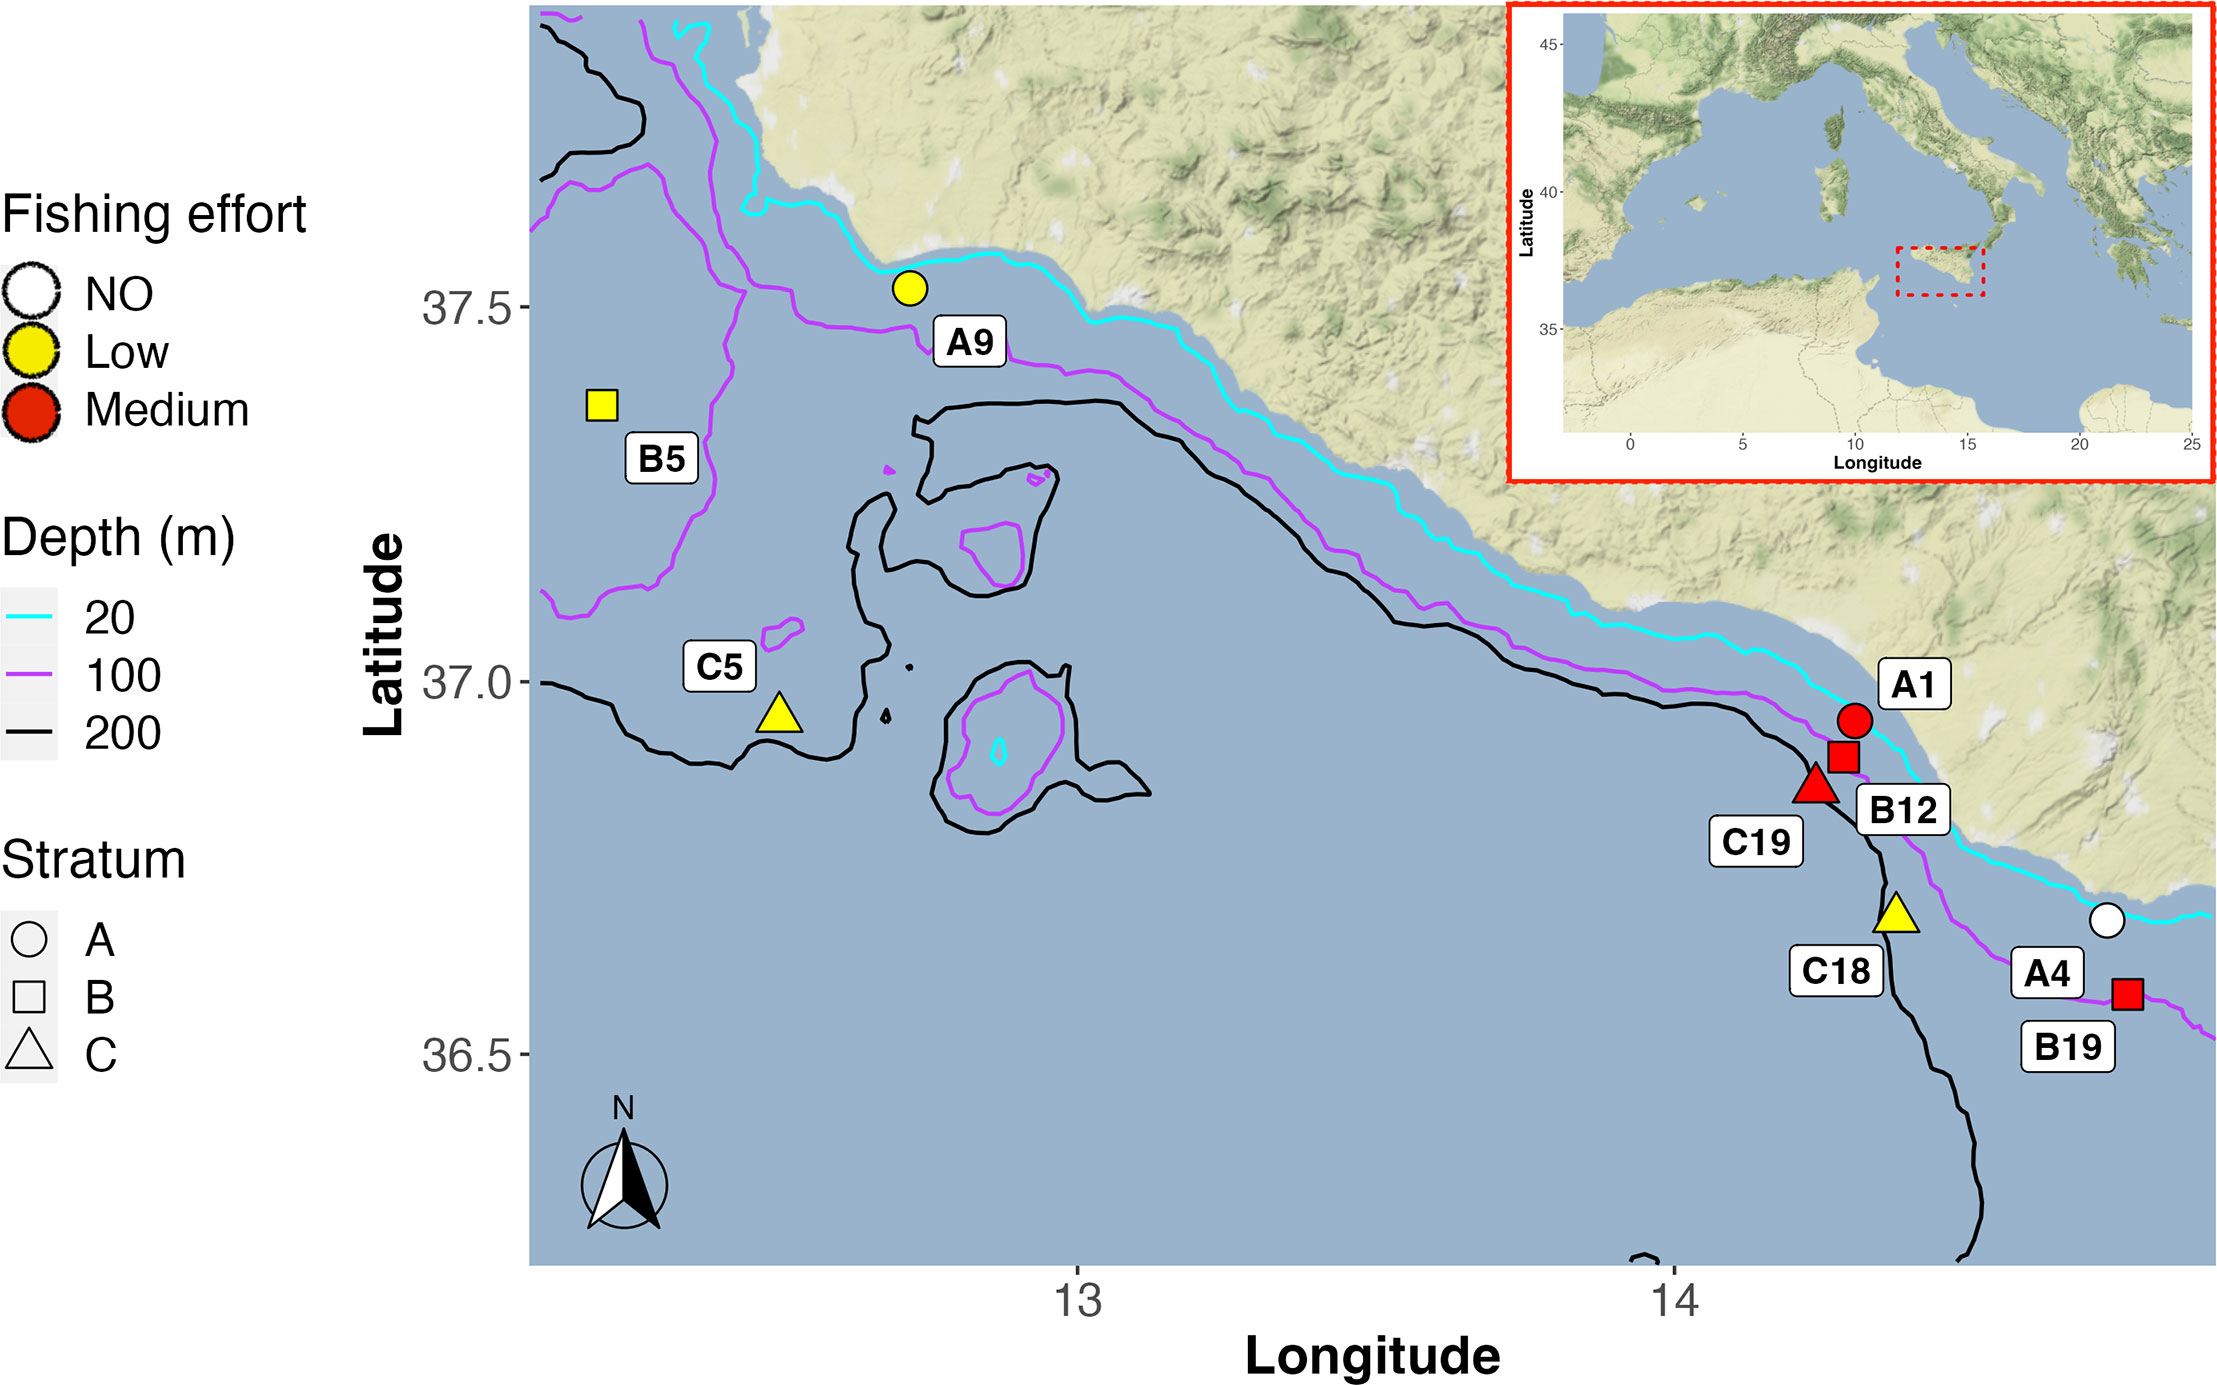
Figure 1 Map showing the location of the nine sampling sites (as part of the MEDITS survey), in the Strait of Sicily (Central Mediterranean Sea). The main isobaths are depicted as a reference to illustrate the topology of the seafloor, while the different levels of fishing effort at the sites are displayed using a colour scale.
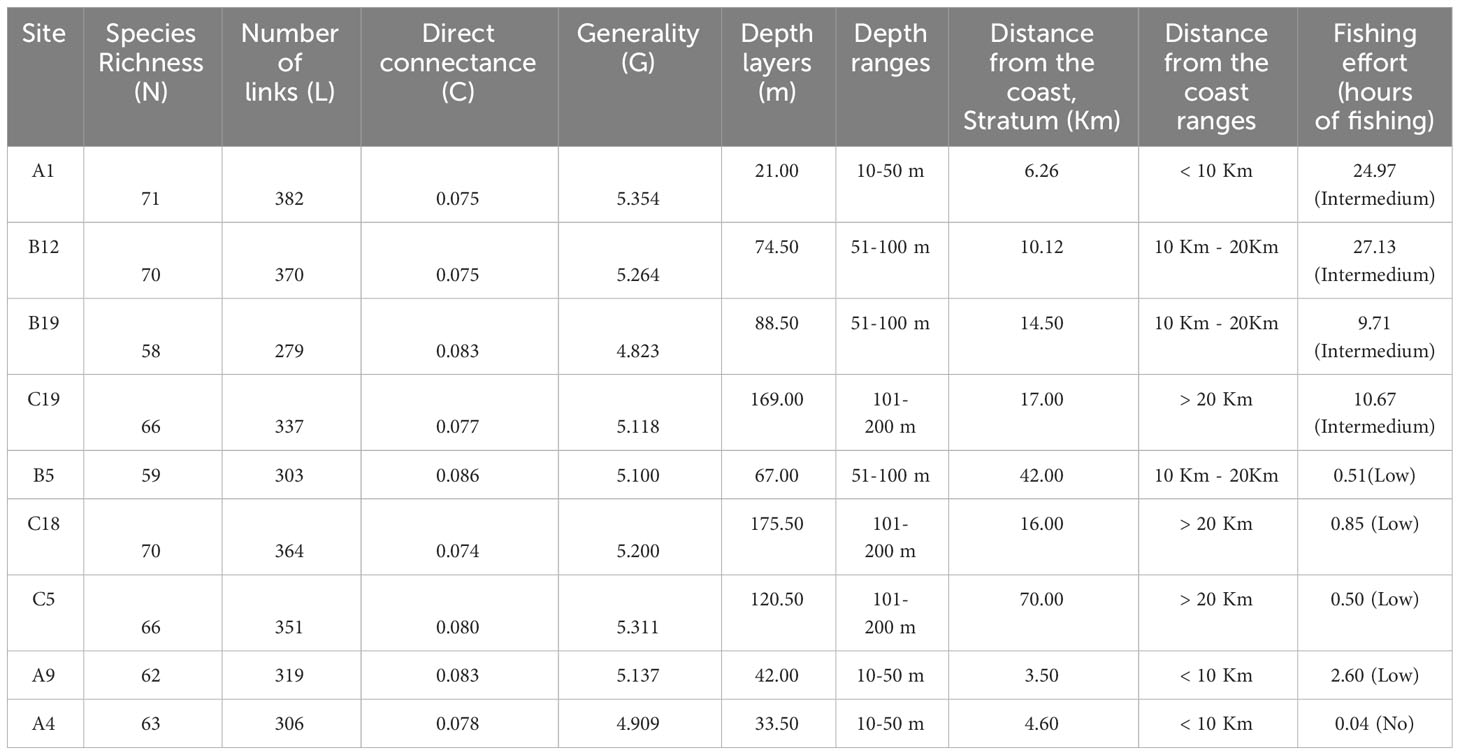
Table 1 Values of sub-webs indicators, abiotic variables and intensity of fishing effort of the nine sampled sites in the area located along the Sicilian coast of SoS.
Sampling sites covered three depth strata (10–50, 51–100, and 101–200 m), three distance ranges from the coast (< 10 Km, 10 Km-20 Km, > 20 Km), and different levels of fishing effort intensity (Russo et al., 2019; De Angelis et al., 2020). According to the EUNIS classification, all sampling sites are classified as having a substratum predominantly consisting of muddy sand. All the details about the sampling and the methodological procedures applied are available in Russo et al. (2021).
Here it is important to recall that, through the amplification of two mitochondrial regions (a ~167 bp fragment of the 12S gene using the Teleo02 primer and a ~313 bp fragment of the COI gene using the universal metazoan Leray-XT primer) (Taberlet et al., 2018; Wangensteen et al., 2018), a list of species was obtained for each of the nine sites considered using the eDNA material in the “slush” (the dense water draining from fishing nets just after the end of hauling operations), together with a corresponding list of species visually identified in the catch.
The list of taxa identified by 12S and COI were merged by sampling site and the Multi Response Permutation Procedure (MRPP) (Berry and Mielke, 1994) implemented in the R package vegan (Oksanen et al., 2018) was then applied to assess whether there was a significant difference between the replicates grouped by sampling sites. MRPP is not constrained to the assumptions of MANOVA (e.g. Normality and Equal Variances for each variable) and allows to compare, through a permutational approach, the inter-sites dissimilarities (i.e. between replicates of different sites) with the intra-site dissimilarities (i.e. between replicates of the same site) in terms of species composition.
To investigate how food-web structure varies across the study area, we collected the available information on the trophic relationships of all the species identified through both eDNA metabarcoding and catch data by conducting an extensive literature review (diet and feeding studies obtained from Fishbase, SeaLifeBase, and Google scholar). Since food webs reflect the trophic functioning of the ecological community, the network position of each species (node) is informative about its trophic role. The node position into the network may be a proxy of functional importance and provide macroscopic descriptors of ecosystems. In this analysis, we considered adult feeding links only and excluded feeding interactions involving juveniles, larvae or eggs. This decision was partially justified by the temporal scale of the sampling, which occurred during summer, some months after the spawning periods of most of the species considered. However, juveniles and larvae are often not considered in this kind of modelling exercise since the scant amount of available information for these stages is likely to impair the food web reconstruction (Frelat et al., 2022). The process of eDNA metabarcoding taxon aggregation assumes that there are nodes in the network that are taxonomically similar enough that we can consider them functionally equivalent. Taxonomic aggregation was performed along the hierarchy genus and species level. In this step, each set of congeneric species was lumped into a single functional group, producing a higher genus-level node for the food webs, following Agnetta et al. (2019) (Supplementary Table 1). These aggregation criteria of species may not always reflect the ecological reality of the group; however, we defined the functional groups by combining the taxonomical similarity and the bathymetric distribution of the sampled demersal species, considering these as the main drivers in the definition of functional groups. Following Agnetta et al. (2019), at the lower trophic level of the local food webs we placed primary consumers: Algae, Phytoplankton, and Seagrasses; together with basic resources including: Benthic detritus, Pelagic and Sediment bacteria, Suspended particulate organic matter (SOM). This information was used to reconstruct the predator-prey relationships among all the taxa identified through the MENA. Then, the R package cheddar (Hudson et al., 2013; Hudson, 2022) was used to generate two models (one based on the catch data and one based on the eDNA metabarcoding data) of the food web and to estimate the trophic level (TLcheddar) of each node (taxon). Then, the consistency and reliability of these estimates TLcheddar were evaluated by comparing them with the trophic level information extracted from a number of widely used and popular databases (TLreference) (see Supplementary Table 2 for details). Values of TLreference were retrieved for each species, attempting to filter the different values contained in the databases so as to select those obtained through studies conducted in the Mediterranean. If more than one value was available for a given species, the mean was calculated. A linear regression analysis was then used to assess the agreement between the TLcheddar predicted from heuristic food webs (from both catch and eDNA data) and the respective values of the TLreference from the reference databases (Compson et al., 2019). A delta was computed as the difference between TLcheddar and TLreference and the distributions of their values were inspected for catch and eDNA data. In addition, this analysis was used to evaluate the two parallel reconstruction of the food webs (from both catch and eDNA data) and identify the most reliable and robust one.
For illustrative purposes, we reconstructed nine local food-webs combining the information from the replicates of each site. Nodes (taxa) at each site were defined as the subset of taxa identified in at least two of the replicates of that site. The R package igraph (Nepusz, 2022) was then used to produce a graphical representation of the local food webs.
A set of four ecological indicators was computed for each replicate, including: (1) Species Richness (N); (2) Number of links (L); (3) Direct connectance (C); (4) Generality (G) (Table 2). These indicators were used to summarise the changes in food web structure (topological characteristics) and network complexity for each local food web. Then, GAM (Hastie and Tibshirani, 1990) were used to fit the relationships between each food web indicator and three predictors: sea bottom depth, distance from the coast, and fishing effort intensity exerted from trawlers. Nonparametric regression approaches such as GAMs enable the modeling of variable connections without requiring the underlying regression function to take on a certain form. The use of smooth functions as regressors gives GAMs greater flexibility over parametric (including linear) types of models. GAMs were computed using the R package mgcv (Wood, 2022). The model’s goodness of fit was assessed using the coefficient of determination (adjusted R2) and the amount of deviance explained. Residuals for each model were graphically inspected to detect any departures from the model assumptions or other possible anomalies in the data. All statistical analyses were conducted in the programming environment R ver, 1.4.1103 (www.rproject.org). According to the results (section below) of the comparison between estimated (TLcheddar) and reference (TLreference) trophic levels, which was used to compare reconstructions obtained from capture data and those obtained from eDNA data (see the subsection above), the procedure described in this subsection was applied only on the eDNA-based food webs.
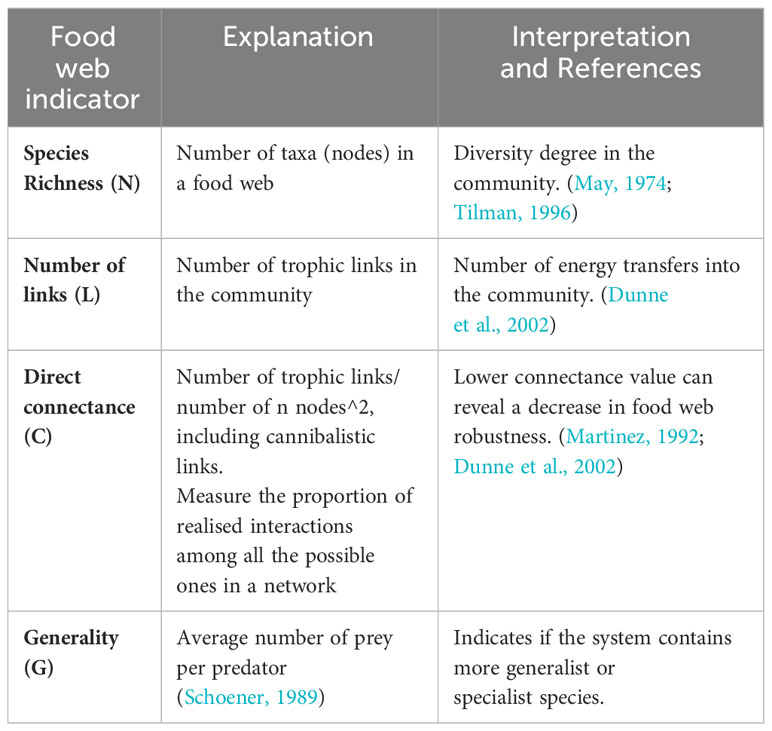
Table 2 Full names and codes of the food web indicators used in this study, with their explanation and their ecological meanings (interpretation).
The detailed information returned by the literature review and from the two databases FishBase (Froese and Pauly, 2022) and SeaLifeBase (Palomares, 2022) about species interactions (i.e. feeding relationships or trophic links) are available in Supplementary Table 3 (Supplementary Materials).
Overall, the comparison between the set of TLcheddar estimated using cheddar (and thus based on eDNA metabarcoding) and TLreference extracted from popular databases (Figure 2) showed a significant agreement for both the reconstructions, although the values estimated in the model based on eDNA metabarcoding data were much closer to the values known from the literature (Figure 2-A1) than the values obtained for the catch-based data (Figure 2-A2). However, for some species (labelled points in Figure 2-A1), the estimated TL was slightly different from the reference values.
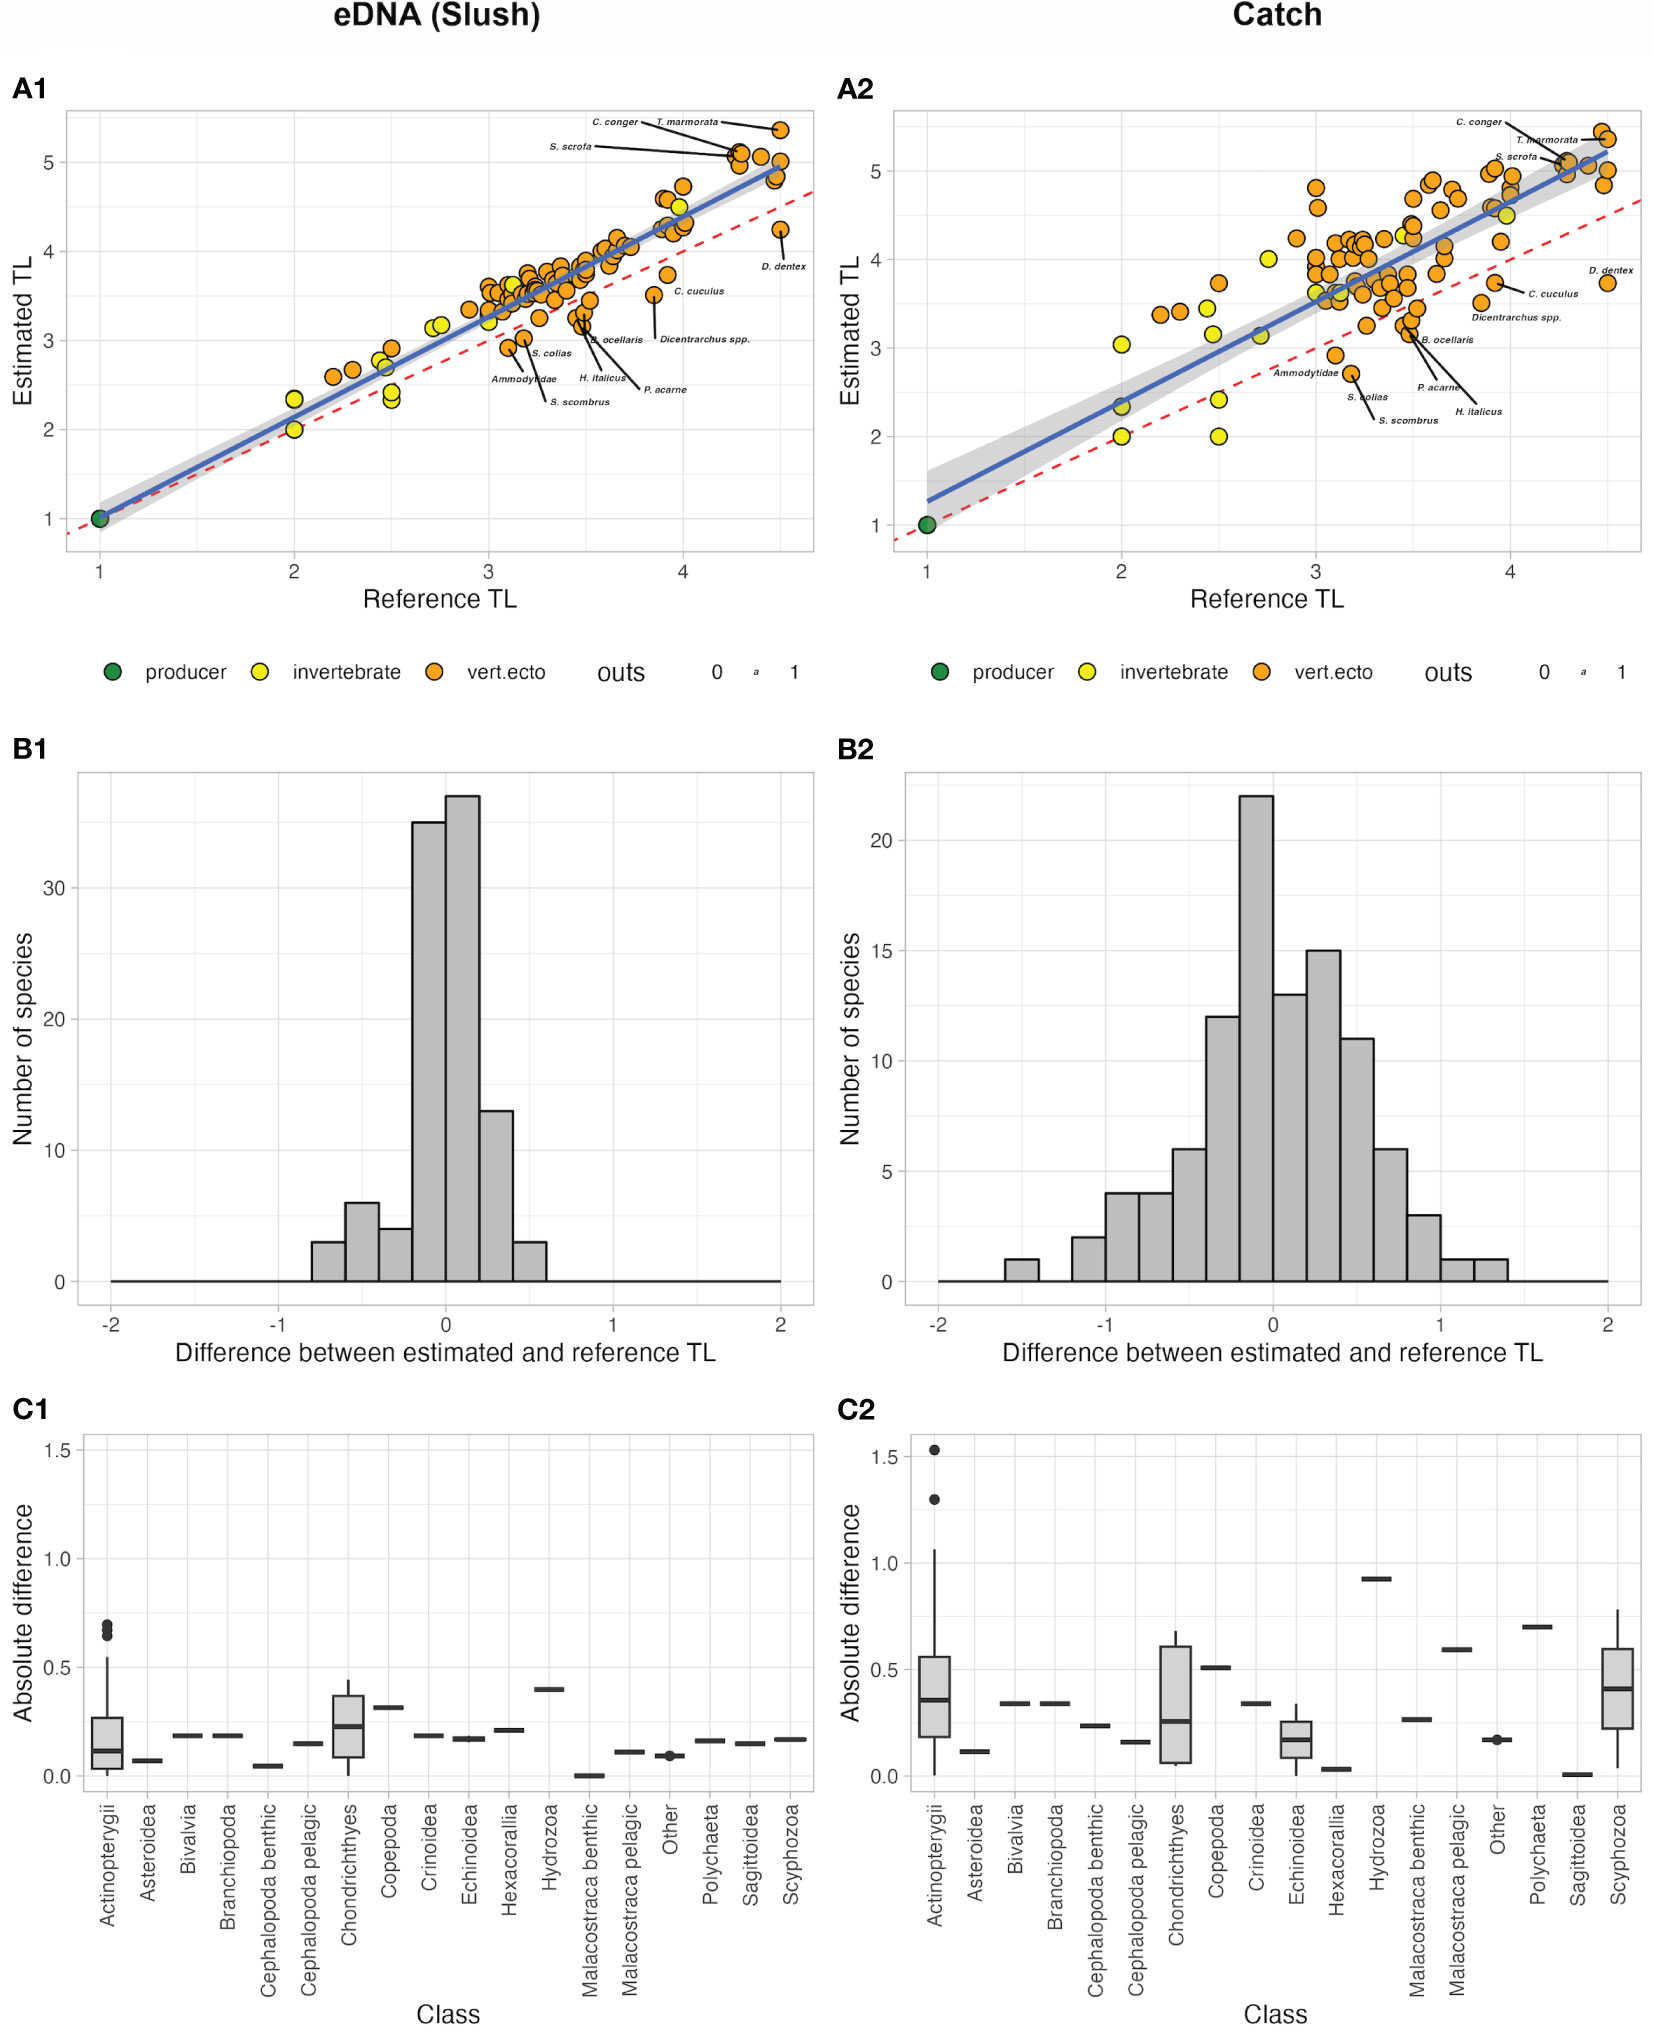
Figure 2 (A1–A2) Comparison between TL values obtained through the application of cheddar package functions (metaweb approach) and TL values extracted from popular databases (Fishbase, Sealifebase) and scientific literature for both approach (eDNA metabarcoding in A1 and catch data in A2). The species for which the difference between metaweb value and reference value is larger than 0.4 (in absolute value) are indicated and labelled. Yellow and orange dots in the upper panel represent invertebrates and fishes, respectively. Nodes deviating the most from the regression line are labelled; (B1–B2) Distributions (as histograms) of the differences between estimated and reference TL for the species for both approach (eDNA metabarcoding in B1 and catch data in B2); (C1–C2) Boxplots of the absolute delta between estimated and reference TL by class for both approaches (eDNA metabarcoding in C1 and catch data in C2).
The distribution of the differences (delta) between estimated and reference TL, when inspected by class, showed that Chondrichthyes and Actinopterygii were the groups with the greatest variances in the eDNA-based model, while for some other classes (e.g benthic malacostraca and benthic cephalopoda) the variability was much lower (Figures 2-B1, C1). The corresponding distribution of the difference between baseline and estimated TL values for the model based on the capture data was much more platykurtic (Figure 2-B2). The distribution of the delta by class (Figure 2-C2) showed that Chondrichthyes and Actinopterygii (as for the eDNA), but also Echinoidea and Scyphozoa, were the groups characterised by the more variables.
Overall, these results indicate that the eDNA-based MENAs perform better than the corresponding catch-based ones, placing the taxa in trophic positions consistent with previous knowledge. Accordingly, and for the sake of conciseness, the following results are focused on the analysis of the eDNA-based MENA.
Environmental DNA Metabarcoding allowed for the identification of 101 taxa, of which 7 taxa of basal resources, 82 at species level, nine at genus level, one at family level, one at superorder level and one at subclass level (Table 3). The N values ranged from 59 to 71, while the L values ranged from 306 to 382, spanning over 4 TL. Apical species (TL ~ 4.5) included the silver scabbardfish Lepidopus caudatus, the European hake Merluccius merluccius, the common dentex Dentex dentex, the marbled electric ray Torpedo marmorata, and the John Dory Zeus faber. Species with slightly lower TL were the red scorpionfish Scorpaena scrofa, the European conger Conger conger, the whiting Merlangius merlangus, the bluntnose spiny dogfish Squalus megalops, and the European angler Lophius piscatorius. Other predators with TL = 4 were the common smooth-hound Mustelus mustelus, the Blainville’s dogfish Squalus blainville, the stargazer Uranoscopus scaber, and the blue whiting Micromesistius poutassou (Table 3).
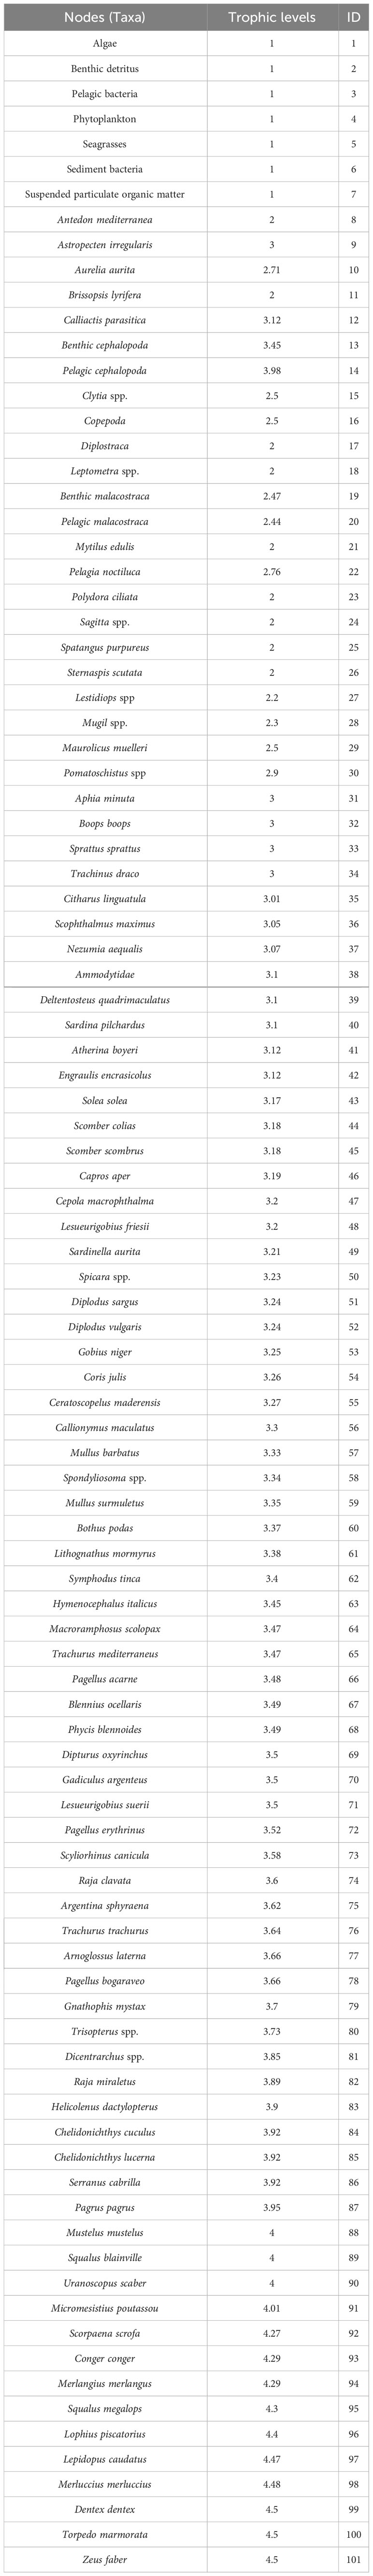
Table 3 List of nodes (taxa), and TL retrieved from Fishbase and Sealifebase with associated the ID codes of every single taxa.
The MRPP established that the differences (in terms of species co-occurrence) between samples belonging to the same site (mean value of the Jaccard distance between replicates: 0.451) were significantly less than those between samples belonging to different sites (mean value of the Jaccard distance between sites: 0.743), supporting statistical consistency among replicates at each sampling site. Network analysis revealed considerable variability in food webs without clear patterns. The Local food-web structure varied across space in relation to the intensity of fishing effort and the considered abiotic variables (distance from the coast, depth layers) (Figure 3; Table 1). The most complex food webs, in terms of N, L and G were represented by the food webs A1, B12 and C5, characterised by intermediate and low intensities of fishing effort, respectively. In terms of ecological complexity represented by C; the direct connectance varied inversely with N and L (see the three categories of fishing effort intensity Intermedium, low and no fishing effort in Table 1). Apical predators present in all the local food-webs included D. dentex (ID = 99) an active and solitary predator, as well as C. conger (ID = 93), M. poutassou (ID = 91), and M. merluccius (ID = 98) except for the local food web B5. As it may be expected, the most striking differences occurred at the top of the webs. Local food webs with fewer top predators corresponded to intermediate depths and distances (Local food webs B5 and B19, Table 1; Figure 3), while the level of fishing effort did not seem to have a noticeable effect on this aspect. However, there were no immediate visual differences among the local food webs at different locations. The food webs indicators of N, L and C varied substantially between sites, with the widest range of values occurring at intermediate values of depth (50-100m) and distance from the coast (10-20 km) (N = 58 at site B19, N = 71 at site A1; L = 279 at site B19 and L = 371 at site A1). C ranged between 0.074 (minimum value at site C18 and 0.086 (maximum value) at site B5. G ranges between 4.823 (minimum value) at site B19 to 5.354 (maximum value) at site A1 (Table 3). The generated GAMs appeared, in almost all the cases, well-trained (with Deviance explained > 67% and adjusted R2 > 0.60) (Figure 4; Table 4). In general, both the environmental gradients and the fishing effort had significant effects on all the indicators. N was significantly correlated with all three predictors and showed increasing trends with respect to depth, distance to the coast and fishing effort intensity. The pattern for L was similar. C showed opposite trends when compared to N and L, as it decreased below 100 m depth, showing maximum values at intermediate fishing effort and Distance from the coast. G had a minimum around 100 m depth, being monotonically and directly related to Distance from the coast and fishing effort.
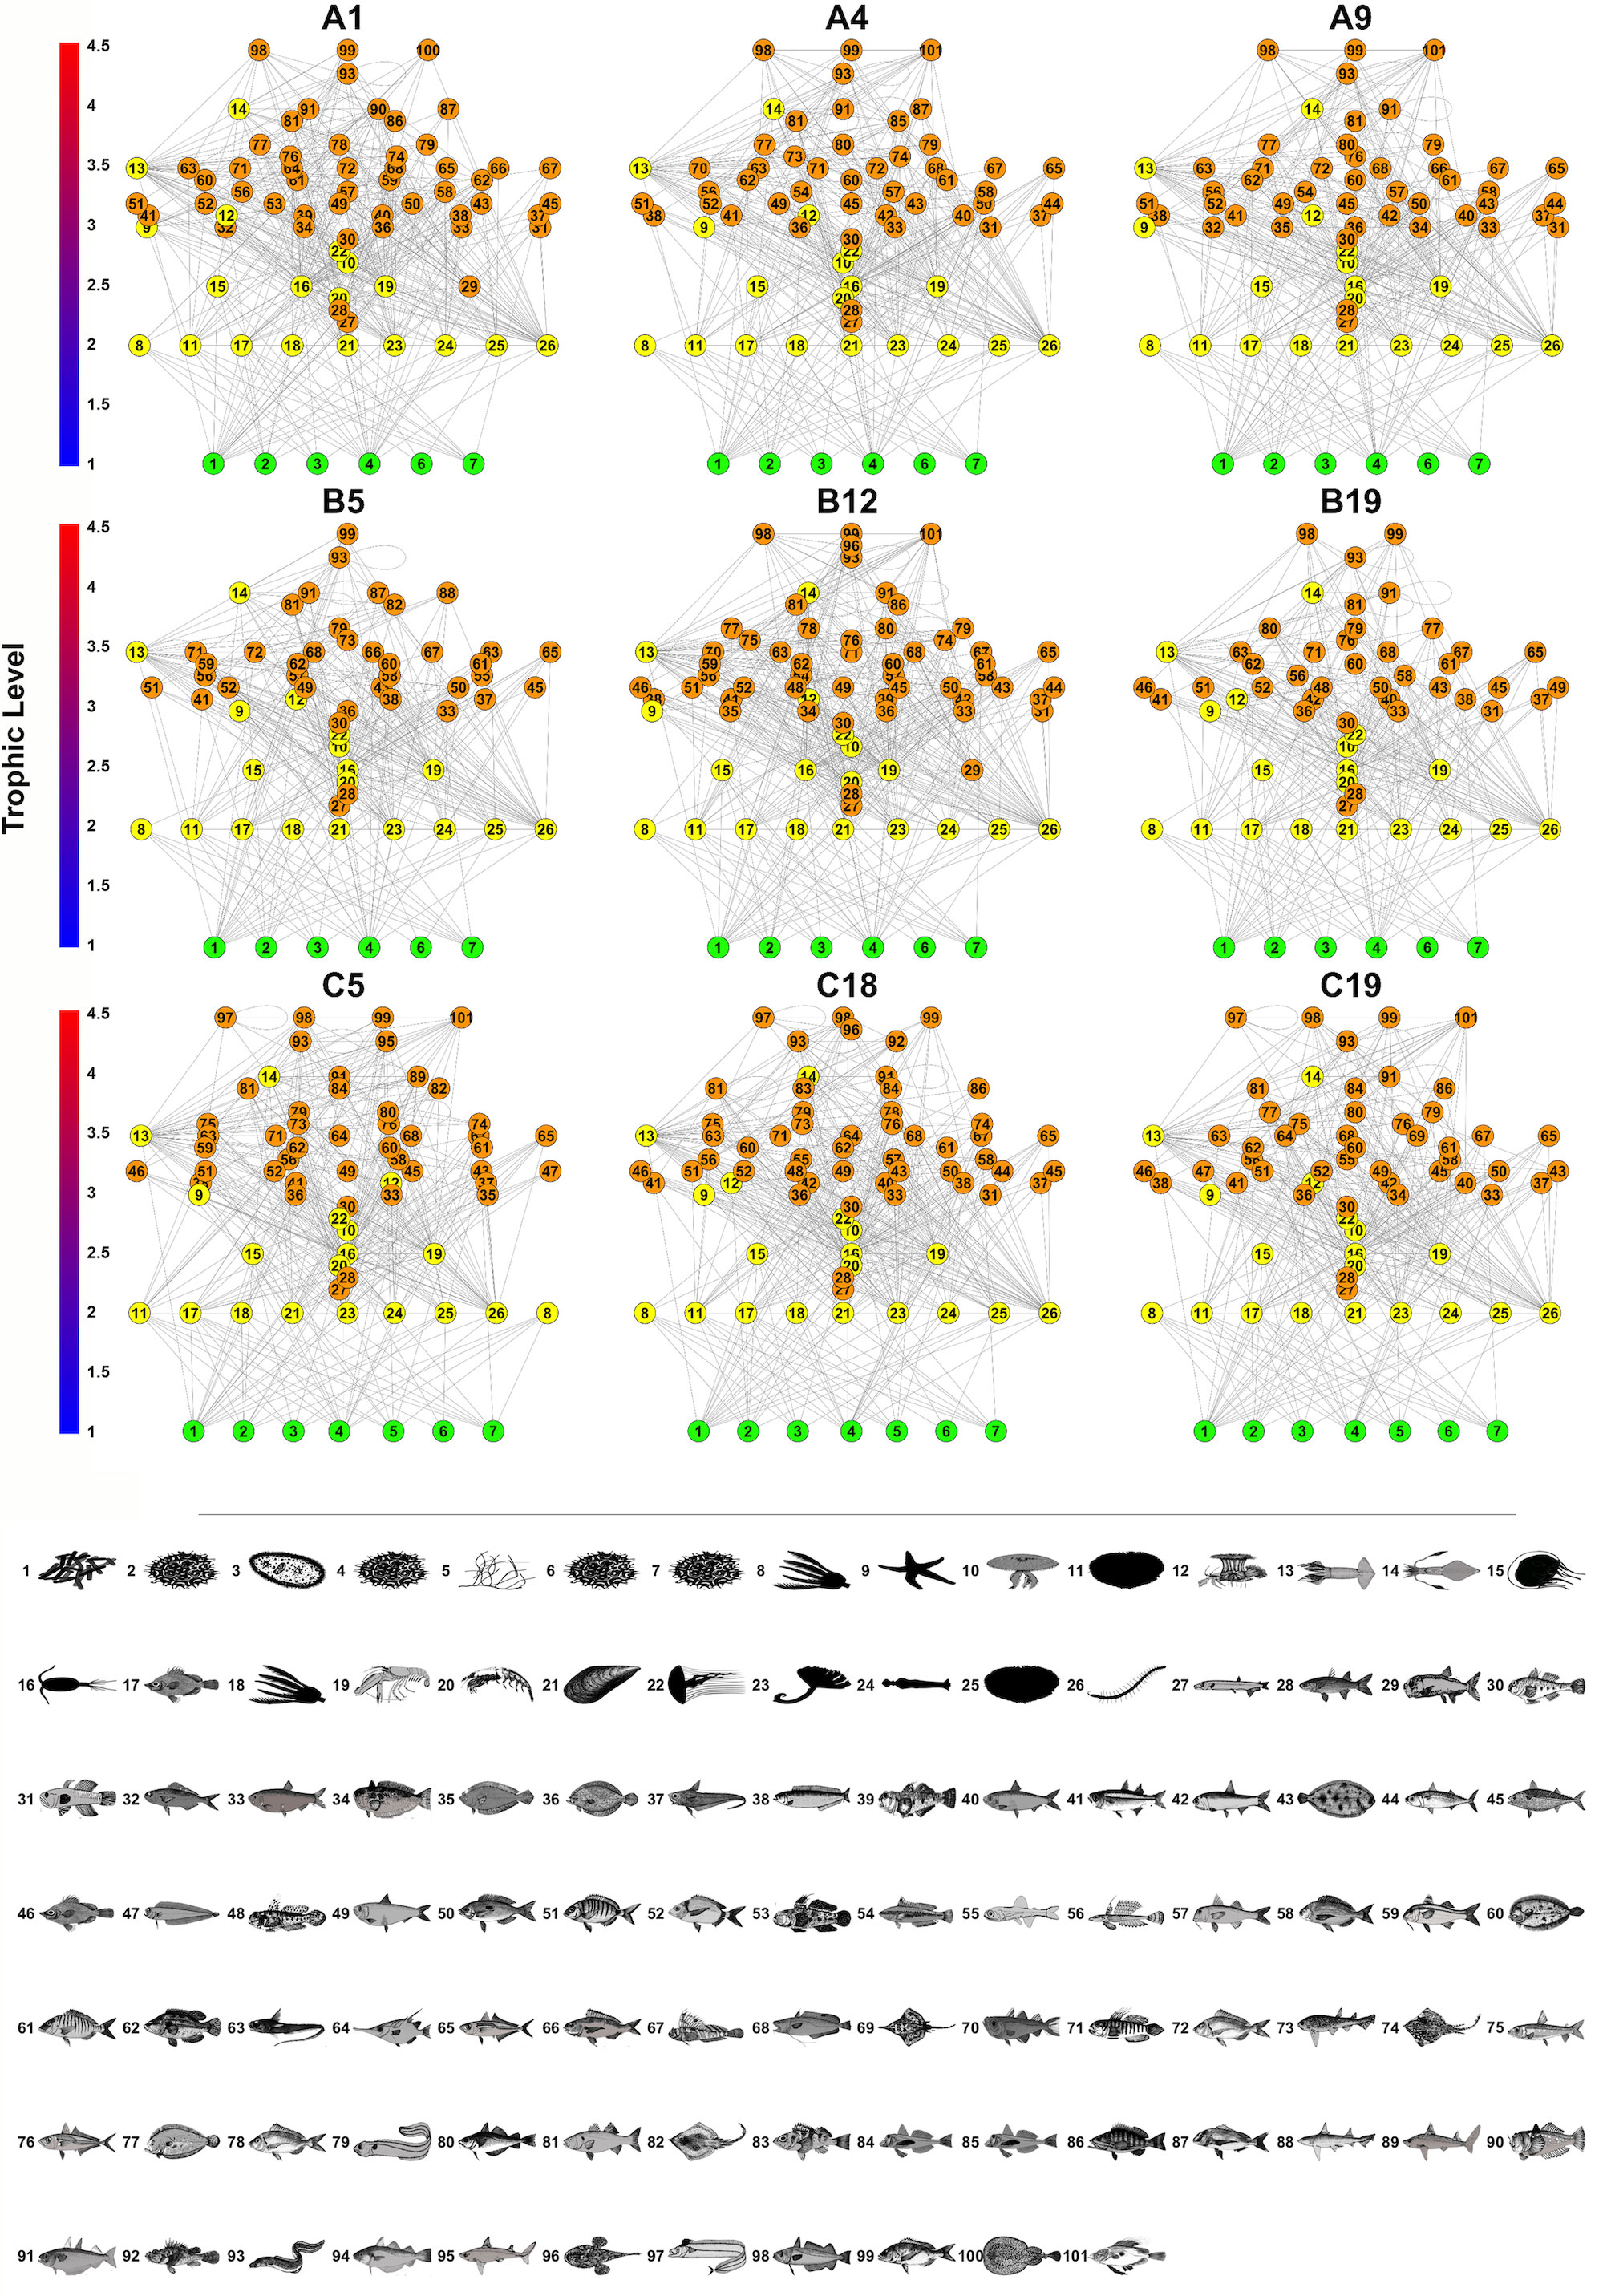
Figure 3 Local food web representations of the nine sites. Each taxon (node) is identified as a numbered circle (and are associated to a silhouette (bottom panel). The edges connecting the nodes stand for trophic interactions. Basal nodes are in green and represented at the lower trophic levels of the food webs and are connected to higher TL by trophic links. Invertebrate and vertebrate are represented respectively in yellow and orange. The y axis indicates the TL of the species. 1 Algae; 2 Benthic detritus; 3 Pelagic bacteria; 4 Phytoplankton; 5Seagrasses; 6 Sediment bacteria; 7 Suspended particulate organic matter; 8 Antedon mediterranea; 9 Astropecten irregularis; 10 Aurelia aurita; 11 Brissopsis lyrifera; 12 Calliactis parasitica; 13 Benthic cephalopoda; 14 Pelagic cephalopoda; 15 Clytia spp.; 16 Copepoda; 17 Diplostraca; 18 Leptometra spp.; 19 Benthic malacostraca; 20 Pelagic malacostraca; 21 Mytilus edulis; 22 Pelagia noctiluca; 23 Polydora ciliata; 24 Sagitta spp.; 25 Spatangus purpureus; 26 Sternaspis scutata; 27 Lestidiops spp.; 28 Mugil spp.; 29 Maurolicus muelleri; 30 Pomatoschistus spp.; 31 Aphia minuta; 32 Boops boops; 33 Sprattus sprattus; 34 Trachinus draco; 35 Citharus linguatula, 36 Scophthalmus maximus; 37 Nezumia aequalis; 38 Ammodytidae; 39 Deltentosteus quadrimaculatus; 40 Sardina pilchardus; 41 Atherina boyeri; 42 Engraulis encrasicolus; 43 Solea solea; 44 Scomber colias; 45 Scomber scombrus; 46 Capros aper; 47 Cepola macrophthalma; 48 Lesueurigobius friesii; 49 Sardinella aurita; 50 Spicara spp.; 51 Diplodus sargus; 52 Diplodus vulgaris; 53 Gobius niger; 54 Coris julis; 55 Ceratoscopelus maderensis; 56 Callionymus maculatus; 57 Mullus barbatus; 58 Spondyliosoma spp.; 59 Mullus surmuletus; 60 Bothus podas; 61 Lithognathus mormyrus; 62 Symphodus tinca; 63 Hymenocephalus italicus; 64 Macroramphosus scolopax; 65 Trachurus mediterraneus; 66 Pagellus acarne; 67 Blennius ocellaris; 68 Phycis blennoides; 69 Dipturus oxyrinchus; 70 Gadiculus argenteus; 71 Lesueurigobius suerii; 72 Pagellus erythrinus; 73 Scyliorhinus canicula; 74 Raja clavata; 75 Argentina sphyraena; 76 Trachurus trachurus; 77 Arnoglossus laterna; 78 Pagellus bogaraveo; 79 Gnathophis mystax; 80 Trisopterus spp.; 81 Dicentrarchus spp.; 82 Raja miraletus; 83 Helicolenus dactylopterus; 84 Chelidonichthys cuculus; 85 Chelidonichthys lucerna; 86 Serranus cabrilla; 87 Pagrus pagrus; 88 Mustelus mustelus; 89 Squalus Blainville; 90 Uranoscopus scaber; 91 Micromesistius poutassou; 92 Scorpaena scrofa; 93 Conger conger; 94 Merlangius merlangus; 95 Squalus megalops; 96 Lophius piscatorius; 97 Lepidopus caudatus; 98 Merluccius merluccius; 99 Dentex dentex; 100 Torpedo marmorata; 101 Zeus faber. The silhouettes were downloaded and edited from Froese, R. and D. Pauly. Editors. 2023.FishBase. World Wide Web electronic publication. www.fishbase.org.
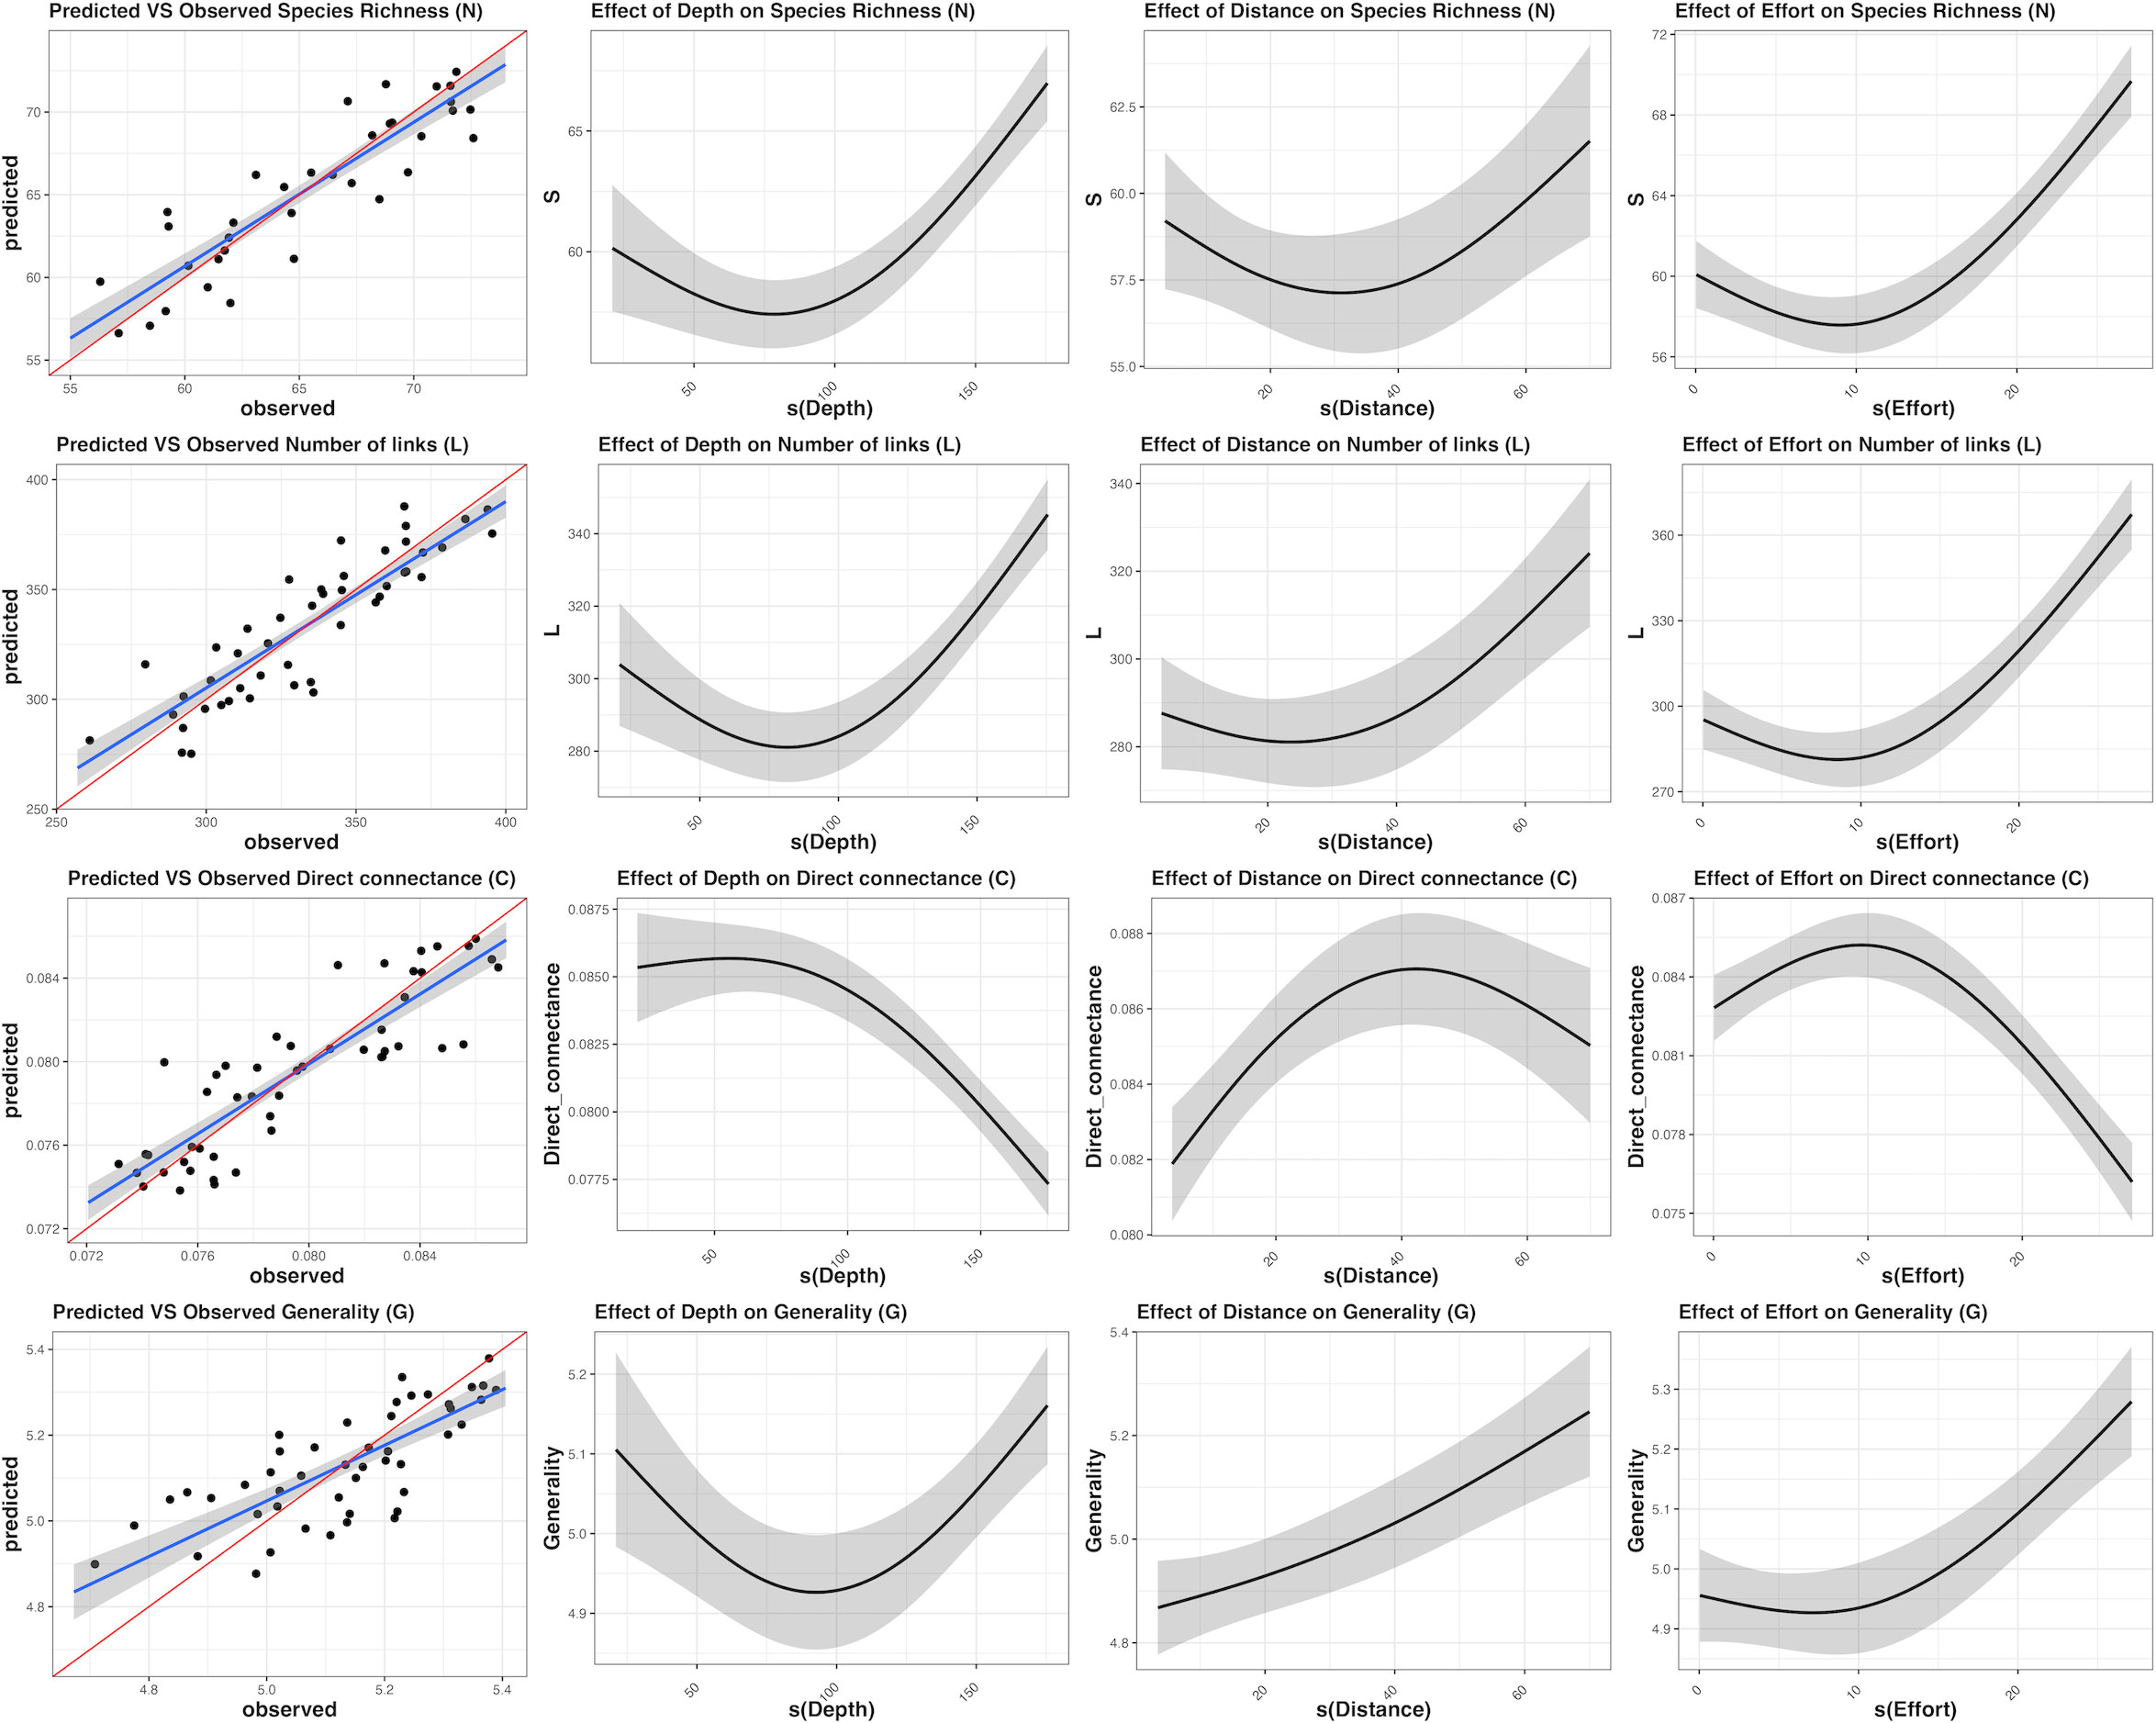
Figure 4 Summary of results of the best-fit Generalised Additive Model (GAM) used to evaluate whether different factors including depth, distance from the coast and fishing effort explain variations in the food web indicators.
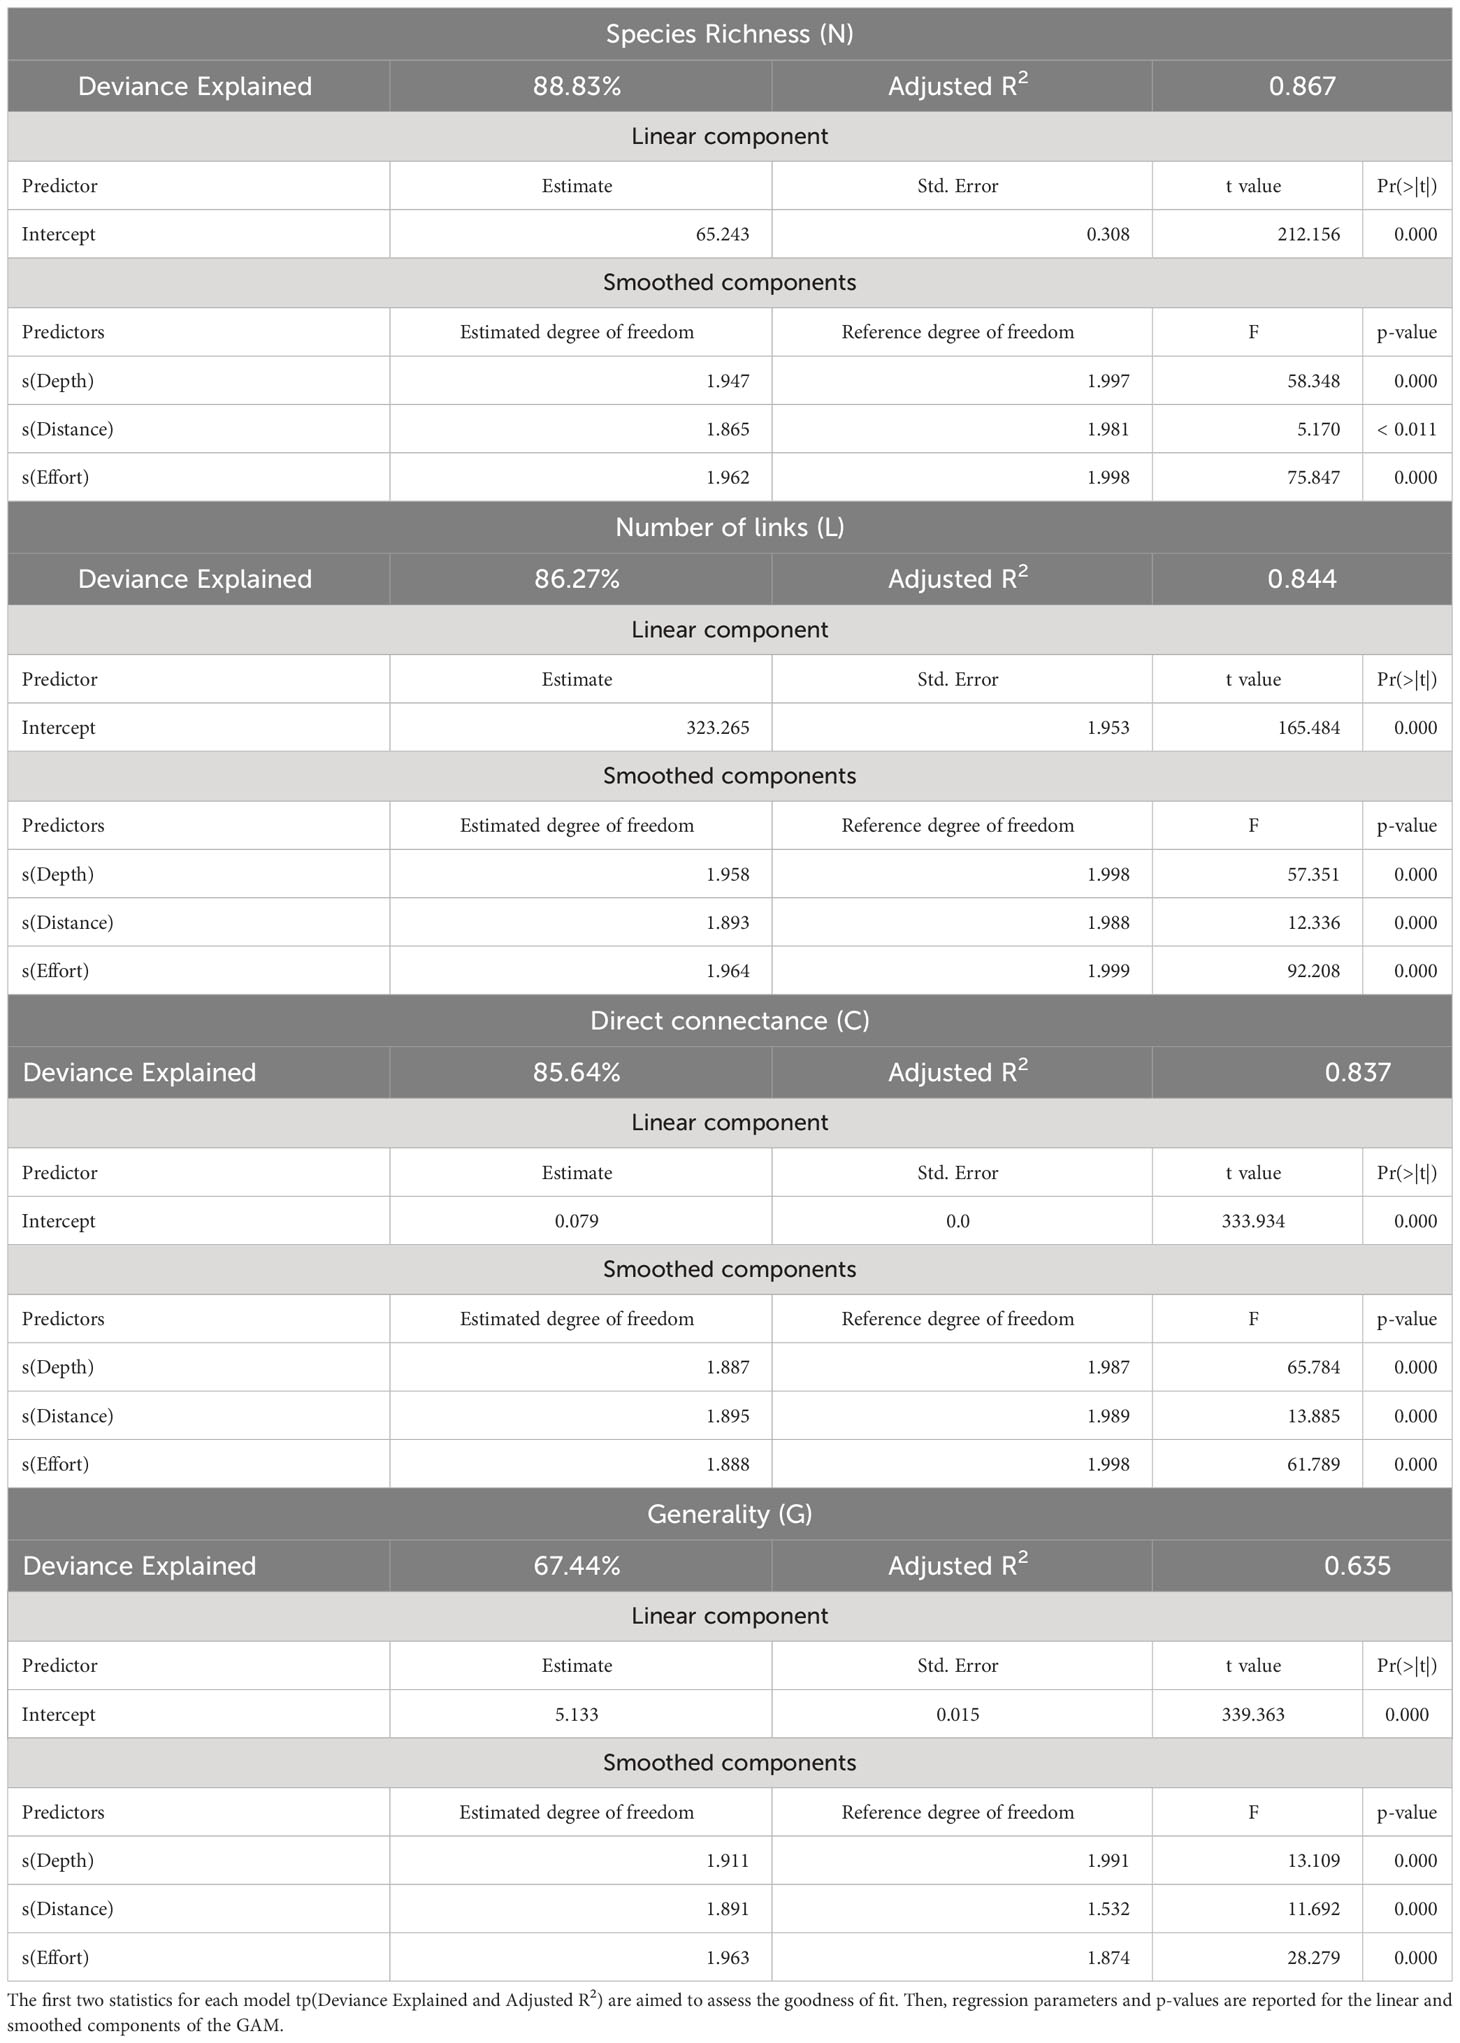
Table 4 Values of the different sets of parameters estimated by the GAM applied on each ecological indicator and using, as predictive variables Depth (m), Distance from the Coast (Km) and Fishing effort (total yearly hours of bottom trawling).
The findings presented by Russo et al. (2021) indicated that the slush (water draining directly from trawling gear) is an effective source of DNA. The results presented in this paper further suggest that integrating eDNA metabarcoding with available information on the trophic habits of marine species allows for the reconstruction of local (site-specific) food webs and the investigation of their ecological properties in relation to some key environmental drivers and fishing pressure. These results are important as they extend the role of eDNA metabarcoding as a tool for characterising the structure of marine communities (DiBattista et al., 2020), raising the prospect that this approach can complement the often time/space limited survey methods for monitoring marine communities under fishing exploitation. With the judicious melding of DNA-based biodiversity inventory with literature information, Food Web Analysis can be more widely employed to monitor spatial and temporal changes occurring at the ecosystem level in response to multiple environmental gradients and anthropogenic pressures (McCann, 2007; Dunne, 2009; Compson et al., 2019; DiBattista et al., 2020). In addition, our proposed method provides the basis for calculating a set of ecological indicators to monitor and assess the status of communities.
The reconstructed local food webs of the nine sites portrayed complex systems with a total of 101 taxa associated with more than 4 trophic levels (Figure 3). It included several top predators such as C. conger, M. merlangus, S. megalops, L. piscatorius, L. caudatus, M. merluccius, D. dentex, T. marmorata and Z. faber, typical of the marine ecosystem of the South-central Mediterranean. Estimated TL was used to calibrate, parameterize, and validate food-web models and to calculate metrics and indicators of community structure (Belgrano, 2004). Trophic levels obtained from databases (Fishbase and Sealifebase) and the literature strongly correlated with those inferred from eDNA data using the analysis and visualisation of ecological communities (Yodzis and Innes, 1992) integrated into the cheddar package (Figures 2-A1, A2). This indicates the robustness and accuracy of our approach for reconstructing food webs. Similarly, Agnetta et al. (2019) estimated the maximum trophic level of the SoS food webs at 4.5, which was reached by bluefin tuna Thunnus thynnus, with similar values for mesopelagic species, sharks, rays and demersal predators such as M. merluccius also placed in the upper trophic level (Figure 3; Table 3). Furthermore, the trophic level values obtained from our approach strongly align with the study of Karachle and Stergiou (2017), which updated a previous compilation of the feeding habits and trophic level collected from 178 papers, regarding 204 Mediterranean fishes and invertebrates species, with values ranging from 2 to 4.50. Although further work is needed across a variety of different marine ecosystems under different levels of exploitation, our approach of comparing local food webs and trophic level appears promising for the characterisation of small-scale ecosystem responses to the interplay of environmental and exploitation drivers. The local food webs exhibited an association between increasing fishing effort intensity and changes in topological structures (Figure 3; Table 1), highlighting the impacts of fishing effort on food web structures. The indicators of species richness, number of trophic links, direct connectance and generality are considered the most sensitive and reliable parameters to study spatial variations in food web structures (Martinez, 1992; Vermaat et al., 2009; Riede et al., 2010; Baiser et al., 2012). In our study, they were used as response variables in GAM models with fishing effort and abiotic variables serving as predictors. Results showed that species richness and number of trophic links seem to be the primary aspects of spatial variation in food web complexity in the SoS (Figure 4; Table 4). Sites A1 and B12 (characterised by intermediate fishing effort intensity) showed higher values of both species’ richness and number of trophic links than sites with low/no fishing effort intensity (Table 1). These findings revealed more complex and denser local food webs with highly connected species (higher number of trophic links) due to a high degree of generality (more pronounced trophic generalisms). Based on established theory (MacArthur, 1955; May, 1974), our results indicate that relatively high values of species richness and number of trophic links support high trophic complexity, which is considered fundamental in food webs stability (Pimm, 1980). Also, in line with classic ecological theory and with other studies (Cohen et al., 1985; Winemiller, 1989; Cohen et al., 1990; Olesen and Jordano, 2002; Dunne, 2006; Rossi et al., 2015), direct connectance, a proxy of ecological complexity, is inversely correlated which species richness (Figure 4; Table 1), and this indicates that, when the species richness is higher, species are exploiting a growing fraction of the total ‘prey’ available (Warren, 1990). Moreover, the higher number of species detected in sites where fishing effort intensity is intermediate (Table 1; Figure 3) can be explained by the dominant presence of mobile generalist fishes and invertebrates, which further mirror the higher values of trophic generalism with respect to the other fishing sites.
Previous studies have shown that the negative effects of fishing effort are not necessarily generalised at food web scale (Pauly et al., 1998; Kuparinen et al., 2016). The effect of fishing effort on the structure of local food webs and related indicators has been examined, using as reference the results published by Russo et al. (2019), which carried out an in-depth assessment of trawling areas in the Italian seas (including the whole SoS in the central Mediterranean). The values of fishing effort for the nine sampling sites of this study should thus be interpreted with reference to the values detected in the SoS (Russo et al., 2019). Accordingly, the values of the fishing effort for the nine sampling sites ranged from absent to intermediate, whereas none of the sampling sites considered in this study is characterised by truly high levels of fishing effort. Future works should overcome these limitations and investigate food webs and related indicators in highly-exploited locations. Hence, local food webs indicators we assessed showed significant spatial variations (Table 1) and, in this sense, our analysis could be viewed as a quantitative exploration of how trophic re-organisation of the food webs could contribute to the understanding of marine exploited ecosystems. A major result of this study is that eDNA-based reconstructions of food web’s structure (i.e. species co-occurrence) were consistent over the nine sampling sites. However, the local food webs of different sites differed according to depth, distance from the coast and fishing effort intensity. The role of depth and distance from the coast (which are strongly related descriptors) was not surprising given that we are dealing with food webs of demersal communities. The effect of fishing effort intensity was less obvious and should be interpreted cautiously referring to the available literature. Indeed, fishing is expected to have adverse impacts on marine ecosystems (Pauly et al., 1998; Kuparinen et al., 2016), especially on food web structure and total biomass (Hinz et al., 2017). Specifically, fished areas are characterised by simplified food webs structures (Coll et al., 2008; Good et al., 2022). Lauria et al. (2020) using time series (1994–2016) of MEDITS trawl survey in the SoS, identified four main assemblages sustaining demersal fisheries: coastal (10-70m), outer shelf (70-250m), upper slope (250-450m) and medium slope (400-800m). These assemblages were stable throughout time and showed a clear spatial distribution, different species composition and biodiversity values driven by depth and, to a lesser extent, surface salinity. Our eDNA-based list of species is highly comparable with species found in two (coastal and outer shelfs) of the four assemblages described by Lauria et al. (2020). Moreover, conforming to these authors’ results, we observed that higher values of species richness can be detected in the coastal assemblage, despite being characterised by a relatively high fishing effort intensity. This apparent contradiction could be driven by the fact that the effect of fishing effort is masked by that of other features such as oceanographic features (fronts, upwellings and gyres) and habitat complexity of the coastal area of the SoS (Garofalo et al., 2007). In general, different studies have shown that increased perturbations tend to decrease diversity, and this has been observed in many demersal communities exposed to intense fishing effort (Rijnsdorp, 1996; Jennings and Kaiser, 1998; Gristina et al., 2006). Indeed, the action of bottom trawling is strongly related to the reduction or functional removal and/or loss of fishes and benthic invertebrates from the community, altering the ecological interactions such as predator-prey relationships (Hinz et al., 2017), competition strengths of ecosystems, and bentho-pelagic coupling (Agnetta et al., 2019). In contrast, other authors found that the relationships between human impact (quantified as cumulative removals) and species richness are complex, non-linear and ocean-basin specific (Trebilco et al., 2011). In particular, these authors documented that a higher fishing effort intensity is associated with higher species richness in the Indian and Pacific Oceans, and this overlap is particularly prominent in the central Pacific, and in the Indian Ocean around Sri Lanka (Trebilco et al., 2011). Through this study, we have provided the first indication of a significant positive relationship between rising fishing effort intensity and increasing species richness and number of trophic links in the Mediterranean Sea. If we consider that fishing effort levels corresponding to the sites of this study range from zero (no fishing effort) to intermediate, it is possible to explain the positive relationship between effort level and α diversity by referring to the Intermediate disturbance hypothesis (IDH - Dial and Roughgarden, 1998). Although it will be necessary to supplement and expand the observations of the present study to a wider range of environmental variables and fishing effort, it is certainly possible that the complex system of factors, including fishing effort, that determines α diversity in the SoS at the local level, allows for some level of biodiversity to be maintained even in areas moderately exploited by trawling.
Unfortunately, food web analysis requires a great deal of information, first and foremost the species composition of the communities analysed. Environmental DNA has largely been used for gathering indirect evidence about the presence of a broad spectrum of species, from single-celled organisms to whales (Jeunen et al., 2019). However, food webs reconstruction requires considerable knowledge about community organisms and their feeding habits. Leaving aside some largely acknowledged public databases such as FishBase and SeaLifeBase, accessing this knowledge from journals and reports is painstaking and time-consuming, and generating new knowledge incrementally using traditional sampling and observation is impractical for scaling up. Environmental DNA metabarcoding can boost biodiversity data acquisition to unprecedented levels revealing community compositions at high resolution, by making such efforts less reliant on increasingly scarce taxonomic expertise. Nevertheless, eDNA metabarcoding is not without drawbacks in the perspective of the ecological networks reconstruction. In accordance with basic ecological theories and concepts, including Adaptive Trophic Behaviour (ATB, Valdovinos et al., 2010) and Niche Theory, which can be associated with the concepts of ‘adaptive’ foraging (Kondoh, 2003) and foraging ‘optimisation’ (Pyke et al., 1977), consumers change their food sources over space and time, and thus their linkages in the food web, in response to resource availability, competition and presence of predators. In accordance with theories, it has been demonstrated that consumers will select a subset of prey among those available and an omnivore can feed at different trophic levels depending on prey abundance/productivity/season. The approach described in this paper is not able to capture these kinds of changes in food web structures and, more in general, eDNA metabarcoding should be groud-truthed with empirical studies about the actual feeding choices of the different species (Riccioni et al., 2018). However, we argue that: 1) the aggregation of taxa applied in this study can significantly reduce the distortion determined by the local and temporal ATB, since a given predator could “ignore” a given prey in some conditions, but it is unlikely that would ignore a full set of prey (e.g. copepods, malacostraca or cephalopods); 2) more important, none of the ecological indicators considered in this study is affected by the weights of the trophic links. Another potential issue is represented by the fact that the trophic position of omnivorous species depends on the relative importance of resources on different trophic levels in their diet but information on the strength of trophic linkages in specific locations at specific times cannot be obtained from the literature. To address this, we assumed that omnivorous predators consume prey from different trophic levels in the same proportions. Our study found that the values of TL estimated through food web analysis (TLcheddar) are significantly coherent with the ones collected from the literature (TLreference), which is per se a demonstration that the approach presented in this study can return a suitable estimation of the trophic positions. In summary, our methodological framework captured only changes in the food webs linked to changes in species presence/absence; it did not consider other sources of structural changes, such as changes in interaction strength. In this optic, the unique method to capture structural similarities or dissimilarities between food webs is to reconstruct heuristic food webs, based only on species co-occurrence. These latter are based on the assumption that the trophic links, unequivocally determined by the species feeding behaviour, are depicted by unweighted links in a binary network (binary matrix), where 0 represent no trophic relationship and 1 represent the trophic relationship of prey-predator, creating in this way a topological network. There is currently no complementary method to measure or otherwise generate the species abundance and their biomass data needed for FWA beyond quantified DNA sequence proxies. Furthermore, a main limitation of this approach results from the scarce knowledge of biological trophic links in marine communities, especially of less known environments (i.e. mesopelagic and bathypelagic zones). Despite all these considerations, to characterise the spatial variations of the SoS food webs we computed diverse topology properties because they cover diverse and ecologically relevant aspects of food web structures such as the vertical (trophic level), horizontal (generality) dimensions of food webs and their complexity (species richness, number of trophic links and direct connectance). Due to the complexity of our methodological framework, the interpretation of the results must be sequential and can rapidly become complicated if spatial components are entangled. By combining food web indicators with GAMs, we propose a framework to quantify and relate spatial changes in food web structure to changes in marine community composition. Our methodological approach can be readily used in areas where long-term monitoring of multiple trophic groups is carried out synchronously to support effective management strategies aimed at conserving the structure and functioning of ecological communities in times of environmental changes and species’ distributional shifts.
FWA has been identified as a helpful tool to support ecosystem-based fisheries management (Gaichas and Francis, 2008; Dee et al., 2017). Our study illustrates the possibility of employing a food web approach generated through MENA for exploring the variability in composition of marine demersal biological communities, owing to the rapid acquisition of sequence-based occurrence data. When this high taxonomic-resolution biodiversity information is translated into food webs, it yields even more information on connections among organisms and how these shape food webs, allowing us to understand complex ecological relationships (Winemiller, 1989; Dunne et al., 2002).
FWA is considered an inexpensive analytical tool for the assessment of community status (McCann, 2007) and the addition of DNA-based information can improve its use as a biomonitoring tool, particularly in marine environments. Using eDNA to assess food webs avoids the need for direct observation of interactions; given how rapidly species inventories can be generated through eDNA metabarcoding, across space and time, these approaches are poised to boost trophic ecology in a major way. Although eDNA-based data collection techniques also have severe limitations, it has recently been demonstrated that eDNA samples can be quickly, easily and inexpensively collected during normal fishing activities (Russo et al., 2021; Maiello et al., 2022; Albonetti et al., 2023, 2023). The approach presented in this study could represent a useful new tool in the context of current European policies such as the Marine Strategy Framework Directive (MSFD, 2008) or Marine Spatial Planning. In fact, MSFD requires monitoring and assessment of the status of marine ecosystems at both small and large spatial scales. This monitoring activity is presently based on the integration of different layers (i.e. the descriptors), some of which are well captured by a MENA (e.g. Descriptor 1: Biodiversity is maintained, Descriptor 2: Non-indigenous species do not adversely alter the ecosystem, Descriptor 3: The population of commercial fish species is healthy, Descriptor 4: Elements of food webs ensure long-term abundance and reproduction). The next step will focus on the possibility of integrating the food web structure with additional information detected using more efficient ways of collecting eDNA. As recently shown (Maiello et al., 2022), new solutions for eDNA collection from fishing nets can enhance data collection across space and time, with minimal impact on trawlers’ operations. Another necessary improvement regards the understanding of ecosystem instability more comprehensively, possibly employing complementary approaches. In particular, the integration of eDNA information with stable isotopes analysis of carbon and nitrogen could contribute to reconstructing food webs topology and trophic and isotopic niche (Cicala et al., 2019; Cicala et al., 2020; De Santis et al., 2022) in a more realistic way.
The datasets presented in this study can be found in online repositories. The names of the repository/repositories and accession number(s) can be found below: https://datadryad.org/stash/dataset/doi:10.5061/dryad.7m0cfxpsh.
Samples came from fishing activities (scientific survey). No ethical approval is needed.
TR, SM, GM, and SD’A conceived the idea. FF and GG planned the sampling and collected the samples at sea. GM analysed the samples using lab procedures. DC, GM, AS, SD’A, MS, LP, and TR analysed the data. DC, FF, GG, and DM revised the species list. DC, SM, and TR wrote the paper. All authors contributed to the article and approved the submitted version.
The author(s) declare that no financial support was received for the research, authorship, and/or publication of this article.
The authors declare that the research was conducted in the absence of any commercial or financial relationships that could be construed as a potential conflict of interest.
All claims expressed in this article are solely those of the authors and do not necessarily represent those of their affiliated organizations, or those of the publisher, the editors and the reviewers. Any product that may be evaluated in this article, or claim that may be made by its manufacturer, is not guaranteed or endorsed by the publisher.
The Supplementary Material for this article can be found online at: https://www.frontiersin.org/articles/10.3389/fmars.2023.1209093/full#supplementary-material
Agnetta D., Badalamenti F., Colloca F., Cossarini G., Fiorentino F., Garofalo G., et al. (2022). Interactive effects of fishing effort reduction and climate change in a central Mediterranean fishing area: Insights from bio-economic indices derived from a dynamic food-web model. Front. Mar. Sci. 9. doi: 10.3389/fmars.2022.909164
Agnetta D., Badalamenti F., Colloca F., D’Anna G., Di Lorenzo M., Fiorentino F., et al. (2019). Benthic-pelagic coupling mediates interactions in Mediterranean mixed fisheries: An ecosystem modeling approach. PloS One 14, e0210659. doi: 10.1371/journal.pone.0210659
Albonetti L., Maiello G., Cariani A., Carpentieri P., Ferrari A., Sbrana A., et al. (2023). DNA metabarcoding of trawling bycatch reveals diversity and distribution patterns of sharks and rays in the central Tyrrhenian Sea. ICES J. Mar. Sci. 0, fsad022. doi: 10.1093/icesjms/fsad022
Baiser B., Gotelli N. J., Buckley H. L., Miller T. E., Ellison A. M. (2012). Geographic variation in network structure of a nearctic aquatic food web: Network structure in an aquatic food web. Global Ecol. Biogeography 21, 579–591. doi: 10.1111/j.1466-8238.2011.00705.x
Bascompte J. (2009). Disentangling the web of life. Science 325, 416–419. doi: 10.1126/science.1170749
Bascompte J., Melián C. J., Sala E. (2005). Interaction strength combinations and the overfishing of a marine food web. Proc. Natl. Acad. Sci. U.S.A. 102, 5443–5447. doi: 10.1073/pnas.0501562102
Bastardie F., Nielsen J. R., Andersen B. S., Eigaard O. R. (2010). Effects of fishing effort allocation scenarios on energy efficiency and profitability: An individual-based model applied to Danish fisheries. Fisheries Res. 106, 501–516. doi: 10.1016/j.fishres.2010.09.025
Berry K. J., Mielke P. W. (1994). A test of significance for the index of ordinal variation. Percep. Motor Skills 79 (3, Pt 1), 1291–1295.
Bertrand J., Leonori I., Dremière P. Y., Cosimi G. (2002). Depth trajectory and performance of a trawl used for an international bottom trawl survey in the Mediterranean. Sci. Mar. 66, 169. doi: 10.3989/scimar.2002.66s2169
Bohan D. A., Vacher C., Tamaddoni-Nezhad A., Raybould A., Dumbrell A. J., Woodward G. (2017). Next-generation global biomonitoring: large-scale, automated reconstruction of ecological networks. Trends Ecol. Evol. 32, 477–487. doi: 10.1016/j.tree.2017.03.001
Cicala D., Calizza E., Careddu G., Fiorentino F., Sporta Caputi S., Rossi L., et al. (2019). Spatial variation in the feeding strategies of Mediterranean fish: flatfish and mullet in the Gulf of Gaeta (Italy). Aquat Ecol. 53, 529–541. doi: 10.1007/s10452-019-09706-3
Cicala D., Polgar G., Mor J. R., Piscia R., Brignone S., Zaupa S., et al. (2020). Trophic niches, trophic positions, and niche overlaps between non-native and native fish species in a Subalpine lake. Water 12, 3475. doi: 10.3390/w12123475
Cohen J. E., Briand F., Newman C. M. (1990). Community food webs: data and theory. (Berlin, Heidelberg: Springer Verlag).
Cohen J. E., Newman C. M., Steele J. H. (1985). A stochastic theory of community food webs I. Models and aggregated data. Proc. R. Soc. London. Ser. B. Biol. Sci. 224, 421–448. doi: 10.1098/rspb.1985.0042
Coll M., Palomera I., Tudela S., Dowd M. (2008). Food-web dynamics in the South Catalan Sea ecosystem (NW Mediterranean) for 1978–2003. Ecol. Model. 217, 95–116. doi: 10.1016/j.ecolmodel.2008.06.013
Coll M., Piroddi C., Steenbeek J., Kaschner K., Ben Rais Lasram F., Aguzzi J., et al. (2010). The biodiversity of the Mediterranean sea: estimates, patterns, and threats. PloS One 5, e11842. doi: 10.1371/journal.pone.0011842
Compson Z. G., Monk W. A., Hayden B., Bush A., O’Malley Z., Hajibabaei M., et al. (2019). Network-based biomonitoring: exploring freshwater food webs with stable isotope analysis and DNA metabarcoding. Front. Ecol. Evol. 7. doi: 10.3389/fevo.2019.00395
Cowan J. H., Rice J. C., Walters C. J., Hilborn R., Essington T. E., Day J. W., et al. (2012). Challenges for implementing an ecosystem approach to fisheries management. Mar. Coast. Fisheries 4, 496–510. doi: 10.1080/19425120.2012.690825
D’Alessandro S., Mariani S. (2021). Sifting environmental DNA metabarcoding data sets for rapid reconstruction of marine food webs. Fish Fish 22, 822–833. doi: 10.1111/faf.12553
De Angelis P., D’Andrea L., Franceschini S., Cataudella S., Russo T. (2020). Strategies and trends of bottom trawl fisheries in the Mediterranean Sea. Mar. Policy 118, 104016. doi: 10.1016/j.marpol.2020.104016
Dee L. E., Allesina S., Bonn A., Eklöf A., Gaines S. D., Hines J., et al. (2017). Operationalizing network theory for ecosystem service assessments. Trends Ecol. Evol. 32, 118–130. doi: 10.1016/j.tree.2016.10.011
Delmas E., Besson M., Brice M.-H., Burkle L. A., Dalla Riva G. V., Fortin M.-J., et al. (2019). Analysing ecological networks of species interactions. Biol. Rev. 94, 16–36. doi: 10.1111/brv.12433
Deng Y., Jiang Y.-H., Yang Y., He Z., Luo F., Zhou J. (2012). Molecular ecological network analyses. BMC Bioinf. 13, 113. doi: 10.1186/1471-2105-13-113
De Santis V., Cicala D., Baneschi I., Boschi C., Brignone S., Iaia M., et al. (2022). Non-native fish assemblages display potential competitive advantages in two protected small and shallow lakes of northern Italy. Global Ecol. Conserv. 35, e02082. doi: 10.1016/j.gecco.2022.e02082
Dial R., Roughgarden J. (1998). Theory of marine communities: the intermediate disturbance hypothesis. Ecology 79, 1412–1424. doi: 10.1890/0012-9658(1998)079[1412:TOMCTI]2.0.CO;2
DiBattista J. D., Reimer J. D., Stat M., Masucci G. D., Biondi P., De Brauwer M., et al. (2020). Environmental DNA can act as a biodiversity barometer of anthropogenic pressures in coastal ecosystems. Sci. Rep. 10, 8365. doi: 10.1038/s41598-020-64858-9
Di Lorenzo M., Sinerchia M., Colloca F. (2018). The North sector of the Strait of Sicily: a priority area for conservation in the Mediterranean Sea. Hydrobiologia 821, 235–253. doi: 10.1007/s10750-017-3389-7
Dunne J. A. (2006). “The network structure of food webs,” in Ecological networks: linking structure to dynamics in food webs (Oxford: Oxford Univ. Press), 27–86.
Dunne J. A. (2009). “Food webs,” in Complex networks and graph theory section of the encyclopedia of complexity and systems science (New York: Springer), 3661–3682.
Dunne J. A., Williams R. J., Martinez N. D. (2002). Food-web structure and network theory: The role of connectance and size. Proc. Natl. Acad. Sci. U.S.A. 99, 12917–12922. doi: 10.1073/pnas.192407699
EC (2008). “DIRECTIVE 2008/56/EC OF THE EUROPEAN PARLIAMENT AND OF THE COUNCIL of 17 June 2008 establishing a framework for community action in the field of marine environmental policy (Marine Strategy Framework Directive,” in Official Journal of the European Union. Bruxells: European Commission. Available at: https://eur-lex.europa.eu/legal-content/EN/TXT/PDF/?uri=CELEX:32008L0056&from=EN.
Estrada E. (2007). Food webs robustness to biodiversity loss: The roles of connectance, expansibility and degree distribution. J. Theor. Biol. 244, 296–307. doi: 10.1016/j.jtbi.2006.08.002
Frelat R., Kortsch S., Kröncke I., Neumann H., Nordström M. C., Olivier P. E. N., et al. (2022). Food web structure and community composition: a comparison across space and time in the North Sea. Ecography 2022, ecog.05945. doi: 10.1111/ecog.05945
Froese R., Pauly D. (2022) FishBase. Available at: www.fishbase.org.
Gaichas S. K., Francis R. C. (2008). Network models for ecosystem-based fishery analysis: a review of concepts and application to the Gulf of Alaska marine food web. Can. J. Fish. Aquat. Sci. 65, 1965–1982. doi: 10.1139/F08-104
Garofalo G., Fiorentino F., Gristina M., Cusumano S., Sinacori G. (2007). Stability of spatial pattern of fish species diversity in the Strait of Sicily (central Mediterranean). Hydrobiologia 580, 117–124. doi: 10.1007/s10750-006-0460-1
Gilbert A. J. (2009). Connectance indicates the robustness of food webs when subjected to species loss. Ecol. Indic. 9, 72–80. doi: 10.1016/j.ecolind.2008.01.010
Good E., Holman L. E., Pusceddu A., Russo T., Rius M., Iacono C. L. (2022). Detection of community-wide impacts of bottom trawl fishing on deep-sea assemblages using environmental DNA metabarcoding. Mar. pollut. Bull. 183, 114062. doi: 10.1016/j.marpolbul.2022.114062
Gristina M., Bahri T., Fiorentino F., Garofalo G. (2006). Comparison of demersal fish assemblages in three areas of the Strait of Sicily under different trawling pressure. Fisheries Res. 81, 60–71. doi: 10.1016/j.fishres.2006.05.010
Hastie T., Tibshirani R. (1990). Exploring the nature of covariate effects in the proportional hazards model. Biometrics 46, 1005–1005. doi: 10.2307/2532444
Hilborn R. (2011). Future directions in ecosystem based fisheries management: A personal perspective. Fisheries Res. 108, 235–239. doi: 10.1016/j.fishres.2010.12.030
Hinz H., Moranta J., Balestrini S., Sciberras M., Pantin J. R., Monnington J., et al. (2017). Stable isotopes reveal the effect of trawl fisheries on the diet of commercially exploited species. Sci. Rep. 7, 6334. doi: 10.1038/s41598-017-06379-6
Hudson L. (2022) cheddar: Analysis and Visualisation of Ecological Communities. Available at: https://cran.r-project.org/web/packages/cheddar/index.html.
Hudson L. N., Emerson R., Jenkins G. B., Layer K., Ledger M. E., Pichler D. E., et al. (2013). Cheddar: analysis and visualisation of ecological communities in R. Methods Ecol. Evol. 4, 99–104. doi: 10.1111/2041-210X.12005
Jennings S., Greenstreet S., Hill L., Piet G., Pinnegar J., Warr K. J. (2002). Long-term trends in the trophic structure of the North Sea fish community: evidence from stable-isotope analysis, size-spectra and community metrics. Mar. Biol. 141, 1085–1097. doi: 10.1007/s00227-002-0905-7
Jennings S., Kaiser M. J. (1998). “The effects of fishing on marine ecosystems,” in Advances in Marine Biology (Elsevier), 201–352. doi: 10.1016/S0065-2881(08)60212-6
Jeunen G., Knapp M., Spencer H. G., Lamare M. D., Taylor H. R., Stat M., et al. (2019). Environmental DNA (eDNA) metabarcoding reveals strong discrimination among diverse marine habitats connected by water movement. Mol. Ecol. Resour 19, 426–438. doi: 10.1111/1755-0998.12982
Karachle P. K., Stergiou K. I. (2017). An update on the feeding habits of fish in the Mediterranean Sea, (2002-2015). Medit. Mar. Sci. 18, 43. doi: 10.12681/mms.1968
Kelly R. P., Closek C. J., O’Donnell J. L., Kralj J. E., Shelton A. O., Samhouri J. F. (2017). Genetic and manual survey methods yield different and complementary views of an ecosystem. Front. Mar. Sci. 3. doi: 10.3389/fmars.2016.00283
Kondoh M. (2003). Foraging adaptation and the relationship between food-web complexity and stability. Science New Ser. 299, 1388–1391. doi: 10.1126/science.1079154
Kuparinen A., Boit A., Valdovinos F. S., Lassaux H., Martinez N. D. (2016). Fishing-induced life-history changes degrade and destabilize harvested ecosystems. Sci. Rep. 6, 22245. doi: 10.1038/srep22245
Lauria V., Gristina M., Fiorentino F., Attrill M. J., Garofalo G. (2020). Spatial management units as an ecosystem-based approach for managing bottom-towed fisheries in the central Mediterranean sea. Front. Mar. Sci. 7. doi: 10.3389/fmars.2020.00233
MacArthur R. (1955). Fluctuations of animal populations and a measure of community stability. Ecology 36, 533. doi: 10.2307/1929601
Maiello G., Talarico L., Brodie C., Carpentieri P., Sbrana A., Shum P., et al. (2023). Net gain: Low-cost, trawl-associated eDNA samplers upscale ecological assessment of marine demersal communities. Environ. DNA 00, edn3.389. doi: 10.1002/edn3.389
Maiello G., Talarico L., Carpentieri P., De Angelis F., Franceschini S., Harper L. R., et al. (2022). Little samplers, big fleet: eDNA metabarcoding from commercial trawlers enhances ocean monitoring. Fisheries Res. 249, 106259–106259. doi: 10.1016/J.FISHRES.2022.106259
Martinez N. D. (1992). Constant connectance in community food webs. Am. Nat. 139, 1208–1218. doi: 10.1086/285382
May R. M. (1974). Stability and Complexity in Model Ecosystems (Princeton: Princeton University Press). doi: 10.2307/j.ctvs32rq4
Micheli F., Halpern B. S., Walbridge S., Ciriaco S., Ferretti F., Fraschetti S., et al. (2013). Cumulative human impacts on Mediterranean and Black Sea marine ecosystems: Assessing current pressures and opportunities. PloS One 8. doi: 10.1371/journal.pone.0079889
MSFD. (2008). Directive 2008/56/EC of the European Parliament and of the Council of 17 June 2008 establishing a framework for community action in the field of marine environmental policy (Marine Strategy Framework Directive). Official Journal of the European Union. Available at: http://data.europa.eu/eli/dir/2008/56/oj.
Nepusz T. (2022) igraph: Network Analysis and Visualization. Available at: https://cran.r-project.org/web/packages/igraph/index.html.
Oksanen J., Blanchet F. G., Friendly M., Kindt R., Legendre P., McGlinn D., et al. (2018). vegan: Community Ecology Package. Ordination methods, diversity analysis and other functions for community and vegetation ecologists.
Olesen J. M., Jordano P. (2002). GEOGRAPHIC PATTERNS IN PLANT–POLLINATOR MUTUALISTIC NETWORKS. Ecology 83, 2416–2424. doi: 10.1890/0012-9658(2002)083[2416:GPIPPM]2.0.CO;2
Palomares M. L. (2022) SeaLifeBase. Available at: https://www.sealifebase.ca/.
Pauly D., Christensen V., Dalsgaard J., Froese R., Torres F. (1998). Fishing down marine food webs. Science 279, 860–863. doi: 10.1126/science.279.5352.860
Preciado I., Arroyo N. L., González-Irusta J. M., López-López L., Punzón A., Muñoz I., et al. (2019). Small-scale spatial variations of trawling impact on food web structure. Ecol. Indic. 98, 442–452. doi: 10.1016/j.ecolind.2018.11.024
Pyke G. H., Pulliam H. R., Charnov E. L. (1977). Optimal foraging: A selective review of theory and tests. Q. Rev. Biol. 52, 137–154. doi: 10.1086/409852
Ramírez F., Coll M., Navarro J., Bustamante J., Green A. J. (2018). Spatial congruence between multiple stressors in the Mediterranean Sea may reduce its resilience to climate impacts. Sci. Rep. 8, 14871. doi: 10.1038/s41598-018-33237-w
Riccioni G., Stagioni M., Piccinetti C., Libralato S. (2018). A metabarcoding approach for the feeding habits of European hake in the Adriatic Sea. Ecol. Evol. 8, 10435–10447. doi: 10.1002/ece3.4500
Riede J. O., Rall B. C., Banasek-Richter C., Navarrete S. A., Wieters E. A., Emmerson M. C., et al. (2010). “Scaling of food-web properties with diversity and complexity across ecosystems,” in Advances in Ecological Research (Elsevier), 139–170. doi: 10.1016/B978-0-12-381363-3.00003-4
Rijnsdorp A. (1996). Changes in abundance of demersal fish species in the North Sea between 1906–1909 and 1990–1995. ICES J. Mar. Sci. 53, 1054–1062. doi: 10.1006/jmsc.1996.0132
Rossi L., di Lascio A., Carlino P., Calizza E., Costantini M. L. (2015). Predator and detritivore niche width helps to explain biocomplexity of experimental detritus-based food webs in four aquatic and terrestrial ecosystems. Ecol. Complexity 23, 14–24. doi: 10.1016/j.ecocom.2015.04.005
Russo T., Carpentieri P., D’Andrea L., De Angelis P., Fiorentino F., Franceschini S., et al. (2019). Trends in effort and yield of trawl fisheries: A case study from the Mediterranean sea. Front. Mar. Sci. 6. doi: 10.3389/fmars.2019.00153
Russo T., Carpentieri P., Fiorentino F., Arneri E., Scardi M., Cioffi A., et al. (2016). Modeling landings profiles of fishing vessels: An application of Self-Organizing Maps to VMS and logbook data. Fisheries Res. 181, 34–47. doi: 10.1016/j.fishres.2016.04.005
Russo T., Maiello G., Talarico L., Baillie C., Colosimo G., D’Andrea L., et al. (2021). All is fish that comes to the net: metabarcoding for rapid fisheries catch assessment. Ecol. Appl. 31. doi: 10.1002/eap.2273
Russo T., Parisi A., Cataudella S. (2013). Spatial indicators of fishing pressure: Preliminary analyses and possible developments. Ecol. Indic. 26, 141–153. doi: 10.1016/j.ecolind.2012.11.002
Russo T., Scardi M., Boglione C., Cataudella S. (2011). Application of the Self-Organizing Map to the study of skeletal anomalies in aquaculture: The case of dusky grouper (Epinephelus marginatus Lowe 1834) juveniles reared under different rearing conditions. Aquaculture 315, 69–77. doi: 10.1016/j.aquaculture.2010.11.030
Schoener T. W. (1989). Food webs from the small to the large: the Robert H. MacArthur Award lecture. Ecology. 70, 1559–1589. doi: 10.2307/1938088
Stat M., John J., DiBattista J. D., Newman S. J., Bunce M., Harvey E. S. (2019). Combined use of eDNA metabarcoding and video surveillance for the assessment of fish biodiversity. Conserv. Biol. 33, 196–205. doi: 10.1111/cobi.13183
Taberlet P., Bonin A., Zinger L., Coissac E. (2018). Environmental DNA: For biodiversity research and monitoring. (Oxford: Oxford University).
Thompson R. M., Brose U., Dunne J. A., Hall R. O., Hladyz S., Kitching R. L., et al. (2012). Food webs: reconciling the structure and function of biodiversity. Trends Ecol. Evol. 27, 689–697. doi: 10.1016/j.tree.2012.08.005
Tilman D. (1996). Biodiversity: population versus ecosystem stability. Ecology 77, 350–363. doi: 10.2307/2265614
Trebilco R., Halpern B. S., Flemming J. M., Field C., Blanchard W., Worm B. (2011). Mapping species richness and human impact drivers to inform global pelagic conservation prioritisation. Biol. Conserv. 144, 1758–1766. doi: 10.1016/j.biocon.2011.02.024
Valdovinos F. S., Ramos-Jiliberto R., Garay-Narváez L., Urbani P., Dunne J. A. (2010). Consequences of adaptive behaviour for the structure and dynamics of food webs: Adaptive behaviour in food webs. Ecol. Lett. 13, 1546–1559. doi: 10.1111/j.1461-0248.2010.01535.x
Vermaat J. E., Dunne J. A., Gilbert A. J. (2009). Major dimensions in food-web structure properties. Ecology 90, 278–282. doi: 10.1890/07-0978.1
Wangensteen O. S., Palacín C., Guardiola M., Turon X. (2018). DNA metabarcoding of littoral hardbottom communities: High diver- sity and database gaps revealed by two molecular markers. PeerJ 2018 (5), e4705. doi: 10.7717/peerj.4705
Warren P. H. (1990). Variation in food-web structure: the determinants of connectance. Am. Nat. 136, 689–700. doi: 10.1086/285123
Winemiller K. O. (1989). Must connectance decrease with species richness? Am. Nat. 134, 960–968. doi: 10.1086/285024
Wood S. (2022) mgcv: Mixed GAM Computation Vehicle with Automatic Smoothness Estimation. Available at: https://cran.r-project.org/web/packages/mgcv/index.html.
Keywords: Food Webs Analysis (FWA), environmental DNA (eDNA), marine communities, abiotic factors, fishing pressure, Mediterranean Sea
Citation: Cicala D, Maiello G, Fiorentino F, Garofalo G, Massi D, Sbrana A, Mariani S, D’Alessandro S, Stefani M, Perrodin L and Russo T (2024) Spatial analysis of demersal food webs through integration of eDNA metabarcoding with fishing activities. Front. Mar. Sci. 10:1209093. doi: 10.3389/fmars.2023.1209093
Received: 20 April 2023; Accepted: 14 December 2023;
Published: 08 January 2024.
Edited by:
Stelios Katsanevakis, University of the Aegean, GreeceReviewed by:
Antonia Picornell, University of the Balearic Islands, SpainCopyright © 2024 Cicala, Maiello, Fiorentino, Garofalo, Massi, Sbrana, Mariani, D’Alessandro, Stefani, Perrodin and Russo. This is an open-access article distributed under the terms of the Creative Commons Attribution License (CC BY). The use, distribution or reproduction in other forums is permitted, provided the original author(s) and the copyright owner(s) are credited and that the original publication in this journal is cited, in accordance with accepted academic practice. No use, distribution or reproduction is permitted which does not comply with these terms.
*Correspondence: Tommaso Russo, VG9tbWFzby5SdXNzb0BVbmlyb21hMi5pdA==
Disclaimer: All claims expressed in this article are solely those of the authors and do not necessarily represent those of their affiliated organizations, or those of the publisher, the editors and the reviewers. Any product that may be evaluated in this article or claim that may be made by its manufacturer is not guaranteed or endorsed by the publisher.
Research integrity at Frontiers
Learn more about the work of our research integrity team to safeguard the quality of each article we publish.