 Jan Tiede
 Christian Jordan
 Armin Moghimi
 Torsten Schlurmann
94% of researchers rate our articles as excellent or good
Learn more about the work of our research integrity team to safeguard the quality of each article we publish.
Find out more
ORIGINAL RESEARCH article
Front. Mar. Sci., 27 June 2023
Sec. Coastal Ocean Processes
Volume 10 - 2023 | https://doi.org/10.3389/fmars.2023.1207524
In this study, we demonstrate how freely available satellite images can be used to understand large-scale coastline developments along the coast of Mecklenburg-Western Pomerania (MWP). By validating the resulting dataset with an independent Light Detection and Ranging (LIDAR) dataset, we achieved a high level of accuracy for the calculation of rates of change (ROC) with a root mean square error (RMSE) of up to 0.91 m, highlighting the reliability of Earth observation data for this purpose. The study assessed the coastal system’s natural evolution from 1984 to 1990, prior to significant human interventions, and examined the period from 1996 to 2022, which was characterized by regular sand nourishments amounting to approximately 16 million m³. The results reveal notable changes in the study area, with a significant decline in erosive trends and an increase in the number of stable and accreting transects. However, it is important to note that the regular sand nourishments may be masking the true ROC along the coastline. Furthermore, the future supply of sand raises concerns about the sustainability of coastal developments, particularly in the context of future sea level rise (SLR). The study provides valuable insights for coastal authorities and policymakers, informing decisions on sand resource allocation and highlighting the need for appropriate adaptation strategies to address future SLR and ensure long-term coastal resilience.
Coastal zones are vital resources for humans due to their abundance of marine resources, tourism, recreational activities, and coastal infrastructures. These areas also provide crucial ecosystem services (Barbier et al., 2011; Temmerman et al., 2013). However, projections of an increase in the frequency of storms, sea level rise (SLR), and land subsidence threaten the global coastal zone, potentially leading to erosion and flooding (Oppenheimer et al., 2019). Although conventional coastal engineering methods such as methods, such as dikes, seawalls, and embankments, are the default solution for protecting most coastal communities, they are costly and have negative impacts on existing ecosystems. As sea levels rise, a conventional strategy will constantly require the heightening and widening of dikes, which is unsustainable eventually. Hinkel et al. (2014) and Nicholls et al. (2019) assessed the resulting costs of adapting to SLR and protecting the coast until the end of the 21st century focusing on coastal zones worldwide. The model-based approach by Hinkel et al. (2014) produces cost estimates as high as 1.9 to 4.2 trillion USD until the end of the 21st century, while Nicholls et al. (2019) arrives at 18.3 trillion USD for a comparable SLR scenario, emphasizing the challenge as well as the uncertainty SLR poses to communities worldwide. Furthermore, conventional structures also do not provide ecosystem services, nor do they benefit existing ecosystems.
In contrast to conventional structures, Nature-based solutions (NbS) provide the chance to reduce the costs needed for protecting the coast (van Zelst et al., 2021). According to the International Union for the Conservation of Nature (IUCN), the definition of NbS is as follows: “Nature-based Solutions are actions to protect, sustainably manage, and restore natural and modified ecosystems that address societal challenges effectively and adaptively, simultaneously benefiting people and nature.” (Cohen-Shacham et al., 2016, p. 5). With respect to the challenges at the coast arising through SLR, NbS provide protection from floods and erosion by utilizing natural systems, such as wetlands, mangroves, and sand dunes (Temmerman et al., 2013; Schoonees et al., 2019). NbS are not limited to natural systems but also include ecologically enhanced conventional engineering structures, for instance, vegetated revetments (Schoonees et al., 2019). Especially submerged breakwaters were found to provide several services for the ecology in their surroundings (Saengsupavanich et al., 2022). For instance, they were observed to provide a habitat for corals (Burt et al., 2009) and other benthic communities when engineered with a suitable material (Scyphers et al., 2015). By working with nature rather than against it, these measures benefit existing or emerging ecosystems by improving their health and functioning. While it is vital to transition to these NbS for the sustainable preservation of our coastal zones, it is equally important to address the critical research that highlights potential negative impacts associated with these solutions. While nourishments, an example of a widely used NbS, are generally considered ecosystem-friendly (Salman et al., 2004), there is critical research indicating potential negative impacts on marine life at both extraction and placements sites (Saengsupavanich et al., 2023).
In general, coastal protection aims to prevent flooding and mitigate coastal erosion to maintain the available coastal habitats and infrastructures. The driving factors of erosion and deposition vary depending on the observed spatial and temporal scales. Long-term changes, occurring over inter-centennial timescales, are mostly driven by SLR (Ranasinghe et al., 2012) and the availability of sediment (Carter et al., 1987). Short-term changes, occurring over inter-seasonal and inter-annual timescales, are influenced by variations in wave conditions (Dodet et al., 2019), nourishments, and extreme events (Stive et al., 2002). Man-made interventions, such as coastal protection structures, can also affect coastal morphology (Turner, 2006). To effectively understand and manage the drivers of coastal erosion and deposition, monitoring approaches need to provide an appropriate temporal and spatial resolution. This allows for a comprehensive understanding of the roles played by both short- and long-term drivers. By incorporating this knowledge into coastal management strategies, it is possible to ensure the sustainable protection of coastal habitats and infrastructures.
Suitable coastal protection strategies can be highly variable depending on the stresses affecting the coast (i.e., coastal erosion and flooding) and local conditions (e.g., financial resources and the type of coast). Mecklenburg-Western Pomerania (MWP), a German federal state located along the Baltic Sea coastline spanning about 377 km, has relied on sand nourishments for over 50 years as a crucial aspect of its coastal protection strategy. This approach is necessary due to the state's dependence on the foreshore, beaches, and dunes (StALU, 2021). However, the assessment of the efficiency, effectiveness, and lifetime of these nourishments is complicated by the combination of natural coastal developments and anthropogenic influences. The current practice is to monitor and react to changes seen on the beaches and regularly replace the sand that was washed away by local metocean conditions (StALU, 2021). A long-term protection strategy that incorporates the uncertainties arising from climate change, particularly SLR, is necessary to manage the coast in the future, emphasizing the importance of understanding the coastal dynamics and the impact of current protection practices. Long-term and high-resolution datasets of coastal development achieved through continuous monitoring are needed for this understanding.
Beach surveying by global navigation satellite systems (Baptista et al., 2008), laser scanning (Kaehler et al., 2022), and photogrammetry (Talavera et al., 2020) are state-of-the-art means for accurate and precise monitoring of local coastal developments and the assessment of coastal protection safety levels. However, due to their limited spatial and temporal coverage, they are not suitable for assessing large-scale coastal morphology. Publicly accessible geospatial data on coastal topography and bathymetry usually combine data from different years into a single dataset to cover extensive areas (Lehfeldt and Melles, 2014), which limits their usefulness for analyzing morphological processes.
According to Staudt et al. (2021), monitoring of the development and overall effectiveness of sand nourishments is a rarely conducted practice. They studied the practices in a number of countries and observed that the long-term impact of sand nourishments and sediment extraction is not fully understood. The lack of monitoring makes it challenging to assess the development and effects of nourishments beyond the nourishment site itself. The monitoring strategies range from quarterly beach profiles (Denmark) to biannual beach profiles (Belgium) to monitor the development and actual lifetime of the conducted nourishments.
In recent years, researchers have turned to Earth observation to overcome the limitations of traditional monitoring approaches. Several studies have used spaceborne and airborne sensors with different characteristics to analyze shoreline dynamics (Toure et al., 2019). The Google Earth Engine (GEE) provides a cloud computing platform with free access to many remotely sensed datasets, including images from satellite missions, namely Landsat (5, 7 and 8) and Sentinel-2 (Amani et al., 2020). However, uncertainties, such as water levels due to tidal forcings, cloud coverages, registration errors, and difficulties in detecting the interface between wet and dry sand, make it challenging to derive shorelines from these images (Castelle et al., 2021).
Despite these uncertainties, satellite-derived shorelines (SDS) can be useful for analyzing inter-annual and seasonal processes (Vos et al., 2019a). Castelle et al. (2022) used satellite imagery to assess shoreline dynamics over 269 km of a high-energy macro tidal coast in France and compared their results to field data from 41 transects. Nanson et al. (2022) successfully identified local to regional scale coastal changes dominated by either wave or tide by using observations from Landsat missions (5,7, and 8). Other studies have used a time-series of yearly composite images to depict regional and global shoreline developments (Luijendijk et al., 2018; Bishop-Taylor et al., 2021). Luijendijk et al. (2018) validated their global SDS at four study sites by comparing satellite-derived shoreline positions to in-situ measurements along 277 transects. Bishop-Taylor et al. (2021) applied their annually generated SDS from Landsat imagery with a validation dataset comprising different sources, reporting an accuracy matching that of Vos et al. (2019b) and improving on the accuracy reported by Luijendijk et al. (2018). Their tide modeling and pixel-based correction of tidal fluctuations resulted in a dataset with a root mean square error (RMSE) of 0.70 m/yr when compared to validation data for a specific set of 330 validation transects.
Using 2D images in the form of satellite images to observe coastal change has its limitations. Coastal morphodynamics are characterized by volumetric changes, meaning that erosion and deposition of the shore are not always equivalent to a seaward or landward displacement of the shoreline. For instance, the sand eroding from a dune might be deposited on the beach or in the foreshore, resulting in a perceived accumulation of sand in this segment. This limits the usability of satellite images for the observation of short-term processes, for instance, redistribution processes shortly after a nourishment. These limitations must be considered when assessing coastal change with satellite images.
In this study, we assess the coastline change over the last 30+ years along the coast of the federal state of MWP at the Baltic Sea. We suggest that nourishments have significantly changed the distribution of erosive and accreting segments. Furthermore, we provide a regional-scale accuracy for the detection of coastline changes using remote sensing techniques by comparing them with multi-temporal LIDAR datasets. Unlike the focus of other studies (Bishop-Taylor et al., 2021; Castelle et al., 2022; Nanson et al., 2022), the micro-tidal coast of MWP is heavily nourished and depends on the presence and services of adjacent natural dunes for coastal protection. Due to the complex dynamic equilibrium between erosion and accretion, which depends on several external factors, such as storms, precipitation, river discharge, protection strategy, and infrastructure measures, the coast of MWP is highly dynamic.
The outer coastline of MWP in the southwestern Baltic Sea spans 377 km, with 237 km being flat coast and 140 km consisting of cliffs. Based on historical map data analyzed by state authorities, 65% of the coastline is receding, 13% is advancing into the sea, and 22% is in balance (StALU, 2021). The average rate of erosion along the entire coastline over a 100-year time span is 0.35 m/yr, but locally erosion rates can reach up to 2.1 m/yr. However, there are also areas with a growth rate of up to 4.0 m/yr. The study area, located in the north-east of Germany, is depicted in Figure 1. The cliffs, which account for about one third of the coastline, act as a natural source of sediment, leading to accumulation in neighboring areas. Some attempts to protect these cliffs for tourism and agriculture have negatively affected neighboring flat coasts. Consequently, the cliffs remain largely unprotected, conducive to their role as sediment suppliers (StALU, 2021). The Baltic Sea coast can be characterized as self-balancing, with exposed areas experiencing erosion, while sheltered areas accumulate sediment. Large bays are located behind the outer coastline, partially connected to the sea. Coastal protection measures in these bays tend to be lower due to the absence of significant wave activity, thus protection at the outer coastline is crucial in preventing breaches and flooding. However, little is known about how seasonal changes affected this balance in the past and for how long these evenly distributed budgets of erosion and accretion patterns are going to last in the coming decades.
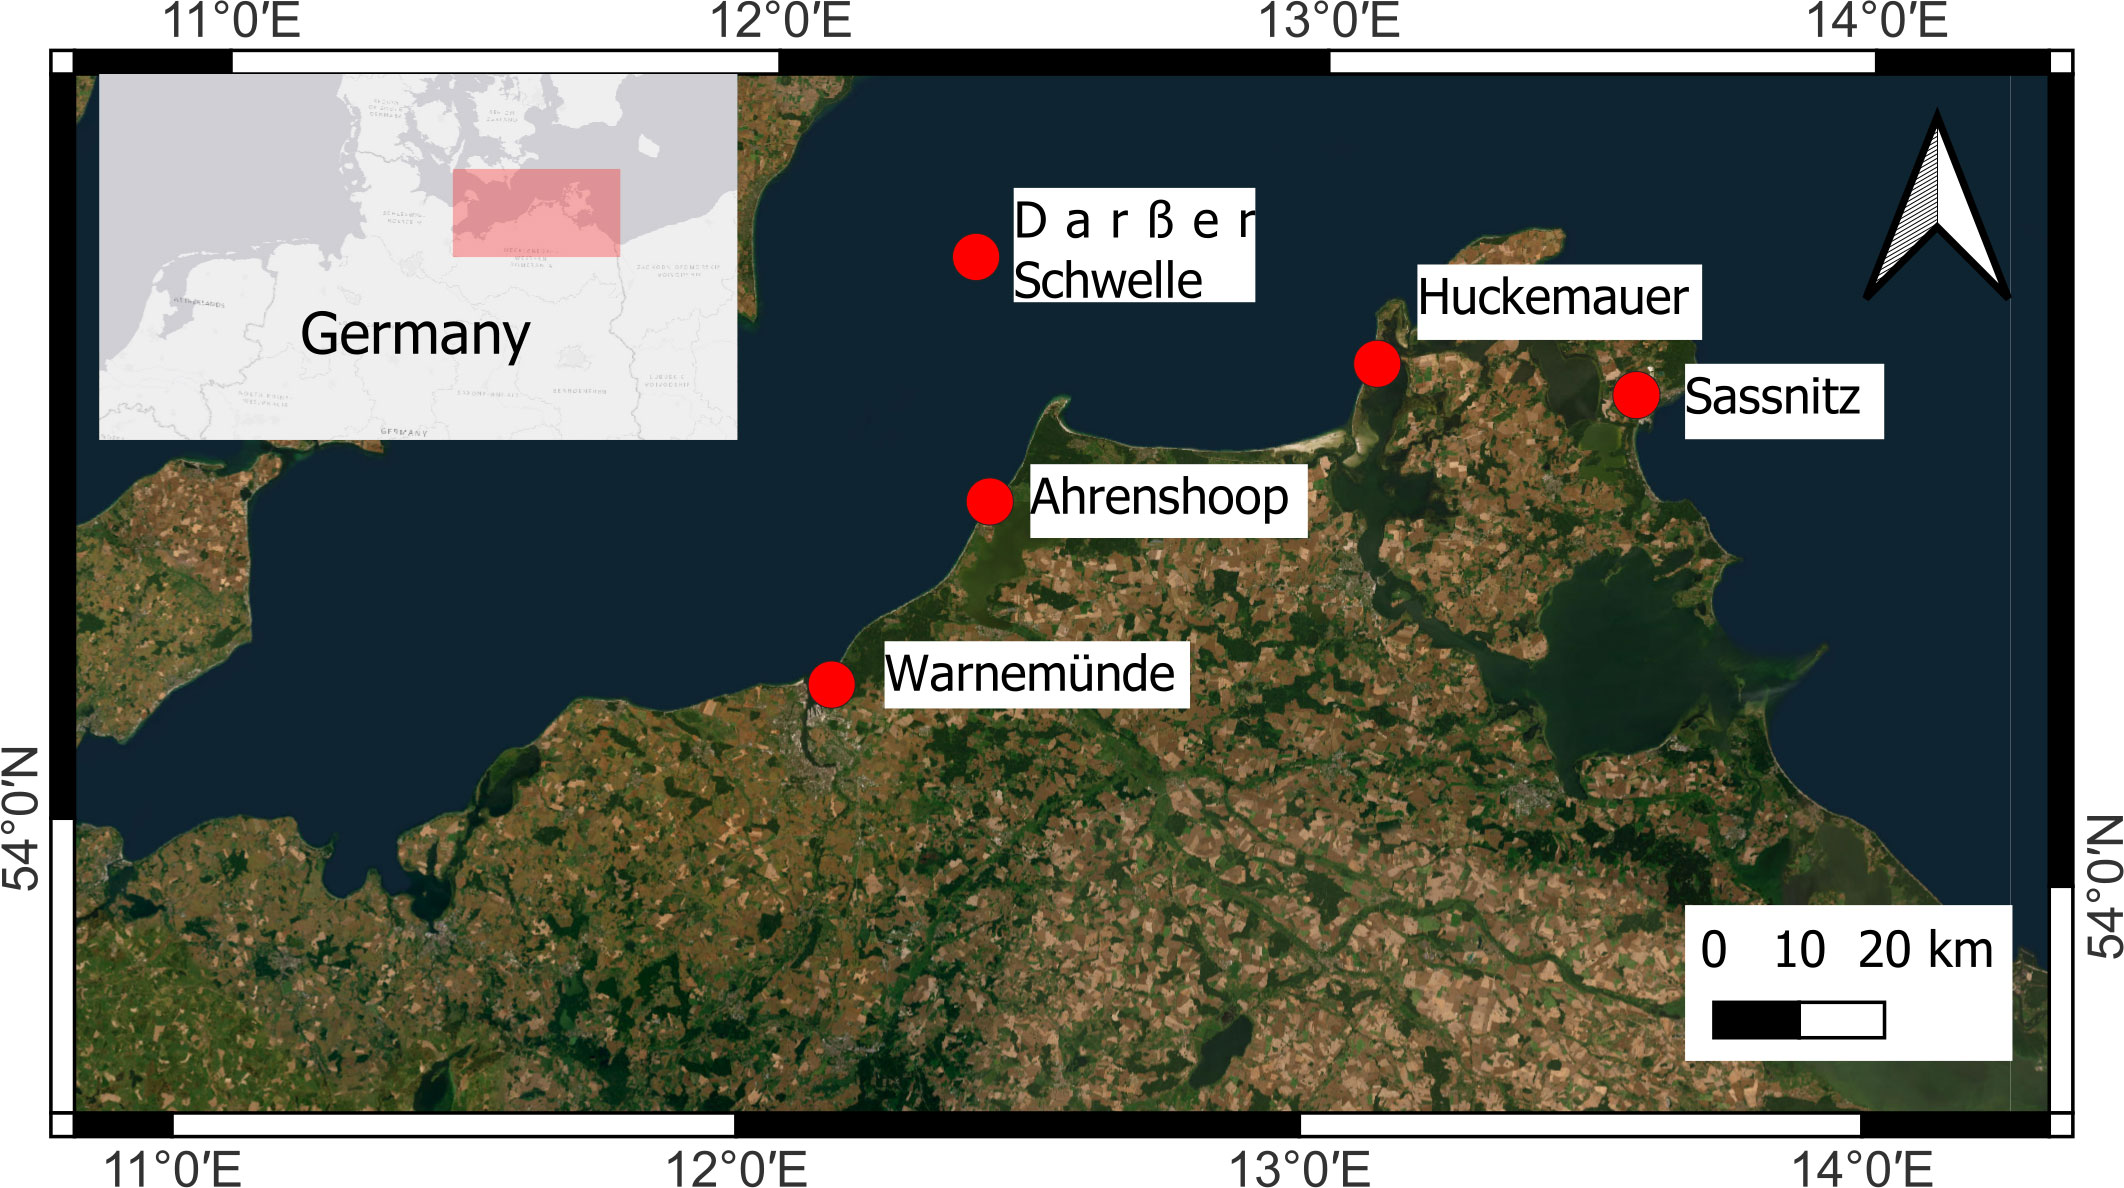
Figure 1 Overview of the study area of MWP. Red dots mark major cities and locations of wave/water level measurements (stations at Ahrenshoop and Darßer Schwelle). Background map sources: Esri, DigitalGlobe, GeoEye, i-cubed, USDA FSA, USGS, AEX, Getmapping, Aerogrid, IGN, IGP, swisstopo, and the GIS User Community.
To further compound the challenges faced by the coastal protection measures, the effects of climate change and SLR cannot be ignored. According to Kelln et al. (2022), the southwestern Baltic Sea has experienced a rise in sea level of 1.23 ± 0.11 mm/yr between 1900 and 2015 based on tidal gauge data. Figure 2 illustrates the trend of SLR at Warnemünde from 1855 to 2015, supporting their findings. Recent studies have also shown that the rate of SLR has accelerated significantly. Madsen et al. (2019) found a rise in the absolute sea level change for the Baltic Sea of 3.4 ± 0.7 mm/yr between 1993 to 2014 based on reconstructed tide gauge data and 4.0 ± 1.3 mm/yr between 1993 to 2015 based on satellite imagery.
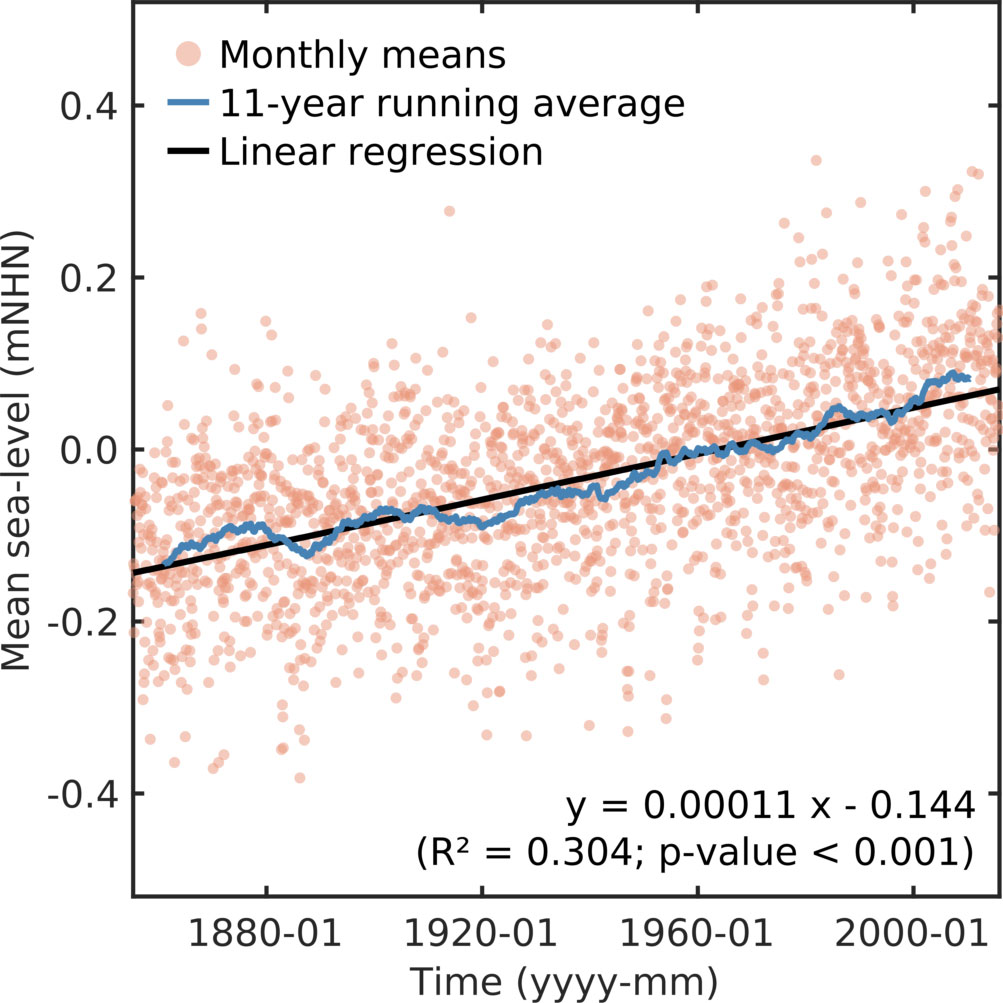
Figure 2 Monthly values of mean SLR in Warnemünde over the years 1850 to 2015. mNHN is the German height reference system and refers to elevation above sea level (Kelln et al., 2019).
The major coastal protection measures in the study area, measured by their share of the total protected shoreline, are dunes (40.9%) and dikes (17.5%). Seawalls and detached breakwaters are only used in small segments. The large share of dunes is in contrast to the coastal protection strategy along the German North Sea coastline. Notably, in the German North Sea only three barrier islands (Sylt, Norderney, and Langeoog) receive significant nourishments, with an approximate volume of 1.8 million m3/yr. As the major element of the coastal protection strategy at the Baltic Sea, dunes cover approximately 106 km of protected shoreline (StALU, 2021). However, as sand-based protection measures, they are subject to erosion from waves, particularly during storm surges. At locations where sediment deficiencies exist, coastal authorities regularly nourish the dunes to prevent complete erosion of the dunes (StALU, 2021).
Apart from long-term changes, short-term sea level extremes caused by storm surges, wind waves, and wind surges before a storm are also significant factors affecting coastal protection measures (Suursaar et al., 2006; Madsen et al., 2015). Storm surges in the Western Baltic Sea region, where the study area is located, typically reach a height of 1.0 to 1.5 m, with storm surges exceeding 1.0 m occurring 1.2 to 2.1 times per year depending on the location (Weisse et al., 2021). The height of waves in the Baltic Sea follows a seasonal cycle of wind speeds, which are higher during the winter (Björkqvist et al., 2018). Figure 3 summarizes the development of significant wave heights and wave directions at Ahrenshoop and Darßer Schwelle between 1955 and 2017, revealing a moderate positive trend in the significant wave height over the modeled timespan. The yearly significant wave height fluctuates around 0.52 m at the median, while the yearly 99th percentile ranges between 2.3 to 3.6 m in the studied time frame. Additionally, a wave rose from a wave buoy at Darßer Schwelle and a water level time series from a gauge at Warnemünde are supplied in Supplementary Figure 2 for more details on the wave heights and water level fluctuations. The linear regression of wave direction also suggests an increase of waves from a westerly direction, which could potentially cause changes to the coastal system, such as the reversal of longshore drift direction in some locations. These findings demonstrate the increasing pressure on coastal protection measures.
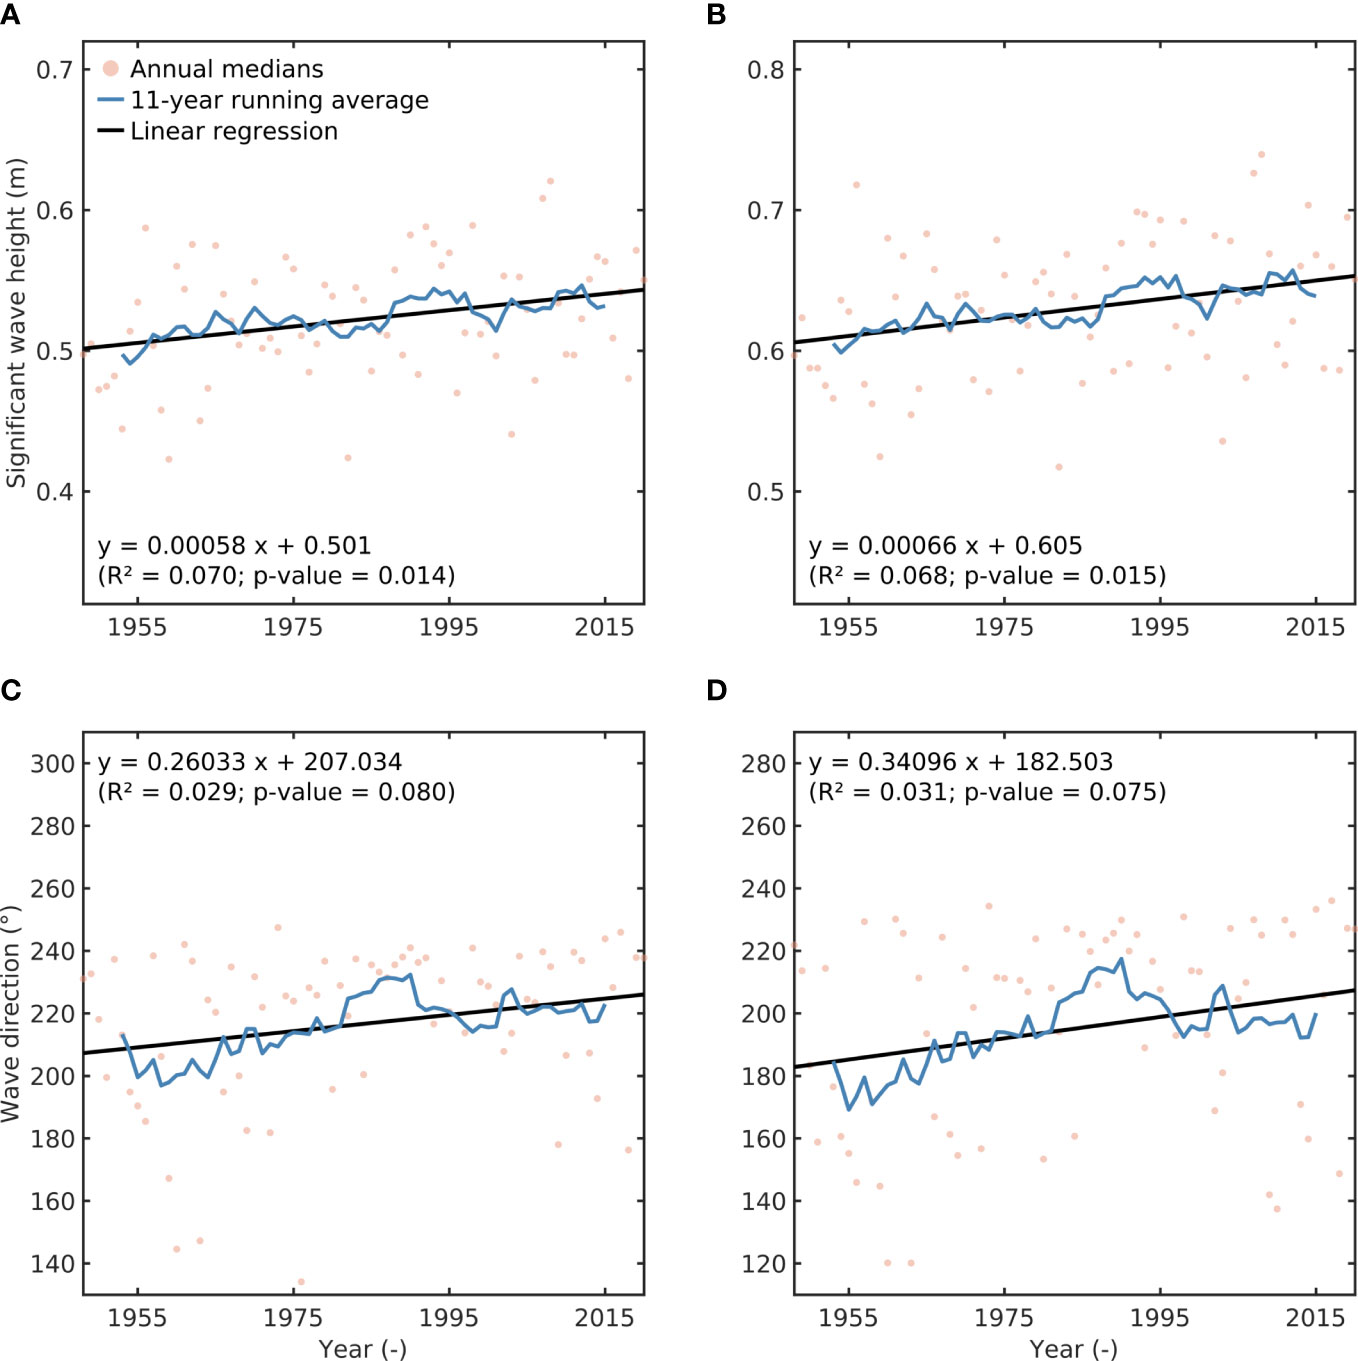
Figure 3 Times series of significant wave heights (m) and wave directions (°) from a hind cast (unpublished dataset by Groll N. as part of the coastDat project). Significant wave heights at (A) Ahrenshoop and (B) Darßer Schwelle. Wave directions at (C) Ahrenshoop and (D) Darßer Schwelle.
The current management practice, written down in the “Coastal Protection Rules Mecklenburg-West Pomerania”, has been in place since 1995. Since then, the level of coastal protection has been heightened and extended. The financial investment for the implementation of the coastal protection strategy of MWP has been approx. 15.5 million €/yr in the period from 1990 to 2008 (StALU, 2021). Of this investment, only 11% are spent on dykes, while the share of measures aimed primarily at limiting the erosion of sand-based coastal protection measures is as high as 85.1%. Included in this percentage are nourishments (45.6%), groins (19.6%), seawalls (7.7%), revetments (7.6%), and detached breakwaters (4.6%) (StALU, 2021).
Generally, understanding the dynamics of the shoreline is crucial when planning the distribution of sand supplies along the coast. This is particularly important considering the challenges posed by SLR in the coming years. By investing in coastal protection measures, such as nourishments and groins, authorities can help to mitigate the effects of erosion and storm surges, which threaten the stability of the coastline and the communities that depend on it.
Of the 106 km of coastline protected by dunes, around 69 km are regularly nourished, with individual nourishments ranging from 10,000 to 600,000 m³ of sand. The intervals for the nourishments typically range from 5 to 10 years depending on the site-specific sand deficits. According to datasets produced by the StALU, which describe the nourishing practice in MWP, approximately 6 million m3 of sand have been installed between 1964 and 1995 and approximately 12 million m³ of sand were installed for beach and dune replenishment between 1995 and 2018 (Figure 4). This volume of sand emphasizes the scale of the challenge in safeguarding the coast against the damaging effects of erosion. The primary objective of the nourishment practice is to protect inhabited areas (StALU, 2021). However, it must be noted that nourishments are also deployed to widen the beach for touristic needs by local initiatives.
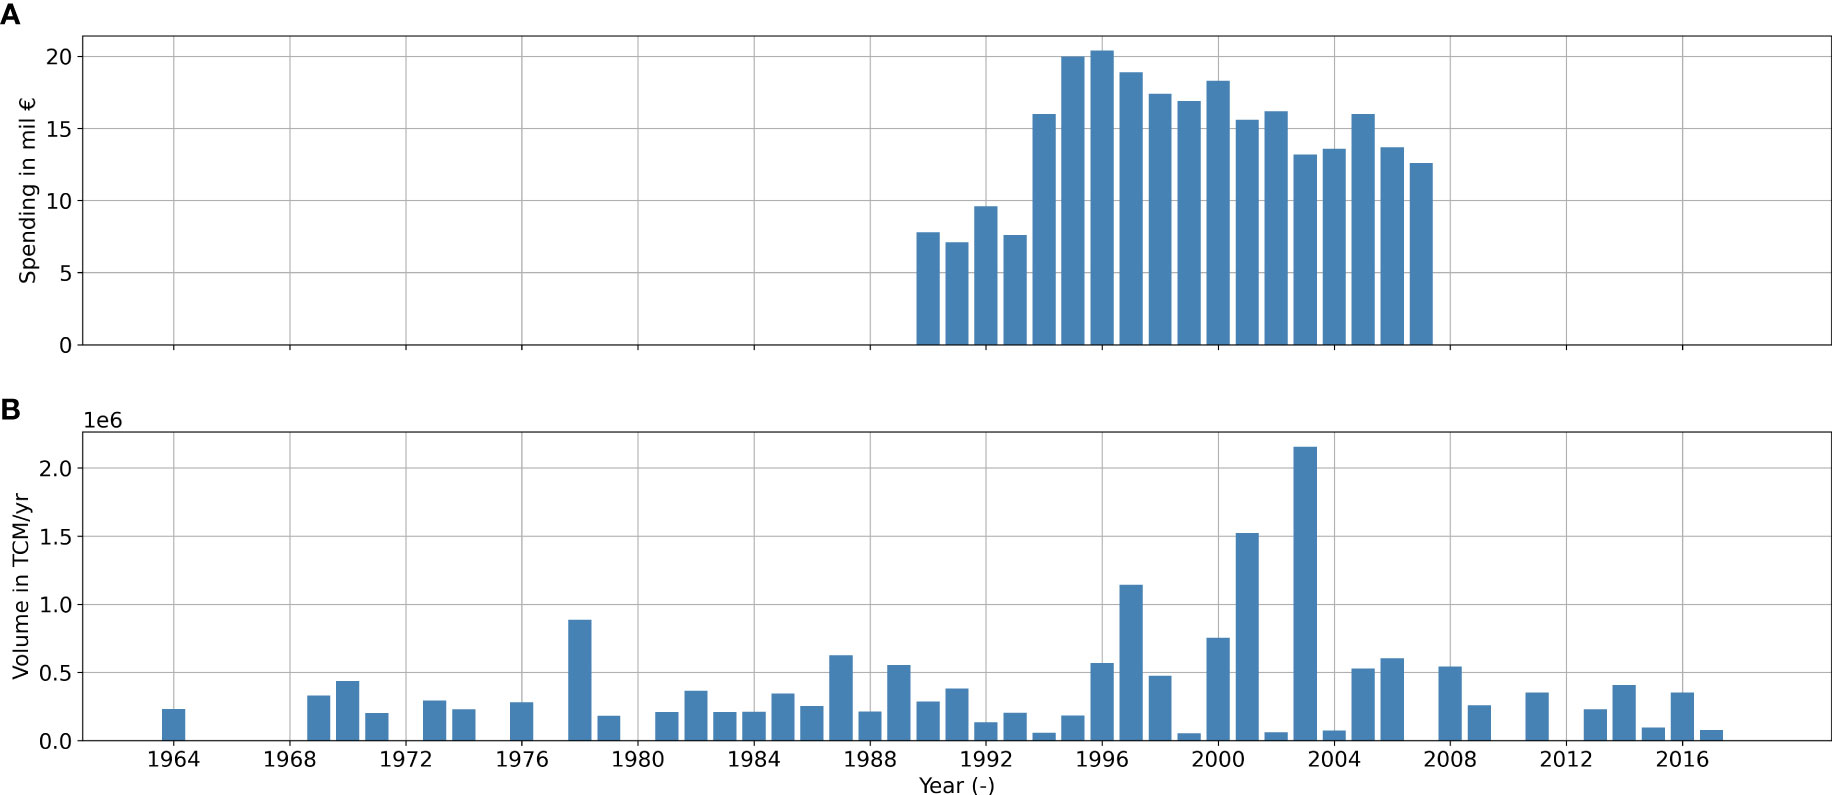
Figure 4 (A) Money in million € spent on coastal protection measures at the coast in MWP between 1990 and 2018. (B) Nourished sand volume in thousand cubic meters (TCM) per year between 1964 and 2018. Note that for the years before 1990 and after 2017 no data is available for the cost of nourishments.
Beach nourishments may be directed towards the shoreface, beach, or dune parts of the coastline, depending on the specific requirements of each location. However, this information is not always recorded in the data. In practice, the nourishments involve the introduction of sand into the system, which is then transported seaward by incoming waves, resulting in a longshore drift along the coast. The sand continues to move until it reaches areas where the longshore drift slows down, allowing the sand to settle and form dunes and beaches.
It is also worth noting that the effects of nourishment are not confined to the coastal segments downdrift of the nourishment sites. Rather, stretches updrift from the nourishments are also affected, as the sand introduced into the system impacts the longshore drift and ultimately affects the entire coastline (Silva et al., 2021). Moreover, changing dune toe positions and the subsequent establishment of the beach profile impact the shoreline, which is the interface between land and water at mean sea level (MSL). As the dune toe shifts, the shoreline moves either seaward (accretion) or landward (erosion), making nourishments a crucial component of coastal protection efforts.
To create a comprehensive dataset of long-term shoreline changes and evaluate the efficacy of local beach nourishment projects along the coast of MWP, this study utilized the python-based CoastSat toolkit (Vos et al., 2019b). As noted earlier, several potential sources of errors and uncertainties are inherent to the method of establishing shoreline positions from satellite images. To accurately assess the precision of the space-borne measurement of the shoreline change, a multi-temporal LIDAR dataset from 2014 and 2018 was utilized as an independent, but valuable dataset to calculate rates of change (ROC), which were then compared to the ROC derived from the SDS. Supplementary Figure 1 gives an overview of the necessary computation steps for both datasets.
The CoastSat toolkit (Vos et al., 2019b) allows for easy extraction of subpixel resolution shorelines from satellite images using the GEE. Landsat missions (5, 7, and 8) from 1984 to 2022 were used in this analysis, with details presented in Supplementary Table 1. The instantaneously derived shorelines have an accuracy of approximately 10 m, as reported by Vos et al. (2019b), allowing for assessment of inter-annual and seasonal processes in coastal environments. The main errors in the detection are caused by white water from breaking waves and offset errors in orthorectification from data providers. For a more detailed introduction and validation of the CoastSat toolbox, see Vos et al. (2019b).
To identify the boundary between water and sand, CoastSat utilizes a processing method centered around the Modified Normalized Difference Water Index (MNDWI). This technique is based on analyzing the shortwave infrared (SWIR1) and green (G) channels of remote sensing imagery. The MNDWI is given by Xu (2006) as follows:
The extraction process with CoastSat can be refined by selecting images with a cloud cover of less than 10%, using a buffer of 300 m around cloud edges in which shoreline extraction is prohibited, and setting a minimum shoreline length of 800 m to avoid including short shorelines derived from clouds or other errors. These options balance the accuracy of the shoreline information with the number of images excluded.
For the analysis with CoastSat, 231 polygons along the coast (Figure 5) were derived, which delineate the coast into boxes of 1000 m length and 500 m width. For each of the created boxes, the available Landsat images between 1984 and 2022 were identified and subsequently downloaded from the GEE. In the timeframe and with the predefined threshold for the cloud cover, approx. 100 000 images were available and downloaded. In the next step, the shorelines were extracted from the images using CoastSat.
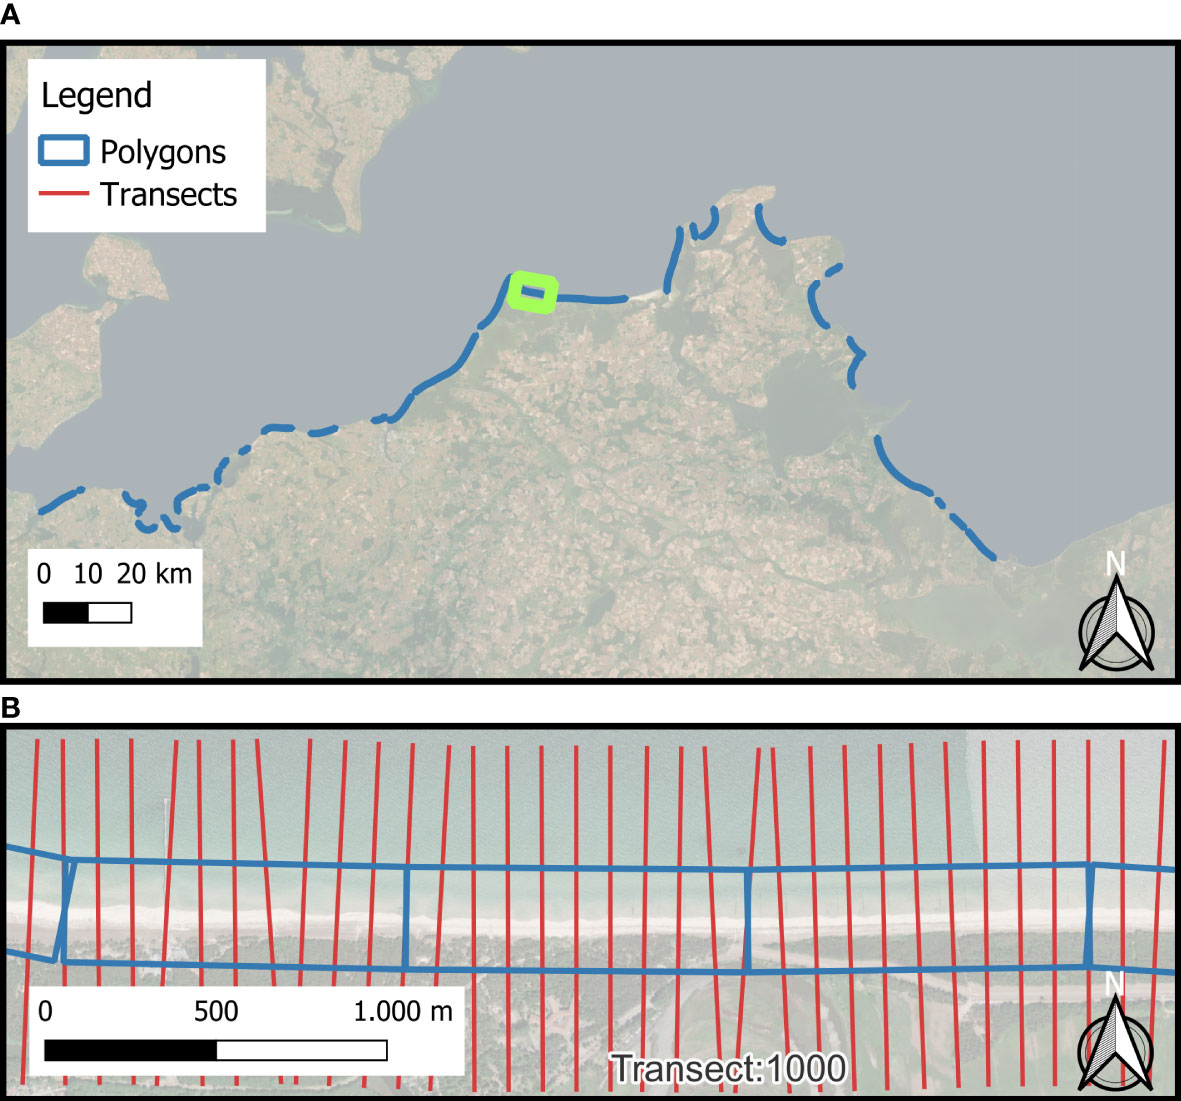
Figure 5 Delineation of the sandy shoreline segments into boxes for the SDS analysis with CoastSat. Zoomed area of (B) is marked as green outline in (A). Background map sources: Esri, DigitalGlobe, GeoEye, i-cubed, USDA FSA, USGS, AEX, Getmapping, Aerogrid, IGN, IGP, swisstopo, and the GIS User Community.
To analyze and evaluate the dynamics of the shoreline, transects perpendicular to the coastline were defined at 100 m intervals along the coast, incrementally numbered from east to west (Figure 5). The chosen interval allows the detection of shoreline change due to nourishments, which range in length from 200 m to 4300 m, while still facilitating a large-scale assessment of the coastal development. A total number of 2264 transects are generated in this manner and used to evaluate the shoreline change in the study area. After extraction of the shorelines from the satellite images, the intersection with the transects was computed. In consequence, both the temporal dynamics and relative spatial changes of the chainage (position of shoreline along each transect) along the coast are determined, deducing a valuable insight into the processes of eroding and accreting segments along the coast.
To establish a yearly mean location from the extracted shorelines, the absolute location of all shoreline locations per year was computed and averaged. Then, linear regression was performed on the data points of the horizontal location of the shoreline between 1984 and 2022 to obtain reliable estimates of the ROC in each transect. The ROC indicates whether a coastal section experiences erosion or deposition in reference to the entire coastal stretch over the available timespan. This assessment includes both the natural drivers of coastal change, e.g., storms, storm surges, and SLR, and the execution of nourishments to counteract coastal erosion. To systematize and adequately categorize the observed ROC, we followed and extended the approach proposed by Esteves and Finkl (1998), which groups change rates into different categories ranging from severely eroding (< -1.5 m/yr) to severely accreting (> 1.5 m/yr).
To account for the displacement of shorelines due to significant tidal changes, particularly noticeable in areas with gradual beach slopes, where minor tidal shifts can cause substantial horizontal shoreline movement, the following approach was adopted:
First, the corresponding water level from the nearest tide stations along the coast (Rostock or Sassnitz) was ascertained from a measured time series whenever a satellite image was taken. To exclude images impacted by excessive water levels, specific thresholds were established, limiting the water level to a range of -0.2 and +0.2 m below or above the MSL. This range encompasses the prevailing tidal range in the study area. By employing this technique, as described in Bishop-Taylor et al. (2021), an impartial dataset was created, which remains unaffected by extreme water levels resulting from tidal forces or storm surges.
To validate the accuracy of our approach following the objective to depict long-term morphological changes at the coast of MWP using remote sensing techniques, we worked with yearly ROC derived from the SDS and LIDAR data. Unlike other approaches (Luijendijk et al., 2018; Bishop-Taylor et al., 2021; Castelle et al., 2022), we validated the yearly ROC for virtually all transects between 2014 and 2018. To achieve this, we used multi-temporal LIDAR datasets of the entire coast, which are commissioned to third party companies by the state authorities on a yearly basis. However, due to limitations in the LIDAR data’s availability and reliability near mean sea level height, we compared the ROC computed from both data sources instead of comparing the absolute location of the shoreline.
To accomplish the computation of the geospatial data for the entire coast on an off-the-shelf machine, we used a workflow involving LAStools, QGIS, and Python scripts. The data was initially given in ASCII-XYZ format. We converted the data to the LAS format, merged it into one data file, thinned it to a 1 m grid, and extracted isolines in 0.1 m increments.
We used the 1.0 m isoline for the computation of yearly change rates, as it corresponded to the dune toe in this region, providing a reliable proxy for coastal change. Additionally, the 1 m isoline offered good coverage between the datasets being compared. Isolines from lower increments were affected by nourishments forming cusps, hindering the extraction of reliable ROC. We applied the same method which was used for the computation of shoreline change from the SDS to the isolines, resulting in values for the ROC in the same transects along the coast (Figure 6).
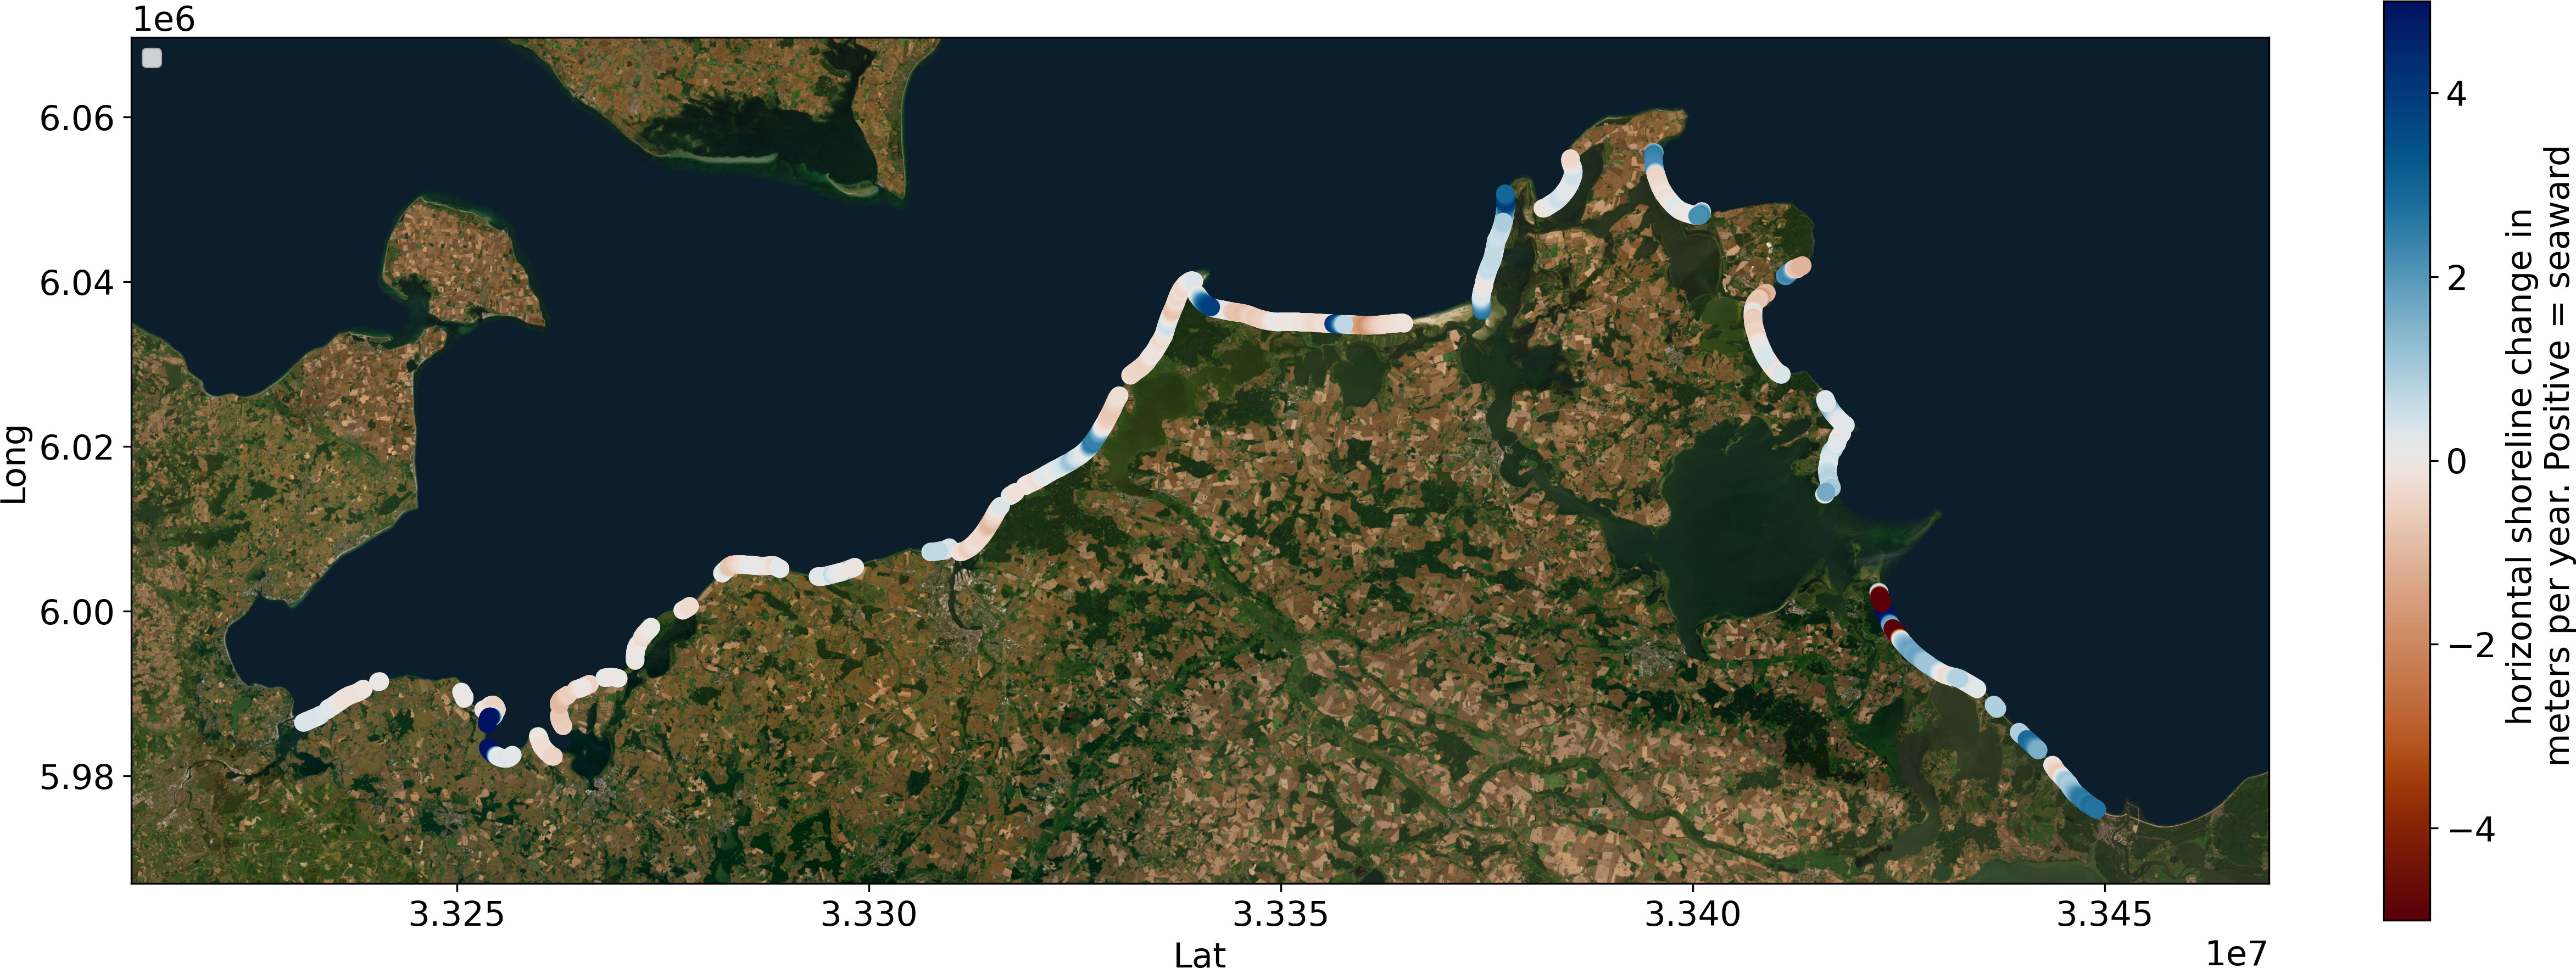
Figure 6 ROC along the coast, computed from LIDAR datasets from 2014 and 2018. Each dot represents a moving average of 5 adjacent transects, representing a balance between high resolution and clarity. Background: Esri–Source: Esri, i-cubed, USDA, USGS, AEX, GeoExe, Getmapping, Aerogrid, IGN, IGP, UPR-EGP, and the GIS User Community.
The present study conducted a validation of the results by comparing the ROC derived from LIDAR and SDS data. The validation results are presented in Figure 7, with Panel (A) highlighting a comprehensive but precise comparison of the ROC between the two independent datasets. Specifically, the comparison revealed that the RMSE from the raw data is 1.65 m per year (B), indicating a significant level of variability between the datasets. Though this variability is expected, due to the specific limitations of each data source, it nevertheless indicates reasonable agreement between the LIDAR and SDS data. However, to further refine the validation process and to obtain a higher accuracy, a moving average filter with a window width of 2500 m was applied to both datasets allowing to blur boundaries of the artificially set interrogation boxes/cells. This window width was chosen to approximate the shortest coastal length scale over which nourishments are typically executed. The moving average filter yielded an enhanced accuracy of the validation as it helped to reduce local variabilities, such as the presence of beach cusps or the uneven accumulation of sand in a groin field due to the alongshore transport direction. This filtering process was necessary to obtain a comprehensive understanding of the ROC in the coastal regions and to ensure that the data obtained is reliable and accurate. This filtering led to an improvement of the RMSE to 0.91 m.
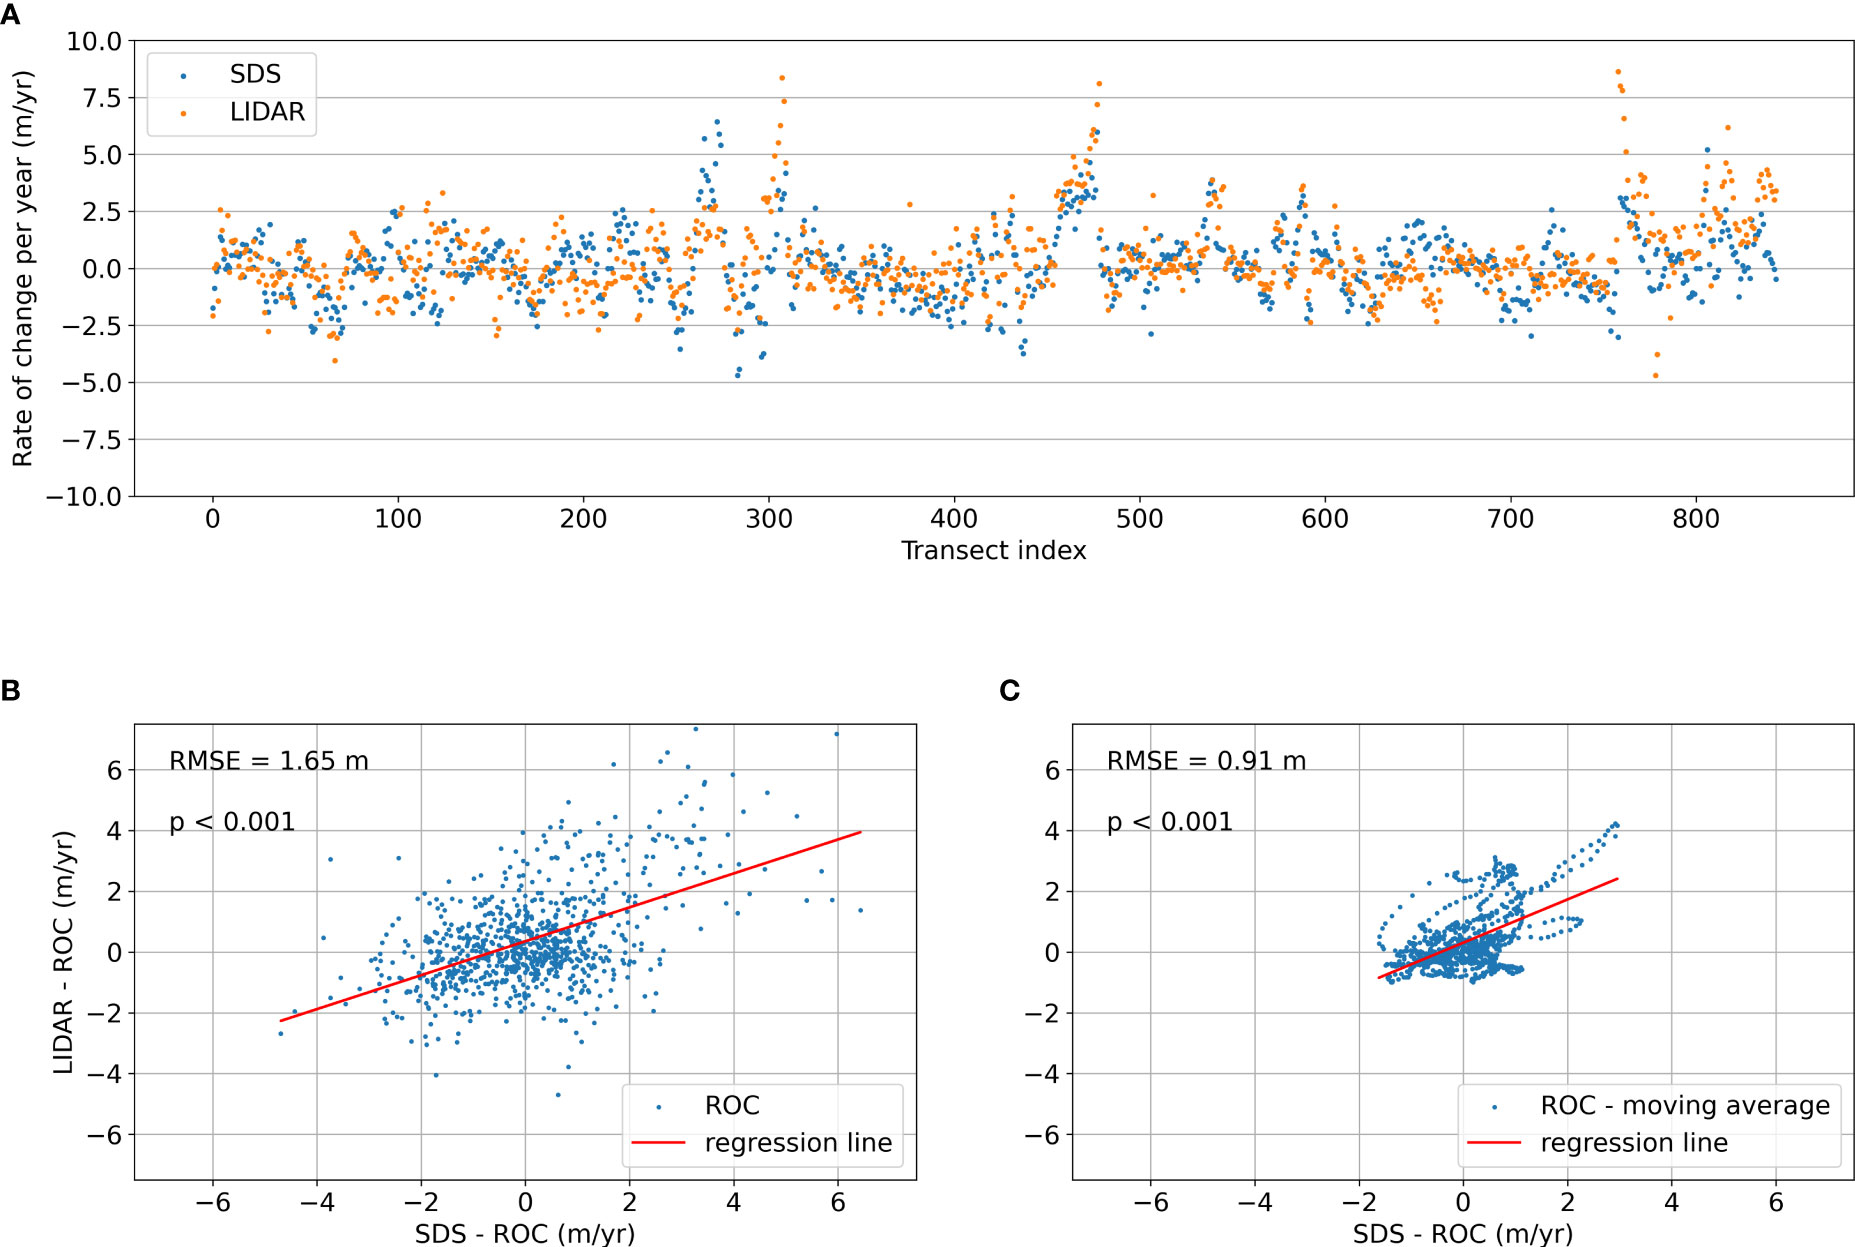
Figure 7 ROC derived from LIDAR and SDS plotted against each other. (A) ROC along the coast. Markers (blue = SDS, orange = LIDAR) depicting the long-term ROC in each transect where LIDAR and SDS were available. (B) Scatter plot of ROC from LIDAR and SDS against each other. (C) Scatter plot of ROC from LIDAR and SDS with a moving average filter (2500 m). The calculation of p-values<0.001 demonstrate the statistical significance of the obtained validation.
The results obtained from the validation process provide valuable insights into the efficacy of using LIDAR and SDS data for assessing the ROC in coastal regions. The application of a moving average filter with a window width of 2500 m proved to be a critical step in refining the validation process, reducing the RMSE, and ensuring the accuracy and reliability of the results. This methodology may prove useful in future studies examining coastal changes and the efficacy of different data sources in assessing these changes.
The study period of 1984 to 1995 was chosen to assess the natural evolution of the coastal system, with minimal volumes of nourishments conducted during this time and the master plan for coastal protection (StALU, 2021) not yet being in place. Due to the limited availability of SDS for the years 1990 and 1995, we excluded the SDS from these years from the analysis and based the computation of the changes for the natural period on the robust SDS data from the years 1984 to 1990. The results showed a heterogeneous development of the coast over this six-year period, with some hotspots exhibiting high erosion and accretion rates of up to 4.5 m/yr (Figures 8, 9). Additionally, the dataset reveals a heterogeneous development of the coast over these six years, with 33% of the transects exhibiting erosion, 49% remaining stable, and 18% experiencing accretion (Supplementary Table 2). The accreting segments are largely located near transect 2000 facing east and appear to accrete due to their sheltered position from the primary wave attack direction, which occurs from approximately 200-220°.
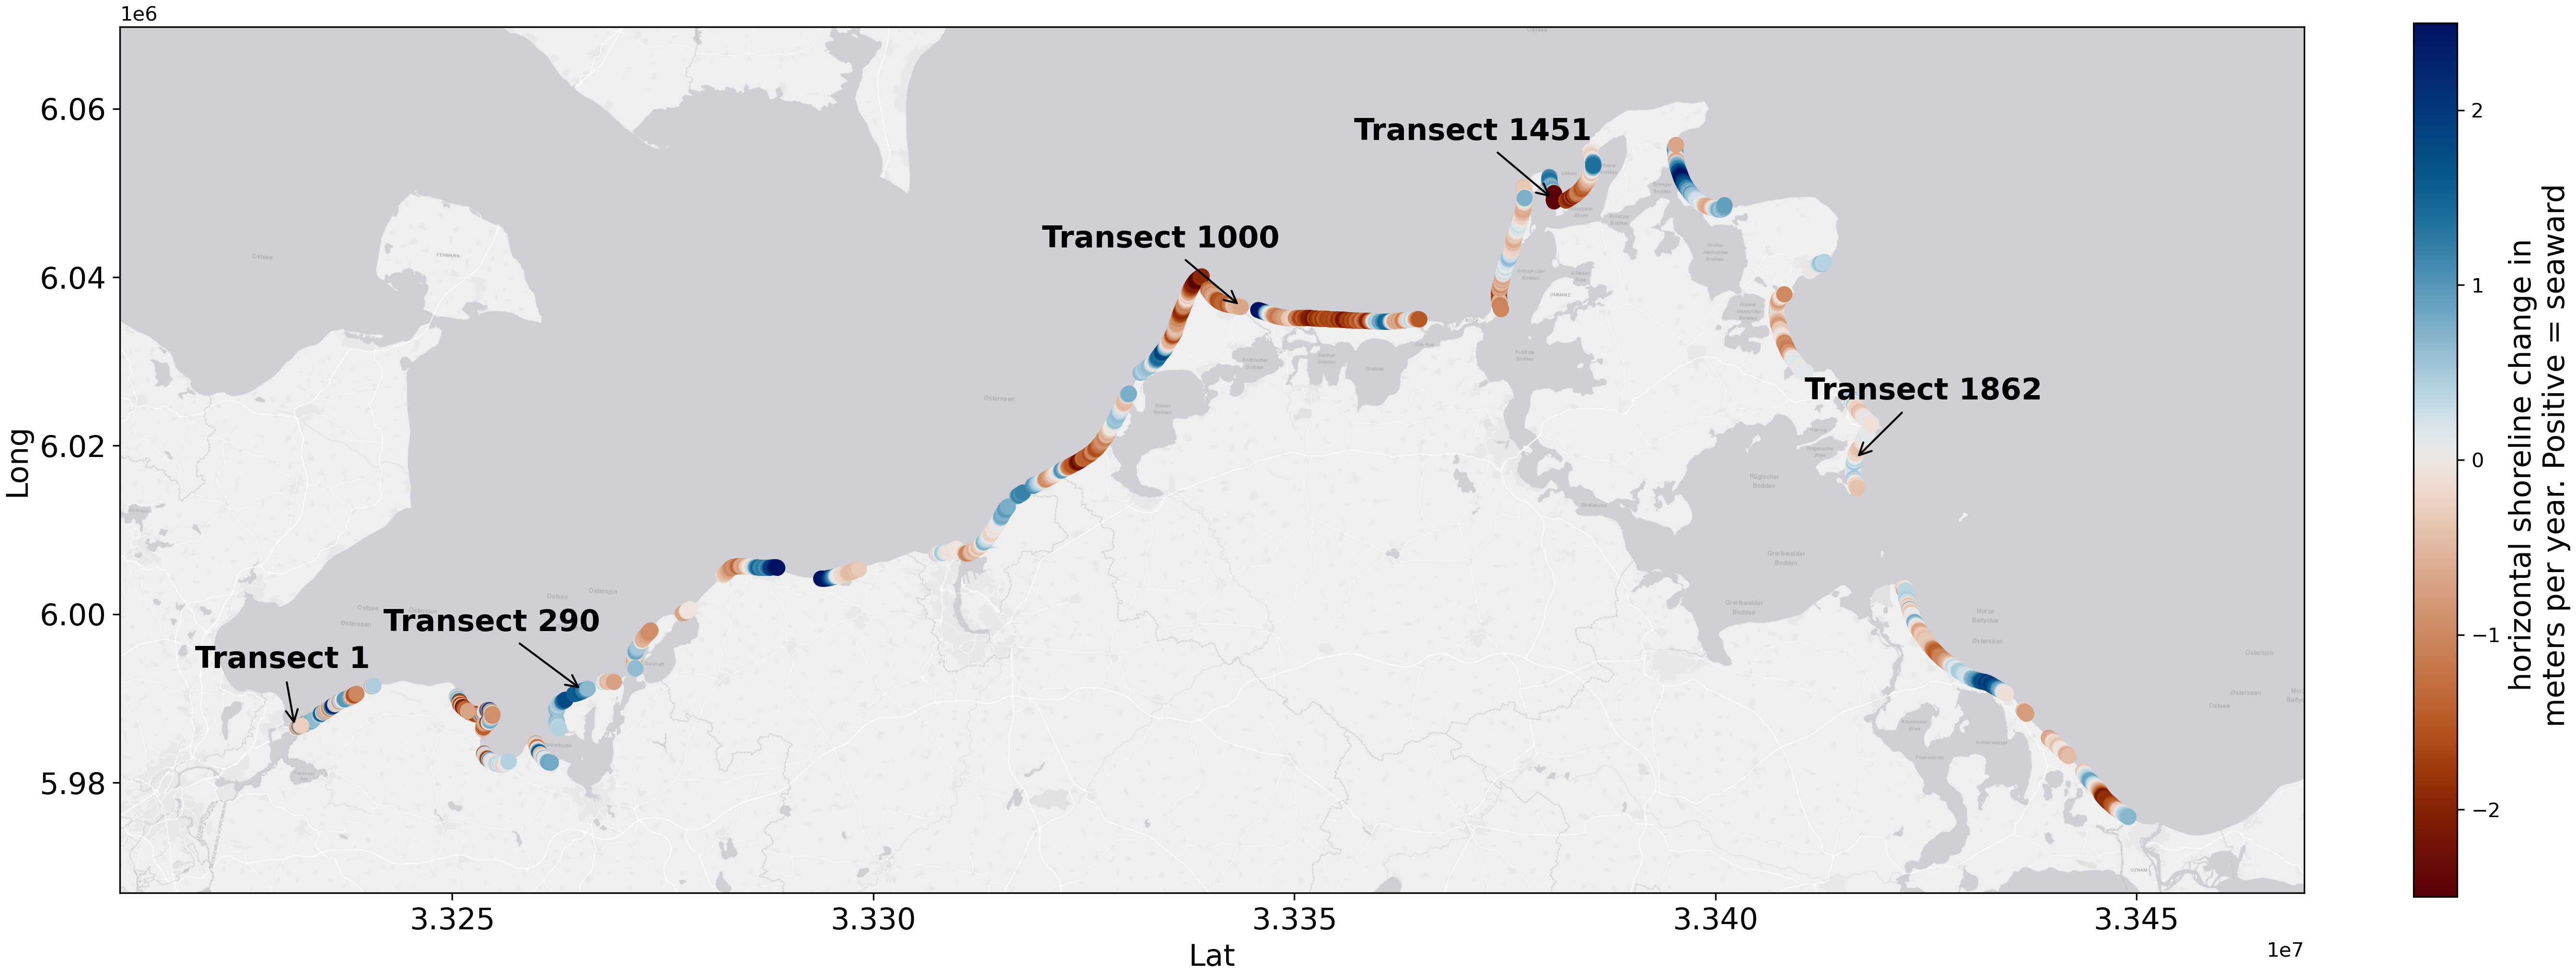
Figure 8 Yearly ROC along the coast from 1984 to 1990. Each dot represents a moving average of 5 adjacent transects, representing a balance between high resolution and clarity. Background Sources: Esri, DeLorme, HERE, MapmyIndia.
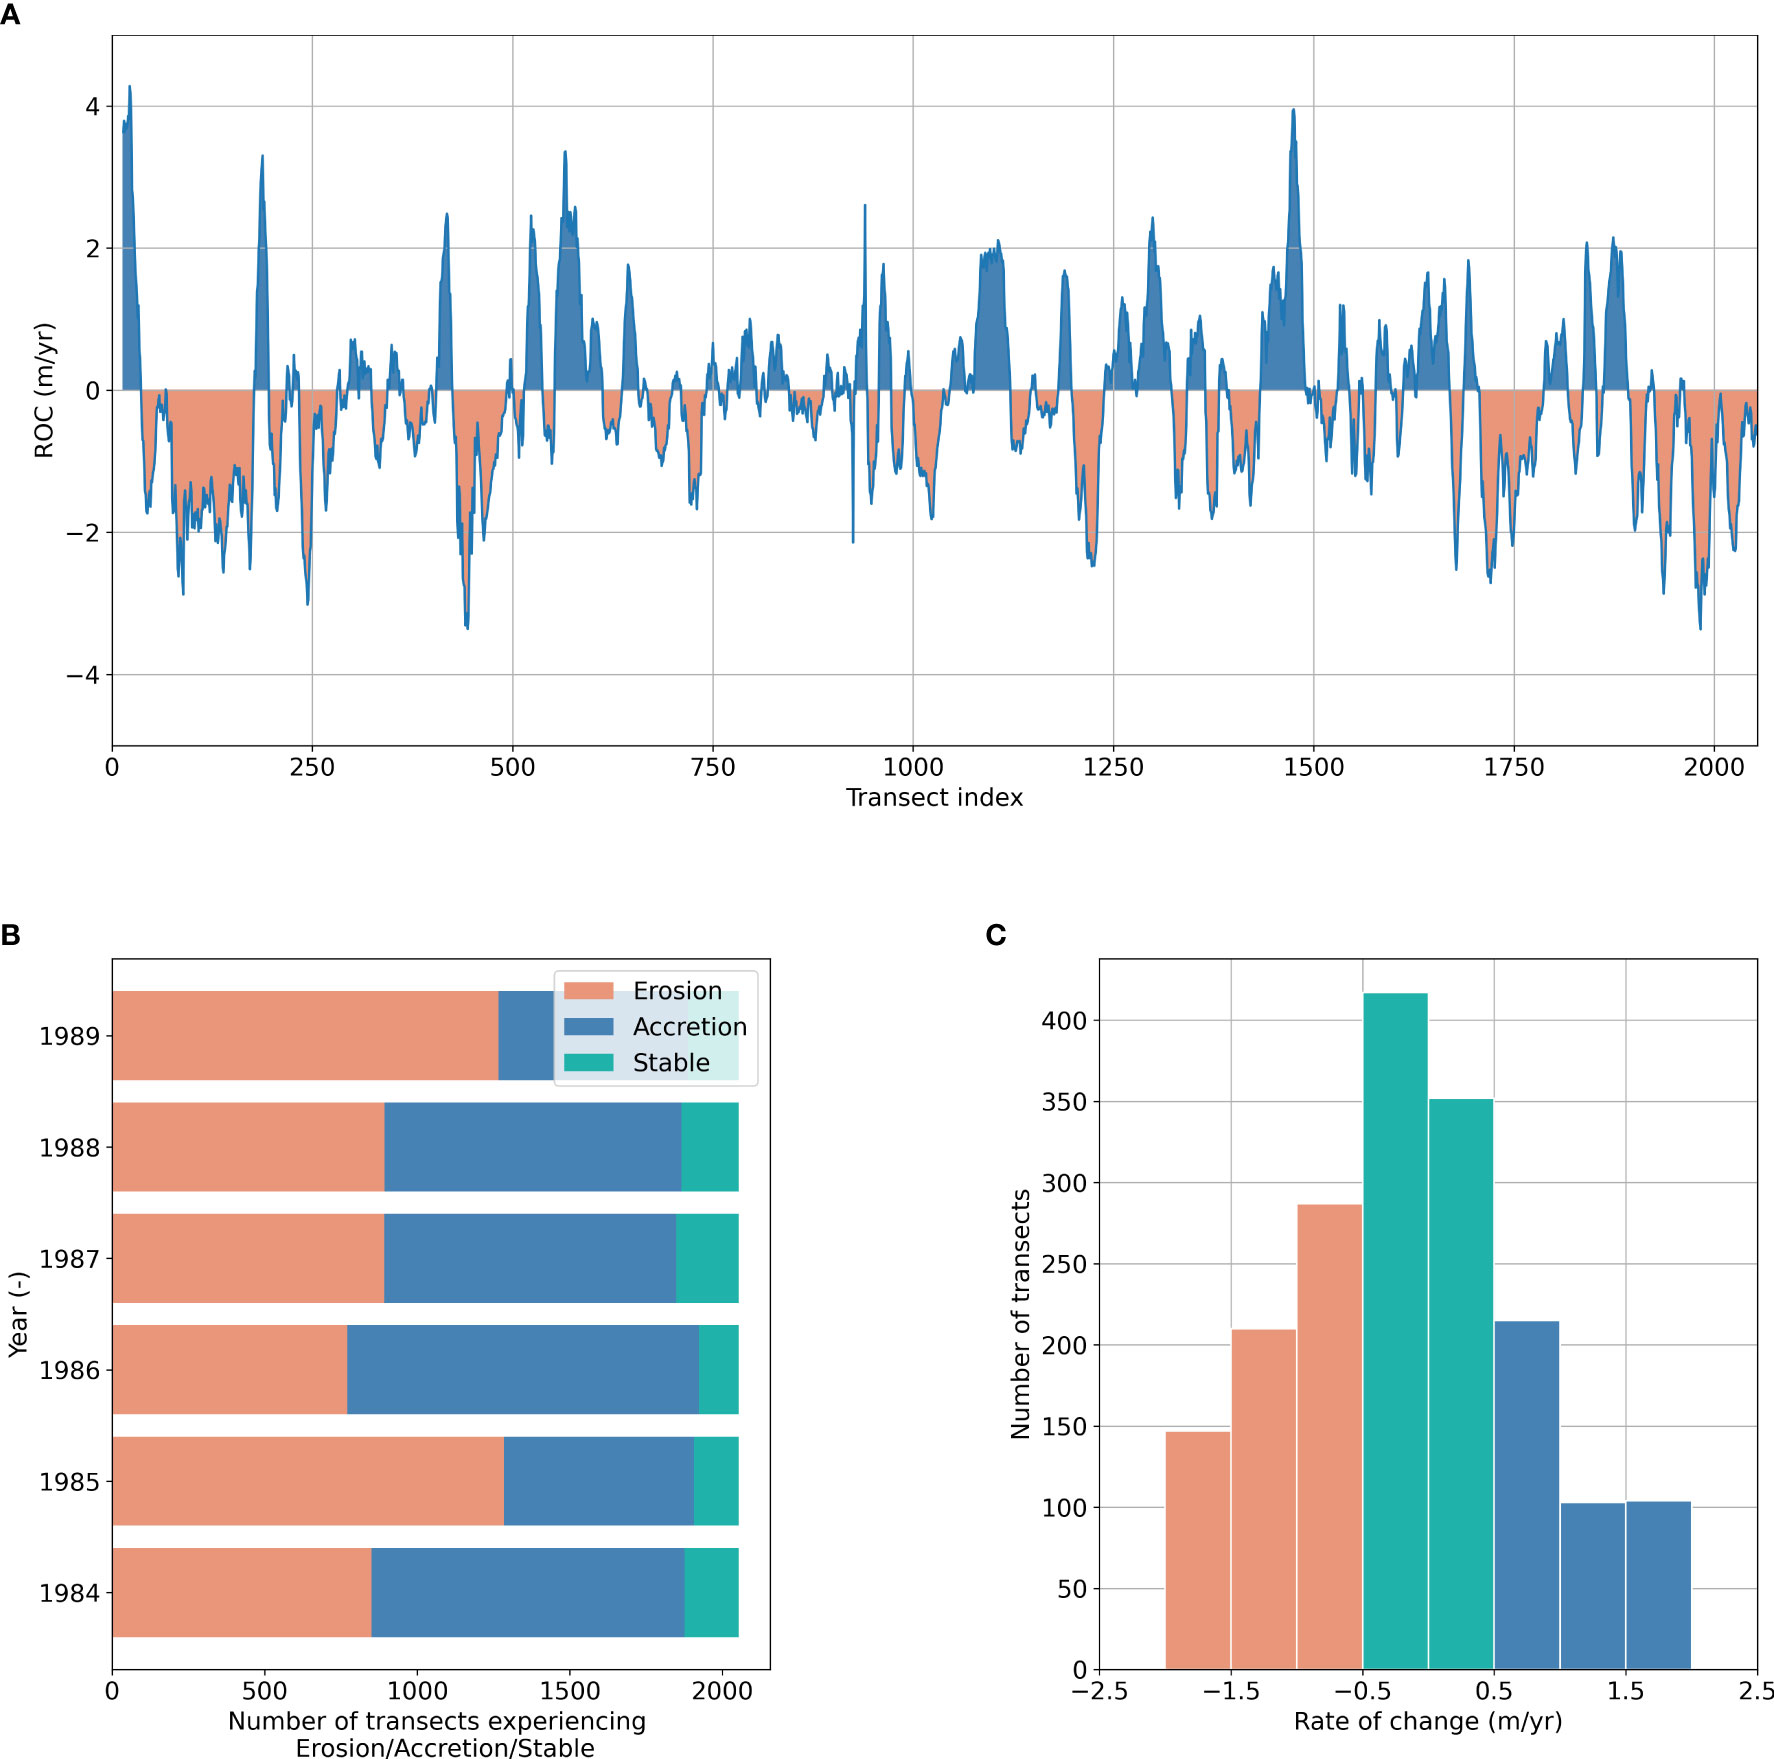
Figure 9 (A) Line plot of the ROC along the coast during the years 1984 to 1990. (B) Number of transects experiencing erosion (red), accretion (blue), and balance (green) for each year. (C) Histogram of the distribution of the ROC per number of transects. Note that transects, which experience erosion and deposition roughly equally over the years and are displayed as such in (B), could fall in the stable category in (C) when considering the linear regression over the entire period.
Figure 10 provides a comprehensive overview of the evolution of the coastline between 1996 and 2022, revealing the position of each detected shoreline in each transect relative to the mean position of the coastline in that transect. This approach allowed for a more nuanced understanding of the changes occurring along the coastline, enabling the observation of sudden changes either caused by severe storm impacts or nourishments more easily than when using a fixed reference point, such as a specific year. It is important to note that the study period was characterized by regular nourishments, with an estimated volume of approximately 16 million m³ of sand (~0.5 million m3/yr) added to the coastline during the entire timeframe (StALU, 2021).
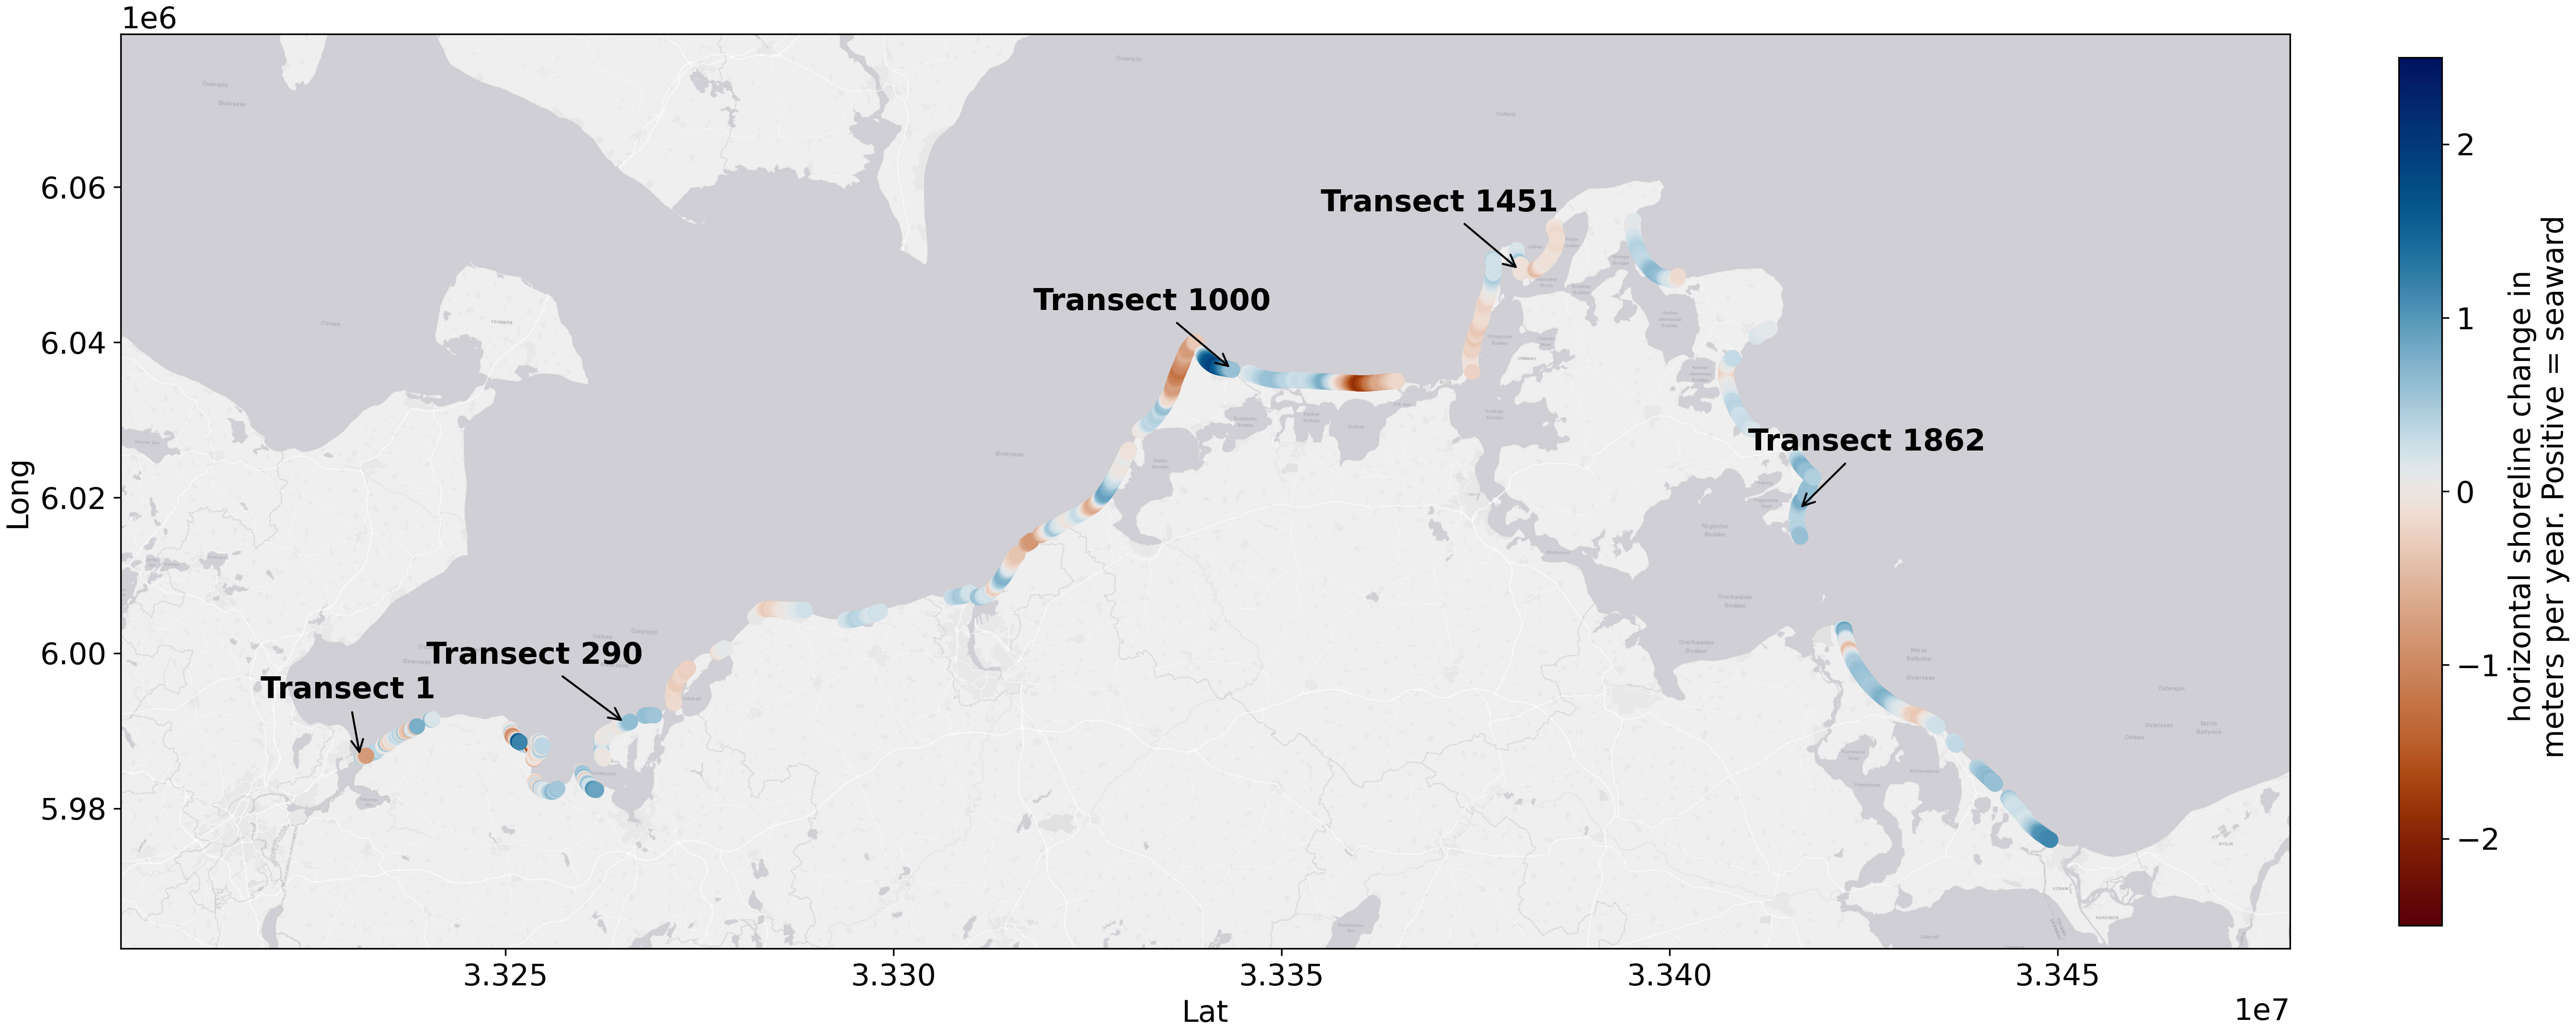
Figure 10 ROC along the coast from 1997 to 2020. Each dot represents a moving average of 5 adjacent transects, representing a balance between high resolution and clarity. Background Sources: Esri, DeLorme, HERE, MapmyIndia.
The results of our study reveal that the observed coast has demonstrated an accreting tendency over the study period, as depicted in Figure 11. Specifically, 23% of transects exhibited accretion rates of over 0.5 m/yr (Supplementary Table 3). The majority of transects (66%) remained stable, with change rates between -0.5 and 0.5 m/yr. A smaller share of transects (11%) exhibited erosive tendencies (<-0.5 m/yr).
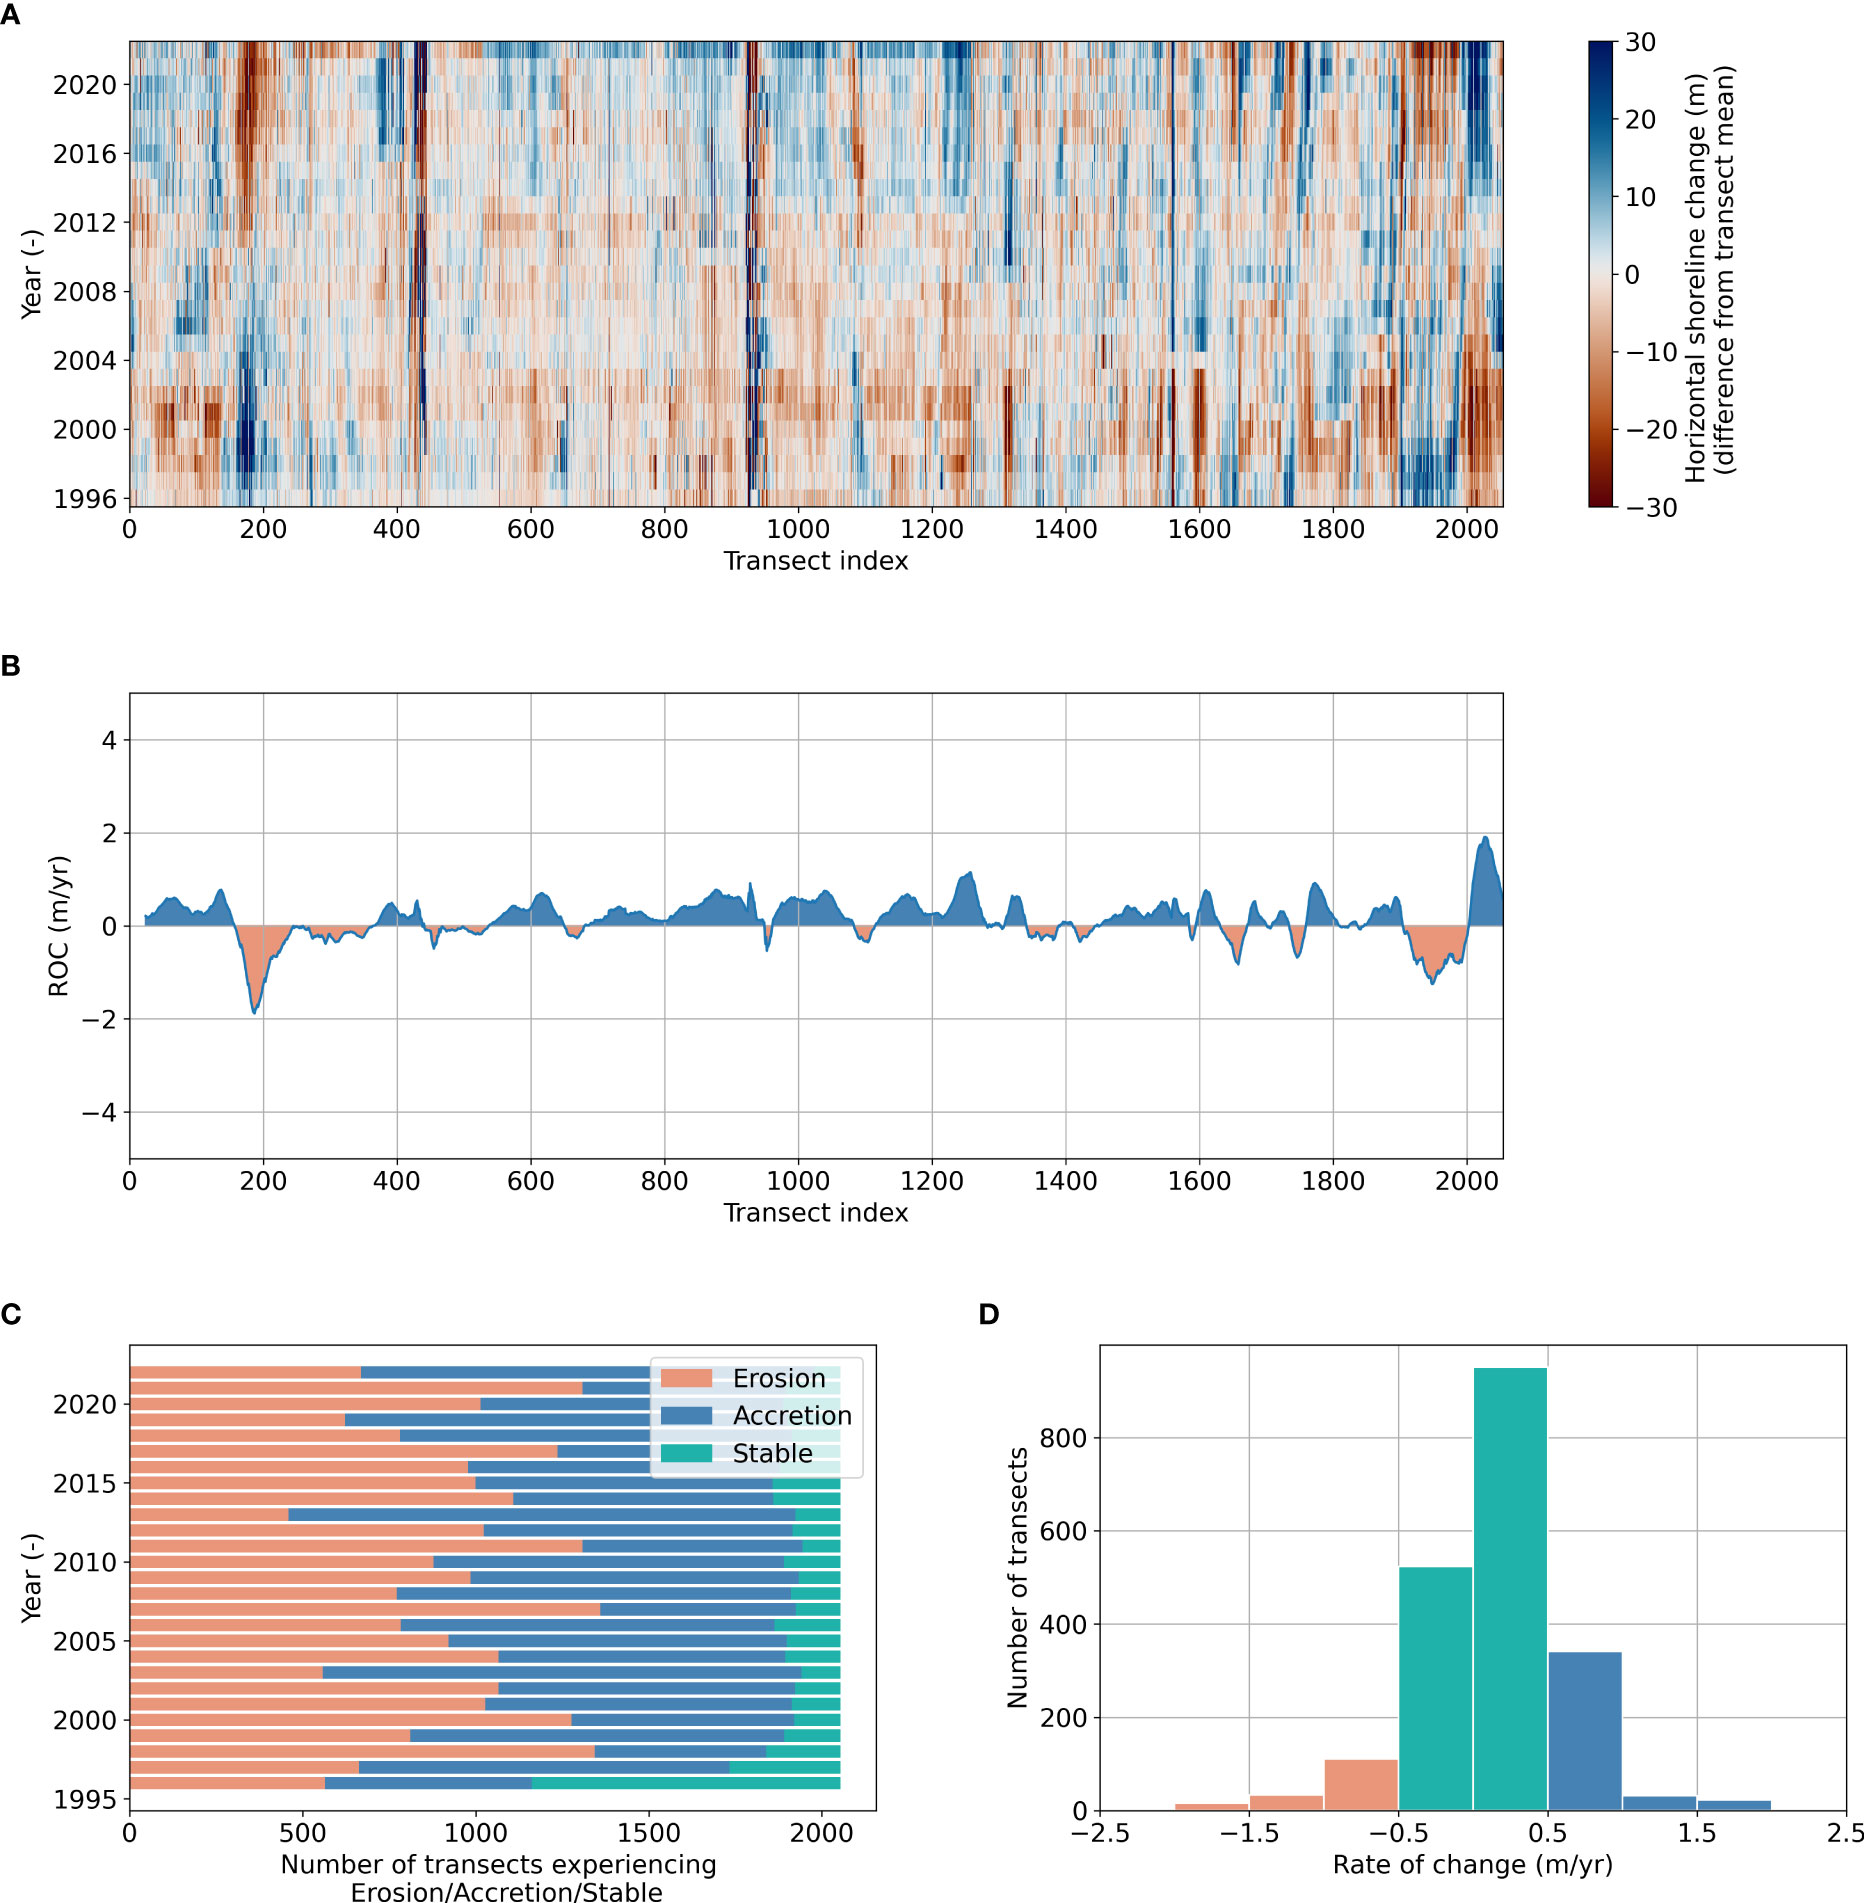
Figure 11 (A) Shoreline change compared to the mean of each transect over the years 1995 to 2022. (B) Line plot of the ROC along the coast. (C) Number of transects experiencing erosion (red), accretion (blue), and balance (green) for each year. (D) Histogram of the distribution of the ROC per number of transects. Note that transects, which experience erosion and deposition roughly equally over the years and are displayed as such in (C), could fall in the stable category in (D) when considering the linear regression over the entire period.
In this study, the CoastSat toolkit was utilized to assess coastline change over the Baltic Sea spanning a 38-year period (1984-2022). The integration of CoastSat with GEE allowed for a streamlined workflow, automating crucial and time-consuming processes, such as data acquisition, pre-processing, and analysis of long-term Landsat satellite images. This approach offers advantages in terms of automation, time-saving, consistency, and coverage compared to the StALU maps, which are generated through a time-consuming empirical approach based on manual digitization of historic maps (StALU, 2021) depicting the ROC in coastal areas over the past two centuries. The inclusion of a pre-trained Neural Network (NN) classifier (Civco, 1993) within the CoastSat processing framework enables accurate and fast detection of costal classes like ‘sand’, ‘water’, ‘white-water’, and ‘other land features’. The utilization of the Otsu algorithm (Otsu, 1979), based on the MNDWI, also provides an efficient solution for differentiating water from sand during coastline detection. However, it is important to acknowledge certain limitations. Inaccurate class detection may occur, resulting in misclassification or incomplete identification of coastal features. Additionally, generalizing the CoastSat approach to diverse coastal environments with varying geomorphological and ecological characteristics may pose challenges.
While we believe that the limitations we encountered did not have a significant impact on the main findings of our study, future research should consider implementing additional controls. Fine-tuning the pre-trained NN classifier or incorporating Artificial Intelligent (AI)/Deep Learning (DL) techniques can help mitigate the limitations associated with the CoastSat tool. It is worth noting that recent advancements in AI technology have greatly enhanced the accuracy of coastline extraction methods, leading to improved precision in coastal analysis and monitoring (Vitousek et al., 2023). However, these methods often require extensive training data and parameter settings, which can be time-consuming. Furthermore, the need for calibration in different geographical areas should be taken into account. In response to these challenges, researchers like Seale et al. (2022) have made valuable efforts in building global datasets for coastline extraction, aiming to enhance the applicability and generalization of AI-based approaches in coastal studies. Integrating such strategies into CoastSat has the potential to yield even more reliable and robust results.
The StALU has produced maps that illustrate the ROC that have occurred in the past two centuries on a purely empirical basis (StALU, 2021). These maps, which are based on manually digitized historic maps, provide a valuable reference point for studying the natural dynamics of the coastal system before significant human interventions, such as nourishments, were carried out. Although the manual digitization process may introduce some errors and uncertainties, the resulting maps offer a reliable comparison to the current anthropogenically influenced system. Yet, our analysis and subsequent evaluation rely on the assumption that the coastal system during the period from 1984 to 1990 (Figure 9) had neither yet been heavily influenced nor modified by human activities. Our findings indicate that approximately 33% of the coast experienced erosion, while 18% accreted, and 49% remained stable, which is consistent with the patterns observed in the historic maps.
In contrast to the undisturbed period, the analysis of the period from 1996 to 2022 revealed a highly managed and maintained coastal system, where approximately half of the sandy transects were nourished regularly, and new groins were constructed, refurbished, or reconstructed. Our results show that in this period, 11% of the transects experienced erosion, 23% fell into the accreting category, and 66% showed a stable development. Between the more natural period to the nourished period, the share of stable or accreting transects rose from 67% to 89%, while the share of eroding segments fell by 20%.
The change from the historical ROC shown in the maps by the authorities and in our assessment of the natural period cannot be attributed to specific human interventions (e.g., port and jetty construction, river dredging, coastal protection infrastructure, and sand nourishments). Nevertheless, single sand nourishment events are evident in the dataset (Figure 11A) and nourishments are the prominent form of coastal protection measures in the area. We therefore suggest that the nourishments are indeed the single most dominant driver of coastal change in this area. Interpreting this change as part of the coastal protection strategy, the nourishments halt the erosion and are effective in prohibiting the loss of land.
Still, though the strategy seems to have halted erosion, nourishments are not able to reverse erosive trends in most instances, instead the erosion is concealed by continuous replenishing of the sand resources on the beach and dune. The same large-scale masking of the erosive trends by continuous nourishing of a coast was found in case of the Atlantic coastline of the US (Armstrong and Lazarus, 2019). They also identified the possibility of a system trap, indicating that by masking the erosion the underlying causes are not approached, instead the system becomes dependent on continuous manipulation. The perceived reduced coastal hazard then leads to increased construction of infrastructure and a further concentration of population in the area. Due to the system trap, the underlying increasing hazard due to SLR and a possible increase in storm frequency and severeness is not taken into consideration. The same development could hold true for the Baltic Sea and a careful assessment of the underlying coastal hazard is necessary.
The drivers of coastal changes on short-term time scales, e.g., storm impacts and nourishments, and long-term time scales, e.g., SLR and sediment availability, are not readily discernible in the dataset. Instead, the naturally induced changes are often superimposed by the counteractive effects of nourishment activities. Nonetheless, the empirical StALU maps and the present study provide crucial insights into the natural and anthropogenic processes that shape the coastal system, which can inform future management strategies for coastal resilience. The data also revealed a clear turning point in 1997, after which the coast predominantly accreted rather than eroded. These findings suggest that the practical measures taken by state authorities to stabilize the coast, such as nourishments and coastal protection infrastructure, have had a positive impact on the coastline’s long-term evolution. However, some areas still experience erosion. For instance, the Huckemauer (Figure 1) is a human-made structure that contributed to erosive spots in the adjacent segments. Additionally, there are gaps in the groins that lead to the creation of erosion hotspots, such as the one found at km 73 along the coast (Kloster/Dierhagen). These recessive coastal areas are hotspots for further attention and possible action.
Nowadays, coastal monitoring predominantly employs GPS or UAVs for data collection when surveying post nourishments changes, evidenced by numerous studies (Muzirafuti et al., 2022; Pinto et al., 2022; Tadić et al., 2022). However, these investigations are often limited to the period directly following nourishments and confined to nourished areas, excluding adjacent regions due to temporal and financial constraints. As such, while they provide insights into short-term morphological sand redistribution post-nourishment, long-term impacts on neighboring coastal regions and the broader coastline remain unexplored. A notable exception from these techniques are LIDAR-based studies such as the study by Nicolae Lerma et al. (2022), who observed a large 230 km coastal strip annually for 11 years. Such studies, while highly informative, are scarce, recent, and costly, limiting their widespread availability. In contrast, Earth observation-derived products offer a more accessible alternative, providing the extensive temporal scales necessary for comprehensive coastal monitoring.
We aimed to demonstrate the potential of satellite-based Earth observation for shoreline extraction with minimal human intervention. To achieve this, we did not manually discard satellite images with a poor representation of the shoreline, which may have introduced outliers and bias to the data. Nevertheless, our validation showed the utility of satellite images for this task. However, the available validation dataset is limited in its temporal extent and biased towards more recent coastal developments. Therefore, the accuracy of the SDS in the 1990s and 2000s may be overestimated. Additionally, the validation and resulting SDS are limited to sandy parts of the coast and exclude the cliffed parts, where CoastSat in its current implementation cannot be reliably used due to small sandy areas in front of cliffs, which are otherwise mostly composed of gravel. Another limitation of this study is the absence of a tidal correction of the results, which may not be feasible in meso- to macro-tidal environments where tidal fluctuations can induce large horizontal offsets. The validation approach compared ROC derived from SDS at MSL with ROC obtained from isolines located 1.0 m above MSL derived from LIDAR data. As a result, the computed accuracy of the ROC is likely too conservative. LIDAR surveys that map the beach near and below MSL would reduce this uncertainty. The comparison was intentionally conducted with the ROC values instead of using the absolute position. In this way, we could robustly compare the raw yearly ROC instead of relying on a reprojection of either SDS or isolines to the same height, possibly introducing bias into the data.
Overall, our study demonstrates the potential of satellite-based Earth observation for shoreline extraction, but these limitations must be considered when interpreting the results and applying them to other coastal environments. Future studies may explore ways to address these limitations and improve the accuracy and applicability of satellite-based methods for coastal monitoring.
The availability of Landsat images for the study area between 1990 and 1997 was limited (Supplementary Figure 3), which may have introduced an error in the computed ROC. The limited availability is due to budgetary constraints and operational issues that affected the acquisition of satellite images (Goward et al., 2006). The comparatively recent launch of Sentinel-2 with its higher revisit time (5 days) and extensive coverage of the European continent offers promising opportunities to improve the accuracy of future datasets derived with the proposed method. This will allow for a more comprehensive assessment of coastal dynamics, especially in areas with limited Landsat coverage.
In this study, we demonstrated how freely available satellite images can be used to understand large-scale coastline developments along the coast of MWP. By validating the resulting dataset with an independent LIDAR dataset, we achieved a RMSE of up to 0.91 m, highlighting the accuracy of freely available satellite images for mapping long-term changes. The method effectively handles a wide array of conditions in sandy environments as proven by the validation of virtually all transects encompassing the entire study area. By mapping the coastal evolution from a natural state (1984-1990) to a managed period (1996-2022), which was characterized by the addition of 16 million m3 of sand to the coastline, we gained valuable insights into long-term coastal dynamics. Our dataset of coastal change for MWP is the first that provides information about the changes in the coastline stretching back to 1984, or any data that encompasses extensive portions of the coast, much less the entire coastline. The transition between the natural and the managed period is marked by a significant shift in coastal dynamics, as erosive trends were reduced and the number of stable and accreting transects increased – a change potentially attributed to decades of sand nourishments. While determining the exact impact of sediment supply, SLR, or climate drivers requires future work, this dataset offers vital insights for coastal authorities. It enhances understanding of past sand nourishments and supports decisions on allocating sand resources in the future. In absence of any drastic changes to the protection strategy, the coast of MWP will remain dependent on further sand supply to avoid loss of land and floodings, raising the question of how long the available sand will last and if NbS or a return to hard structures are the answer in the long-term.
The raw data supporting the conclusions of this article will be made available by the authors, without undue reservation.
JT concepted and designed the study. CJ produced Figures 2, 3 and Supplementary Figure 2. AM and JT produced Supplementary Figure 1. JT wrote the first draft of the manuscript. TS acquired funding and wrote the proposal for the project leading to this publication. All authors contributed to the article and approved the submitted version.
This research was conducted as part of the joint research project ECAS-Baltic which was funded by the German Federal Ministry of Education and Research under the funding code 03F0860E.
We thank the StALU for answering detailed questions about the coastal protection strategy of MWP and supplying the LIDAR dataset. The publication of this article was in part funded by the Open Access Fund of Leibniz Universität Hannover.
The authors declare that the research was conducted in the absence of any commercial or financial relationships that could be construed as a potential conflict of interest.
All claims expressed in this article are solely those of the authors and do not necessarily represent those of their affiliated organizations, or those of the publisher, the editors and the reviewers. Any product that may be evaluated in this article, or claim that may be made by its manufacturer, is not guaranteed or endorsed by the publisher.
The Supplementary Material for this article can be found online at: https://www.frontiersin.org/articles/10.3389/fmars.2023.1207524/full#supplementary-material
Amani M., Ghorbanian A., Ahmadi S. A., Kakooei M., Moghimi A., Mirmazloumi S. M., et al. (2020). Google Earth engine cloud computing platform for remote sensing big data applications: a comprehensive review. EEE J. Sel. Top. Appl. Earth Observations Remote Sens. 13, 5326–5350. doi: 10.1109/JSTARS.2020.3021052
Armstrong S. B., Lazarus E. D. (2019). Masked shoreline erosion at Large spatial scales as a collective effect of beach nourishment. Earth’s Future 7 (2), 74–84. doi: 10.1029/2018EF001070
Baptista P., Bastos L., Bernardes C., Cunha T., Dias J. (2008). Monitoring sandy shores morphologies by DGPS–a practical tool to generate digital elevation models. J. Coast. Res. 24 (6), 1516–1528. doi: 10.2112/07-0861.1
Barbier E. B., Hacker S. D., Kennedy C., Koch E. W., Stier A. C., Silliman B. R. (2011). The value of estuarine and coastal ecosystem services. Ecol. Monogr. 81 (2), 169–193. doi: 10.1890/10-1510.1
Bishop-Taylor R., Nanson R., Sagar S., Lymburner L. (2021). Mapping australia’s dynamic coastline at mean sea level using three decades of landsat imagery. Remote Sens. Environ. 267, 112734. doi: 10.1016/j.rse.2021.112734
Björkqvist J.-V., Lukas I., Alari V., van Vledder G., Hulst S., Pettersson H., et al. (2018). Comparing a 41-year model hindcast with decades of wave measurements from the Baltic Sea. Ocean Eng. 152, 57–71. doi: 10.1016/j.oceaneng.2018.01.048
Burt J., Bartholomew A., Bauman A., Saif A., Sale P. F. (2009). Coral recruitment and early benthic community development on several materials used in the construction of artificial reefs and breakwaters. J. Exp. Mar. Biol. Ecol. 373 (1), 72–78. doi: 10.1016/j.jembe.2009.03.009
Carter R. W. G., Johnston T. W., McKenna J., Orford J. D. (1987). Sea-Level, sediment supply and coastal changes: examples from the coast of Ireland. Prog. Oceanogr. 18 (1), 79–101. doi: 10.1016/0079-6611(87)90027-9
Castelle B., Masselink G., Scott T., Stokes C., Konstantinou A., Marieu V., et al (2021). Satellite-derived shoreline detection at a high-energy meso-macrotidal beach. Geomorphology 383, 107707. doi: 10.1016/j.geomorph.2021.107707
Castelle B., Ritz A., Marieu V., Nicolae Lerma A., Vandenhove M. (2022). Primary drivers of multidecadal spatial and temporal patterns of shoreline change derived from optical satellite imagery. Geomorphology 413, 108360. doi: 10.1016/j.geomorph.2022.108360
Civco D. L. (1993). Artificial neural networks for land-cover classification and mapping. Int. J. Geographical Inf. Syst. 7 (2), 173–186. doi: 10.1080/02693799308901949
Cohen-Shacham E., Walters G., Janzen C., Maginnis S. (Eds.) (2016). Nature-based solutions to address global societal challenges (Switzerland: IUCN International Union for Conservation of Nature). doi: 10.2305/IUCN.CH.2016.13.en
Dodet G., Melet A., Ardhuin F., Bertin X., Idier D., Almar R. (2019). The contribution of wind-generated waves to coastal sea-level changes. Surveys Geophysics 40 (6), 1563–1601. doi: 10.1007/s10712-019-09557-5
Esteves L. S., Finkl C. W. (1998). The problem of critically eroded areas (CEA): an evaluation of Florida beaches. J. Coast. Res. 26, 11–18. Available at: https://www.jstor.org/stable/25736114.
Goward S., Arvidson T., Williams D., Faundeen J., Irons J., Franks S. (2006). Historical record of landsat global coverage: mission operations, NSLRSDA, and international cooperator stations. Photogrammetric Eng. Remote Sens. 72, 1155–1169. doi: 10.14358/PERS.72.10.1155
Groll N., Weisse R. (2017). A multi-decadal wind-wave hindcast for the north Sea 1949–2014: coastDat2. Earth System Sci. Data 9 (2), 955–968. doi: 10.5194/essd-9-955-2017
Hinkel J., Lincke D., Vafeidis A. T., Perrette M., Nicholls R. J., Tol R. S. J., et al. (2014). Coastal flood damage and adaptation costs under 21st century sea-level rise. Proc. Natl. Acad. Sci. 111 (9), 3292–3297. doi: 10.1073/pnas.1222469111
Kaehler C., Cantré S., Schweiger C., Saathoff F. (2022). Dune erosion at the German Baltic coast–investigation and analysis of a Large-scale field experiment compared to life dunes. J. Mar. Sci. Eng. 10 (11), 1605. doi: 10.3390/jmse10111605
Kelln J., et al. (2022). “Monthly sea level from tide gauge station warnemuende at the German Baltic coastline,” in Monthly sea level from tide gauge stations at the German Baltic coastline (AMSeL_Baltic Sea). Ed. Kelln J., et al (PANGAEA). doi: 10.1594/PANGAEA.904857
Kelln J., Dangendorf S., Gräwe U., Steffen H., Jensen J., et al. (2022). Entwicklung des mittleren meeresspiegels entlang der südwestlichen ostseeküste. Die Küste 91. doi: 10.18171/1.091107
Lehfeldt R., Melles J. (2014) Marine dateninfrastruktur, deutschland (MDI-DE). Available at: https://hdl.handle.net/20.500.11970/110316.
Luijendijk A., Hagenaars G., Ranasinghe R., Baart F., Donchyts G., Aarninkhof S. (2018). The state of the world’s beaches. Sci. Rep. 8 (1), 6641. doi: 10.1038/s41598-018-24630-6
Madsen K. S., Høyer J. L., Fu W., Donlon C. (2015). Blending of satellite and tide gauge sea level observations and its assimilation in a storm surge model of the north Sea and Baltic Sea. J. Geophysical Res. (Oceans) 120, 6405–6418. doi: 10.1002/2015JC011070
Madsen K. S., Høyer J. L., Suursaar Ü., She J., Knudsen P. (2019). Sea Level trends and variability of the Baltic Sea from 2D statistical reconstruction and altimetry. Front. Earth Sci. 7. doi: 10.3389/feart.2019.00243
Muzirafuti A., Randazzo G., Lanza S. (2022). “UAV application for coastal area monitoring: a case study of Sant’Alessio siculo, Sicily,” in 022 IEEE International Workshop on Metrology for the Sea; Learning to Measure Sea Health Parameters (MetroSea). (Milazzo, Italy: IEEE), 143–147. doi: 10.1109/MetroSea55331.2022.9950841
Nanson R., Bishop-Taylor R., Sagar S., Lymburner L. (2022). Geomorphic insights into australia’s coastal change using a national dataset derived from the multi-decadal landsat archive. Estuarine Coast. Shelf Sci. 265, 107712. doi: 10.1016/j.ecss.2021.107712
Nicholls R. J., Hinkel J., Lincke D., van der Pol T. (2019). Global investment costs for coastal defense through the 21st century. (Washington, DC: World Bank). doi: 10.1596/1813-9450-8745
Nicolae Lerma A., Castelle B., Marieu V., Robinet A., Bulteau T., Bernon N., et al. (2022). Decadal beach-dune profile monitoring along a 230-km high-energy sandy coast: aquitaine, southwest France. Appl. Geogr. 139, 102645. doi: 10.1016/j.apgeog.2022.102645
Oppenheimer M., Glavovic B. C., Hinkel J., van de Wal R., Magnan A. K., Abd-Elgawad A., et al. (2019). Sea Level Rise and Implications for Low-Lying Islands, Coasts and Communities. Cambridge, UK and New York, US: IPCC. Available at: https://www.cambridge.org/core/product/identifier/9781009157964/type/book.
Otsu N. (1979). A threshold selection method from Gray-level histograms. IEEE Trans. Systems Man Cybernetics 9 (1), 62–66. doi: 10.1109/TSMC.1979.4310076
Pinto C. A., Taborda R., Andrade C., Baptista P., Silva P. A., Mendes D., et al. (2022). Morphological development and behaviour of a shoreface nourishment in the Portuguese Western coast. J. Mar. Sci. Eng. 10 (2), 146. doi: 10.3390/jmse10020146
Ranasinghe R., Callaghan D., Stive M. J. F. (2012). Estimating coastal recession due to sea level rise: beyond the bruun rule. Climatic Change 110 (3), 561–574. doi: 10.1007/s10584-011-0107-8
Saengsupavanich C., Ariffin E. H., Yun L. S., Pereira D. A. (2022). Environmental impact of submerged and emerged breakwaters. Heliyon 8, e12626. doi: 10.1016/j.heliyon.2022.e12626
Saengsupavanich C., Pranzini E., Ariffin E. H., Yun L. S. (2023). Jeopardizing the environment with beach nourishment. Sci. Total Environ. 868, 161485. doi: 10.1016/j.scitotenv.2023.161485
Salman A., Lombardo S., Doody P. (2004). Living with coastal erosion in Europe: Sediment and Space for Sustainability. EUCC. Available at: http://www.eurosion.org/reports-online/part4.pdf. (Accessed December 6, 2023).
Schoonees T., Gijón Mancheño A., Scheres B., Bouma T. J., Silva R., Schlurmann T., et al. (2019). Hard structures for coastal protection, towards greener designs. Estuaries Coasts 42 (7), 1709–1729. doi: 10.1007/s12237-019-00551-z
Scyphers S. B., Powers S. P., Heck K. L. (2015). Ecological value of submerged breakwaters for habitat enhancement on a residential scale. Environ. Manage. 55 (2), 383–391. doi: 10.1007/s00267-014-0394-8
Seale C., Redfern T., Chatfield P., Luo C., Dempsey K. (2022). Coastline detection in satellite imagery: a deep learning approach on new benchmark data. Remote Sens. Environ. 278, 113044. doi: 10.1016/j.rse.2022.113044
Silva A. P., Vieira da Silva G., Strauss D., Murray T., Tomlinson R. (2021). Updrift morphological impacts of a coastal protection strategy. how far and for how long? Mar. Geol. 441, 106625. doi: 10.1016/j.margeo.2021.106625
StALU (2021). Regelwerk küstenschutz mecklenburg-vorpommern. Available at: https://www.stalu-mv.de/mm/Themen/K%C3%BCstenschutz/Regelwerk-K%C3%BCstenschutz-Mecklenburg%E2%80%93Vorpommern/ (Accessed 6 January 2023).
Staudt F., Gijsman R., Ganal C., Mielck F., Wolbring J., Hass H. C., et al. (2021). The sustainability of beach nourishments: a review of nourishment and environmental monitoring practice. J. Coast. Conserv. 25 (2), 34. doi: 10.1007/s11852-021-00801-y
Stive M. J. F., Aarninkhof S. G. J., Hamm L., Hanson H., Larson M., Wijnberg K. M., et al. (2002). Variability of shore and shoreline evolution. Coast. Eng. 47 (2), 211–235. doi: 10.1016/S0378-3839(02)00126-6
Suursaar Ü., Kullas T., Otsmann M., Saaremäe I., Kuik J., Merilain M. (2006). Cyclone gudrun in January 2005 and modelling its hydrodynamic consequences in the Estonian coastal waters. Boreal Environ. Res. 11 (2), 143. Available at: http://www.borenv.net/BER/archive/pdfs/ber11/ber11-143.pdf.
Tadić A., Ružić I., Krvavica N., Ilić S. (2022). Post-nourishment changes of an artificial gravel pocket beach using UAV imagery. J. Mar. Sci. Eng. 10 (3), 358. doi: 10.3390/jmse10030358
Talavera L., Del Río L., Benavente J. (2020). UAS-based high-resolution record of the response of a seminatural sandy spit to a severe storm. J. Coast. Res. 95, 679. doi: 10.2112/SI95-132.1
Temmerman S., Meire P., Bouma T., Herman P., Ysebaert T., de Vriend H. (2013). Ecosystem-based coastal defence in the face of global change. Nature 504, 79–83. doi: 10.1038/nature12859
Toure S., Diop O., Kpalma K., Maiga A. S. (2019). Shoreline detection using optical remote sensing: a review. ISPRS Int. J. Geo-Information 8 (2), 75. doi: 10.3390/ijgi8020075
Turner I. L. (2006). Discriminating modes of shoreline response to offshore-detached structures. J Waterw Port Coast Ocean Eng 132 (3), 180–191. doi: 10.1061/(asce)0733-950x(2006)132:3(180
van Zelst V. T. M., Dijkstra J. T., van Wesenbeeck B. K., Eilander D., Morris E. P., Winsemius H. C., et al. (2021). Cutting the costs of coastal protection by integrating vegetation in flood defences. Nat. Commun. 12 (1), 6533. doi: 10.1038/s41467-021-26887-4
Vitousek S., Buscombe D., Vos K., Barnard P. L., Ritchie A. C., Warrick J. A. (2023). The future of coastal monitoring through satellite remote sensing. Cambridge Prisms: Coast. Futures 1, e10. doi: 10.1017/cft.2022.4
Vos K., Harley M. D., Splinter K. D., Simmons J. A., Turner I. L. (2019a). Sub-Annual to multi-decadal shoreline variability from publicly available satellite imagery. Coast. Eng. 150, 160–174. doi: 10.1016/j.coastaleng.2019.04.004
Vos K., Splinter K. D., Harley M. D., Simmons J. A., Turner I. L. (2019b). CoastSat: a Google earth engine-enabled Python toolkit to extract shorelines from publicly available satellite imagery. Environ. Model. Software 122, 104528. doi: 10.1016/j.envsoft.2019.104528
Weisse R., Dailidienė I., Hünicke B., Kahma K., Madsen K., Omstedt A., et al. (2021). Sea Level dynamics and coastal erosion in the Baltic Sea region. Earth System Dynamics 12 (3), 871–898. doi: 10.5194/esd-12-871-2021
Keywords: satellite-derived shorelines, remote sensing, coastal management, sand nourishments, Baltic Sea
Citation: Tiede J, Jordan C, Moghimi A and Schlurmann T (2023) Long-term shoreline changes at large spatial scales at the Baltic Sea: remote-sensing based assessment and potential drivers. Front. Mar. Sci. 10:1207524. doi: 10.3389/fmars.2023.1207524
Received: 17 April 2023; Accepted: 05 June 2023;
Published: 27 June 2023.
Edited by:
Grzegorz Różyński, Polish Academy of Sciences, PolandReviewed by:
Rafał Ostrowski, Polish Academy of Sciences, PolandCopyright © 2023 Tiede, Jordan, Moghimi and Schlurmann. This is an open-access article distributed under the terms of the Creative Commons Attribution License (CC BY). The use, distribution or reproduction in other forums is permitted, provided the original author(s) and the copyright owner(s) are credited and that the original publication in this journal is cited, in accordance with accepted academic practice. No use, distribution or reproduction is permitted which does not comply with these terms.
*Correspondence: Jan Tiede, dGllZGVAbHVmaS51bmktaGFubm92ZXIuZGU=
Disclaimer: All claims expressed in this article are solely those of the authors and do not necessarily represent those of their affiliated organizations, or those of the publisher, the editors and the reviewers. Any product that may be evaluated in this article or claim that may be made by its manufacturer is not guaranteed or endorsed by the publisher.
Research integrity at Frontiers
Learn more about the work of our research integrity team to safeguard the quality of each article we publish.