
95% of researchers rate our articles as excellent or good
Learn more about the work of our research integrity team to safeguard the quality of each article we publish.
Find out more
ORIGINAL RESEARCH article
Front. Mar. Sci. , 24 November 2023
Sec. Ocean Observation
Volume 10 - 2023 | https://doi.org/10.3389/fmars.2023.1205142
This article is part of the Research Topic Frontiers in Marine Geomorphometry View all 16 articles
 Rui Nian1*
 Shasha Liu2Zongcan Lu1Xiaoyu Li1Shidong Ren1
 Yuqi Qian1Qiuying Li1
 Guotong He1Kexin Shi1Guoyao Zhang1Lina Zang1Luyao Li1Bo He1
 Tianhong Yan3
 Xishuang Li4
The increasing use of underwater vehicles facilitates deep-sea exploration at a wide range of depths and spatial scales. In this paper, we make an initial attempt to develop online computing strategies to identify seafloor categories and predict biogeographic patterns with a deep learning-based architecture, DenseNet, integrated with joint morphological cues, with the expectation of potentially developing its embedded smart capacities. We utilized high-resolution multibeam bathymetric measurements derived from MBES and denoted a collection of joint morphological cues to help with semantic mapping and localization. We systematically strengthened dominant feature propagation and promoted feature reuse via DenseNet by applying the channel attention module and spatial pyramid pooling. From our experiment results, the seafloor classification accuracy reached up to 89.87%, 82.01%, and 73.52% on average in terms of PA, MPA, and MIoU metrics, achieving comparable performances with the state-of-the-art deep learning frameworks. We made a preliminary study on potential biogeographic distribution statistics, which allowed us to delicately distinguish the functionality of probable submarine benthic habitats. This study demonstrates the premise of using underwater vehicles through unbiased means or pre-programmed path planning to quantify and estimate seafloor categories and the exhibited fine-scale biogeographic patterns.
Deep sea is viewed as one of the least explored ocean ecosystems (Snelgrove, 1998; Williams et al., 2010; Teixeira et al., 2013; Copley, 2014). The variety of physicochemical gradients in deep-sea habitats is quite remarkable (Thornton et al., 2016), with diverse biogeographic patterns. Due to difficulties in its sensing accessibility, it is of great challenging to discover how the seafloor surface stretches and functions as submarine benthic habitats in the extremely deep sea (Jannasch and Mottl, 1985; Fisher et al., 1994; Johnson et al., 1994; McCollom and Shock, 1997; Sarrazin et al., 1999; Desbruyères et al., 2000; Luther et al., 2001; Van Dover et al., 2002; Bergquist et al., 2007; Nakamura and Takai, 2014; Lamarche et al., 2016).
Over the decades, a multitude of geomorphometric techniques have utilized bathymetric sensors to characterize seafloor stretching attributes (Chakraborty et al., 2013; Masetti et al., 2018; Neil et al., 2019; Pillay et al., 2020; Wang et al., 2021a; Wang et al., 2021b). The increasing use of underwater vehicles, such as Autonomous Underwater Vehicles (AUVs) or Remotely Operated Vehicles (ROVs), e.g., Bluefin (Panish and Taylor, 2011), Hugin (Marthiniussen et al., 2004), Remus (Freitag et al., 2005), Autosub (Furlong et al., 2012), JAMSTEC (Tamura et al., 2000), Urashima (Sawa et al., 2005), and so forth, provides more opportunities to facilitate deep-sea inspection with flexibility and adaptability (Singh et al., 2004; Bewley et al., 2012; Smale et al., 2012; Huvenne et al., 2018).
Advanced sensing techniques have provided the opportunity to investigate the detailed seafloor stretching morphology over a wide range of spatial scales. Underwater vehicles could be equipped with a series of sensors and proceed at shallower depths closer to the seafloor surface, providing higher-resolution morphological images and benthic habitat observations. A multibeam echosounder (MBES) is one of the most widely mounted sensors in bathymetric surveys, which can give insight into noteworthy benthic habitats at large scales, like hydrothermal vent sites, cold springs, mud volcanoes, and seamounts along subduction zones and trench areas. Meanwhile, the optical sensors would enable the provision of video transects at increasing depths in the deep sea to explore the potential biogeographic distribution, the submarine benthic habitat, and biological community structure in detail at smaller scales in the field.
Therefore, increasing attention has been paid to exploring the regional and even global seafloor stretching morphology, the extent of geographical ranges, and the submarine benthic habitats in the deep sea (Lonsdale, 1977; Bach and Edwards, 2003; Trenkel et al., 2004; Williams et al., 2012; Pizarro et al., 2013; Kuhnz et al., 2014; Nakamura and Takai, 2014; Thornton et al., 2016; Thornton et al., 2016; Dunlop et al., 2018; Misiuk and Brown, 2022). The increased diversity of seafloor surface morphology may account for spatial habitat heterogeneity. The formation and types of benthic habitats are typically associated with the physical and geological attributes of seafloor surface stretching. While the benthic habitat, indicator taxa, biodiversity, and community assemblages at one site may still be greatly different from other sites, they may show significant differentiation along similar geomorphometric characteristics. The classification of the seafloor would probably serve as the physical and geological elements to exert a significant impact on the benthic habitats and the biodiversity of organisms inhabiting the underwater environments. Corrêa et al. (2022) conducted an exploration of the plateau and rifts in the Rio Grande Rise (RGR) area with the HyBIS robot and analyzed the description of the structuring factors regarding seafloor topography and habitat types, which revealed highly heterogeneous and rapidly changing habitats with differences in geomorphology, slope, and substrate textures. Urra et al. (2021) characterized the geomorphologic diversity, habitats, and associated biodiversity in the Gazul MV mud volcanoes with underwater imaging and multibeam bathymetry techniques, identifying habitats harboring a characteristic faunal assemblage and highlighting the slope and water depth as the main factors explaining the distribution of the assemblages. Perez et al. (2022) explored seamounts located within the Discovery Rise and classified the types of benthic habitats based on substrate hardness, texture, slope, and physical and biological modifiers. Pierdomenico et al. (2015) conducted a comprehensive analysis of acoustic mapping and optical surveys with underwater vehicles to complete ultra-high-resolution bathymetric and backscatter imagery of geomorphological features of seafloor stretching and to characterize benthic habitat variation in the Hudson Canyon. Swanborn et al. (2023) examined how multiscale seafloor heterogeneity influences commercially important fish families on seamounts of the Southwest Indian Ridge by quantifying seascape heterogeneity from bathymetry and geomorphological habitat maps. De la Torriente et al. (2018) observed a highly diverse range of habitats from multibeam bathymetry and high-resolution seismic profiles with ROV at the Seco de los Olivos Seamount and identified depth and slope as the main significant factors structuring epibenthic assemblages.
Most of the seafloor bathymetric surveys tend to retrieve comprehensive topographic and morphological factors and other auxiliary variables and identify seafloor stretching attributes during post-processing. With the rapid development of hardware embedded in underwater vehicles, more and more expectations are cast to promote online smart computing capabilities, enabling the immediate understanding of seafloor surface stretching and submarine benthic habitat on site from on-board perception sensors rather than relying only on routine post-processing back from missions. Due to the great success of deep learning, all kinds of emerging and advanced algorithms have been developed and enhanced recently, from Deep Belief Networks (DBN) (Hinton et al., 2006), Deep Convolutional Neural Networks (CNN) (Karpathy et al., 2014), and AlexNet (Krizhevsky et al., 2012) to more recent Generative Adversarial Networks (GANs) (Goodfellow et al., 2014), Deep Residual Networks (ResNet) (He et al., 2016), Densely Connected Convolutional Networks (DenseNet) (Huang et al., 2017), and Transformer (Vaswani et al., 2017). Recently, Conti et al. (2019) employed Marine Object-Based Image Analysis (MOBIA) and machine learning classification to identify the distribution and zonation of individual organisms on a cold-water coral (CWC), the Piddington Mound within the Porcupine Seabight, Ireland Margin, from a high-resolution reef-scale video mosaic and ROV-mounted multibeam data. Qin et al. (2021) applied shallow-water, side-scan sonar imaging from the Pearl River Estuary, established the ResNet architecture for acoustic seafloor classification (ASC), and explored the use of GANs for augmentation. Rimavicius and Gelzinis (2017) developed an accurate Norwegian seafloor interpretation and classification system with state-of-the-art deep learning techniques. Martin-Abadal et al. (2019) presented a highprecision semantic segmentation performed automatically in Posidonia oceanica meadows and its habitat by a deep learning-based network, VGG16. Dyer et al. (2020) proposed the identification of seafloor landslides in images with the deep learning model ResNet101 in the Gulf of Mexico, from the advanced bathymetry raster and its derivatives rendered to high-resolution seafloor topography.
However, the above has not yet been extensively applied to specify seafloor stretching characteristics and intrinsic relations with the limited computation resources in underwater vehicles due to the difficulties of simultaneously bathymetry mapping, classifying, and validating. The hardware configuration for embedded supercomputing, such as a high-performance Graphics Processing Unit (GPU), may promote online computational capacities. Hence, we attempted to accelerate the identification and localization process of seafloor morphology and to deduce possible biogeographic patterns with a deep learning-based architecture, DenseNet. DenseNet connects each layer to every other layer in a feed-forward fashion, where the feature maps of all preceding layers are inputs and its own feature maps are inputs to all subsequent layers (Huang et al., 2017). DenseNet offers significant advantages over many state-of-the-art deep learning algorithms. It addresses the vanishing gradient problem, enhances feature propagation, and significantly reduces the number of parameters, thereby demanding fewer computational resources. Moreover, various new variants have been developed recently (Jégou et al., 2017; Zhu and Newsam, 2017; Wang et al., 2018; Lee et al., 2019; Lu et al., 2021; Xiao et al., 2021).
We aimed to establish a generalized deep learning-based architecture so as to develop smart capabilities to identify seafloor categories for underwater vehicles. This could facilitate online computing strategies for unbiased path planning with real-time perception and autonomous decision-making, and adapt to dynamic, unknown, and complex underwater conditions. Such unbiased path planning tends not to rely so much on predetermined global seafloor mappings or predefined routes but focuses on current environmental states, efficiently updating the path selection with the understanding of seafloor categories or potential biogeographic distribution retrieved along the mission route points. The model parameters could be updated and fine-tuned by the local underwater geology, dynamically promoting solutions to viable path planning optimization in an online manner. This could also benefit pre-programmed path planning that utilizes deterministic or optimization algorithms to search offline for optimal or shortest routes from the known underwater environment mapping. Such pre-programmed path planning typically requires prior acquisition of knowledge of regional and even global seafloor stretching morphology. The quality and strength of such approaches partially lie in the ability to identify seafloor categories with high quality and high computational efficiency.
In this paper, starting from the inspiration to explore the seafloor surface stretching and biogeographic patterns along the traces of underwater vesicles, we directly retrieved the multibeam bathymetric mapping from the MBES scans and calculated a variety of morphological parameters from the digital elevation to help semantic segmentation and localization. We established online computation strategies via DenseNet and took the multibeam bathymetric measurements and the joint morphological cues as inputs, with the annotations manually labeled as expected outputs. The minimalistic transition-up blocks, the channel attention module, and the spatial pyramid pooling have been seamlessly integrated to systematically strengthen the dominant feature propagation and encourage feature reuse with the global contextual prior. The developed model has been comprehensively evaluated in terms of PA (Pixel Accuracy), MPA (Mean Pixel Accuracy), and MIoU (Mean Intersection over Union Ratio). We further proposed a preliminary study on the potential biogeographic distribution statistics to provide initial insights into the connective and predictive evidence between seafloor categories, benthic habitats, and even species assemblages.
The remainder of the paper is organized as follows: Sections 2, 3, and 4 describe the basic principles of multibeam bathymetric mapping, the basics of seafloor surface morphological calculation, and DenseNet, respectively. Section 5 introduces the seafloor surface classification via DenseNet, coupled with the channel attention module and spatial pyramid pooling. Section 6 shows the simulation experiment and the analysis of the results. Finally, the conclusions are given in Section 7.
MBES refers to a type of highly integrated multibeam bathymetric sensor. It could help with full-coverage depth measurements at high resolution and determine the nature of seafloor surfaces in the deep sea. The basic principle of MBES is shown in Supplementary Figure A1. The MBES transducer is essentially a combination of an acoustic projector array and a perpendicular hydrophone array. The former emits acoustic pulses at a specific frequency, with a narrow opening along-track angle and a wide across-track angle, in a given swath (Mahmud and Yusof, 2006; Costa et al., 2009). The latter is built to listen to echo reflections with received beams. Thus, the seafloor strips, ensonified by the projectors, will intersect with those observed by the hydrophones, producing the beam footprints. When receiving across-track beams of certain time intervals one after another, the position and depth of the seafloor measurement could be calculated, given the angle of incidence and the two-way travel time of each beam (Zhao et al., 2020; Wu et al., 2021). In a complete transmission and reception period, the projector array runs only once to generate acoustic pulses, while the hydrophone array acquires multiple received beams with appropriate delays. As underwater vehicles proceed forward, a strip of water depth measurements reflecting bathymetric mapping at a specific width could be derived from the MBES, providing full coverage of the seafloor surface morphology, which would benefit the identification and location of seafloor categories with high precision, high density, and high efficiency.
Essentially, we utilized the Digital Elevation Model (DEM) to solve the numerical problem of visualizing the geospatial entities of the seafloor surfaces with a finite set of depth measurements from the MBES. The core interpolation calculation allows the production of a gridded multibeam bathymetric map. We applied a weighted average point-to-point interpolation to generate the digital elevation. Assuming that the elevation point is to be inserted in the center of each sliding sampled window, the elevation value is determined by approximating the weighted averaging of the surrounding elevation values within the window, which can be formulated as
where the number of neighboring elevation points in the sliding window is denoted as , refers to the th elevation value, and represents the corresponding weight. For the output elevation values, the sum of the products between the surrounding elevation values and their corresponding weights within the window is divided by the sum of all the weights. Each weight is defined as the reciprocal of the spatial distance between the surrounding elevation points and the center to be inserted,
The greater the spatial distance , the smaller the corresponding weight , and vice versa. An example of a seafloor strip before and after the interpolation is shown in Figure 1, where the color bar denotes the water depth values. We can see from the experimental results that the high-resolution multibeam bathymetric mapping could reasonably depict the integrity of the seafloor surface stretching in the DEM, especially the stitching of the gaps in the edges.
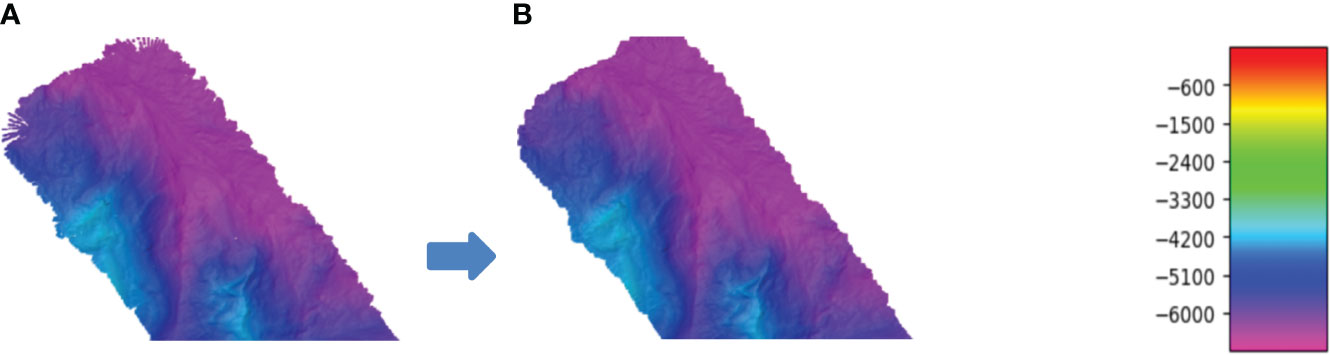
Figure 1 Example strip of seafloor surface mapping. (A) before interpolation, (B) after interpolation.
We further elaborated on the thematic maps of seafloor surface morphological cues from high-resolution multibeam bathymetric mapping. Let the depth value of the given elevation point on a certain seafloor surface be , with and representing the horizontal and vertical coordinates at the seafloor location, respectively. We essentially employed several topological attributes in aid of the first and second derivatives calculated from the neighborhood within a sliding window to consider every elevation point in turn.
The slope refers to the measurement that determines the steepness or degree of inclination in seafloor bathymetric mapping relative to the horizontal plane, which constitutes the fundamental index of benthic habitat and colonization at a variety of scales (Friedman et al., 2013). Multibeam bathymetric mapping can be approximated by a bivariate quadratic equation, and we compute the slope with the first derivative of the elevation values. The slope with the origin at the central point in the local coordinate system within the sliding window is hereby calculated as
The slope direction could be defined as,
where and represent the slope with respect to and directions, which can take a variety of forms. We determine the slope value of the central point from the finite differential of the surrounding neighbors within the sliding window, as is shown in Supplementary Figure B.1. The slope and of the horizontal and vertical directions could be denoted as,
where are the elevation values in the sliding window, respectively, and is the grid length.
The curvature behaves as a quantitative measurement of the degree of distortion on the surface of the seafloor geomorphic changes, providing a possible assessment of uplift or depression (Shary, 1995). The profile curvature values stand for the stretching morphology of the seafloor surface, with positive curvature attesting to an upwardly concave and a negative curvature, indicating upwardly convex, and a value of zero indicating flat seafloor surfaces. It helps to delimit distinct habitat regions by identifying boundaries in seafloor morphology, delineating between favorable and unfavorable habitats for communities. The curvature is a second spatial derivative of the seabed terrain, which can be expressed as
where and are the first derivatives of the elevation values in the horizontal and vertical directions, respectively; , , correspond to the derivative of the horizontal slope with respect to direction, the derivative of the horizontal slope with respect to direction, and the derivative of the vertical slope with respect to direction, respectively.
where , are the first derivatives of the elevation values in the horizontal and vertical directions within the sliding window, as is calculated in Supplementary Figure C1.
Surface roughness reflects the degree of the structural complexity of the seafloor surface stretching, which to some extent indicates its macrotopographic characteristics and undulation status, and can be defined as the ratio of the total seafloor surface of the sampled region to a projected plane to decouple measurements from the overall slope (Friedman et al., 2013). Each topographic seafloor surface stretching can be divided into non-overlapping virtual quadrats, and the surface roughness value is derived from each virtual square as
where and are the seafloor surface area and the horizontal projected area, respectively, in a given virtual quadrat. Let the slope at a given th elevation point in the sliding window be , the corresponding surface roughness could then benefit from the calculation of this available topographic factor as follows:
The surface roughness of each virtual quadrat with elevation points can then be expressed as
It was believed that such thematic maps of topological parameters reflecting the seafloor elements and types are effective in classifying seafloor categories in terms of their formation processes and evolution (Burrough and McDonnell, 1998). The topological parameters of high similarity would most likely be shared with the identical seafloor categories. Since most attempts to characterize seafloor elements are limited to a relatively restricted range of morphological attributes, while seafloor types represent characteristic patterns that repeat regardless of scales (MacMillan et al., 2000), we endeavored to utilize high-resolution multibeam bathymetric mapping to extract micro geomorphologic factors such as slope and curvature, as well as macro geomorphologic factors like surface roughness, and to assess the effectiveness of individual or joint morphological cues in distinguishing seafloor surface types. It should be noted that the formation of seafloor surfaces can be viewed from a variety of spatial scales, and the effect of scales involves geomorphology in a complex, hierarchical context. Thus, seafloor classification is related to the issue of scales in different geomorphological settings and the role that morphological cues play in seafloor surface stretching (De Boer, 1992).
The thematic maps of topological parameters for a few example MBES images are shown in Figure 2, with the original images, the slope, the surface roughness, and the curvature, respectively, displayed from top to bottom. The slope of the seamount generally approached a large value with high-level relief amplitude; the slope of the trench bottom basin was relatively small with nearly flat surfaces; and the slope of the island slope deepwater terrace shifted frequently, representing the divergence of the degree of seafloor surface steepness. The surface roughness provides a macroscopic view of the complexity of seafloor surfaces and reflects the degree to which the seabed terrain is susceptible to erosion. Higher surface roughness values corresponded to more complex or eroded seafloor terrain, e.g., around the island slope deep water terrace. Conversely, flat seafloor surfaces experienced less erosion and exhibited lower roughness values. The curvature directly affected the net erosion, reflecting the degree of seafloor surface fragmentation. When the curvature value of the sea mount was relatively small, the degree of fragmentation was the lowest, and the curvature value of the island slope deep water terrace was relatively large, representing a high degree of fragmentation. The curvature directly affected the net erosion, reflecting the degree of seafloor surface fragmentation. When the curvature value of the sea mount was relatively small, the degree of fragmentation was the lowest, and the curvature value of the island slope deep water terrace was relatively large, representing a high degree of fragmentation.

Figure 2 Extraction of topographic factors from MBES imagery. (A) Multibeam bathymetric topographic mapping, (B) slope, (C) surface roughness, (D) curvature.
We initially utilized basic clustering techniques (K-means) to agglomeratively assign elevation points with highly similar topological parameters into the same group and to deviate from the significantly inconsistent outlier elevation points. We could therefore locate and identify individual notions of landforms and geological structures at certain scales with specific physical attributes and translate them to the complete coverage of bathymetric mapping to estimate the potentially appropriate scales as a whole for reference. The individual and joint morphological cues in combinations have served as the input to assess the clustering performances, in terms of PA, MPA, and MIoU, as is shown in Supplementary Table E1, where the first row is the clustering evaluation of only the bathymetric topographic mapping from MBES, and the second, third, and fourth rows are the evaluation results when introducing the additional morphological cues, respectively, including the slope, surface roughness and curvature. Among them, the clustering performance was superior when both slope and surface roughness were fed as inputs together with the original bathymetric mapping. The comparison of clustering performance with the individual and joint morphological cues for example MBES imaging is shown in Figure 3, with the original example images, the clustering results from bathymetric mapping+slope, +surface roughness, +curvature, and the ground truth listed from left to right respectively. It was shown that some regions of the trench seamount group were quite easily misclassified as island slopes, leading to many mistakenly divided holes. Owing to the complexity and variability of seafloor surfaces, there exist large divergences even within identical seafloor types and possible similarities across distinct seafloor types, all of which would influence the discrimination process. We have tried to integrate the joint morphological cues into the deep learning-based models to improve the accuracy of distinguishing seafloor categories.
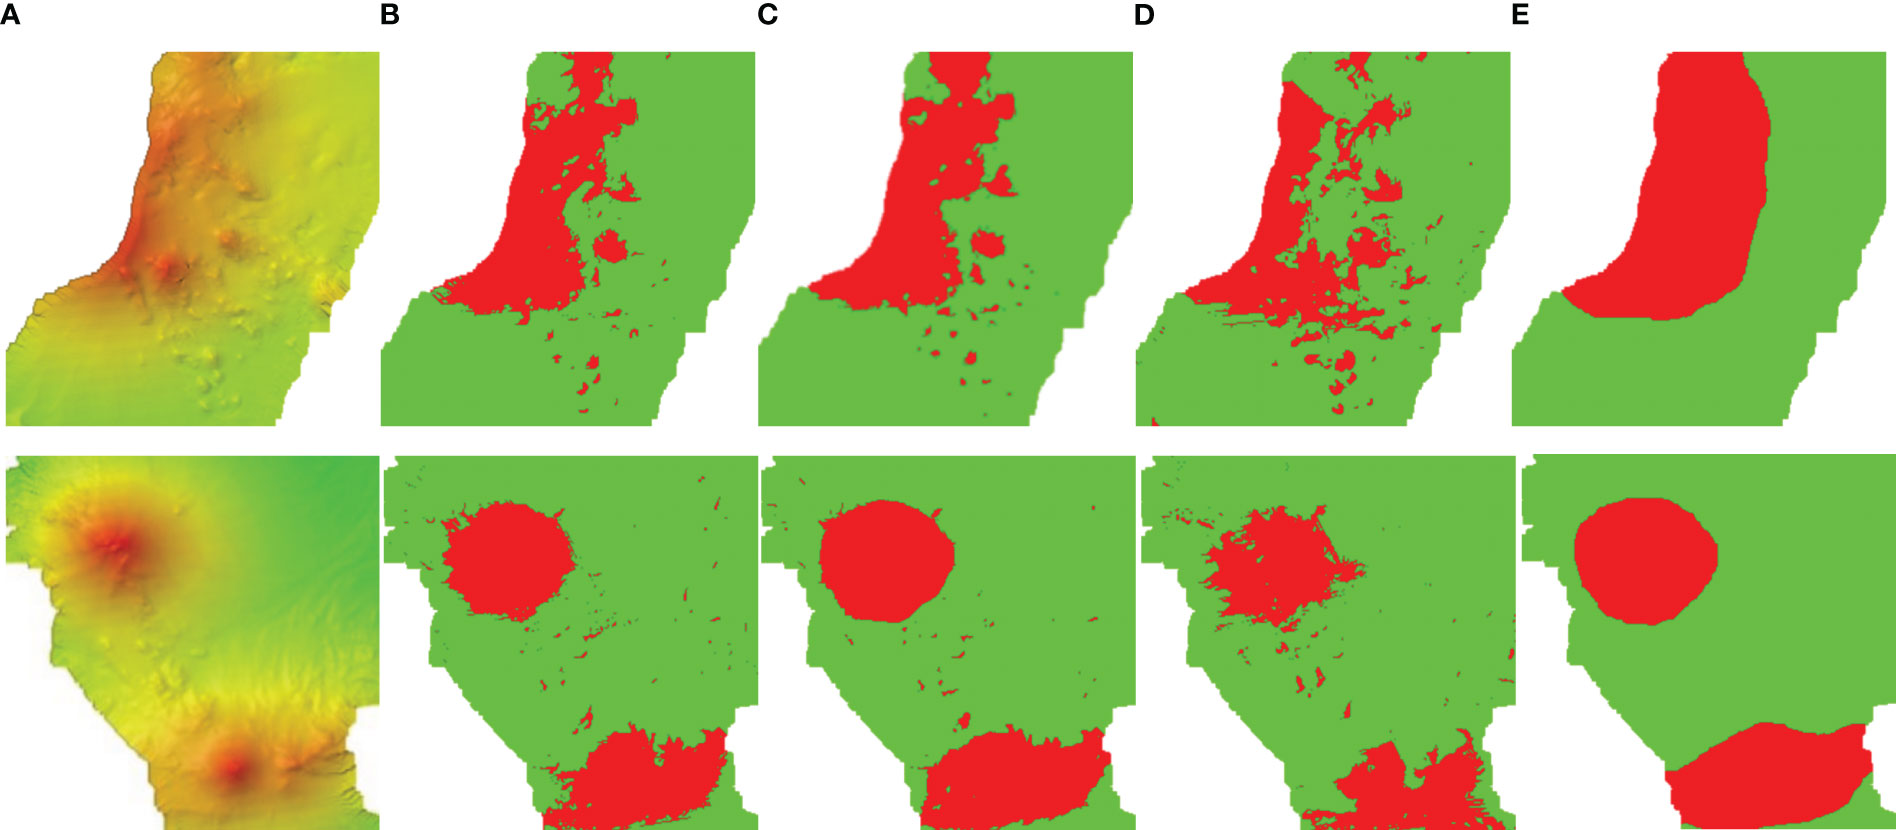
Figure 3 Clustering comparison with joint morphological cues. (A) Bathymetric topographic mapping, (B) +slope, (C) +slope+roughness, (D) +slope+roughness+curvature, (E) ground truth.
The basic Densely Connected Convolutional Networks (DenseNet) embraces the hypothesis that shorter connections exhibit high performance in a substantially deeper network manner (Huang et al., 2017; Jégou et al., 2017). The feature maps of all previous layers are used as inputs for each layer, and its own feature maps are introduced as inputs to all subsequent layers. Therefore, a basic DenseNet comprising layers will result in direct connections in a feed-forward fashion. Let be the non-linear transformation implemented in the th layer, with the output of the th layer denoted as . DenseNet proposes a dense connectivity pattern that introduces direct connections from each layer to all subsequent layers. Consequently, the th layer receives the feature maps of all previous layers as the input
where refers to the concatenation of the feature maps produced in the previous layers. For ease of implementation, the multiple inputs of (·) could be concatenated into a single tensor. Since the concatenation operation may not be feasible if the size of the feature maps changes during down-sampling, DenseNet would be further divided into multiple dense blocks, with the transition layers between them for convolution and pooling.
We used DenseNet121 as the backbone network of our proposed scheme for seafloor surface classification. The non-linear transformation (·) was initially defined as a composite function of consecutive operations, i.e., Batch Normalization (BN), followed by a Rectified Linear Unit (ReLU) and a Convolution (Conv). The design of a 1×1 convolution was introduced as a bottleneck layer before each 3×3 convolution to improve computational efficiency. The DenseNet121 network configuration was made up of four dense blocks. Before entering the first dense block, the initial convolution layer comprised convolutions of size 7×7 with step size 2, and the number of feature maps in all other layers followed from the setting . The transition layers took a 1×1 convolution, followed by a Average pooling between two contiguous dense blocks. At the end of the last dense block, global Average pooling was performed and then a softmax classifier was applied. The number of feature maps in the four dense blocks was 6, 12, 24, and 16, respectively, and the corresponding size of features was , , , of the original input.
Our proposed scheme consists of several correlative steps, as follows: (1) Manual annotation: at the beginning, the seafloor stretching annotation of the bathymetric mapping collected from MBES scans is manually labeled as the standard reference. (2) Network construction: an upgraded Densenet121 backbone is established, in aid of the minimalistic transition-up blocks in the upsampling path, the channel attention module, and the spatial pyramid pooling, to explore the potential seafloor stretching categories. (3) Morphological feature fusion: the morphological cues are incorporated into the context of the DenseNet architecture from the extracted topological parameters. (4) The seafloor stretching classification would go through the statistics on potential biogeographic distribution and jointly improve the understanding of delineating the submarine benthic habitats. The flowchart of seafloor surface classification via DenseNet is shown in Figure 4. It should be noted that our proposed scheme could actually be extended to accommodate multiple scales of input seafloor stretching surfaces. It is well known that the parameters for describing the geomorphological formations of seafloor surfaces can be quite sensitive to the scales involved (Wong, 1973; Phillips, 1988; Mahmud and Yusof, 2006; Millar, 2013). We have taken into account the issues of scales and specifically designed the geomorphological modeling via deep learning. We have tried to integrate the site-specific scales and responded to recognize the appropriate spatial scales from the individual physical attributes of the seafloor categories during the reasoning process under the classification criterion.
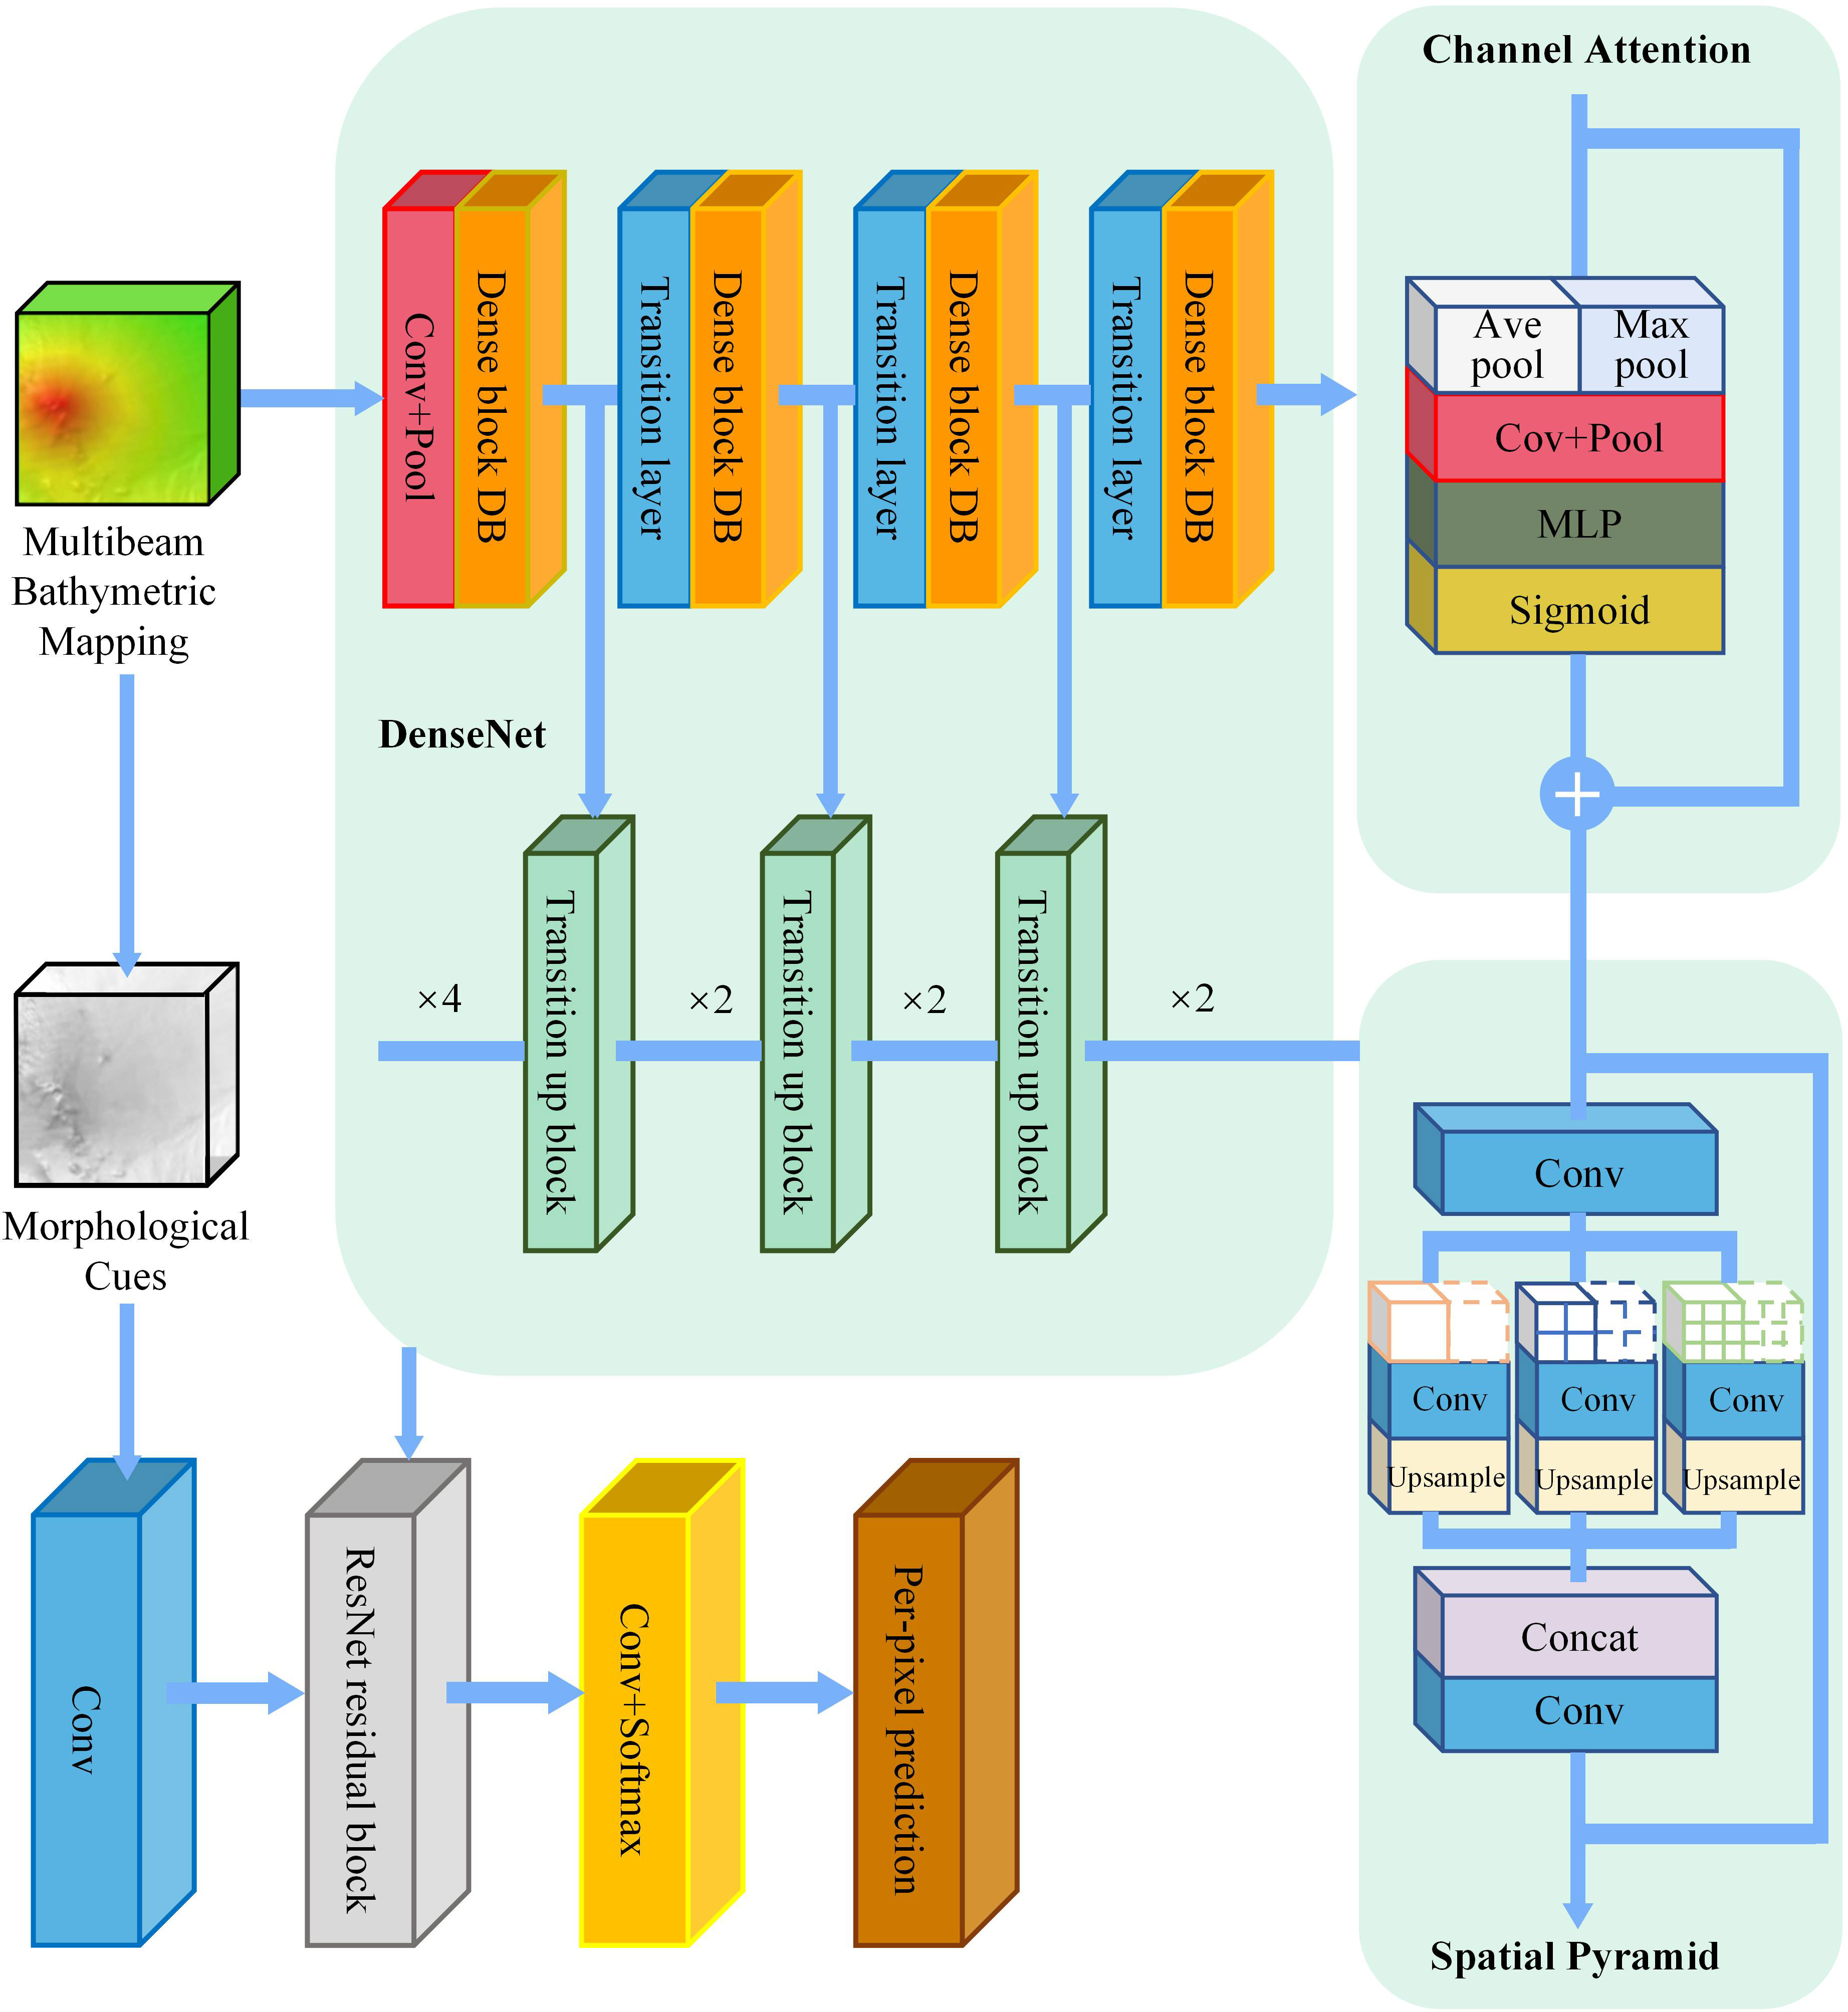
Figure 4 Flowchart of seafloor surface classification using DenseNet.
DenseNet121 transforms the input into a feature tensor by gradually reducing the spatial resolution and increasing the number of feature maps along a downsampling path. As for the design and the upsampling path, the Tiramisu model has had great success in the naive extension of DenseNet to fully convolutional networks, while mitigating the linear growth of the feature map explosion in very deep neural networks with very few parameters, replacing the convolution operation with a sequence of dense blocks and the transposed convolution referred to as transition-up (TU) blocks, with an approximately 10-fold reduction with respect to the state-of-the-art models (Jégou et al., 2017). In this paper, in order to explore the possibilities of developing smart capabilities in understanding the seafloor stretching morphology for underwater vehicles, we have updated the DenseNet architecture with an upsampling path of a more simplified transition-up process, i.e., the minimalistic transition-up blocks, which could transform the low-resolution features into high-resolution predictions by recovering details from early layers with blending semantics from deeper layers (Kreso et al., 2017). The design of minimalistic TU blocks is introduced to play the role of the upsampling path in DenseNet121. TU blocks blend the smaller and larger representations whose spatial resolutions differ by a factor of 2 from the upsampling and downsampling paths, respectively, via a skip connection. The blending procedure is repeated recursively by simple summation along the upsampling path, with skip connections arriving from the outputs of each dense block instead of the symmetric encoder-decoder network. The final TU block produces logits at the resolution of the DenseNet stem. The dense predictions at the input resolution are finally obtained by 4× bilinear upsampling. The minimalistic design helps lightweight semantic execution with a low memory footprint and low-dimensional feature tensors during upsampling and discourages overfitting to low-level textures, which potentially presents significant online computation capacities in distinguishing seafloor categories for underwater vehicles.
We adaptively refined the input feature maps along channels by seamlessly integrating the Convolutional Block Attention Module (CBAM) (Woo et al., 2018) into DenseNet121. The CBAM module sequentially infers channel-wise attention maps, which are multiplied by input feature maps. Unlike the Squeeze-and-Excitation (SE) module (Hu et al., 2018), we have tried to exploit the inter-channel relationships by employing both Average pooling and Max pooling in parallel. Given an intermediate feature map of size , with , , being the height, width, and channel number of the feature map, respectively, the spatial dimension of the feature map is squeezed as follows:
where and are the outputs of the Average pooling and the Max pooling, respectively, with a size of . The Average pooling aggregates the spatial dimension to suggest the extent of the seafloor surface stretching, and the Max pooling gathers clues of distinctive seafloor surface features to simultaneously infer finer channel-wise attention. Both descriptors allow the global receptive fields to be embedded.
An excitation operation, where the specific activations govern the excitation of the channels by the dependency, feeds the two descriptors into a shared multi-layer perceptron (MLP) with a hidden layer to produce the channel attention map. To reduce the parameter overhead, the hidden activation size is set to , where is the reduction ratio. The output in MLP is recovered to generate the feature vectors of size . After the shared MLP is applied, the feature vectors are merged by the element-wise summation. In short, channel attention is computed as
where and respectively refer to the weights of the two layers, stands for the ReLU activation function, and denotes the sigmoid function. Finally, the channel attention output is multiplied with the initial feature map to retrieve the newly refined features with calibration,
where denotes the element-wise multiplication. The weight coefficient from the channel attention values is broadcast along the spatial dimension during the multiplication to adaptively screen the optimal feature map along the channels.
We have further embraced the idea of a kind of spatial pyramid pooling module (SPP) (He et al., 2015) into our DenseNet121 architecture since it may not sufficiently incorporate the momentous global contextual prior for the receptive fields of the seafloor surface stretching, especially on high-level layers. The basic module of the pyramid scene parsing network (PSPNet) is developed to help exploit and enhance the capability of global context-aware features through aggregation along with sub-regions from multiple receptive fields. We have proposed the introduction of a global context with a sub-region context that enriches to distinguish seafloor surface categories in a pyramidal manner, using both the Average pooling and the Max pooling, as is shown in Supplementary Figure H1.
Let the number of channels from the channel attention module be ; the dimensionality reduction is first performed on the input feature maps by a 1×1 convolution. The Average pooling and the Max pooling simultaneously conclude the feature maps in sub-regions of pyramid scales, with the latter appropriately compensating for the former in detail, and then connect together at pyramid levels along the channel dimension. To maintain the weight of the global seafloor features, a 1×1 convolution layer is applied after each pyramid level. The low-dimensional feature maps are directly upsampled to obtain feature maps of the same size before pooling by bilinear interpolation. Multiple levels of pyramid pooling features are concatenated with the original feature maps before the pooling stage as the final globally enhanced seafloor features, and then output with convolution for the next upsampling.
We further proposed fusion strategies to merge with the morphological cues in the context of DenseNet so as to enhance the semantic understanding among seafloor surface types, as is shown in Supplementary Figures I1 and I2. The first one is that we have attempted to superimpose the morphological features as the input of DenseNet together with the bathymetric seafloor mapping, calibrating the deep-level feature mapping with the help of the channel attention module, enhancing the global feature extraction from the spatial pyramid pooling, and restoring the high-resolution predictions in the up-sampling path for the pixel-level seafloor surface classification. The second strategy is to make an up-sampling of those morphological features through a convolution as a branch to join with the deep-level feature mapping of the same dimensionality extracted from the DenseNet branch to jointly contribute as the input of the residual block for the subsequent seafloor type prediction. Due to the existence of the identity mapping in ResNet, the residual block could at least copy the previous layer to prevent degradation and simultaneously refine morphological details. In addition, we have evaluated the impact of multiple morphological cues on promoting the descriptiveness and distinguishability of seafloor surface classification.
In our simulation experiment, the developed scheme has been verified by the high-resolution multibeam bathymetric data from the NOAA Office of Ocean Exploration and Research (OER) for the expeditions EX1605L1, EX1605L2, and EX1605L3, with Kongsberg EM302 multibeam echosounders on board the research vessel Okeanos Explorer. The total time of the expedition is 1631.269 h, lasting for 59 days, from the 20th of April to the 10th of July 2016, with a track length of 26703.6897 km and an average speed of 16.33 km/h in the Mariana Trench Marine National Monument and the Commonwealth of the Northern Mariana Islands, as is shown in Supplementary Table K1.
Meanwhile, the submersible ROV Deep Discoverer (D2), equipped with high-definition cameras and a lighting system, was connected to the camera platform Seirios and the research vessel via an umbilical cable, which provided the possibility of visual cues about the benthic habitat and colonization that are difficult to obtain in the deep sea (Cantwell, 2016). The detailed summary of the ROV Deep Discoverer dive log of EX1605L3 is listed in Supplementary Table L1, and it includes the latitude and longitude, bottom time, and maximum depth.
First, we essentially utilized the manually labeled seafloor surface annotation as the standard reference so as to identify eight seafloor stretching categories via DenseNet. The normative standard of our manual annotation is listed in Table 1, where the descriptive morphological formation features are commonly known to systematically evaluate the seafloor surface categories (Nishizawa et al., 2009; Harris et al., 2014). In the beginning, we divided the original MBES images into overlapping sub-blocks based on their relatively independent physical attributes of morphological structures at the given scales. We normalized the above MBES images at multiple scales, with their corresponding morphological cues and manual labeling into the basic uniform size 256×256. Such transformed sub-blocks were varied with multiple processing steps, such as random flip, rotation, translation, etc., to promote the diversity of the samples. The selection of the basic uniform size satisfied a comprehensive view of most seafloor topography in our experiment, allowing for interpretation, classification, and validation under the given average swath width of MBES scans. Once a variety of scales with regard to geomorphological formations of seafloor surfaces have been used, normalization would be taken to adapt to the proposed model. In total, 11,720 sub-blocks were chosen, with 8200 samples for training and 3520 for testing, of which 697 samples were originally labeled to the island slope ridge category, 2765 samples to the island slope category, 1145 samples to the island slope deep water terrace category, 2682 samples to the trench seamount group category, 1690 samples to the trench edge slope category, 1240 samples to the trench bottom basin category, 840 samples to the island platform category, and 661 samples to the slope fault basin category. We could further accumulate and refine the seafloor surface annotation as the ground truth through the acquisition of more MBES images.
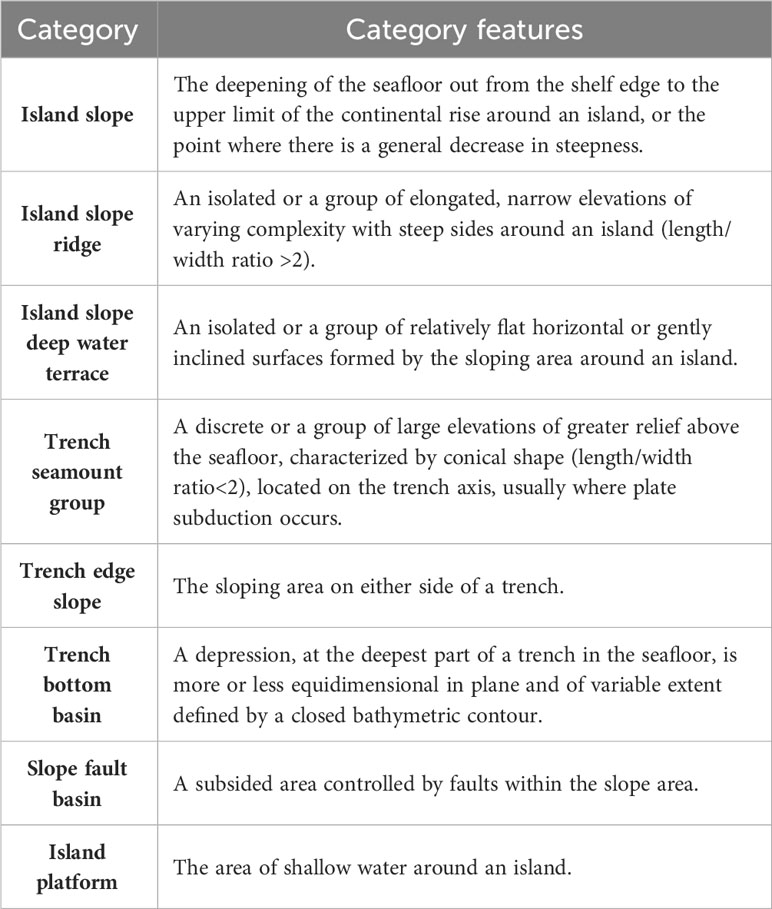
Table 1 Annotation standard for seafloor surface categories.
The configuration of the supercomputing solutions during the model building, training, and testing process was as follows: NVIDIA TITAN Xp graphics card and GeForce GTX 1080Ti graphics cards, an Intel Core i5-2410M CPU with a main frequency of 2.3GHZ, 32GB of memory cards, an Ubuntu 16.04 operating system, a Tensorflow 1.3.0 deep learning framework, a Python3.5 interpreter, data science libraries including Numpy and Pandas, and netCDF data viewers. For optimization, the best Adam optimizer was adopted, among which the exponential decay rate of the first-order moment estimation and the second-order moment estimation were 0.9 and 0.99, respectively, by using the cross entropy as the loss function, the learning rate was initially set to 0.001, with the batch size of 16. It should be noted that we examined the hyper-parameters in our simulation experiment, especially the learning rate and the batch size, to ensure the impact on the convergence of our developed model. When the batch size varied from 8 to 32 and the learning rate varied from 0.0005 to 0.01, it was demonstrated from our experimental results that the selected parameters exhibited quite comparable convergence for our proposed scheme.
We employed PA, MPA, and MIoU metrics to quantify semantic segmentation performance with the help of manual annotation. Assuming that there are categories of seafloor surfaces, let be the total number of image pixels that originally belonged to the th category but have been incorrectly classified into the th category, and be the total number of image pixels that originally belonged to the th category but have been incorrectly classified into the th category, with the total number of image pixels that belonged to the th category and have been correctly classified into the th category.
PA refers to the ratio between the amount of properly classified image pixels and the total number, which can be expressed as the following formula:
MPA refers to the ratio of the number of correctly classified image pixels on a per-category basis, which is then averaged over the total number of categories,
MIoU calculates the average IoU ratio across all categories, which describes the degree of overlap ratio between the intersection and union of categories,
We further started to evaluate the semantic segmentation performance of our proposed scheme. First, we verified the configuration of a variety of backbone networks, such as ResNet50, ResNet101, and DenseNet121, to determine whether it would be more effective to extract the possibly deeper level features for the seafloor surface stretching by means of the identical upsampling modules. As shown in Supplementary Figure J1, the selection of DenseNet121 initially achieved comparable performance for semantic segmentation of seafloor surface stretching in terms of PA, MPA, and MIoU metrics.
We carried out a series of ablation studies to quantitatively investigate the extent to which the progress of semantic segmentation performance could benefit individually from the improvement of the channel attention module and spatial pyramid pooling in our proposed model. The performance verification for each step is listed in Tables 2 and 3 in our ablation studies, respectively, in terms of PA, MPA, and MIoU metrics. The channel attention module combined both global average pooling and global maximum pooling to optimize the generation of the deep-level feature descriptors. We made the comparative evaluation of the baseline Densenet121, with either the global average pooling or the global maximum pooling, as well as with both types of the pooling. In our experimental results, it has been demonstrated that the effectiveness of both types of pooling behaved better in parallel, where the maximum pooling supplied the possible losses derived from the Average pooling. Spatial pyramid pooling was added to the baseline Densenet121 with the channel attention module, using various pooling selections at multiple pyramid scales. It was shown that the Average pooling alone outperformed the maximum pooling alone, while the two complementary poolings in parallel improved the semantic segmentation accuracy more.
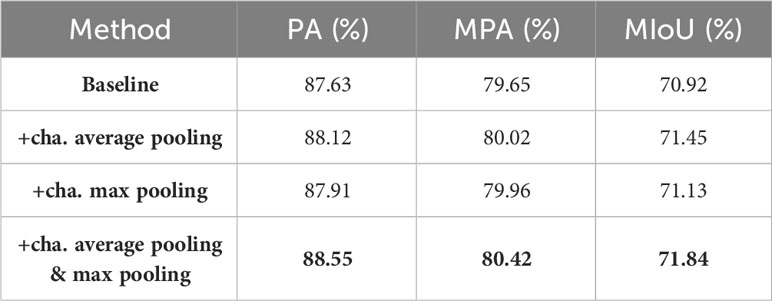
Table 2 Evaluation of the channel attention module in our ablation studies.
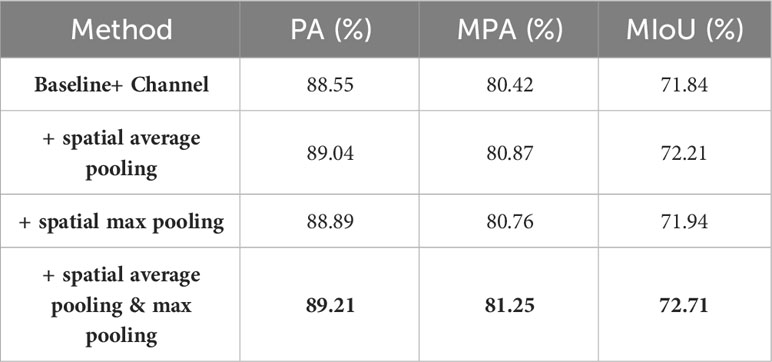
Table 3 Evaluation of the channel attention module in our ablation studies.
We also examined which types of morphological cues are more relevant to the semantic segmentation of seafloor surface categories, together with the features retrieved directly from MBES imagery via Densenet. Table 4 lists the evaluation of the semantic segmentation accuracy by merging multiple morphological cues into the DenseNet backbone network with the embedded channel attention module (C) and spatial pyramid pooling module (S) in the context of two types of feature fusion strategies, including slope, roughness, curvature, slope + roughness, slope + curvature, roughness + curvature, and slope + roughness + curvature. The first mode concatenated the individual or joint morphological cues with multibeam bathymetric seafloor mapping in advance to generate the multi-channel input for DenseNet, and the resulting fused feature maps would be adaptively optimized with the channel attention module, advanced into global feature representation with the spatial pyramid pooling, then restored to high-resolution predictions from up-sampling with the aid of transition-up blocks, outputting the subsequent semantic seafloor classification. In the second mode, the bathymetric seafloor mapping was individually input into DenseNet, with the channel attention module and spatial pyramid pooling employed. Concatenated feature maps of the same dimensionality were extracted from up-sampled morphological cues by convolution from another branch in parallel, and then commonly fed the feature fusion into the residual block to output the seafloor type prediction. From our experimental results, the second mode achieved the overall performance improvement compared to the baseline and the first mode, which to a certain extent plays a role in compensating for the loss in down-sampling, thereby improving the descriptiveness and distinguishability of seafloor surface categories. The morphological cues of slope + roughness exhibited better performance, while the curvature did not show a significant improvement in accuracy. It was inferred that the slope tends to indicate the degree of steepness in seafloor surface stretching, and the surface roughness might display the extent of erosion in the seafloor surface topography, all of which contribute to the semantic segmentation. Also, the curvature reflects the degree of fragmentation, which might not be seen as a very distinguishable index and might lead to misclassification to a large extent.
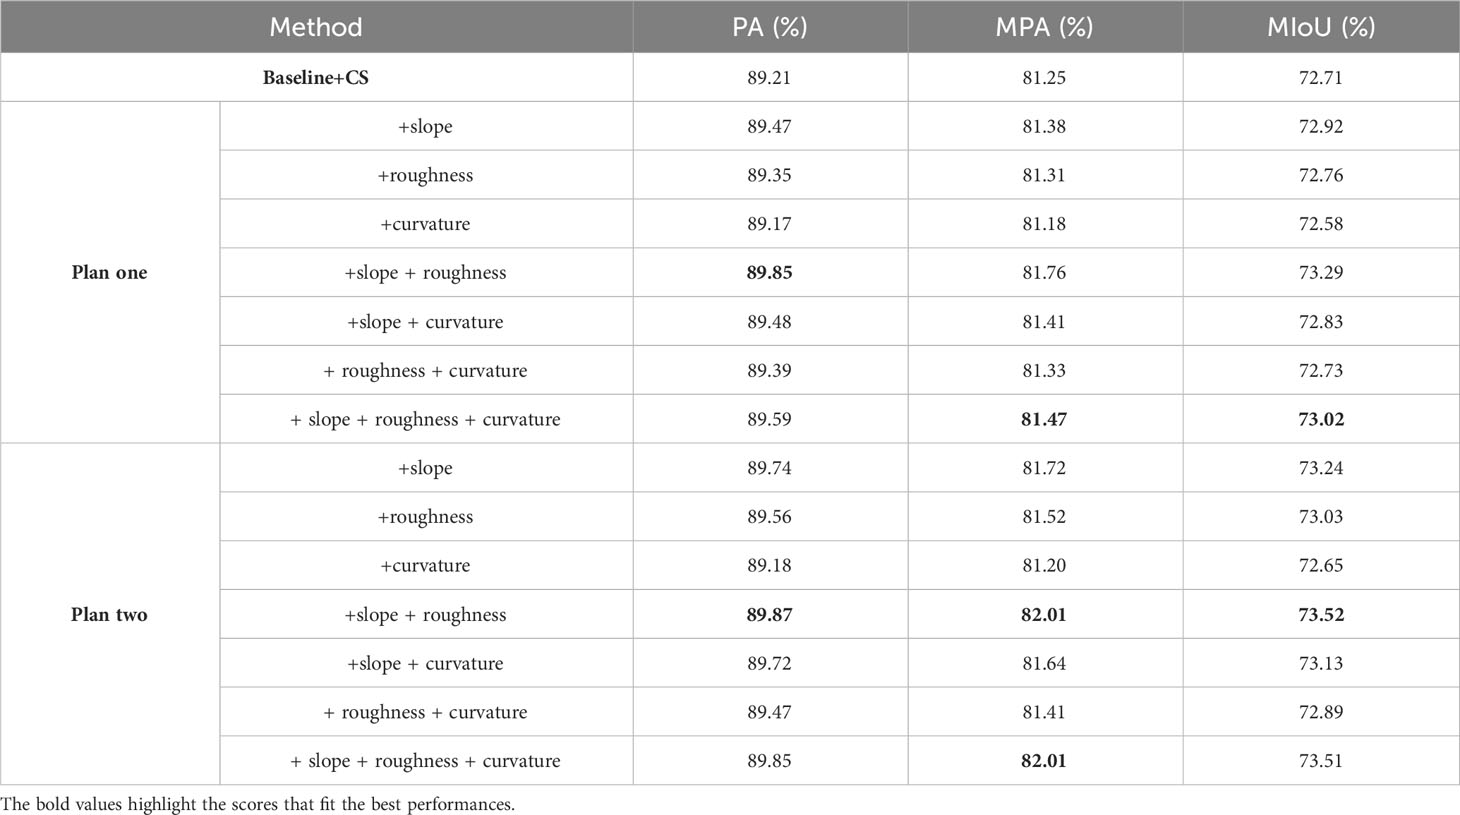
Table 4 Evaluation of feature fusion in our ablation studies.
Furthermore, the semantic segmentation accuracy of each individual seafloor surface category was systematically evaluated against the classic Fully Convolutional Network (FCN) (Long et al., 2015) in terms of the IoU measure, as is shown in Table 5. Since IoU describes the degree of overlap between the actual outputs and the expected outputs of each category prediction, the higher the IoU index value, the better the segmentation performance. It could be seen from our experimental results that our proposed scheme has made general progress in distinguishing individual seafloor surface categories from the rest via DenseNet with the channel attention module and spatial pyramid pooling strategies, which tended to enhance the feature mapping capability of the entire network and thus improve the segmentation accuracy accordingly.
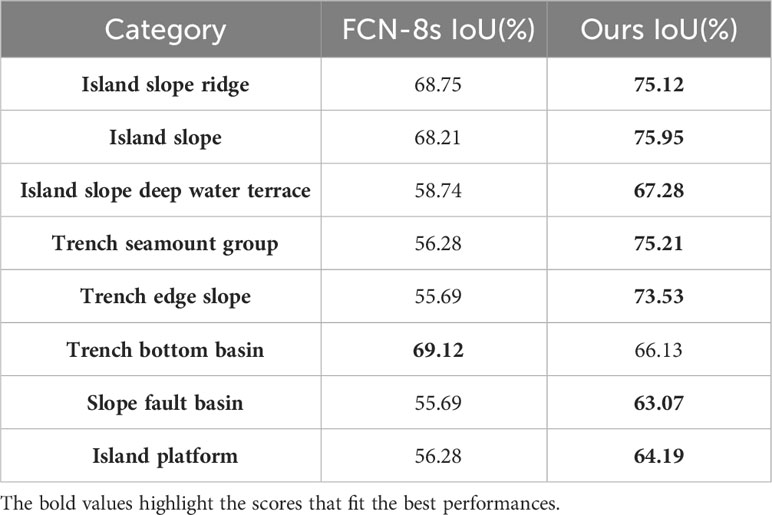
Table 5 Performance of semantic segmentation across categories.
The overall performance evaluation of our developed scheme has been illustrated in Table 6, where the semantic segmentation accuracy calculation, from the baseline Densenet121 with the minimalistic transition-up (TU) blocks (DT), embedded with the channel attention module (DTC) and spatial pyramid pooling module (DTCS), to the coupled feature fusion with the morphological cues (DTCSF), was quantitatively measured step by step in terms of PA, MPA, and MIoU metrics.
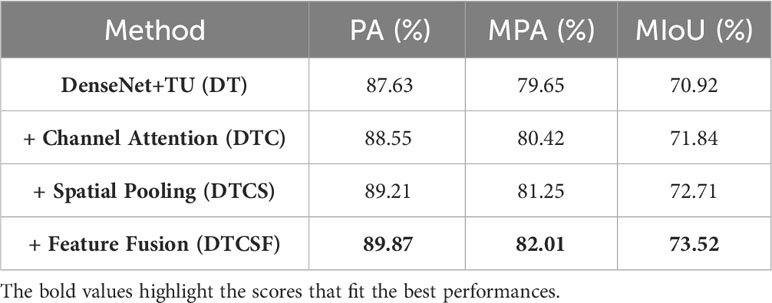
Table 6 Evaluation of the overall network performance.
We further performed the comparative evaluation with some state-of-the-art models for semantic segmentation of seafloor surface stretching, including FCN-8s, SegNet (Badrinarayanan et al., 2017), RefineNet (Lin et al., 2017), PSPNet (Zhao et al., 2017), DeepLab v3+ (Chen et al., 2018), and our developed scheme, as shown in Table 7. The classic FCN-8s network integrates the multi-layer feature maps during down-sampling in FCN. The SegNet network calls the pooling index at the corresponding encoder in the decoder to upsample the feature map through the unpooling operation. RefineNet explicitly exploits all the information available along the down-sampling process to enable high-resolution prediction through long-range residual connections. PSPNet captures global context through different-region-based context aggregation by the pyramid pooling module to improve network performance. DeepLab v3+ makes use of an encoder-decoder to perform multi-scale information fusion while retaining the dilated convolutions and Atrous Spatial Pyramid Pooling (ASPP) layer of the original DeepLab series. It should be noted that the above segmentation results for seafloor stretching categories were initially generated from the average product of 5-fold cross-validation with our developed model by dividing into mutually exclusive subsets with nearly equal numbers of randomly selected samples. From the experimental results, it was demonstrated that our proposed scheme had achieved a significant improvement in semantic segmentation performance, with PA, MPA, and MIoU metrics reaching up to 89.87%, 82.01%, and 73.52%, respectively. The model also exhibited a high level of stability in terms of PA, MPA, and MIoU metrics with a series of cross-validation rounds.
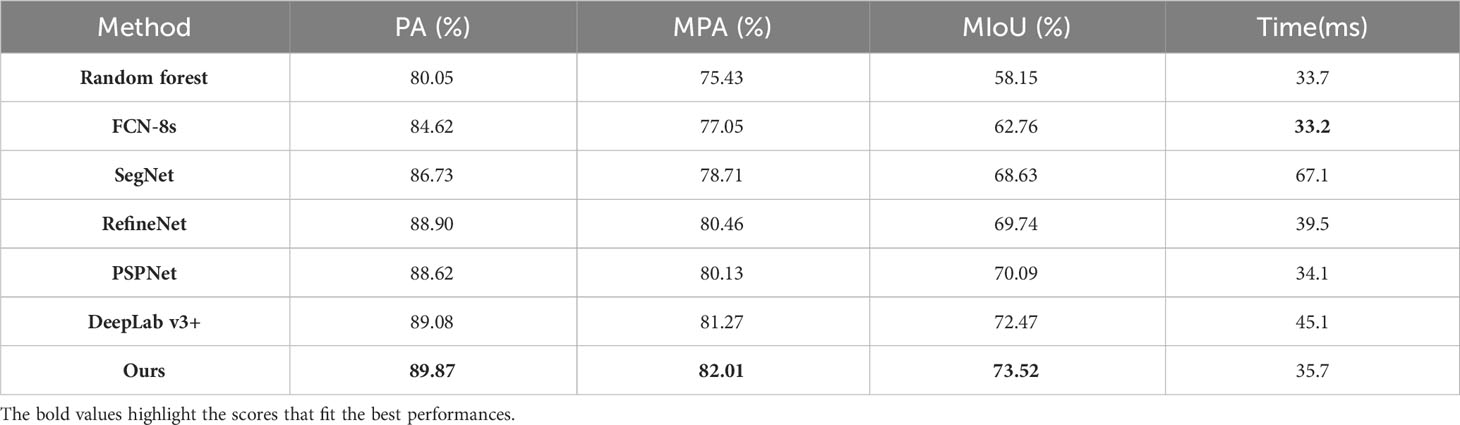
Table 7 Comparison of classification performance.
The semantic segmentation of multibeam bathymetric seafloor mapping has been further visualized, as is shown in Figure 5, where the example MBES image, the segmentation results of both FCN-8s and our proposed scheme, and the corresponding labels are listed from left to right, respectively, with the island slope ridge in red, the island slope in green, the island slope deepwater terrace in cyan, the trench seamount group in yellow, the trench edge slope in blue, the trench bottom basin in purple, the island platform in orange, and the slope fault basin in black. From our experimental results, it was demonstrated that our developed scheme visually outperformed the classic FCN-8s, and simultaneously enhanced the details in-between edges, with the ability to preserve the salient features and eliminate redundancy on a global scale, showing its superiority in the descriptiveness and distinguishability of the seafloor surface categories. Some semantic segmentation results of the example multibeam bathymetric seafloor mapping along waypoints of the expedition track around the Mariana Trench are shown in Figure 6, where the location of the waypoint, the original example MBES images, the segmentation results, and the ground truth are listed from left to right.
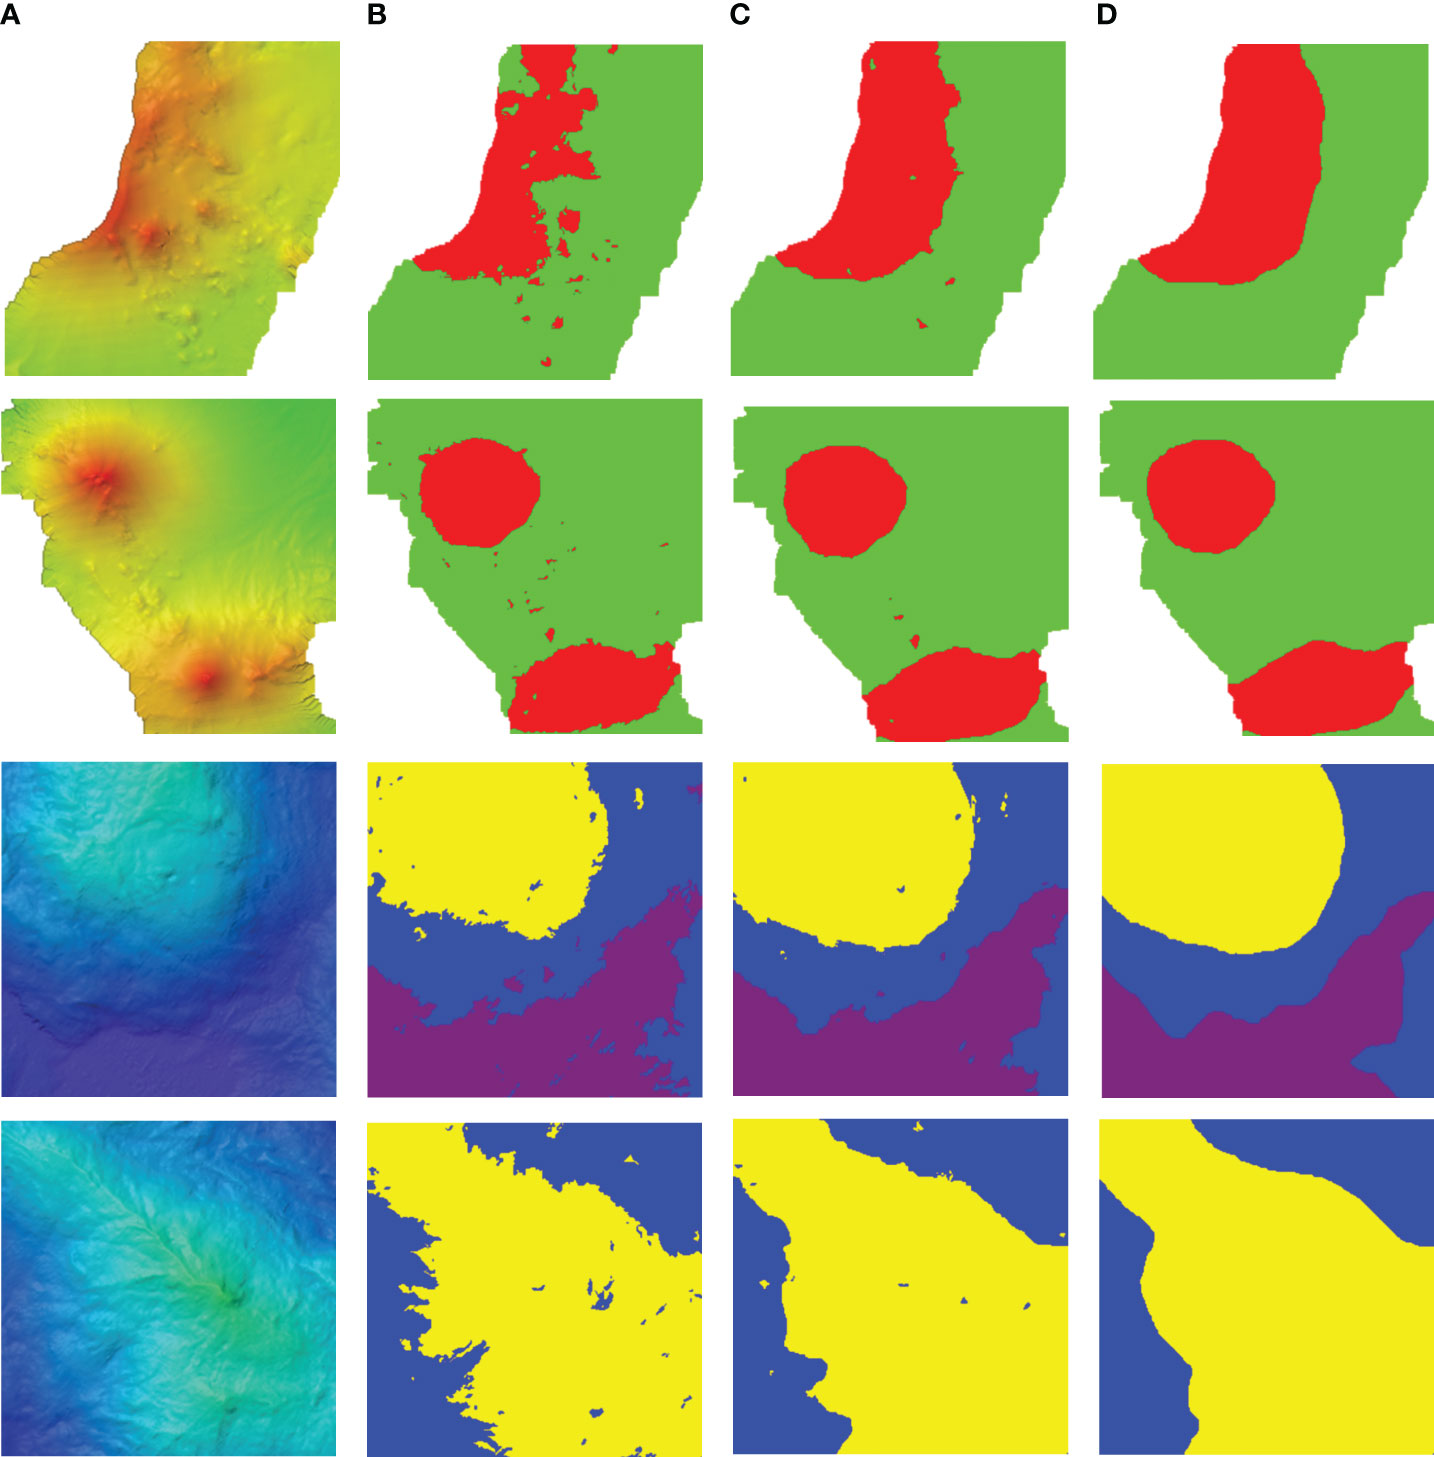
Figure 5 Visualization of an example MBES image segmentation result. (A) Example MBES image, (B) FCN-8s, (C) the proposed scheme, (D) ground truth.
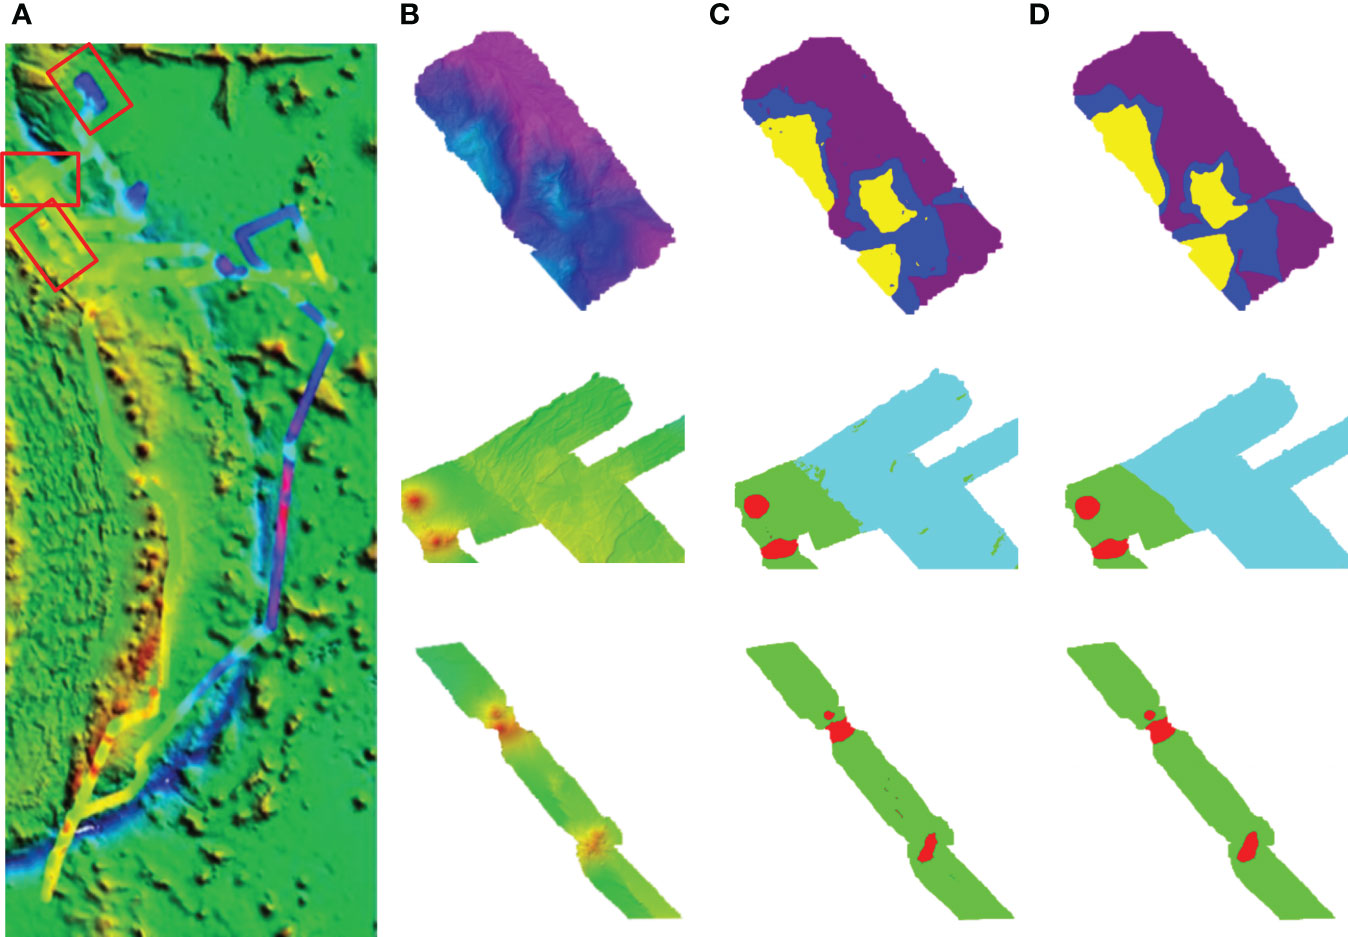
Figure 6 Multibeam bathymetric seafloor mapping along waypoints around the Mariana Trench. (A) Location of waypoints, (B) Example MBES image, (C) segmentation result, (D) ground truth.
Furthermore, we made an attempt to focus on a more delicate observation and a preliminary study of how the seafloor surface stretching functions as a submarine benthic habitat and what type of biogeographic pattern distribution of the benthic organisms are present in the extremely deep sea, with the help of both the acoustic sensor on board the research vessel Okeanos Explorer and the optical sensor mounted in the ROV Deep Discoverer. A total of 10,000 underwater images of the dominant resident biological species and their corresponding habitats, at dive depths within a range of 250-5000m, included Rimicaris, Austinograea, Symphurus thermophiles, Bathymodiolus, Phenacolepadidae, Shinkailepas, Thoridae Lebbeus, Lamellibrachia, etc., and were considered as our alternative underwater vision dataset for this preliminary study. The primary benthic species retrieved from the video of each dive by the ROV Deep Discoverer during the EX1605L3 expedition route are recorded in Supplementary Table M1.
We established a global geographical link between the ROV dive path and the MBES bathymetric mapping route. Figure 7 shows the connection between the latitude and longitude of the example ROV dive paths and the location of the MBES imaging survey, including the original example MBES bathymetric mapping, the corresponding seafloor surface categories, the ROV dive paths on Eifuku Seamount and Daikoku Seamount, and the possible typical benthic habitats retrieved from visual cues along the paths, thus linking the seafloor surface topography with the primary benthic biogeographic patterns. We tried to statistically match the corresponding primary benthic habitats and species with the seafloor surface stretching by roughly retrieving the microgeographic cues from each ROV dive, and subdividing the benthic habitats with the visual cues from optical sensing. Figure 8 lists some examples of dominant benthic habitats and species that visually reflect the possible biogeographic patterns that respectively appeared and were distributed at distinct locations of the seamount above Figures 8A–F and the seamount below Figures 8G–L, which also makes it possible to provide an initial insight into the diversity and distribution of the benthic community.
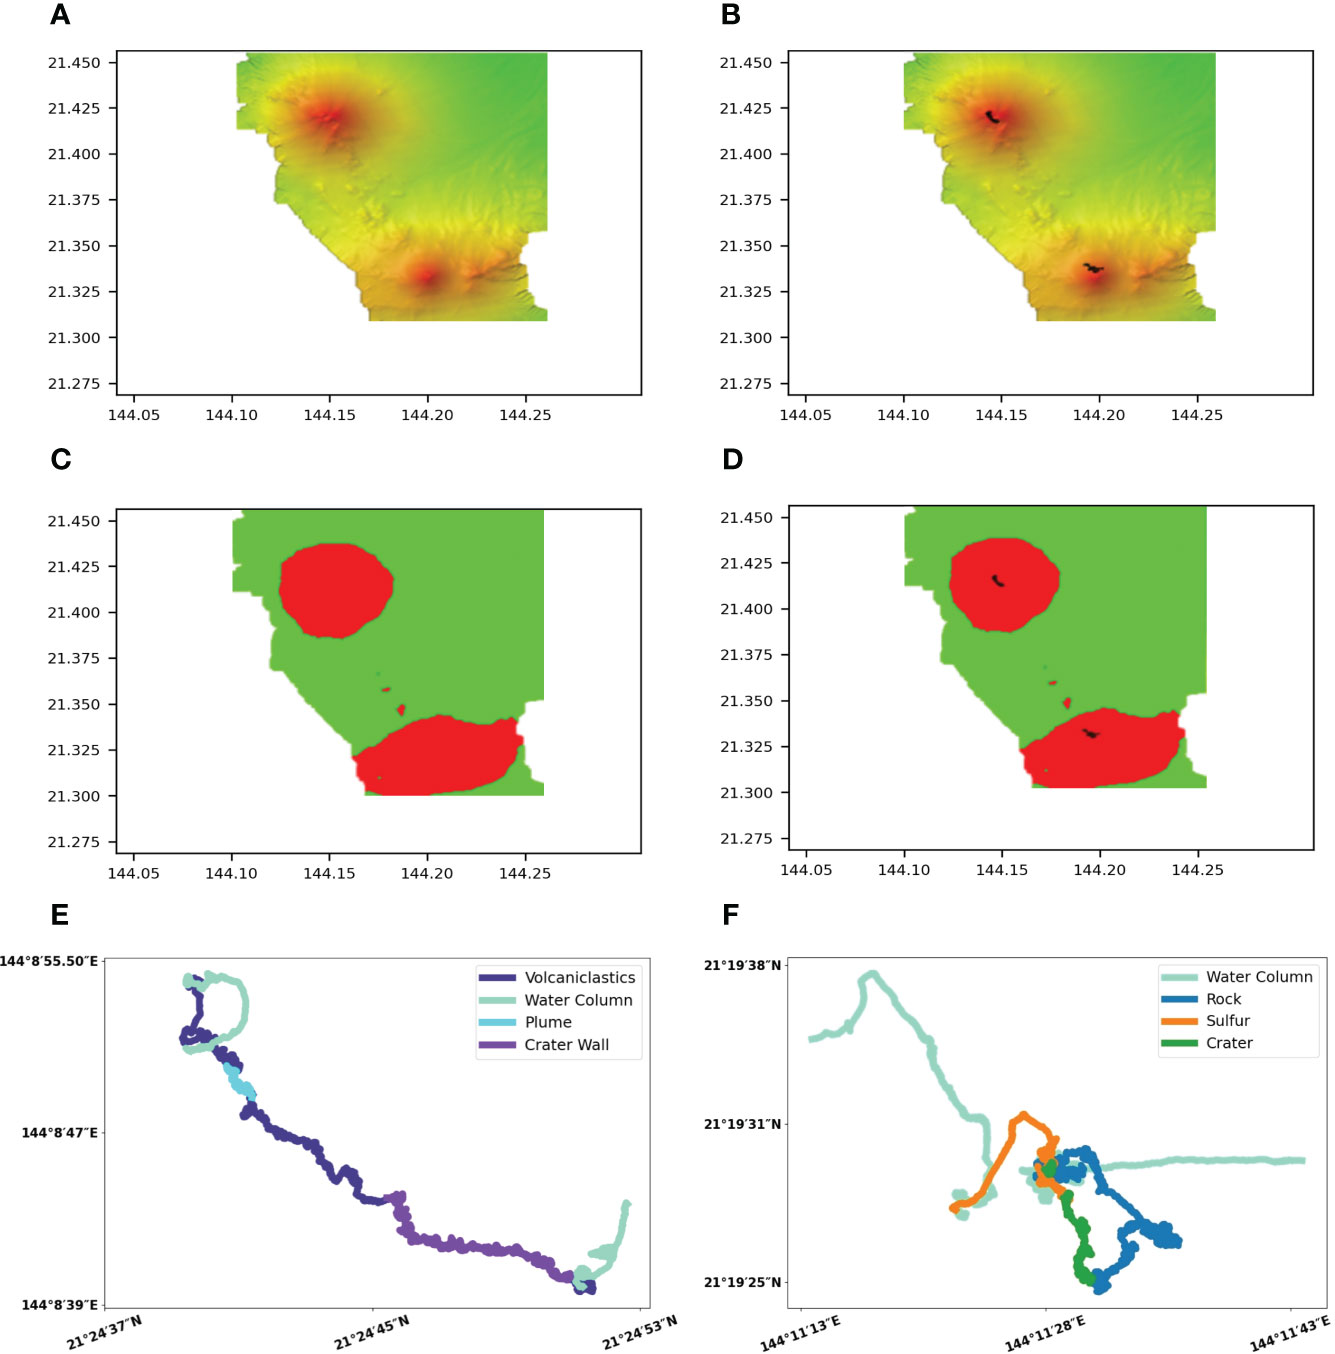
Figure 7 The connection between the latitude and longitude of Dive8 and Dive9 path and the geographical location of MBES imaging survey. (A) MBES bathymetric mapping, (B) geographical linkage between ROV diving path and the route of MBES bathymetric mapping, (C) segmentation result of MBES imaging, (D) geographical linkage between ROV diving path and segmentation result of MBES imaging, (E) Dive8 diving path maps, (F) Dive9 diving path maps.
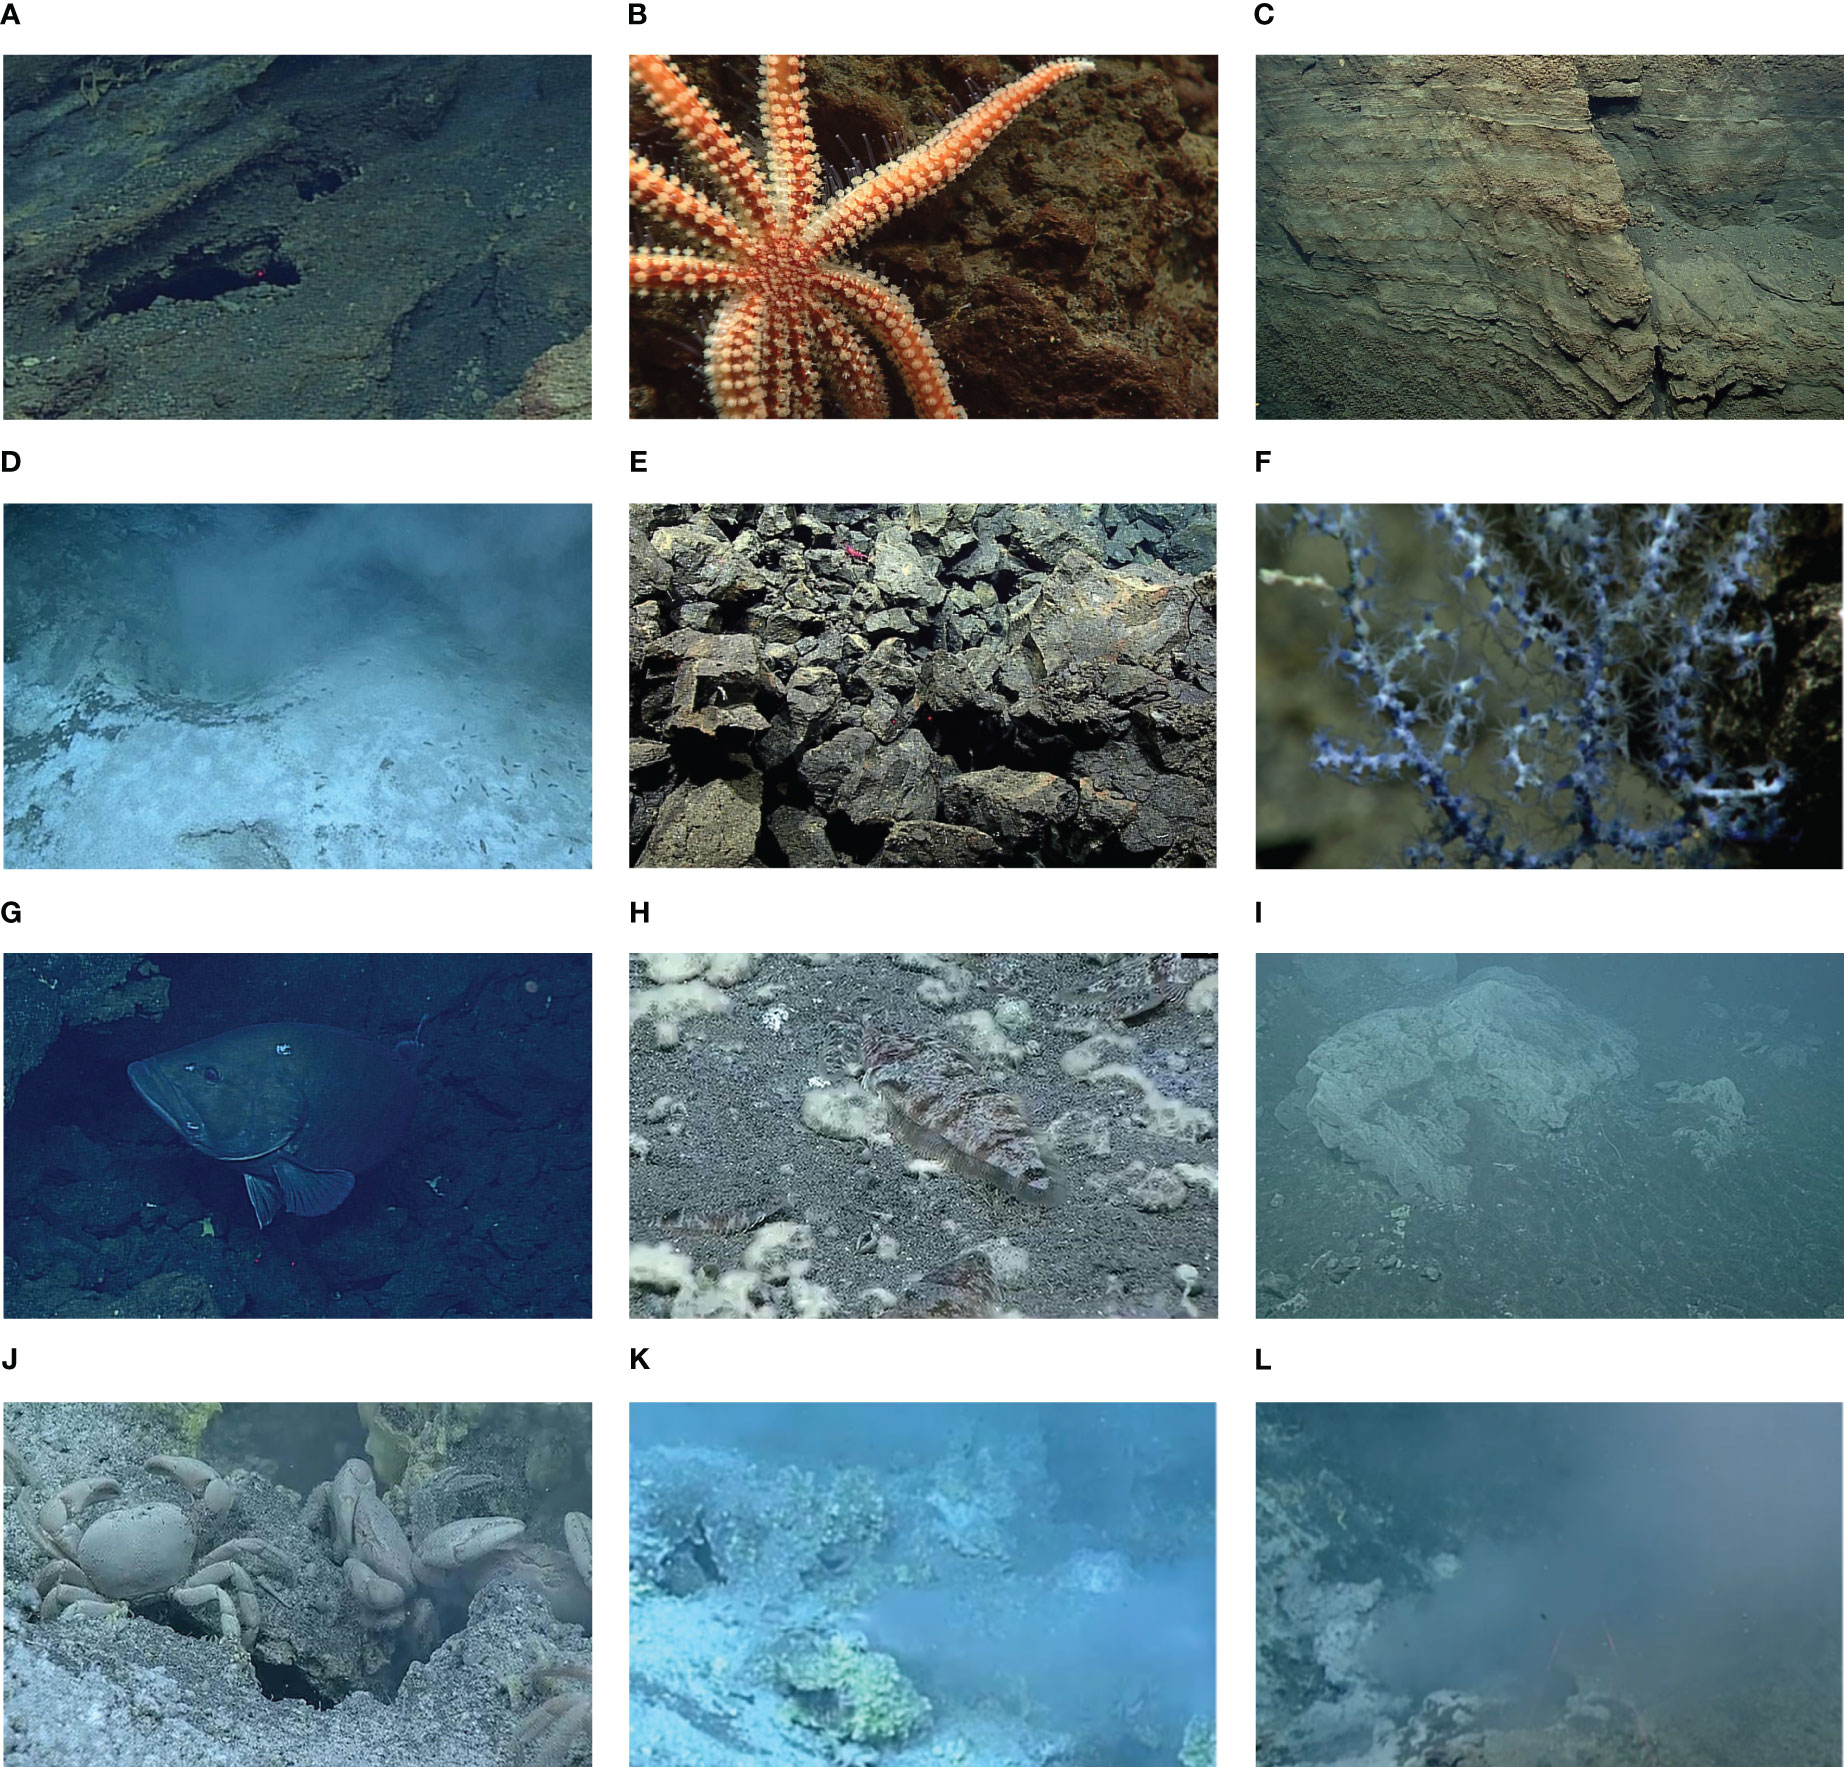
Figure 8 Preliminary study of benthic habitats with both acoustic and optical sensors along the ROV dive path above and below. (A) old hydrothermal chimney, (B) coronaster seastar, (C) crater wall, (D) grouper, (E) volcaniclastics, (F) octocoral fauna, (G) sulfur, (H) Symphurus thermophilus, (I) volcanic rock, (J) Gandalfus yunohana, (K) crater, (L) volcanic smoke.
It could be seen from the visual clues from the ROV dive on Eifuku Seamount that the benthic species, especially fish and octocoral fauna, were unexpectedly diverse, and the typical geomorphology discovered included the crater wall and the hydrothermal chimney structure near the summit, while the visual clues from the ROV dive on Daikoku Seamount demonstrated the high activity of the hydrothermal vents, the possible evidence of the recent eruption, the volcaniclastics, the sulfur pond and the thick volcanic smoke, the plume, and the flatfish communities, e.g., Symphurus thermophilus and Gandalfus yunohana. The extent of the seafloor surface stretching and the estimation of the primary benthic biogeographic patterns reflect the coupling variation of multivariate environmental variables in the deep sea. The associative study derived from the sparse observation statistics through both acoustic and optical sensors not only produces the possibility of capturing the potential relationships between the full coverage of seafloor mapping and the benthic habitats, even the benthic species assemblage maps, but also provides the opportunity to examine the predicted biogeographic patterns with better-described variations and uncertainties towards the distinct geographical characteristics of seafloor surfaces.
The extent to which the seafloor surface stretches and the benthic community survives and thrives, strongly reflecting the coupling variation of multivariate environmental factors, is still poorly understood in the extreme deep sea. With access to advanced sensing techniques, especially those related to the deployment of ROVs and AUVs, more attention has been paid to accumulating benthic biogeographic knowledge from these less-mapped or even unknown deep-sea regions. In this paper, an effort has been made to explore how to build online computing strategies for underwater vehicles that enable them to reasonably classify seafloor surface categories and identify the potential biogeographic patterns when underwater vehicles proceed along waypoints, in favor of a deep learning-based framework, DenseNet. We directly utilized multibeam bathymetric mapping from high-resolution MBES scans and manually labeled the seafloor surfaces as the standard references, i.e., island slope ridge, island slope, island slope deepwater terrace, trench seamount group, trench edge slope, trench bottom basin, island platform, and slope fault basin. We initially applied the individual and joint morphological cues in combination, in terms of slope, surface roughness, and curvature, in relation to the formation and evolution processes, to help semantic mapping and localization, which agglomerated assigned elevation points with highly similar topological parameters for the identical seafloor categories and deviated from the significantly inconsistent outlier elevation points. We then established an upgraded Densenet121 backbone from the minimalistic transition-up blocks in the upsampling path, systematically strengthening the dominant feature propagation and encouraging multi-scale feature reuse by employing both the channel attention module and the spatial pyramid pooling, and derived the types of seafloor categories with specific morphological parameters. We integrated the channel attention module by sequentially inferring channel-wise attention maps from both the Average pooling and the Max pooling in parallel. Meanwhile, we applied spatial pyramid pooling to incorporate the momentous global contextual prior by aggregation along with sub-regions from multiple receptive fields in a pyramidal manner. From the experiment results, it was demonstrated that the seafloor stretching classification accuracy of our proposed scheme could reach up to 89.87%, 82.01%, and 73.52% on average in terms of PA, MPA, and MIoU metrics, achieving comparable performances with state-of-the-art deep learning frameworks such as FCN-8s, SegNet, RefineNet, PSPNet, and DeepLab v3+, which permits us to delicately and adaptively distinguish the specific seafloor categories and connect the probable submarine benthic habitats. We also made a preliminary study on the potential biogeographic distribution statistics, showing the premise of deploying underwater vehicles through unbiased means or pre-programmed path planning to quantify and estimate the specific types of seafloor categories and the exhibiting fine-scale biogeographic patterns. The proposed scheme commits to developing smart capabilities embedded in underwater vehicles that could integrate the geometrical, topological, morphological, and biogeographic evidence yielded from MBES and optical sensing and hopefully perform habitat delineation, sampling programs, and other deep-sea tasks with more flexibility and adaptability. In the future, we will tentatively extend our proposed seafloor classification scheme with more advanced deep learning frameworks, such as Transformers, and further implant them in underwater vehicles through lightweight solutions.
The original contributions presented in the study are included in the article/Supplementary Material. Further inquiries can be directed to the corresponding author. Ocean Exploration and Research (OER) digital atlas is available in the official website of the National Oceanic and Atmospheric Administration (NOAA) (http://www.noaa.gov/).
RN: Conceptualization, Methodology, Supervision, Programming, Formal analysis, Writing, Funding acquisition. SL: Methodology, Software, Formal analysis, Writing. ZL: Data curation, Methodology, Formal analysis, Writing. XYL: Data curation, Methodology, Programming. SR: Data curation, Methodology, Software, Formal analysis, Programming. YQ: Data curation, Writing. QL: Data curation, Writing. GH: Data curation, Writing. KS: Data curation, Writing. GZ: Programming, Software. LZ: Data curation, Software. LL: Software. BH: Supervision, Funding acquisition. TY: Supervision, Funding acquisition. XSL: Supervision. All authors contributed to the article and approved the submitted version.
The author(s) declare financial support was received for the research, authorship, and/or publication of this article. This work was supported by the National Key R&D Program (grant number 2019YFC1408304); the National High-Tech R&D 863 Program (grant number 2014AA093410); the National Key R&D Program (grant number 2016YFC0301400); the Natural Science Foundation of P. R. China (grant number 42376191); the Natural Science Foundation of P. R. China (grant number 31202036); the Natural Science Foundation of P. R. China (grant number 41376140).
We would like to acknowledge team member Jie Wang for his guidance in data analysis.
The authors declare that the research was conducted in the absence of any commercial or financial relationships that could be construed as a potential conflict of interest.
All claims expressed in this article are solely those of the authors and do not necessarily represent those of their affiliated organizations, or those of the publisher, the editors and the reviewers. Any product that may be evaluated in this article, or claim that may be made by its manufacturer, is not guaranteed or endorsed by the publisher.
The Supplementary Material for this article can be found online at: https://www.frontiersin.org/articles/10.3389/fmars.2023.1205142/full#supplementary-material
Bach W., Edwards K. J. (2003). Iron and sulfide oxidation within the basaltic ocean crust: implications for chemolithoautotrophic microbial biomass production. Geochimica Cosmochimica Acta 67 (20), 3871–3887. doi: 10.1016/S0016-7037(03)00304-1
Badrinarayanan V., Kendall A., Cipolla R. (2017). SegNet: A deep convolutional encoder-decoder architecture for image segmentation. IEEE Trans. Pattern Anal. Mach. Intell. 39 (12), 2481–2495. doi: 10.1109/TPAMI.2016.2644615
Bergquist D. C., Eckner J. T., Urcuyo I. A., Cordes E. E., Hourdez S., Macko S. A., et al. (2007). Using stable isotopes and quantitative community characteristics to determine a local hydrothermal vent food web. Mar. Ecol. Prog. Ser. 330, 49–65. doi: 10.3354/meps330049
Bewley M., Douillard B., Nourani-Vatani N., Friedman A., Pizarro O., Williams S. (2012). “Automated species detection: An experimental approach to kelp detection from sea-floor AUV images,” in Proc Australas Conf Rob Autom. Wellington, New Zealand. Vol. 2012.
Burrough P. A., McDonnell R. (1998). Principles of geographical information systems. (New York: Oxford University Press).
Cantwell K. (2016). “Final Project Instructions,” in EX-16-05 Leg 3: CAPSTONE CNMI & Mariana Trench MNM (rov & mapping), June 17-July 10, 2016.m depth of each dive.
Chakraborty B., Haris K., Latha G., Maslov N., Menezes A. (2013). Multifractal approach for seafloor characterization. IEEE Geosci. Remote Sens. Lett. 11 (1), 54–58. doi: 10.1109/LGRS.2013.2245856
Chen L. C., Papandreou G., Kokkinos I., Murphy K., Yuille A. L. (2018). DeepLab: semantic image segmentation with deep convolutional nets, atrous convolution, and fully connected CRFs. IEEE Trans. Pattern Anal. Mach. Intell. 40 (4), 834–848. doi: 10.1109/TPAMI.2017.2699184
Conti L. A., Lim A., Wheeler A. J. (2019). High resolution mapping of a cold water coral mound. Sci. Rep. 9 (1), 1016. doi: 10.1038/s41598-018-37725-x
Copley J. (2014). “Just how little do we know about the ocean floor?,” in The conversation. Available at: https://theconversation.com/just-how-little-do-weknow-about-the-ocean-floor-32751.
Corrêa P. V. F., Jovane L., Murton B. J., Sumida P. Y. G. (2022). Benthic megafauna habitats, community structure and environmental drivers at Rio Grande Rise (SW Atlantic). Deep Sea Res. Part I: Oceanographic Res. Papers 186, 103811. doi: 10.1016/j.dsr.2022.103811
Costa B. M., Battista T. A., Pittman S. J. (2009). Comparative evaluation of airborne LiDAR and ship-based multibeam SoNAR bathymetry and intensity for mapping coral reef ecosystems. Remote Sens. Environ. 113 (5), 1082–1100. doi: 10.1016/j.rse.2009.01.015
De Boer D. H. (1992). Hierarchies and spatial scale in process geomorphology: a review. Geomorphology 4 (5), 303–318. doi: 10.1016/0169-555X(92)90026-K
De la Torriente A., Serrano A., Fernández-Salas L. M., García M., Aguilar R. (2018). Identifying epibenthic habitats on the Seco de los Olivos Seamount: species assemblages and environmental characteristics. Deep Sea Res. Part I: Oceanographic Res. Papers 135, 9–22. doi: 10.1016/j.dsr.2018.03.015
Desbruyères D., Almeida A., Biscoito M., Comtet T., Khripounoff A., Le Bris N., et al (2000). A review of the distribution of hydrothermal vent communities along the northern Mid-Atlantic Ridge: dispersal vs. environmental controls. In Island, Ocean and Deep-Sea Biology: Proceedings of the 34th European Marine Biology Symposium, Ponta Delgada (Azores). Portugal, September 1999.
Dunlop K. M., Jarvis T., Benoit-Bird K. J., Waluk C. M., Caress D. W., Thomas H., et al. (2018). Detection and characterisation of deep-sea benthopelagic animals from an autonomous underwater vehicle with a multibeam echosounder: A proof of concept and description of data-processing methods. Deep Sea Res. Part I: Oceanographic Res. Papers 134, 64–79. doi: 10.1016/j.dsr.2018.01.006
Dyer A. S., Zaengle D., Suhag A., Mark-Moser M. K., Duran R., Rose K., et al. (2020). Deep Learning to Locate Seafloor Landslides in High Resolution Bathymetry (No. RSS624) (Pittsburgh, PA, Morgantown, WV, and Albany, OR (United States: National Energy Technology Laboratory (NETL).
Fisher C. R., Childress J. J., Macko S. A., Brooks J. M. (1994). Nutritional interactions in Galapagos Rift hydrothermal vent communities: inferences from stable carbon and nitrogen isotope analyses. Mar. Ecol. Prog. Ser. 103, 45–55. doi: 10.3354/meps103045
Freitag L., Grund M., Von Alt C., Stokey R., Austin T. (2005). A shallow water acoustic network for mine countermeasures operations with autonomous underwater vehicles. Underwater Defense Technol. (UDT), 1–6.
Friedman A., Pizarro O., Williams S. B., Johnson-Roberson M. (2013). Correction: multi-scale measures of rugosity, slope and aspect from benthic stereo image reconstructions. PloS One 7 (12), e50440. doi: 10.1371/annotation/55ee98d1-6731-4bee-81d6-03ce0259c191
Furlong M. E., Paxton D., Stevenson P., Pebody M., McPhail S. D., Perrett J. (2012). “Autosub long range: A long range deep diving AUV for ocean monitoring,” in 2012 IEEE/OES Autonomous Underwater Vehicles (AUV). Southampton, UK. 1–7.
Goodfellow I., Pouget-Abadie J., Mirza M., Xu B., Warde-Farley D., Ozair S., et al (2014). Generative adversarial nets. Advances in neural information processing systems, Quebec, Canada. June 2014.
Harris P. T., Macmillan-Lawler M., Rupp J., Baker E. K. (2014). Geomorphology of the oceans. Mar. Geology 352, 4–24. doi: 10.1016/j.margeo.2014.01.011
He K., Zhang X., Ren S., Sun J. (2015). Spatial pyramid pooling in deep convolutional networks for visual recognition. IEEE Trans. Pattern Anal. Mach. Intell. 37 (9), 1904–1916. doi: 10.1109/TPAMI.2015.2389824
He K., Zhang X., Ren S., Sun J. (2016). “Deep residual learning for image recognition,” in 2016 IEEE Conference on Computer Vision and Pattern Recognition (CVPR). Las Vegas, NV, USA. 770–778. doi: 10.1109/CVPR.2016.90
Hinton G. E., Osindero S., Teh Y. W. (2006). A fast learning algorithm for deep belief nets. Neural Comput. 18 (7), 1527–1554. doi: 10.1162/neco.2006.18.7.1527
Hu J., Shen L., Sun G. (2018). “Squeeze-and-excitation networks,” in Proceedings of the IEEE conference on computer vision and pattern recognition. Salt Lake City, UT, USA. 7132–7141. doi: 10.1109/TPAMI.2019.2913372
Huang G., Liu Z., van der Maaten L., Weinberger K. Q. (2017). “Densely connected convolutional networks,” in Proceedings of the IEEE conference on computer vision and pattern recognition. Honolulu, HI, USA. 4700–4708.
Huvenne V. A., Robert K., Marsh L., Lo Iacono C., Le Bas T., Wynn R. B. (2018). “Rovs and auvs,” in Submarine geomorphology. ed. Micallef A. (Berlin, Germany: Springer, Cham) 93–108.
Jannasch H. W., Mottl M. J. (1985). Geomicrobiology of deep-sea hydrothermal vents. Science 229 (4715), 717–725. doi: 10.1126/science.229.4715.717
Jégou S., Drozdzal M., Vázquez D., Romero A., Bengio Y. (2017). “The one hundred layers tiramisu: fully convolutional denseNets for semantic segmentation,” in 2017 IEEE Conference on Computer Vision and Pattern Recognition Workshops (CVPRW). Honolulu, HI, USA. 1175–1183.
Johnson K. S., Childress J. J., Beehler C. L., Sakamoto C. M. (1994). Biogeochemistry of hydrothermal vent mussel communities: the deep-sea analogue to the intertidal zone. Deep Sea Research Part I: Oceanographic Research Papers 41 (7), 993–1011. doi: 10.1016/0967-0637(94)90015-9
Karpathy A., Toderici G., Shetty S., Leung T., Sukthankar R., Fei-Fei L. (2014). “Large-scale video classification with convolutional neural networks,” in Proceedings of the IEEE conference on Computer Vision and Pattern Recognition. Columbus, OH, USA. 1725–1732.
Kreso I., Segvic S., Krapac J. (2017). “Ladder-style densenets for semantic segmentation of large natural images,” in Proceedings of the IEEE International Conference on Computer Vision Workshops. Venice, Italy. 238–245.
Krizhevsky A., Sutskever I., Hinton G. E. (2012). Imagenet classification with deep convolutional neural networks. Adv. Neural Inf. Process. Syst. 25, 1097–1105. doi: 10.1145/3065386
Kuhnz L. A., Ruhl H. A., Huffard C. L., Smith K. L. Jr. (2014). Rapid changes and long-term cycles in the benthic megafaunal community observed over 24 years in the abyssal northeast Pacific. Prog. Oceanography 124, 1–11. doi: 10.1016/j.pocean.2014.04.007
Lamarche G., Orpin A. R., Mitchell J. S., Pallentin A. (2016). “Benthic habitat mapping,” in Biological sampling in the deep sea. ed. Clark M. R. (New York, US: John Wiley & Sons) 80–102. doi: 10.1002/9781118332535
Lee Y., Hwang J., Lee S., Bae Y., Park J. (2019). “An energy and GPU-computation efficient backbone network for real-time object detection,” in 2019 IEEE/CVF Conference on Computer Vision and Pattern Recognition Workshops (CVPRW). Long Beach, CA, USA. 752–760.
Lin G., Milan A., Shen C., Reid I. (2017). “Refinenet: Multi-path refinement networks for high-resolution semantic segmentation,” in Proceedings of the IEEE conference on computer vision and pattern recognition. Honolulu, HI, USA. 1925–1934.
Long J., Shelhamer E., Darrell T. (2015). “Fully convolutional networks for semantic segmentation,” in Proceedings of the IEEE conference on computer vision and pattern recognition. Boston, MA, USA. 3431–3440.
Lonsdale P. (1977). Clustering of suspension-feeding macrobenthos near abyssal hydrothermal vents at oceanic spreading centers. Deep Sea Res. 24 (9), 857–863. doi: 10.1016/0146-6291(77)90478-7
Lu H., Yang R., Deng Z., Zhang Y., Gao G., Lan R. (2021). Chinese image captioning via fuzzy attention-based DenseNet-BiLSTM. ACM Trans. Multimedia Computing Communications Appl. (TOMM) 17 (1s), 1–18. doi: 10.1145/3422668
Luther G. W., Rozan T. F., Taillefert M., Nuzzio D. B., Meo C. D., Shank T. M., et al. (2001). Chemical speciation drives hydrothermal vent ecology. Nature 410, 813–816. doi: 10.1038/35071069
MacMillan R. A., McNabb D. H., Jones R. K. (2000). “Automated landform classification using DEMs: a conceptual framework for a multi-level, hierarchy of hydrologically and geomorphologicaly oriented physiographic mapping units,” in Proceedings of the 4th International Conference on Integrating GIS and Environmental, Modeling: Problems, Prospects and Research Needs. Banff, Alberta, Canada.
Mahmud M. R., Yusof O. M. (2006). The implementation of post-processing data thinning for multibeam echo sounding data. Int. Symposium Exhibition Geoinformation. 19, 21.
Marthiniussen R., Vestgard K., Klepaker R. A., Storkersen N. (2004). “HUGIN-AUV concept and operational experiences to date,” in Oceans' 04 MTS/IEEE Techno-Ocean'04 (IEEE Cat. No. 04CH37600). Kobe, Japan. Vol. 2. 846–850.
Martin-Abadal M., Riutort-Ozcariz I., Oliver-Codina G., Gonzalez-Cid Y. (2019). “A deep learning solution for Posidonia oceanica seafloor habitat multiclass recognition,” in OCEANS 2019-Marseille IEEE. Marseille, France. 1–7. doi: 10.1109/OCEANSE.2019.8867304
Masetti G., Mayer L. A., Ward L. G. (2018). A bathymetry-and reflectivity-based approach for seafloor segmentation. Geosciences 8 (1), 14. doi: 10.3390/geosciences8010014
McCollom T. M., Shock E. L. (1997). Geochemical constraints on chemolithoautotrophic metabolism by microorganisms in seafloor hydrothermal systems. Geochimica cosmochimica Acta 61 20, 4375–4391. doi: 10.1016/S0016-7037(97)00241-X
Millar S. W. S. (2013). “Spatial and temporal scales in geomorphology,” in The Foundations of Geomorphology (London: Elsevier), 130–145.
Misiuk B., Brown C. J. (2022). Multiple imputation of multibeam angular response data for high resolution full coverage seabed mapping. Mar. Geophysical Res. 43 (1), 7. doi: 10.1007/s11001-022-09471-3
Nakamura K., Takai K. (2014). Theoretical constraints of physical and chemical properties of hydrothermal fluids on variations in chemolithotrophic microbial communities in seafloor hydrothermal systems. Prog. Earth Planet Sci. 1, 5. doi: 10.1186/2197-4284-1-5
Neil H., Lamarche G., Mitchell J., MacKay K., Pallentin A. (2019). Multibeam echosounder mapping to identify seafloor habitats. In The 8th Land Administration Domain Model Workshop. Kuala Lumpur, Malaysia.
Nishizawa A., Kaneda K., Watanabe N., Oikawa M. (2009). Seismic structure of the subducting seamounts on the trench axis: Erimo Seamount and Daiichi-Kashima Seamount, northern and southern ends of the Japan Trench. Earth Planets Space 61 (3), e5–e8. doi: 10.1186/BF03352912
Panish R., Taylor M. (2011). “Achieving high navigation accuracy using inertial navigation systems in autonomous underwater vehicles,” in OCEANS 2011 IEEE-Spain IEEE. Santander, Spain. 1–7. doi: 10.1109/Oceans-Spain.2011.6003517
Perez J. A. A., Vizuete R. S., Ramil F., Castillo S. (2022). FISH, cephalopods and associated habitats of the Discovery rise seamounts, Southeast Atlantic. Deep Sea Res. Part I: Oceanographic Res. Papers 188, 103849. doi: 10.1016/j.dsr.2022.103849
Phillips J. D. (1988). The role of spatial scale in geomorphic systems. Geographical Anal. 20 (4), 308–317. doi: 10.1111/j.1538-4632.1988.tb00185.x
Pierdomenico M., Guida V. G., Macelloni L., Chiocci F. L., Rona P. A., Scranton M. I., et al. (2015). Sedimentary facies, geomorphic features and habitat distribution at the Hudson Canyon head from AUV multibeam data. Deep Sea Res. Part II: Topical Stud. Oceanography 121, 112–125. doi: 10.1016/j.dsr2.2015.04.016
Pillay T., Cawthra H. C., Lombard A. T. (2020). Characterisation of seafloor substrate using advanced processing of multibeam bathymetry, backscatter, and sidescan sonar in Table Bay, South Africa. Mar. Geology 429, 106332. doi: 10.1016/j.margeo.2020.106332
Pizarro O., Williams S. B., Jakuba M. V., Johnson-Roberson M., Mahon I., Bryson M., et al. (2013). “Benthic monitoring with robotic platforms—the experience of Australia,” in 2013 IEEE international underwater technology symposium (UT). Tokyo. 1–10. doi: 10.1109/UT.2013.6519909
Qin X., Luo X., Wu Z., Shang J. (2021). Optimizing the sediment classification of small side-scan sonar images based on deep learning. IEEE Access 9, 29416–29428. doi: 10.1109/ACCESS.2021.3052206
Rimavicius T., Gelzinis A. (2017). “A comparison of the deep learning methods for solving seafloor image classification task,” in Communications in Computer and Information Science, ed. Mobasheri A. (Berlin, Germany: Springer, Cham), 442–453. doi: 10.1007/978-3-319-67642-5_37
Sarrazin J., Juniper S. K., Massoth G. J., Legendre P. (1999). Physical and chemical factors influencing species distributions on hydrothermal sulfide edifices of the Juan de Fuca Ridge, northeast Pacific. Mar. Ecol. Prog. Ser. 190, 89–112. doi: 10.3354/meps190089
Sawa T., Aoki T., Yamamoto I., Tsukioka S., Yoshida H., Hyakudome T., et al. (2005). Performance of the fuel cell underwater vehicle URASHIMA. Acoustical Sci. Technol. 26 (3), 249–257. doi: 10.1250/ast.26.249
Shary P. A. (1995). Land surface in gravity points classification by a complete system of curvatures. Math. Geol 27 (3), 373–390. doi: 10.1007/BF02084608
Singh H., Armstrong R., Gilbes F., Eustice R., Roman C., Pizarro O., et al. (2004). Imaging coral I: imaging coral habitats with the SeaBED AUV. Subsurface Sens. Technol. Appl. 5 (1), 25–42. doi: 10.1023/B:SSTA.0000018445.25977.f3
Smale D. A., Kendrick G. A., Harvey E. S., Langlois T. J., Hovey R. K., Van Niel, et al. (2012). Regional-scale benthic monitoring for ecosystem-based fisheries management (EBFM) using an autonomous underwater vehicle (AUV). ICES J. Mar. Science: J. du Conseil 69, 1108–1118. doi: 10.1093/icesjms/fss082
Snelgrove P. V. (1998). The biodiversity of macrofaunal organisms in marine sediments. Biodiversity Conserv. 7 (9), 1123–1132. doi: 10.1023/A:1008867313340
Swanborn D. J. B., Huvenne V. A. I., Malpas T., Pittman S. J., Rogers A. D., Taylor M. L., et al. (2023). Seamount seascape composition and configuration shape Southwest Indian Ridge fish assemblages. Deep Sea Res. Part I: Oceanographic Res. Papers 191, 103921. doi: 10.1016/j.dsr.2022.103921
Tamura K., Aoki T., Nakamura T., Tsukioka S., Murashima T., Ochi H., et al. (2000). “The development of the AUV-urashima,” in OCEANS 2000 MTS/IEEE Conference and Exhibition. Conference Proceedings (Cat. No. 00CH37158) IEEE. Providence, RI, USA. Vol. 1. 139–146.
Teixeira J. B., Martins A. S., Pinheiro H. T., Secchin N. A., de Moura R. L., Bastos A. C. (2013). Traditional ecological knowledge and the mapping of benthic marine habitats. J. Environ. Manage. 115, 241–250. doi: 10.1016/j.jenvman.2012.11.020
Thornton B., Bodenmann A., Pizarro O., Williams S. B., Friedman A., Nakajima R., et al. (2016). Biometric assessment of deep-sea vent megabenthic communities using multi-resolution 3D image reconstructions. Deep Sea Res. Part I: Oceanographic Res. Papers 116, 200–219. doi: 10.1016/j.dsr.2016.08.009
Trenkel V. M., Lorance P., Mahévas S. (2004). Do visual transects provide true population density estimates for deepwater fish? ICES J. Mar. Sci. 61 (7), 1050–1056. doi: 10.1016/j.icesjms.2004.06.002
Urra J., Palomino D., Lozano P., González-García E., Farias C., Mateo-Ramírez Á., et al. (2021). Deep-sea habitat characterization using acoustic data and underwater imagery in Gazul mud volcano (Gulf of Cádiz, NE Atlantic). Deep Sea Res. Part I: Oceanographic Res. Papers 169, 103458. doi: 10.1016/j.dsr.2020.103458
Van Dover C. L., German C. R., Speer K. G., Parson L. M., Vrijenhoek R. C. (2002). Evolution and biogeography of deep-sea vent and seep invertebrates. Science 295, 1253–1257. doi: 10.1126/science.1067361
Vaswani A., Shazeer N. M., Parmar N., Uszkoreit J., Jones L., Gomez A. N., et al. (2017). Attention is All you Need (ArXiv). NIPS'17: Proceedings of the 31st International Conference on Neural Information Processing Systems, Long Beach. California, USA.
Wang R. J., Li X., Ao S., Ling C. X. (2018). Pelee: A Real-Time Object Detection System on Mobile Devices (NeurIPS). NIPS'18: Proceedings of the 32nd International Conference on Neural Information Processing Systems. Montréal, Canada. 3–8.
Wang A., Tao C., Zhang G., Shen C., Liu Y. (2021b). Seafloor classification based on deep-sea multibeam data—Application to the Southwest Indian Ridge at 50.47° E. J. Appl. Geophysics 185, 104259. doi: 10.1016/j.jappgeo.2021.104259
Wang M., Wu Z., Best J., Yang F., Li X., Zhao D., et al. (2021a). Using multibeam backscatter strength to analyze the distribution of manganese nodules: A case study of seamounts in the Western Pacific Ocean. Appl. Acoustics 173, 107729. doi: 10.1016/j.apacoust.2020.107729
Williams S. B., Pizarro O., Jakuba M., Barrett N. (2010). “AUV benthic habitat mapping in south eastern Tasmania,” in Field and Service Robotics (Berlin, Heidelberg: Springer), 275–284.
Williams S. B., Pizarro O. R., Jakuba M. V., Johnson C. R., Barrett N. S., Babcock R. C., et al. (2012). Monitoring of benthic reference sites: using an autonomous underwater vehicle. IEEE Robotics Automation Magazine 19 (1), 73–84. doi: 10.1109/MRA.2011.2181772
Woo S., Park J., Lee J. Y., Kweon I. S. (2018). “Cbam: Convolutional block attention module,” in Proceedings of the European conference on computer vision (ECCV). Munich, Germany. 3–19.
Wu Z., Yang F., Tang Y., Wu Z., Yang F., Tang Y. (2021). Multibeam bathymetric technology. High-resolution Seafloor Survey Appl., 21–76. doi: 10.1007/978-981-15-9750-3_2
Xiao B., Yang Z., Qiu X., Xiao J., Wang G., Zeng W., et al. (2021). PAM-DenseNet: A deep convolutional neural network for computer-aided COVID-19 diagnosis. IEEE Trans. Cybernetics 52 (11), 12163–12174. doi: 10.1109/tcyb.2020.3042837
Zhao H., Shi J., Qi X., Wang X., Jia J. (2017). “Pyramid scene parsing network,” in Proceedings of the IEEE conference on computer vision and pattern recognition. Honolulu, HI, USA. 2881–2890. doi: 10.1109/CVPR.2017.660
Zhao D., Wu Z., Zhou J., Wang M., Liu Z. (2020). Parameter group optimization by combining CUBE with surface filtering and its application. J. Geodesy Geoinformation Sci. 3 (2), 81. doi: 10.11947/j.JGGS.2020.0209
Keywords: multi-beam bathymetric mapping, seafloor stretching morphology, DenseNet, channel attention module, spatial pyramid pooling, biogeographic patterns
Citation: Nian R, Liu S, Lu Z, Li X, Ren S, Qian Y, Li Q, He G, Shi K, Zhang G, Zang L, Li L, He B, Yan T and Li X (2023) Toward the development of smart capabilities for understanding seafloor stretching morphology and biogeographic patterns via DenseNet from high-resolution multibeam bathymetric surveys for underwater vehicles. Front. Mar. Sci. 10:1205142. doi: 10.3389/fmars.2023.1205142
Received: 03 May 2023; Accepted: 16 October 2023;
Published: 24 November 2023.
Edited by:
Benjamin Misiuk, Dalhousie University, CanadaReviewed by:
Xiaodong Shang, Naval University of Engineering, ChinaCopyright © 2023 Nian, Liu, Lu, Li, Ren, Qian, Li, He, Shi, Zhang, Zang, Li, He, Yan and Li. This is an open-access article distributed under the terms of the Creative Commons Attribution License (CC BY). The use, distribution or reproduction in other forums is permitted, provided the original author(s) and the copyright owner(s) are credited and that the original publication in this journal is cited, in accordance with accepted academic practice. No use, distribution or reproduction is permitted which does not comply with these terms.
*Correspondence: Rui Nian, bmlhbnJ1aV84MEAxNjMuY29t
Disclaimer: All claims expressed in this article are solely those of the authors and do not necessarily represent those of their affiliated organizations, or those of the publisher, the editors and the reviewers. Any product that may be evaluated in this article or claim that may be made by its manufacturer is not guaranteed or endorsed by the publisher.
Research integrity at Frontiers
Learn more about the work of our research integrity team to safeguard the quality of each article we publish.