 Christine A. Madden Hof1,2*
 Amelia A. Desbiens3Jeff Kinch4Nancy N. Fitzsimmons5Hayley Versace6Angelique Amon7Nathan McIntyre5
 Kathy A. Townsend1
 Michael P. Jensen2,5,8
- 1School of Science, Technology, and Engineering, University of the Sunshine Coast, Sippy Downs, QLD, Australia
- 2World Wide Fund for Nature, Healthy Land and Seascapes, Brisbane, QLD, Australia
- 3Marine Spatial Ecology Lab, University of Queensland, School of Biological Sciences, St Lucia, QLD, Australia
- 4Food and Agriculture Organisation of the United Nations, Sub-Regional Office for the Pacific, Apia, Samoa
- 5Australian Rivers Institute, Griffith University, Nathan, QLD, Australia
- 6The Coral Islands Limited, Panasesa Island, Papua New Guinea
- 7Lissenung Resort Island, Kavieng, Papua New Guinea
- 8Department of Chemistry and Bioscience, Aalborg University, Aalborg, Denmark
This study investigated the genetic structure, diversity, and migratory patterns of hawksbill turtles (Eretmochelys imbricata) from two nesting locations in Papua New Guinea (PNG) using mitochondrial DNA (mtDNA) sequencing and satellite telemetry. Tissue samples collected from nesting female hawksbill turtles (n=75) in PNG revealed a total of 6 haplotypes from the Conflict Group site and 5 haplotypes from Kavieng site, with the Conflict Group and Kavieng samples significantly differing from one another and all other known Asia-Pacific stocks. This finding expands our understanding of the genetic stock structure of hawksbill turtles in the Asia-Pacific region, resulting in 9 Management Units (MUs) now published. Satellite tracking of 15 hawksbill turtles revealed that all individuals migrated from the Conflict Group westerly towards foraging areas in eastern Australia (93%) and PNG (7%). With a mean migration path distance of 1241 ± 108 km, three distinct migration strategies were used by the 10 hawksbill turtles that made it to their foraging grounds in the I) eastern Torres Strait, II) Far North Queensland, and III) western PNG waters. A broad scope of home-range strategies and sizes (95% UD) were used, and in comparison to other studies further postulates that hawksbills are connected to non-specific foraging grounds associated with food source availability. This study provides for the first time in PNG essential insights into hawksbill turtle population structure and connectivity in the western Pacific region, highlighting the importance of effectively conserving and managing this critically endangered species as distinct population stocks. Furthermore, we make recommendations for national and regional conservation strategies and transboundary management to ensure the long-term survival and recovery of western Pacific’s hawksbill turtle populations.
1 Introduction
The hawksbill turtle, Eretmochelys imbricata, is found in subtropical marine systems worldwide, but many populations are declining, particularly in the Indian and Western Pacific regions (Mortimer and Donnelly, 2008; Hamann et al., 2022; Madden Hof et al., 2022). Although Australia was reported to have one of the world’s largest remaining hawksbill nesting populations (Limpus and Miller, 2008; Limpus, 2009), expiration as early as 2032 was recently predicted for the north-east Queensland (neQld) genetic stock (Bell et al., 2020). This raises concern that hawksbill populations in neighbouring countries, with less protection, may face similar trajectories. Hawksbill turtles, considered “Critically Endangered” internationally, are listed differently throughout the western Pacific. For example, hawksbills are considered “Vulnerable” under Australian legislation but not listed in or protected by any laws in Papua New Guinea (PNG) (EPBC Act, 1999; Mortimer and Donnelly, 2008; Kinch and Burgess, 2009; Kinch, 2020a). This disparity is concerning because hawksbills are among the least-studied of the six marine turtle species (Limpus, 2009). With broad information gaps across Asia-Pacific (Hamann et al., 2022; Madden Hof et al., 2022), substantial new information is required to inform immediate and effective management and conservation action.
There is a shortage of research on hawksbills in PNG, with only a limited number of studies to date. Previous work has focused primarily on broad historical analysis (Pritchard, 1978; Spring, 1982a; Spring, 1982b) or short-term population assessments, primarily restricted to the Milne Bay Province (MBP) (Kinch, 2003a; Wangunu et al., 2004).
Louisiade Archipelago has the largest area of reef in the MBP (at about 7,980 km²; Skewes et al., 2011) and is thought to support one of the largest populations of hawksbills nesting in PNG at the Engineer, Deboyne, Conflict and Jomard Group of Islands (Kinch, 2020a). Although sea turtles were monitored at the Jomard Group in 2003 (Kinch, 2003a) and on two separate occasions in the Conflict Group of Islands (Conflict Group) (Wangunu et al., 2004; Aigoma, 2009), there are currently no peer-reviewed publications on the genetic population structure, dynamics or trend estimates. The only demonstration that hawksbill populations are declining is provided by reports showing overexploitation (Wangunu et al., 2004). Although limited flipper tag returns have shown some connectivity between foraging ground areas in Australia and rookeries across the Bismarck-Solomon Sea region (Barr et al., 2021; Bell and Jensen, 2018; Limpus, 2009), there are also no published satellite tracking records to show migratory routes between nesting and foraging grounds.
According to a recent satellite telemetry study by Madden Hof et al. (2023), the neQld stock’s geographical range is likely limited to Australian waters. While this study also revealed a dominance of the neQld stock in western Queensland (western Torres Strait and western Cape York), the neQld stock shares east coast Queensland waters with mixed genetic stocks, including the Solomon Islands, Vanuatu, and foragers of unknown origin (Broderick et al., 1994; Limpus, 2009; Fitzsimmons and Limpus, 2014; Hamilton et al., 2015; Vargas et al., 2016; Bell and Jensen, 2018). Likewise, hawksbill turtles nesting in Solomon Island also migrate to the east coast of Queensland, Australia to forage (Hamilton et al., 2021). Limited tag returns show that turtles from eastern PNG use foraging areas along the Great Barrier Reef (Ange Amon pers. comm; Bell and Jensen, 2018; Hayley Versace pers. comm; Limpus, 2009). Yet, it remains unknown if hawksbill turtles nesting within PNG are part of the Solomon Island or neQld genetic stocks, also referred to as Management Units (MU’s), or if they are distinct.
In response, a conservation-based not-for-profit organisation, the Conflict Island Conservation Initiative (CICI), instigated a long-term saturation tagging program of hawksbill and green turtles (Chelonia mydas) at the Conflict Group in MBP, to monitor the populations and assess the level of poaching effort with the view to protect the turtle populations and their habitats within a marine protected area. Local people from the Engineer Group of Islands and the Deboyne Group of Islands harvest sea turtles and their eggs from the Conflict Group for consumption and trade (Kinch, 2003b; Kinch, 2020b). Historically, the Conflict Group has been granted as freeland title from 1846–2016 that includes various proposed developments, from sponge and pearl farms to the establishment of coconut plantations to produce copra and the developments of private island dominion of several bio-engineered islands and marinas. Today, the Conflict Group is owned and managed by Ian Gowrie-Smith, an Australian businessman, resulting in the establishment of CICI. Since 2016, saturation flipper tagging programmes have been conducted in the Conflict Group (CICI, 2018; CICI, 2019; CICI and Coral Islands Ltd., 2021; CICI and Coral Islands Ltd., 2022), with nesting hawksbill turtle numbers adequate for undertaking satellite tracking and genetic studies, which is a first for PNG.
Along a similar timescale, a conservation program began in 2013 at Lissenung Resort and the nearby islands of Ral and Edmago in New Ireland Province, PNG. Local people frequently harvest sea turtles from these islands. The conservation program includes nest monitoring on three islands and management of a hatchery to protect hatchlings as well as providing education and awareness, and employment opportunities. Over the years, the conservation program has protected more than 16,000 hawksbill hatchlings which enabled the opportunity to undertake wider genetic studies of hawksbill turtle populations in PNG.
Molecular (DNA) sampling provides a time-efficient and cost-effective way to assess the genetic stock structure and the geographical boundaries of individual stocks and can be used to connect turtles at foraging areas to their nesting population origin (stock origin). Based on mitochondrial DNA (mtDNA) there are currently seven distinct MU’s for hawksbill turtles in the Asia-Pacific region (Wahidah and Syed Abdullah, 2009; Nishizawa et al., 2016; Vargas et al., 2016) encompassing one or more rookeries. Many gaps remain however, limiting the use of accurate genetic stock assignments (LaCasella et al., 2021). In this case, satellite tracking studies can pinpoint migration paths and foraging ground home ranges, enhancing our comprehension of hawksbills’ finer-scale orientation, navigation, fidelity and habitat use (refer citations in Barr et al., 2021). By combining these methods, we can gain a much deeper understanding of the spatial dynamics of marine turtle populations, which is crucial for effective conservation planning and management.
Using a combination of satellite telemetry and genetic analysis, this study aimed to determine the stock structure of hawksbill turtles in PNG and the migration paths of MBP hawksbill turtles to their foraging grounds to assess their connectedness to the western Pacific and broader Asia-Pacific region, and inform future management and protection of hawksbills in PNG.
2 Materials and methods
2.1 Sample sites
This study was carried out at two hawksbill turtle nesting locations in PNG, separated by an approximate distance of 920 km (Figure 1).
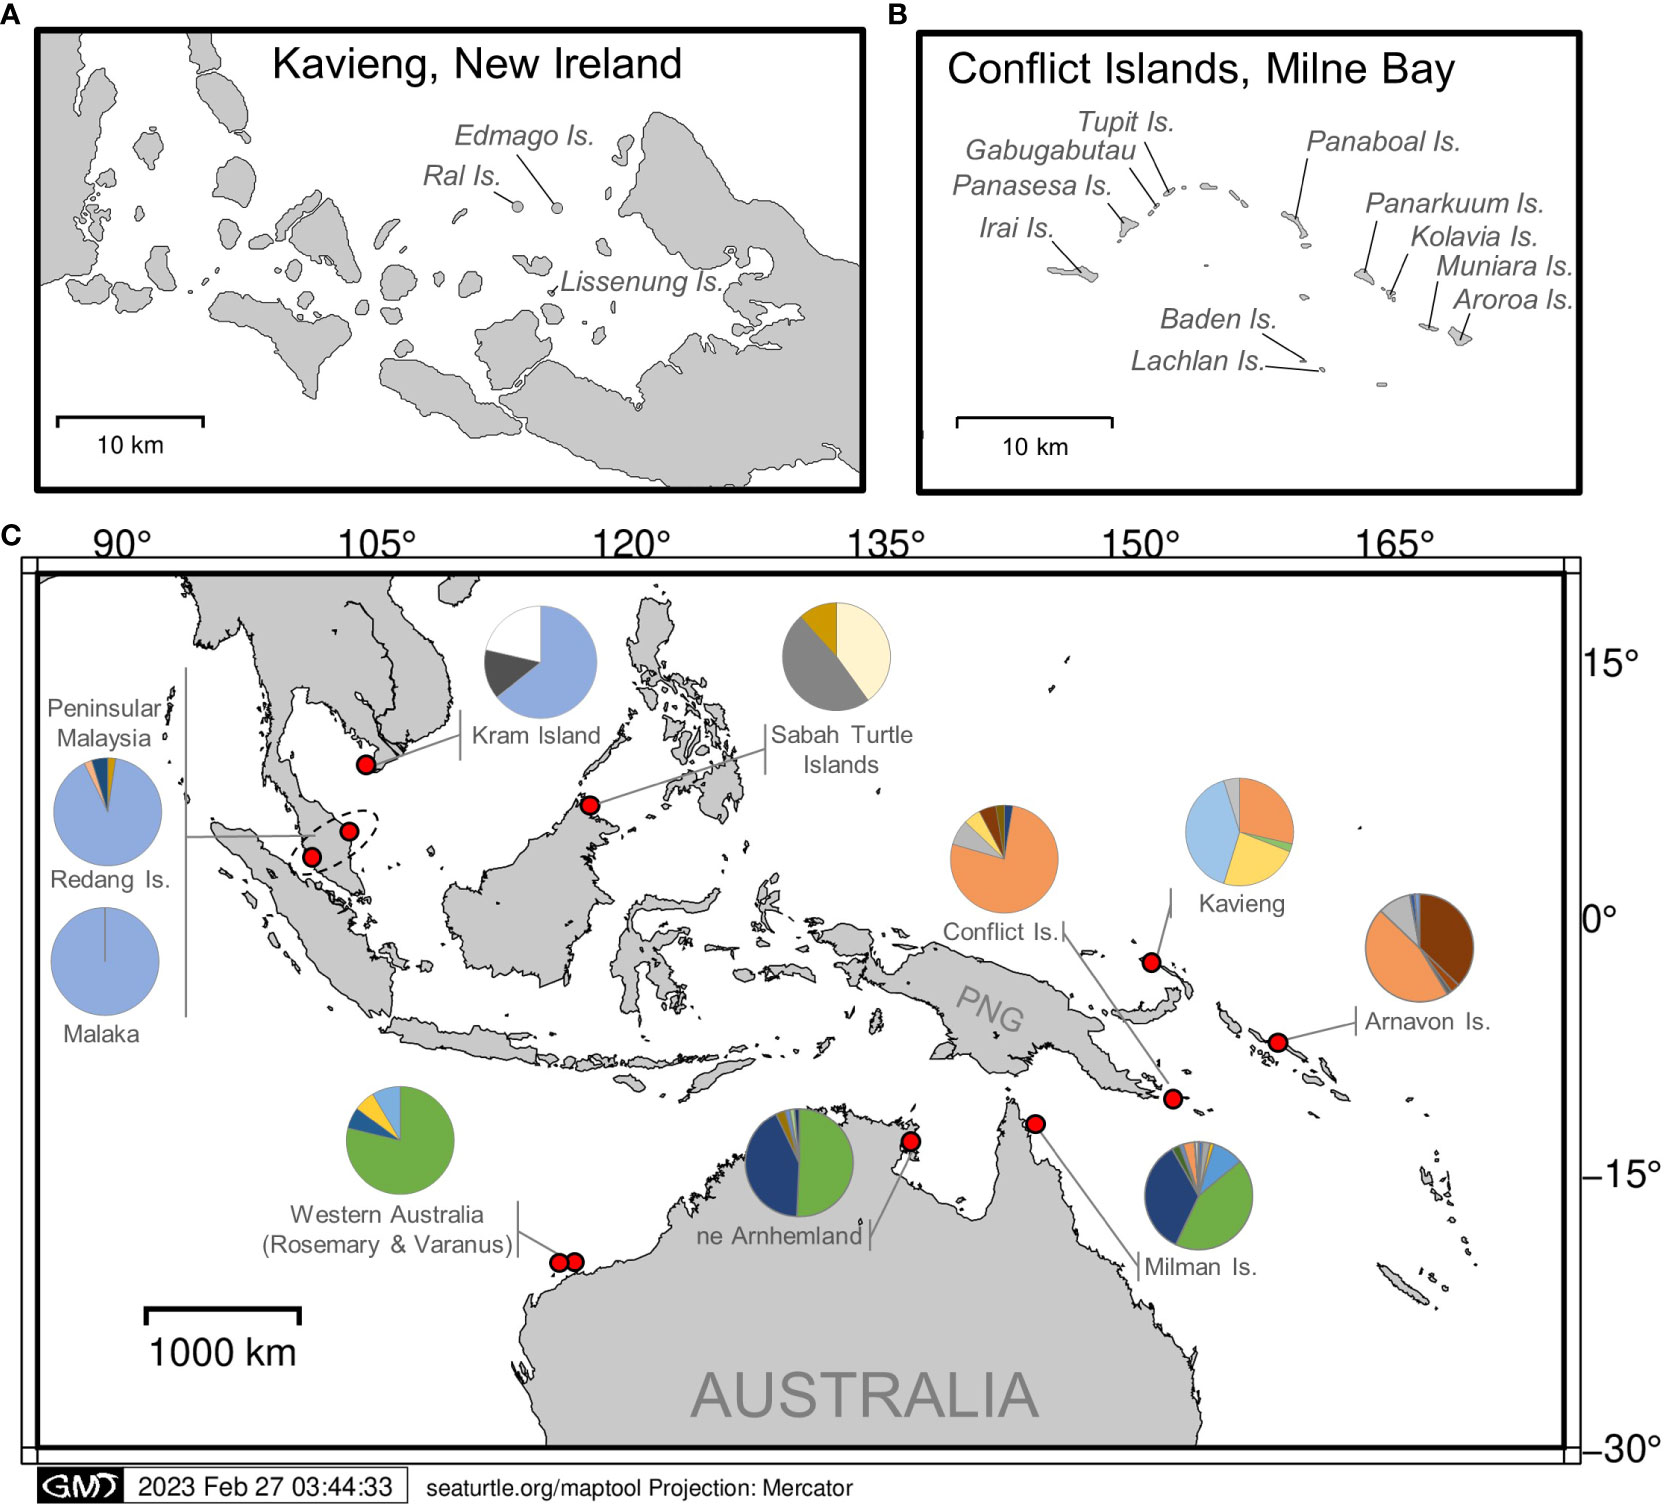
Figure 1 Locations of hawksbill turtle genetic sampling in (A) Kavieng, New Ireland Province and with the addition of satellite tagging, in (B) the Conflict Group of Islands, Milne Bay Province. (C) Sampling locations and haplotype frequencies (shown as pie graphs) across Asia-Pacific.
Conflict Group of Islands (10° 46’ 10.992’’ S; 151° 45’ 26.2512’’ E) is located approximately 150 km southeast of Alotau in the Louisiade Archipelago within MBP. The Conflict Group consists of 21 uninhabited islands, except for a small resort on Panasesa. The main islands include Irai, Gabugabutau, Tupit (Tobiki), Panarakuum, Kolavia, Muniara, Aroroa, and the Reef Islands. Both satellite tracking and genetic sampling were conducted at the Conflict Group during the nesting season (November–March) from 2017 to 2020.
Kavieng (2° 34’ 25” S; 150° 47’ 43” E) is located at the northern tip of the New Ireland Province. Since 2013, Ral island, Edmago island and the larger Lissenung Island, have been monitored for turtle nesting by the owners of Lissenung Resort. These islands are located to the west of the Kavieng township and remain unoccupied, except for a small resort on Lissenung. From mid-September to the end of March, a conservation project relocates marine turtle eggs to incubate in the resort hatchery. From 2015–2021, genetic samples from one hatchling per nest were collected and donated to this study.
2.2 Genetic sampling
At the Conflict Group, a total of 39 tissue samples were collected from nesting female hawksbill turtles across multiple islands from 2017 to 2020. Skin samples (<0.5 cm2) were collected using a scalpel blade from the front or rear trailing flipper and stored in 2 ml cryo-vials in >70% ethanol. At the Conflict Group, all nesting hawksbills were tagged with a titanium tag (Limpus, 1992), and measured for curved carapace length (CCL) before being released.
At Kavieng, 56 tissue samples were collected from hawksbill hatchlings on Ral, Edmago, and Lissenung Islands from 2015 to 2021. No nesting females were encountered at the Kavieng sites, but nests were translocated to a protected hatchery. One tissue sample was collected from a single hatchling from each nest and stored in 2 ml cryo-vials in >70% ethanol. All samples were stored (-20°C) and transferred to Griffith University in Australia for long-term storage and analysis.
All research was conducted under PNG’s National Research Institute approval. All genetic samples were transported to international universities for analysis under CITES permits 018140 and 022064 (export) and WT2019–000439 and PWS2021-AU-001689 (import).
2.3 Laboratory analysis
Genomic DNA was obtained from all samples using the salting out extraction method described in Jensen et al. (2013). The control region (or d-loop) of the mitochondrial genome was amplified to generate about 800 base pair sequences using LCM-15382 (5’ GCT TAA CCC TAA AGC ATT GG 3’) and H950g (5’ GTC TCG GAT TTA GGG GTT TG 3’) primers (Abreu-Grobois et al., 2006), PCR reactions were carried out in a 25 μl reaction volume. The PCR cycling parameters were as follows: an initial 4 min of DNA denaturation at 95°C, followed by 36 cycles of 25 s at 95°C, 25 s at the annealing, temperature, and 30 s at 72°C, followed by a final 2 min of extension at 72°C. The annealing temperature consisted of 2 cycles at 56°C, 2 cycles at 54°C and 33 cycles at 52°C. Each PCR setup included negative controls to detect contamination, and the PCR products were visualized on 1.2% agarose gels stained with SYBR Safe DNA Gel Stain (Thermo Fisher Scientific). The PCR products were purified, and sequenced by Macrogen Inc. (Seoul, Korea).
Raw sequences were edited using the software Geneious 6.1.7. (https://www.geneious.com). (Applied Biosystems, Foster City, California, USA). Each sequence was manually inspected for uncalled and miscalled bases, and all variable positions were confirmed by comparing sequences from the forward and reverse strands. Haplotypes were assigned by comparing aligned sequences to the ShellBank database (global marine turtle reference database; www.shellbankproject.org), which contains a reference library of published hawksbill haplotype sequences, and by searching the GenBank database (http://www.ncbi.nih.gov) The standardised nomenclature was used to name the new haplotypes using the EiIP prefix for Indo-Pacific hawksbill haplotypes, followed by the next number in order. New haplotypes were submitted to GenBank (http://www.ncbi.nih.gov). The sequences were then aligned, edited, and cropped at a standard cropping site of approximately 770 bp using Geneious Prime.
2.4 Population genetic analysis
We analysed all 39 Conflict Group hawksbills confirmed as independent nesting individuals through flipper tags. For Kavieng, a total of 52 samples were sequenced, but after excluding hatchling samples likely to be from the same mother, only 42 samples remained and were used for the final analysis. When the mother could be sampled (and tagged), one hatchling from each nest may represent the nesting female since they carry the same copy of mtDNA. However, since hawksbill turtles may lay 1–5 nests within a season, it is important to avoid pseudo-sampling (i.e. sampling the offspring from the same mother in consecutive nests). To ensure individual hatchlings from different mothers were selected, we applied a conservative 10 to 18-day window, the renesting interval for hawksbill turtles when hatchlings with the same haplotype could originate from the same mother. This was assumed for up to four consecutive nests. This let us rule out any hatchlings born during that time with the same haplotype, increasing the chance that samples represented individual nesting individuals (Table S1). Although we do not know the remigration interval for hawksbill turtles in PNG but likely 2-9 years (Limpus, 2009), and given the harvest pressure, the likelihood of re-sampling the same mother is reduced but pseudo-sampling across years cannot be ruled out. Furthermore, we observed no substantial differences in haplotype frequencies between the strategies (not removing samples and removing samples). Given these results, we are confident that regardless of the strategy applied, it will not significantly affect the study’s outcomes.
In addition to samples from rookeries in Kavieng and the Conflict Group we included data from nesting hawksbill turtles in Thailand at Kram Island (Wahidah and Syed Abdullah, 2009), Malaysia at Malaka Island, Redang Island, and Sabah Turtle Islands (Wahidah and Syed Abdullah, 2009; Nishizawa et al., 2016, Vargas et al., 2016), in Australia at Western Australia, northeast Arnhemland in the Northern Territory and north Queensland (Vargas et al., 2016; Bell and Jensen, 2018; LaCasella et al., 2021), and in the Solomon Islands (Vargas et al., 2016; LaCasella et al., 2021) (Table S2). We first tested for any significant genetic structure across years and studies to combine various published datasets from the region. These included five data sets from Sabah Turtle Islands in East Malaysia (Wahidah and Syed Abdullah, 2009; Nishizawa et al., 2016; Vargas et al., 2016), three datasets from Malaka (Wahidah and Syed Abdullah, 2009; Nishizawa et al., 2016) and three datasets for Redang (Nishizawa et al., 2016; Vargas et al., 2016) in Peninsular Malaysia, two datasets from Milman Island (Vargas et al., 2016; LaCasella et al., 2021) and two datasets from Arnavon, Solomon Islands (Vargas et al., 2016; LaCasella et al., 2021) (Table S2). All subsequent analyses were performed on pooled datasets across locations and years were appropriate.
Population structure was tested using pairwise FST comparisons and exact tests of population differentiation with the software Arlequin v 3.5.1.2 (Excoffier and Lischer, 2010). To determine significance, a probability level of P > 0.05 was used. A first round of pairwise comparisons tested temporal trends within previously published rookeries collected across different years and studies to determine if these could be combined or if haplotype composition had changed significantly over time. A second set of pairwise comparisons tested previously identified genetic stocks against the two new sites at Conflict group and Kavieng to assess the overall stock structure. Significance values for FST were obtained from 10,000 permutations. Exact tests of population differentiation were conducted with 100,000 permutations and 10,000 dememorization steps (Raymond and Rousset, 1995). Finally, haplotype (Hd) and nucleotide (π) diversity were calculated for each Management Unit using Arlequin v 3.5.1.2 (Excoffier and Lischer, 2010). Haplotype diversity was assessed following Nei (1987), and nucleotide diversity was computed using Tamura and Nei. (1993).
2.5 Post-nesting tracking and analysis
Sixteen Argos satellite tags (SPOT6, Wildlife Computers, Seattle, Washington, USA) were attached after oviposition to nesting hawksbill turtles found on various islands of the Conflict Group during the 2017-2018 and 2018-2019 nesting seasons (Figure 2; Table S4). As per Godley et al. (2002), satellite tags were attached anteriorly to the hawksbill turtle’s carapace and were released when the epoxy (Sika AnchroFix -3+) had completely cured to avoid turtles rubbing off the tag. The tags were additionally painted with International Micron 66 anti-fouling paint to prevent algal growth and other fouling organisms. All turtles curved carapace length (CCL) were measured and individually numbered titanium flipper tags were applied prior to release.
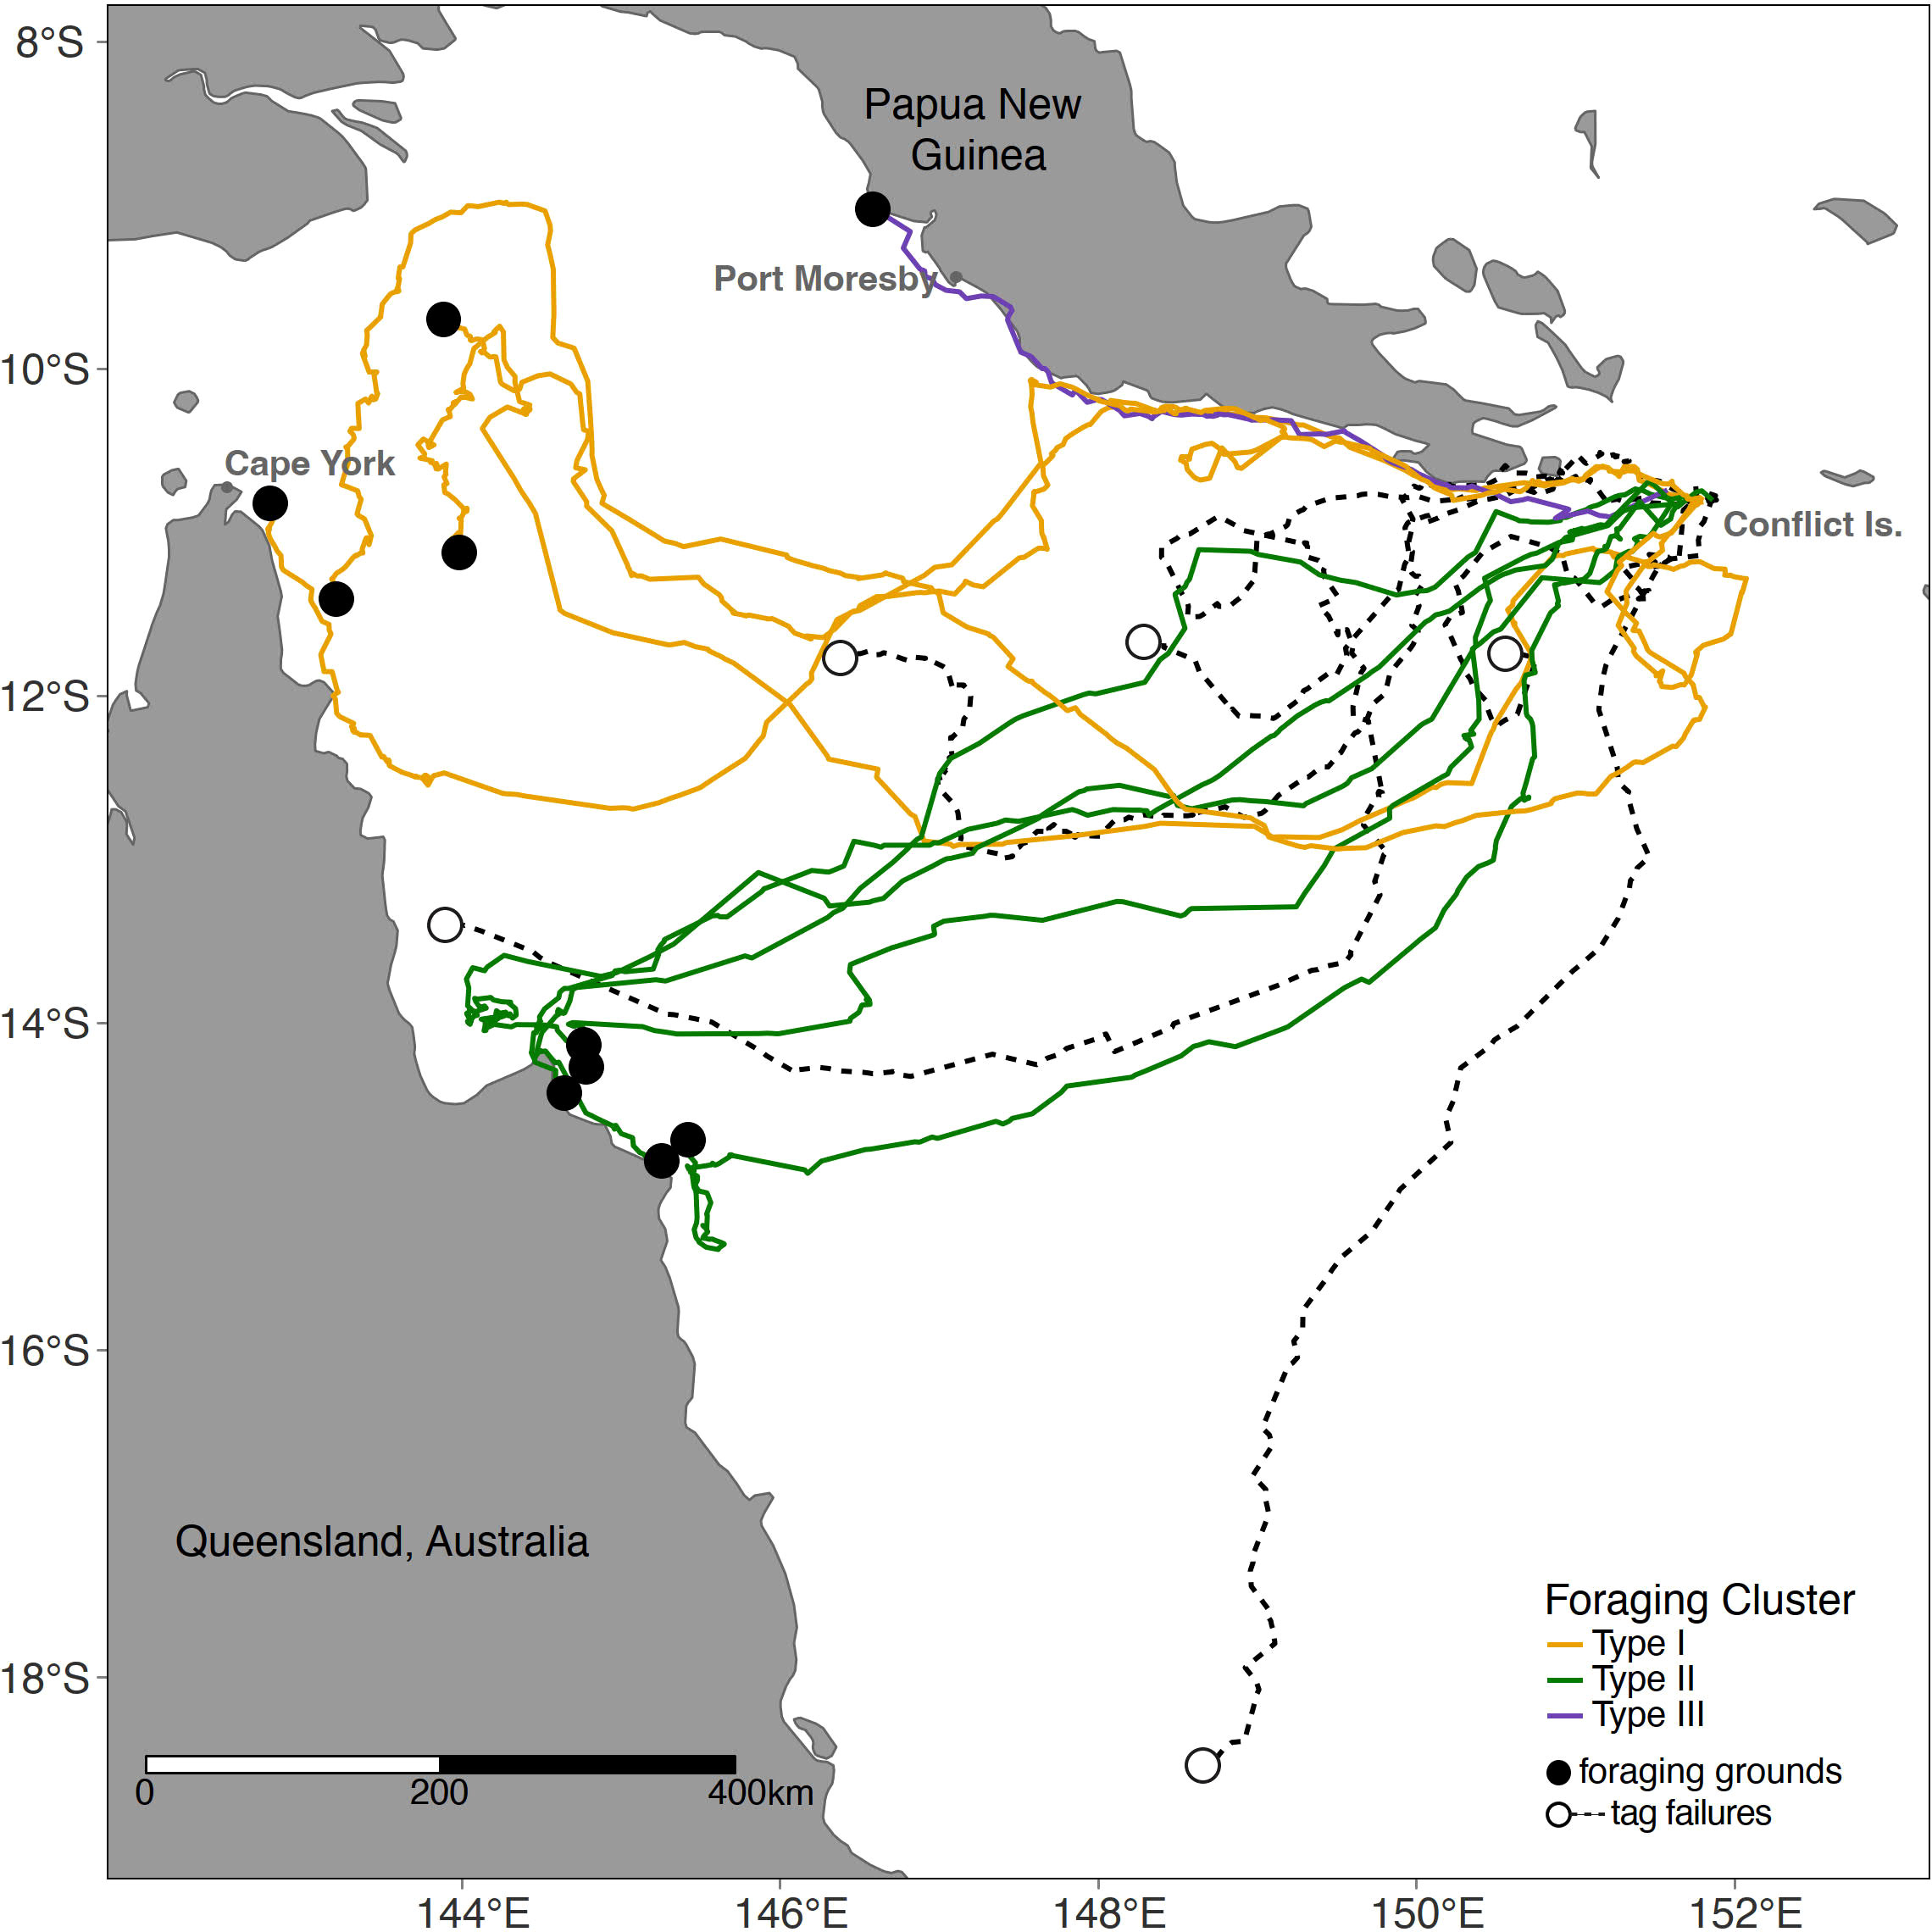
Figure 2 Satellite tagging location of hawksbill turtles. Migratory routes and foraging ground end points (shown as circle). Foraging ground clusters (Type I,II,III) shown in colour as per legend. See Table S4 for tag and turtle details.
The Argos satellite system (http://www.argos-system.org/) was used to relay location data, and the Wildlife Computer Portal was used to store the received data. Filtering of all tracks and analysis was conducted in R Statistical Software (V4.0.0; R Core Team, 2021). Argos locations were first filtered using the R package SDLfilter (Shimada, 2016) to remove duplicates and positions with location errors of > 1km, i.e., only Argos classes 0, 1, 2 and 3 were retained. Locations between which swimming speeds were deemed implausible (> 5 km/hr as per Shimada et al., 2012) were also removed. The remaining track locations were intersected with spatial polygons of land masses, and any fixes that overlapped were discarded. We visually assessed the trajectories of each turtle to classify track segments as either inter-nesting, migratory or foraging behaviours. The start of the migration period was defined as the point when individuals showed directed and continuous movement away from nesting areas. We considered foraging behaviour had begun following a significant decrease in overall swim speed and the cessation of directed movement.
To describe migration, we calculated swimming speed, distance, and total duration for each turtle. For turtles that arrived in foraging areas (n = 10), we quantified foraging activity by estimating the 50 and 95% utilisation distributions (UDs) using minimum convex polygons implemented using the adehabitatHR package (Calenge, 2006; Calenge, 2015). We assumed the 50% UD contour to represent each turtle’s core centre of activity and that the 95% UDs represented overall foraging areas. Turtles were classified into foraging groups based on the spatial clustering of their foraging home ranges.
3 Results
3.1 Genetic structure and diversity
Sequence data from ~770 bp fragments of mtDNA was used from 39 nesting females at the Conflict Group and from 42 hatchlings from Kavieng (Table S2). We identified a total of 6 haplotypes from the Conflict Group. The most common was haplotype EiIP-33 (84.6%), followed by EiIP-34, EiIP-59, EiIP-93, EiIP-09 and EiIP-114 all found a low frequency (<8%), with no new haplotypes identified. From Kavieng, we identified a total of 5 haplotypes, with the most common being haplotype EiIP64 (39%), followed by EiIP-33 (29%), EiIP-59 (24%), EiIP-39 (2%) and one newly discovered haplotype, EiIP-150 (5%) (Genbank Accession: to be added) (Table S2).
Given that multiple studies have been conducted from these sites over many years, the first step was to test for temporal variation in rookeries with data from several studies collected across multiple years. Both pairwise FST and exact tests showed no significant differentiation across studies or years within the same location except for samples from Sabah Turtle Islands from 2014 (Nishizawa et al., 2016) which were significantly different from other years within Sabah Turtle Island (FST = 0.07817 - 0.15951, P < 0.05), and exact test (P < 0.05) (Table 1) . As a result, all samples within rookies were combined with the exception of Sabah Turtle Islands, which were separated into East Malaysia “Old” (1998-2008) and East Malaysia “New” (2014) in subsequent analysis. A similar result was found in Nishizawa et al. (2016).
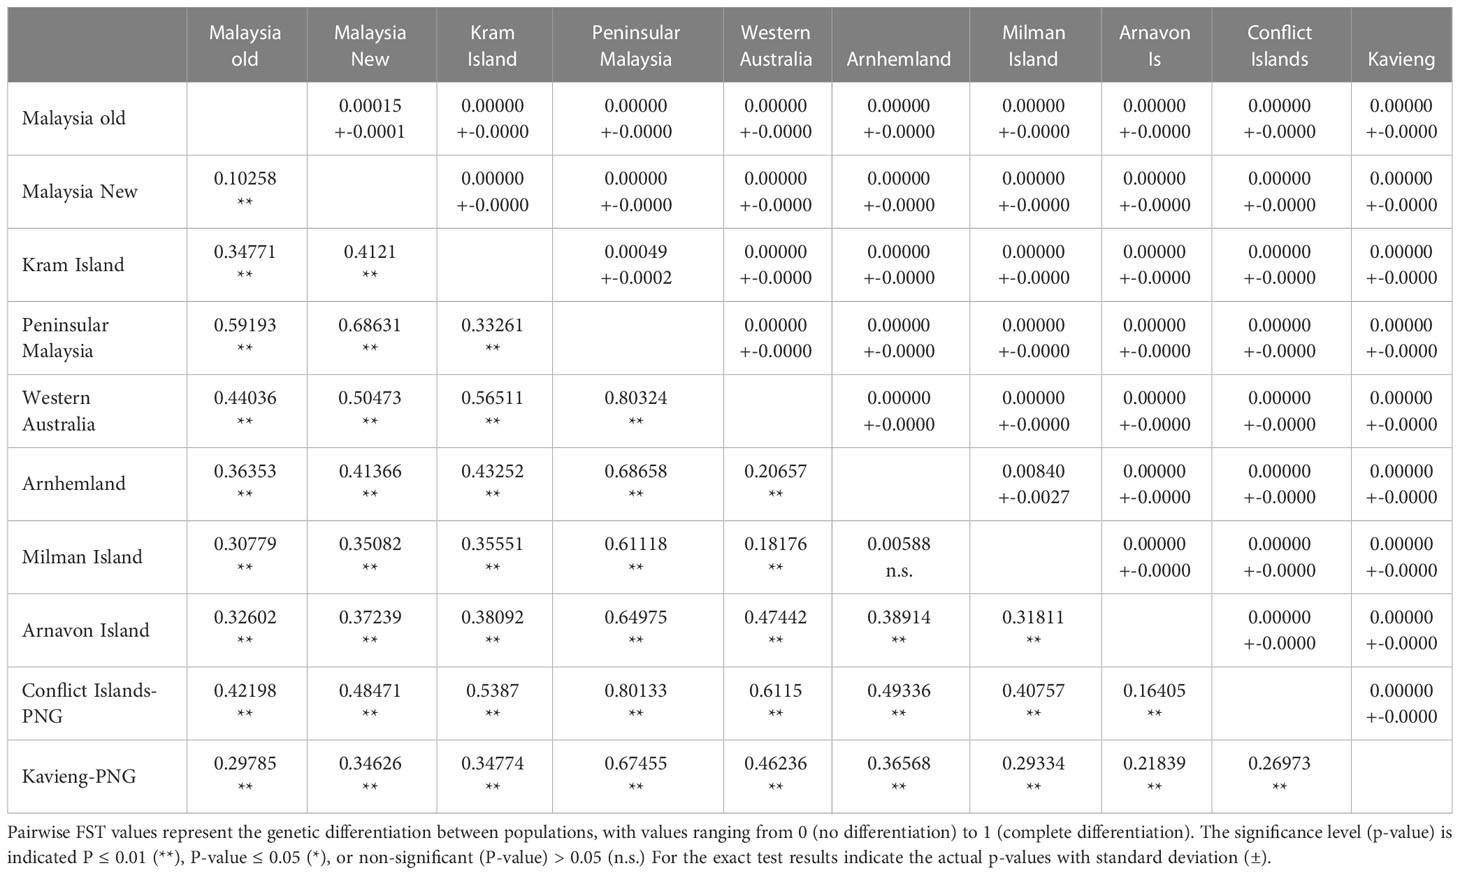
Table 1 Matrix of population differentiation showing pairwise FST values below the diagonal and exact test results above the diagonal.
The haplotype frequencies of samples from the Conflict Islands was significantly different from those of the Kavieng rookeries for both the exact test (P< 0.0001) and FST (FST = 0.270, P ≤ 0.01; Table 1). Moreover, the Conflict Group and Kavieng samples each differed significantly from the Asia-Pacific hawksbill stocks in Malaysia, Australia and the Solomon Islands (Figure 1; Table 1). Both the exact test and FST indicate high significance differentiation, except for Milman Island and Arnhem Land, which showed significant differences for the exact test (P = 0.0084) but not for the FST test (FST = 0.0059, P = 0.2129) (Table 1). Due to breeding seasonality (predominantly summer vs winter nesting), these genetic stocks have already been deemed separate MUs (Vargas et al., 2016). This represents at least nine hawksbill MUs now characterised in the Asia-Pacific region (Figure 1).
Estimated nucleotide diversity ranged from very low in Peninsular Malaysia (0.00027) to high in Milman Island (0.01994), with intermediate levels at Conflict Group (0.00263) and Kavieng (0.00138) (Table S3). Haplotype diversity was highest at Kavieng (h = 0.7120 ± 0.0346) relatively low at Conflict Group (0.4062 (±- 0.0969) and lowest at Peninsular Malaysia (0.0901 (± 0.0421) (Table S3).
3.2 Satellite tracking
All turtles tagged were “primary” or “within season recaptured” turtles (meaning caught for the first time or within the nesting season), with a mean CCL of 80.9 (s.d.=,2.60, range = 77.5 to 86.3 cm, n = 16) and mean curved carapace width (CCW) of 71.9 (s.d. = 3.24, range = 66.1 to 76 cm, n = 8) (Table S4). Fifteen hawksbill turtles were tracked for a total of 4476 days ranging from 53 to 747 days (mean ± SE = 298 ± 66). The sixteenth hawksbill stopped tracking within 27 days and did not leave the vicinity of the initial tagging location before tag failure. Upon tag assessment, no apparent cause to the failure could be attributed, including poaching. This turtle was excluded from the rest of the analyses.
3.2.1 Migration to foraging areas
All 15 satellite-tagged turtles migrated from the Conflict Group westerly towards their distinct foraging grounds. Fourteen of the turtles (93%) migrated towards eastern Australia, while only one individual (7%) stayed within PNG coastal waters, north of Port Moresby and Redscar Bay. Four tracked turtles stopped transmitting in the Coral Sea whilst on a migratory trajectory towards the eastern coast of Queensland, and the other stopped tracking within PNG not far from the Conflict Group.
Only 10 satellite-tagged turtles reached their foraging grounds (Figure 2; Table 2). Of the ten turtles that reached their foraging ground, the total migratory path distance ranged from 537 to 1715 km, with a mean migration path distance of 1241 ± 108 km, and an average straight-line migration distance of 854 ± 35 km (Table S5). The migration duration ranged from 24 to 65 days (mean = 38 ± 4), at an average swimming speed of 1.67 km/h ± 0.14 (Table S5).
The migration pattern and foraging ground selection of the tracked turtles resulted in distinct clustering and were described as one of the following three groups (Figure 3; Table 2): Type I, turtles migration ending in foraging grounds of the Torres Strait, Far North Queensland (n=4 individuals); Type II, settlement in Northern Queensland (n=5 individuals); and, Type III, the turtle that remained foraging in PNG waters (n=1 individual).
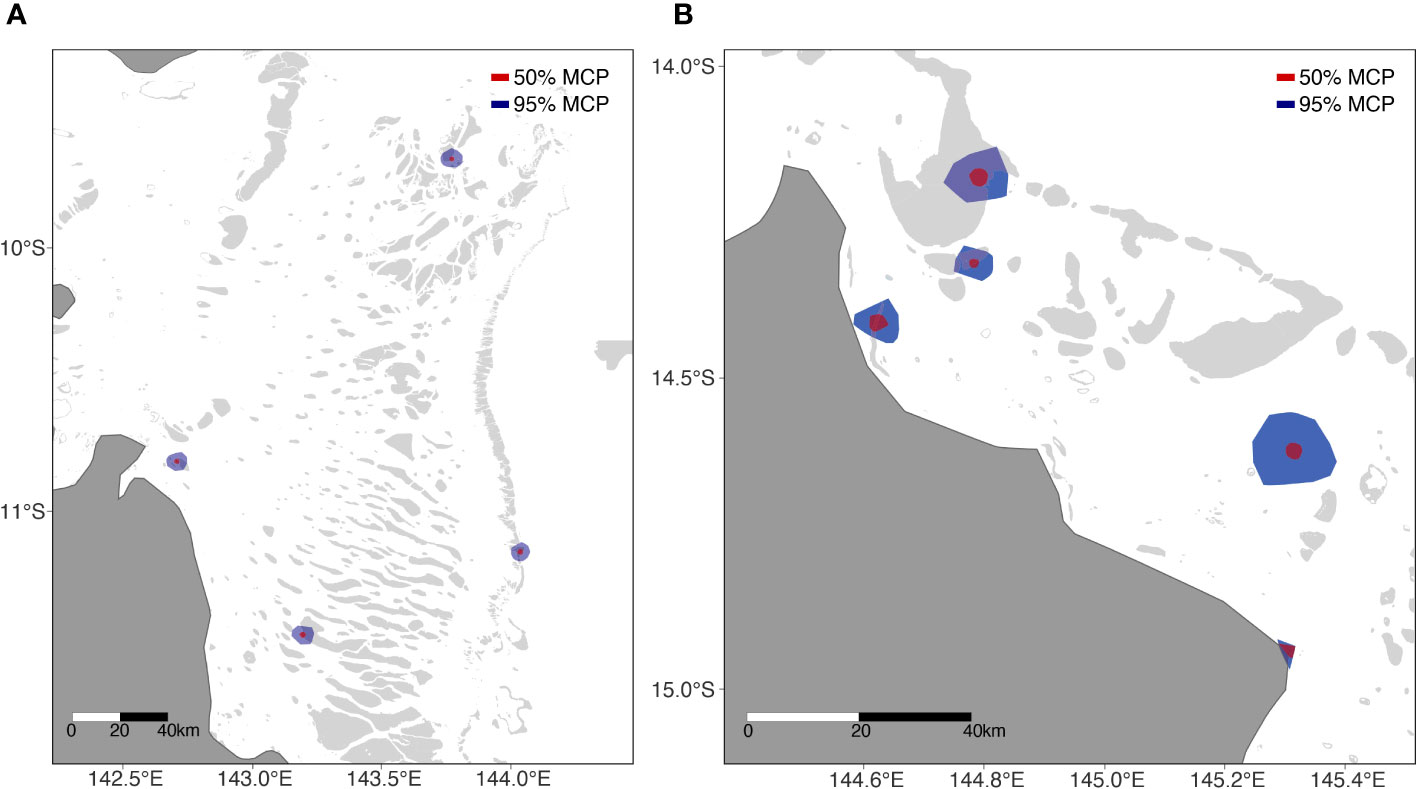
Figure 3 Type I (A) and Type II (B) home ranges. Type III not shown. Red circles denote 50% UD, blue circles 95%UD.
All turtles chose individual foraging grounds located on reefs surrounding remote coral reef islands or submerged coral reefs on the eastern outer barrier reefs of Australia or adjacent to eastern Queensland mainland. On average the distance of these coral reef foraging ground home ranges to shore was 37.05km ± 13.05 km (Table 2). The Type III cluster showed much larger, and Type II showed much smaller overall and core home ranges (Table 2). Foraging home ranges (95% UD) ranged in size from 7.97 km2 (Type II) to 208.6 km2 (Type III) (mean = 74.59 ± 19.14), and core home ranges (centre of activity; 50% UD) ranged in size from 2.34 km2 (Type II) to 12.5 km2 (Type III) (mean = 5.98 ± 0.96) (Table 2).
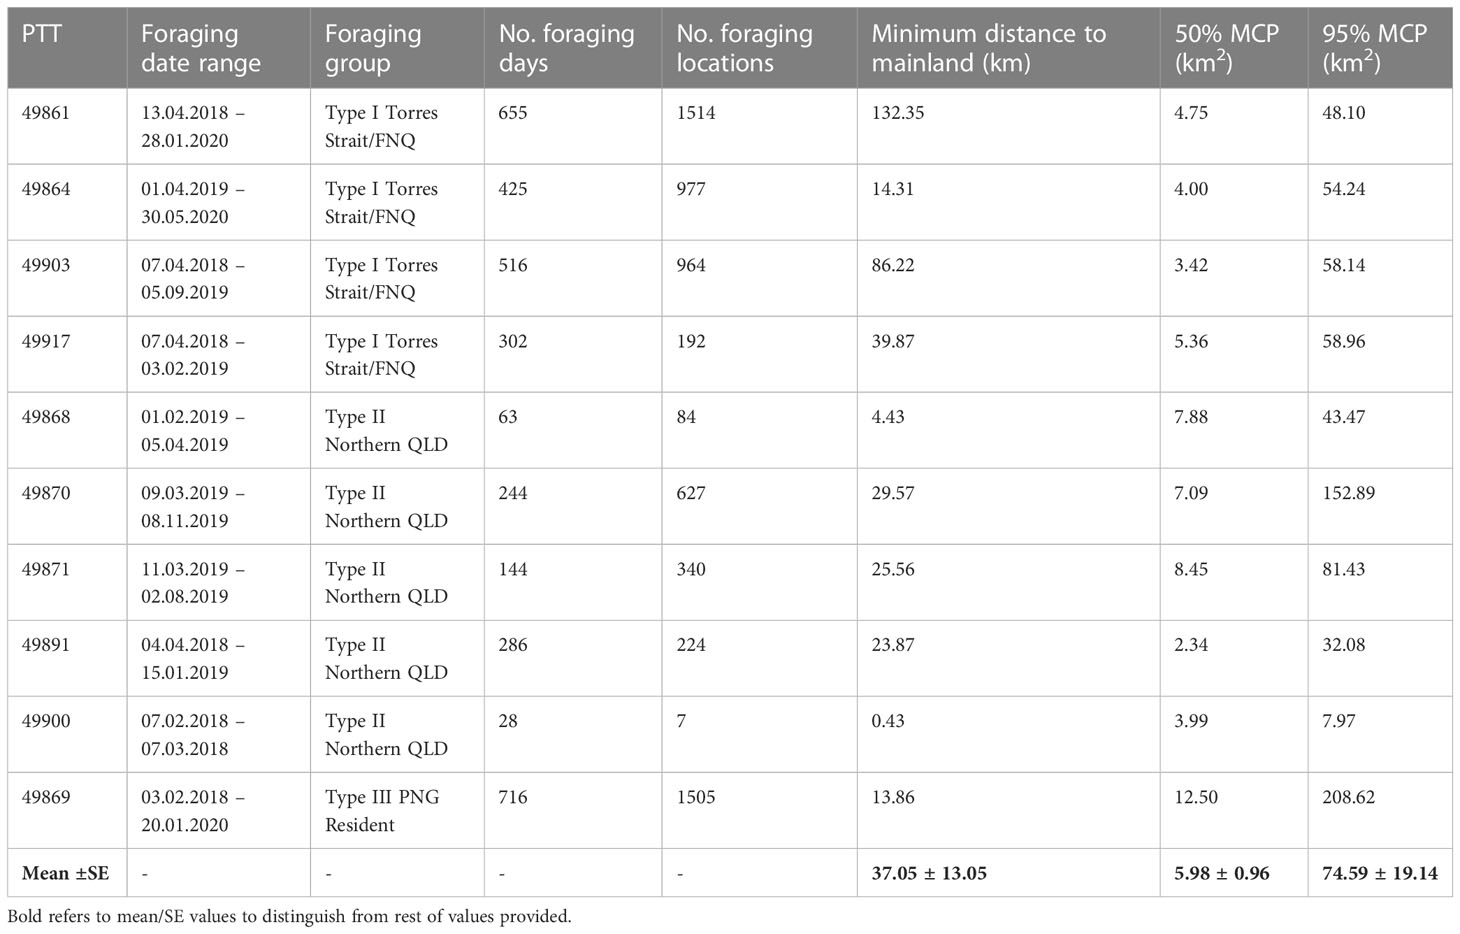
Table 2 Home range analysis using minimum convex polygons (MCP) for ten hawkbill turtles during their foraging period.
Type I cluster turtles foraged in the very northern Great Barrier Reef complex (40%), in the vicinity of the index nesting beach for the northeast Queensland hawksbill turtle stock (neQld stock), Milman Island, as well as the key nesting beach in the Torres Strait, Aukane. No turtle foraged west of these reef systems. Type II cluster turtles foraged near Howick Group of Islands between South Warden Reef and Lizard Island (50%), a well monitored long-term tagging site for the neQld stock (Bell and Jensen, 2018). Type II home ranges were closer to shore (on average) in comparison to the other clusters, likely due to the proximity of the reef complex to the mainland. Type III cluster turtle foraged along the coastline near Port Moresby (10%), yet limited coral reef studies have been undertaken in this locality in PNG to inform reef type and structure.
4 Discussion
Our genetic results show that the Conflict Group and Kavieng samples were each significantly differentiated from all other known Asia–Pacific genetic stocks and should be considered as two independent MU’s - Milne Bay Province (MBP MU) and eastern New Ireland Province (eNIP MU), respectively. This expands our understanding of the genetic stock structure of hawksbill turtles in Asia-Pacific, resulting in nine MU’s for this region. In addition, satellite tracking revealed that all 15 tagged turtles migrated from the Conflict Group westerly towards foraging areas in eastern Australia and PNG. Together, these results provide important new insights into the population structure and connectivity of hawksbill turtles in the western Pacific region.
On a region-wide scale, pairwise FST and exact tests showed no significant genetic differentiation across studies and years within the same location except for Sabah Turtle Island samples from 2014, which were significantly differentiated from samples taken in other years. A likely explanation, also proposed by Nishizawa et al. (2016), is that the there was a higher frequency of the EiIP48 haplotype and a lower frequency of the EiIP49 haplotype in 2014 could be due to incomplete sampling in previous years. However, despite the fact that sea turtles typically maintain a stable genetic composition over time, changes can occur.
Similar to green turtles, there seems to be limited dispersal of hawksbill nesting females (lineage) between the nine hawksbill turtle rookeries across geographical seascapes of the western Pacific Ocean with significant genetic differences among rookeries located more than 500 km apart (Dethmers et al., 2006; Dutton et al., 2014). However in northern Queensland specifically, this differs for both green and hawksbill turtles in that hawksbills are more closely linked to northeast Arnhem Land stocks than western Pacific stocks, whereas green turtle stocks of northern Queensland are less similar to western Queensland and more closely linked to New Caledonia in the south western Pacific (Dethmers et al., 2006; Jensen et al., 2019). Identification of the two new MU’s for PNG improves the baseline data for conducting these mixed stock analyses to determine population origin of hawksbill turtles at feeding grounds and in harvests (LaCasella et al., 2021)) in the western Pacific.
Based on flipper-tag returns, hawksbill turtles have been shown to make reproductive migrations from regional western Pacific rookeries, including New Ireland and Milne Bay Provinces, to foraging grounds at the Howick Group of Islands (Great Barrier Reef, north eastern Queensland, Australia) (Bell and Jensen, 2018). This was corroborated by Lissenung Resort (pers comm. Ange Amon) and CICI (pers comm. Hayley Versace). A new haplotype was identified in the Kavieng samples (EiIP-150; GenBank Accession ID: to be added). Interestingly, two previously orphan haplotypes (EiIP-39 and EiIP-59) found in foraging hawksbills at the Howick Group of Islands (Bell and Jensen, 2018) and in tortoiseshell products from the Solomon Islands (LaCasella et al., 2021) have now been identified in Conflict Group (EiIP59) and Kavieng (EiIP-39, EiIP-59), providing a likely origin for those samples. This study also corroborated this finding using satellite tracking from the Conflict Group whereby 10 out of 15 satellite-tracked hawksbill turtles migrated to eastern Queensland and half of these (50%, n = 5) foraged nearby the Howick Group of Islands.
As with other studies, the Conflict Group hawksbill turtles meandered along their post-nesting migratory routes and showed fidelity to multiple small foraging grounds with little collective specificity towards a singular/particular foraging ground (Gaos, 2011; Hamilton et al., 2015; Madden Hof et al., 2023). Yet there was some preference for following a general migratory pathway and selecting specific foraging ground reefs as a collective (or cluster; Type I, II, III). Given Type III cluster was based on a small sample size (n=1), making it necessary to conduct further research to draw more conclusive results. However, staying local seems to be a relatively uncommon behaviour among hawksbill turtles in this region. The Solomon Island genetic stock also utilises these cluster pathways and foraging grounds, whereby 93% of the Arnavon satellite-tagged hawksbill turtles migrated across the Coral Sea to reside in PNG or Australia (Hamilton et al., 2021). This highlights the regional importance of these waters and migratory cluster pathways for western Pacific hawksbill populations. Of particular interest is the highly similar mean migration speed (1.63 km h-1 and 1.67 km h-1, respectively). The mean migration of hawksbills from PNG (1241 km) is greater than most studies, for example, in Hawaii (218 km, Parker et al., 2009), Eastern Pacific (113 km, Gaos et al., 2012), Northern Territory (Australia) (349 km, Hoenner et al., 2016), and US Virgin Islands (67 km, Hart et al., 2019), except for the Solomon Islands (2028 km, Hamilton et al., 2021).
Where size and use of turtle foraging home ranges is connected to adequate habitat and food sources (Hoenner et al., 2016; Barr et al., 2021), this present study also showed a broad scope of home-range strategies and sizes (95% UD) that differed to other studies even when other genetic stocks share the same coastal waters of eastern Queensland (e.g Solomon Island and neQld stocks). For example, the mean home range (95%UD) of hawksbill turtles that made it to their foraging grounds in eastern Queensland from the Solomon Island (Arnavon) genetic stock was 5.5km2, compared to Torres Strait tracked turtles at 1.4km2, and the PNG genetic stock at 25.3km2. Of similarity, between the Solomon Island and PNG genetic stocks, was the greater home range (95%UD) utilised in PNG (23.5km2, 4 times larger; and 208km2,8 times larger, respectively) in comparison to the Australian reefs, further postulating that hawksbills forage and are connected to non-specific foraging grounds associated with food source availability.
4.1 Implications for management
The aim of this study was to assess if hawksbill turtles at Conflict Islands and Kavieng were individual genetic stocks or if they were connected to each other or other western Pacific stocks in the Solomon Islands or Australia. This study’s findings emphasise that the two newly described PNG genetic stocks need to be managed as demographically separate MU’s, but their migratory and foraging life history also links them to Australia’s management and conservation action. The importance of Australia’s habitat in supporting multiple (mixed stock) hawksbill turtle populations has been highlighted by other recent studies (neQld, Madden Hof et al., 2023; Solomon Island, Hamilton et al., 2021; Torres Strait, Barr et al., 2021; Vanuatu, Jim et al., 2022). This highlights the need for greater national and regional cooperation, particularly given the decline in the neQld hawksbill stock (Bell et al., 2020) and the likely decline of other western Pacific hawksbill populations (Pilcher, 2021). Also, sea turtle harvesting for meat and eggs in Australia and PNG is a traditional fishery undertaken by traditional owners in coastal and islander communities. Within PNG, shells are also used to make utilitarian items such as needles and limes spatulas, decorations such as earrings and bracelets, and for ceremonial purposes or trade (Kinch and Burgess, 2009). Despite efforts to track harvest levels in PNG, accuracy is complicated due to the remote nature of harvesting locations and limited government presence (Kinch, 2020a). Small-scale artisanal fisheries (Eley, 1988; Kwan, 1991) and market surveys (Hirth and Rohovit, 1992; Kinch and Burgess, 2009) have reported evidence of hawksbill turtles (with particular concern raised for MBP) being heavily targeted by local inhabitants of the Louisiade Archipelago (Kinch, 2020b). These findings align with an assessment of exploitation in PNG, which identified MBP as one of three targeted harvest locations in need of intervention (Opu, 2018).
Ineffective, unregulated or complete lack of management and/or protection at hawksbill rookeries or foraging grounds is likely to negatively impact the PNG population and other western Pacific stocks (Bell and Jensen, 2018; Madden Hof et al., 2023). In the context of PNG, no marine turtle, with the exception of the leatherback turtle, is protected by PNG’s legislation [e.g. Fauna (Protection and Control), 1976 (Kinch, 2006)]. There are no laws, regulations, or quota limits to harvesting hawksbill turtles or to sell, offer or consign sale or be in possession. The International trade (Fauna and Flora) Regulation, 2014 does prescribe that it is illegal to trade to and from PNG in CITES-listed fauna (which includes hawksbill turtles). The taking of hawksbill turtles by Papua New Guineans within Australia’s EEZ (i.e. the Torres Strait Protected Zone) is also allowed under the Torres Strait Treaty, 1985 as long as they are traditional inhabitants of ‘Treaty’ Villages conducting “traditional fishing”. However, each Party should to its best endeavours identify and protect fauna that are or may become threatened with extinction (Article 14(1)(a) Torres Strait Treaty, 1985; Kinch, 2020a). However, inhabitants assignment, regulation and enforcement are limited (Busilacchi et al., 2018).
There are, however, many other laws that could support sea turtle conservation in PNG (refer, Kinch, 2006; Kinch, 2020a) including the Organic Law on Provincial Governments and Local-level Governments, 1997, which allows for the development of local-level conservation laws (under Sections 42 and 44) and could potentially be used to ban or limit hawksbill turtle and egg take, and establish nesting beach closures. Additionally, the Fisheries Management Act, 2016 provides the framework to regulate hawksbill turtles as a sustainable fishery. While all potential options require scientifically based assessments of PNG’s hawksbill turtle population status and trajectory that are informed by annual harvest rates, applying the precautionary principle could at least ensure a level of protection as an intermediary step. Initial protection could be afforded through the uplisting of hawksbill turtles as a ‘Protected Species’ under the Flora and Fauna Protection and Control Act, 2014, alongside a review and strengthening of the Torres Strait Treaty, 1985. In acknowledging the role of marine turtles in local communities, it is suggested the strengthening of these policy and legislative options be considered and planned in consultation with and in recognition of communities and their rights to sea turtle resources. This should be done alongside improvements to the local community economy and provision of alternatives to the reliance on hawksbill turtles for subsistence, trade and culture. Ongoing research by CICI and the World Wide Fund for Nature is already underway to fill these critical assessment and research gaps (CICI and Coral Islands Ltd., 2021; Madden Hof et al., 2022).
In eastern Australia, where most of the Conflict Group hawksbill turtles forage, hawksbill turtles will also require further national and transboundary management and protection. Hawksbill turtles are protected and managed across a raft of Commonwealth and State legislation, policy and recovery strategies in Australia. Still, harvesting can occur by Australian Aboriginal and Torres Strait Islanders under the Native Title Act, 1994. Under this Act and other frameworks, (e.g. Torres Strait Turtle Fishery), there are no legislative or regulated quota limits to harvesting. Instead, communities are encouraged to self-manage and permit their catches through their local traditional LORE, and as such, there are no quantifiable harvest rates. While there are few geo-political strategies in place to protect transboundary marine turtle populations in this region (Bell and Jensen, 2018), given PNG shares its hawksbill populations with Australia (and beyond), joint and concerted co-management efforts should now be explored to ensure future conservation and protection across PNG’s hawksbills full life history. This study will help facilitate these discussions and underpin the development of conservation strategies to protect hawksbill turtles throughout their life history and the western Pacific range.
Data availability statement
The data presented in the study are deposited in the GenBank repository (https://www.ncbi.nlm.nih.gov/genbank/), accession number (OR000397).
Ethics statement
The animal study was reviewed and approved by University of the Sunshine Coast.
Author contributions
CM conceptualised and designed the study and undertook most of the field work except for Kavieng. AA conducted this field work. HV contributed to the Conflict Island field work. NF, NM, CM performed the laboratory analysis. AD, MJ, CM performed the statistical analyses. CM wrote the first draft of the manuscript. MJ and AD contributed to writing sections of the manuscript. All authors contributed to the article and approved the submitted version.
Funding
Funding was provided by the World Wide Fund for Nature, its donors, and from philanthropic support by the Isaacson Davis Foundation, and by the University of the Sunshine Coast including a research grant by Dr. Kylie Scales.
Acknowledgments
We would like to express our sincere appreciation of the dedicated CICI turtle monitors, CICI volunteer interns, and the staff of Lissenung Resort for assisting in sample collection. Without you, we would not have been able to undertake this research. We would particularly like to thank the CICI turtle monitors of the 2017-2018 and 2018-2019 nesting seasons, Dr. Ian Bell, Natalie Robinson, Coen Madden Hof, Amaya Madden Hof, Blake Seccombe and Brian Seccombe for assisting in satellite tracking deployment.
Conflict of interest
Authors HV and AA are employed by The Coral Islands Limited and Lissenung Resort Island, respectively.
The remaining authors declare that the research was conducted in the absence of any commercial or financial relationships that could be construed as a potential conflict of interest.
Publisher’s note
All claims expressed in this article are solely those of the authors and do not necessarily represent those of their affiliated organizations, or those of the publisher, the editors and the reviewers. Any product that may be evaluated in this article, or claim that may be made by its manufacturer, is not guaranteed or endorsed by the publisher.
Supplementary material
The Supplementary Material for this article can be found online at: https://www.frontiersin.org/articles/10.3389/fmars.2023.1201009/full#supplementary-material
References
Abreu-Grobois F. A., Horrocks J. A., Formia A., Dutton P. H., LeRoux R., Vélez-Zuazo X., et al. (2006). “New mtDNA D-loop primers which work for a variety of marine turtle species may increase the resolution of mixed stock analysis,” Book of abstracts. Twenty sixth annual symposium on sea turtle biology and conservation, Eds. M. Frick, A. Panagopoulou, A. F. Rees and K. Williams (Athens, Greece: International Sea Turtle Society), 376.
Barr C. E., Hamann M., Shimada T., Bell I., Limpus C. J., Ferguson J. (2021). Post-nesting movements and feeding ground distribution by the hawksbill turtle (Eretmochelys imbricata) from rookeries in the Torres Strait. Wildlife Res. 48 (7), 598–608. doi: 10.1071/WR20183
Bell I., Jensen M. P. (2018). Multinational genetic connectivity identified in western Pacific hawksbill turtles, Eretmochelys imbricata. Wildlife Res. 45 (4), 307–315. doi: 10.1071/WR17089
Bell I. P., Meager J. J., Eguchi T., Dobbs K. A., Miller J. D., Madden Hof C. A. (2020). Twenty-eight years of decline: nesting population demographics and trajectory of the north-east Queensland endangered hawksbill turtle (Eretmochelys imbricata). Biol. Conserv. 241, 108376. doi: 10.1016/j.biocon.2019.108376
Broderick D., Moritz C., Miller J. D., Guinea M., Prince R. I. T., Limpus C. J. (1994). Genetic studies of the hawksbill turtle eretmochelys imbricata: evidence for multiple stocks in Australian waters. Pac. Conserv. Biol. 1, 121–131. doi: 10.1071/PC940123
Busilacchi S., Butler J., Rochester W., Posu J. (2018). Drivers of illegal livelihoods in remote transboundary regions: the case of the trans-fly region of Papua New Guinea. Ecol. Soc. 23 (1), 19. doi: 10.5751/ES-09817-230146
Calenge C. (2006). The package A’dehabitat’ for the r software: a tool for the analysis of space and habitat use by animals. Ecol. Model. 197, 516–519. doi: 10.1016/j.ecolmodel.2006.03.017
CICI (2018). Turtle tagging and monitoring at the conflict islands, Milne bay province November 2017-march 2018. Report prepared for the conflict islands conservation initiative.
CICI. (2019). Turtle tagging and monitoring at the conflict islands, Milne bay province November 2018-march 2019. Report prepared for the conflict islands conservation initiative.
CICI, Coral Islands Ltd. (2021). 2020 – 2021 turtle nesting season End of season report prepared for the Conflict Island Conservation Initiative. Available at: https://www.cici.org.au/_files/ugd/a86e24_2b1fb04e6d2145ad9c3af73caee0b6e8.pdf.
CICI, Coral Islands Ltd. (2022). 2021 – 2022 turtle nesting season. End of season report prepared for the Conflict Island Conservation Initiative. Available at: https://www.cici.org.au/_files/ugd/a86e24_68e4fcae12cd41c293952fbd8ac19d96.pdf.
Dethmers K. E. M. E. M, Broderick D., Moritz C., FitzSimmons N. N., Limpus C. J., Lavery S., et al. (2006). The genetic structure of Australasian green turtles (Chelonia mydas): exploring the geographical scale of genetic exchange. Mol. Ecol. 15, 3931–3946. doi: 10.1111/j.1365-294X.2006.03070.x
Dutton P. H., Jensen M. P., Frutchey K., Frey A., LaCasella E. L., Balazs G. H., et al. (2014). Genetic stock structure of green turtle (Chelonia mydas) nesting populations across the pacific islands. Pacif. Sci. 64, 451–464. doi: 10.2984/68.4.1
Eley T. (1988). Hunters of the reefs: the marine geography of the Kiwai, Papua New Guinea. Unpublished PhD thesis (Berkeley, California, United States of America: University of California).
Excoffier L., Lischer H. E. L. (2010). Arlequin suite ver 3.5: a new series of programs to perform population genetics analyses under Linux and Windows. Mol. Ecol. Resour. 10, 564–567. doi: 10.1111/j.1755-0998.2010.02847.x
Fitzsimmons N. N., Limpus C. J. (2014). Marine turtle genetic stocks of the indo-pacific: identifying boundaries and knowledge gaps. Indian Ocean Turtle Newslett 64, 2–35.
Gaos A. R. (2011). Spatial ecology of hawksbill turtles (Eretmochelys imbricata) in the eastern Pacific ocean (San Diego, USA: MSc Thesis presented to the Faculty of San Diego State University).
Gaos A. R., Lewison R. L., Wallace B. P., Yañez I. L., Liles M. J., Nichols W. J., et al. (2012). Spatial ecology of critically endangered hawksbill turtles Eretmochelys imbricata: implications for management and conservation. Mar. Ecol. Prog. Ser. 450, 181–194. doi: 10.3354/meps09591
Godley B. J., Richardson S., Broderick A. C., Coyne M. S., Glen F., Hays G. C. (2002). Long-term satellite telemetry of the movements and habitat utilisation by green turtles in the Mediterranean. Ecography 25, 352–362. doi: 10.1034/j.1600-0587.2002.250312.x
Hamann M., Flavell F., Frazier J., Limpus C. J., Miller J. D., Mortimer J. A. (2022). Assessment of the conservation status of the hawksbill turtle in the Indian ocean and South-East Asia region (CMS). Available at: https://www.cms.int/sites/default/files/publication/iosea_hawksbill_assessment_2022.pdf.
Hamilton R. J., Bird T., Gereniu C., Pita J., Ramohia P. C., Walter R., et al. (2015). Solomon Islands largest hawksbill turtle rookery shows signs of recovery after 150 years of excessive exploitation. PloS One 10 (4), 1–16. doi: 10.1371/journal.pone.0121435
Hamilton R. J., Desbiens A., Pita J., Brown C. J., Vuto S., Atu W., et al. (2021). Satellite tracking improves conservation outcomes for nesting hawksbill turtles in Solomon islands. Biol. Conserv. 261, 109240. doi: 10.1016/J.BIOCON.2021.109240
Hart K. M., Iverson A. R., Benscoter A. M., Fujisaki I., Cherkiss M. S., Pollock C., et al. (2019). Satellite tracking of hawksbill turtles nesting at Buck Island Reef National Monument, US Virgin Islands: inter-nesting and foraging period movements and migrations. Biol. Conserv. 229, 1–13. doi: 10.1016/j.biocon.2018.11.011
Hirth H., Rohovit L. (1992). Marketing patterns of green and hawksbill turtles in port Moresby, Papua New Guinea. Oryx 26 (1), 39–42. doi: 10.1017/S0030605300023218
Hoenner X., Whiting S. D., Hamann M., Limpus C. J., Hindell M. A., McMahon C. R. (2016). High-resolution movements of critically endangered hawksbill turtles help elucidate conservation requirements in northern Australia. Mar. Freshw. Res. 67 (8), 1263–1278. doi: 10.1071/MF15013
Jensen M. P., Limpus C. J., Whiting S., Guinea M., Prince R., Dethmers K., et al. (2013). Defining olive ridley turtle Lepidochelys olivacea management units in Australia and assessing the potential impact of mortality in ghost nets. Endanger. Species Res 21, 241–253. doi: 10.3354/esr00521
Jensen M. P., FitzSimmons N. N., Bourjea J., Hamabata T., Reece J. S., Dutton P. H. (2019). The evolutionary history and global phylogeography of the green turtle (Chelonia mydas). J. Biogeogr., 46 (5), 860–870. doi: 10.1111/jbi.13483
Jim L. M. R., Rice M. R., Hickey F. R., Balazs G. H. (2022). Destination revealed: post-nesting migrations of hawksbill turtles (Eretmochelys imbricata) from Moso Island, Republic of Vanuatu. Micronesica 2022-01, 1–16.
Kinch J. (2003a). Sea Turtle resources in the Milne Bay province, Papua New Guinea: results of a nesting survey (21-27/01/03) at Panayayapona and Panadaludalu Islands (Jomard islands), with additional notes (Alotau, Milne Bay Province, Papua New Guinea: Report prepared for Conservation International).
Kinch J. (2003b). Sea Turtle resources in the Milne Bay province, Papua New Guinea: conservation and management issues in relation to protection and sale in markets (Port Moresby, National Capital District, Papua New Guinea: Report prepared for the Department of Environment and Conservation).
Kinch J. (2006). A socio-economic assessment of the huon coast leatherback turtle nesting beach projects (Labu Tale, Busama, Lababia and Paiawa), Morobe province, Papua New Guinea (Honolulu: Western Pacific Regional Fisheries Management Council).
Kinch J. (2020a). “Papua New Guinea,” in Sea Turtles in Oceania: MTSG annual regional report 2020. Eds. Work T., Parker D., Balaz G. (The Gland: International Union for Conservation of Nature), pp: 377–428.
Kinch J. (2020b). Changing lives and livelihoods: culture, capitalism and contestation over marine resources in island melanesia. unpublished PhD thesis (Canberra, Australian Capital District, Australia: Australian National University).
Kinch J., Burgess E. A. (2009). An assessment of the trade in hawksbill turtles in Papua new Guinea. Traffic Bull. 22 (2), 62–72.
Kwan D. (1991). “The artisanal sea turtle fishery in daru, Papua new Guinea,” in Sustainable development for traditional inhabitants of the Torres straits region. Eds. Lawrence D., Cansfield-Smith T. (Townsville: Great Barrier Reef Marine Park Authority), pp: 239–240. Proceedings of the Torres Strait baseline study conference, Kewarra Beach Cairns, 19–23 November 1990.
LaCasella E. L., Jensen M. P., Madden Hof C. A., Bell I. P., Frey A., Dutton P. H. (2021). Mitochondrial DNA profiling to combat the illegal trade in tortoiseshell products. Front. Mar. Sci. 7 (January). doi: 10.3389/fmars.2020.595853
Limpus C. J. (1992). Estimation of tag loss in marine turtle research. Wildlife Res. 19 (4), 457–469. doi: 10.1071/WR9920457
Limpus C. J. (2009). A biological review of Australian marine turtles: 3. Hawksbill turtle, Eretmochelys imbricata (Linnaeus). Queensland: DERM; Environmental Protection Agency. Available at: http://www.derm.qld.gov.au/services_resources/item_details.php?item_id=200005.
Limpus C., Miller J. (2008). Australian Hawksbill turtle population dynamics project. Brisbane, Queensland, Australia: Environmental Protection Agency.
Madden Hof C. A., Riskas K. A., Jensen M. P., Hamilton R. J., Pilcher N., Gaos A. R., et al. (2022). Assessment of the conservation status of the hawksbill turtle in the western Pacific ocean region (CMS Technical Series No. 45), 51 Pages.
Madden Hof C. A., Smith C., Miller S., Ashman K., Townsend K. A., Meager J. (2023). Delineating spatial use combined with threat assessment to aid critical recovery of northeast Australia’s endangered hawksbill turtle, one of western Pacific last strongholds. Front. Mar. Sci. 10:1200986. doi: 10.3389/fmars.2023.1200986
Mortimer J., Donnelly M. (2008). “IUCN red list: hawksbills turtle (Eretmochelys imbricata),” in Marine turle specialist group 2008 (IUCN Red List status assessment).
Nishizawa H., Joseph J., Chong Y. K. (2016). Spatio-temporal patterns of mitochondrial DNA variation in hawksbill turtles (Eretmochelys imbricata) in Southeast Asia. J. Exp. Mar. Biol. Ecol. 474, 164–170. doi: 10.1016/j.jembe.2015.10.015
Opu J. (2018). An assessment of marine turtle exploitation in Papua New Guinea: final report prepared for the secretariat of the pacific regional environmental programme. Papua New Guinea: SPREP.
Parker D. M., Balazs G. H., King C. S., Katahira L., Gilmartin W. (2009). Short-range movements of hawksbill turtles (Eretmochelys imbricata) from nesting to foraging areas within the Hawaiian islands. Pacif. Sci. 63, 371–382. doi: 10.2984/049.063.0306
Pilcher N. J. (2021). Review of the status of sea turtles in the Pacific Ocean 2021 (Apia, Samoa: Secretariat of the Pacific Regional Environment Programme).
Pritchard (1978). Marine turtles of Papua New Guinea (Port Moresby, National Capital District, Papua New Guinea: Report prepared for the Wildlife Division).
R Core Team. (2021). R: a language and environment for statistical computing. Vienna, Austria: R Foundation for Statistical Computing. Available at: https://www.R-project.org/.
Raymond M., Rousset F. (1995). An exact test for population differentiation. Evol. Int. J. Organic Evol. 49, 1280–1283. JSTOR. doi: 10.2307/2410454
Shimada T., Jones R., Limpus C., Hamann M. (2012). Improving data retention and home range estimates by data-driven screening. Mar. Ecol. Prog. Ser. 457, 171–180. doi: 10.3354/meps09747
Skewes T., Lyne V., Butler J., Mitchell D., Poloczanska E., Williams K., et al. (2011). Melanesian Coastal and marine ecosystem assets: assessment framework and Milne bay case study (Brisbane: Commonwealth Science and Industry Research Organisation).
Spring S. (1982a). “Status of marine turtles populations in Papua New Guinea,” in Biology and conservation of Sea turtles, proceedings of the world conference on Sea turtle conservation, Washington, D.C., 26th-30th November 1979. Ed. Bjorndal K. (Washington, DC: Smithsonian Institution Press), 281–289.
Spring S. (1982b). “Subsistence hunting of marine turtles in Papua New Guinea,” in Biology and conservation of Sea turtles, proceedings of the world conference on Sea turtle conservation, Washington, D.C., 26th-30th November 1979. Ed. Bjorndal K. (Washington, DC: Smithsonian Institution Press), 291–295.
Tamura K., Nei M. (1993). Estimation of the number of nucleotide substitutions in the control region of mitochondrial DNA in humans and chimpanzees. Mol. Biol. Evol. 10, 512–526. doi: 10.1093/oxfordjournals.molbev.a040023
Vargas S. M., Jensen M. P., Ho S. Y. W., Mobaraki A., Broderick D., Mortimer J. A., et al. (2016). Phylogeography, genetic diversity, and management units of hawksbill turtles in the indo-pacific. J. Hered. 107 (3), 199–213. doi: 10.1093/jhered/esv091
Wahidah M. A., Syed Abdullah S. A. K. (2009). “Identification of the stock/population of green and hawksbill turtles in Southeast Asian region,” in Report on the third regional technical consultation on research for stock enhancement of Sea turtles (Japanese trust fund IV program). Ed. Syed Abdullah bin Syed Abdul Kadir O. A. (Kuala Lumpur, Malaysia: Southeast Asian Fisheries Development Center), 125–135.
Wangunu N., Kwan. D., Bell I., Pita J. (2004). Turtle tagging and monitoring in Milne bay province, December 2003 (Alotau, Milne Bay Province, Papua New Guinea: Report prepared for the South Pacific Regional Environment Program, Apia, Samoa; the Department of Environment and Conservation, Port Moresby, Papua New Guinea; and Conservation International).
Keywords: hawksbill, mitochondrial DNA, migration, genetic stock, conservation
Citation: Madden Hof CA, Desbiens AA, Kinch J, Fitzsimmons NN, Versace H, Amon A, McIntyre N, Townsend KA and Jensen MP (2023) From rookeries to foraging grounds: understanding regional connectivity and genetic diversity in hawksbill turtles. Front. Mar. Sci. 10:1201009. doi: 10.3389/fmars.2023.1201009
Received: 05 April 2023; Accepted: 15 June 2023;
Published: 08 August 2023.
Edited by:
Mark Meekan, University of Western Australia, AustraliaReviewed by:
Brian Michael Shamblin, University of Georgia, United StatesRonel Nel, Nelson Mandela University, South Africa
Copyright © 2023 Madden Hof, Desbiens, Kinch, Fitzsimmons, Versace, Amon, McIntyre, Townsend and Jensen. This is an open-access article distributed under the terms of the Creative Commons Attribution License (CC BY). The use, distribution or reproduction in other forums is permitted, provided the original author(s) and the copyright owner(s) are credited and that the original publication in this journal is cited, in accordance with accepted academic practice. No use, distribution or reproduction is permitted which does not comply with these terms.
*Correspondence: Christine A. Madden Hof, Y2hvZkB3d2Yub3JnLmF1