 Guodong Zhang
 Yujian Wen
 Changling Ding
 Guicheng Zhang
 Jun Sun
- 1Research Centre for Indian Ocean Ecosystem, Tianjin University of Science and Technology, Tianjin, China
- 2Institute for Advance Marine Research, China University of Geoscience, Guangzhou, China
The Haihe River system is a major conduit of land-based pollution into the Bohai Sea in North China, This study presented the first-ever observation of hypoxia in the Haihe River estuary, providing valuable insights into the complex interplay between physical and biochemical factors influencing hypoxia in estuarine systems. The research found seasonal variations in DO distribution in the estuaries of the Haihe and Yongdingxin Rivers. Hypoxia emerged in summer at the bottom of the Haihe River estuary and dissipated in autumn, with the minimum DO concentration of 1.85 mg/L recorded at the bottom of the HH-2 station. Within the hypoxic zone, the average DO concentration was 4.02 mg/L, and the average of DO saturation was less than 0.4. This study also identified the primary drivers of summer hypoxia as a combination of physical and biochemical factors, with water stratification due to hydrodynamic factors limiting exchange and reoxygenation between different water layers. In addition, the decomposition of organic matter in the bottom consumed a significant amount of dissolved oxygen.The significantly higher DO concentration and saturation in autumn compared to summer suggested the possible existence of seasonal hypoxia in the Haihe estuary. This study of hypoxia in the Haihe River estuary contribute to a better understanding of the factors that influence seasonal hypoxia. The findings have important implications for the management and remediation of hypoxia in the Haihe estuary and other estuarine systems.
Introduction
Dissolved oxygen (DO) is a crucial water quality parameter that profoundly affects the survival and reproductive of aquatic organisms.Various studies have defined hypoxia as DO concentrations below 3 mg/L, with anoxia defined by concentrations below 2 mg/L (Dai et al., 2006; Chen et al., 2007). In recent years, hypoxia has become increasingly prevalent in aquatic ecosystems worldwide due to the accelerated pace of urbanization and industrialization (Rabalais et al., 2010; Conley et al., 2011; Breitburg et al., 2018).
The concentration of DO in water is influenced by various factors such as temperature, salinity, water exchange capacity, organic matter types and concentrations, and plankton abundance. Hypoxia not only affects the growth and reproduction of primary producers but also has further impacts on higher trophic-level organisms, causing a decline in fish abundance and biodiversity in aquatic ecosystems, as well as affecting the growth of benthic organisms (Diaz and Rosenberg, 2008; Levin et al., 2009). Because of these ecological hazards, hypoxia is recognized as a major global environmental problem.
Previous research had indicated that hypoxia occurred in coastal waters as a result of the stratification process of water (Stanley and Nixon, 1992; Rabalais et al., 2010; Murphy et al., 2011). This process led to the depletion of DO in the bottom layer of the water, making its recovery difficult due to the presence of stratification. Moreover, the input of eutrophic water accelerated the consumption of oxygen in both water and sediment (Morse and Rowe, 1999), exacerbating the hypoxic conditions. The increasingly severe hypoxia in coastal waters has prompted many scientists to investigate the mechanisms behind this phenomenon.
Coastal hypoxia has received widespread attention from researchers, and many reports of hypoxia have been documented in the Yangtze River Estuary, Pearl River Estuary, and Gulf of Mexico. In the Yangtze River Estuary, various water masses with large differences in properties existed due to the confluence of diluted freshwater, the northward Taiwan Warm Current, and the nearshore Kuroshio branch (Zhang et al., 2007; Yang et al., 2013; Luo et al., 2018). These different water masses had different distribution depths, resulting in the existence of stratification in the Yangtze River Estuary. The input of organic matter from primary productivity growth in the spring exacerbated the process of oxygen consumption (Wang et al., 2017), and the difficulty of reoxygenation caused by stratification led to the phenomenon of hypoxia. In the Pearl River estuary, the large amount of freshwater input in summer was distributed in the surface water (Yan et al., 2015), causing both density stratification and a large amount of external organic matter. In the process of organic matter decomposition, DO in the water was also significantly consumed (Cole et al., 1987), leading to the formation of hypoxic areas. The Gulf of Mexico is one of the most severe areas of coastal hypoxia worldwide and is a typical seasonal hypoxic zone. Hypoxia generally began to form in late spring and early summer, reached its peak in summer, and gradually disappeared in autumn. The reasons for eutrophication and hypoxia in the coastal zone here were due to the Mississippi River and Atchafalaya River’s dissolved organic carbon (POC) flux into the Gulf of Mexico, reaching up to 3.1 Tg (Dagg et al., 2007). The continuous influx of freshwater and a large amount of organic matter not only met the conditions for stratification but also provided sufficient organic matter for sediment oxygen consumption in the bottom water (Mccarthy et al., 2013). Although there are differences in the reasons for stratification and organic matter sources in these regions, they still conform to the widely accepted “stratification-eutrophication-hypoxia formation” route.
Since the 1980s, the surface temperature in the Bohai Sea has gradually increased, the thickness of the upper mixed layer has become thinner, the thermocline has become shallower, and the bottom water temperature difference has increased, leading to the gradual enhancement of water stratification (Liang et al., 2004). In summer, the DO in the bottom water has decreased year by year. In early September 2015, the Bohai Sea experienced the historically lowest DO concentration (66 μmol/L), close to the hypoxic threshold (Chen et al., 2022). Studies have shown that the hypoxic areas in the Bohai Sea are mainly distributed in the narrow and deep water areas to the west of the shallow water in the central bank of the Bohai Sea, forming two hypoxic centers, the south (offshore of the Yellow River mouth) and the north (near Qinhuangdao) (Wei et al., 2019). The weak stratification structure and anti-cyclonic eddy in the central shallow bank of the Bohai Sea weakened the connectivity between the hypoxic zones in the south and north, while the tidal front provided the dynamic conditions for the expansion of hypoxic zones in low-lying areas (Liu et al., 2019). Isotopic methods have indicated that the formation of hypoxia in the Bohai Sea was mainly caused by the oxygen consumption of organic matter produced by phytoplankton in the upper ocean (Chen et al., 2022). In addition, the mineralization of accumulated organic matter in sediments in summer was also an important reason for the formation of bottom hypoxia and acidification environment.
In this study, through water quality monitoring of the Haihe River and Yongdingxin River estuary section in the summer and autumn of 2020, we found for the first time that hypoxia also existed in the Haihe River estuary area of the Bohai Bay. The Haihe River estuary is a weakly tidal and bidirectional estuary. When the tide gate is open, it is jointly affected by tide and flood. When the tide gate is closed, it is mainly influenced by tides. The Yongdingxin River, Jiyun Canal, and Chaobai River converge and flow into the Bohai Bay from the Yongdingxin River estuary. This estuary is mainly affected by tides (Li, 2016). The two estuaries are located in the northwest of the Bohai Bay, with weak circulation and poor water exchange capacity (Rabalais et al., 2002). Studies have shown that under multiple environmental pressures, this sea area has become one of the most prominent marine areas of coastal environmental problems in the Bohai Bay, and it is also a key area for the Chinese government to strengthen governance in the “14th Five-Year Plan”. Therefore, this study will explore the causes and mechanisms of hypoxia by analyzing and comparing the distribution characteristics of dissolved oxygen in different river estuaries in the Bohai Bay, providing scientific basis and reference value for improving the ecological environment of river estuary areas.
Materials and methods
Cruise and sample collection
The “R/V Jinhan 04700” vessel conducted two cruises in the summer from July 23 to August 3, and in the autumn from October 23 to November 6, 2020, to investigate the Bohai Bay area. Fourteen sampling stations were set up in the Haihe River estuary section (HH section) and Yongdingxin River estuary section (JYC section), with five stations in each of the two river channels and the rest in the adjacent sea areas near the two river mouths (Figure 1).
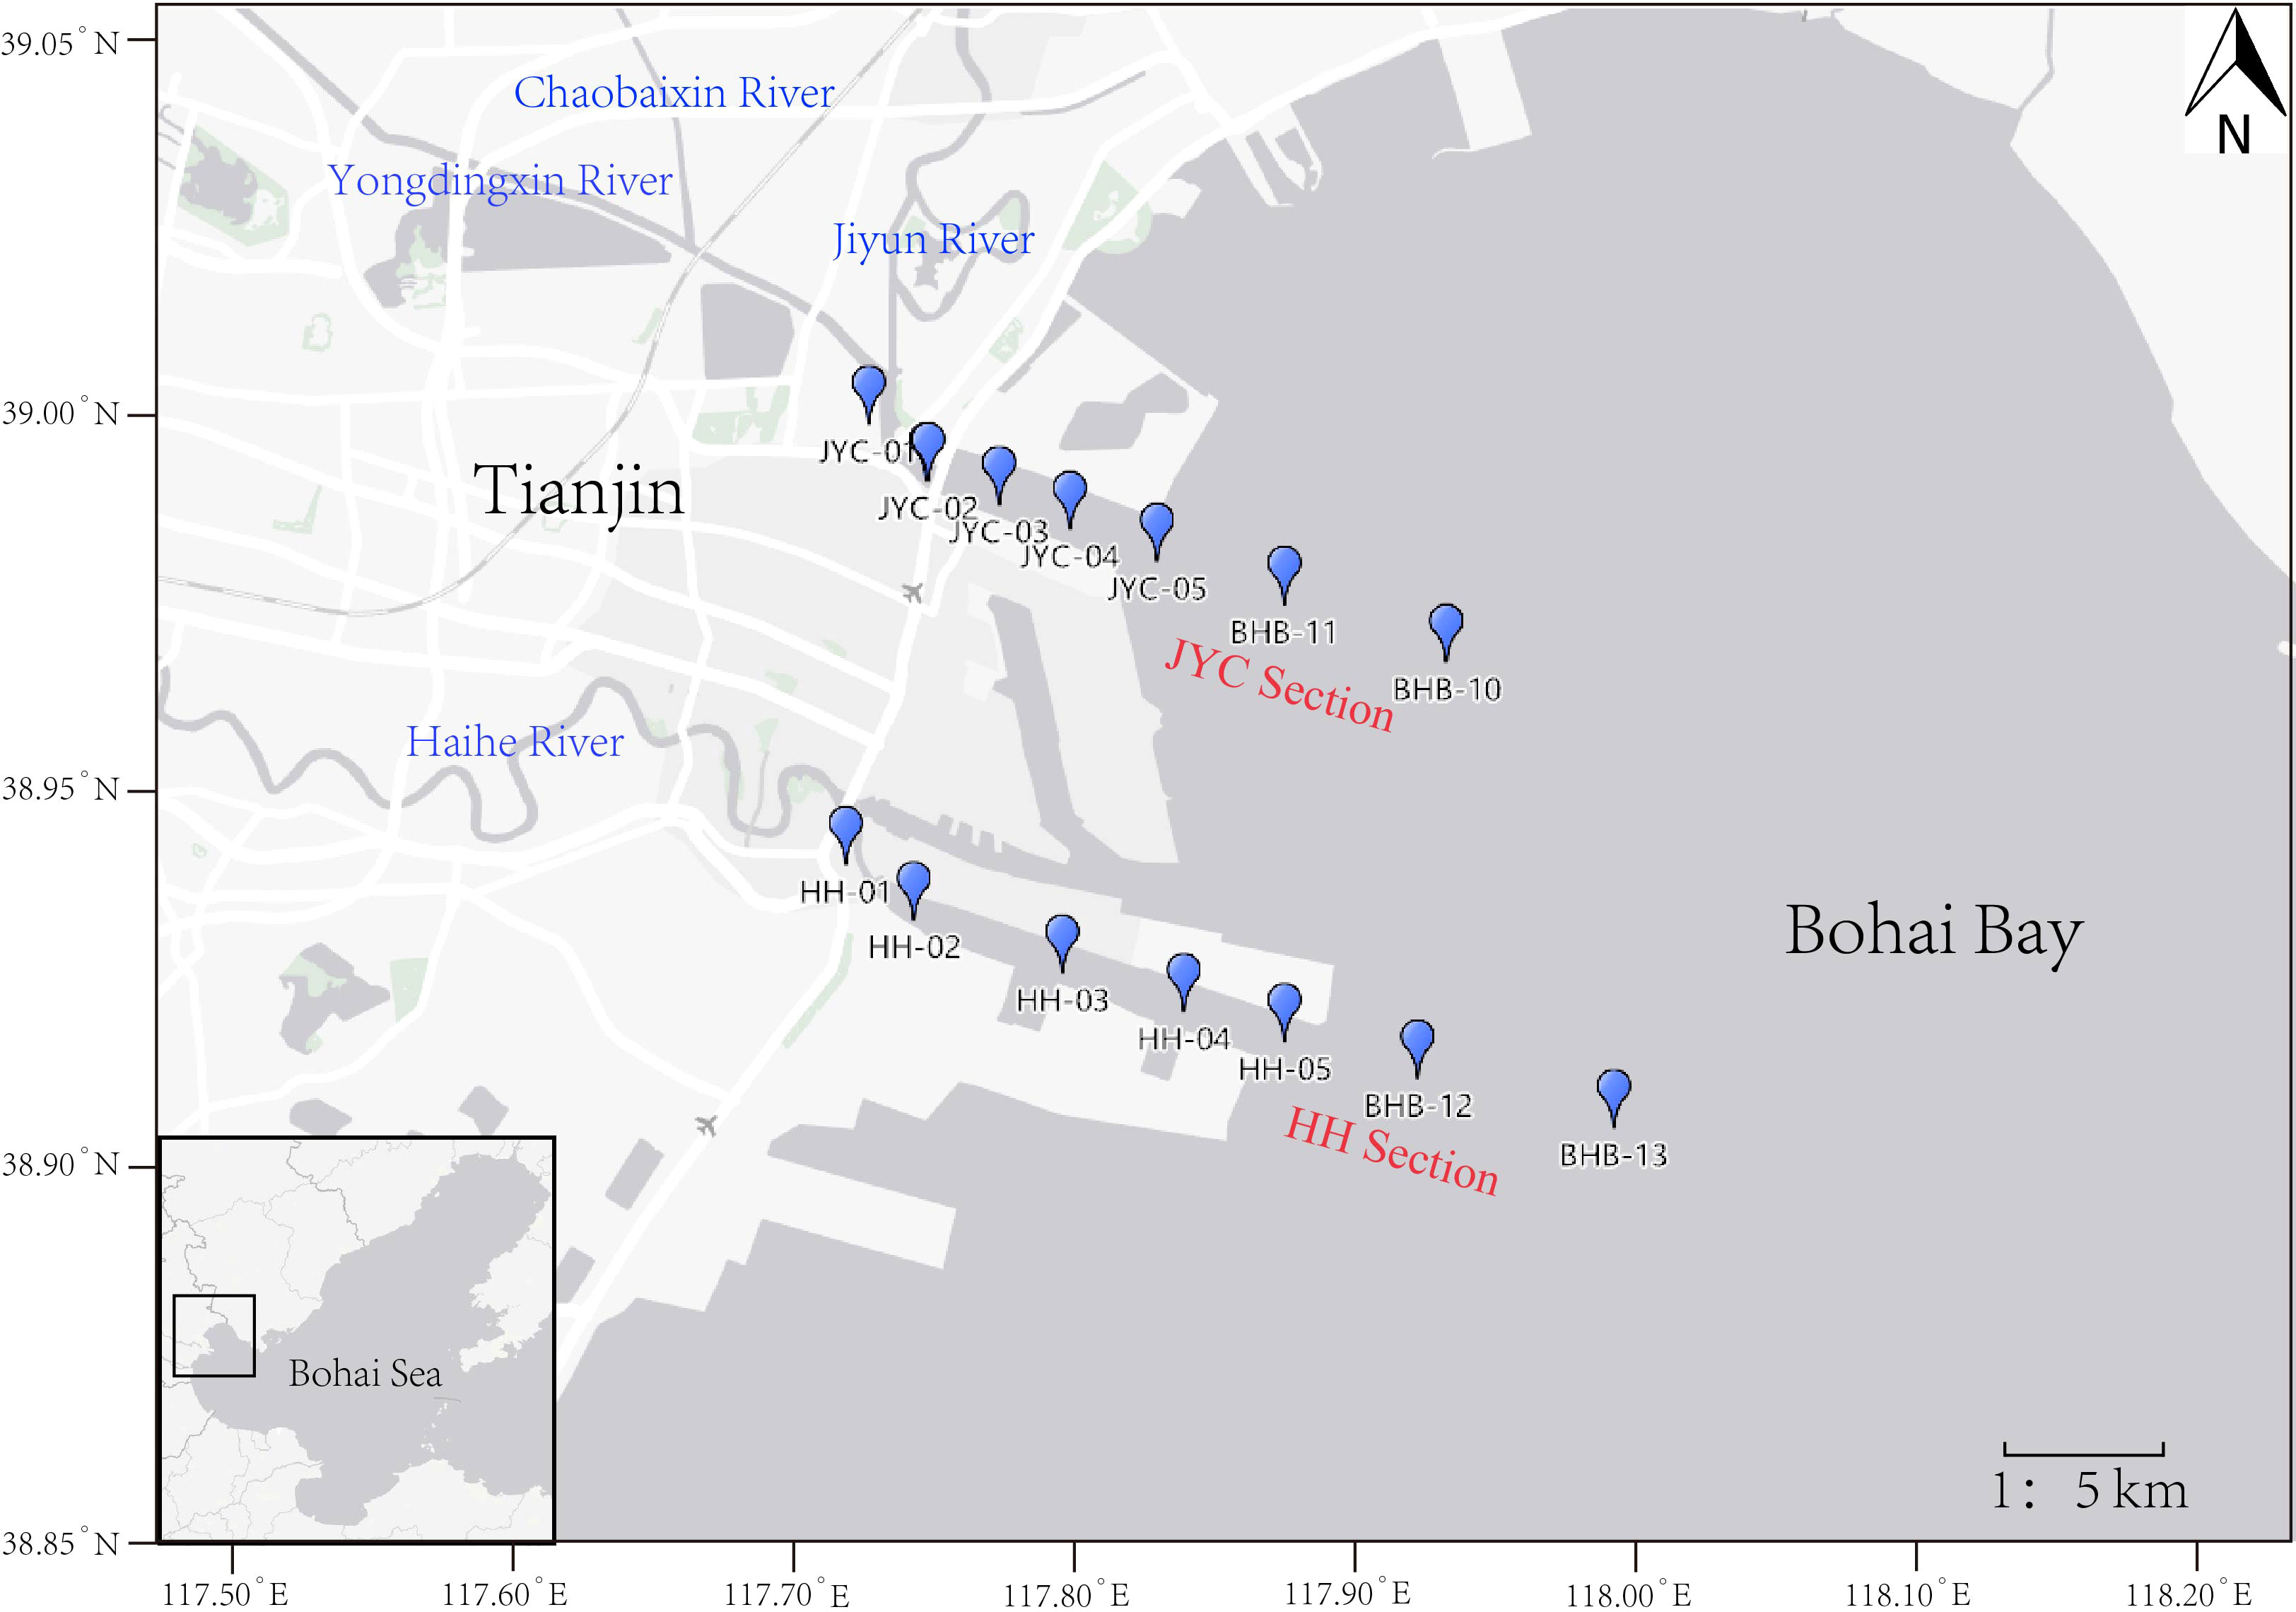
Figure 1 Location map of sampling stations at the HH section and JYC section in the Bohai Bay, China.
At each investigate station, multi-channel samplers (CTD, SBE-19 plusV2; Sea-bird Electronics, USA) were used to collect seawater samples from different water layers based on pre-set sampling depths. Prioritizing DO, Alkalinity (Alk), N2O, and other gas samples, the outflow rate was controlled during sampling to prevent bubble formation. Samples for DO measurements were immediately treated with MnCl2 and KI-NaOH reagents to fix the DO, and were then shaken and left in the dark for two hours. Water samples for pH determination were allowed to rest for a period of time after collection to minimize the effect of temperature differences on the measurements. All samples were collected in appropriate containers for subsequent analysis.
A volume of seawater was filtered using a Whatman GF/F filter membrane under 15 kPa pressure with a vacuum pump. The filtered membrane is used to determine chlorophyll a (Chl a) concentration, which should be wrapped in aluminum foil before being stored at -20 °C. The filtrate should be transferred to PE plastic bottles and frozen for nutrient concentration measurement. For COD determination, no filtration is required, and samples should be directly transferred to PE plastic bottles with added mercuric chloride (HgCl2) and stored in cold storage. It is necessary to pre-treat containers for sample storage by burning aluminum foil paper at 450 °C and soaking PE plastic bottles in acid solution, and then rinsing them with Milli-Q water.
Sample analyses
Water quality multi-parameter (RBR, Ottawa, Canada) was deployed to obtain parameters such as temperature, salinity, depth, pH, and DO. These parameters were recorded in the operation record file. pH and DO were manually measured on site. The pH samples were measured using a pre-calibrated ( ± 0.001) S210-K pH meter (S210-K, Mettler Toledo Technologies, Zurich, Switzerland). DO samples were titrated by the Winkler iodometric method. Three sets of parallel samples were set up for pH value and DO concentration measurement.
Nutrient samples were thawed at room temperature in the laboratory and measured using the nutrient auto-analyzer (AA3, Seal, Germany). Nitrate (NO3-N), ammonium (NH4-N), nitrite (NO2-N), phosphate (PO4-P), and silicate (SiO3-Si) were measured using the cadmium-copper reduction, sodium hypobromite, diazotization, phosphomolybdate blue, and silicomolybdate blue methods, respectively (Hansen and Koroleff, 1999).
Chl a samples were extracted in 90% acetone under dark and -20°C conditions for 24 hours. The supernatant was taken and measured using the Trilogy laboratory fluorometer (Trilogy, Turner Designs Ltd, USA). A standard working curve was plotted based on the calibrated Chl a standard concentration and fluorescence intensity, and the concentration of seawater Chl a was quantitatively calculated.
COD samples were measured using the alkaline KMnO4 method to determine COD concentration (Dhanjai et al., 2019).
Alkalinity samples were measured using the Gran titration method (Gran, 1952) with a T5 automatic potentiometric titrator (T5, Mettler Toledo Technologies, Zurich, Switzerland) equipped with a DGi111-SC pH probe, the accuracy was 0.001.
Data analyses
Calculation and correction of dissolved oxygen saturation concentration (DOs) were performed according to the formula developed by Garcia and Gordon (1992) and the relevant guidelines provided by the United States Geological Survey (USGS). The DOs were then used to calculate the apparent oxygen consumption (AOU) and the dissolved oxygen saturation (σ).
The dissolved oxygen saturation (σ) in seawater represents the percentage of the measured DO concentration to the saturated DO concentration. The formula used for its calculation is as follows:
Apparent oxygen utilization (AOU) is the difference between the saturation concentration and the measured concentration of DO, is often used to describe biological oxygen consumption processes. The formula for calculating AOU is as follows:
The eutrophication index (E) is often used to describe the nutritional status of seawater, and its calculation formula is:
In this formulation, E stands for the eutrophication index; CCOD refers to the measured value of chemical oxygen consumption (mg/L); CDIN and CDIP represent the measured values of inorganic nitrogen and inorganic phosphorus, respectively. The higher the E, the higher the degree of eutrophication.
The stratification coefficient, N, is commonly used to describe the stratification state of water.
In Equation 4, Δρ represents the density difference between different water layers, and Δz represents the change in depth. The magnitude of N reflects the stability of water stratification, with larger values indicating greater stability.
The concentration of CO2 in water was calculated by determining the total alkalinity (Alk). The CO2SYS_V2.1 script, compiled using VB language (Brookhaven National Laboratory, New York City, NY, USA) was used for the calculation.
The figures and tables in this paper were generated using the software Ocean Data View (ODV 5.4.6) and Origin PRO 2021. The data were analyzed using SPSS 27.
Results
Distributions of temperature and salinity in the HH and JYC section
Temperature and salinity are important parameters for reflecting the properties of seawater, and both can affect water stratification through the presence of thermoclines and haloclines. Figure 2 illustrated the temperature and salinity distribution in two estuaries during different seasons. During the survey periods in July (summer) and October (autumn) 2020, the water temperature in the study area ranged between 14.77 °C and 28.92 °C. The water temperature in the two estuarine sections differed considerably between summer and autumn due to seasonal warming, with summer temperature being significantly higher than those in autumn (p<0.01). The temperature distribution characteristics of the two estuarine sections were generally consistent in summer survey, with high inshore water temperature, low distant shore water temperatures, high surface water temperature, and low bottom water temperature (Figure 2A, E). However, in autumn, the temperature distribution was opposite to that of summer (Figure 2B, F), with the highest temperature appearing at the bottom of the eastern station and the lowest temperature at the surface of the western station. Furthermore, the water temperature in the vertical direction of the HH section changed significantly during summer, with an average rate of change of 0.18 °C/m, while in autumn, the vertical change rate of water temperature was 0.01 °C/m. However, in both summer and autumn, the difference of water temperature in the vertical direction in the JYC section was not as significant as that in the HH section (p<0.01).
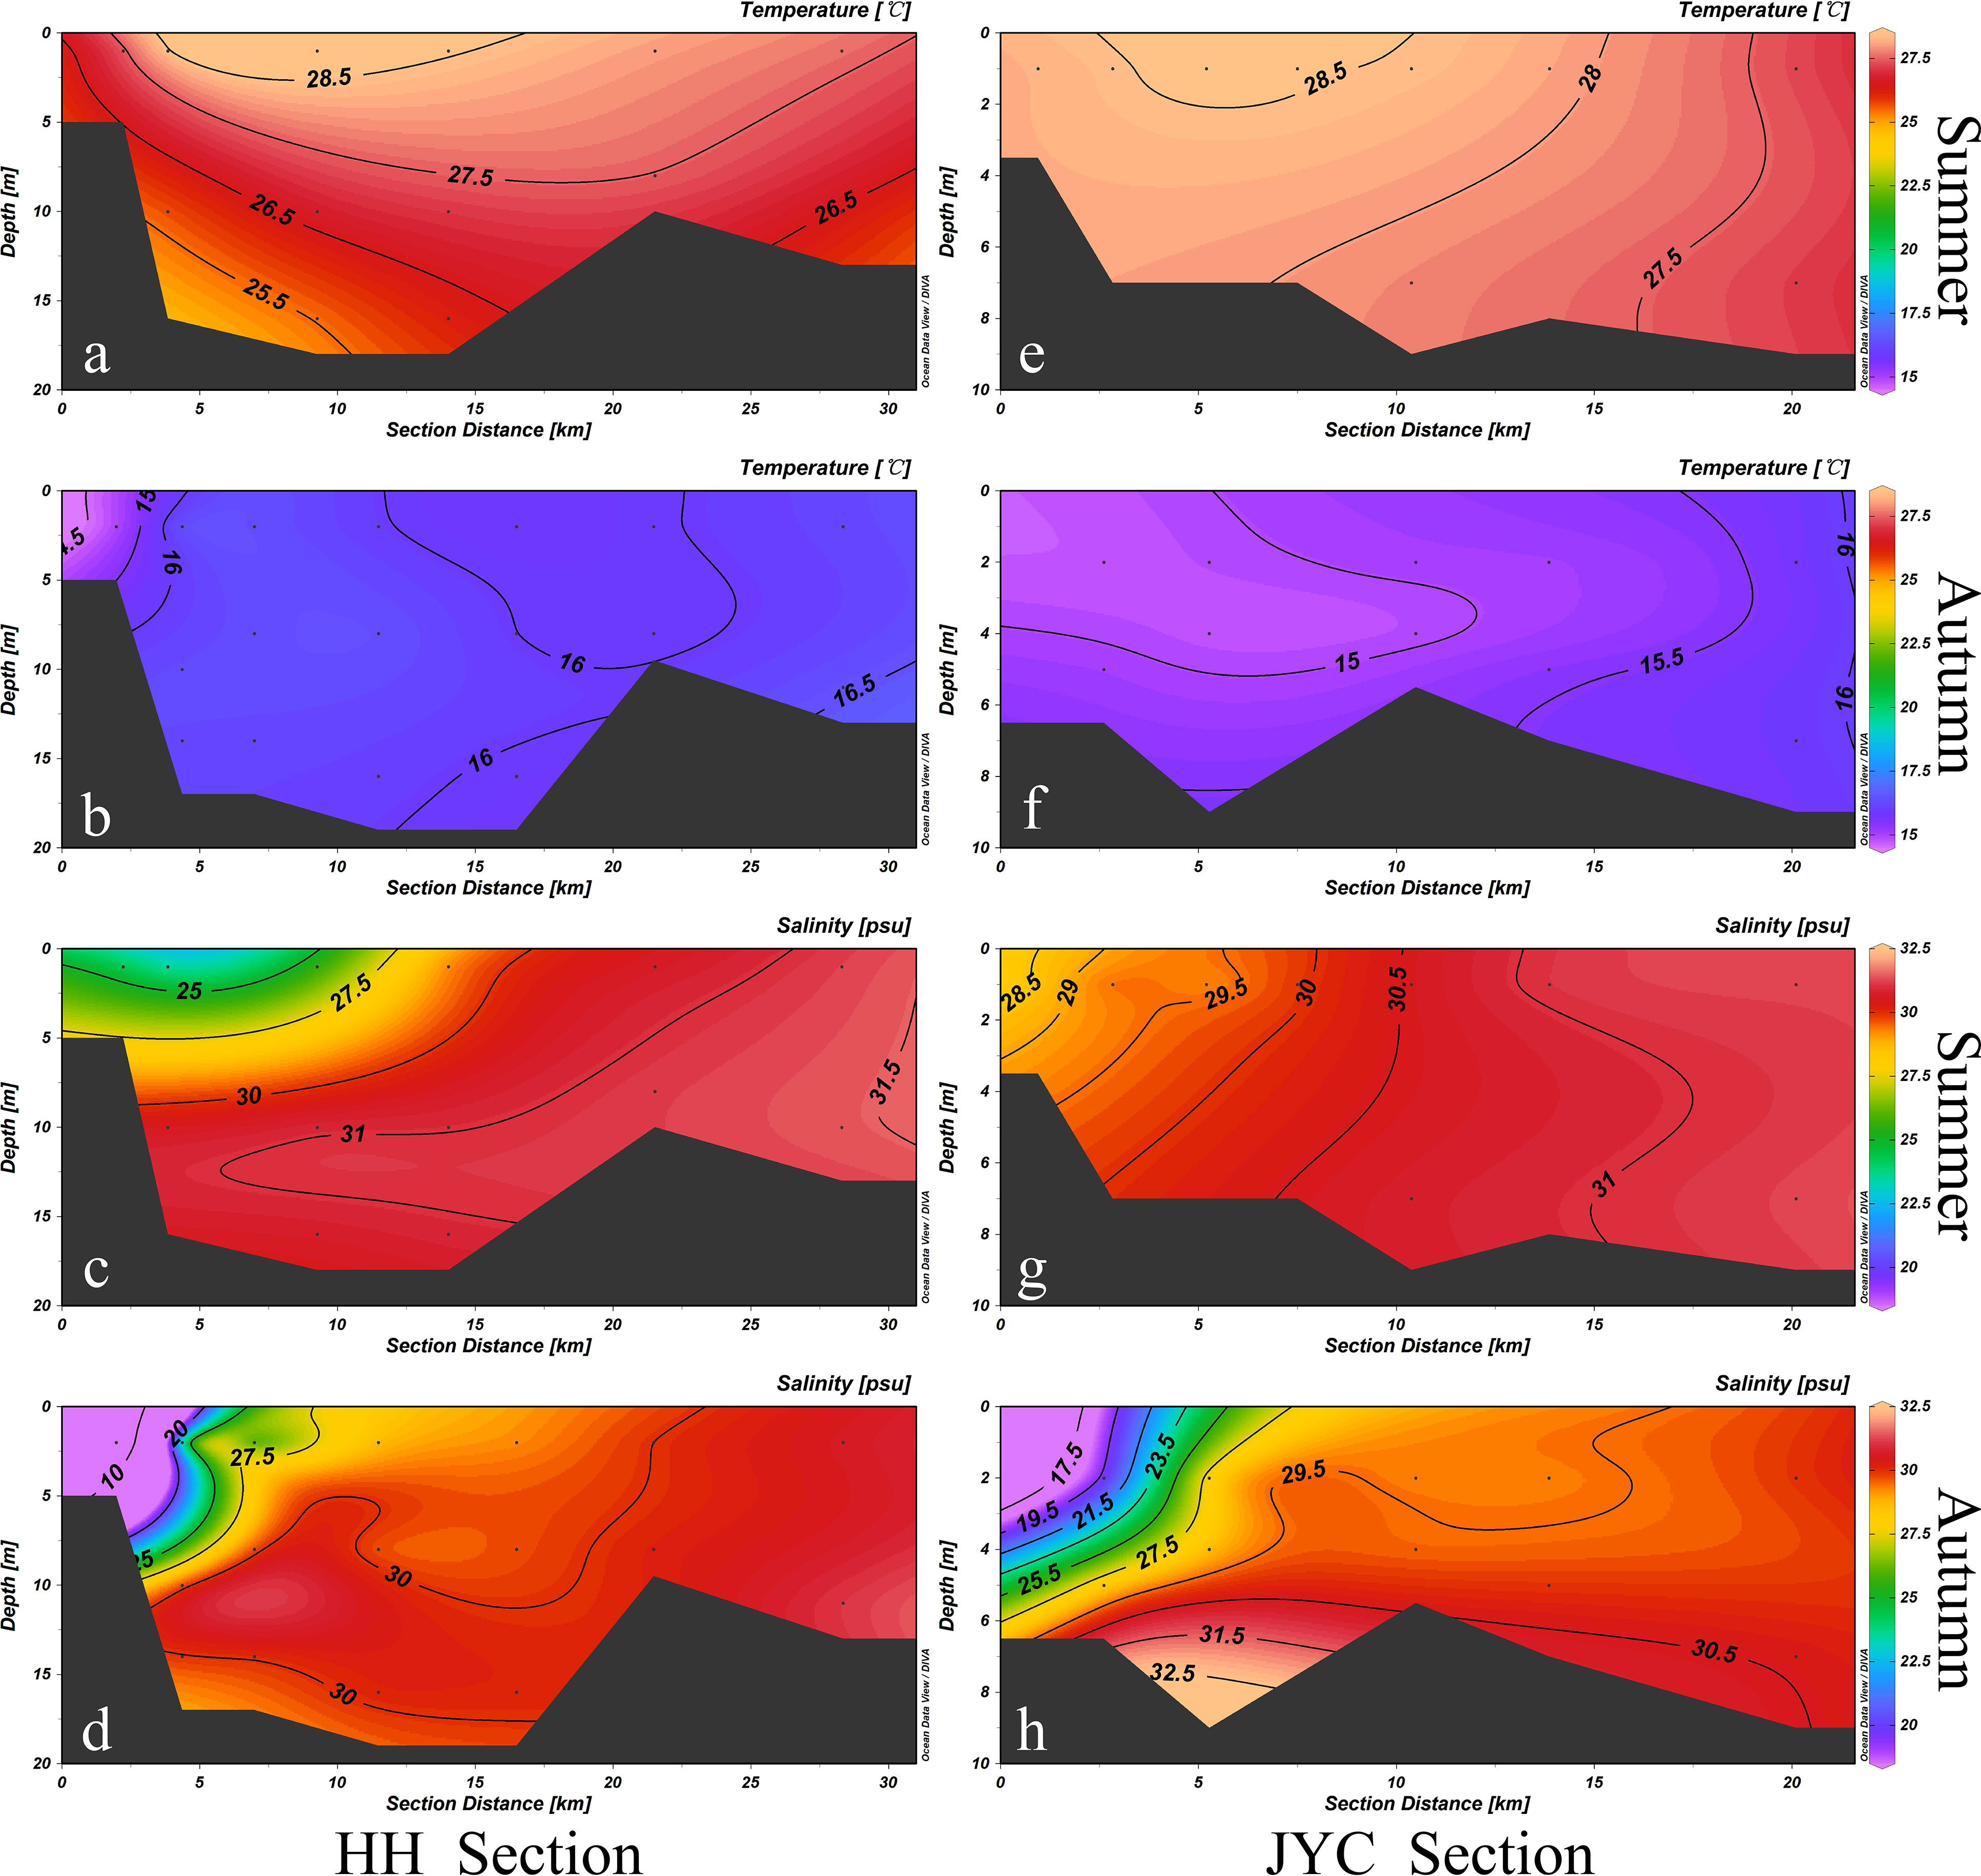
Figure 2 Temperature and salinity distributions of HH Section (A–D) and JYC Section (E–H) in summer and autumn.
The salinity distribution of the HH and JYC sections was generally similar. Both sections exhibit a west-to-east gradient of increasing salinity during the summer and autumn. Salinity increased with distance from the shore, gradually increasing from the surface to the bottom. During the autumn survey, the discharge of floodwaters in the upper reaches of the HH section resulted in a large input of freshwater, leading to a low-salinity area in the upper reaches of the HH section and causing a wider range of salinity distribution in autumn (6.63 to 31.44). Although the salinity distribution range of the JYC section is larger in autumn, the effect of freshwater runoff on salinity was weaker than that of the HH section.
Distributions of pH and DO in the HH and JYC section
Figure 3 illustrated the pH, DO and DO saturation distributions in two estuaries during different seasons. In summer, the pH values of the HH section ranged from 7.74 to 8.19, and gradually decrease with depth. The lowest pH value was observed at the bottom of station HH-2 (7.73). In autumn, the pH of the middle water layer was lower, and the average pH of the bottom layer (8.30) and the surface layer (8.39) were both higher than that of the middle layer (8.26). The vertical distribution characteristics of pH were significantly different from those observed in summer (p<0.01). In the JYC section, the pH distribution characteristics differed in different seasons, with lower values observed in the upper reaches and higher values in the lower reaches. However, the pH did not vary significantly with depth, ranging from 7.84 to 8.16 in summer, with a negligible change in the vertical direction (ΔpH≈0.005/m). Under the influence of tides, the pH value of the surface water at the confluence of the river and the ocean was higher, while the pH value of the bottom water was lower in autumn. The observation results of the stations located in the upper reaches of the estuary showed that the pH distribution in the surface layer was consistent with that in the bottom layer.
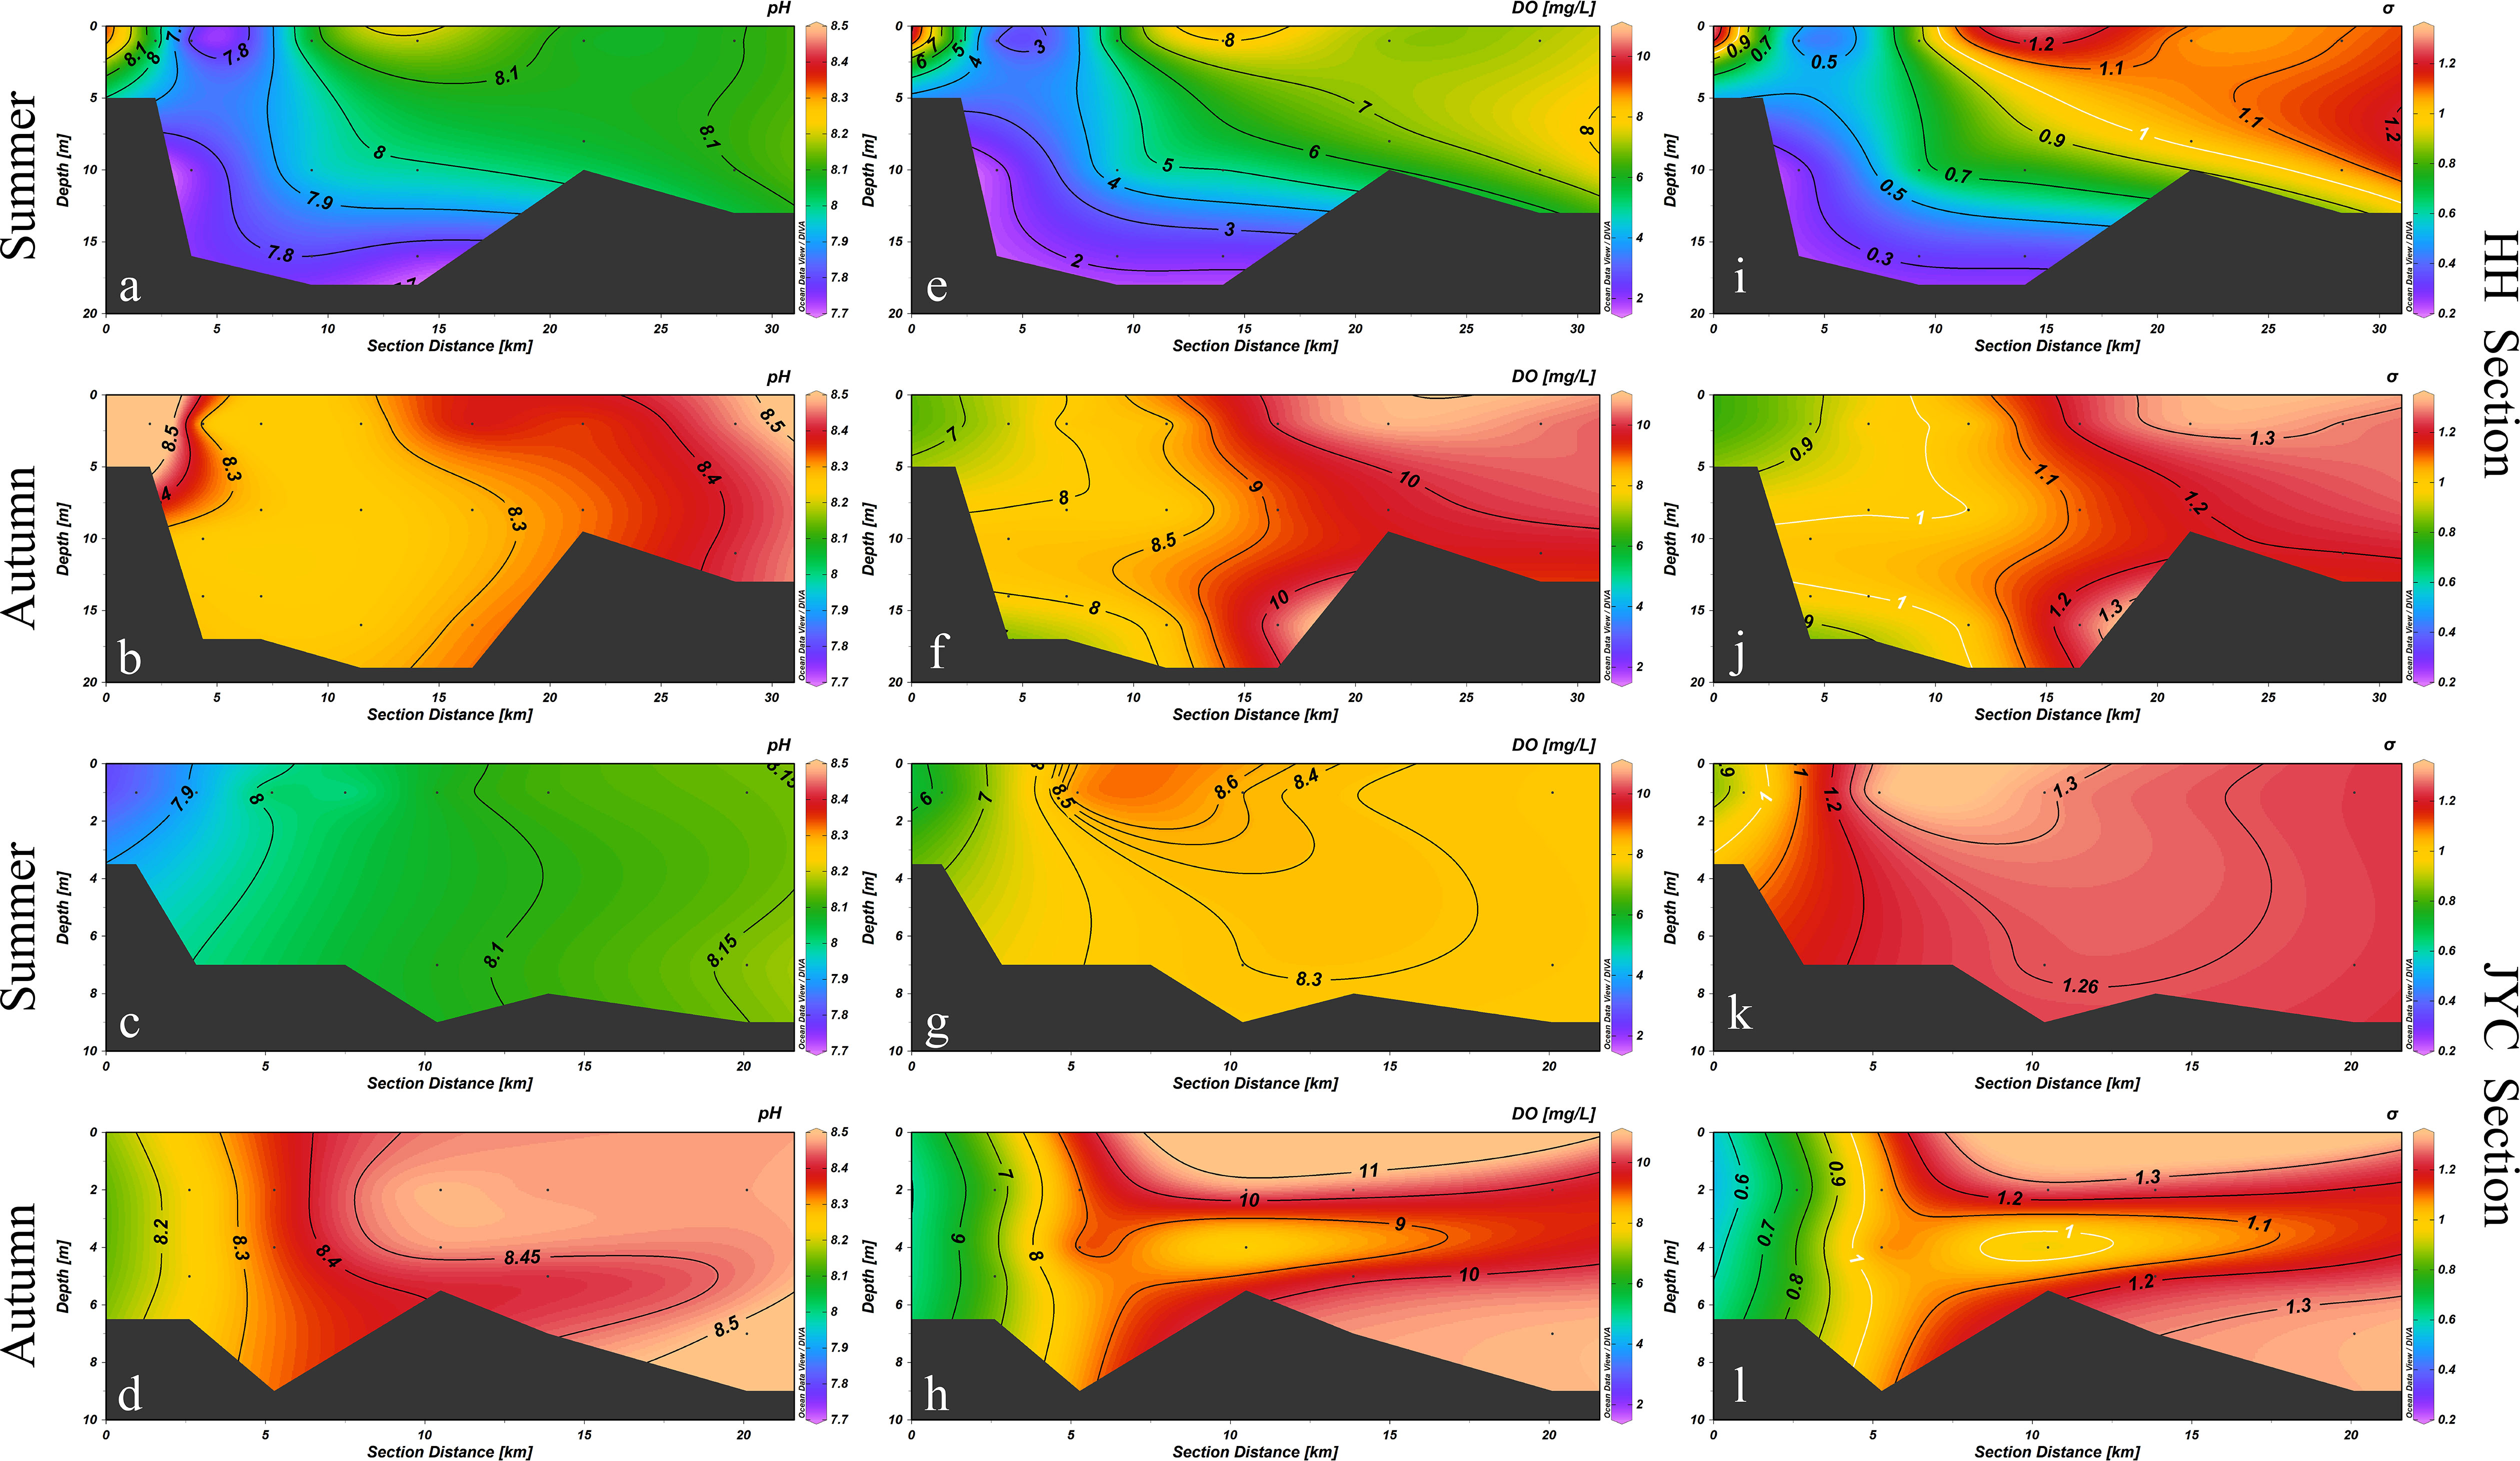
Figure 3 Distributions of pH, DO concentration and dissolved oxygen saturation σ in the HH Section (A, E, I, B, F, J) and JYC Section (C, G, K, D, H, L) in summer and autumn.
Based on the analysis of the collected samples during the voyage and the calculation of the saturated DO concentration, significant temporal and spatial differences were observed in the distribution of DO concentration in the HH section. In summer, the DO content in the HH section was low, ranging from 1.84 to 8.00 mg/L, with a wide range of hypoxia areas in the bottom water. The average DO content in the bottom layer was 4.02 mg/L, and the minimum DO value appeared at the bottom of HH-2 station, with an oxygen saturation of 0.27, indicating hypoxic conditions. In autumn, the DO content in the HH section was higher than that in summer, ranging from 7.35 to 10.89 mg/L, with more than half of the stations being supersaturated with DO. The concentration of DO in all stations was higher than the hypoxia critical value. In autumn, the water in the HH section mixes more evenly in the vertical direction, and the distribution of DO in the surface and bottom layers was relatively consistent. The change rate of DO in the vertical direction was significantly different between the two seasons compared with the distribution in summer (p<0.01).
Similar to the HH section, the JYC section also exhibited a distribution pattern of low DO concentration near the shore and high DO concentration far from the shore in both seasons. In summer, the DO concentration in the JYC section ranged between 6.14 and 8.77 mg/L, which was relatively uniform and generally higher than the defined value for low-oxygen water. In autumn, DO concentrations ranged from 6.62 to 10.86 mg/L. The DO concentration increased significantly from the estuary to offshore.
Distributions of eutrophication and Chl a in the HH and JYC section
Sources of oxygen-depleting organic matter in water include both freshwater inputs and local production. Figure 4 illustrateed the degree of eutrophication and distribution of Chl a in the two estuaries during the summer and autumn seasons. Influent water from the upper reaches of the two rivers consistently exhibited high trophic states (EHH-1 = 186.95, EJYC-1 = 57.49). Eutrophic water inputs from runoff were continuously diluted by oligotrophic seawater, resulting in a gradual decrease in eutrophication indices in the horizontal direction. Due to variations in water mixing, the eutrophication indices of the estuary sections exhibit different vertical distributions during different seasons. Overall, eutrophication tended to be more homogeneous in the surface and bottom layers during autumn, while eutrophication was mostly confined to the surface layer during summer.
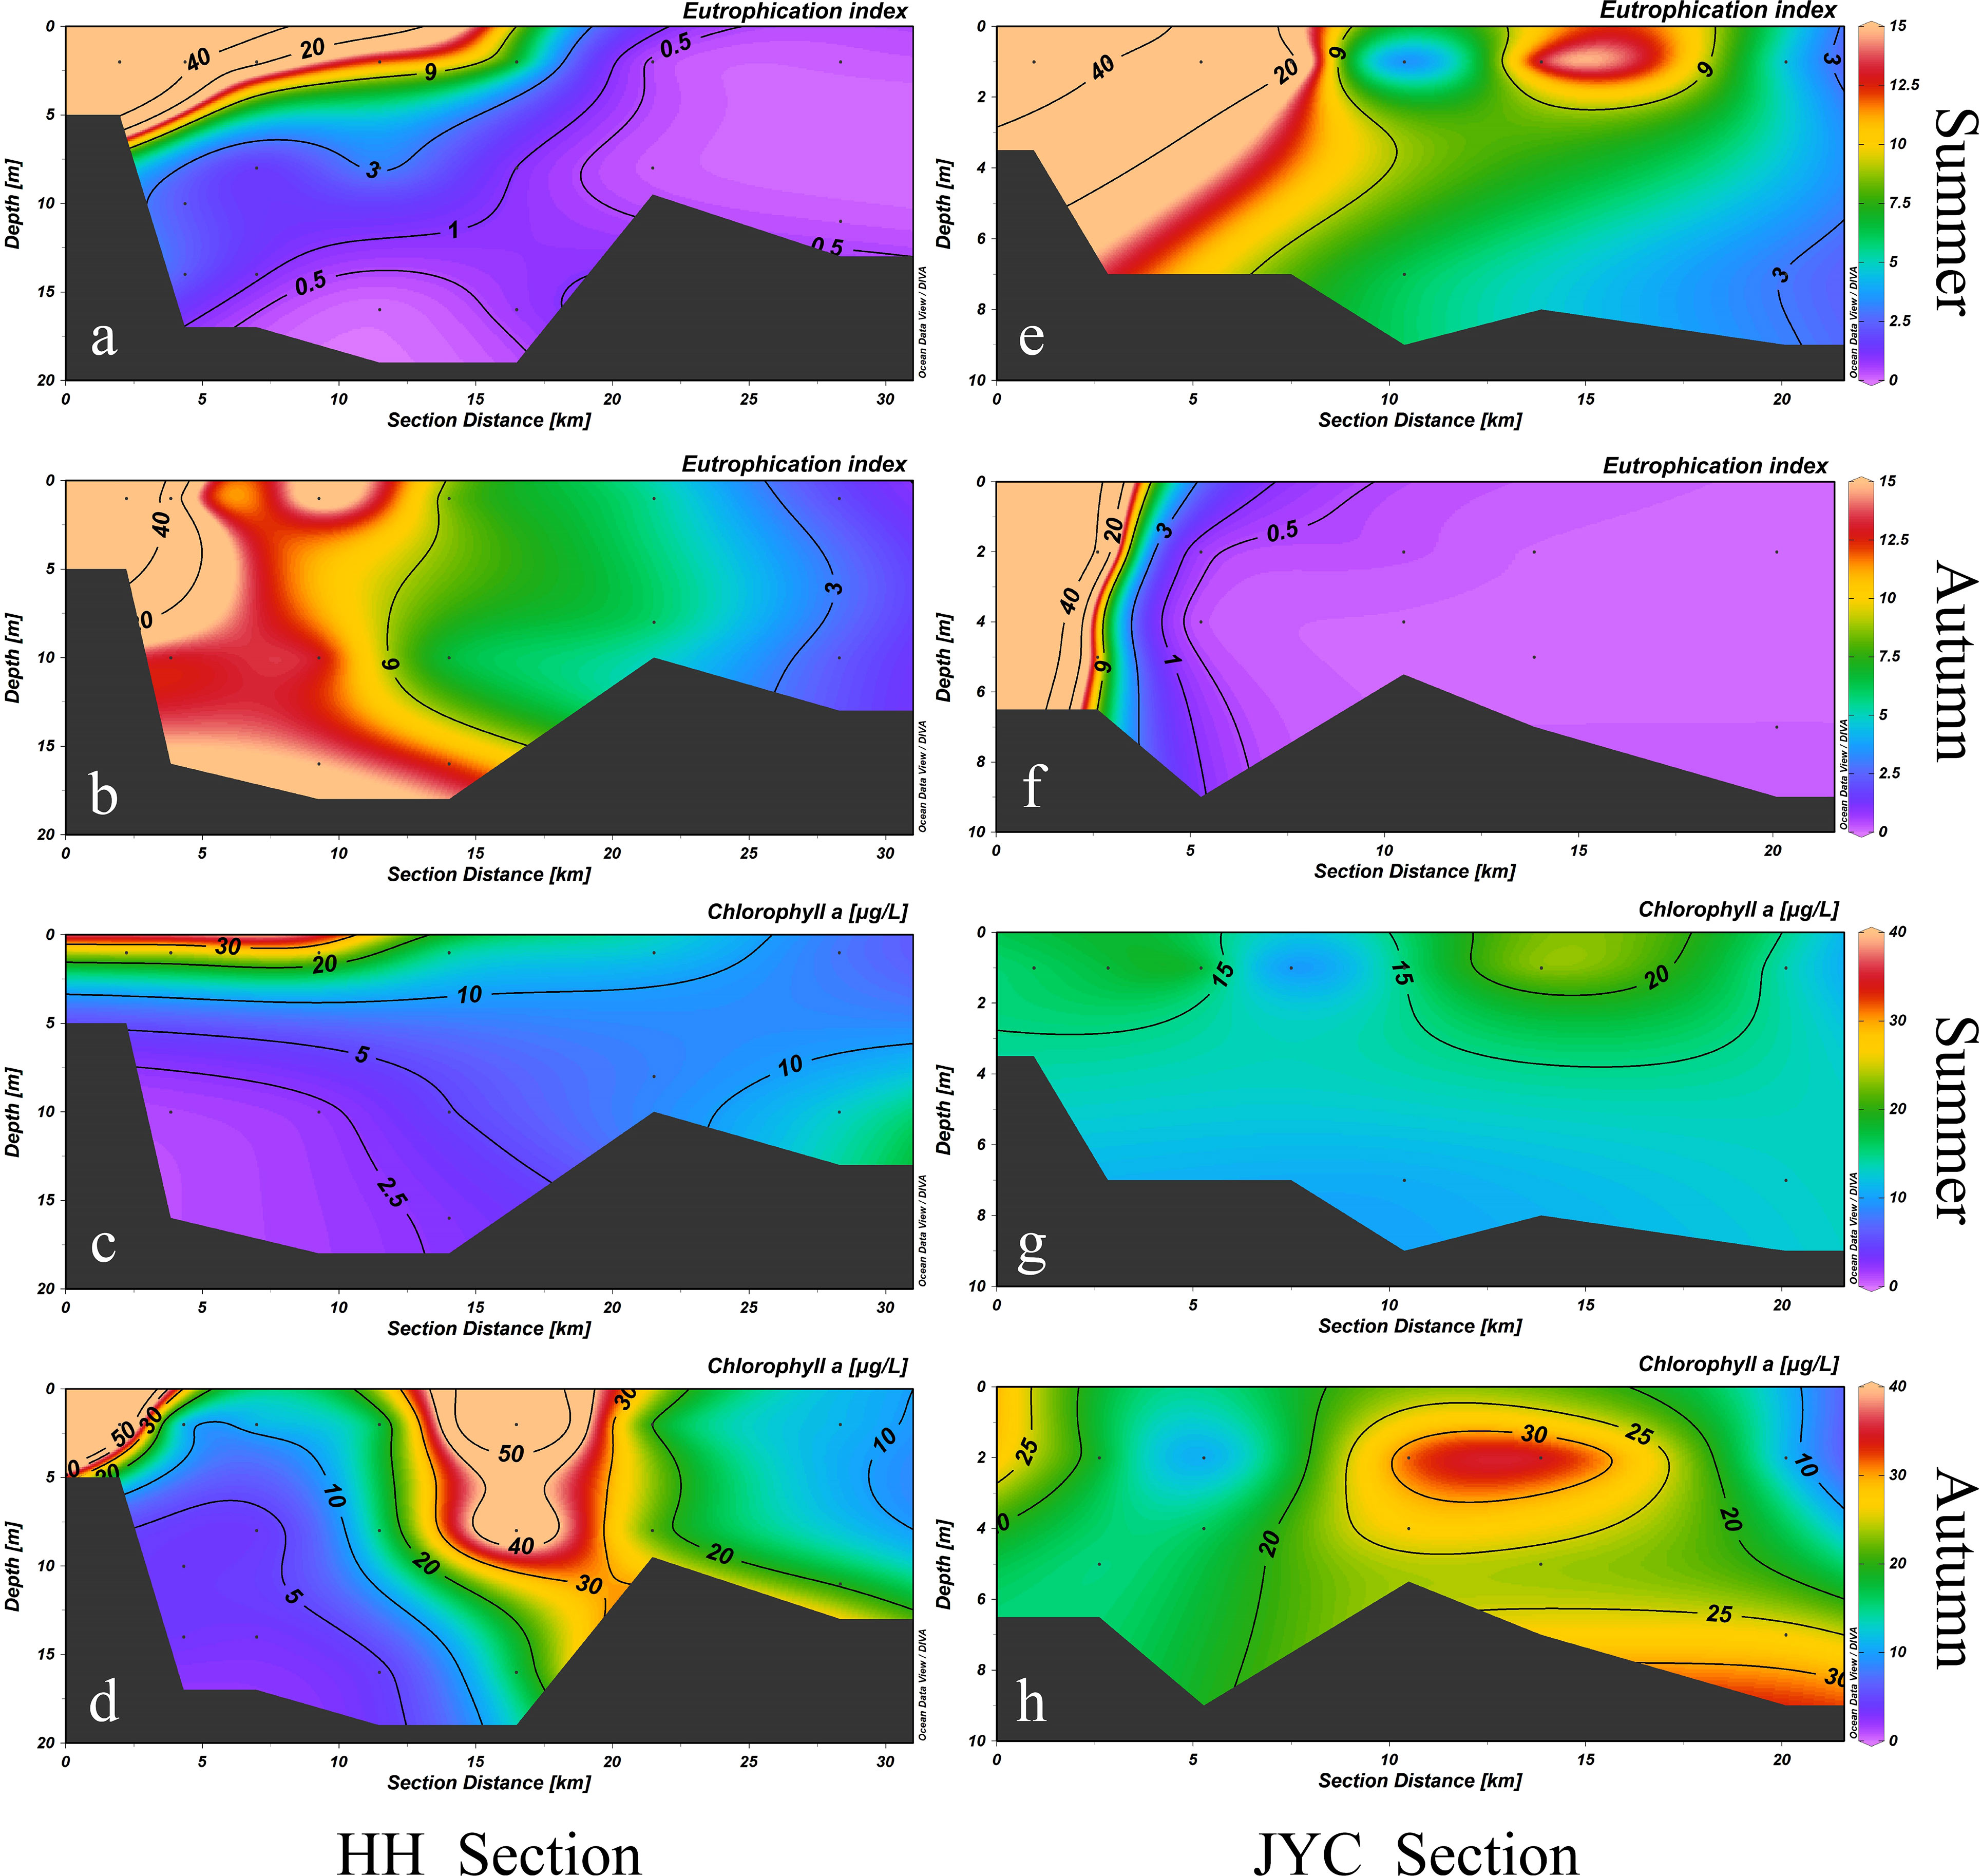
Figure 4 Eutrophication index (E) and Chl a concentration distributions of HH Section (A–D) and JYC Section (E–H) in summer and autumn.
Inconsistencies were observed between the distribution of Chl a and eutrophic water. During summer, Chl a in the HH section was mainly distributed in the surface water of HH-1~HH-3 stations located in the upper reaches of the estuary section, with an average concentration of 25.7 μg/L. At the bottom of the upstream sampling sites, the concentration of Chl a was low, only 1.40 μg/L. In the upper reaches The distribution of Chl a was consistent with the eutrophication water, while the Chl a concentration in the bottom water of the lower reaches was up to 10 μg/L, despite the low degree of eutrophication. In autumn, two areas of high Chl a concentration were observed in the HH section, namely, HH-1 station (84.89 μg/L) located in the upper estuary and HH-5 station (80.83 μg/L) in the Bohai Bay. In the upper part of the JYC section, the eutrophication index was higher but the concentration of Chl a was lower, while the lower part of the JYC section showed high levels of both Chl a and eutrophication index. The distribution of Chl a in autumn was essentially inconsistent with that of highly eutrophic water. Except for HH-1 and JYC-1 stations in the upper reaches of these two sections, which were greatly affected by runoff input, the area of high Chl a values in the two estuarine sections did not coincide with the severe eutrophication water in general.
Discussion
Mechanism of hypoxia formation in HH section
Research has demonstrated that water stratification is a prerequisite for the formation of hypoxia (Diaz and Rosenberg, 2008). In this process, we found temperature to be the dominant factor, with solar irradiation as the main contributor to the temperature increase in summer. The variation in temperature, particularly during the summer months, significantly contributes to the DO stratification of water. Due to the HH section’s deeper depth, the temperature increase was not uniform between the surface and bottom water when heated by solar irradiation, resulting in a large temperature difference between them and the formation of density difference. The runoff input of low-salinity surface water also contributed to the density difference, thus promoted the formation of stratification. However, compared to temperature, salinity is not the main cause of stratification. The linear correlation graph between salinity and dissolved oxygen concentration (Figure 5B) shows that there was no significant salinity difference accompanying the change in dissolved oxygen concentration in the upstream and downstream sections of the Haihe Estuary in summer. By calculating the stratification coefficient N, we found that the HH-2 and HH-3 stations belong to the slow mixed type, indicating that there was some degree of stratification during summer investigation. Additionally, Figure 5A indicated a positive correlation between temperature and DO concentration in the HH section during summer. The stratified structure in the HH section made it difficult to reoxygenate the bottom cold water after DO depletion (Murphy et al., 2011), while the surface water, with high temperatures and frequent exchange of water and air, results in high DO concentrations. This not only explained the positive correlation between DO and temperature but also suggested that temperature was the primary factor causing delamination in the HH section.
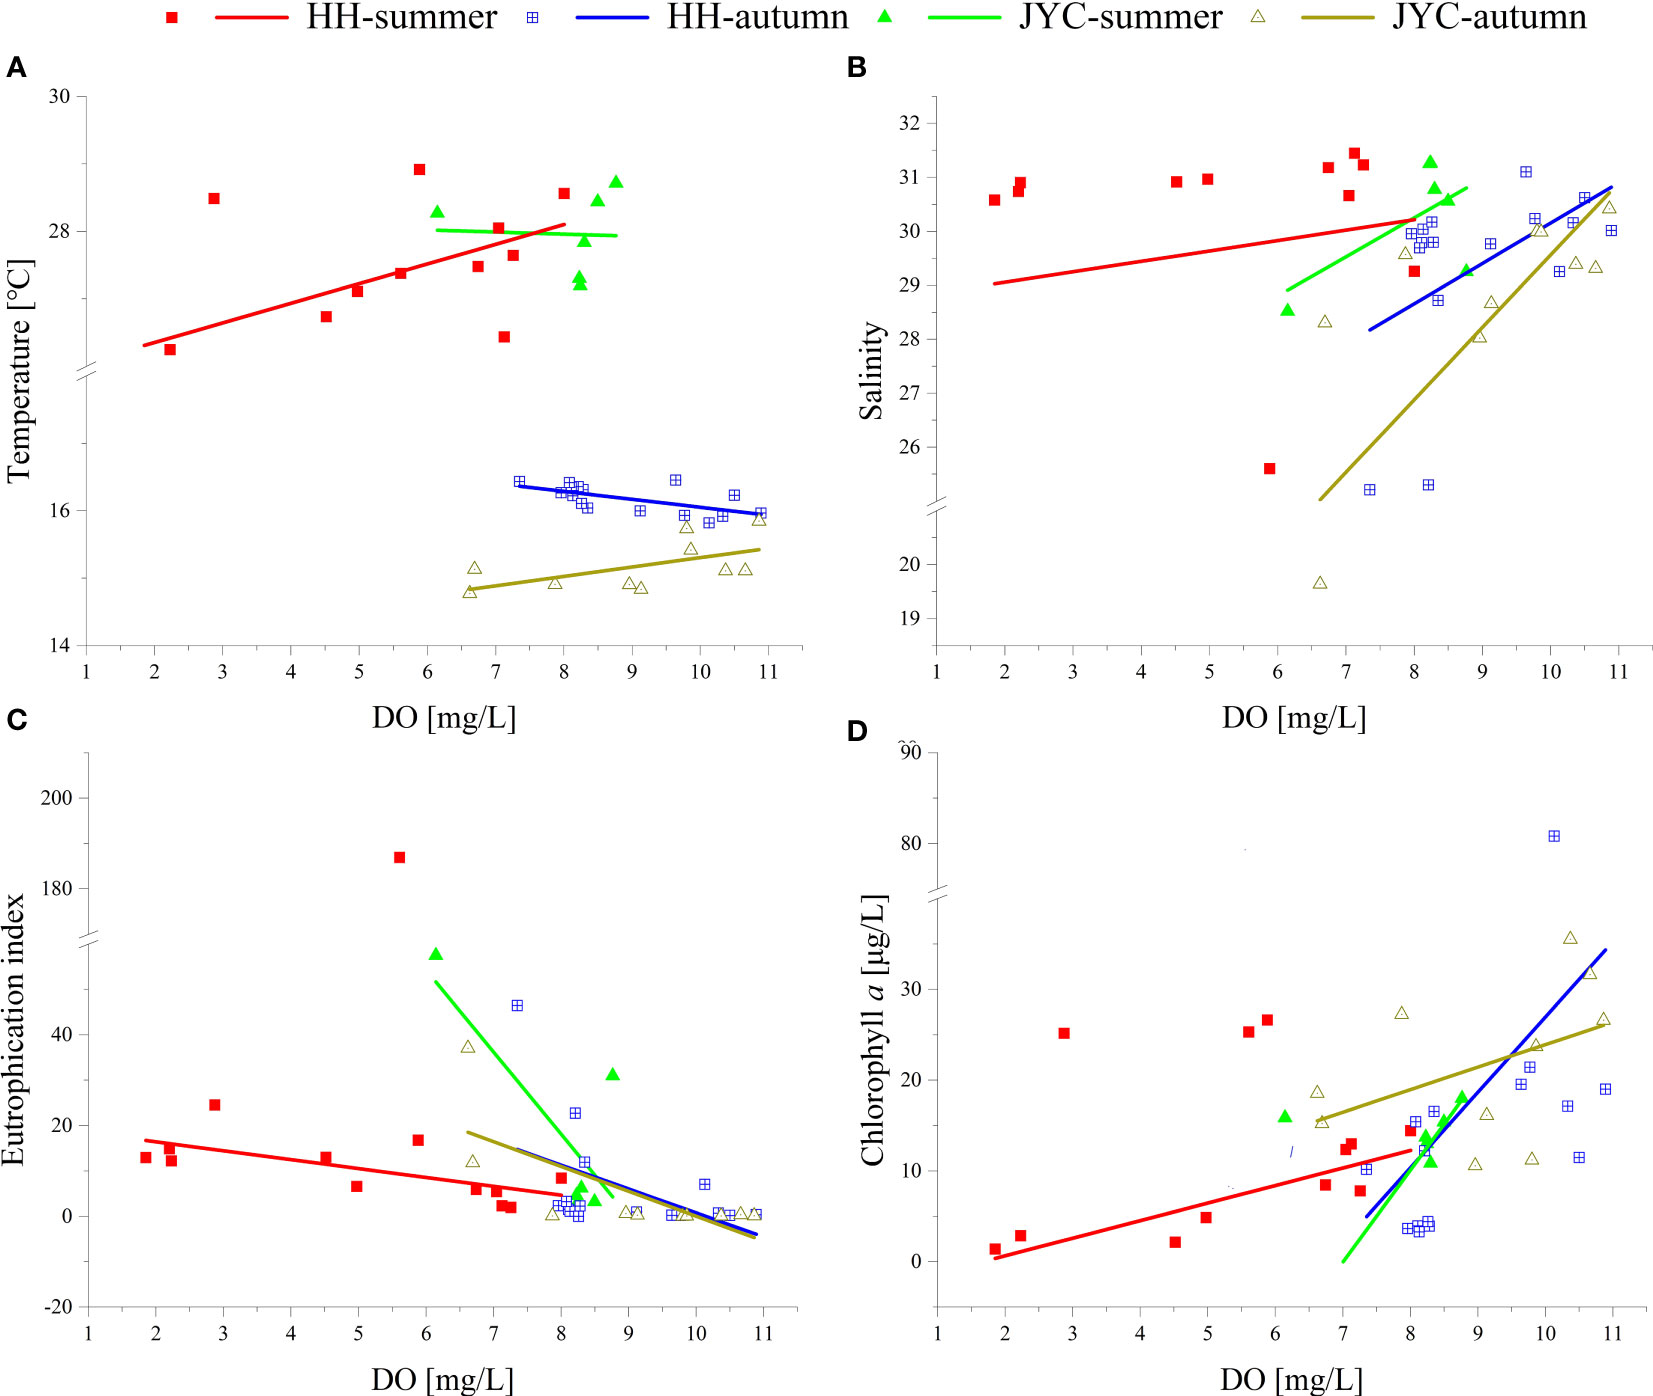
Figure 5 Linear relationship between DO concentration and other parameters (A, temperature; B, salinity; C, eutrophication index; D, chlorophyll a) in the HH section and JYC section in two seasons.
In comparison to the HH section, the water depth in the JYC section was relatively shallower (Hmax< 9 m). Due to exposure to solar radiation, there was a more uniform temperature distribution in the water column with a smaller temperature gradient from the surface to the bottom (ΔT< 1°C). These conditions were not conducive to the formation of a stratified structure. Additionally, the topography of the JYC section’s riverbed played a role in the difficulty of forming a stratified structure. As shown in the sectional diagram, the bed of the JYC section gradually descends through a step-like drop and increases in-depth uniformly, while the bed of the HH section had a large drop at station HH-2 and a large uplift at station HH-4, forming a “basin” on the riverbed. This topography, similar to a valley and a “V”-shaped trough, prolongs the water’s stagnation time and limits its composition exchange with the surrounding water (Rowe and Chapman, 2002; Bianchi et al., 2010), further restricting the reoxygenation process in the bottom water. Most of the low-oxygen regions found during the summer survey in this study were located in depressions in this riverbed. It is evident that the stable stratified structure formed in the HH section during summer hinders the reoxygenation of the underlying water, which was consistent with existing research conclusions (Conley et al., 2011; Rabalais et al., 2014).
The depletion of oxygen due to microbial decomposition of organic matter is the primary cause of hypoxia. The eutrophication index (E) is an indicator of the nutritional status of a body of water. The presence of dissolved inorganic and organic matter can both contribute to the increase of the eutrophication index, which is closely related to the DO concentration.
Linear analysis revealed instances where the correlation between DO concentration and the eutrophication index did not reach statistical significance. Nevertheless, a negative correlation was observed overall (Figure 5C). This finding suggests that, despite the existence of certain data points not conforming to statistical significance, the overarching trend highlights eutrophication as a significant promoter of hypoxia formation (Diaz, 2001). This reflects the intricate interactions within ecological systems and the role various factors play in influencing DO concentrations.
By analyzing the components of the eutrophication index formula, it was found that the concentrations of nutrients (DIN, DIP) were significantly negatively correlated with DO concentration in different seasons (Summer: r HH-DIP=-0.44, r HH-DIN=-0.50, r JYC-DIP=-0.60, r JYC-DIN=-0.78, Autumn: r HH-DIP=-0.59, r HH-DIN=-0.64, r JYC-DIP=-0.77, r JYC-DIN=-0.80). However, the correlation coefficient between COD and DO showed considerable variability across different seasons.(Summer: r HH-COD=0.12, r JYC-COD=-0.66, Autumn: r HH-COD=0.63, r JYC-COD=-0.023). This suggests that DIN and DIP had a greater impact on the eutrophication index, as microorganisms decompose organic matter to produce DIN and DIP at the bottom of the section. It is noteworthy that there was no significant difference between the two river sections in autumn (p>0.05). Additionally, during summer, the effect of the eutrophication index on the DO concentration in the JYC section was less pronounced than in the HH section. This may be because the stations in the JYC section mainly collected surface samples, and the DO concentration was significantly affected by sea-air exchange (Diaz, 2001).
Chl a is an important indicator of phytoplankton biomass and a major source of DO content. At the upstream end of the JYC section, the JYC-1 station was an exception. Despite displaying Chl a concentrations similar to other stations, this station experienced markedly elevated levels of eutrophication due to upstream influences. This was reflected in an initial correlation coefficient of -0.12 between DO and Chl a concentrations at the JYC section prior to data exclusion. This unusual correlation indicated an overlying impact of organic matter decomposition on DO concentrations at this station, resulting in lower DO levels even with comparable Chl a concentrations. In light of this finding, we made the decision to exclude data from the JYC-1 station in our analysis. After this adjustment, a positive correlation between Chl a and DO concentration emerged in the JYC section as well, aligning with the correlations seen in both river sections during both seasons (rHH=0.77, rJYC=0.86 in summer; rHH=0.45, rJYC=0.43 in autumn). In summer, the correlation between Chl a and DO concentration in the HH section was significantly higher compared to other seasons. This suggested that the reoxygenation process in stable stratified water was more reliant on photosynthesis in summer, while the replenishment pathway of DO through sea-air exchange was hindered by stratification. In autumn, the correlation between Chl a and DO concentrations showed no significant difference in the HH section and JYC section (p>0.05), suggesting a similar contribution of sea-air exchange and photosynthesis to the DO sources in both river sections.
The coupling relationship between low oxygen and pH in the river estuary
The mechanism of water acidification may be due to the mixing of low pH water from terrestrial sources with seawater or the result of biological oxygen consumption. Our study found a strong correlation between pH and DO concentration (Figure 6A), consistent with previous research (Wang et al., 2017). As mentioned earlier, the distribution of acidification zones and hypoxic zones was similar. The higher water temperature in summer accelerated respiratory and decomposition reactions, and CO2 produced by cellular metabolism further promoted the acidification process (Cai et al., 2020). Due to the presence of stratification, material exchange between surface and bottom water was limited, and CO2 in bottom water cannot be diluted in time, which exacerbated water acidification (Cai et al., 2011). To further quantify the relationship between pH and DO, we calculated the CO2 concentration and redundant CO2 concentration (ΔCO2) in water. It is worth noting that the CO2 content in hypoxic water was mainly derived from two pathways: microbial decomposition of organic matter and denitrification. By measuring the N2O concentration in water (average value of 37.44 nmol/L), the corresponding CO2 content produced is much lower than that due to AOU. Therefore, we neglected the CO2 content produced by denitrification and only calculated the CO2 production from organic matter decomposition based on the (Redfield, 1963) equation for oxygen consumption.
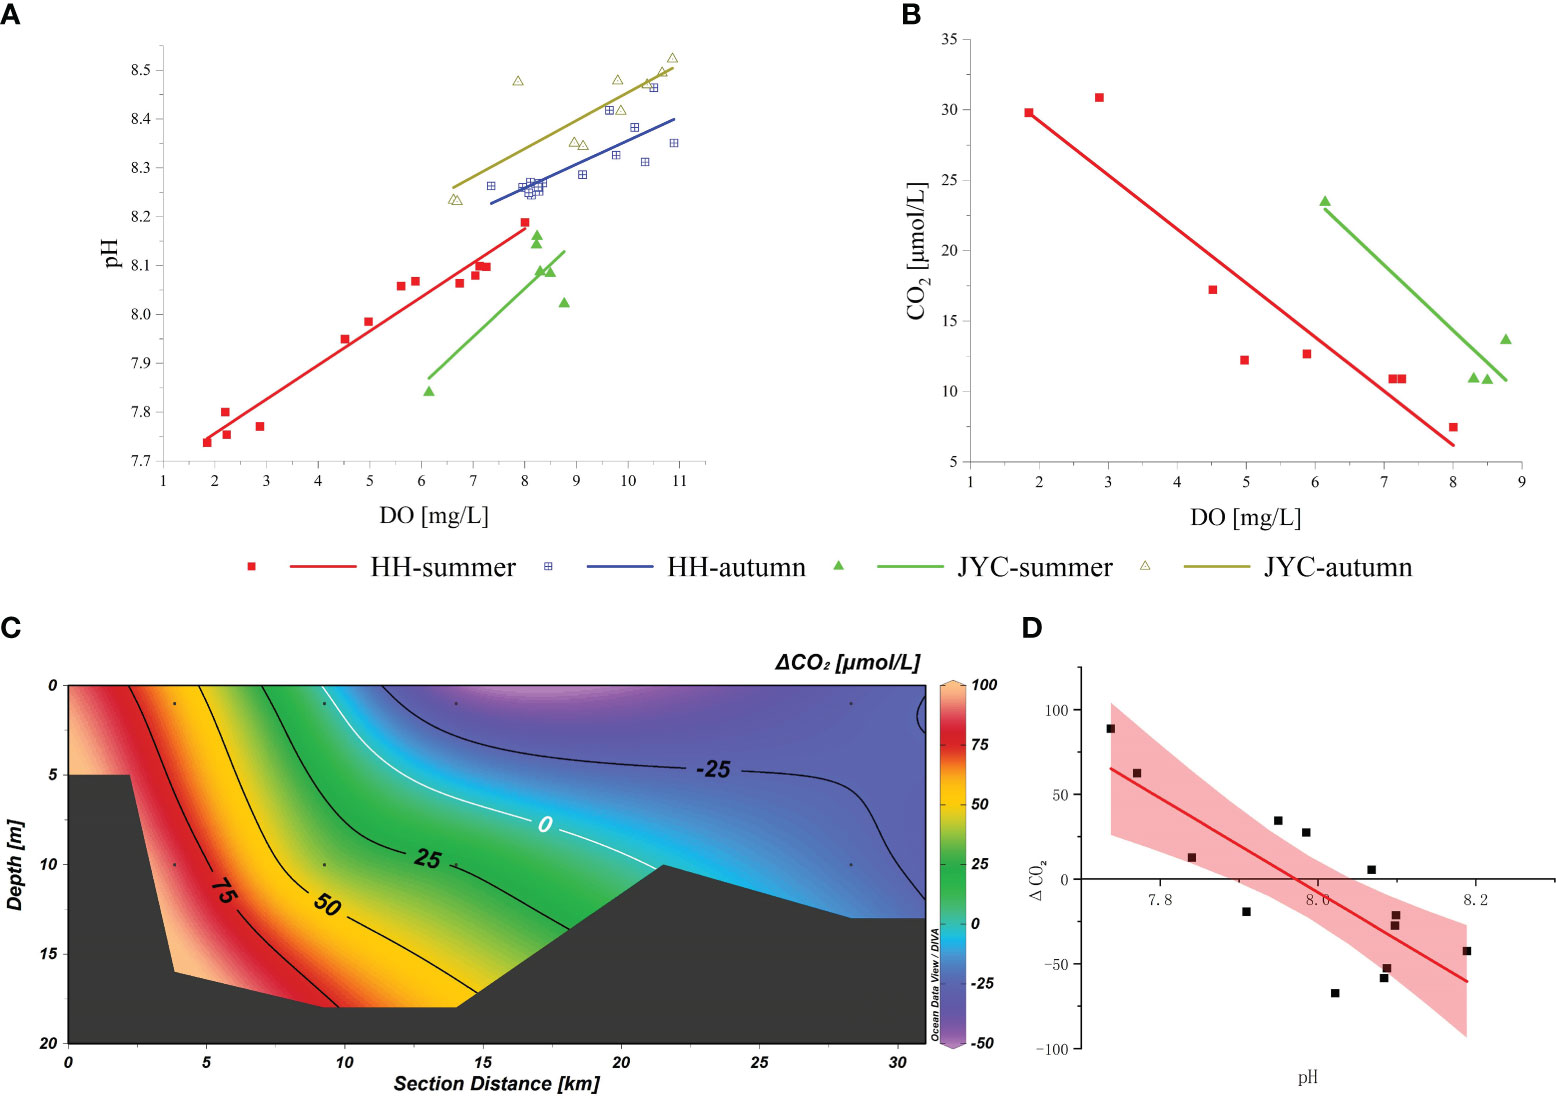
Figure 6 Correlations between DO and pH (A), DO and CO2 (B), ΔCO2 and pH (D) in HH and JYC sections, respectively, and cross-sectional distribution of ΔCO2 (C) in HH section during summer.
Under ideal conditions, the ratio of O2 consumption to CO2 release is expected to be 138:106. The AOU was utilized to compute the theoretical concentration of CO2 release (CO2-T). The current concentration of CO2 in the water (CO2-S) was calculated based on the total alkalinity Alk and pH (Dickson and Millero, 1987), and the difference between the two values resulted in the redundant CO2 concentration (ΔCO2). Comparison of the theoretical CO2 concentration with the concentration of free CO2 in the carbonate equilibrium system calculated by AOU revealed that the CO2 produced by the decomposition of organic matter in the upper reaches of the HH section in summer far exceeded the free CO2 in the carbonate system. The concentration distribution of this portion of redundant CO2 corresponded to the region of low pH (Figure 6C) and showed a significant negative correlation (Figure 6D), suggesting that the decrease in pH was closely linked to the accumulation of carbon dioxide generated by the decomposition process of organic matter.
Conclusion
In the summer of 2020, during the investigation of the Bohai Bay, hypoxia was discovered for the first time in the Haihe estuary. We found that the seasonal hypoxia appeared in summer and disappeared in autumn. A hypoxic zone was observed in the bottom layer between stations HH-2 and HH-4, and the minimum DO concentration (1.85 mg/L) was appeared at the bottom of station HH-2. The occurrence of hypoxia followed the route of “stratification-eutrophication-hypoxia formation”. Temperature, riverbed topography, and freshwater input promoted the formation of stratification, which consumed DO in the bottom water through the decomposition of organic matter. Stratification also hindered the reoxygenation of the bottom water and caused the accumulation of carbon dioxide, resulted in the formation of hypoxic and acidified zones. The limitations of existing data made it difficult to determine the origin of organic matter in the hypoxic zone and the contribution of sediment oxygen consumption to hypoxia formation. Future research will address these limitations. With a better understanding of the mechanism of hypoxia formation, controlling hypoxia in estuaries will become a crucial step in optimizing the ecological environment of marine systems.
Data availability statement
The original contributions presented in the study are included in the article/Supplementary Material. Further inquiries can be directed to the corresponding authors.
Author contributions
GZ: Investigation, data analysis, writing-original draft. YW: Investigation and environmental data. GCZ: Investigation, data curation, writing-review & editing, funding acquisition. JS: Conceptualization, methodology, project administration, resources, supervision, review & editing. All authors contributed to the article and approved the submitted version.
Funding
This research was financially supported by the National Key R&D Program of China (No. 2019YFC1407800), the National Natural Science Foundation of China (Nos. 42106095 and 41876134), and the Changjiang Scholar Program of Chinese Ministry of Education (No. T2014253). Data acquisition and sample collection were supported by the National Key R&D Program of China.
Acknowledgments
We wish to thank the captains and crew of R/V Jinhan 04700 and all scientists and technicians who helped with sample collection and CTD data during the cruise.
Conflict of interest
The authors declare that the research was conducted in the absence of any commercial or financial relationships that could be construed as a potential conflict of interest.
Publisher’s note
All claims expressed in this article are solely those of the authors and do not necessarily represent those of their affiliated organizations, or those of the publisher, the editors and the reviewers. Any product that may be evaluated in this article, or claim that may be made by its manufacturer, is not guaranteed or endorsed by the publisher.
Supplementary material
The Supplementary Material for this article can be found online at: https://www.frontiersin.org/articles/10.3389/fmars.2023.1199340/full#supplementary-material
References
Bianchi T. S., Dimarco S. F., Cowan J. H. Jr., Hetland R. D., Chapman P., Day J. W., et al. (2010). The science of hypoxia in the northern gulf of Mexico: a review. Sci. Total Environ. 408, 1471–1484. doi: 10.1016/j.scitotenv.2009.11.047
Breitburg D., Levin L. A., Oschlies A., Gregoire M., Chavez F. P., Conley D. J., et al. (2018). Declining oxygen in the global ocean and coastal waters. Science 359, eaam7240. doi: 10.1126/science.aam7240
Cai W.-J., Hu X., Huang W.-J., Murrell M. C., Lehrter J. C., Lohrenz S. E., et al. (2011). Acidification of subsurface coastal waters enhanced by eutrophication. Nat. Geosci. 4, 766–770. doi: 10.1038/ngeo1297
Cai W. J., Xu Y. Y., Feely R. A., Wanninkhof R., Jonsson B., Alin S. R., et al. (2020). Controls on surface water carbonate chemistry along north American ocean margins. Nat. Commun. 11, 2691. doi: 10.1038/s41467-020-16530-z
Chen L., Cai X., Cao M., Liu H., Liang Y., Hu L., et al. (2022). Long-term investigation of heavy metal variations in mollusks along the Chinese bohai Sea. Ecotoxicol. Environ. Saf. 236, 113443. doi: 10.1016/j.ecoenv.2022.113443
Chen C. C., Gong G. C., Shiah F. K. (2007). Hypoxia in the East China Sea: one of the largest coastal low-oxygen areas in the world. Mar. Environ. Res. 64, 399–408. doi: 10.1016/j.marenvres.2007.01.007
Cole J. J., Susumu H., Erez J. (1987). Benthic decomposition of organic matter at a deep-water site in the Panama basin. Nat. Geosci. 237, 703–704. doi: 10.1038/327703a0
Conley D. J., Carstensen J., Aigars J., Axe P., Bonsdorff E., Eremina T., et al. (2011). Hypoxia is increasing in the coastal zone of the Baltic Sea. Environ. Sci. Technol. 45, 6777–6783. doi: 10.1021/es201212r
Dagg M. J., Ammerman J. W., Amon R. M. W., Gardner W. S., Green R. E., Lohrenz S. E. (2007). A review of water column processes influencing hypoxia in the northern gulf of Mexico. Estuaries Coasts 30, 735–752. doi: 10.1007/BF02841331
Dhanjai Sinha A., Zhao H., Chen J., Mugo S. M. (2019). "Water Analysis | Determination of Chemical Oxygen Demand," in Encyclopedia of Analytical Science (Third Edition), eds. Worsfold P., Poole C., Townshend A, Miró M. (Oxford: Academic Press), 258–270. doi: 10.1016/B978-0-12-409547-2.14517-2
Dai M., Guo X., Zhai W., Yuan L., Wang B., Wang L., et al. (2006). Oxygen depletion in the upper reach of the pearl river estuary during a winter drought. Mar. Chem. 102, 159–169. doi: 10.1016/j.marchem.2005.09.020
Diaz R. J. (2001). Overview of hypoxia around the world. J. Environ. Qual. 30, 275–281. doi: 10.2134/jeq2001.302275x
Diaz R. J., Rosenberg R. (2008). Spreading dead zones and consequences for marine ecosystems. Science 321, 926–929. doi: 10.1126/science.1156401
Dickson A. G., Millero F. J. (1987). A comparison of the equilibrium constants for the dissociation of carbonic acid in seawater media. Deep Sea Res. Part A Oceanogr. Res. Pap. 34, 1733–1743. doi: 10.1016/0198-0149(87)90021-5
Garcia H. E., Gordon L. I. (1992). Oxygen solubility in seawater: better fitting equations. Limnol. Oceanogr. 37, 1307–1312. doi: 10.4319/lo.1992.37.6.1307
Gran G. (1952). Determination of the equivalence point in potentiometric titrations. Part II. Analyst 77, 661–671. doi: 10.1039/AN9527700661
Hansen H.P., Koroleff F. (1999). "Determination of nutrients," in Methods of Seawater Analysis (3rd Edition), 159–228. doi: 10.1002/9783527613984.ch10
Levin L., Ekau W., Gooday A. J., Jorissen F., Middelburg J. J., Naqvi S. W. A., et al. (2009). Effects of natural and human-induced hypoxia on coastal benthos. Biogeosciences 6, 2063–2098. doi: 10.5194/bg-6-2063-2009
Li B. C. (2016). Study on the hydrological characteristics of the mouth of yongdingxinhe river. Water Sci. Eng. Technol., 34–36. doi: 10.19733/j.cnki.1672-9900.2016.02.014
Liang L. N., He B., Jiang G. B., Chen D. Y., Yao Z. W. (2004). Evaluation of mollusks as biomonitors to investigate heavy metal contaminations along the Chinese bohai Sea. Sci. Total Environ. 324, 105–113. doi: 10.1016/j.scitotenv.2003.10.021
Liu J., Cao L., Dou S. (2019). Trophic transfer, biomagnification and risk assessments of four common heavy metals in the food web of laizhou bay, the bohai Sea. Sci. Total Environ. 670, 508–522. doi: 10.1016/j.scitotenv.2019.03.140
Luo X., Wei H., Fan R., Liu Z., Zhao L., Lu Y. (2018). On influencing factors of hypoxia in waters adjacent to the changjiang estuary. Continent. Shelf Res. 152, 1–13. doi: 10.1016/j.csr.2017.10.004
Mccarthy M. J., Carini S. A., Liu Z., Ostrom N. E., Gardner W. S. (2013). Oxygen consumption in the water column and sediments of the northern gulf of Mexico hypoxic zone. Estuarine Coast. Shelf Sci. 123, 46–53. doi: 10.1016/j.ecss.2013.02.019
Morse J. W., Rowe G. T. (1999). Benthic biogeochemistry beneath the Mississippi river plume. Estuaries 22, 206–214. doi: 10.2307/1352977
Murphy R. R., Kemp W. M., Ball W. P. (2011). Long-term trends in Chesapeake bay seasonal hypoxia, stratification, and nutrient loading. Estuaries Coasts 34, 1293–1309. doi: 10.1007/s12237-011-9413-7
Rabalais N., Cai W.-J., Carstensen J., Conley D., Fry B., Hu X., et al. (2014). Eutrophication-driven deoxygenation in the coastal ocean. Oceanography 27, 172–183. doi: 10.5670/oceanog.2014.21
Rabalais N. N., Díaz R. J., Levin L. A., Turner R. E., Gilbert D., Zhang J. (2010). Dynamics and distribution of natural and human-caused hypoxia. Biogeosciences 7, 585–619. doi: 10.5194/bg-7-585-2010
Rabalais N. N., Turner R. E., Wiseman W. J. (2002). Gulf of Mexico hypoxia, A.K.A. “The dead zone”. Annu. Rev. Ecol. Syst. 33, 235–263. doi: 10.1146/annurev.ecolsys.33.010802.150513
Rowe G. T., Chapman P. (2002). Continental shelf hypoxia: some nagging questions. Gulf Mexico Sci. 20, 153–160. doi: 10.18785/goms.2002.08
Stanley D. W., Nixon S. W. (1992). Stratification and bottom-water hypoxia in the pamlico river estuary. Estuaries 15, 270. doi: 10.2307/1352775
Wang B., Chen J., Jin H., Li H., Huang D., Cai W. J. (2017). Diatom bloom-derived bottom water hypoxia off the changjiang estuary, with and without typhoon influence. Limnol. Oceanogr. 62, 1552–1569. doi: 10.1002/lno.10517
Wei Q., Wang B., Yao Q., Xue L., Sun J., Xin M., et al. (2019). Spatiotemporal variations in the summer hypoxia in the bohai Sea (China) and controlling mechanisms. Mar. pollut. Bull. 138, 125–134. doi: 10.1016/j.marpolbul.2018.11.041
Yan D., Werners S. E., Ludwig F., Huang H. Q. (2015). Hydrological response to climate change: the pearl river, China under different RCP scenarios. J. Hydrol.: Reg. Stud. 4, 228–245. doi: 10.1016/j.ejrh.2015.06.006
Yang D., Yin B., Sun J., Zhang Y. (2013). Numerical study on the origins and the forcing mechanism of the phosphate in upwelling areas off the coast of zhejiang province, China in summer. J. Mar. Syst. 123-124, 1–18. doi: 10.1016/j.jmarsys.2013.04.002
Keywords: hypoxia, stratification, organic-matter degradation, formation mechanisms, the Bohai Bay
Citation: Zhang G, Wen Y, Ding C, Zhang G and Sun J (2023) Hypoxia in the Bohai Bay, China: distributions, causes and mechanisms. Front. Mar. Sci. 10:1199340. doi: 10.3389/fmars.2023.1199340
Received: 03 April 2023; Accepted: 14 June 2023;
Published: 28 June 2023.
Edited by:
Siyuan Ye, Qingdao Institute of Marine Geology (QIMG), ChinaReviewed by:
Tong Hao, Tianjin Normal University, ChinaShaofeng Pei, Qingdao Institute of Marine Geology (QIMG), China
Copyright © 2023 Zhang, Wen, Ding, Zhang and Sun. This is an open-access article distributed under the terms of the Creative Commons Attribution License (CC BY). The use, distribution or reproduction in other forums is permitted, provided the original author(s) and the copyright owner(s) are credited and that the original publication in this journal is cited, in accordance with accepted academic practice. No use, distribution or reproduction is permitted which does not comply with these terms.
*Correspondence: Jun Sun, cGh5dG9wbGFua3RvbkAxNjMuY29t; Guicheng Zhang, Z3VpY2hlbmcuZ29vZEAxNjMuY29t