
95% of researchers rate our articles as excellent or good
Learn more about the work of our research integrity team to safeguard the quality of each article we publish.
Find out more
ORIGINAL RESEARCH article
Front. Mar. Sci. , 28 June 2023
Sec. Marine Molecular Biology and Ecology
Volume 10 - 2023 | https://doi.org/10.3389/fmars.2023.1198036
 Jennifer R. Hall1*
 Sarah J. Lehnert2
 Emmanuel Gonzalez3,4,5
 Jacqueline M. Hanlon2
 Surendra Kumar6
 Corey J. Morris2†
 Matthew L. Rise6†
The snow crab (Chionoecetes opilio) fishery off the east coast of Newfoundland and Labrador, Canada, has been impacted by annual seismic oil and gas surveying in recent decades, and commercial crab harvesters are concerned that it could potentially affect this resource. A laboratory study was performed to investigate the effects of chronic noise exposure on the transcriptomes of snow crab hemocytes and hepatopancreas, which are important in immunity, metabolism and response to environmental stress. Snow crab were held in replicate control or experimental tanks; on alternating days, the experimental tanks were exposed to noise from an underwater speaker which played a recording of a seismic airgun firing every 10 sec in a continuous loop for ~ 22 weeks (chronic noise). RNA sequencing was used to identify candidate noise-responsive molecular biomarkers in both hemocytes and hepatopancreas. The quantified transcripts of individuals (i.e. n=10 from each of the four groups) were compared using DESeq2, identifying over 300 noise-responsive transcripts in each cell/tissue type. Real-time quantitative polymerase chain reaction (qPCR) assays were designed and run for 61 of these transcripts with significant BLASTx hits. One transcript (rgs2) was significantly (p < 0.05) higher expressed in both hemocytes and hepatopancreas in response to noise; five and seven other transcripts were either significant or showed a non-significant trend of differential expression (0.05 < p ≤ 0.1) in hemocytes (e.g. cfb upregulated, sacs and myof downregulated) and hepatopancreas (e.g. gpx3 and atf3 upregulated, sult1c4 downregulated), respectively. To further investigate the performance and utility of these candidate biomarkers in the field, expression levels of 25 selected transcripts were then examined in the hepatopancreas of snow crab that had been subjected to 2D and 3D seismic surveying using both qPCR and multivariate statistical analyses. Overall, few of these biomarkers showed consistent results in field-collected snow crab, highlighting the need to combine lab and field-based studies to fully evaluate the utility of biomarkers. Nonetheless, our study still identified noise-responsive biomarkers in both settings (including stress and immune relevant genes), providing valuable information for understanding the impact of ocean noise on snow crab physiology and health.
Sources of noise and their potential effects on marine animals have been characterized in scientific reviews (e.g. Hirst and Rodhouse, 2000; Hildebrand, 2009; Hawkins et al., 2015; Nowacek et al., 2015). However, the impacts of noise on marine invertebrate species, and mechanisms through which it could manifest, are not well known compared to marine mammals (Carroll et al., 2017). Off the east coast of Newfoundland and Labrador (NL), Canada, seismic oil and gas surveying (both 2D and 3D) overlaps with a lucrative snow crab (Chionoecetes opilio) fishery, and commercial harvesters are concerned about the potential impacts of the resultant noise upon this resource (Payne et al., 2015; Morris et al., 2021). Most seismic surveys use airguns to emit a sharp impulse noise, referred to as a “shot”, to generate geological data informing oil and gas exploration interests (Holliday et al., 1987). Briefly, both 2D and 3D surveys typically utilize 24-32 airguns that operate simultaneously, emitting short pulses approximately every 10 sec in our study area, but ranging from 6 to 20 sec depending on the application (McCauley, 1994). However, the survey design is different for 2D and 3D surveys. For 3D surveys, shots are fired along survey lines that are closely spaced (e.g. <1 km); therefore, stationary animals in the vicinity can experience elevated noise levels over many weeks when the survey is conducted in a relatively small area. In comparison, for 2D surveys, the lines are often longer, and spaced further apart; therefore, stationary animals experience elevated noise levels for a shorter time period. Seismic surveying activity has increased in the NL region over recent decades, and 3D-type seismic surveys have become more common than 2D surveys (https://www.cnlopb.ca/information/geoscience/). This coincides with declines in snow crab abundance (Mullowney et al., 2018), thus raising concerns about the potential effects of long-term exposure to elevated noise levels (i.e. from 3D seismic surveying) on relatively stationary animals such as snow crab.
A multi-faceted approach was previously undertaken by our group in which the effects of impulse noise from field-based 2D and 3D seismic surveying on snow crab catch rates, movement, physiology, and transcriptomics were examined (summarized in Morris et al., 2021 and references therein). Multi-faceted approaches are useful for field-based studies, as previous work has noted the wide range of potential effects as well as difficulties in controlling sources of external variation within a given study (Kight and Swaddle, 2011; Przeslawski et al., 2018; Cote et al., 2020). This research suggested that snow crab catch rates (Morris et al., 2018; Morris et al., 2020) and movement (Cote et al., 2020) were not measurably affected by seismic surveying in the wild; however, as summarized below, questions remain about potential effects on physiology (see Hall et al., 2021). Further, these studies found that uncontrolled sources of natural variation were significantly influential which may limit the ability to resolve potentially subtle effects, highlighting a need for controlled laboratory-based studies to better resolve the effects of chronic noise.
In the previous transcriptomics study, we used RNA sequencing (RNA-seq) and real-time quantitative polymerase chain reaction (qPCR) validation to identify candidate seismic-responsive biomarkers in field-collected seismic exposed and non-exposed snow crab hepatopancreas (Hall et al., 2021). In that study, hepatopancreas RNA samples were collected from a seismic-exposed site at three time points and a non-exposed site in 2016 and then subjected to RNA-seq with qPCR confirmation to identify differentially expressed transcripts (DETs) (Hall et al., 2021). In the following year, twenty of these candidate biomarkers were tested using qPCR in a set of hepatopancreas RNAs from 2D and 3D seismic exposed and non-seismic exposed snow crab collected from the field (Hall et al., 2021). While multivariate statistical analyses of qPCR data separated the 2016 groups, significant separation of groups was not seen with the crab hepatopancreas samples from the field in 2017 (Hall et al., 2021). Nonetheless, the study helped to build a valuable transcriptomics knowledge foundation for studies of snow crab hepatopancreas responses to environmental stressors (Hall et al., 2021), while also further supporting the need for pairing field sampling with controlled laboratory-based work to better understand the effects of seismic exposure in this species.
Here, we complement the previous field-based transcriptomics study by designing a tank-based noise exposure experiment. To emulate the “shot” emitted by the airgun approximately every 10 sec during both 2D and 3D seismic surveying in the field, crab in the experimental tanks were exposed to noise from an underwater speaker which played a recording of a seismic airgun firing every 10 sec in a continuous loop for ~ 22 weeks (chronic noise such as that experienced with 3D surveying). We then used RNA-seq to identify candidate noise-responsive biomarker genes in an immune-relevant cell (hemocytes) and tissue/organ (hepatopancreas) type. Crustacean hemocytes are immune competent cells that respond to environmental stressors such as pollutants (Qyli et al., 2020), and the crustacean hepatopancreas plays roles in several biological processes including digestion/absorption and defense responses to pathogens and environmental stressors (e.g. Vogt, 1994; Li et al., 2013; Sun et al., 2016). Therefore, they are suitable cell/tissue types for the current investigation of the potential impacts of noise (e.g. loud sound in the tank-based study; seismic exposure in the field-based study) on snow crab immune physiological genomics (i.e. transcriptomes). In addition, RNA-seq has been used to study crab responses to environmental stressors such as pathogens, temperature, salinity, and toxicants (e.g. Li et al., 2013; Sun et al., 2016; Chen et al., 2020; Chen et al., 2022; Crandall et al., 2022); however, the impact of seismic surveying noise stress on a crab immune tissue (hepatopancreas) transcriptome has only been studied previously by our group in the field (Hall et al., 2021). The use of a controlled tank-based experiment for the current study was needed to minimize sources of external variation (e.g., temperature, salinity, capture methods) that may influence the stress response, allowing for a more direct measure of noise exposure effects on gene expression (Hall et al., 2021). Here, following identification of novel biomarkers in the controlled tank-based experiment, we then used field-collected snow crab hepatopancreas samples from a variety of seismic (2D, 3D, none) exposure locations and time points to determine the utility of these biomarkers for assessing seismic effects on basal immune physiology.
Snow crab were captured by pot fishing during Fisheries and Oceans Canada research vessel surveys conducted in NL, Canada (47 4.2 N, 53 39.5 W) in December, 2016. Pots were designed to select for large, terminally-molted, commercial size (> 95 mm carapace width) male snow crab. They were transported in refrigerated (1°C) seawater to a laboratory facility at the Northwest Atlantic Fisheries Centre (Fisheries and Oceans Canada), St. John’s, NL, Canada. In the laboratory, individual snow crab were tagged (plastic tubing tied around the carapace widthwise) with a unique tag number, weighed, and divided amongst four (i.e. two control and two experimental) identical 1150 l tanks, at stocking densities of 6-11 kg m-3. To ensure a consistent environment for the duration of the experiment, water flow was kept at a constant rate, water temperature was between 1-3°C, and the tank room was maintained at the natural photoperiod for this latitude. Tank functions were inspected daily. They were fed a diet of capelin once per week and allowed to feed for 24 h, after which all remaining food was removed from the tanks. Crab weight, mortality and feeding were monitored throughout the experiment.
Starting on January 13, 2017, on alternating days, the experimental tanks were exposed to impulse sound every 10 sec from a seismic soundtrack played through an underwater speaker (Lubell Labs, Model LL9161) for approximately 22 weeks. In the wild, snow crab in this study experience median daily noise levels (24 h sound exposure level) of 150 dB re 1 µPa2 ·s, with considerable variability largely due to wind storm events; during offshore seismic surveying activity, the noise level exceeded 190 dB re 1 µPa2 ·s (Morris et al., 2018). In this laboratory study, the daily noise level measured in the control tanks was 136 dB re 1 µPa2 ·s, while the noise level in the exposure tanks was greater than 200 dB re 1 µPa2 ·s. Therefore, in our experiment, noise exposure conditions in the control tanks were lower and more consistent than open ocean conditions, with those in the experimental tanks consisting of very loud noise impulses, even in comparison to offshore soundscapes directly impacted by seismic surveying. We recognize that the acoustic properties of tanks and the noise generated by speakers are not fully representative of real-world conditions; however, captive animals in this experiment were exposed to very different levels of noise, under controlled conditions, allowing us to directly measure the effects of noise on gene expression.
For both the control and experimental tanks, feeding was stopped 8 days prior to sampling. Snow crab were dissected and sampled on June 14 and 15, 2017 alternating between tanks [i.e. 1 crab from control tank 1 (n=11), then 1 crab from control tank 2 (n=13), then 1 crab from experimental tank 1 (n=17), then 1 crab from experimental tank 2 (n=14)]. Sampling alternated between tanks to control for any unknown effects of time of day on gene expression. Body mass and carapace width were measured, and claw meat density was calculated. For molecular analyses, hemolymph was collected from the right leg of the first walking pair (from the front) by cutting 1 cm above the first joint using clean kitchen shears that had been treated with RNaseZAP (Sigma-Aldrich, Oakville, ON, Canada) and then pouring it into an RNase-free 15 ml tube. Approximately 2 x 1.5 ml of hemolymph were then transferred by pipette into 2 x 1.5 ml RNase-free tubes and centrifuged at 500 x g for 5 min at 4°C. The plasma was completely removed by pipette and the cell pellets (hemocytes) were immediately flash-frozen on dry ice. The carapace was then removed to expose the organs. Approximately 100 mg of hepatopancreas were removed, placed in a 1.5 ml RNase-free tube and immediately flash-frozen on dry ice. Samples were stored at -80°C until preparation of RNA. Additional tissues were collected for assessment of indicators of animal health (see Morris et al., 2021). Multiple people were involved in sampling using a team-based assembly line approach to minimize sampling time and ensure that crabs were fully processed within 5-10 min after removal from the tank.
RNA extraction was performed using TRIzol Reagent (Invitrogen/Thermo Fisher Scientific, Burlington, ON, Canada). For hemocytes, 400 µl of TRIzol were added to each of the duplicate cell pellets, and homogenized using a motorized Kontes RNase-Free Pellet Pestle Grinder (Kimble Chase, Vineland, NJ, United States). The homogenates were then combined, mixed by pipetting, frozen on dry ice and stored at -80°C. Hepatopancreas samples were homogenized in 400 µl of TRIzol as for hemocytes. An additional 400 µl of TRIzol were added, mixed by pipetting, and the homogenates frozen on dry ice and stored at -80°C. Frozen homogenates were further processed by thawing on wet ice and then passing through a QIAshredder (QIAGEN, Mississauga, ON, Canada) spin column following the manufacturer’s instructions. Two-hundred microliters of TRIzol were added to each sample to make a total homogenate volume of approximately 1 ml. The TRIzol total RNA extractions were then completed following the manufacturer’s instructions.
The hepatopancreas samples had low A260/230 ratios following the TRIzol extraction, which interferes with column purification. Therefore, a subsample (120 µg) of each TRIzol-extracted RNA sample was re-extracted using the phenol-chloroform phase separation method as described in Hall et al. (2021).
The TRIzol-extracted hemocytes and the acid phenol:chloroform:isoamyl alcohol extracted hepatopancreas RNA samples (45 µg) were then treated with 6.8 Kunitz units of DNaseI (RNase-Free DNase Set, QIAGEN) with the manufacturer’s buffer (1X final concentration) at room temperature for 10 min to degrade any residual genomic DNA. DNase-treated RNA samples were column-purified using the RNeasy Mini Kit (QIAGEN) following the manufacturer’s instructions. RNA integrity was verified by 1% agarose gel electrophoresis, and RNA purity was assessed by A260/280 and A260/230 NanoDrop UV spectrophotometry for both the pre-cleaned and the column-purified RNA samples.
Five crabs from each of the 2 control and the 2 experimental tanks (n=20) were selected for molecular analyses based on comparable size, health (e.g. no missing limbs or black spots on the hepatopancreas) and RNA quality (i.e. high integrity and with A260/280 and A260/230 ratios > 2). Hemocytes and hepatopancreas samples from each of these crabs were then subjected to RNA-seq and qPCR analyses.
The experimental design and sampling methods for the field 2017 study, in which snow crab were exposed to 2D or 3D seismic surveying, were reported previously (Morris et al., 2018; Morris et al., 2020; Hall et al., 2021). Briefly, snow crab (n=30 per group) were collected in eight groups from three sites. Lilly Canyon (LC) was the non-seismic control site, Carson Canyon (CC) was the 2D seismic exposure site, and North of CC (NCC) was the 3D seismic exposure site. At the CC site, crabs were collected before 2D seismic exposure (BSC), and 1 day (1DASC), 2 days (2DASC) and 6 weeks (6WASC) after 2D seismic exposure. At the LC non-seismic site, crabs were collected in a time-matched fashion with the BSC and 6WASC samples, and denoted as BSL and 6WASL, respectively. At the NCC site, crabs were collected during (DSNC) and 4 weeks after (4WASNC) 3D seismic exposure [see Morris et al. (2020) for details of the 3D seismic survey exposure].
RNA was extracted from the first 16 snow crab hepatopancreas samples only (i.e. not hemocytes) from each of the eight groups using TRIzol Reagent (Hall et al., 2021). Ten samples from each of the eight groups (n=80) were selected (based on RNA integrity and with A260/280 and A260/230 ratios > 2) for qPCR analyses only.
Prior to library construction, total RNA integrity was further validated using the 2100 Bioanalyzer system (Agilent, Santa Clara, CA, United States). Libraries were generated from 250 ng of total RNA. Library construction and sequencing services were performed at Génome Québec laboratories, Montréal, QC, Canada. As described in Hall et al. (2021), mRNA enrichment was performed using the NEBNext Poly(A) Magnetic Isolation Module (New England BioLabs, Whitby, ON, Canada) following the manufacturer’s instructions. cDNA was synthesized using the NEBNext RNA First Strand Synthesis Module and NEBNext Ultra Directional RNA Second Strand Synthesis Module (New England BioLabs) following the manufacturer’s instructions. Library preparation was then completed using the NEBNext Ultra II DNA Library Prep Kit for Illumina (New England BioLabs) following the manufacturer’s instructions. Adapters and PCR primers were purchased from New England BioLabs. Libraries were quantified using the Quant-iT™ PicoGreen® dsDNA Assay Kit (Life Technologies/Thermo Fisher Scientific) and the Kapa Illumina GA with Revised Primers-SYBR Fast Universal Kit (Kapa Biosystems/Roche Diagnostics, Laval, QC, Canada) following the manufacturer’s instructions. Average fragment size was determined using the LabChip GX (PerkinElmer, Woodbridge, ON, Canada).
The libraries were normalized and pooled, denatured in 0.05 N NaOH, and then neutralized using HT1 buffer (Illumina, San Diego, CA, United States). ExAMP (Illumina) was added to the mix following the manufacturer’s instructions. The pool was loaded at 200 pM on a cBot (Illumina) and the flowcell was run on a HiSeq 4000 (Illumina) for 2 x 100 cycles (paired-end mode). A phiX library was used as a control and mixed with libraries at the 1% level. The Illumina control software was HCS HD 3.4.0.38 and the real-time analysis program was RTA v. 2.7.7. The program bcl2fastq2 v2.18 was used to demultiplex the samples and generate fastq reads.
Individual assemblies were generated for each cell/tissue type (i.e. hemocytes and hepatopancreas; referred to as RNA-seq analysis 1). A hemocytes-hepatopancreas co-assembly was also built (referred to as RNA-seq analysis 2) which allows for cross-cell/tissue type comparisons.
Reads were trimmed from the 3’ end to a minimum Phred score of 30. Illumina sequencing adapters were removed from the reads, and reads < 50 bp were excluded. Trimming and clipping were performed using Trimmomatic (Bolger et al., 2014). Reads were assembled into a de novo transcriptome using Trinity software (v2.4.0) with default parameters (Haas et al., 2013). Assembled contigs shorter than 200 bp were discarded. Kallisto (v. 0.43.1) (Bray et al., 2016) was used to quantify contig abundance [raw and transcripts per million (tpm) normalised counts]. The de novo assembled contigs were annotated using the BLAST (Altschul et al., 1997) program (BLASTx with default parameters was used to search protein databases using a translated nucleotide query) on three major protein databases (nr NCBI non-redundant protein database, SwissProt and UniProt UniRef90 Reference Clusters). An Expect value (i.e. E-value) cutoff of < 10−6 was used. A Trinotate annotation pipeline (Bryant et al., 2017) was used for functional annotation including homology search to known sequence data (BLAST+/SwissProt/Uniref90), protein domain identification (HMMER/PFAM), protein signal peptide and transmembrane domain prediction (ggnog/tmHMM), and comparison to currently curated annotation databases (EMBL UniProt ggnog/GO Pathways databases).
Differential transcript expression between experimental conditions was estimated using DESeq2 (Love et al., 2014). Within each pairwise comparison, only transcripts with a Benjamini-Hochberg adjusted p-value less than or equal to 0.05 were considered significantly differentially expressed.
For the chronic noise laboratory study, qPCR assays were developed for 61 genes that were identified as differentially expressed in any one of the three pairwise comparisons in the RNA-seq analysis: 1) hemocytes of crab exposed to chronic noise (HCE) compared with hemocytes of control crab (HCC), 2) hepatopancreas of crab exposed to chronic noise (HPE) compared with hepatopancreas of control crab (HPC) and 3) HPC compared with HCC. The pairwise comparison and the assembly (i.e. individual cell/tissue type or co-assembly) in which the transcript was identified as differentially expressed are provided in both Supplemental Table 1 and Supplemental File 1. These genes were selected based on functional annotations related to biological processes of interest (e.g. immunity, defense, regulation of gene expression, metabolism and stress-response).
In a preliminary qPCR analysis, expression levels of these transcripts of interest (TOIs) were measured in cDNA pools representing the four groups (HCC, HCE, HPC, HPE) in this study. In a second qPCR analysis, levels of TOIs that appeared to be differentially expressed (>1.5-fold) in response to chronic noise exposure in either cell/tissue type in the pooled sample screen, and/or with functional annotations related to the aforementioned biological processes of interest were then measured in individual samples. Expression levels of 30 TOIs were assessed in the HPC and HPE samples (n=10 per group); expression levels of 20 of these TOIs were assessed in the HCC and HCE samples (n=10 per group) due to low/no expression of the other 10 TOIs in hemocytes.
For the field study conducted in 2017 (see Hall et al., 2021), a preliminary qPCR analysis was performed in which levels of the aforementioned 61 transcripts were measured in cDNA pools from hepatopancreas representing the eight groups (i.e. pools) in this study. This analysis was performed to help select the transcripts to be assessed in individual samples. In a second qPCR analysis, expression levels of 25 transcripts (19 of which were assessed in individual hepatopancreas samples from both the chronic noise laboratory and the field 2017 studies) were measured in 80 individual samples (n=10 per each of the eight groups). Eight of these transcripts were selected as they were qPCR confirmed as being significantly differentially expressed or showed a non-significant trend (0.05 < p ≤ 0.1) in the HPE group compared with the HPC group. The application of these candidate noise-responsive biomarkers to the field 2017 samples would determine if their expression levels are reproducible going from the laboratory to the field (i.e. if they are consistent noise-responsive molecular biomarkers). The additional 11 transcripts common to both studies were selected as they have functional annotations associated with the aforementioned biological processes of interest, and thus confirming their response to noise in both the laboratory and to both 2D and 3D seismic noise was important. The final 6 transcripts (totalling to 25) were selected as they appeared to be differentially expressed (at least 1.5-fold range among the 8 groups) in response to seismic noise in the pooled sample screen.
First-strand cDNA templates for qPCR were synthesized for each individual sample (n=40, chronic noise laboratory study; n=80, field 2017 study) in 20 μl reactions from 1 µg of DNaseI-treated, column-purified total RNA using random primers (250 ng; Invitrogen/Thermo Fisher Scientific), dNTPs (0.5 mM final concentration; Invitrogen/Thermo Fisher Scientific) and M-MLV reverse transcriptase (200 U; Invitrogen/Thermo Fisher Scientific) with the manufacturer’s first-strand buffer (1X final concentration) and DTT (10 mM final concentration) at 37°C for 50 min. In all cases where pooled samples were analyzed, a subsample of each individual cDNA template (n=10) from a given group (n=4, chronic noise laboratory study; n=8, field 2017 study) was included in that pool, with each individual contributing equally.
All PCR amplifications [i.e. for primer quality control (QC) testing, endogenous control (normalizer) testing and experimental qPCR analyses] were performed in 13 μl reactions using 1X Power SYBR Green PCR Master Mix (Applied Biosystems/Thermo Fisher Scientific), 50 nM of both the forward and reverse primers, and the indicated cDNA quantity (see below). For all primer pairs in this study, an annealing temperature of 60°C was used. Amplifications were performed using the ViiA 7 Real Time PCR system (384-well format) (Applied Biosystems/Thermo Fisher Scientific). The real-time analysis program consisted of 1 cycle of 50°C for 2 min, 1 cycle of 95°C for 10 min and 40 cycles of 95°C for 15 sec and 60°C for 1 min (i.e. primer annealing and extension were combined into one step), with fluorescence detection at the end of each 60°C step, and was followed by dissociation curve analysis.
To confirm the identities of all transcripts subjected to qPCR analyses and to identify the coding sequences (CDS), a BLASTx 2.8.0+ search of the non-redundant (nr) protein sequences database using a translated nucleotide query was performed between March and July, 2018 (Supplemental File 1). All primers are located in the CDS and in an area which overlapped with that of the best BLASTx-identified sequence. The amplicon size range was 87-150 bp. All primers were designed with a melting temperature (Tm) of 60°C, mostly using Primer3 (Koressaar and Remm, 2007; Untergasser et al., 2012); however, in the case of gene paralogues/isoforms [e.g. spastic ataxia of Charlevoix-Saguenay (sacsin) (sacs), toll-like receptor (tlr)] they were hand-designed in paralogue/isoform-specific areas (i.e. in an area with ≥ 3 bp difference between them) to ensure specificity. Each primer pair was quality control (QC)-tested to ensure that a single product was amplified (dissociation curve analysis) and that there was no primer-dimer present in the no-template control. Amplicons were electrophoretically separated on 2% agarose gels and compared with a 1 kb plus ladder (Invitrogen/Thermo Fisher Scientific) to verify that the correct size fragment was being amplified. Finally, amplification efficiencies (Pfaffl, 2001) were calculated for cDNA pools representing the two groups in which the TOI had been identified as differentially expressed in RNA-seq studies; however, with the exception of period circadian regulator isoform 1 (per1), the TOIs identified in HCE compared with HCC analysis 2 were QC tested in HPE and HPC cDNA pools due to low/no expression levels in hemocytes. Standard curves were generated using a 5-point 1:3 dilution series starting with cDNA representing 10 ng of input total RNA. The reported efficiencies (Supplemental Table 1) are an average of the two values with the exception of cytochrome P450 CYP330A1 (cyp330a1), gamma-interferon induced thiol reductase 1 (gilt1), gamma-interferon induced thiol reductase 3 (gilt3), leucine-rich repeat-containing protein 24 (lrrc24), myoferlin (myof) and per1 (HPC only), and macrophage mannose receptor 1 (mrc1) and clotting factor B (cfb) (HCC only) due to low/no expression levels in the other group. These same efficiencies were used in the 2017 field study. The sequences, amplicon sizes and efficiencies for all primer pairs used in the qPCR analyses are presented in Supplemental Table 1.
Expression levels of the TOIs analyzed herein were normalized to expression levels of two endogenous control transcripts, namely 60S ribosomal protein L32 (alias ribosomal protein 49) (rpl32) and elongation factor 1-alpha (ef1a). These transcripts had been previously shown to be stably expressed in the hepatopancreas of field-collected crab that had been subjected to seismic surveying in 2016 and in 2017 (also analyzed in the current study) using geNorm (Vandesompele et al., 2002) analyses (Hall et al., 2021). In the chronic noise laboratory study, they were also stably expressed in hepatopancreas samples with average fluorescence threshold cycle (CT) values between control and chronic noise exposed samples that were nearly identical, and in hemocyte samples with average CT values between control and chronic noise exposed samples < 0.2 cycle different. However, average CT values between hepatopancreas and hemocytes samples were ~0.7 cycle different (data not shown). Therefore, expression levels of the TOIs were compared within a given cell/tissue type only (i.e. HCE compared with HCC only; HPE compared with HPC only).
In all four experimental qPCR analyses, cDNA representing 4 ng of input RNA was used as template in the PCRs. On each plate, for every sample, the TOIs and endogenous controls were tested in triplicate and a no-template control was included. In the two individual sample qPCR analyses, as expression levels of a given TOI were measured across multiple plates, a plate linker sample (i.e. a sample that was run on all plates in a given study) was also included to ensure there was no plate-to-plate variability. The relative quantity (RQ) of each transcript was determined using the ViiA 7 Software Relative Quantification Study Application (Version 1.2.3) (Applied Biosystems/Life Technologies), with normalization to both rpl32 and ef1a transcript levels, and with amplification efficiencies incorporated. For each TOI, for the given cell/tissue type, the sample with the lowest normalized expression (mRNA) level was set as the calibrator sample (i.e. assigned an RQ value = 1.0).
For the chronic noise laboratory study, transcript expression data were analyzed with non-parametric statistics as there were some cases where values did not exhibit homogeneity of variance (Levene’s Test for Equality of Variances). The Mann-Whitney test was used to assess if there were any significant differences in expression levels of a given TOI in response to chronic noise exposure within a given cell/tissue type. In all cases, p < 0.05 was considered to be statistically significant. All data are expressed as mean ± standard error (S.E.).
For the field study conducted in 2017, transcript expression data were log10 transformed and one-way ANOVA followed by Tukey’s B post-hoc test were used to assess expression levels of a given TOI across the eight groups. In all cases, p < 0.05 was considered to be statistically significant. All data are expressed as mean ± S.E.
To test the utility of selected transcripts to act as biomarkers of seismic noise in the field, we also examined transcript expression in multivariate space using principal component analyses (PCAs). Transcript expression data from field collected samples in 2017 were scaled and centered using the scale function in R prior to analyses. PCAs were performed using prcomp function in R and plotted using the ggbiplot R package (Vu, 2011). Individual PCA scores on PC axes 1 and 2 were compared among sample groups using one-way ANOVA or t-test (depending on comparison) in R, and for any significant comparisons using ANOVA, Tukey’s post-hoc test was used to test pairwise differences between groups using the TukeyHSD function in R. The contributions of different transcripts (loadings) on PC1 and PC2 were examined and the top 5 transcripts that loaded the highest on each PC axis were identified. A PCA was performed on all field samples from 2017 using 25 transcripts for which expression was quantified in the hepatopancreas tissues. Correlations in transcript expression patterns among all transcripts were examined using cor.test function and plotted using corrplot package in R. The same methods for the PCA were applied to subsets of these data, where we ran a separate PCA for: 1) only samples from Carson Canyon, 2) only samples exposed to 3D seismic noise north of Carson Canyon, and 3) only samples exposed to no seismic noise from two geographically separate locations. Transcripts loading highly on PC 1 and PC 2 in each of the four PCAs were compared using a Venn diagram in the R package VennDiagram.
Daily observations to inspect tank functions did not identify any differences between them throughout the duration of the experiment. In terms of animal health, there were no distinguishable differences between crab in the control and experimental tanks (i.e. crab remained healthy, mortality was low, and there were no obvious behavioral differences). These observations were supported by no statistically significant differences between crab in the control and experimental tanks in indicators of health including mortality, food consumption, carapace width and claw meat density (see Table 1, Figure 13 in Morris et al., 2021); body mass data could not be accurately assessed as some individuals were missing limbs and claws. We note that loss of limb or claw was not due to experimental conditions, but likely occurred prior to capture and is not uncommon in the species. In addition, noise exposure did not significantly impact the sensory-hair field inside the crab statocyst (i.e. “hearing” structure) (see Table 1, Figure 13 in Morris et al., 2021). Finally, there were no significant differences in selected biochemical parameters (e.g. EROD, GST, phenoloxidase, total antioxidant, protein carbonyl and protein) (see Table 1, Figure 14 in Morris et al., 2021).
RNA-seq libraries were generated for hemocytes samples (10 each of HCC and HCE) and for hepatopancreas samples (10 each of HPC and HPE) from the same 20 individual snow crab (see Supplemental File 2; Sequencing tab). The samples have been deposited in the NCBI BioSample database under accession numbers SAMN10833272-SAMN10833281 (HCC), SAMN10833282- SAMN10833291 (HCE), SAMN10833292-SAMN10833301 (HPC) and SAMN10833302-SAMN10833311 (HPE). All libraries have been deposited in the NCBI Sequence Read Archive (SRA) under accession number PRJNA517457. Individual assemblies for hemocytes and hepatopancreas sample reads produced 431,293 and 422,579 putative transcripts, and 260,702 and 249,325 putative genes, respectively. A hemocytes-hepatopancreas co-assembly produced a total of 440,481 putative transcripts and 263,826 putative genes.
The DET lists, including log2 fold-change values, transcripts per million (tpm) counts, BLAST results and functional annotations for the following five comparisons are provided in Supplemental File 3. For the individual cell/tissue type assemblies (i.e. RNA-seq analysis 1), a comparison of the transcriptomes for HCE samples with HCC samples, and for HPE samples with HPC samples using DESeq2 identified 34 and 45 DETs, respectively. The identity of only 11 and 17 of these DETs, respectively, could be determined using BLAST. Nucleotide sequences (in FASTA format) for the DETs are provided Supplemental File 4 and Supplemental File 5, respectively. For the hemocytes-hepatopancreas co-assembly (i.e. RNA-seq analysis 2), each of the aforementioned pairwise comparisons identified over 300 DETs; however, less than 100 were of known identity (i.e. associated gene or protein name due to significant BLAST hit). In addition, a comparison of the transcriptomes for HPC samples with HCC samples identified over 100,000 DETs, including many with immune-relevant functions. Nucleotide sequences for the DETs from the three pairwise comparisons from RNA-seq analysis 2 are provided in Supplemental File 6. Summary information for the co-assembly is provided in Supplemental File 2.
A subset (n=40) of candidate noise-responsive snow crab transcripts with BLASTx hits (and potential functional annotation) were selected for qPCR analyses. Of these, 9 and 13 were identified in the HCE compared with HCC RNA-seq analyses 1 and 2, respectively; 11 and 7 were identified in the HPE compared with HPC RNA-seq analyses 1 and 2, respectively. In addition, 21 snow crab transcripts primarily with functional annotations related to the immune response (HPC compared with HCC RNA-seq analysis 2) were selected for qPCR analyses (n=61 total) (Supplemental Table 1, Supplemental File 3). A summary of the results of the BLASTx (performed for primer design), RNA-seq and qPCR analyses for these transcripts is provided in Supplemental File 1.
Expression levels of these 61 transcripts were initially measured in a pooled HCC sample and in a pooled HCE sample (Supplemental Figure 1), and in a pooled HPC sample and in a pooled HPE sample (Supplemental Figure 2). Transcripts are grouped by the specific pairwise comparison in which they were identified as differentially expressed in the RNA-seq analyses and are sorted by Gene ID number (see Supplemental File 1). Of the 9 transcripts selected for qPCR from the HCE and HCC comparison (RNA-seq analysis 1), fold-change values for 7/9 in the pooled hemocytes sample qPCR analysis [Supplemental Figures 1A (A–I)] agreed with the direction of change in the RNA-seq analysis. Of the 13 transcripts selected for qPCR from the HCE and HCC comparison (RNA-seq analysis 2), only per1 was expressed at levels that could be detected in the pooled hemocytes sample qPCR analysis [Supplemental Figure 1A (J)]; fold-change values for per1 did agree with the RNA-seq direction of change. Of the 11 and 7 transcripts selected for qPCR from the HPE and HPC comparison (RNA-seq analyses 1 and 2), fold-change values for 8/11 and 7/7 in the pooled hepatopancreas sample qPCR analysis (Supplemental Figures 2C, D) agreed with the RNA-seq direction of change, respectively (see Supplemental File 1 for a summary of the RNA-seq and qPCR results).
Expression levels of transcripts that appeared to be differentially expressed in response to noise in the pooled sample qPCR analyses (see above), and/or with functional annotations related to immunity, regulation of gene expression, metabolism and stress-response were then measured in individual samples from the HCC and the HCE groups (n=20) (Figure 1). Levels of these 20 transcripts and an additional 10 transcripts that were not measured in hemocytes (due to low/no expression levels) were measured in individual samples from the HPC and HPE groups (Figure 2). GO annotations for the putative human orthologue [or for crab spp. for cfb, cuticle protein CBM (cbm) and hemocyanin C chain (hcyc)] of these transcripts were collected from QuickGO (Binns et al., 2009) (Supplemental Table 2).

Figure 1 qPCR analysis of selected RNA-seq identified transcripts in individual crab hemocytes samples from the chronic noise laboratory study. Expression levels of RNA-seq identified transcripts that appeared to be differentially expressed in one or both of the intra-tissue pooled comparisons (Supplemental Figures 1, 2) and/or with functional annotations related to immunity, regulation of gene expression, metabolism and stress-response were measured in individual samples from the hemocytes control (HCC) group and from the hemocytes chronic noise-exposed (HCE) group. Transcript levels are presented as mean ± SE relative quantity (RQ) values (i.e. values for the transcript of interest were normalized to both rpl32 and ef1a transcript levels and were calibrated to the individual with the lowest normalized expression level of that given transcript). Asterisks denote significant differences in transcript levels between the HCE and the HCC groups. In all cases, n=10 and p < 0.05 was considered to be statistically significant. Gene names: (A) regulator of G-protein signaling 2;(B) clotting factor B; (C, D) sacsin; (E) myoferlin; (F) period circadian regulator isoform 1; (G) activating transcription factor 3; (H) interferon regulatory factor 2-binding protein; (I) signal transducer and activator of transcription; (J) E3 ubiquitin-protein ligase TRIM38; (K) toll-interacting protein; (L, M) toll-like receptor; (N) interleukin 16; (O) cathepsin A; (P) gamma-interferon induced thiol reductase GILT1; (Q) pyruvate dehydrogenase kinase, mitochondrial; (R) ATP synthase F1 subunit beta; (S) histone-lysine N-methyltransferase 2D; (T) radical S-adenosyl methionine domain-containing protein 1, mitochondrial.

Figure 2 qPCR analysis of selected RNA-seq identified transcripts in individual crab hepatopancreas samples from the chronic noise laboratory study. Expression levels of RNA-seq identified transcripts that appeared to be differentially expressed in one or both of the intra-tissue pooled comparisons (Supplemental Figures 1, 2) and/or with functional annotations related to immunity, regulation of gene expression, metabolism and stress-response were measured in individual samples from the hepatopancreas control (HPC) group and from the hepatopancreas chronic noise-exposed (HPE) group. Transcript levels are presented as mean ± SE relative quantity (RQ) values (i.e. values for the transcript of interest were normalized to both rpl32 and ef1a transcript levels and were calibrated to the individual with the lowest normalized expression level of that given transcript). Asterisks denote significant differences in transcript levels between the HPE and the HPC groups. In all cases, n=10 and p < 0.05 was considered to be statistically significant. Gene names: (A) regulator of G-protein signaling 2; (B) ATP synthase F1 subunit beta; (C) glutathione peroxidase 3; (D) activating transcription factor 3; (E) cathepsin A; (F) tetraspanin-like protein CD9; (G) cuticle protein CBM; (H) sulfotransferase 1C4; (I) interferon regulatory factor 2-binding protein; (J) interferon regulatory factor; (K) signal transducer and activator of transcription; (L) E3 ubiquitin-protein ligase TRIM38; (M) toll-interacting protein; (N, O) toll-like receptor; (P) interleukin 16; (Q) cathepsin D; (R) cathepsin L; (S) gamma-interferon induced thiol reductase GILT1; (T) gamma-interferon induced thiol reductase GILT3; (U, V) sacsin; (W) clotting factor B; (X) selenium-dependent glutathione peroxidase 5; (Y) hemocyanin C chain; (Z) pyruvate dehydrogenase kinase, mitochondrial; (AA) histone-lysine N-methyltransferase 2D; (AB) radical S-adenosyl methionine domain-containing protein 1, mitochondrial; (AC) myoferlin; (AD) period circadian regulator isoform 1.
In the HCE group compared with the HCC group, six transcripts were either significantly differentially expressed or showed a non-significant trend (0.05 < p < 0.10) (Figures 1A–F). Expression levels of two transcripts were induced by chronic noise; regulator of G-protein signaling 2 (rgs2) was 2-fold significantly higher and cfb was 1.5-fold higher (p=0.052) in the HCE group. Expression levels of four transcripts were suppressed by chronic noise; one sacs paralogue (DN162290_c0_g1_i1) was 1.3-fold significantly lower and a second paralogue (DN143706_c0_g1_i1) was 1.3-fold lower (p=0.063) in the HCE group. Myof (18-fold) and per1 (360-fold) also showed a non-significant trend (p=0.052) towards lower expression; however, expression levels of both transcripts were highly variable. There were no significant differences in expression levels of the other transcripts (Figures 1G–T).
In the HPE group compared with the HPC group, eight transcripts were either significantly differentially expressed or showed a non-significant trend (0.05 < p ≤ 0.1) (Figures 2A–H). Two transcripts, rgs2 (1.9-fold) and ATP synthase F1 subunit beta (atp5f1b; 1.8-fold) were significantly higher expressed in the HPE group. Five transcripts, glutathione peroxidase 3 (gpx3; 2.5-fold), activating transcription factor 3 (atf3; 1.8-fold), cathepsin A (ctsa; 1.5-fold), tetraspanin-like protein CD9 (cd9; 1.5-fold), and cbm (1.4-fold) showed a non-significant trend towards higher expression in the HPE group. Sulfotransferase 1C4 (sult1c4) was 29-fold significantly lower expressed in the HPE group. There were no significant differences in expression levels of the other transcripts (Figures 2I-AD).
To provide insight into how the 61 transcripts from the chronic noise laboratory study may respond to 2D and 3D seismic surveying in the field, their expression levels were initially measured in hepatopancreas cDNA pools representing the eight groups (i.e. BSC, 1DASC, 2DASC, 6WASC, BSL, 6WASL, DSNC and 4WASNC) from the field study conducted in 2017. These data are presented in the same order as Supplemental Figure 2 (Supplemental Figure 3).
In a second qPCR analysis, levels of a subset (n=25) of these transcripts were assessed in individual samples from the 8 groups in the 2017 study (Figure 3). Of the 7 transcripts that were either significantly higher expressed or showed a non-significant trend (0.05 < p ≤ 0.1) towards higher expression in the HPE group compared with the HPC group (Figures 2A–G), only gpx3 was significantly higher expressed with seismic surveying in the field 2017 study (i.e. trending higher in the 2DASC group and significantly higher in the DSNC group) (Figure 3C). Levels of two (rgs2 and atf3) of these transcripts showed the opposite effect with rgs2 levels significantly lower in the 1DASC, 6WASC and 4WASNC groups compared with the BSC group (Figure 3A), and with atf3 showing a non-significant trend (0.05 < p < 0.10) of lower expression in the 1DASC, DSNC and 4WASNC groups (Figure 3D). Sult1c4, which was significantly lower expressed in the HPE group compared with the HPC group (Figure 2H), was not significantly differentially expressed in the field study (Figure 3H).

Figure 3 qPCR analyses of selected transcripts from the chronic noise laboratory study in samples from the field study conducted in 2017. Expression levels of selected transcripts that were significantly (p < 0.05) higher expressed (A, B), showed a non-significant trend (0.05 < p ≤ 0.1) towards higher expression (C–G), that were significantly lower expressed (H) or not significantly differentially expressed (I–S) in the hepatopancreas of crab exposed to chronic noise compared with control crab in the chronic noise laboratory study qPCR analysis (Figure 2), or which appeared to be potentially seismic-responsive based on the pooled sample screen (Supplemental Figure 3) (T–Y) were measured in the hepatopancreas of crab from the field study conducted in 2017. At the Carson Canyon 2D seismic exposure site, crab were collected before (BSC), and 1 day (1DASC), 2 days (2DASC) and 6 weeks (6WASC) after 2D seismic exposure; at the Lilly Canyon non-seismic control site, crab were collected in a time-matched fashion with the BSC and 6WASC samples (BSL, 6WASL); at the North of Carson Canyon 3D seismic exposure site, crab were collected during (DSNC) and 4 weeks after (4WASNC) 3D seismic exposure. Transcript levels are presented as mean ± SE relative quantity (RQ) values (i.e. values for the transcript of interest were normalized to both rpl32 and ef1a transcript levels and were calibrated to the individual with the lowest normalized expression level of that given transcript). Lowercase letters indicate Tukey’s HSD groupings. In all cases, n=10 and p < 0.05 was considered to be statistically significant. Gene names: (A) regulator of G-protein signaling 2; (B) ATP synthase F1 subunit beta; (C) glutathione peroxidase 3; (D) activating transcription factor 3; (E) cathepsin A; (F) tetraspanin-like protein CD9; (G) cuticle protein CBM; (H) sulfotransferase 1C4; (I) interferon regulatory factor; (J) signal transducer and activator of transcription; (K) toll-like receptor; (L) interleukin 16; (M) gamma-interferon induced thiol reductase GILT1; (N) gamma-interferon induced thiol reductase GILT3; (O) sacsin; (P) pyruvate dehydrogenase kinase, mitochondrial; (Q) histone-lysine N-methyltransferase 2D; (R) radical S-adenosyl methionine domain-containing protein 1, mitochondrial; (S) myoferlin; (T) broad complex protein; (U) cationic amino acid transporter; (V) cytochrome P450 CYP330A1; (W) chromodomain-helicase-DNA-binding protein 1; (X) spectrin alpha chain-like protein; (Y) leucine-rich repeat-containing protein 24.
Of the transcripts that were not significantly differentially expressed in the HPE group compared with the HPC group, signal transducer and activator of transcription (stat) was significantly higher expressed in the 4WASNC group compared with the 2DASC and 6WASC groups (Figure 3J), pyruvate dehydrogenase kinase, mitochondrial (pdk2) was significantly lower expressed in the 2DASC compared with the 6WASL and the 6WASC groups (Figure 3P), histone-lysine N-methyltransferase 2D (kmt2d) was significantly lower expressed in the DSNC compared with the 6WASL group (Figure 3Q), and myof was significantly higher expressed in the 4WASNC group compared with the DSNC group (Figure 3S); gilt1 showed a non-significant trend (0.05 < p < 0.10) of higher expression in the 2DASC, DSNC and 4WASNC groups (Figure 3M).
Six additional transcripts that appeared to be differentially expressed in response to seismic surveying in the pooled sample screen were also assessed. GO annotations for the putative human orthologue of these transcripts were also collected from QuickGO (Binns et al., 2009) (Supplemental Table 2). Broad complex protein (brc) was significantly lower expressed in the BSC, 2DASC and DSNC compared with the 6WASL, 6WASC and 4WASNC groups (Figure 3T). Cationic amino acid transporter (cat) showed a non-significant trend (0.05 < p < 0.10) of lower expression in the 2DASC, DSNC and 4WASNC groups (Figure 3U). The four additional transcripts [cyp330a1, chromodomain helicase DNA binding protein 1 (chd1), spectrin alpha chain-like protein (sptan1) and lrrc24] were not significantly differentially expressed (Figures 3V–Y).
First, we performed a principal component analysis (PCA) using all transcript expression data (25 transcripts) from field samples collected in 2017. PCA did not significantly separate the eight groups on PC 1 (p=0.259) or PC 2 (p=0.346) (Figures 4A–C). The top loading transcripts on PC 1 were lrrc24, sptan1, cd9, interleukin 16 (il16), and atf3, while the top loading transcripts on PC 2 were tlr (DN183609), rgs2, ctsa, atp5f1b, and cyp330a1 (Figures 4D, E). Only one of these top transcripts, rgs2, showed significant differences between the eight groups (Figure 3A), where significant differences were found between BSC compared to 1DASC, 6WASC, 4WASNC, and BSL, as well as between 2DASC and 4WASNC (Figure 3A). Correlations in expression among transcripts are provided in the Supplemental Figure 4.
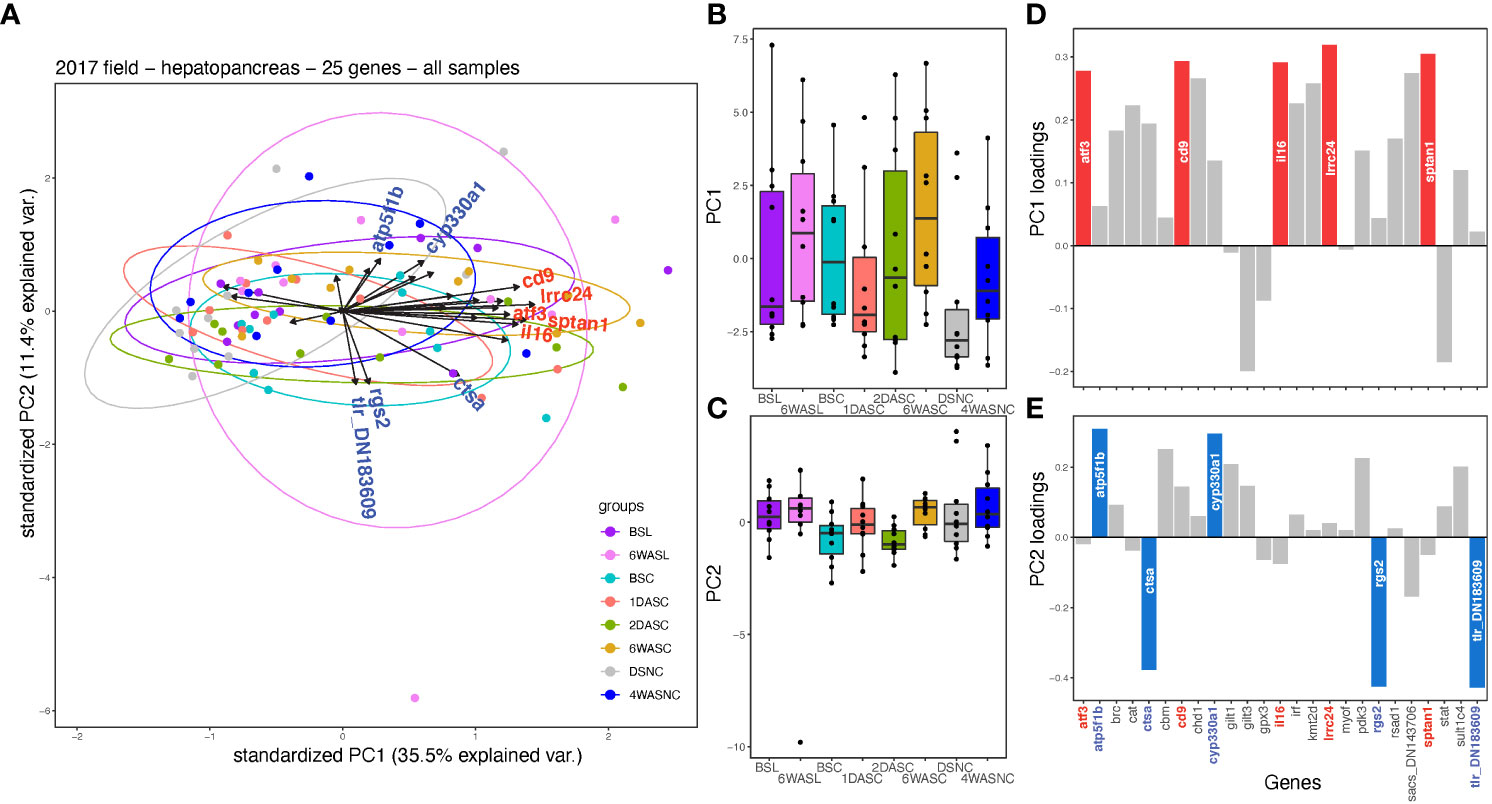
Figure 4 Multivariate analysis (principal component analysis; PCA) of qPCR-generated expression data for 25 transcripts in the hepatopancreas of snow crab from the field study conducted in 2017. (A) In the PCA plot, length and direction of arrows indicate loading of each transcript on PC axes (with the top five highest loading transcripts on each axis labelled on arrows) with points representing individual samples coloured by groupings. Boxplots of (B) PC axis 1 and (C) axis 2 scores for individual samples, with colours corresponding to groupings in (A). Loading of transcripts on (D) PC axis 1 and (E) axis 2, where the top five highest loading genes on each axis are highlighted in the respective plots.
PCA was also performed on a subset of samples which were all collected from the same geographic location (Carson Canyon). At Carson Canyon, the PCA did not significantly separate groups on PC 1 (p=0.345), but differences between groups were detected on PC 2 (p=0.007) (Figures 5A–C). Post-hoc test revealed a significant difference between samples from 2DASC and 6WASC (padj=0.0038). Transcripts contributing the most to variation on PC 1 were cd9, chd1, il16, lrrc24, and sptan1, and transcripts that loaded highly on PC 2 were brc, gilt1, gpx3, rgs2, and sult1c4 (Figures 5D, E). Two of these top transcripts on PC 2, namely rgs2 and brc, were significantly different between the four groups (Figures 3A, T). Expression of brc was significantly higher for 6WASC compared to BSC and 2DASC (Figure 3T). Conversely, expression of rgs2 was significantly lower 6WASC and 1DASC compared to BSC (Figure 3A).
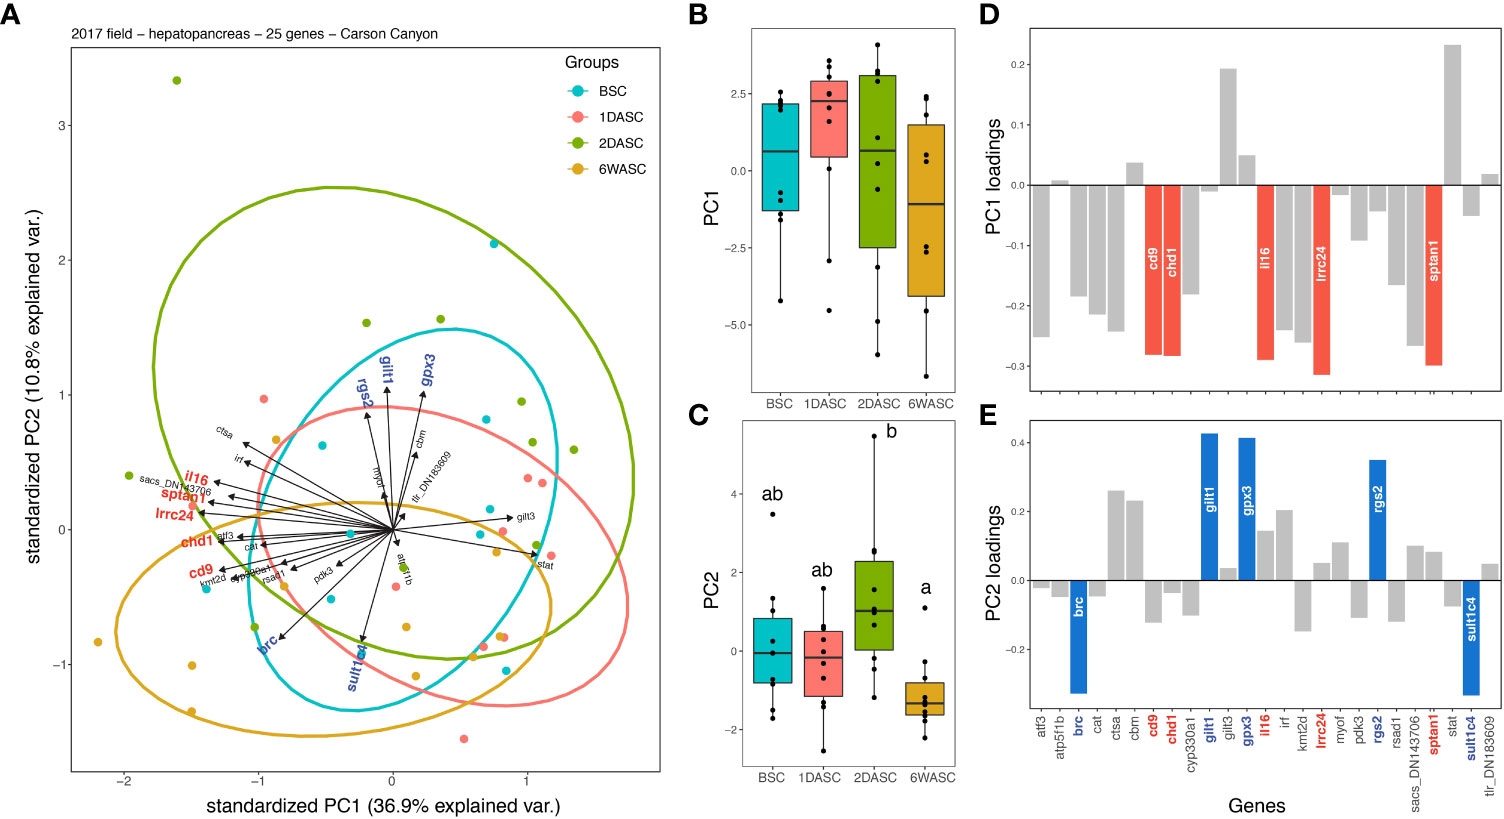
Figure 5 Multivariate analysis (principal component analysis; PCA) of qPCR-generated expression data for 25 transcripts in the hepatopancreas of snow crab from the field study conducted in 2017 for only those sampled at Carson Canyon (CC). (A) In the PCA plot, length and direction of arrows indicate loading of each transcript on PC axes with points representing individual samples coloured by groupings. Boxplots of (B) PC axis 1 and (C) axis 2 scores for individual samples, with colours corresponding to groupings in (A). Significant differences between the groups are indicated by different letters. Loading of transcripts on (D) PC axis 1 and (E) axis 2, where the top five highest loading genes on each axis are highlighted in the respective plots.
PCAs were also performed on other data subsets including: 1) only samples north of Carson Canyon (NCC) that were exposed to 3D noise and 2) samples not exposed to seismic noise (BSC and BSL). PCAs of both datasets did not reveal significant differences between groups on PC 1 or PC 2 (Supplemental Figures 5-6). For 3D NCC samples, no transcripts that loaded highly on PC 1 or PC 2 showed significant differences between the two groups (DSNC and 4WASNC). Whereas, for non-seismic exposed samples from different geographic locations (BSL and BSC), one gene (brc) that loaded highly on PC 2 showed significant differences between the sites, with higher expression in Lilly Canyon (BSL) compared to Carson Canyon (BSC) (t-test; p = 0.039).
Transcripts that contributed to PC 1 and PC 2 in all four of the PCAs described above were compared. A Venn diagram showed that four of the same transcripts (il16, cd9, lrrc24, and sptan1) loaded highly on PC 1 for all four PCAs, whereas for PC 2, no transcripts loaded highly across all four PCAs. In addition, three key immune-relevant transcripts (irf, gilt3 and stat) that are involved in the interferon pathway (see Supplemental Table 2 for GO annotations) were exclusive to 3D NCC (Figure 6). While we note that other transcripts showed significant differences between the groups (Figure 3), they did not represent transcripts that loaded highly in the PCAs suggesting that these transcripts may not contribute as much to variation in the samples overall given that PC 1 and PC 2 could explain >45% of the variation among samples in each PCA.
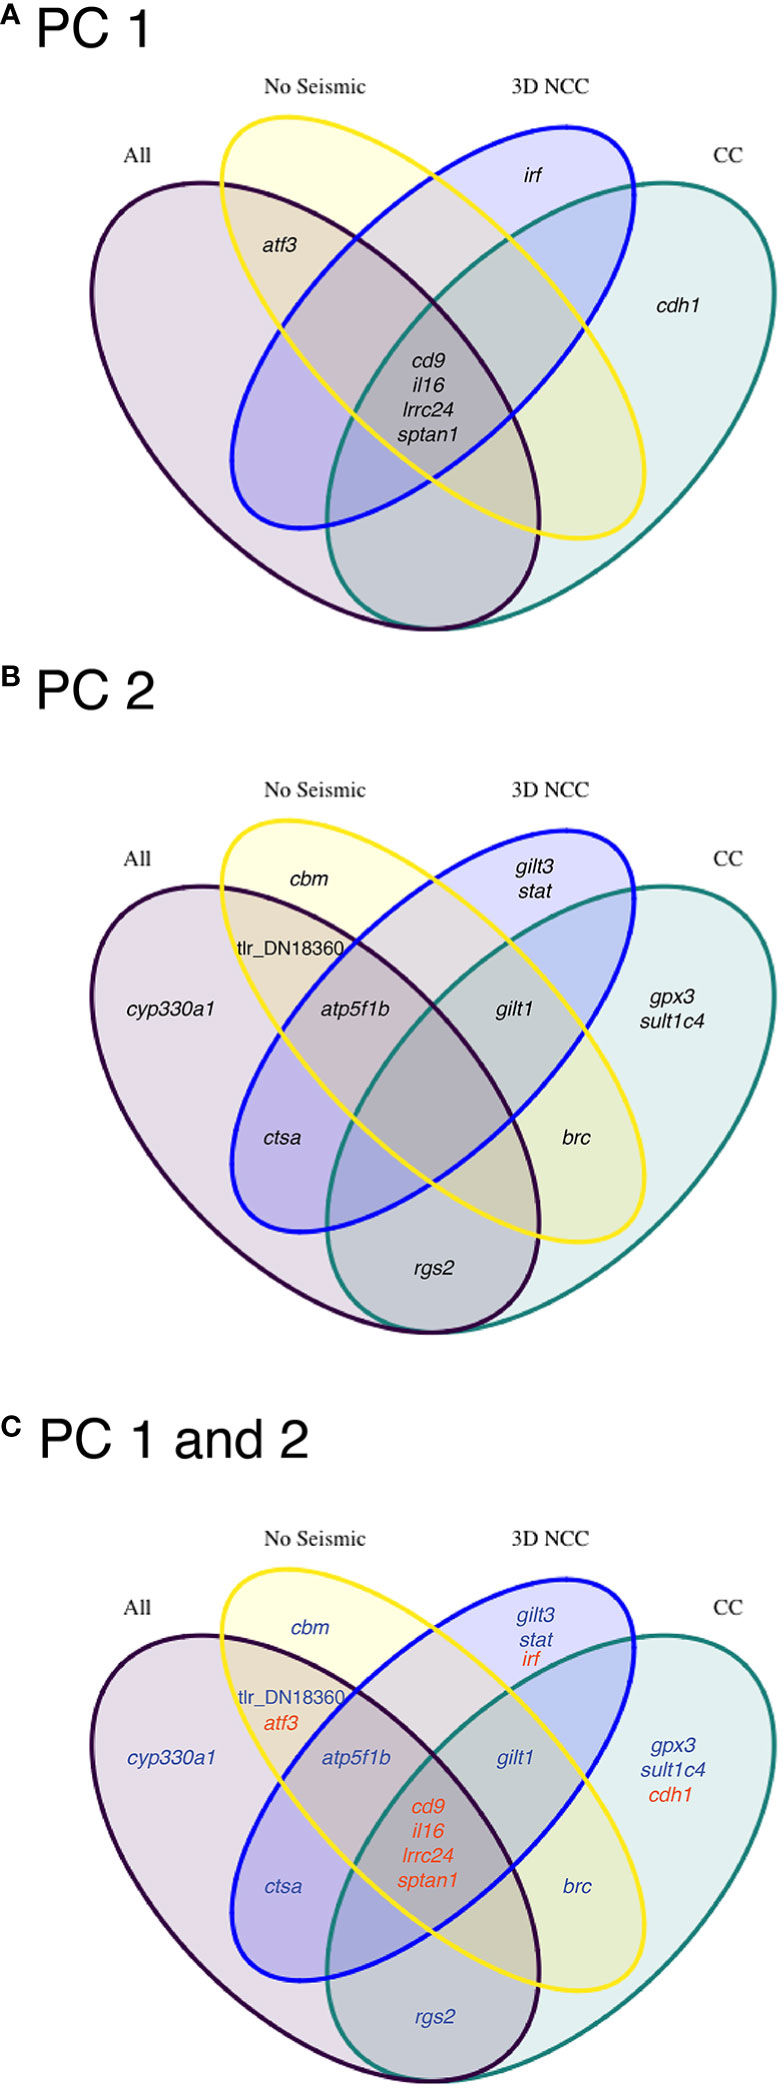
Figure 6 Venn diagrams showing the overlapping transcripts that loaded highly on (A) principal component (PC) axis 1, (B) axis 2, and (C) both axes between all four PCAs that were performed with all data or subsets of the data. In (C) transcripts that loaded high on PC 1 are indicated in red, and those that loaded high on PC 2 are indicated in blue. Subsets of the data included: samples exposed to 3D noise north of Carson Canyon (3D NCC), samples from Carson Canyon (CC), and samples that were exposed to no seismic activity (“No Seismic”; BSC and BSL).
Increases in seismic activity coinciding with declines in snow crab abundance in NL have raised concerns about the potential impacts of chronic noise from oil and gas surveys on the snow crab fishery. Here, we used a laboratory-based study, which emulated the source, shot interval and exposure duration of impulsive noise generated by seismic oil and gas surveying, paired with field sampling to investigate the effects of chronic noise on the stationary snow crab. Although we did not detect a significant impact of noise on indicators of effect including mortality, food consumption, claw muscle weight, impact on the sensory-hair field inside the statocyst, or in selected biochemical parameters (Morris et al., 2021), more subtle effects were elucidated at the transcriptomics level. We found several transcripts that showed a significant response to chronic noise in lab-based experiments using RNA-seq and qPCR validation in snow crab hemocytes and hepatopancreas, including one transcript (rgs2) that showed increased expression following noise exposure in both cell/tissue types. Five and seven other transcripts were found to be differentially expressed following noise exposure in hemocytes and hepatopancreas, respectively. However, pairing our laboratory-identified biomarkers with field-collected samples, few of these biomarkers showed consistent results in field-collected snow crab. Similarly, in our previous study, we identified seismic-responsive biomarkers in field-collected snow crab in 2016, yet none of the selected biomarkers showed significant differences between exposure groups during the following year (Hall et al., 2021). While there were potential reasons for discrepancies between years in that study (see Hall et al., 2021), this previous work highlighted the need for the controlled lab-based study conducted herein to better understand transcriptional responses to noise exposure. As seismic oil and gas surveying continues to increase in Canadian waters, it is important that we fully understand the impacts of ocean noise on snow crab and other fisheries.
The genes included in our qPCR studies using biological replicate (i.e. individual crab) samples from both the lab-based study (i.e. exposure to chronic noise in tanks) and the field-based study (i.e. exposure to seismic stress in the marine environment) focused mainly on RNA-seq-identified genes with significant BLAST hits that had associated literature and functional annotations related to defense processes (e.g. immune and stress responses). For example, rgs2 was identified as significantly upregulated by chronic noise in hemocytes (RNA-seq analysis 1) and then qPCR confirmed to be significantly 1.9- to 2.0-fold upregulated by noise exposure in both hemocytes and hepatopancreas (Supplemental File 1). As another example, myof was identified in RNA-seq analysis 2 as significantly downregulated in noise-exposed hepatopancreas compared with control hepatopancreas; while qPCR showed that myof was ~ 100-fold and ~ 20-fold downregulated by chronic noise in hepatopancreas and hemocytes, respectively, and this was not statistically significant for hepatopancreas and borderline significant (p = 0.052) for hemocytes (Supplemental File 1). Several of the putative immune-relevant qPCR genes (e.g. sacs, gilt1, gilt3, tlr, il16, stat, cfb) were RNA-seq-identified as differentially expressed between control (i.e. non-noise exposed) hepatopancreas and control hemocytes, with sacs and cfb shown by qPCR to also be noise-responsive in hemocytes [downregulated and upregulated (p=0.052), respectively; Supplemental File 1]. For additional information on the differentially expressed gene lists giving rise to qPCR genes in this study, and associated functional annotations [gene ontology (GO) terms], please see Supplemental Files 3 to 6 and Supplemental Table 2. The most informative qPCR genes based on our statistical analyses are discussed below, grouped by function.
While rgs2 was shown to be significantly upregulated by chronic noise in both hepatopancreas and hemocytes in our tank-based study, it did not appear to be upregulated by seismic exposure in our field-based study. Rather, hepatopancreas rgs2 transcript was significantly downregulated 1 day and 6 weeks after seismic exposure at the Carson Canyon site compared with pre-exposure controls. In addition, rgs2 expression was significantly higher in hepatopancreas of crabs from Carson Canyon compared with those from another geographic location (Lilly Canyon) when seismic exposure was absent at both sites. In mice, rgs2 is involved in regulating T cell activation and antiviral immunity (Oliveira-dos-Santos et al., 2000). In addition to its immune-related functions, mouse rgs2 is involved in regulating pancreatic β-cell apoptosis and function (Dong et al., 2017). Mammalian RGS2 protein is induced by several forms of stress including ischemia, and is thought to play a key role in modulating the stress response (Endale et al., 2010; Wang and Chidiac, 2019). Supporting this hypothesis, functional annotations associated with rgs2 include “response to amphetamine” and “response to ethanol” (Supplemental Table 2). Therefore, it is not surprising that we found rgs2 to be induced in chronic noise exposed snow crab hepatopancreas and hemocytes, and suggests that rgs2 will be a valuable biomarker in future research on crab stress responses. While our field trial had unexpected rgs2 expression results, it is important to note that rgs2 was among the top five qPCR genes driving the significant differences in multivariate analyses (i.e., on PC axis 2 in PCA) between Carson Canyon pre- and post-seismic exposure groups. Therefore, this gene may be a valuable biomarker in future crab environmental transcriptomic studies.
RNA-seq identified cfb as significantly higher expressed in control hemocytes compared with control hepatopancreas and was shown by qPCR to be upregulated by chronic noise (p = 0.052) in hemocytes in the current study. Cfb is an intracellular hemocyte-expressed serine protease involved in the hemolymph coagulation response of horseshoe crab (Limulus) to bacterial endotoxin [i.e. lipopolysaccharide (LPS)]; this is thought to be important in the animal’s hemostasis and antimicrobial defense (Nakamura et al., 1986; Iwanaga et al., 1992; Muta et al., 1993) (Supplemental Table 2). Our results suggest that chronic noise may disrupt snow crab hemocyte function in hemolymph coagulation and antibacterial defense. Münzel et al. (2017) reported that aircraft noise (administered to mice from loudspeakers over four days) significantly increased macrophages within the vasculature. Based on these collective results, we speculate that noise may impact phagocytic immune cells (e.g. hemocytes, macrophages) of diverse animal taxa.
As previously stated, myof was identified herein as downregulated by chronic noise. In our qPCR study with field-collected hepatopancreas samples, while myof was not differentially expressed before and after 2D seismic exposure at the Carson Canyon site, this gene was significantly downregulated during 3D seismic exposure compared with four weeks after 3D seismic exposure at the North of Carson Canyon site. Collectively, our results suggest that myof is a noise-responsive biomarker in snow crab immune cells and tissues that may be useful in studying effects of 3D seismic exposure on crab immune physiology. At the Carson Canyon site, there was not a hepatopancreas sampling time point between pre-seismic and one day post-seismic exposure. It is possible that myof expression may have been suppressed during 2D seismic exposure (as observed in the 3D seismic exposure study), and that future research would benefit from additional sampling time points (e.g. during and shortly after 2D seismic exposure).
While Myoferlin has primarily been studied in mammalian muscle, where it plays roles in myoblast fusion and endocytosis by endothelial cells (Doherty et al., 2005), it is now known to also have important functions in many mammalian cell types including phagocytes (e.g. macrophages and neutrophils), adipocytes and cancer cells (Miyatake et al., 2018; Nozato et al., 2020; Gupta et al., 2021). Functional annotations associated with myof include “plasma membrane repair” and “extracellular exosome” (Supplemental Table 2); extracellular exosomes (also called extracellular microvesicles) are important components of several biological processes including tissue homeostasis, organ remodeling, and cell-cell communication (Ratajczak and Ratajczak, 2020 and references therein). For example, Myoferlin plays a key role in mouse phagocyte function by regulating lysosomal exocytosis (Miyatake et al., 2018). In addition, myof knockout mice on a high-fat diet had attenuated obesity, altered glucose metabolism, and lower adipose inflammation associated with fewer inflammatory macrophages compared with those on a normal diet (Nozato et al., 2020). In human pancreatic cancer cells, Myoferlin is a membrane repair factor that protects against membrane damage and regulates lysosome function, with lower Myoferlin expression alleviating malignant phenotypes (Wang et al., 2013; Zhu et al., 2019; Gupta et al., 2021). If Myoferlin function is conserved between mammals and crustaceans, then the suppressed myof expression that we observed in chronic noise exposed crab hepatopancreas and hemocytes (in the tank-based study) and during 3D seismic exposure (in the field-based study) could influence the repair of membranes damaged by mechanical stress injury from loud sounds, as well as other biological processes such as glucose metabolism and inflammation. Further research is needed to understand the physiological and fitness-related consequences of suppressed myof in noise-exposed crab hepatopancreas and hemocytes.
Some snow crab hepatopancreas and hemocyte genes identified in the current study were little studied in marine invertebrates previously, but known to function in vertebrate immune and/or stress responses. For example, in the current study, snow crab atf3 was upregulated (p = 0.052) in hepatopancreas following chronic noise exposure (in the tank-based study) and also differentially expressed (p = 0.079) between groups in the field-collected hepatopancreas samples from various seismic-exposed and non-exposed sites; as well, atf3 was one of the five genes driving the non-significant (p > 0.05) differences on axis 1 of the PCA including samples from all eight field sampling sites. While there is a paucity of information available on marine invertebrate atf3, Atlantic cod (Gadus morhua) atf3 mRNA was shown to be significantly upregulated (over 60-fold) in spleen 24 h after stimulation with the double-stranded RNA analog polyriboinosinic polyribocytidylic acid [(pIC), a viral mimic] (Feng and Rise, 2011). In mammals, ATF3 is stress-induced and plays critical roles in the regulation of immunity, glucose metabolism, and cancer (Ku and Cheng, 2020). Functional annotations associated with atf3 include GO terms involving response to endoplasmic reticulum stress and regulation of apoptosis (Supplemental Table 2). Mouse atf3 and atf4 transcripts were shown to be strongly induced in the inner ear neurons after acoustic trauma (i.e. noise exposure) (Milon et al., 2021). The transcription factors ATF3 and ATF4 are key parts of the integrated stress response pathway that may, after trauma, lead to either the restoration of homeostasis or cell death (Pakos-Zebrucka et al., 2016; Milon et al., 2021). Based on these results, we hypothesize that the integrated stress response pathway is activated in the crab hepatopancreas by chronic noise, and that transcripts in this pathway (e.g. atf3) may be suitable molecular biomarkers for studying the effects of seismic and other noise exposure on wild crabs. As well, since mammalian ATF3 influences the expression of interferon gamma (Rosenberger et al., 2008), we propose that interferon signaling may be part of a mechanism by which snow crab hepatopancreas responds to loud sounds/noise. The presence of gilt1 among the top five genes driving the significant difference between post-seismic time points at the Carson Canyon sampling site (Figure 5E) seems to support this idea.
Although kmt2d was RNA-seq identified (in analysis 1) as downregulated in hemocytes of crabs exposed to chronic noise, this gene could not be confirmed as noise-responsive in either hemocytes or hepatopancreas using qPCR. GO terms associated with kmt2d include “histone H3-K4 methylation”, “regulation of DNA-templated transcription”, “oogenesis”, and “response to estrogen” (Supplemental Table 2). In the field-based component of the current study, kmt2d was shown to be significantly lower expressed during 3D seismic exposure (at the North of Carson Canyon site) compared with one of the control non-seismic sample groups (6WASL). Recently, RNA-seq was used to identify the transcript encoding a different Histone-lysine N-methyltransferase, (H3 lysine-79 specific) as being upregulated in horseshoe crab (Tachypleus gigas) hemocytes exposed to lipopolysaccharide [(LPS), a bacterial pathogen-associated molecular pattern (PAMP)] (Sarmiento et al., 2021). While it is known that human KMT2D has cancer-epigenetic function (e.g. in tumorigenesis and hematological malignancies such as non-Hodgkin lymphoma) (Dhar and Lee, 2021; Yamagishi, 2022), the function of crustacean kmt2d is not known. There is an extensive literature on the influence of noise stress on mammalian immune function and association with various diseases including non-Hodgkin lymphoma (reviewed by Zhang et al., 2021). Assuming KMT2D function is conserved in mammals and crustaceans, it is possible that altered histone modification associated chromatin remodeling may be part of an epigenetic mechanism by which 3D seismic stress could influence the snow crab hepatopancreas in the wild.
The snow crab transcript identified herein as brc (contig hepatopancreas_DN112978_c0_g1_i3) has significant similarity (BLASTx against nr database) to proteins including Zinc finger protein 169-like (Homarus americanus), Longitudinals lacking protein (Portunus trituberculatus), Zinc finger protein Helios (C. opilio), and Broad-complex protein isoform 4 (Penaeus vannamei) (data not shown), with associated GO terms including “metal ion binding” and “retinoic acid-responsive element binding” (Supplemental Table 2). This brc-like transcript was RNA-seq identified (in analysis 1) as down-regulated in chronic noise exposed hepatopancreas compared with control hepatopancreas. In our qPCR study with field-collected hepatopancreas samples, brc was among the most informative biomarkers, being significantly lower expressed during 3D seismic compared with 4 weeks after 3D seismic, and also significantly lower expressed before and 2 days after 2D seismic compared with 6 weeks after 2D seismic. As well, brc was one of the top five qPCR genes driving the significant differences in multivariate analyses (i.e., in PCA on PC 2) between Carson Canyon seismic exposure groups. In Drosophila, brc and lola (encoding Longitudinals lacking protein) are members of the BTB-zinc finger protein family of transcription factors that play roles in embryonic and ovarian development, e.g. repressing apoptosis (Ohsako et al., 2003; Zhao et al., 2022); as well, lola is involved in the formation of a sexually dimorphic courtship circuit in Drosophila (Sato et al., 2019). In ridgetail white prawn (Exopalaemon carinucauda), lola was identified as a gonad development associated gene that mapped to a sex-related quantitative trait locus (Lv et al., 2020). In addition to roles in sex and development, members of this protein family also have immune-related functions; for example, the human zinc finger transcription factor Helios is a marker used to identify thymically-derived regulatory T-cells (Treg) and plays a critical role in the maintenance of a stable Treg phenotype in tumors (Tanoue et al., 2016; Wang et al., 2021). If the brc-like gene involved in our study also functions in development and/or immunity, then it may be a useful molecular biomarker for future studies of seismic and other environmental stress on snow crab physiology.
In addition to the previously discussed genes associated with the immune response and inflammation, many other putative defense-relevant transcripts were RNA-seq-identified and qPCR-assayed in the current study. Immune-related functional annotations (GO terms) associated with genes represented in Figures 1–6 include “adaptive immune response” [cathepsin L (ctsl)], “immune response” [ctsl, interferon regulatory factor (irf), il16, and tlr], “innate immune response” [E3 ubiquitin-protein ligase TRIM38 (trim38), toll-interacting protein (tollip), and tlr], “lipopolysaccharide immune receptor activity” (tlr), and several related to B cell differentiation [stat, interferon regulatory factor binding protein (irf2bp), irf] (Supplemental Table 2). Of these genes, stat was differentially expressed between groups in the field study, and il16 and tlr were among the top five highest loading genes in multivariate analyses. Immune-relevant gene sequences and qPCR assays generated in this study represent important new resources for future studies of snow crab defense responses to seismic and other environmental stressors.
Both gilt1 and gilt3 were RNA-seq identified (in analysis 2) as significantly much higher expressed in control hepatopancreas compared with control hemocytes. This agrees with Huang et al. (2015), who showed that mud crab (Scylla paramamosain) gilt1 and gilt3 constitutive transcript expression levels were highest in hepatopancreas (of 11 tissues tested), with low and moderate expression of gilt1 and gilt3, respectively, in hemocytes. While our qPCR study did not detect gilt3 in hemocytes, gilt1 was non-significantly (p > 0.05) 2.5-fold upregulated in noise-exposed crab hemocytes compared with control hemocytes; qPCR showed that neither gilt1 nor gilt3 appeared to respond to noise in hepatopancreas. In our field study, gilt1 appeared to be upregulated (p = 0.087) in hepatopancreas two days after 2D seismic exposure compared with the three other Carson Canyon sample groups (i.e. before seismic, and one day and six weeks after seismic); gilt1 showed no change in expression between the two sampling times at the non-seismic control site (Lilly Canyon), and no response to 3D seismic exposure at the North of Carson Canyon site. In our multivariate analysis of Carson Canyon hepatopancreas transcript expression data, gilt1 was among the top five genes driving the significant difference on PC axis 2 between samples collected two days versus six weeks after 2D seismic exposure.
GILT, which catalyzes the reduction of protein disulfide bonds, plays roles in numerous defense-relevant processes in mammals including antigen presentation, regulation of the cellular redox state, response to bacterial infection, and viral entry into host cells (Rausch and Hastings, 2015; Majdoul and Compton, 2022) (Supplemental Table 2). Indeed, GILT is known to function in innate immunity (e.g. response to bacterial infection) and regulation of oxidative stress in diverse animals including invertebrates such as planarians (Gao et al., 2021) and lower vertebrates such as sturgeon (e.g. You et al., 2018). In Atlantic salmon (Salmo salar) fed diets with partial replacement of fish meal with solvent-extracted camelina meal for 16 weeks, gilt transcript expression in the distal intestine was significantly correlated with some histopathological signs of inflammation (Brown et al., 2016). In recent years, gilt-like gene expression has been studied in crustaceans. For example, Chinese mitten crab gilt mRNA expression in hemocytes was significantly induced after infection with bacterial pathogens Vibrio parahaemolyticus and Staphylococcus aureus (Nan et al., 2022). As well, red swamp crayfish (Procambarus clarkii) gilt mRNA expression was shown to be over 2-fold higher in hepatopancreas compared with hemocytes (agreeing with our RNA-seq results), and also strongly upregulated in hepatopancreas following challenge with PAMPs, namely pIC and peptidoglycan (Liu et al., 2019). In shrimp (Penaeus monodon), the GILT catalyzed reduction of viral protein disulfide bonds restricted white spot syndrome virus infection (Thipwong et al., 2019). As well, mud crab gilt1 and gilt3 transcript expression in hepatopancreas was shown to be significantly upregulated by Vibrio parahaemolyticus infection (Huang et al., 2015). Given GILT’s conserved functions across animal taxa, and the relatively high expression of gilt1 and gilt3 in snow crab hepatopancreas observed herein, it seems likely that these gilt family members function in defense (e.g. inflammation and/or innate immune responses to pathogens). The gilt1 expression change after 2D seismic exposure at the Carson Canyon site, then, could potentially influence the crabs’ immune function and health. The regulation and function of snow crab gilt1 and gilt3, and their potential use as biomarkers of exposure to environmental stressors such as seismic surveys, warrant further investigation.
In the current study, sacs was shown by RNA-seq and qPCR to be significantly downregulated in snow crab hemocytes exposed to chronic noise; however this gene was not differentially expressed in our lab-based and field-based hepatopancreas qPCR experiments. The human sacs gene encodes a molecular chaperone (Anderson et al., 2011) associated with early-onset spastic ataxia (Engert et al., 2000), with functional annotations including “Hsp70 protein binding”, “proteasome binding”, and “protein-folding chaperone binding” (Supplemental Table 2). Recently, a CRISPR-Cas9-generated zebrafish sacs knockout strain exhibited characteristics similar to mammalian models of sacs-associated spastic ataxia (e.g. increased oxidative stress, mitochondrial dysfunction, motor impairment; Naef et al., 2021). In some teleost fish species, sacs has also been shown to be responsive to viral or viral-like stimuli; for example, sacs transcript was induced in Atlantic cod brain following stimulation with pIC (Rise et al., 2010), and in Atlantic salmon macrophage-like cells after infection with the viral pathogen that causes Infectious Salmon Anemia (ISA) (Workenhe et al., 2009). Based on these results, Rise et al. (2012) speculated that sacs could be part of the core set of antiviral fish genes discussed by Verrier et al. (2011). Importantly, a proteomic study of the reef coral Pocillopora acuta identified Sacsin (an HSP40 family member) to be associated with elevated temperature, and a sacsin-like gene may be involved in the responses of Acropora corals to environmental stressors (Mayfield et al., 2018; Fuller et al., 2020; Takahashi-Kariyanzono and Terai, 2021). Collectively, our results alongside literature associated with noise-responsive genes identified in the current study that are known to be involved in both stress and antiviral responses (i.e. sacs and atf3) suggest that these genes may be valuable molecular biomarkers for assessing immune-related impacts of chronic noise and other environmental stressors on snow crab and other marine animals.
GPx3, a selenoprotein that catalyzes the reduction of H2O2 [hydrogen peroxide, a reactive oxygen species (ROS)] to H2O and O2, is a key component of the redox system that protects cells from oxidative damage (Hernández-Aguirre et al., 2022). Functional annotations associated with gpx3 include “selenium binding”, “oxidoreductase activity”, “cellular oxidant detoxification”, response to lipid hydroperoxide”, and “response to oxidative stress” (Supplemental Table 2). While gpx3 was RNA-seq identified as downregulated in noise-exposed crab hemocytes, this transcript was not detectable by qPCR in hemocytes. However, we found that gpx3 was upregulated (p = 0.052) in noise exposed crab hepatopancreas. Further, in the field-based qPCR studies, gpx3 was significantly upregulated during 3D seismic exposure compared with four weeks later (at the North of Carson Canyon site) and also one of the top five genes driving differences in multivariate analysis (i.e., on PC 2 in PCA) between 2D seismic exposure groups (at the Carson Canyon site). Previous studies have shown that marine invertebrate Glutathione peroxidase responds to environmental stressors. For example, cadmium exposure of the freshwater crab Sinopotamon henanense significantly increased ROS levels and activity of Glutathione peroxidase and other antioxidant enzymes [Superoxide dismutase (SOD) and Catalase (CAT)] in hemocytes (Zhou et al., 2016). At the transcript expression level, Cheng et al. (2020a) showed that mud crab (Scylla paramamosain) gpx3 had relatively high constitutive expression in hepatopancreas and hemocytes, and was significantly upregulated (along with sod and cat) in hepatopancreas of crabs exposed to acute nitrite stress. A mud crab hepatopancreas RNA-seq study found that gpx3 and other oxidative stress relevant transcripts (thioredoxin, thioredoxin reductase, cytochrome p450) were upregulated after air exposure, an important environmental stressor for crab aquaculture and transport (Cheng et al., 2020b). As well, crayfish (Cherax quadricarinatus) gpx3 transcripts were shown to be upregulated in nerve cord by elevated temperature and hypoxia (Hernández-Aguirre et al., 2022), and Zhikong scallop (Chlamys farreri) gpx3 upregulation in kidney after exposure to paralytic shellfish toxin (PST)-producing dinoflagellates may protect this organ from PST-associated oxidative stress (Hlaing et al., 2021). While the aforementioned crustacean gpx3 expression studies showed induction following exposure to various environmental stressors (in agreement with our observation of snow crab gpx3 upregulation by chronic noise in hepatopancreas), gpx3 was found to be significantly downregulated in Chinese mitten crab (Eriocheir sinensis) gill after salinity stress (Li et al., 2014). Collectively, these results support gpx3 as a robust environmental stress responsive biomarker in crustaceans, and suggest that gpx3 induction may be part of a mechanism by which snow crab hepatopancreas is protected from oxidative stress associated with chronic noise exposure. In light of these gpx3 results, and the many immune-relevant snow crab genes identified as noise-responsive in our study, it is notable that Zhang et al. (2021) hypothesized that noise may alter the human immune system through modulation of oxidative stress.
In the current study, atp5f1b was significantly upregulated in snow crab hepatopancreas after chronic noise exposure, and was also one of the five genes driving the non-significant (p > 0.05) differences on axis 2 of the PCA including samples from all eight field sampling sites. Chronic low pH (i.e. acidic) stress significantly influenced the expression of many Chinese mitten crab hepatopancreas transcripts involved in oxidative phosphorylation (e.g. atp5f1) and in glycolysis/gluconeogenesis and pyruvate metabolism (e.g. pdhA, pdhD) (Wang et al., 2020). While our tank-based chronic noise qPCR study did not confirm pdk2 as noise-responsive in either hemocytes or hepatopancreas, in the field qPCR study, pdk2 was differentially expressed between groups [i.e. significantly lower expressed two days after 2D seismic exposure compared with six weeks after 2D seismic at the Carson Canyon site, and also compared with one of the control non-seismic sample groups (6WASL)]. PDK2 plays a key role in regulating cellular energy metabolism and homeostasis (Shi and McQuibban, 2017), and associated GO terms include “mitochondrial pyruvate dehydrogenase complex” and “cellular response to reactive oxygen species” (Supplemental Table 2). A recent RNA-seq study followed by KEGG pathway enrichment found that hypoxia-responsive Chinese mitten crab hepatopancreas genes were significantly enriched for the “Pyruvate metabolism” pathway (Xu et al., 2021). Collectively, these results suggest that pdk2 may be a valuable biomarker for assessing the impact of seismic and other environmental stressors on crab mitochondrial metabolism.
Overall, we found little evidence of consistency in expression patterns for biomarkers in lab-based and field-collected samples. Differences between lab- and field-based samples may not be surprising, and other studies have found transcriptional differences between controlled and natural environments (Schmidt and Baldwin, 2006; Wellband et al., 2018; Krishnan et al., 2020). Therefore, seemingly subtle or unknown differences can contribute to observed variation leading to discrepancies between field and controlled laboratory experiments. For example, in Chinook salmon (Oncorhynchus tshawytscha), differences in rearing environment can alter basal gene expression patterns as well as expression patterns in response to stress (Wellband et al., 2018). In our study, there are several reasons why differences may exist between the lab and field. First, lab-based experiments were performed using underwater speakers with recordings of seismic noise, whereas field-based samples were exposed directly to seismic testing. We acknowledge that the acoustic properties of the tank environment and the noise generated by speakers may not be directly representative of seismic surveying and the conditions experienced in the ocean. Therefore, these stressors may not be exactly the same, but may still induce noise-responsive changes in snow crab. Further, the lab-based experiment was conducted with chronic exposure to noise for ~ 22 weeks, whereas exposure in the field lasted only 2 hours, with the exception of crab located at North of Carson Canyon (NCC), which were subjected to chronic 3D seismic noise over 2 months. In addition, snow crab in the lab-based experiment and field-based study were collected from different areas off of NL. High connectivity and low population structure over large spatial scales is expected among snow crab of eastern Canada (Puebla et al., 2008); however, information regarding the genetic population structure of snow crab across this entire region is not available. Nonetheless, differences in transcription can still be found among populations that are genetically similar (De Wit and Palumbi, 2013). Such differences can occur due to differences in ecological and environmental factors. In our study, the abiotic and biotic conditions encountered by crab in the tank environment differ from that of crab in nature. For example, within experimental tanks, crab were regularly fed, experienced a constant water flow rate and temperature, had no other stressors, and the crab selected for transcript expression analyses were considered in healthy condition. Conversely, in the field, the conditions experienced by the crab prior to sampling are unknown, as it is possible for food availability, water currents, temperature, and salinity to fluctuate across time in the ocean. The collection and sampling of crab in the field is also more difficult, as it requires capture in crab pots (deployed for 12 hours) and the amount of time required to collect tissue from crab after recovering pots can take up to 3 hours. Recovery of crab pots is also associated with rapid environmental change for crab, as it involves changes in temperature and light as pots are hauled up through the water column. This differs from the laboratory-collected samples where tissues were sampled immediately after removal from the tank and processed within 10 minutes. While the field provides a more realistic ecological setting to examine the effects of stressors (Alvarez et al., 2015) like seismic noise, the remote location of the crab fishery can make it more difficult to control other variables that can impact gene expression, and thus may explain some of the differences between lab- and field-based collections found here.
Overall, the pairing of lab- and field-based programs are necessary to evaluate the utility of biomarkers in any species. Indeed, our study identified biomarkers that were determined to be noise-responsive in both the laboratory and field setting that may be valuable for further studies of environmental stress impacts on snow crab. The transcripts highlighted here were largely associated with stress and immune response, suggesting chronic noise may influence these responses in snow crab. To date, other studies have not found clear impacts of noise on snow crab behaviour, physiology, or catch rates (Morris et al., 2018; Cote et al., 2020; Morris et al., 2020; Morris et al., 2021), thus the transcriptional changes documented here may help identify more subtle ways in which snow crab may respond, particularly under laboratory conditions. While the identified transcripts may indicate potential mechanisms in which noise can influence snow crab physiology, linking these responses to fitness is still needed (Oomen and Hutchings, 2017) to fully understand the longer term impacts of seismic activity on the snow crab in NL.
JH: Methodology, validation, formal analysis, investigation, resources, data curation, writing - original draft, writing - review and editing, visualization. SL: Formal analysis, data curation, writing - original draft, writing - review and editing, visualization. EG: software, formal analysis, data curation, writing - review and editing. JH: Methodology, investigation, resources, writing - review and editing, project administration. SK: Software, formal analysis, data curation, writing - review and editing. CM: Conceptualization, methodology, investigation, resources, writing - review and editing, supervision, project administration, funding acquisition. MR: Conceptualization, validation, resources, writing - original draft, writing - review and editing, supervision, project administration, funding acquisition. All authors contributed to the article and approved the submitted version.
This research project was primarily supported by funding from the Environmental Studies Research Fund (project 2014-01S) led by CM. MR is supported by a Natural Sciences and Engineering Research Council of Canada (NSERC) Discovery Grant. C3G is a Node of the Canadian Genomic Innovation Network and is supported by the Canadian Government through Genome Canada.
We wish to thank Fisheries and Oceans Canada, and the Fish Food and Allied Workers for field sampling assistance and sample collections. We also thank Matthew Osse and Stephanie Abbott, Oceans Ltd., St. John’s, NL, Canada, for help with sampling. The authors wish to acknowledge the contribution of staff at the McGill University and Génome Québec Innovation Centre, Montréal, QC, Canada, for library construction and sequencing services, and François Lefebvre, Canadian Centre for Computational Genomics (C3G), McGill University and Génome Québec Innovation Centre, for helpful discussions on bioinformatics analyses.
The authors declare that the research was conducted in the absence of any commercial or financial relationships that could be construed as a potential conflict of interest.
All claims expressed in this article are solely those of the authors and do not necessarily represent those of their affiliated organizations, or those of the publisher, the editors and the reviewers. Any product that may be evaluated in this article, or claim that may be made by its manufacturer, is not guaranteed or endorsed by the publisher.
The Supplementary Material for this article can be found online at: https://www.frontiersin.org/articles/10.3389/fmars.2023.1198036/full#supplementary-material
Supplementary Figure 1 | qPCR analysis of selected RNA-seq identified transcripts in pooled crab hemocytes samples. (1A) Transcripts (A–I) were identified as differentially expressed in the hemocytes of crab subjected to chronic noise (HCE) compared with hemocytes of control crab (HCC) using RNA-seq analysis method 1 (see Methods for details). With the exception of per1 (J), transcripts that were identified as differentially expressed in the HCE group compared with the HCC group using RNA-seq analysis method 2 could not be accurately measured in hemocytes using qPCR due to no/low expression levels (data not shown). (1B) These 11 transcripts (A–K) were identified as differentially expressed in the hepatopancreas of crab subjected to chronic noise (HPE) compared with hepatopancreas of control crab (HPC) using RNA-seq analysis method 1. (1C) These 7 transcripts (A–G) were identified as differentially expressed in the HPE group compared with the HPC group using RNA-seq analysis method 2 (see Methods for details). (1D) These 21 transcripts (A–U) were identified as differentially expressed in the HPC group compared with the HCC group using RNA-seq analysis method 2. As an initial screen to help select transcripts for the individual sample qPCR study, qPCR analysis was performed to measure transcript expression levels using a cDNA pool generated for the HCC group and a cDNA pool generated for the HCE group. Transcript levels are presented as relative quantity (RQ) values (i.e. values for the transcript of interest were normalized to both rpl32 and ef1a transcript levels and were calibrated to the pooled sample with the lowest normalized expression level of that given transcript).
Supplementary Figure 2 | qPCR analysis of selected RNA-seq identified transcripts in pooled crab hepatopancreas samples. (2A) These 9 transcripts (A–I) were identified as differentially expressed in the hemocytes of crab subjected to chronic noise (HCE) compared with hemocytes of control crab (HCC) using RNA-seq analysis method 1 (see Methods for details). (2B) These 13 transcripts (A–M) were identified as differentially expressed in the HCE group compared with the HCC group using RNA-seq analysis method 2 (see Methods for details). (2C) These 11 transcripts (A–K) were identified as differentially expressed in the hepatopancreas of crab subjected to chronic noise (HPE) compared with hepatopancreas of control crab (HPC) using RNA-seq analysis method 1. (2D) These 7 transcripts (A–G) were identified as differentially expressed in the HPE group compared with the HPC group using RNA-seq analysis method 2. (2E) These 21 transcripts (A–U) were identified as differentially expressed in the HPC group compared with the HCC group using RNA-seq analysis method 2. As an initial screen to help select transcripts for the individual sample qPCR study, qPCR analysis was performed to measure transcript expression levels using a cDNA pool generated for the HPC group and a cDNA pool generated for the HPE group. Transcript levels are presented as relative quantity (RQ) values (i.e. values for the transcript of interest were normalized to both rpl32 and ef1a transcript levels and were calibrated to the pooled sample with the lowest normalized expression level of that given transcript).
Supplementary Figure 3 | qPCR analysis of selected RNA-seq identified transcripts from the chronic noise laboratory study in pooled hepatopancreas samples from the field study conducted in 2017. (3A) These 9 transcripts (A–I) were identified as differentially expressed in the hemocytes of crab subjected to chronic noise (HCE) compared with hemocytes of control crab (HCC) using RNA-seq analysis method 1 (see Methods for details). (3B) These 13 transcripts (A–M) were identified as differentially expressed in the HCE group compared with the HCC group using RNA-seq analysis method 2 (see Methods for details). (3C) These 11 transcripts (A–K) were identified as differentially expressed in the hepatopancreas of crab subjected to chronic noise (HPE) compared with hepatopancreas of control crab (HPC) using RNA-seq analysis method 1. (3D) These 7 transcripts (A–G) were identified as differentially expressed in the HPE group compared with the HPC group using RNA-seq analysis method 2. (3E) These 20 transcripts (A–T) were identified as differentially expressed in the HPC group compared with the HCC group using RNA-seq analysis method 2. In the field study conducted in 2017, crab were collected in 8 groups. At the Carson Canyon 2D seismic exposure site, crab were collected before (BSC), and 1 day (1DASC), 2 days (2DASC) and 6 weeks (6WASC) after 2D seismic exposure; at the Lilly Canyon non-seismic control site, crab were collected in a time-matched fashion with the BSC and 6WASC samples (BSL, 6WASL); at the North of Carson Canyon 3D seismic exposure site, crab were collected during (DSNC) and 4 weeks after (4WASNC) 3D seismic exposure. As an initial screen to assess expression levels of these transcripts in hepatopancreas samples from the field study conducted in 2017, qPCR analysis was performed to measure transcript expression levels using a cDNA pool generated for each of the 8 groups. Transcript levels are presented as relative quantity (RQ) values (i.e. values for the transcript of interest were normalized to both rpl32 and ef1a transcript levels and were calibrated to the pooled sample with the lowest normalized expression level of that given transcript). Results are presented in the same format as the pooled sample screen for hepatopancreas samples from the chronic noise laboratory study (i.e. transcripts are grouped by the RNA-seq based analysis in which they were identified as being differentially expressed, and are sorted by Gene ID number) (see Supplemental Figure 2).
Supplementary Figure 4 | Correlation coefficients (r) among 25 transcripts based on expression data from snow crab collected in 2017 in the field (all samples). Colour and size of circles indicate strength and direction of relationship. Only significant correlations (p<0.05) are shown by circles.
Supplementary Figure 5 | Multivariate analysis (principal component analysis; PCA) of qPCR-generated expression data for 25 transcripts in the hepatopancreas of snow crab from the field study conducted in 2017 for only those samples exposed to 3D noise north of Carson Canyon (NCC). (A) In the PCA plot, length and direction of arrows indicate loading of each transcript on PC axes with points representing individual samples coloured by groupings. Boxplots of (B) PC axis 1 and (C) axis 2 scores for individual samples, with colours corresponding to groupings in (A). Loading of transcripts on (D) PC axis 1 and (E) axis 2, where the top five highest loading transcripts on each axis are highlighted in the respective plots.
Supplementary Figure 6 | Multivariate analysis (principal component analysis; PCA) of qPCR-generated expression data for 25 transcripts in the hepatopancreas of snow crab from the field study conducted in 2017 for only samples that were not exposed to seismic noise at two geographically separate locations (BSC and BSL). (A) In the PCA plot, length and direction of arrows indicate loading of each transcript on PC axes with points representing individual samples coloured by groupings. Boxplots of (B) PC axis 1 and (C) axis 2 scores for individual samples, with colours corresponding to groupings in (A). Loading of transcripts on (D) PC axis 1 and (E) axis 2, where the top five highest loading transcripts on each axis are highlighted in the respective plots.
Altschul S. F., Madden T. L., Schäffer A. A., Zhang J., Zhang Z., Miller W., et al. (1997). Gapped BLAST and PSI-BLAST: a new generation of protein database search programs. Nucleic Acids Res. 25, 3389–3402. doi: 10.1093/nar/25.17.3389
Alvarez M., Schrey A. W., Richards C. L. (2015). Ten years of transcriptomics in wild populations: what have we learned about their ecology and evolution? Mol. Ecol. 24, 710–725. doi: 10.1111/mec.13055
Anderson J. F., Siller E., Barral J. M. (2011). The neurodegenerative-disease-related protein sacsin is a molecular chaperone. J. Mol. Biol. 411, 870–880. doi: 10.1016/j.jmb.2011.06.016
Binns D., Dimmer E., Huntley R., Barrell D., O'Donovan C., Apweiler R. (2009). QuickGO: a web-based tool for gene ontology searching. Bioinformatics 25, 3045–3046. doi: 10.1093/bioinformatics/btp536
Bolger A. M., Lohse M., Usadel B. (2014). Trimmomatic: a flexible trimmer for illumina sequence data. Bioinformatics 30, 2114–2120. doi: 10.1093/bioinformatics/btu170
Bray N. L., Pimentel H., Melsted P., Pachter L. (2016). Near-optimal probabilistic RNA-seq quantification. Nat. Biotechnol. 34, 525–527. doi: 10.1038/nbt.3519
Brown T. D., Hori T. S., Xue X., Ye C. L., Anderson D. M., Rise M. L. (2016). Functional genomic analysis of the impact of camelina (Camelina sativa) meal on Atlantic salmon (Salmo salar) distal intestine gene expression and physiology. Mar. Biotechnol. 18, 418–435. doi: 10.1007/s10126-016-9704-x
Bryant D. M., Johnson K., DiTommaso T., Tickle T., Couger M. B., Payzin-Dogru D., et al. (2017). A tissue-mapped axolotl de novo transcriptome enables identification of limb regeneration factors. Cell Rep. 18, 762–776. doi: 10.1016/j.celrep.2016.12.063
Carroll A. G., Przeslawski R., Duncan A., Gunning M., Bruce B. (2017). A critical review of the potential impacts of marine seismic surveys on fish & invertebrates. Mar. Pol. Bul. 114, 9–24. doi: 10.1016/j.marpolbul.2016.11.038
Chen J., Leng T., Jiang Y., Chen X., Liu Z. (2022). RNA-Seq analysis of the differential response to low-temperature stress in two morphs of mud crabs (Scylla paramamosain). Comp. Biochem. Physiol. Part D Genomics Proteomics. 43, 101010. doi: 10.1016/j.cbd.2022.101010
Chen Q., Zhang Y., Zhao Q. (2020). Expression analysis of immune-associated genes in hemocytes of mud crab Scylla paramamosain under low salinity challenge. Fish Shellfish Immunol. 107, 16–25. doi: 10.1016/j.fsi.2020.09.021
Cheng C. H., Ma H. L., Deng Y. Q., Feng J., Chen X. L., Guo Z. X. (2020a). Glutathione peroxidase 3 in the mud crab Scylla paramamosain: characterization and regulation under nitrite stress. Comp. Biochem. Physiol. C Toxicol. Pharmacol. 229, 108673. doi: 10.1016/j.cbpc.2019.108673
Cheng C. H., Ma H. L., Deng Y. Q., Feng J., Chen X. L., Guo Z. X. (2020b). Transcriptome analysis and histopathology of the mud crab (Scylla paramamosain) after air exposure. Comp. Biochem. Physiol. C Toxicol. Pharmacol. 228, 108652. doi: 10.1016/j.cbpc.2019.108652
Cote D., Morris C. J., Regular P. M., Piersiak M. G. (2020). Effects of 2D seismic on snow crab movement behavior. Fish. Res. 230, 105661. doi: 10.1016/j.fishres.2020.105661
Crandall G., Jensen P. C., White S. J., Roberts S. (2022). Characterization of the gene repertoire and environmentally driven expression patterns in tanner crab (Chionoecetes bairdi). Mar. Biotechnol. (NY). 24, 216–225. doi: 10.1007/s10126-022-10100-8
De Wit P., Palumbi S. R. (2013). Transcriptome-wide polymorphisms of red abalone (Haliotis rufescens) reveal patterns of gene flow and local adaptation. Mol. Ecol. 22, 2884–2897. doi: 10.1111/mec.12081
Dhar S. S., Lee M. G. (2021). Cancer-epigenetic function of the histone methyltransferase KMT2D and therapeutic opportunities for the treatment of KMT2D-deficient tumors. Oncotarget 12, 1296–1308. doi: 10.18632/oncotarget.27988
Doherty K. R., Cave A., Davis D. B., Delmonte A. J., Posey A., Earley J. U., et al. (2005). Normal myoblast fusion requires myoferlin. Development 132, 5565–5575. doi: 10.1242/dev.02155
Dong H., Zhang Y., Wang J., Kim D. S., Wu H., Sjögren B., et al. (2017). Regulator of G protein signaling 2 is a key regulator of pancreatic β-cell mass and function. Cell Death Dis. 8, e2821. doi: 10.1038/cddis.2016.216
Endale M., Kim S. D., Lee W. M., Kim S., Suk K., Cho J. Y., et al. (2010). Ischemia induces regulator of G protein signaling 2 (RGS2) protein upregulation and enhances apoptosis in astrocytes. Am. J. Physiol. Cell Physiol. 298, C611–C623. doi: 10.1152/ajpcell.00517.2008
Engert J. C., Bérubé P., Mercier J., Doré C., Lepage P., Ge B., et al. (2000). ARSACS, a spastic ataxia common in northeastern Quebec, is caused by mutations in a new gene encoding an 11.5-kb ORF. Nat. Genet. 24, 120–125. doi: 10.1038/72769
Feng C. Y., Rise M. L. (2011). Identification and molecular cloning of Atlantic cod (Gadus morhua) activating transcription factor 3 (ATF3) transcript and its induction in spleen following intraperitoneal polyriboinosinic polyribocytidylic acid injection. Fish Shellfish Immunol. 31, 475–481. doi: 10.1016/j.fsi.2011.06.002
Fuller Z. L., Mocellin V. J. L., Morris L. A., Cantin N., Shepherd J., Sarre L., et al. (2020). Population genetics of the coral Acropora millepora: toward genomic prediction of bleaching. Science 369, 268. doi: 10.1126/science.aba4674
Gao L., Li A., Lv Y., Huang M., Liu X., Deng H., et al. (2021). Planarian gamma-interferon-inducible lysosomal thiol reductase (GILT) is required for gram-negative bacterial clearance. Dev. Comp. Immunol. 116, 103914. doi: 10.1016/j.dci.2020.103914
Gupta S., Yano J., Mercier V., Htwe H. H., Shin H. R., Rademaker G., et al. (2021). Lysosomal retargeting of myoferlin mitigates membrane stress to enable pancreatic cancer growth. Nat. Cell Biol. 23, 232–242. doi: 10.1038/s41556-021-00644-7
Haas B. J., Papanicolaou A., Yassour M., Grabherr M., Blood P. D., Bowden J., et al. (2013). De novo transcript sequence reconstruction from RNA-seq using the trinity platform for reference generation and analysis. Nat. Protoc. 8, 1494–1512. doi: 10.1038/nprot.2013.084
Hall J. R., Lehnert S. J., Gonzalez E., Kumar S., Hanlon J. M., Morris C. J., et al. (2021). Snow crab (Chionoecetes opilio) hepatopancreas transcriptome: identification and testing of candidate molecular biomarkers of seismic survey impact. Fish. Res. 234, 105794. doi: 10.1016/j.fishres.2020.105794
Hawkins A. D., Pembrok e., Popper A. N. (2015). Information gaps in understanding the effects of noise on fishes and invertebrates. Rev. Fish Biol. Fish. 25, 39–64. doi: 10.1007/s11160-014-9369-3
Hernández-Aguirre L. E., Fuentes-Sidas Y. I., Rivera-Rangel L. R., Gutiérrez-Méndez N., Yepiz-Plascencia G., Chávez-Flores D., et al. (2022). cDNA characterization and expression of selenium-dependent CqGPx3 isoforms in the crayfish Cherax quadricarinatus under high temperature and hypoxia. Genes 13, 179. doi: 10.3390/genes13020179
Hildebrand J. A. (2009). Anthropogenic and natural sources of ambient noise in the ocean. Mar. Ecol. Prog. Ser. 395, 5–20. doi: 10.3354/meps08353
Hirst A. G., Rodhouse P. G. (2000). Impacts of geophysical seismic surveying on fishing success. Rev. Fish Biol. Fish. 10, 113–118. doi: 10.1023/A:1008987014736
Hlaing S. M. M., Lou J., Cheng J., Xun X., Li M., Lu W., et al. (2021). Tissue-biased and species-specific regulation of glutathione peroxidase (GPx) genes in scallops exposed to toxic dinoflagellates. Toxins 13, 21. doi: 10.3390/toxins13010021
Holliday D. V., Piper R. E., Clarke M. E., Greenlaw C. F. (1987). “The effects of airgun energy release on the eggs, larvae, and adults of the northern anchovy (Engraulis mordax),” in Tracer applied sciences (Washington, DC: American Petroleum Institute).
Huang W., Duan L., Huang B., Zhou L., Liang Y., Tu C., et al. (2015). Identification of three IFN-γ inducible lysosomal thiol reductase (GILT)-like genes in mud crab Scylla paramamosain with distinct gene organizations and patterns of expression. Gene 570, 78–88. doi: 10.1016/j.gene.2015.06.006
Iwanaga S., Miyata T., Tokunaga F., Muta T. (1992). Molecular mechanism of hemolymph clotting system in Limulus. Thromb. Res. 68, 1–32. doi: 10.1016/0049-3848(92)90124-s
Kight C. R., Swaddle J. P. (2011). How and why environmental noise impacts animals: an integrative, mechanistic review. Ecol. Lett. 14, 1052–1061. doi: 10.1111/j.1461-0248.2011.01664.x
Koressaar T., Remm M. (2007). Enhancements and modifications of primer design program Primer3. Bioinformatics 23, 1289–1291. doi: 10.1093/bioinformatics/btm091
Krishnan J., Persons J. L., Peuß R., Hassan H., Kenzior A., Xiong S., et al. (2020). Comparative transcriptome analysis of wild and lab populations of Astyanax mexicanus uncovers differential effects of environment and morphotype on gene expression. J. Exp. Zool. B: Mol. Dev. Evol. 334, 530–539. doi: 10.1002/jez.b.22933
Ku H., Cheng C. (2020). Master regulator activating transcription factor 3 (ATF3) in metabolic homeostasis and cancer. Front. Endocrinol. 11. doi: 10.3389/fendo.2020.00556
Li X., Cui Z., Liu Y., Song C., Shi G. (2013). Transcriptome analysis and discovery of genes involved in immune pathways from hepatopancreas of microbial challenged mitten crab Eriocheir sinensis. PLoS One 8, e68233. doi: 10.1371/journal.pone.0068233
Li E., Wang S., Li C., Wang X., Chen K., Chen L. (2014). Transcriptome sequencing revealed the genes and pathways involved in salinity stress of Chinese mitten crab, Eriocheir sinensis. Physiol. Genomics 46, 177–190. doi: 10.1152/physiolgenomics.00191.2013
Liu M., Liu L., Abbas M. N., Kausar S., Zhang J., Ye Z., et al. (2019). Involvement of gamma interferon inducible lysosomal thiol reductase in the innate immune responses of red swamp crayfish, Procambarus clarkii. Dev. Comp. Immunol. 99, 103405. doi: 10.1016/j.dci.2019.103405
Love M. I., Huber W., Anders S. (2014). Moderated estimation of fold change and dispersion for RNA-seq data with DESeq2. Genome Biol. 15, 550. doi: 10.1186/s13059-014-0550-8
Lv J., Lu X., Ti X., Liu P., Li J., Li J. (2020). QTL mapping and marker identification for sex determination in the ridgetail white prawn, Exopalaemon carinicauda. Genomics 112, 5340–5247. doi: 10.1016/j.ygeno.2020.09.037
Majdoul S., Compton A. A. (2022). Lessons in self-defence: inhibition of virus entry by intrinsic immunity. Nat. Rev. Immunol. 22, 339. doi: 10.1038/s41577-021-00626-8
Mayfield A. B., Chen Y., Lu C., Chen C. (2018). The proteomic response of the reef coral Pocillopora acuta to experimentally elevated temperatures. PLoS One 13, e0192001. doi: 10.1371/journal.pone.0192001
McCauley R. D. (1994). Seismic surveys,” in environmental implications of offshore oil and gas development in Australia – the findings of an independent scientific review. Eds. Swan J. M., Neff J. M., Young P. C. (Sydney: Australian Petroleum Exploration Association), 19–122.
Milon B., Shulman E. D., So K. S., Cederroth C. R., Lipford E. L., Sperber M., et al. (2021). A cell-type-specific atlas of the inner ear transcriptional response to acoustic trauma. Cell Rep. 36, 109758. doi: 10.1016/j.celrep.2021.109758
Miyatake Y., Yamano T., Hanayama R. (2018). Myoferlin-mediated lysosomal exocytosis regulates cytotoxicity by phagocytes. J. Immunol. 201, 3051–3057. doi: 10.4049/jimmunol.1800268
Morris C. J., Cote D., Martin B., Kehler D. (2018). Effects of 2D seismic on the snow crab fishery. Fish. Res. 197, 67–77. doi: 10.1016/j.fishres.2017.09.012
Morris C. J., Cote D., Martin S. B., Mullowney D. (2020). Effects of 3D seismic surveying on snow crab fishery. Fish. Res. 232, 105719. doi: 10.1016/j.fishres.2020.105719
Morris C. J., Cote D., Martin B., Saunders-Lee R., Rise M., Hanlon J., et al. (2021). “An assessment of the potential risks of seismic surveys to affect snow crab resources,” in Environmental studies research fund report no. 220(St. John’s, NL), 92. Available at: https://www.esrfunds.org/sites/www.esrfunds.org/files/publications/ESRF220_Morris%20et%20al.pdf.
Mullowney D., Coffey W., Baker K., Evans G., Fiander D., Colbourne E., et al. (2018). An assessment of Newfoundland and Labrador snow crab (Chionoecetes opilio) in 2016. DFO Can. Sci. Advis. Sec. Res. Doc. 2017/081, viii + 172.
Münzel T., Daiber A., Steven S., Tran L. P., Ullmann E., Kossmann S., et al. (2017). Effects of noise on vascular function, oxidative stress, and inflammation: mechanistic insight from studies in mice. Eur. Heart J. 38, 2838–2849. doi: 10.1093/eurheartj/ehx081
Muta T., Oda T., Iwanaga S. (1993). Horseshoe crab coagulation factor b. a unique serine protease zymogen activated by cleavage of an ile-ile bond. J. Biol. Chem. 268, 21384–21388. doi: 10.1016/S0021-9258(19)36934-0
Naef V., Marchese M., Ogi A., Fichi G., Galatolo D., Licitra R., et al. (2021). Efficient neuroprotective rescue of sacsin-related disease phenotypes in zebrafish. Int. J. Mol. Sci. 22, 8401. doi: 10.3390/ijms22168401
Nakamura T., Horiuchi T., Morita T., Iwanaga S. (1986). Purification and properties of intracellular clotting factor, factor b, from horseshoe crab (Tachypleus tridentatus) hemocytes. J. Biochem. 99, 847–857. doi: 10.1093/oxfordjournals.jbchem.a135545
Nan X., Zhao K., Qin Y., Song Y., Guo Y., Luo Z., et al. (2022). Antibacterial responses and functional characterization of the interferon gamma inducible lysosomal thiol reductase (GILT) protein in Chinese mitten crab (Eriocheir sinensis). Dev. Comp. Immunol. 136, 104514. doi: 10.1016/j.dci.2022.104514
Nowacek D. P., Clark C. W., Mann D., Miller P. J., Rosenbaum H. C., Golden J. S., et al. (2015). Marine seismic surveys and ocean noise: time for coordinated and prudent planning. Front. Ecol. Environment 13, 378–386. doi: 10.1890/130286
Nozato Y., Takami Y., Yamamoto K., Nagasawa M., Nozato S., Imaizumi Y., et al. (2020). Novel properties of myoferlin in glucose metabolism via pathways involving modulation of adipose functions. FASEB J. 34, 2792–2811. doi: 10.1096/fj.201901539RR
Ohsako T., Horiuchi T., Matsuo T., Komaya S., Aigaki T. (2003). Drosophila lola encodes a family of BTB-transcription regulators with highly variable c-terminal domains containing zinc finger motifs. Gene 311, 59–69. doi: 10.1016/s0378-1119(03)00554-7
Oliveira-dos-Santos A. J., Matsumoto G., Snow B. E., Bai D., Houston F. P., Whishaw I. Q., et al. (2000). Regulation of T cell activation, anxiety, and male aggression by RGS2. Proc. Natl. Acad. Sci. U.S.A. 97, 12272–12277. doi: 10.1073/pnas.220414397
Oomen R. A., Hutchings J. A. (2017). Transcriptomic responses to environmental change in fishes: insights from RNA sequencing. Facets 2, 610–641. doi: 10.1139/facets-2017-0015
Pakos-Zebrucka K., Koryga I., Mnich K., Ljujic M., Samali A., Gorman A. M. (2016). The integrated stress response. EMBO Rep. 17, 1374–1395. doi: 10.15252/embr.201642195
Payne J. F., Andrews C. D., Hanlon J., Lawson J., Mathieu A., Wadsworth B., et al. (2015). “Effects of seismic air gun sounds on lobster (Homarus americanus): pilot laboratory studies with (a) a recorded track from a seismic survey and (b) airgun pulse exposure over 5 days,” in Environmental Studies Research Fund. Government of Canada. Report 197. 38.
Pfaffl M. W. (2001). A new mathematical model for relative quantification in real-time RT-PCR. Nucleic Acids Res. 29, e45. doi: 10.1093/nar/29.9.e45
Przeslawski R., Huang Z., Anderson J., Carroll A. G., Edmunds M., Hurt L., et al. (2018). Multiple field-based methods to assess the potential impacts of seismic surveys on scallops. Mar. pollut. Bull. 129, 750–761. doi: 10.1016/j.marpolbul.2017.10.066
Puebla O., Sévigny J. M., Sainte-Marie B., Brêthes J. C., Burmeister A., Dawe E. G., et al. (2008). Population genetic structure of the snow crab (Chionoecetes opilio) at the Northwest Atlantic scale. Can. J. Fish. Aquat. Sci. 65, 425–436. doi: 10.1139/F07-163
Qyli M., Aliko V., Faggio C. (2020). Physiological and biochemical responses of Mediterranean green crab, Carcinus aestuarii, to different environmental stressors: evaluation of hemocyte toxicity and its possible effects on immune response. Comp. Biochem. Physiol. C Toxicol. Pharmacol. 231, 108739. doi: 10.1016/j.cbpc.2020.108739
Ratajczak M. Z., Ratajczak J. (2020). Extracellular microvesicles/exosomes: discovery, disbelief, acceptance, and the future? Leukemia 34, 3126–3135. doi: 10.1038/s41375-020-01041-z
Rausch M. P., Hastings K. T. (2015). Diverse cellular and organismal functions of the lysosomal thiol reductase GILT. Mol. Immunol. 68, 124–128. doi: 10.1016/j.molimm.2015.06.008
Rise M. L., Hall J. R., Alcock B. P., Hori T. S. (2012). Dynamic expression profiles of virus-responsive and putative antimicrobial peptide-encoding transcripts during Atlantic cod (Gadus morhua) embryonic and early larval development. Gene 509, 232–246. doi: 10.1016/j.gene.2012.08.017
Rise M. L., Hall J. R., Rise M., Hori T. S., Browne M. J., Gamperl A. K., et al. (2010). Impact of asymptomatic nodavirus carrier state and intraperitoneal viral mimic injection on brain transcript expression in Atlantic cod (Gadus morhua). Physiol. Genomics 42, 266–280. doi: 10.1152/physiolgenomics.00168.2009
Rosenberger C. M., Clark A. E., Treuting P. M., Johnson C. D., Aderem A. (2008). ATF3 regulates MCMV infection in mice by modulating IFN-γ expression in natural killer cells. Proc. Natl. Acad. Sci. U.S.A. 105, 2544–2549. doi: 10.1073/pnas.0712182105
Sarmiento M. E., Chin K. L., Lau N. S., Aziah I., Ismail N., Norazmi M. N., et al. (2021). Comparative transcriptome profiling of horseshoe crab Tachypleus gigas hemocytes in response to lipopolysaccharides. Fish Shellfish Immunol. 115, 148–156. doi: 10.1016/j.fsi.2021.08.001
Sato K., Ito H., Yokoyama A., Toba G., Yamamoto D. (2019). Partial proteasomal degradation of Lola triggers the male-to-female switch of a dimorphic courtship circuit. Nat. Commun. 10, 166. doi: 10.1038/s41467-018-08146-1
Schmidt D. D., Baldwin I. T. (2006). Transcriptional responses of Solanum nigrum to methyl jasmonate and competition: a glasshouse and field study. Funct. Ecol. 20, 500–508. doi: 10.1111/j.1365-2435.2006.01122.x
Shi G., McQuibban G. A. (2017). The mitochondrial rhomboid protease PARL is regulated by PDK2 to integrate mitochondrial quality control and metabolism. Cell Rep. 18, 1458–1472. doi: 10.1016/j.celrep.2017.01.029
Sun M., Li Y. T., Liu Y., Lee S. C., Wang L. (2016). Transcriptome assembly and expression profiling of molecular responses to cadmium toxicity in hepatopancreas of the freshwater crab Sinopotamon henanense. Sci. Rep. 6, 19405. doi: 10.1038/srep19405
Takahashi-Kariyanzono S., Terai Y. (2021). Two divergent haplogroups of a sacsin-like gene in acropora corals. Sci. Rep. 11, 23018. doi: 10.1038/s41598-021-02386-w
Tanoue T., Atarashi K., Honda K. (2016). Development and maintenance of intestinal regulatory T cells. Nat. Rev. Immunol. 16, 295–309. doi: 10.1038/nri.2016.36
Thipwong J., Saelim H., Panrat T., Phongdara A. (2019). Penaeus monodon GILT enzyme restricts WSSV infectivity by reducing disulfide bonds in WSSV proteins. Dis. Aquat. Organ. 135, 59–70. doi: 10.3354/dao03377
Untergasser A., Cutcutache I., Koressaar T., Ye J., Faircloth B. C., Remm M., et al. (2012). Primer3 - new capabilities and interfaces. Nucleic Acids Res. 40, e115. doi: 10.1093/nar/gks596
Vandesompele J., De Preter K., Pattyn F., Poppe B., Van Roy N., De Paepe A., et al. (2002). Accurate normalization of real-time quantitative RT-PCR data by geometric averaging of multiple internal control genes. Genome Biol. 3, RESEARCH0034. doi: 10.1186/gb-2002-3-7-research0034
Verrier E. R., Langevin C., Benmansour A., Boudinot P. (2011). Early antiviral response and virus-induced genes in fish. Dev. Comp. Immunol. 35, 1204–1214. doi: 10.1016/j.dci.2011.03.012
Vogt G. (1994). Life-cycle and functional cytology of the hepatopancreatic cells of Astacus astacus (Crustacea, decapoda). Zoomorphology 114, 83–101. doi: 10.1007/BF00396642
Vu V. Q. (2011). Ggbiplot: A ggplot2 based biplot. R package version 0.55. https://github.com/vqv/ggbiplot
Wang C., Chidiac P. (2019). RGS2 promotes the translation of stress-associated proteins ATF4 and CHOP via its eIF2B-inhibitory domain. Cell. Signal. 59, 163–170. doi: 10.1016/j.cellsig.2019.02.007
Wang X., Huang Z., Wang C., Qi C., Gu Z., Li E., et al. (2020). A comparative study on growth and metabolism of Eriocheir sinensis juveniles under chronically low and high pH stress. Front. Physiol. 11. doi: 10.3389/fphys.2020.00885
Wang W. S., Liu X. H., Liu L. X., Lou W. H., Jin D. Y., Yang P. Y., et al. (2013). iTRAQ-based quantitative proteomics reveals myoferlin as a novel prognostic predictor in pancreatic adenocarcinoma. J. Proteomics 91, 453–465. doi: 10.1016/j.jprot.2013.06.032
Wang E. S., Verano A. L., Nowak R. P., Yuan J. C., Donovan K. A., Eleuteri N. A., et al. (2021). Acute pharmacological degradation of Helios destabilizes regulatory T cells. Nat. Chem. Biol. 17, 711–717. doi: 10.1038/s41589-021-00802-w
Wellband K. W., Heath J. W., Heath D. D. (2018). Environmental and genetic determinants of transcriptional plasticity in Chinook salmon. Heredity 120, 38–50. doi: 10.1038/s41437-017-0009-2
Workenhe S. T., Hori T. S., Rise M. L., Kibenge M. J. T., Kibenge F. S. B. (2009). Infectious salmon anaemia virus (ISAV) isolates induce distinct gene expression responses in the Atlantic salmon (Salmo salar) macrophage/dendritic-like cell line TO, assessed using genomic techniques. Mol. Immunol. 46, 2955–2974. doi: 10.1016/j.molimm.2009.06.015
Xu Y., Miao Z., Li X., Lin H., Cheng Y., Pan J., et al. (2021). Hypoxia-reoxygenation stress modulates the hepatopancreas transcriptome of Chinese mitten crab Eriocheir sinensis. Gene 771, 145361. doi: 10.1016/j.gene.2020.145361
Yamagishi M. (2022). The role of epigenetics in T-cell lymphoma. Int. J. Hematol. 116, 828–836. doi: 10.1007/s12185-022-03470-1
You X., Liu L., Li X., Du H., Nie D., Zhang X., et al. (2018). Immune response of interferon-γ-inducible lysosomal thiol reductase (GILT) from Chinese sturgeon (Acipenser sinensis) to microbial invasion and its antioxidative activity in lipopolysaccharides-treated mammalian dentritic cells. Fish Shellfish Immunol. 72, 356–366. doi: 10.1016/j.fsi.2017.11.014
Zhang A., Zou T., Guo D., Wang Q., Shen Y., Hu H., et al. (2021). The immune system can hear noise. Front. Immunol. 11. doi: 10.3389/fimmu.2020.619189
Zhao T., Xiao Y., Huang B., Ran M. J., Duan X., Wang Y. F., et al. (2022). A dual role of lola in Drosophila ovary development: regulating stem cell niche establishment and repressing apoptosis. Cell Death Dis. 13, 756. doi: 10.1038/s41419-022-05195-9
Zhou Y., Dahms H., Dong F., Jing W., Wang L. (2016). Immune-associated parameters and antioxidative responses to cadmium in the freshwater crab Sinopotamon henanense. Ecotoxicol. Environ. Saf. 129, 235–241. doi: 10.1016/j.ecoenv.2016.03.040
Keywords: snow crab (Chionoecetes opilio), chronic noise exposure, transcriptomics (RNA sequencing), gene expression, real-time quantitative polymerase chain reaction (qPCR)
Citation: Hall JR, Lehnert SJ, Gonzalez E, Hanlon JM, Kumar S, Morris CJ and Rise ML (2023) Snow crab (Chionoecetes opilio) hemocytes and hepatopancreas transcriptomes: identification, validation, and application of immune-relevant biomarkers of exposure to noise. Front. Mar. Sci. 10:1198036. doi: 10.3389/fmars.2023.1198036
Received: 31 March 2023; Accepted: 02 June 2023;
Published: 28 June 2023.
Edited by:
Ciro Rico, Spanish National Research Council (CSIC), SpainReviewed by:
Qiu-Ning Liu, Yancheng Teachers University, ChinaCopyright © 2023 Hall, Lehnert, Gonzalez, Hanlon, Kumar, Morris and Rise. This is an open-access article distributed under the terms of the Creative Commons Attribution License (CC BY). The use, distribution or reproduction in other forums is permitted, provided the original author(s) and the copyright owner(s) are credited and that the original publication in this journal is cited, in accordance with accepted academic practice. No use, distribution or reproduction is permitted which does not comply with these terms.
*Correspondence: Jennifer R. Hall, anJoYWxsQG11bi5jYQ==
†These authors have contributed equally to this work
Disclaimer: All claims expressed in this article are solely those of the authors and do not necessarily represent those of their affiliated organizations, or those of the publisher, the editors and the reviewers. Any product that may be evaluated in this article or claim that may be made by its manufacturer is not guaranteed or endorsed by the publisher.
Research integrity at Frontiers
Learn more about the work of our research integrity team to safeguard the quality of each article we publish.