- 1National Institute of Water and Atmospheric Research Ltd, Auckland, New Zealand
- 2National Institute of Water and Atmospheric Research Ltd, Hamilton, New Zealand
- 3National Institute of Water and Atmospheric Research Ltd, Christchurch, New Zealand
This study develops a novel approach to forecasting anomalies of meat yield from mussel aquaculture in Pelorus Sound, New Zealand, based on the relationships between non-local sea surface temperature (SST) and observations of mussel meat yield over 13 years. Overall, we found strong associations between lagged SSTs in the Tasman Sea region and mussel meat yield, with a noticeable seasonal cycle in these relationships. Results also showed that oceanic variables such as SST correlate more strongly with mussel meat yield than atmospheric variables, such as surface wind and other indices of atmospheric flow. The relationship between SST and mussel meat yield is linked to patterns of surface wind anomalies along the west coast of New Zealand. We identified regions where the SST was most correlated with mussel meat yield anomalies for each season and derived empirical relationships from linear regression. We then applied these empirical relationships to seasonal forecasts of SST from the European Centre for Medium-Range Weather Forecasts to generate seasonal forecasts of mussel meat yield. By validating our mussel meat yield forecasts from 13 years of retrospective forecasts, we find significant skill at lead times of up to 3 months in December–February and 5 months in September–November. During March-August forecasts are only skillful at a lead-time of 1 month. The results of this study have the potential to improve the accuracy and reliability of mussel meat yield forecasts and to provide valuable insights for the mussel industry.
1 Introduction
Mussel aquaculture contributes significantly to the New Zealand (NZ) economy, with an annual production of around 80,000 metric tons (Aquaculture New Zealand, 2022), generating over $204 million NZD annually and employing approximately 2,500 people. Research in Pelorus Sound (South Island, NZ: Figure 1) has shown that mussel aquaculture yields are driven by the supply of suspended seston (particulate organic materials, including algae, detritus, and bacteria) as its source of nutrition (Zeldis et al., 2008) and that the abundance and variability of suspended seston affects mussel farming and aquaculture operations. Accurate forecasts of seston or mussel production can therefore help mussel farmers plan, allowing them to make informed decisions about aspects such as when to harvest, how much to gather, and where to harvest (Zeldis et al., 2013).
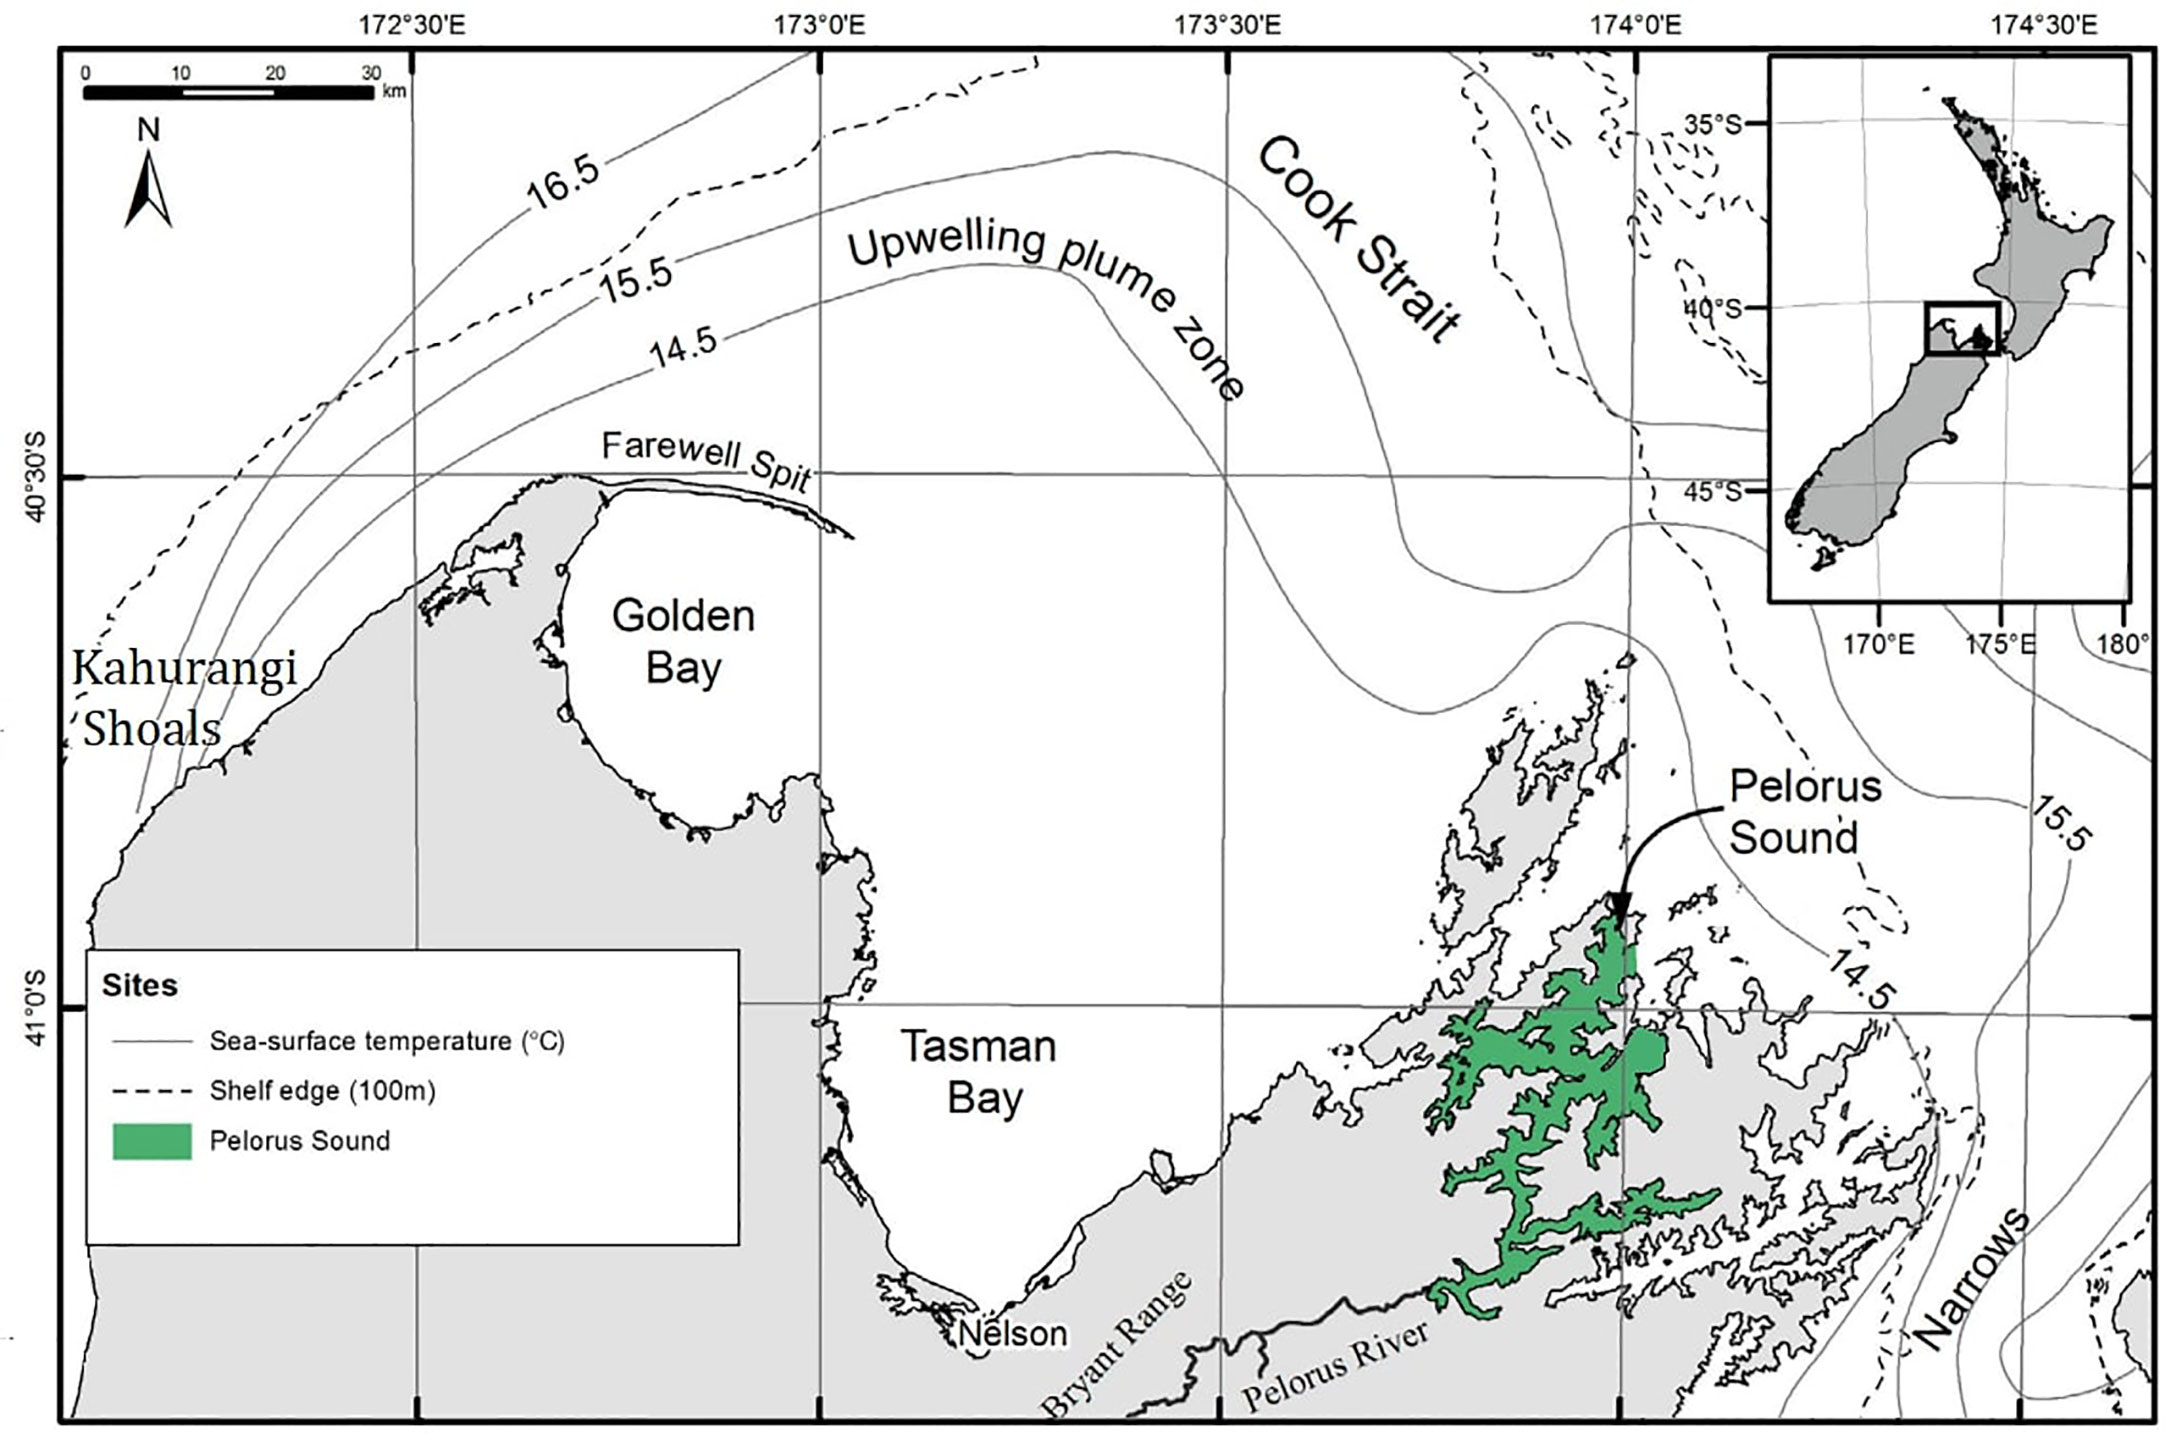
Figure 1 The location of Pelorus Sound in New Zealand, adapted from Zeldis et al. (2013). The contours illustrated the annual mean sea surface temperature in the region. The dashed lines highlight the shelf edge where the ocean depth exceeds 100 m. The filled green area highlights the Pelorus Sound region, for which mussel meat yield is predicted.
Climatic and oceanographic variables or indicators have been used internationally to predict quantities that are associated with aquaculture production (Taboada et al., 2019; Gómara et al., 2021) and are skillful at seasonal timescales (Hobday et al., 2016; Mills et al., 2017; Tommasi et al., 2017; de Burgh-Day et al., 2019; Jacox et al., 2020; de Burgh-Day et al., 2022). In Pelorus Sound, climatic and oceanographic variables were used to predict mussel meat yields (Zeldis et al., 2008; Zeldis et al., 2013). They used multiple regression analysis to show that yields were most strongly associated with the abundance of seston and the oceanographic variables which drive seston abundance. They revealed seasonal variation in the relationships: during the austral summer half-year (October – March), the key mechanism for increased seston (and nitrate supply underpinning its production) in Pelorus Sound is the combination of westerly winds, cooler SSTs, and upwelling. Upwelling occurs off the northwest coast of the NZ South Island adjacent to Cook Strait (Figure 1) and the entrance to Pelorus Sound, which brings nitrate-rich water to the vicinity of the Sound entrance (Zeldis et al., 2013; Chiswell et al., 2017), and stimulates seston production within the sound. While this injection of nutrient-rich upwelled water occurs all year round, it has its greatest influence on seston production during the summer half-year (Bradford et al., 1987; Zeldis et al., 2013). In the winter half-year (April – September), the water column at the entrance is entirely vertically mixed (Harris, 1990; Zeldis et al., 2013) such that local upwelling-favorable winds exert little influence on surface water composition, including its heat content and nutrient content (Zeldis et al., 2013). In the winter half-year, Zeldis et al. (2013) found that nitrate levels in the Pelorus Sound were correlated with its river flows, with influence on seston concentrations. In winter, anomalies in mussel meat yield and seston negatively correlated with 2-month lagged sea surface temperature and positively correlated with river flow.
Here, we aim to further develop the climatic relationships and drivers of mussel meat yield in Pelorus Sound. Unlike the earlier work (Zeldis et al., 2013) long-range forecasts are made by exploiting General Circulation Models (GCMs), to provide state-of-the-art forecasts of a wide variety of variables (e.g., sea surface temperature) on daily to seasonal timescales (Johnson et al., 2019). GCMs consist of complex physical equations, representing processes and interactions on the land, ocean, and atmosphere (Wilby & Wigley, 1997). One commonly used method to obtain forecasts of a variable that is not directly simulated in GCMs (e.g., mussel meat yield) involves analyzing historical data to identify patterns and trends that can be linked to outputs of a GCM (e.g., sea surface temperature or other prognostic fields such as surface winds) to predict historical conditions of that variable (Glahn & Lowry, 1972). For example, one could train a model to predict historical mussel meat yield based on historical SST and historic time series of yield. Once this model has been trained, it can be applied to the outputs of a GCM – which provides forecasts of SST at seasonal timescales, and thus can also provide forecasts of mussel meat yield.
The study by Zeldis et al. (2013) established empirical relationships between Pelorus Sound mussel meat yields observed between 1997 – 2005 and environmental predictor variables, including the El Niño Southern Oscillation (ENSO), wind stress, SST, and river flow using a stepwise multiple linear regression model. While the regression models enabled understanding of the environmental drivers of mussel meat yield (Zeldis et al., 2013), during the summer half-year, they explained 30% of the variance in mussel meat yield from environmental variables and only 20% for the winter-half year. The empirical relationships were then applied to the outputs of seasonal forecast models that provided forecasts of the environmental predictor variables on time horizons of 1–5 months. The statistical downscaling approach by Zeldis et al. (2013) had several limitations. Firstly, the empirical relationships only explained a small portion of the variance during the winter season, and thus when applied to seasonal forecasts their skill was further degraded (as seasonal forecasts are not perfectly like observations). This meant that the authors felt the regression models only provided useful predictive power for the summer half-year (Zeldis et al., 2013). Secondly, the regression model requires predictors such as wind speed and river flow, which are hard to predict accurately on seasonal timescales (Johnson et al., 2019). Lastly, the short training period of data (1997–2005) meant that there was considerable uncertainty about whether these “learned” relationships were robust and applicable to future periods.
Our approach aims to overcome some of these issues. We also fit regression models between observed mussel meat yield and environmental variables but use a larger range of environmental predictor variables. We also investigate the role of lagged relationships in environmental predictor variables, and non-local predictor variables or teleconnections - where teleconnections are defined as non-local external influences (e.g., ENSO). Zeldis et al. (2013) did not explicitly analyze the role of lags in the SST response, or non-local SST (whether SSTs from another location such as near Australia can be correlated with mussel meat yield variability) and whether there are specific weather and oceanic patterns that precede months where mussel meat yield is poor relative to normal. Lags in climate variables such as SST have been suggested to influence aquaculture productivity through ENSO teleconnections, and can be exploited for prediction at seasonal timescales (Zeldis et al., 2013; Gómara et al., 2021). We investigate a wider range of environmental predictor variables, including complex variables such as upper level winds.
Another key advance of our work is that it uses validation on an independent temporal period because learned relationships over one period (e.g., 1997-2005) may not extrapolate well to another period (e.g., 2015–2019, the next period that mussel meat yield data were made available), and our approach focuses on extrapolation. Additionally, we describe how we have operationalized our model in a forecasting context, and we provide a description of model skill, where we validate the performance of our model on over a decade of model hindcasts (retrospective forecasts).
2 Data and methods
2.1 Environmental setting and study approach
Pelorus Sound is a drowned valley estuary at the north end of NZ’s South Island (Te Wai Pounamu), with a length of 56 km and an average depth of 40 m (Figure 1). The sound has relatively complex dynamics, as it is fed both by the Pelorus River and estuarine exchanges with the Cook Strait (Bradford et al., 1987; Gibbs, 1993; Zeldis et al., 2008). The river flow rates are highly seasonal due to rainfall variability, which modulates the concentrations of nutrients and vertical density stratification within the sound. Oceanic effects are also seasonal, with a large seasonal amplitude in SST. Changes in atmospheric circulation also induce significant upwelling of nutrient-rich waters at the northwest South Island (near the Kahurangi Shoals: Figure 1), which are advected toward the sound entrance (Chiswell et al., 2017).
This study was approached in two phases:
1. Exploration of relationships between environmental variables and mussel meat yield through examining lagged correlations and identifying spatial locations that most strongly influence mussel meat yield anomalies.
2. Development of a regression model that uses the relationships established in (1) to apply to the outputs of GCMs to provide a 1–6 month forecast of mussel meat yield anomaly.
2.2 Datasets
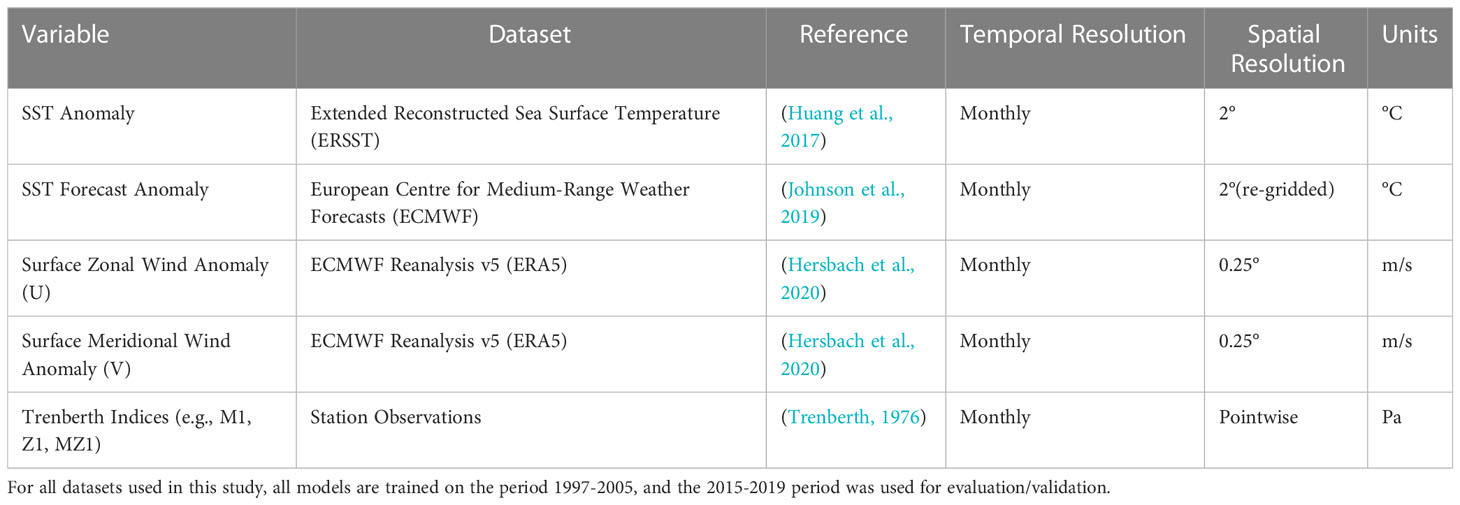
Our regression analyses predict mussel meat yield anomalies obtained as per capita meat yield of mussels obtained from yield monitoring by Sealord Shellfisheries for 11,378 mussel farm long-lines throughout Pelorus Sound from July 1997 until November 2005 (the end of their data availability). The monitoring obtained a sample of 20 mussels from each line which were wet-weighed whole (including shell), then cooked, shelled and the meat re-weighed, on board the harvesting vessel. The yield was then expressed as a percentage, i.e., (100 × cooked flesh wet weight/whole wet weight) (Zeldis et al., 2008). Additional mussel meat yield data (used for validation of our forecast model) were obtained between 2015–2019, with mussels sampled once every two months from Pelorus Sound mussel farms during a NIWA research program and processed identically to the earlier sampling. Therefore, our datasets consisted of two periods (1997–2005 and 2015–2019) separated by 10 years, that provided an opportunity to test whether “learned” relationships from 1997–2005 sufficiently extrapolated to the period 2015–2019. To identify suitable predictors for mussel meat yield, we used several datasets (Table 1). We focused on using a combination of oceanic (e.g., SST) and atmospheric (e.g., surface wind) predictors for mussel meat yield anomaly (see section Calculating Anomalies).
We used the Extended Reconstructed Sea Surface Temperature (ERSST) to establish relationships between SST observations and mussel meat yield. The ERSST dataset is a global monthly analysis of SST derived from the International Comprehensive Ocean–Atmosphere Dataset (ICOADS), which combines SST observations from Argo floats and satellite data. The dataset is widely used for the global monthly analysis of SST trends, at a spatial resolution of 2° (Huang et al., 2017). The ERSST data used in this study is a subset around NZ and Australia, with an extent of 60°S – 20°S latitude and 140°E – 180°E longitude.
While higher spatial resolution SST datasets exist, we only used large-scale SSTs to predict mussel meat yield anomalies. There are two main reasons for this. Firstly, GCMs, which provide seasonal forecasts of SST, typically have resolutions on the order of 1° by 1° (~100 km) and thus cannot capture fine-scale variability in ocean temperature. Secondly, we want to ensure that the relationships learned will generalize well from observed SSTs to the GCMs, and through using a coarse-resolution SST dataset we are ensuring that the two datasets are as consistent as possible.
Our analysis also uses surface zonal (west-to-east) and surface meridional (north-to-south) winds from ERA5 – which is the fifth-generation European Centre for Medium-Range Weather Forecasts (ECMWF) reanalysis (Hersbach et al., 2020). ERA5 incorporates an abundance of surface and satellite observations through state-of-the-art modelling and data assimilation systems, providing a 30 km resolution grid with 137 atmospheric layers stretching from the surface up to an altitude of 80 km.
In addition to surface wind observations, we have used Trenberth indices, which are pressure differences from observations from two different stations, to quantify atmospheric flow across NZ (Trenberth, 1976). The “Z” Trenberth indices outline zonal atmospheric flow (west-to-east) across NZ, “M” indices outline meridional flow (north-to-south), and “MZ” corresponds to diagonal flow through NZ. For example, the Z1 index is the pressure difference between Auckland and Christchurch and the M1 index is the pressure difference between Hobart, Australia, and the Chatham Islands, NZ. More information about the construction of these indices is provided in Trenberth (1976).
2.3 Calculating anomalies
Seasonality in meat yield and atmospheric variables was accounted for in the analysis by establishing relationships between anomalies in each quantity from the seasonal cycle. To calculate the anomalies in mussel meat yield, we first computed the climatological average of meat yield of mussels for each given month for the period 1997–2005. Anomalies were then calculated by subtracting the relevant long-term month-of-year average from each observation in the raw time series. A similar methodology was applied to calculate SST and surface wind anomalies, although they were calculated relative to the climatological period 1993–2016. This is a common period of historical re-forecasts for all eight GCMs, which provide ensemble seasonal forecasts of SST via the Copernicus Data Store (CDS) - an open access data portal. In our analysis (not shown), different climatological periods were also tested but had a negligible effect on our model performance.
2.4 Developing relationships between SST and mussel meat yield anomalies
2.4.1 Correlation maps
The environmental predictor variables (both oceanic and atmospheric) and mussel meat yield anomalies were calculated at monthly temporal resolution. Lags in these environmental variables were also considered for up to six months (i.e., to predict mussel meat yield anomalies at month (t), environmental variables were considered from t to t-6). Mussels and other shellfish often respond gradually to changes in environmental variables, and thus they have an integrated response from both climatic and oceanic conditions (Zeldis et al., 2013).
Because of the previously mentioned seasonality in the relationships between environmental variables and mussel meat yield anomalies, we temporally stratified our analysis. However, unlike Zeldis et al. (2013) who stratified their analysis into summer and winter half-years, we considered three-month periods to better resolve potential seasonal variability in the relationships. We correlated the mussel meat yield anomaly series for a given three-month season with the time series of spatial environmental variables (e.g., SST) for each given geographic grid point in ERA5 and ERSST (observations) datasets and for a given lag. This provides a spatial distribution of the correlation coefficient for a variable such as SST for different lags. These correlation coefficients were computed only for the period 1997–2005, and the remaining mussel meat yield observations from 2015–2019 (sampled every two months) were used as an independent test set.
2.4.2 Composite maps
Composite maps are a way of analyzing data that combines information from multiple events that have something in common. Composites can be used to understand the environmental mechanisms that contribute to mussel meat yield by identifying patterns in environmental conditions (e.g., SST, winds) that are associated with higher or lower mussel meat yields. They represent an average response of all the events for an occurrence (e.g., when the yield is below normal) – which can help us understand the environmental drivers of mussel meat yield and complement the correlation analyses.
We create composite maps as a function of the season of the environmental conditions when the monthly mussel meat yield percentage anomaly:
● falls more than 5% below the mean climatological value for the time of year.
● climbs more than 5% above the mean climatological value for the time of year.
The thresholds above are presented as percentage deviations from the climatology. For example, if the mean mussel meat yield in December – February (DJF) is approximately 25% then a 5% percentage deviation is 1.25%. In the example of examining a composite with 5% higher yield relative to the climatological average for DJF, we would compute the average environmental conditions for all instances in DJF when the yield was greater than 26.25% (25% + 1.25%). If the composites maps computed for DJF showed that above-normal mussel meat yield co-exists with a strong signal of below-normal SSTs in the Tasman Sea, this would indicate that mussel meat yield is sensitive and perhaps linked to SST variability within the Tasman Sea.
We also examined the environmental conditions before such events – to determine if there were patterns of such environmental conditions several months prior. The threshold of 5% was chosen to remove noise and ensure there were sufficiently many samples to produce the composites. Other thresholds including 0 and 10% were also investigated which yielded similar results. In our composite maps, we focused on examining three environmental variables: SST, zonal and meridional surface winds.
2.5 Developing an ensemble forecast system of mussel meat yield
From the correlation maps described above, which determine the strength of the relationship between mussel meat yield and SST, we identified important regions of interest or locations that have the highest magnitude of correlation. For example, if the predictor of mussel meat yield selected for the DJF season were the SSTs near the grid point 45.5°S and 150°E, lagged 3 months, rather than selecting the SST at the grid point of maximum correlation, we averaged the SST anomaly over a 5° buffer in the longitude and latitude directions 43-48°S, 147.5-152.5°E. This averaging helped improve the signal-to-noise ratio. Once this location was determined we trained a simple Ordinary Least Squares (OLS) model to establish relationships between the predictor (e.g., SST averaged around a location) and mussel meat yield anomalies for each season. In total, four models were developed, and each model was able to select a predictor from a different region of interest. We used two independent periods, one for training (1997-2005) and the other for validation (2015-2019). For training, we have a total of 108 monthly observations, or 27 per season. Once the model was trained it was then applied to the outputs of seasonal forecast models.
The seasonal forecasting model or GCM outputs were sourced from the CDS, established under the auspices of the Copernicus Climate Change Service (C3S). The CDS consists of forecast data generated by eight international institutions. These outputs are provided publicly on the 11th day of each month (but are run earlier in the month). Due to the chaotic nature of the atmosphere, each international institution typically runs an ensemble of different forecasts to account for uncertainty. Here, we used the ensemble average of each institution’s seasonal forecast of SST at a monthly temporal resolution, and thus we are left with 8 ensemble-averaged seasonal forecasts – one for each international institution. Hereon, we will refer to these 8 different ensemble-averaged seasonal forecasts from each international institution as the C3S ensemble.
Because the forecasts are only publicly available on the 11th day of the month, a lead-time of 0 months corresponds to forecast for the current month. For example, if the forecast is initialized in January, a forecast for a lead-time of 0 months is a forecast for the month of January itself, and a forecast of a lead-time of 1-month is a forecast issued for February. For some seasons, our regression models (also discussed in Section 3.5) use lagged SSTs to predict mussel meat yield. This means that for some seasons and lead-times, our model may need to use observed SSTs in addition to forecasted SSTs to make a prediction of mussel meat yield. Figure 2B illustrates how observed and forecasted SSTs are ingested into our regression model. For example, let’s take the example of a forecast issued for February (hence the DJF regression model is used) at a lead-time of 1 month (meaning that it is initialized in January). If the DJF regression model used lagged SSTs from 3 months prior, then the forecast issued for February would require SSTs from November. In these instances where the SST observations are available, observations are used instead of previous SST forecasts as they are a more accurate indication of the ocean state. In our analysis, historical observations were used when forecasting months between December-February (incl.).
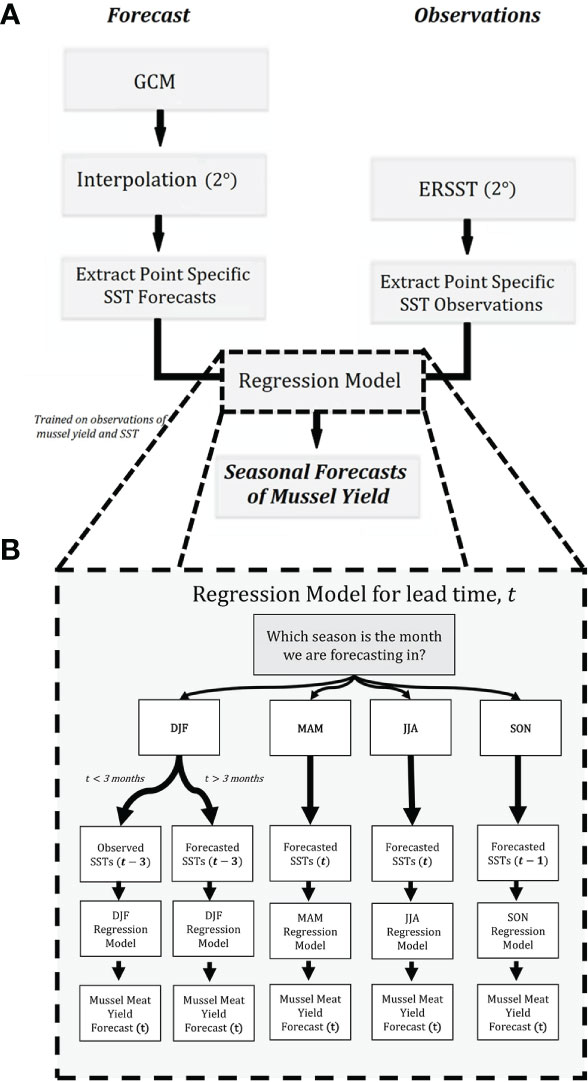
Figure 2 A diagram of the C3S mussel forecasting pipeline. The pipeline consists of two key inputs, observations, and forecast outputs from GCMs. These are post-processed and combined into a single dataset, before being ingested into our regression model (A). (B) shows a detailed account of how the regression is implemented operationally. When forecasting mussel meat yield for a given month, a different regression equation is used for its corresponding season (e.g., DJF model for December). Here, t is the forecast lead time in months, where t ranges from 1 month to 5 months. The mussel app is freely available at: https://shiny.niwa.co.nz/musselforecast/.
A diagram outlining the individual steps required to create a seasonal forecast of mussel meat yield (1-5 months) is illustrated in Figure 2A and summarized below:
● Global monthly SST anomalies (relative to 1993-2016 model hindcast) forecasts for each member of the C3S ensemble (eight GCMs) are downloaded. Note, C3S ensemble member spatial resolution varies from 1.25° to 2.5°.
● All ensemble members of the SST forecast (C3S) are gridded to a common spatial resolution of 2.0°, which is consistent with the resolution of ERSST which the regression models were trained on.
● The SST forecasts (C3S ensemble) and observations (ERSST) lagged up to 3-months before the issued forecast are selected at four locations – each of which is a predictor for mussel meat yield for a given season.
● The regression model is applied to both observations and SST forecasts from C3S – which collectively provides a mussel meat yield forecast at lead times between 1 and 5 months. Note, there are four regression models, where for every forecast lead time a regression model is selected.
Our methodology does not bias correct or calibrate the SST forecasts from C3S, and assumes the forecasts are “pseudo-observations” and that they replicate similar statistics and teleconnections as the observation. These procedures are executed in a web application that predicts mussel meat yield for Pelorus Sound, which is updated once a month on the 11th day (accessible freely at https://shiny.niwa.co.nz/musselforecast/).
2.6 Validation of seasonal forecasts of mussel meat yield
A model hindcast for seasonal forecasts refers to the use of GCMs to make predictions of various meteorological or oceanographic variables, such as SST, for a specified historical period, where the model is run retrospectively. The model hindcast is then compared to actual observations, to obtain a measure of the skill of the model. In our study, we used seasonal hindcasts of SST from the ECMWF model. In total there are 51 ensemble members in the ECMWF seasonal forecast system; in this study we used the ensemble average across all members. The accuracy of the ensemble mean tends to have higher accuracy than each ensemble member (Jacox et al., 2019; Johnson et al., 2019; Jacox et al., 2020). The model hindcasts are provided for the period 1993-2016, which we combined with operational forecasts from the period 2017-2019 to align with the period of the mussel meat yield data. Note, the operational forecasts are not run retrospectively, and are archived forecasts. Here we use the monthly SST anomaly outputs from the hindcast, where we subtract the lead-time dependent climatology of SST over the period 1993-2016 from the forecast for a given location, forecast initialization time, and lead-time. Here, we refer to lead time as the number of leading months that we were making a forecast for. The SST hindcasts were also blended with observations. Then the regression equations were applied to the SST anomaly forecasts (Figure 2: see section 2.3). In section 2.5, we used the 2015-2019 period exclusively for validation. However, here we are applying our regression model to SST outputs from the ECMWF GCM, which is an independent dataset from which the model is trained. Thus, we evaluate the performance of the mussel meat yield forecasts over both the 1997-2005 and 2015-2019 periods for lead-times of 1-5 months. We used two key validation metrics: explained variance and mean absolute percentage error (MAPE).
3 Results
3.1 Climatology of Pelorus Sound
The seasonal cycle of mussel meat yield is strongly correlated with the seasonal cycle of SST whereby lower SSTs tend to correspond to lower mussel meat yields (Figure 3A). The seasonal cycle for surface zonal wind does not strongly align with the seasonal cycle of mussel meat yield; however, the minimum wind speed does approximately coincide with the minimum mussel meat yield (Figure 3B). The seasonal cycle of meat yield is driven by spawning in Pelorus Sound mussels, which occurs in winter and reduces yield (Zeldis et al., 2013). Thus, in subsequent sections, we focus on deviations from the seasonal cycle – or the anomalies.
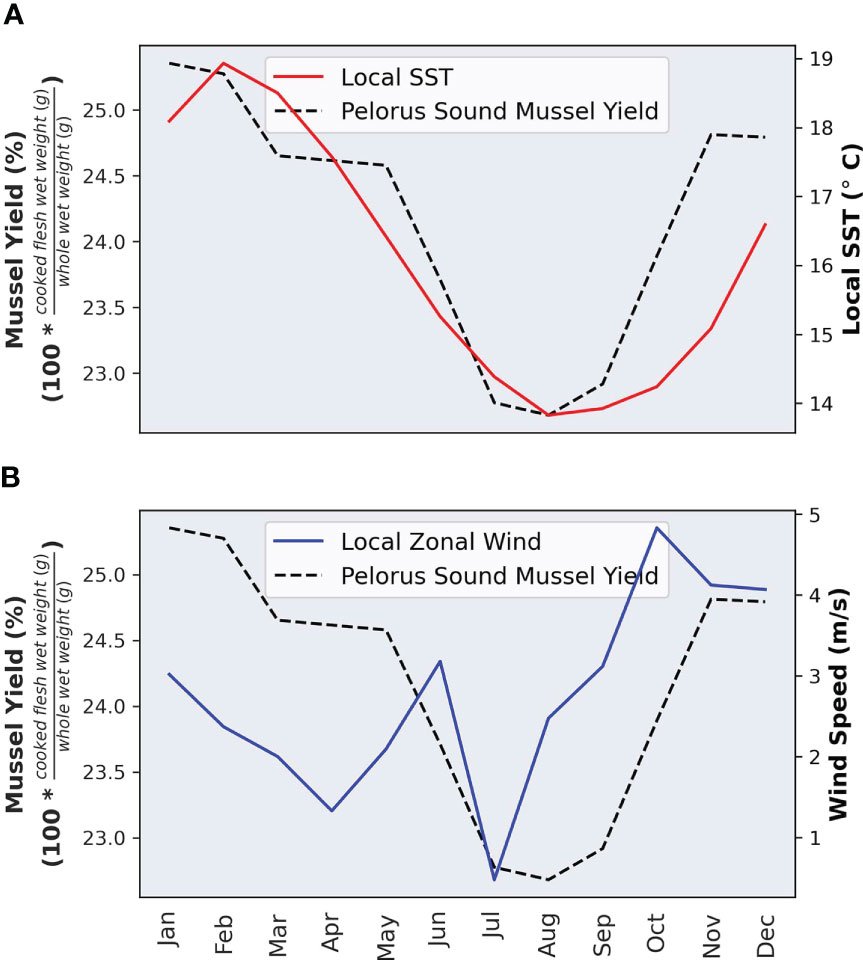
Figure 3 The seasonal cycle of mussel meat yield, sea surface temperature (A) and zonal wind speed. (B) Note, the sea surface temperatures are interpolated from ERSST at 2.0° resolution, and the zonal winds are extracted from ERA5 reanalysis. The seasonal cycle is computed by averaging each variable (e.g. wind speed) for each month over the period 1997-2005.
3.2 The role of atmospheric indicators
While the ocean and atmosphere interact, large-scale variability in ocean properties tend to be more gradual due to its large heat capacity, potentially affecting mussel meat yield variability across longer timescales than atmospheric drivers. Hence, we consider their effects separately. To determine the relationships between each of the Trenberth indices and the mussel meat yield anomalies, we computed the correlation coefficient (r) as a function of season and lag (Figure 4). In Figure 4, we aggregate the relationships by winter and summer half-year to enable a comparison with Zeldis et al. (2013). Overall, the relationships between Trenberth indices (a total of 14 indices) and mussel meat yield anomalies were relatively consistent amongst the summer (DJF) and autumn (MAM) half year, and winter (JJA) and spring (SON) half year (Figure 4). During the winter, we find relatively weak correlations between all indices and mussel meat yield - consistent with Zeldis et al. (2013), which also outlined a breakdown in the role of atmospheric flow in the winter half-year.
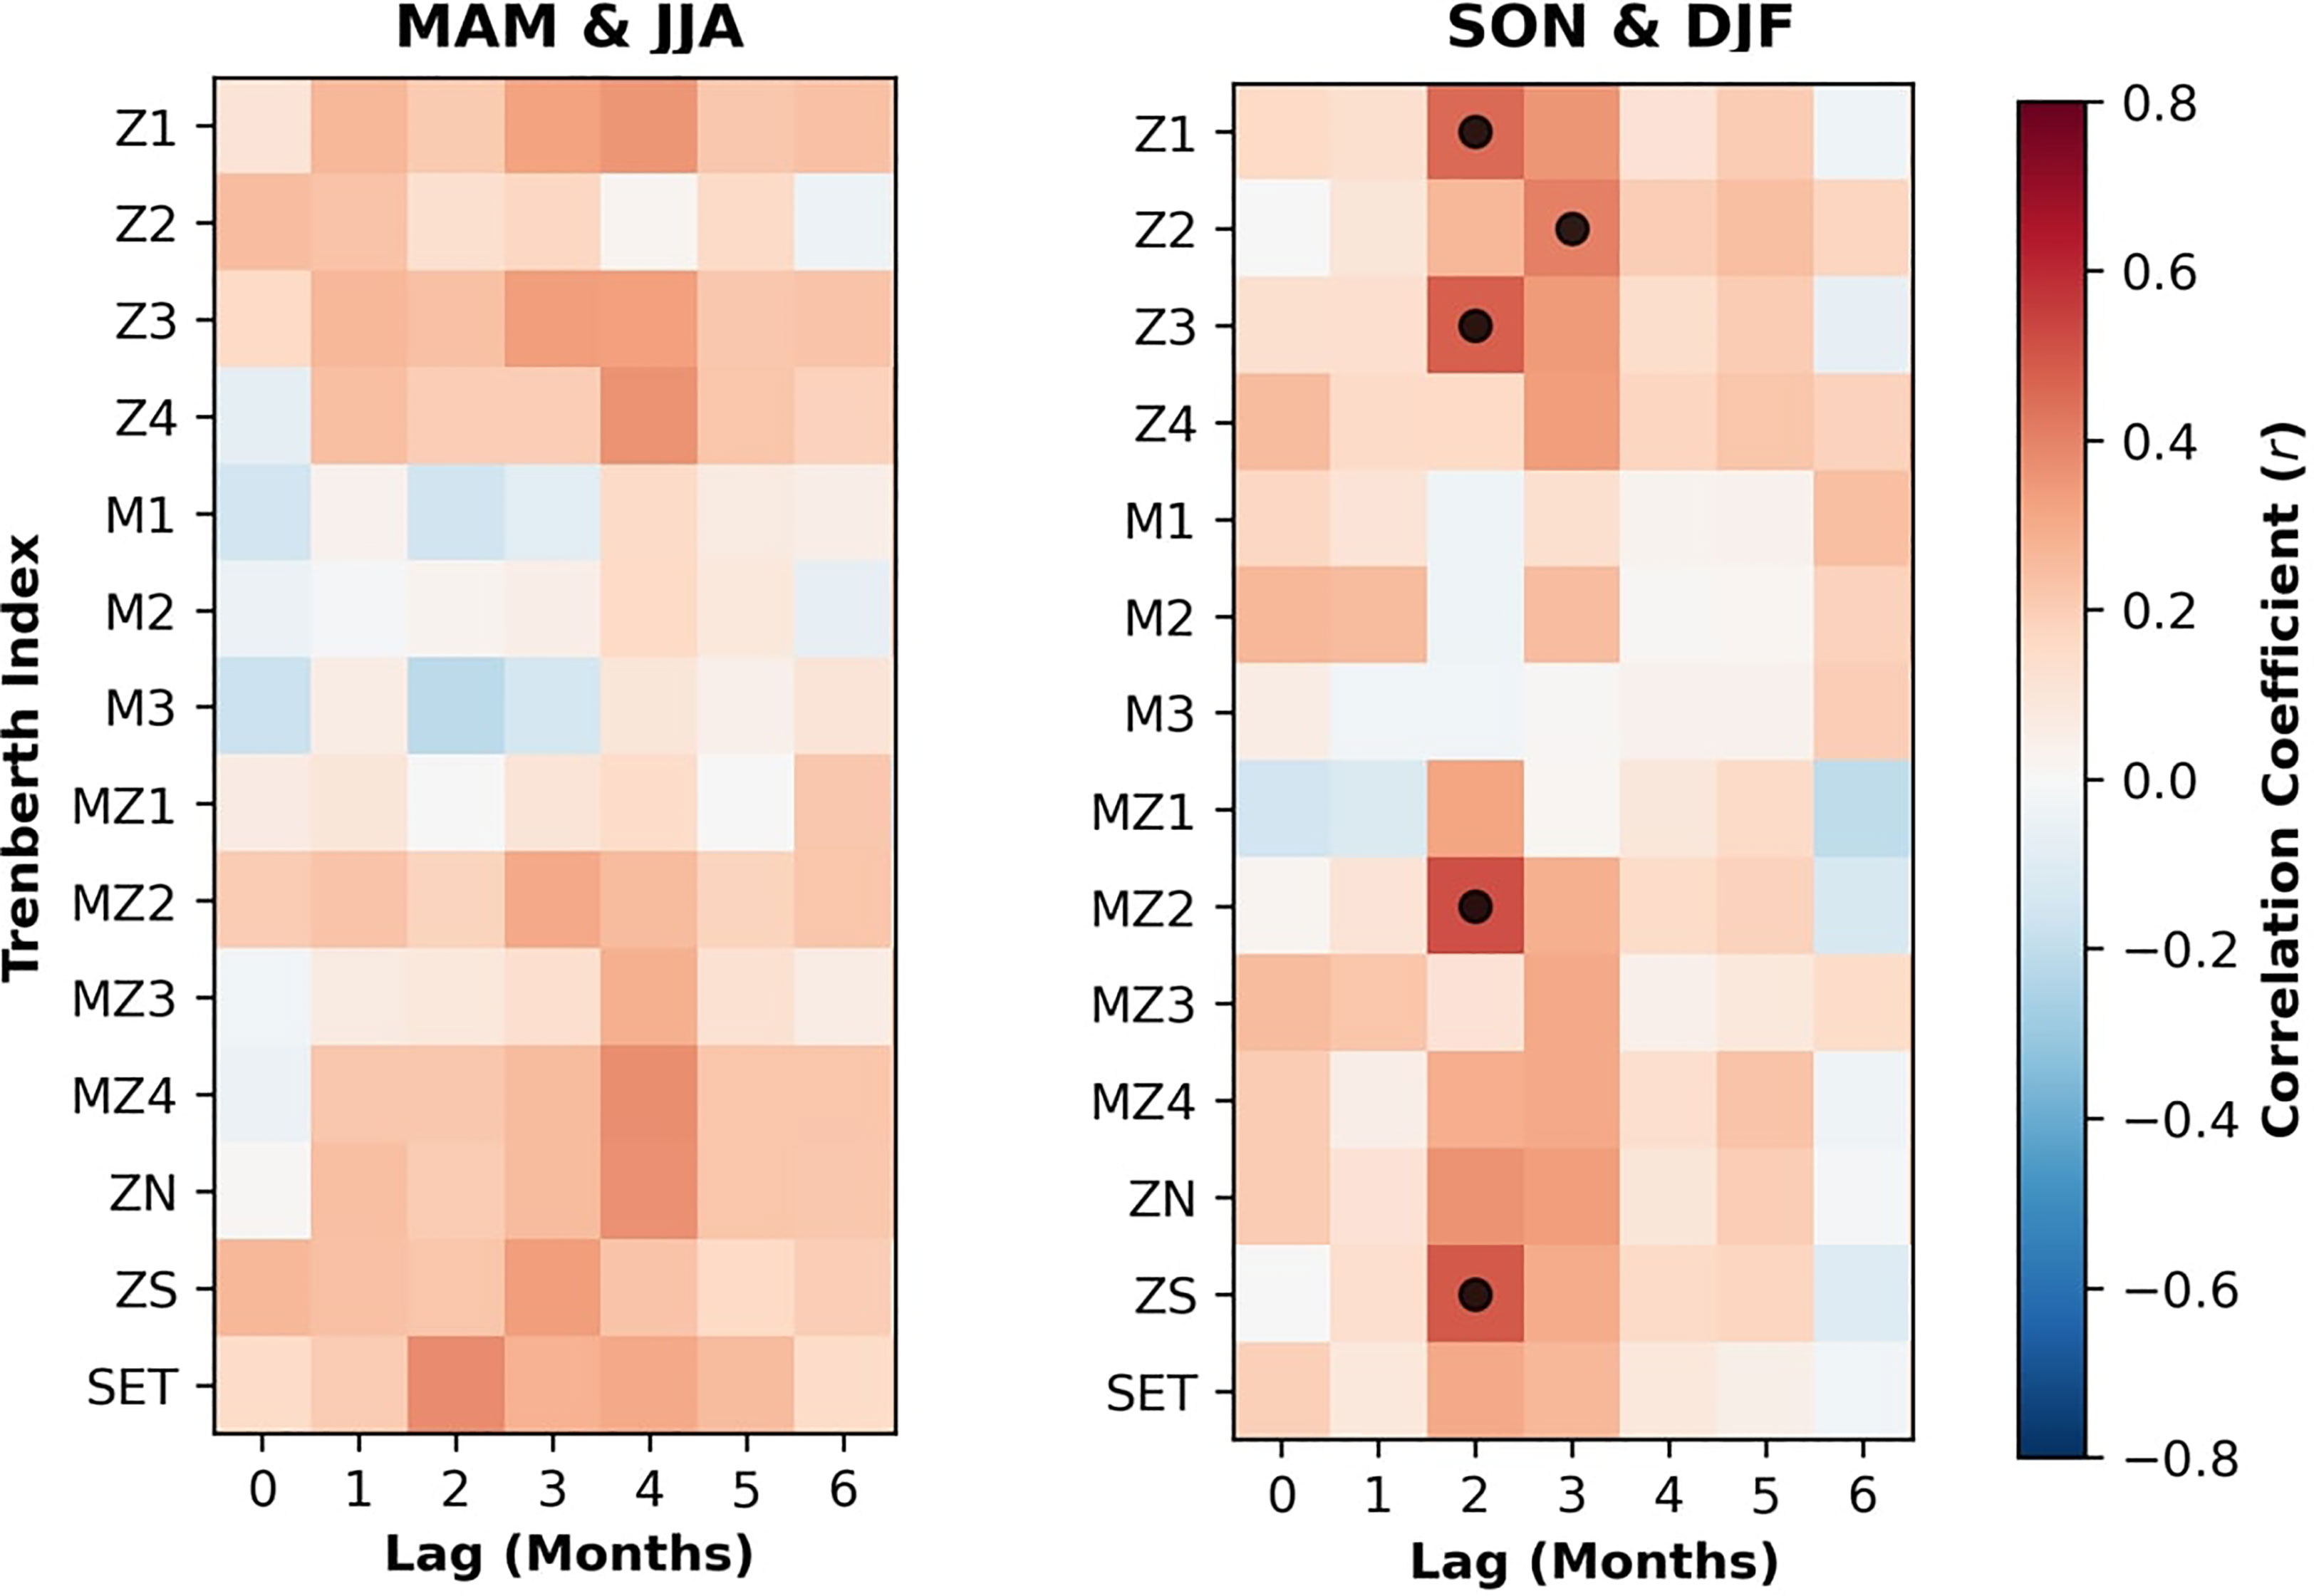
Figure 4 The correlation coefficient between each of the 14 Trenberth Indices (Y-axis) and mussel meat yield anomalies, computed by the summer September-November (SON) and December – February (DJF) and winter March-May (MAM) and June-August (JJA) half-years as a function of the lag, on the X axis. Red colors indicate a positive correlation, and blue indicates a negative correlation. Black dots are where the correlation coefficient exceeds 0.5 and the p-value is less than 0.05.
Conversely during the summer half year, there was moderate correlation (r>0.5) between the Z1, Z2, Z3, MZ2, and ZS and mussel meat yield anomaly at a lag-time of approximately two to three months. Interestingly, there is no significant correlation with any of the meridional-only indices (e.g., M1), reiterating the importance of the westerly wind stress near Pelorus Sound, and stimulation of nitrate-rich waters through upwelling (Zeldis et al., 2008; Zeldis et al., 2013).
3.3 Local and non-local correlations with SST
During DJF there is a strong negative correlation between mussel meat yield anomalies and SST at a lag of three months (the SST from three months prior) in the Tasman Sea between Tasmania and the South Island NZ (Figure 5 location C), where the correlation coefficient reaches values around -0.8 (Figure 5, top row). The pattern of correlation also shows a weak but slightly positive correlation near and around the coastline of Queensland and in the Northern Tasman Sea (Figure 5, locations A and D, respectively) in Australia. During MAM and JJA (Figure 5, second and third rows), we still find a strong negative correlation with the SSTs between Tasmania and the South Island and mussel meat yield anomalies; however, the correlation is stronger for lags up to one month, with slightly weaker correlation at a lag of three months. During the seasons of MAM and JJA, the positive correlation between the SST near the coastline of Queensland strengthens progressively until the season of SON, where the correlation coefficient reaches a maximum of around 0.8 at a lag of one month. Conversely, during SON the strength of the negative correlation significantly weakens or breaks down near Tasmania (Figure 5, location B) of lags for up to one month (Figure 5, bottom row). However, around the coastal waters of NZ, the correlation coefficient becomes increasingly negative, reaching a value of nearly -0.6 at a lag of three months.
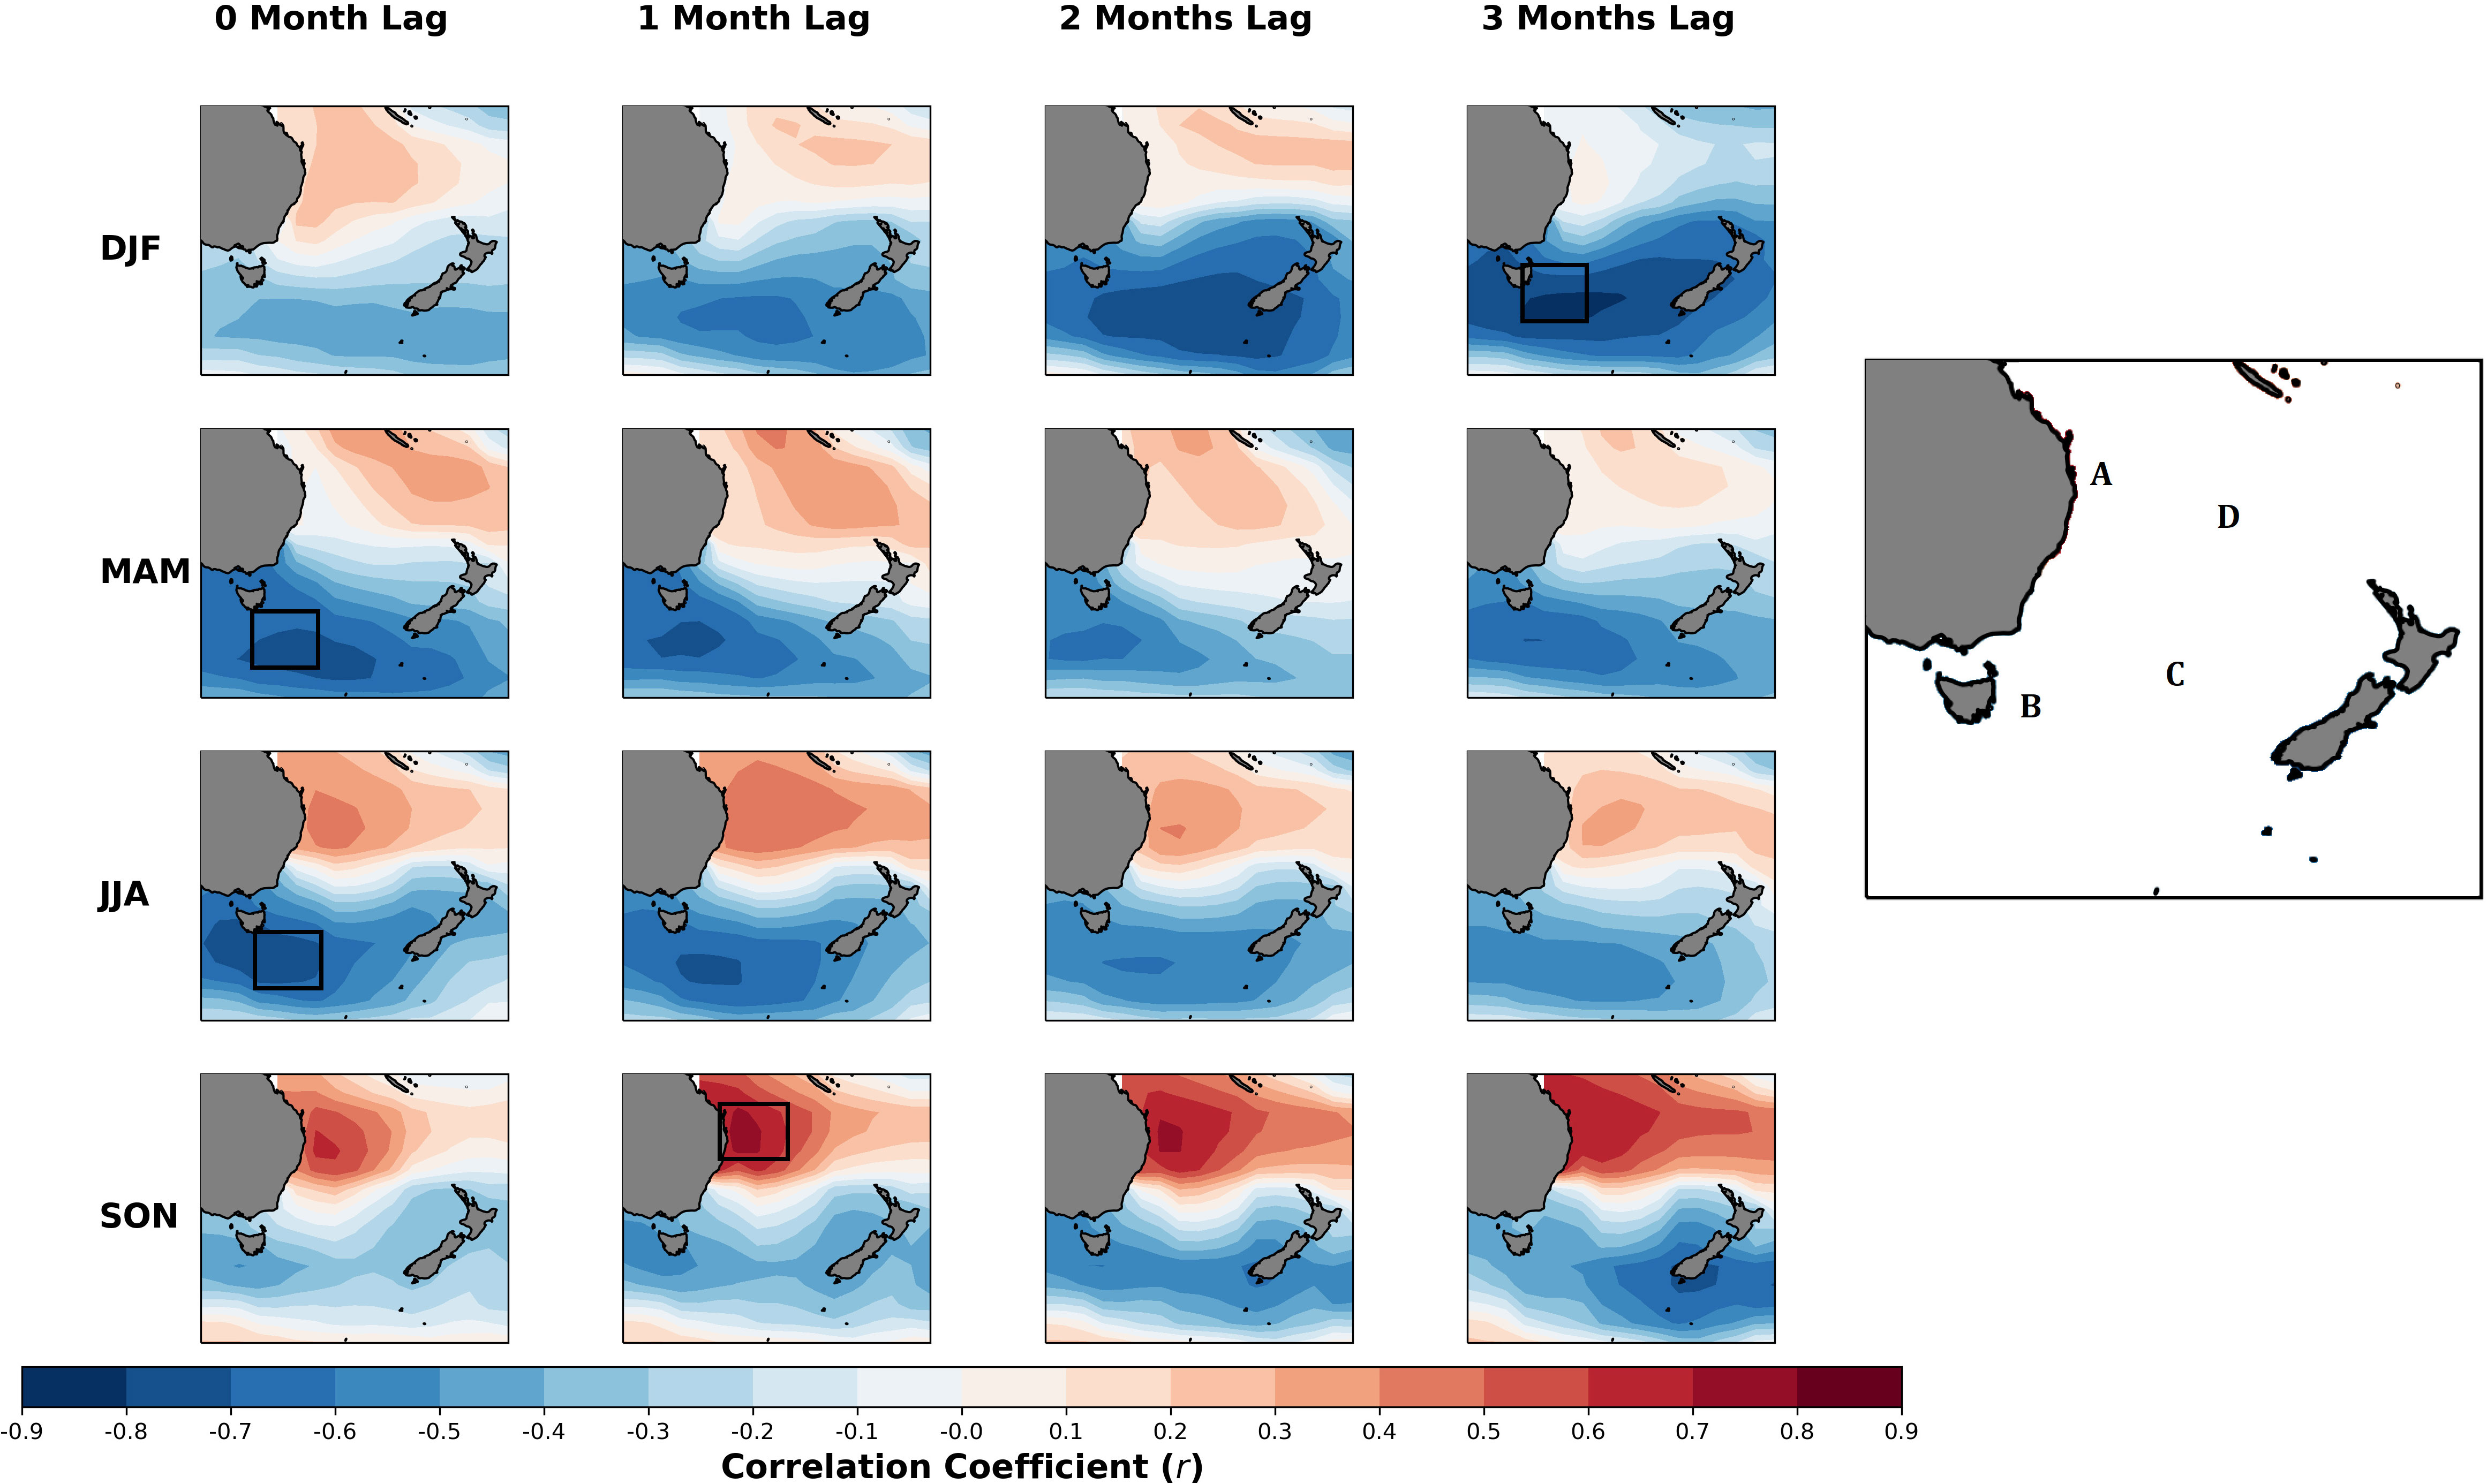
Figure 5 Seasonal correlation between mussel meat yield anomaly and SST anomaly (relative to the climatology) at each grid point within the domain. The correlations are organized by season. For each season (row), the domain with the maximum correlation among the lags is outlined in a black box. The locations (A–D) shown in Figure 5 are referred to in the text. In the text, Location A is referred to as Queensland, Location B as Tasmania, Location C as the Tasman Sea, Location D as the Northern Tasman Sea.
3.4 SST and surface wind composites during above and below-normal mussel meat yields
In this section, we firstly examine composites of SST and surface wind anomalies during seasons of below-normal mussel meat yield. During DJF when mussel meat yield anomalies fell below 5% of their yield relative to climatology (Figure 6, top row), there were above-normal SSTs several months prior across the Tasman Sea (>+0.7°C), and a strong easterly anomaly in surface winds in months preceding these events. The strong easterly anomaly in the surface wind was persistent for several months and would likely reduce the amount of surface upwelling, as surface upwelling on the West Coast of the South Island of NZ has been suggested to be linked to the westerly wind stress (Zeldis et al., 2013) The reduction in mussel meat yield can likely be attributed to a combination of warmer SSTs and reduced westerly flow. We also examined the correlation between surface wind anomalies and mussel meat yield anomalies – and found weaker relationships than using SST alone, and thus SST appears to be a more reliable indicator of mussel meat yield anomalies.
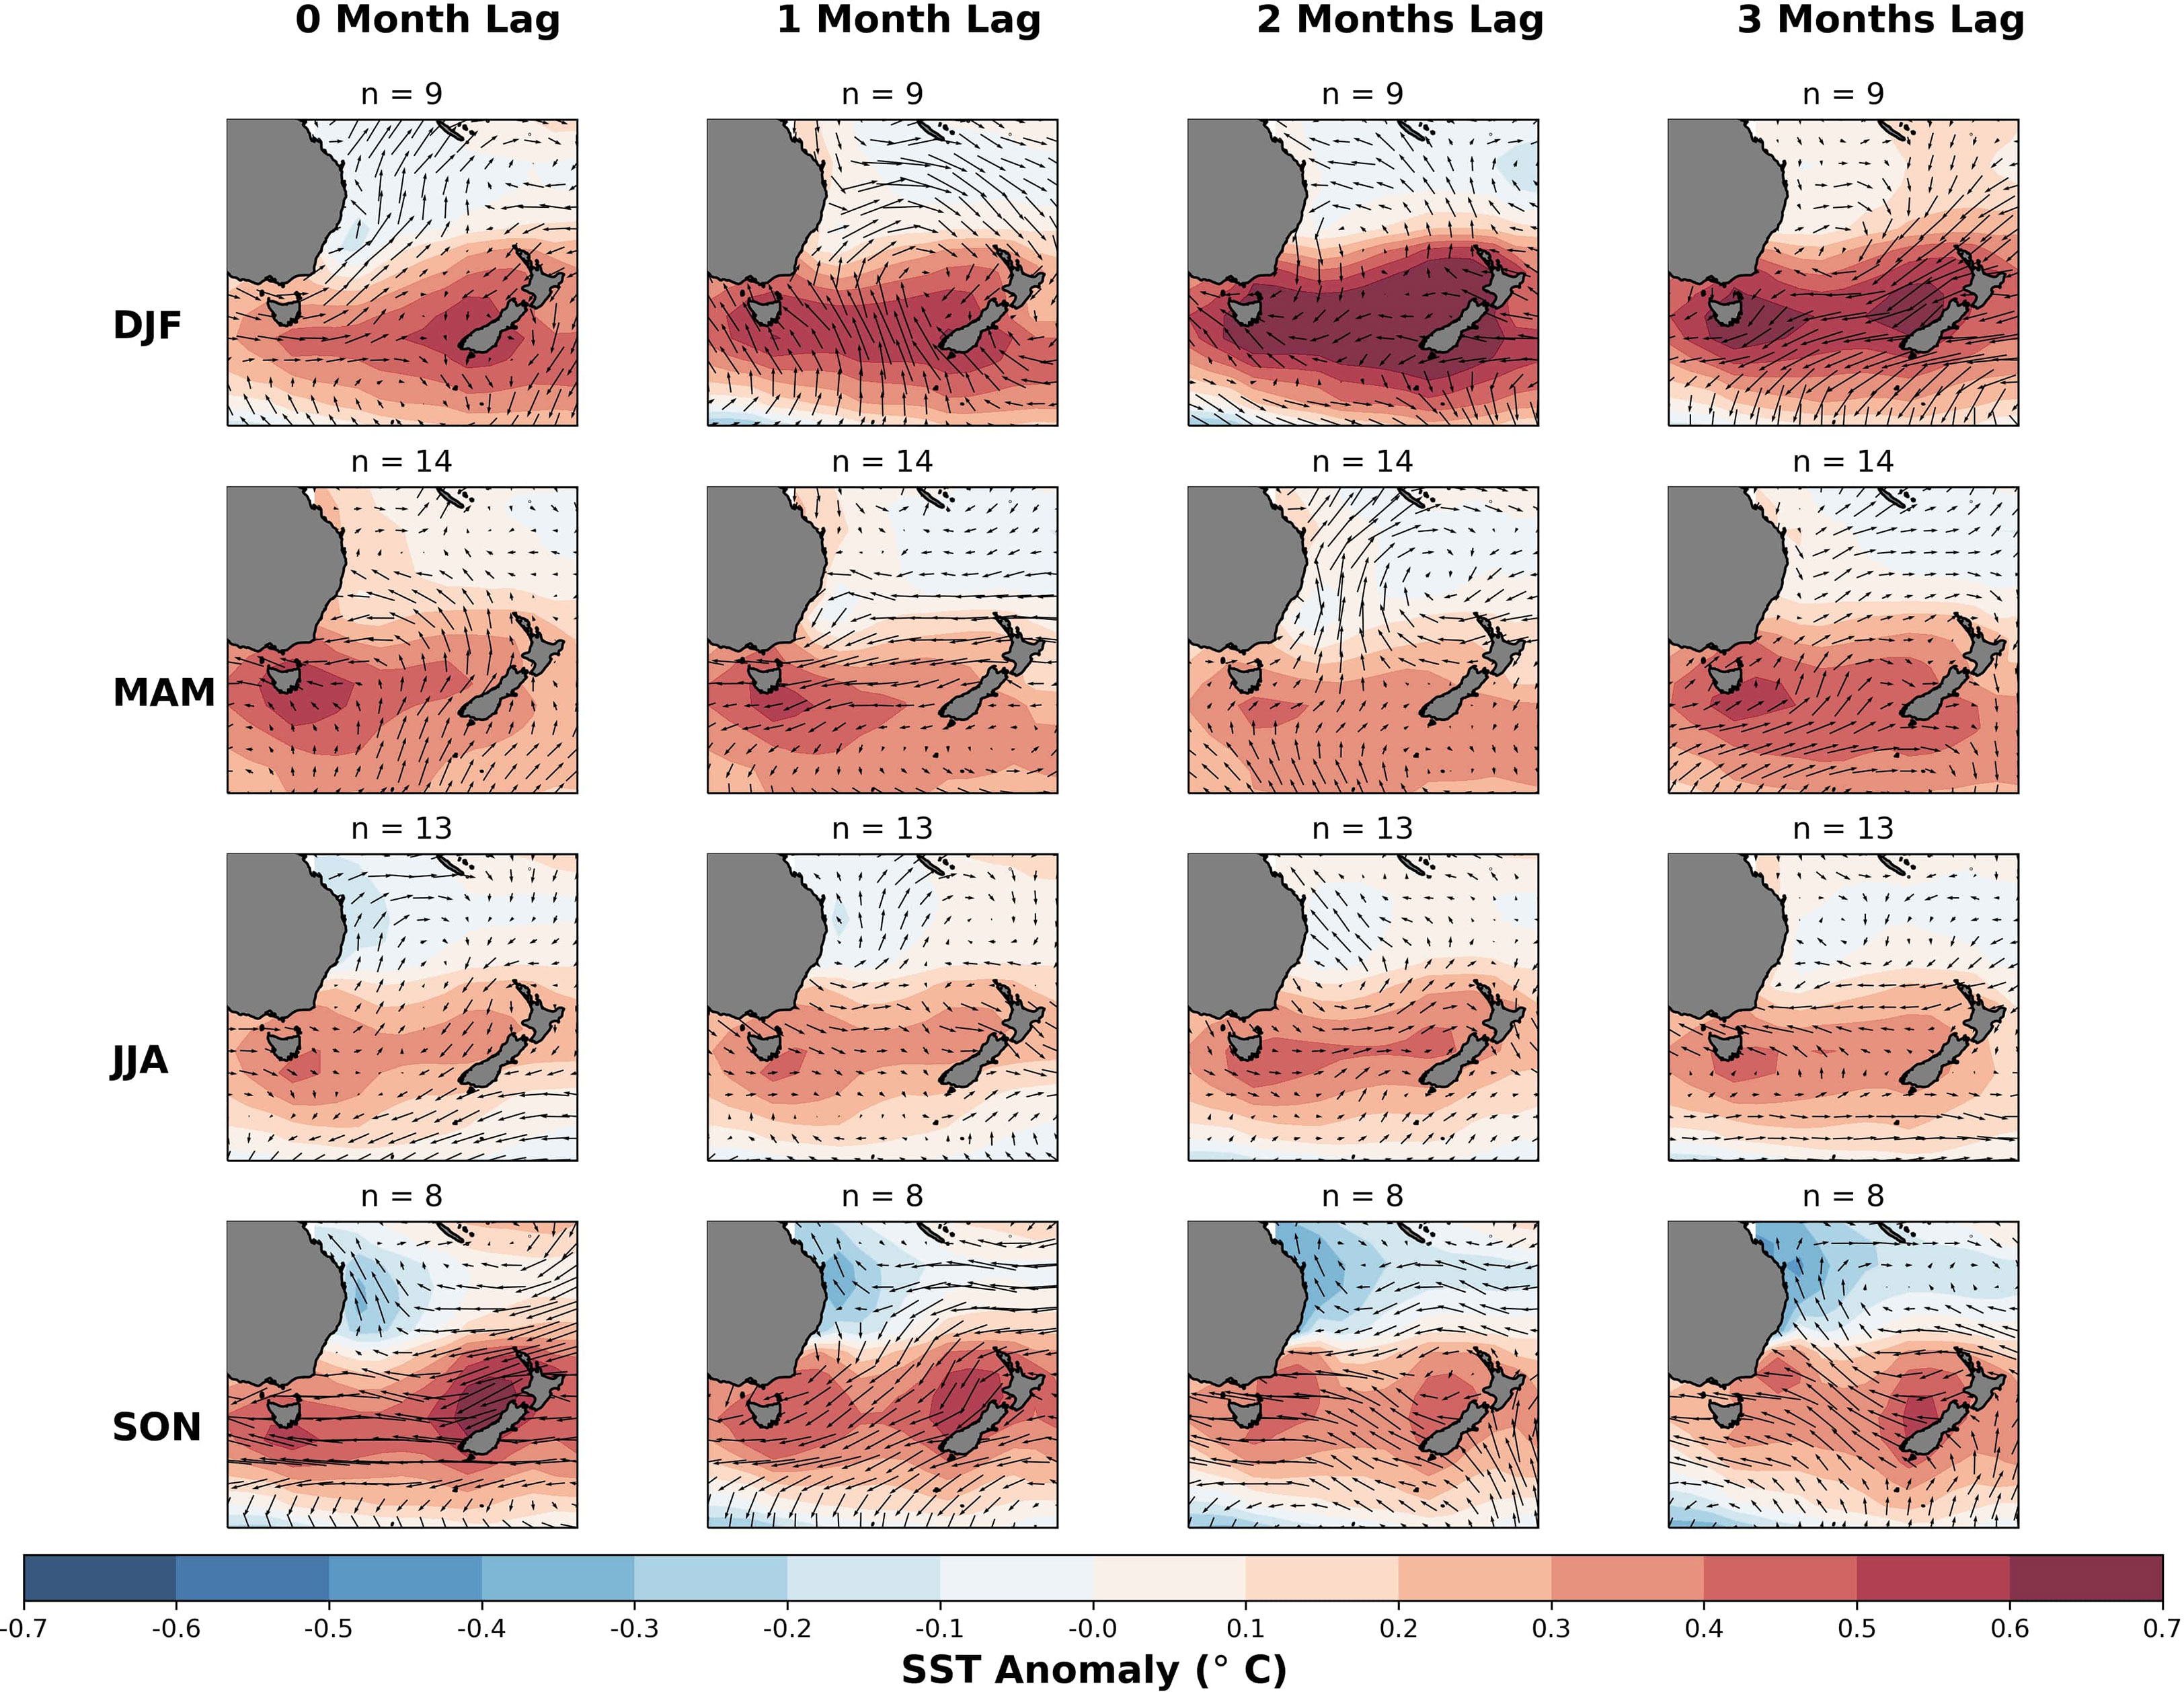
Figure 6 Seasonal SST and surface wind vector anomaly composites for months with mussel meat yield at least 5% lower than the climatological average for each season. The rows correspond to the anomalies for each respective season and anomalies up to three months prior. The number of samples used in each composite calculation is specified in the title. The color scale represents the deviation from the 1993-2016 climatology, with red indicating warmer than normal temperatures and blue indicating cooler than normal temperatures. The wind anomalies are depicted by arrows, with westerly anomalies represented by heads facing right and easterly anomalies represented by heads facing left.
Results for MAM (Figure 6, second row) were similar result to DJF, with warmer than normal SSTs in the Tasman Sea (~0.5°C) coupled with an easterly surface wind anomaly that was persistent approximately one month prior. However, during JJA (Figure 6, third row) average SSTs were warmer throughout the southern Tasman Sea, but with no preferential direction in the surface wind anomaly – and in some months the anomaly was westerly, which was opposite to all other seasons. Moreover, the lack of preferential surface wind anomaly direction during JJA, means that it is unclear whether reduced surface upwelling contributed towards below-normal mussel meat yields. Unlike JJA, the surface-wind anomaly patterns during SON (Figure 6, bottom row) appear to be easterly several months prior to below-normal mussel meat yields. These easterly surface-wind anomalies coexist with positive SST anomaly with a strong easterly surface wind anomaly several months prior.
We now examine composites of SST and surface wind, during seasons of above-normal mussel meat yield (>5% anomaly). During DJF (Figure 7, top row), several months preceding above-normal mussel meat yield there was an intensification of the westerly winds, coupled with slightly cooler than normal SSTs (<-0.3°C). Similarly, during MAM (Figure 7, second row), there was also an intensification in westerly winds coupled by below-average SSTs near Tasmania (<-0.4°C) and above normal SSTs (>0.5°C) north of the North Island and in the Northern Tasman Sea (Location D), resembling the correlation map illustrated in Figure 6, second row. During JJA (Figure 7, third row), there were stronger westerlies several months prior, with negative SST anomalies throughout the Tasman Sea. During SON (Figure 7, bottom row), there were slightly enhanced westerly winds several months prior and a weak signal of negative SST anomalies around the NZ coastline. However, there is a stronger SST anomaly signal near the coast of Queensland – again resembling the SST correlation pattern outlined in Figure 6.
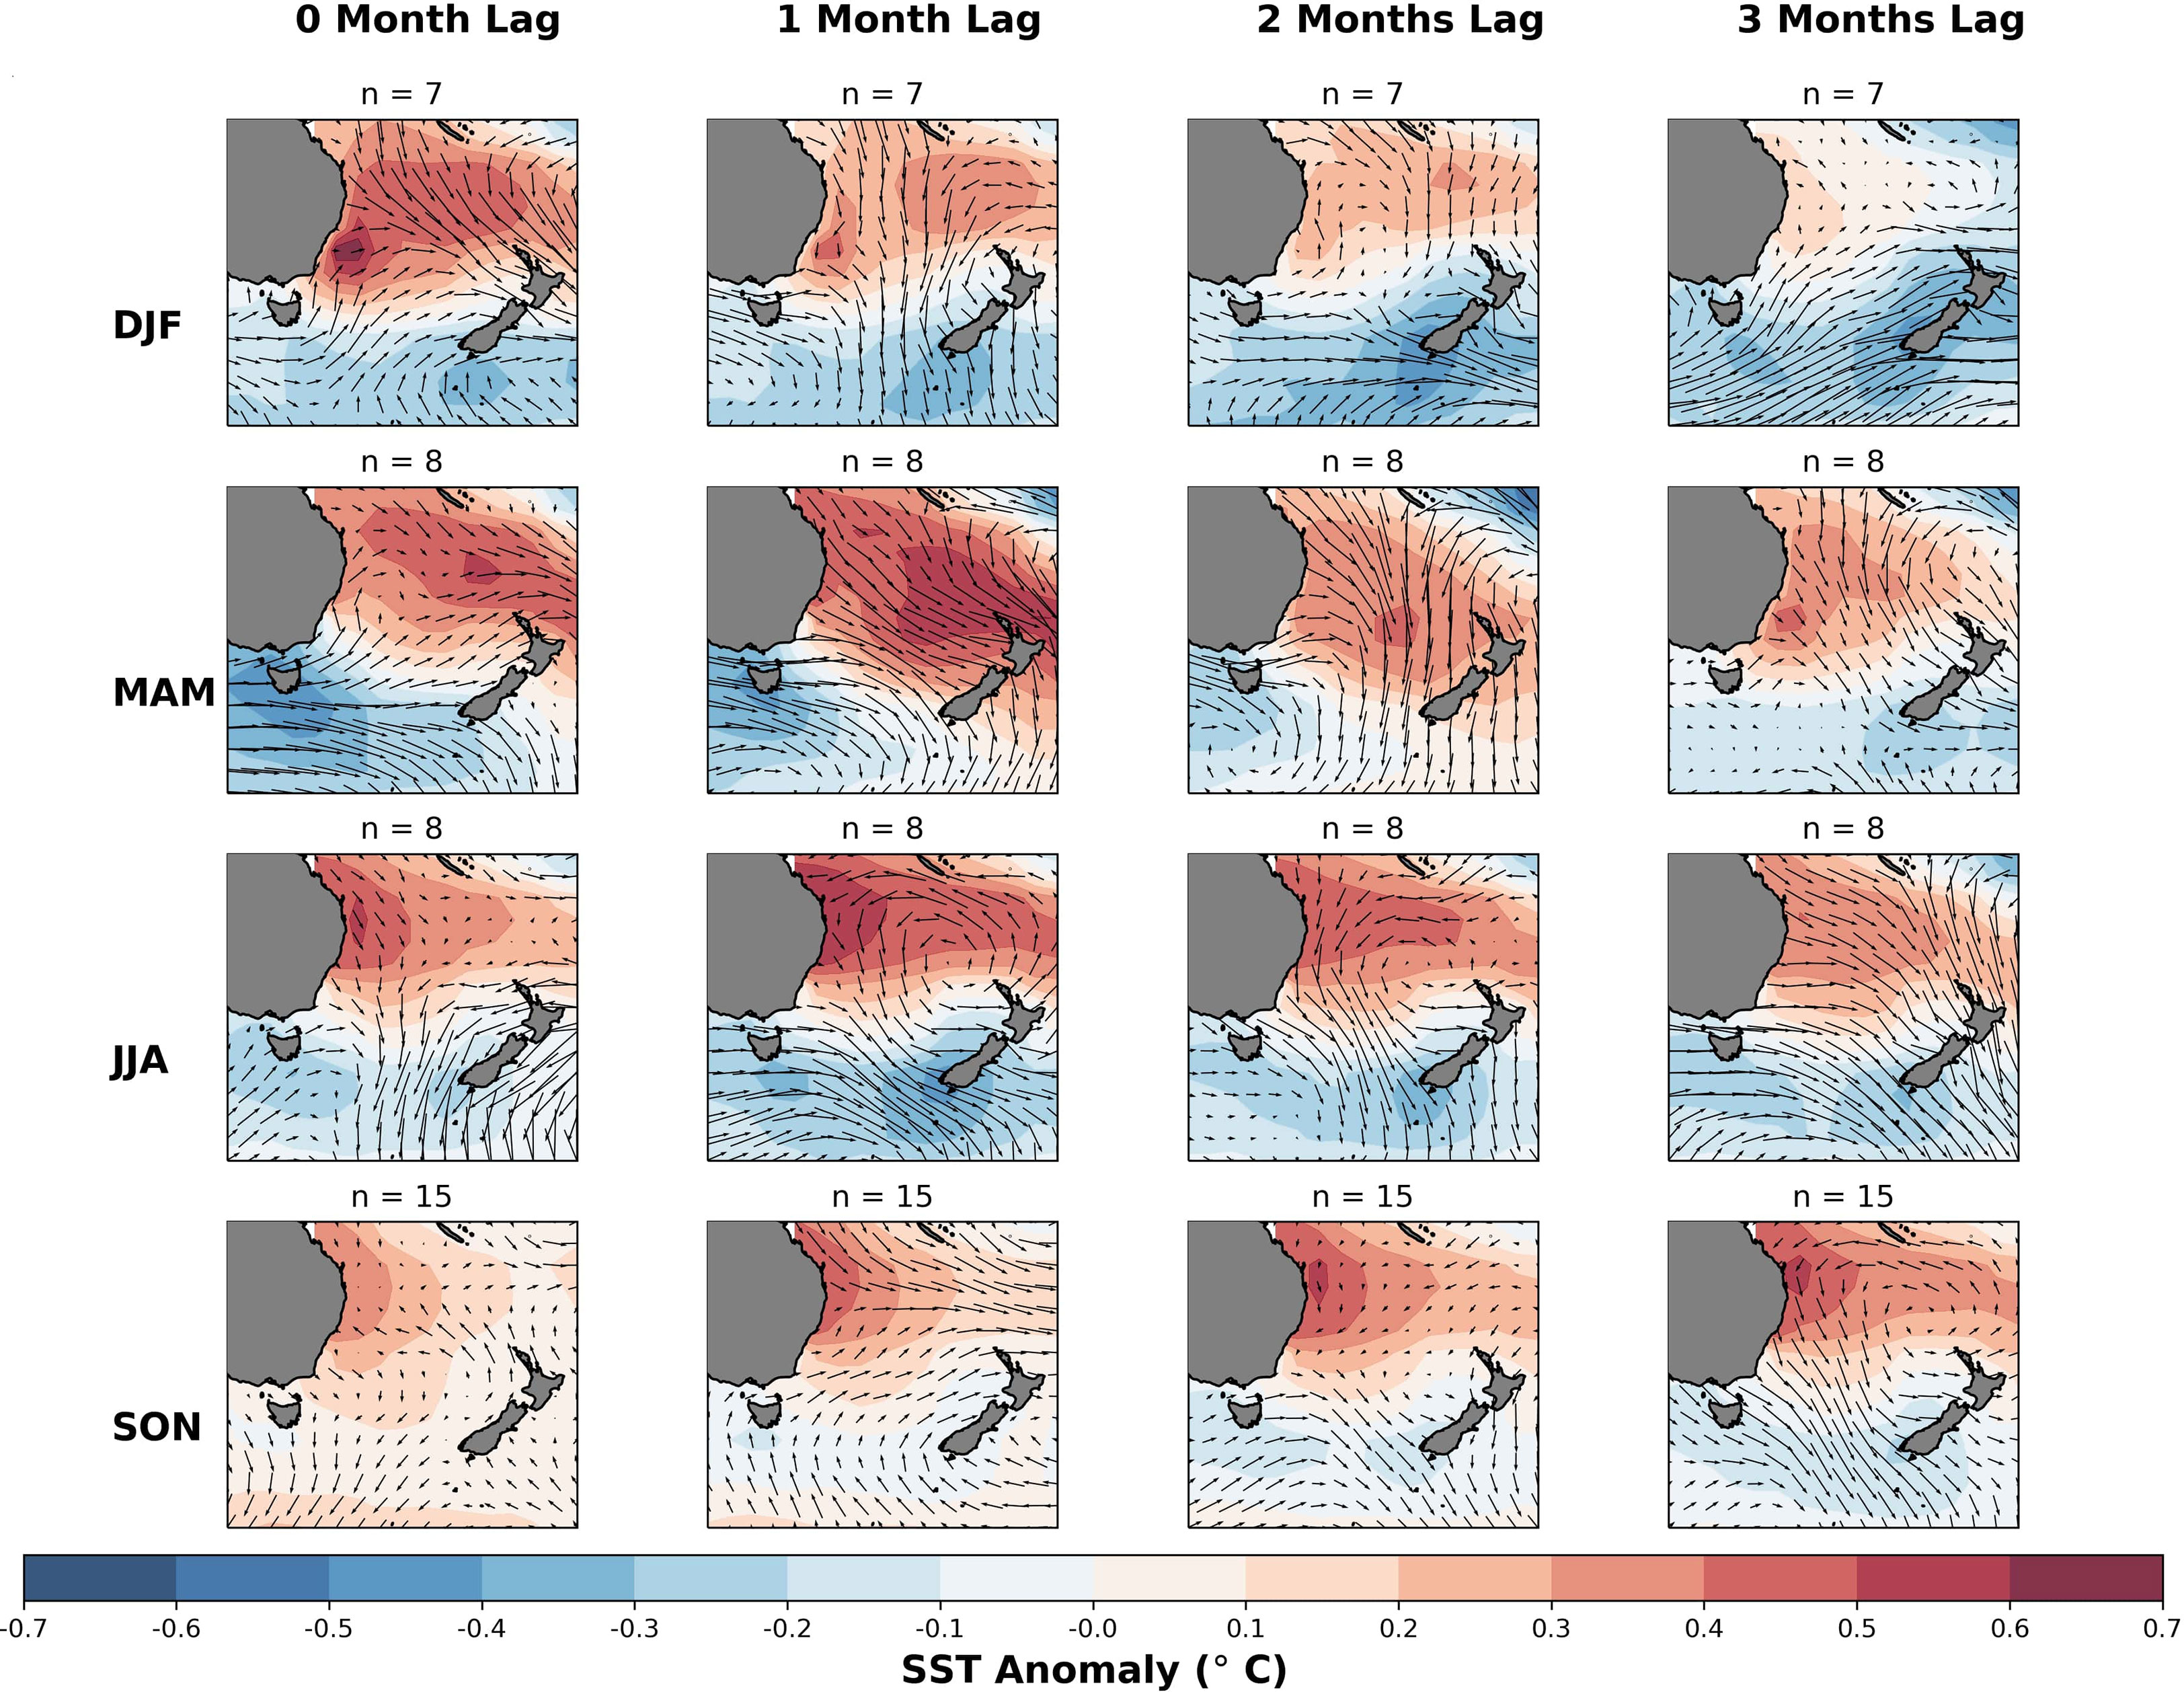
Figure 7 Seasonal SST and surface wind vector anomaly composites for months with mussel meat yield at least 5% higher than the climatological average for each season. The rows correspond to the anomalies for each respective season and anomalies up to three months prior. The number of samples used in each composite calculation is specified in the title. The color scale represents the deviation from the 1993-2016 climatology, with red indicating warmer than normal temperatures and blue indicating cooler than normal temperatures. The wind anomalies are depicted by arrows, with westerly anomalies represented by heads facing right and easterly anomalies represented by heads facing left.
3.5 Regression equations
To develop regression models for each season, we selected a 5° bounding box in which SST anomalies were more strongly correlated with subsequent mussel meat yield anomalies for a given season. These regions were illustrated earlier as the boxes in Figure 5, and the areal extent for these regions are summarized in Table 2. For each season there was only one unique location where the correlation coefficient was either a maximum (e.g., during SON) or minimum (e.g., during DJF, MAM, JJA). Key information about the regression equations including the regression coefficients, p and r values and geographic region of maximum correlation is given in Table 2. The regressions predict that during DJF and MAM, for every degree of warming relative to climatology in the regions outlined in Table 2, there was a reduction of -15.2% ( ± 2.3%) and -11.8% ( ± 1.9%) in mussel meat yield respectively (where the uncertainty corresponds to the standard error in the regression coefficient). During JJA, there was a significantly enhanced sensitivity to SST anomalies, with a -23.7 ± 4.0% reduction for every degree of warming relative to climatology. Lastly, during SON for every degree of warming relative to climatology, there was a 13.1 ± 2.5% increase in mussel meat yield. We have applied our linear regression equations to two separate periods, the training period (1997-2005) and the validation period (2015-2019). Overall, the predicted mussel meat yield appears to match the observed mussel meat yield for both periods with an r2=0.60 over the training period and an r2=0.42 over the validation period (Figure 8).

Table 2 A summary of the suite of linear regression models that are applied to SSTs (x) to create a mussel meat yield (y) forecast.
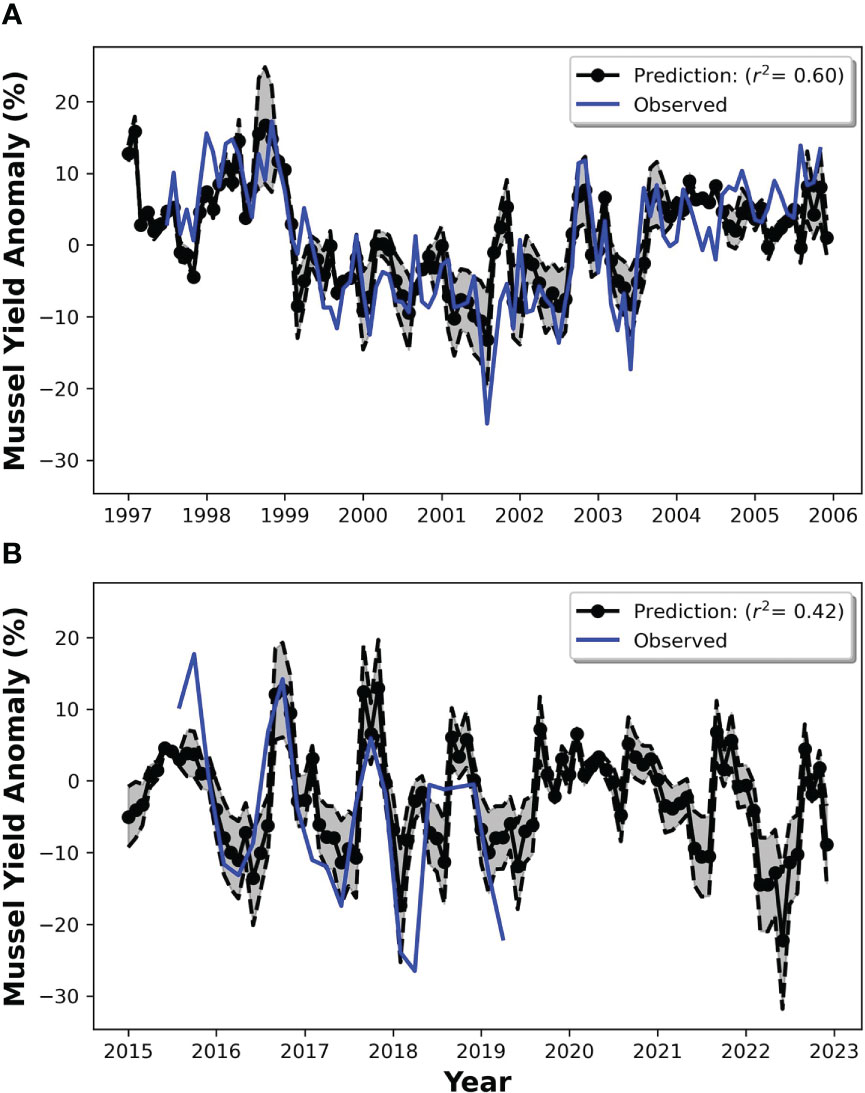
Figure 8 The regression model applied to the training period (A), and to an independent test period (B). The model predictions are black, and the actual observations are blue. Note, the observations only extend until 2019.
3.6 Validation of seasonal forecasts of mussel meat yield anomaly
The results of our mussel hindcast show a distinct seasonality in both explained variance (Figure 9A) and mean absolute percentage error (MAPE) metrics (Figure 9B). The season on the y-axis of Figures 9A, B corresponds to model initialization season. For example, a model initialized in the month of January would provide forecasts until June (5-month lead-time). We evaluated model skill as a function of the forecast initialization time. Our analysis suggests that predictions made in the DJF season had considerable skill out to approximately three months (i.e., to MAM). During the DJF season, the explained variance ranged from 0.56 (or 56%) at a lead time of one month to 0.15 at a lead time of five months but peaked at 0.6 for a lead time of 3 months. Meanwhile, the MAPE ranged from 4.8% to 8.8%, with a minimum of 4.8% for a lead time of 1 month and gradually increased for longer lead times. In contrast, predictions made during the MAM season have meaningful skill only to one month into the future (i.e., AMJ). The explained variance reaches a maximum at a lead time of 1 month, with a sharp decline towards the longer lead times. The MAPE ranged from 7% to 8.9%, with the highest values of 11% and 12% for lead times of 3 and 4 months, respectively. In JJA season, there was some skill in predicting mussel meat yield at lead times of 1 month, but little or no skill at other lead-times. In JJA the MAPE appears to decrease as a function of lead time. During the SON season, there was considerable skill across all lead times, where the explained variance increased from 0.3 at a lead time of one month to 0.61 at a lead time of five months, with a peak of 0.63 for a lead time of 4 months. The MAPE ranged from 5.6% to 5.7%, with a minimum of 3.8% for a lead time of 4 months. Overall, the accuracy of our mussel hindcast showed significant skill at seasonal timescales (≥3 months) during DJF and SON (initialization dates for predictions)– where in SON there was skill at lead times up to five months. During MAM and JJA there was some skill at shorter lead times (~1 month) – where during JJA there appeared to also be some skill at lead times up to 5 months.
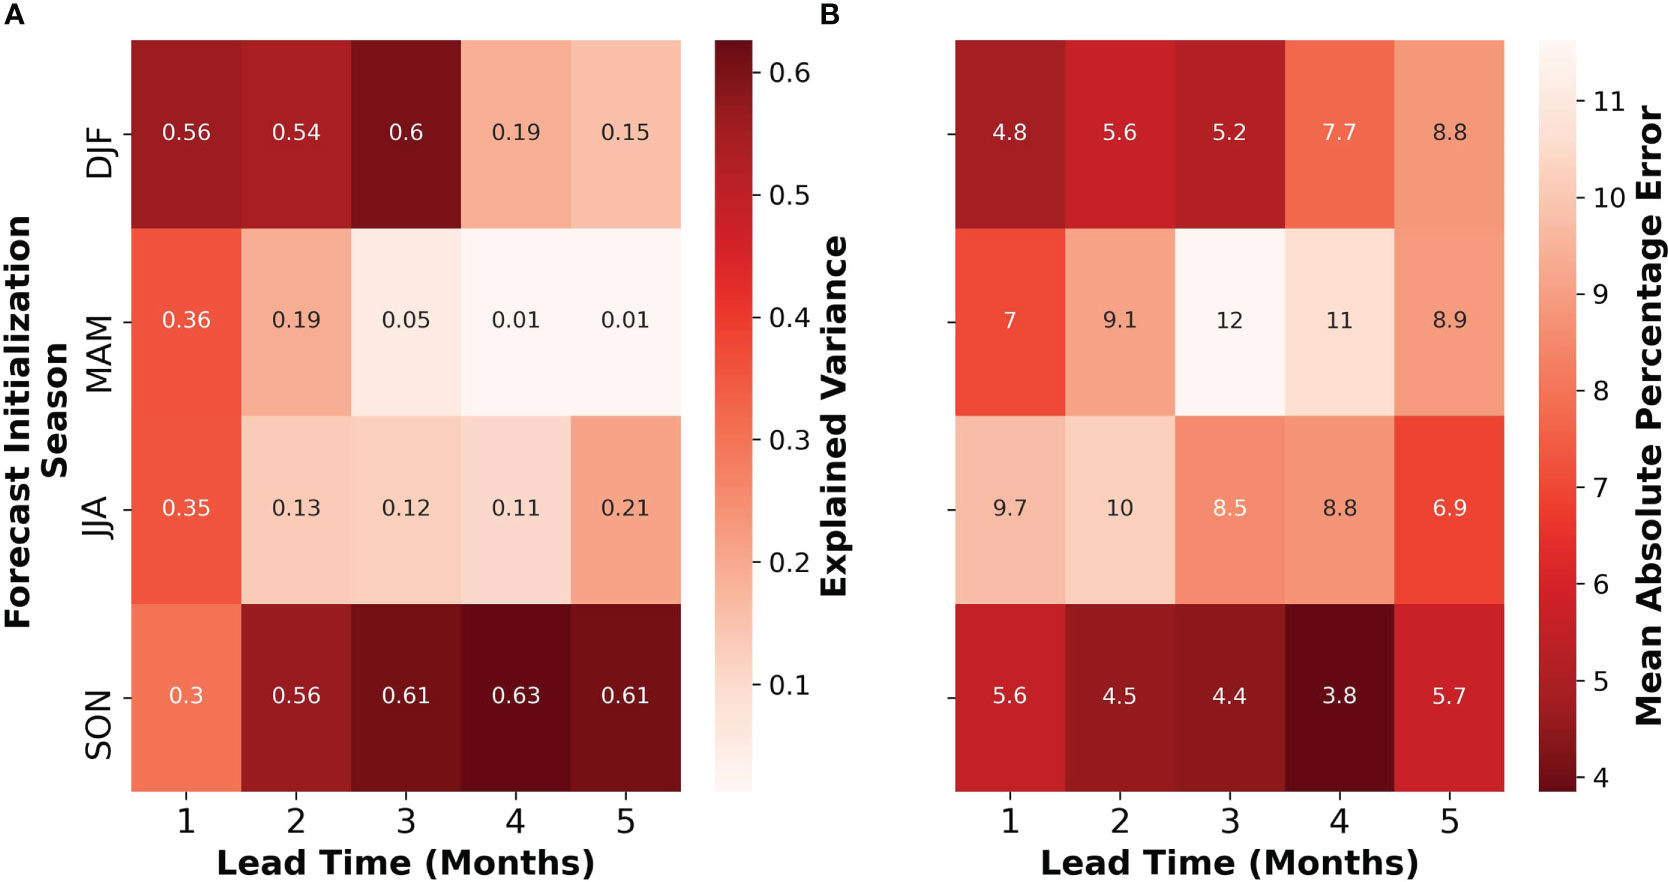
Figure 9 Seasonal and lead-time dependence of mussel hindcast accuracy. The sub-figures show the explained variance (A) and mean absolute percentage error (MAPE, B) of the mussel hindcast initialized in different seasons (DJF, MAM, JJA, and SON) and lead times (1-5 months). Forecast initialization season refers to the season in which the predictor is made and does not represent the season being forecasted for. For explained variance (left), redder colors indicate high accuracy and lighter colors highlight lower accuracy. For MAPE (right), redder colors indicate higher accuracy/lower percentage error and paler colors indicate lower accuracy/higher percentage error.
4 Discussion
Our forecasts of mussel meat yield are predicted with a single variable (SST), despite mussel meat yield being dependent on a wide variety of other local and non-local environmental variables (Zeldis et al., 2008; Zeldis et al., 2013). Overall, we found that our single-variable regression equations, which were trained on the period 1997-2005, extrapolated well to the period 2015-2019, highlighting that the learned relationships were robust and able to generalize to a different climatological period.
To measure the skill of our regression equations, we applied them to SST retrospective forecasts from the ECMWF GCM – without any bias correction. While our model has a skill of a lead-time of at least 1-month for all seasons, it is skillful at 3- and 5-month lead times in DJF and SON, respectively. This means that a forecast issued in September would be skillful and useful for predicting mussel meat yield in February. The crop-production cycle in Pelorus Sound is such that harvest rates tend to be lowest during the mid-winter-early spring period (July–
September: when the mussels tend to be in poor condition following spawning). It is therefore important that our forecast model does have the greatest reliability for months associated with greatest harvest when mussel meat yield is highest (November–March).
Despite our initial results highlighting that our model has significant skill at seasonal timescales, there is still significant room for development. Firstly, there are biases within GCMs, which arise from uncertainties in their parameterization schemes (e.g. Wilby & Wigley, 1997). This means that forecasts from GCMs are not necessarily consistent with observations (Glahn & Lowry, 1972; Wilby & Wigley, 1997). Biases in GCMs are also often seasonal, meaning that a forecast issued in DJF could have a lower skill than forecasts issued in JJA (de Burgh-Day et al., 2019; Jacox et al., 2019; de Burgh-Day et al., 2022). Bias-correcting the outputs from GCMs could significantly improve the skill of our model. Additionally, we have only validated our results on one single GCM. An ensemble average of different GCMs has been shown to be more skillful than one individual model (Jacox et al., 2022).
It is also important to highlight that while using multiple regressors (e.g., atmospheric variables and SST) may improve the explanatory power of a model for predicting mussel meat yield, this added explanatory power may not translate when the model is applied to outputs of a seasonal forecast model or GCM. Using both SST and atmospheric variables as predictors could result in poorer performance than using SST alone in a seasonal forecast for several reasons. Firstly, SST tends to be more predictable on seasonal timescales than atmospheric variables - especially in the mid-latitudes (Johnson et al., 2019). The large heat capacity of the ocean means that it is a much more stable system, and thus more slowly varying than the atmosphere, and that it has a longer persistence and contains a large portion of lower frequency variability (Jacox et al., 2019; Jacox et al., 2022). Owing to these significant differences in seasonal forecast skill and their difference in heat capacity (which causes the ocean to vary more slowly in comparison to the atmosphere) using both a combination of atmosphere and oceanic variables will likely poorly extrapolate to outputs of seasonal forecast models.
Whilst we have been able to generate moderately reliable forecasts of mussel meat yield using non-local SSTs (e.g., near the coast of Tasmania) without explicit recourse to local environmental data (or forecasts of local environmental properties), physical drivers of seston production affecting mussel meat yield will not plausibly arise from non-local SSTs. Rather, they will be affected by oceanic processes off the northern South Island coast of NZ (Zeldis et al., 2008; Zeldis et al., 2013). While our correlation analysis found strong non-local relationships with SST, we also found strong statistically significant correlations with the local SSTs (e.g., the SSTs near the Pelorus Sound) as illustrated in Figure 5. This result is consistent with Zeldis et al. (2013), which found significant correlations with the local SSTs. This additional explanatory power by non-local SSTs in the Tasman Sea for predicting mussel meat yield likely arises through oceanic and atmospheric teleconnections under the influence of ENSO. Moreover, the non-local SSTs are likely able to provide a better description of the effects of ENSO on mussel meat yield.
To describe the role of ENSO on mussel meat yield, we turn to relationships between surface wind anomalies and SST anomalies. Typically, when there are positive SST anomalies near Tasmania there are also north-easterly surface wind anomalies near the West Coast of the South Island, NZ. These conditions are associated with below-normal mussel meat yields. Conversely, cooler SSTs in the Tasman Sea are coupled with south-westerly surface wind anomalies and were associated with above-normal mussel meat yields. We also found a consistent result when examining correlations with each of the Trenberth Indices – where only zonal indices (west-east flow) had a significant correlation with mussel meat yield during the summer half-year. La Niña conditions, which are associated with a positive Southern Oscillation Index (SOI) are associated with northeasterly wind anomalies, and El Niño conditions are typically associated with enhanced westerlies (Mullan, 1998). This is also consistent with Zeldis et al. (2013), which found that the SOIwas an important predictor for mussel meat yield in DJF – with a negative regression coefficient.
Our analysis has focused on non-local SSTs and associations with large-scale atmospheric and oceanic features (>2°), however highly localized environmental fluctuations can also influence mussel meat yield variability in the Pelorus Sound (Zeldis et al., 2013). For example, changes in the surrounding river catchment of Pelorus Sound have the potential to influence patterns of freshwater delivery (annual quantity and seasonality, and hence, stratification and estuarine circulation) inside Pelorus Sound. Similarly, the Pelorus River has the potential to influence the delivery of nutrients and suspended sediments into the sound. Dissolved nutrients can be expected to influence mussel body-condition through their influence on the growth rates (hence, standing stocks) of phytoplankton. Phytoplankton, in turn, underpin the formation of seston of marine origin (Eppley et al., 1977.; Verity, 2002) which is the food of mussels in Pelorus Sound (Gibbs, 1993; Zeldis et al., 2008). Internationally, correlations of mussel growth and condition with food supply have been demonstrated in several cases (Blanton et al., 1987; Figueiras et al., 2002; Ren & Ross, 2005).
Our forecast model was developed using data from commercially harvested mussels that had been brought ashore for factory processing toward a meat/table product. It is therefore likely that the population of harvested mussels will sometimes be a biased sample of the population of harvest-size (shell dimensions) available on the crop lines. Since our forecast model was trained upon mussels which had been commercially harvested and returned to the factory for processing into meat-product, it implicitly takes account of the additional factors (beyond meat content/quality) that influence harvest decisions. Equally, it is important to recognize that our forecast model may be of lesser value as a predictor of the quality/value of mussels harvested for nutriceutical products and mussels which are growing on the crop lines or in the wild (regardless of whether these are of harvest size). We have found a strong relationship between the ‘quality’ of the harvested product and antecedent environmental conditions. This implies that farmers cannot entirely buffer themselves against the vagaries of environmental fluctuations by preferentially selecting only the ‘right’ mussels – sometimes they are forced to harvest sub-optimal ones. Conversely, it also implies that market demands for high-value product do not entirely outweigh the impositions of environmental fluctuations. There are several other aspects that may influence the quality of data collected, these include changes in the forestry cover of the Pelorus river catchment. The upper parts of the Pelorus river catchment are native forests and dry-stock farms. The lower parts of the catchment are more intensively farmed. Below the river mouth, the Sound is surrounded by steep land – much of which is under commercial pine plantations. Much of the plantation forest was in the early/mid-growth phase during the period in which the ‘training data’ were gathered, but increasingly large fractions of that forest are now being harvested. It is not yet clear whether climate change and/or termination of the present forest harvest cycle will lead to temporary or even permanent changes in the patterns of seston generation within/import into the sound, but one much accepts that a quasi-empirical forecast model such as ours may prove to have a shorter useful lifespan than one based upon more formal mechanistic biophysical relationships would have in our climate-changing world.
5 Conclusion
We have recently witnessed significant advances in seasonal forecasting due to increased computational resources and the development of sophisticated physical parameterizations of unresolved ocean processes (Johnson et al., 2019). These advancements have enabled skillful forecasts of SST at horizons of 1-5 months (de Burgh-Day et al., 2019; de Burgh-Day et al., 2022; Jacox et al., 2022; McAdam et al., 2022) which is extremely useful for the aquaculture industry (Hobday et al., 2016; de Burgh-Day et al., 2019; Jacox et al., 2020; de Burgh-Day et al., 2022; Stevens et al., 2022). In this study, we have used these advancements in the accuracy of SST forecasts to develop forecasts of mussel meat yield for Pelorus Sound, the largest mussel aquaculture region in NZ.
To develop a forecasting model of mussel meat yield, we first established relationships between historical SSTs and mussel meat yield. We found that non-local SSTs (e.g., SSTs near Queensland, Australia and near Tasmania, Australia) are the best environmental predictors of mussel meat yield. Through the non-local SST anomaly as a single predictor alone, we explained 60% of the seasonal variance mussel meat yield anomalies from 1997-2005 and 42% from 2015-2019. Our model outperforms previous work by Zeldis et al. (2013), which explained 30% of the summer-time variance and 20% of the winter-time variance. The SST anomaly patterns are strongly linked to patterns of surface wind anomalies with above-normal yields corresponding to cooler SSTs in the Tasman Sea, with enhanced westerly winds. Similarly, in the winter season, we find that below normal mussel meat yields are associated with warmer SSTs in the Tasman Sea and an easterly wind anomaly. A plausible explanation as to why the easterly (westerly) surface wind anomalies would contribute to reducing (increasing) mussel meat yield is through reducing (increasing) the amount of surface upwelling near the West Coast of the South Island. Enhanced surface upwelling (providing nutrient rich waters) is associated with a positive westerly wind stress (Zeldis et al., 2013; Chiswell et al., 2017). We also find that this relationship between surface-wind anomalies and mussel meat yield weakens in JJA, which is consistent with Zeldis et al. (2013). While non-local SSTs have no clear physical mechanism to affecting mussel meat yield, it appears that they are linked to patterns of surface-wind anomalies near the West Coast of the South Island which are induced by different phases of ENSO.
While our mussel meat yield forecasts demonstrate some skill for all seasons, they are particularly skillful at lead times of 3 and 5 months for forecasts initialized in DJF and SON, respectively. Forecasts issued for the months September – May are particularly skillful. These forecasts can help mussel farmers plan, allowing them to make informed decisions about farm management including timing and expected yields of harvest several months in advance.
In future work, our model will be validated against a wide variety of different GCMs, and we will also investigate the use of multi-variate regressors (e.g., atmospheric and oceanic predictors). A large ensemble of GCMs has been suggested to reduce errors in SST forecasts (Jacox et al., 2019; Jacox et al., 2019; Jacox et al., 2022; McAdam et al., 2022) and thus could also reduce errors in our seasonal predictions of mussel meat yield. An ensemble also provides a measure of uncertainty for each forecast, which could useful for decision making (e.g., Hobday et al., 2016; de Burgh-Day et al., 2019; de Burgh-Day et al., 2022; Stevens et al., 2022). Further work will also explore the utility of bias correcting GCMs to obtain more reliable forecasts of SST – which could in turn improve the accuracy of mussel meat yield forecasts.
Data availability statement
Summaries of the data supporting the conclusions of this article can be made available by the authors, upon request.
Author contributions
NR: conceptualization, methodology, data analysis, visualization. NB, DP, JZ and AW: methodology, writing, supervision, reviewing, editing. BN and TM: methodology. JS-D: data collection. All authors contributed to the article and approved the submitted version.
Funding
This research has been undertaken through the National Institute for Water & Atmospheric Research Ltd.’s Aquaculture/Environment Interactions program (project CEEE2303 & predecessors) and funded through Strategic Science Investment Funding from the Ministry for Business, Innovation and Employment (Contract CO1X1703).
Acknowledgments
We thank Sealord Shellfisheries Ltd., who collected the mussel meat yield time series data.
Conflict of interest
Authors DP, JZ, AW, and JS-D were employed by the company National Institute of Water and Atmospheric Research Ltd.The remaining authors declare that the research was conducted in the absence of any commercial or financial relationships that could be construed as a potential conflict of interest.
Publisher’s note
All claims expressed in this article are solely those of the authors and do not necessarily represent those of their affiliated organizations, or those of the publisher, the editors and the reviewers. Any product that may be evaluated in this article, or claim that may be made by its manufacturer, is not guaranteed or endorsed by the publisher.
References
Blanton J. O., Tenore K. R., Castillejo F., Atkinson L. P., Schwing F. B., Lavin A. (1987). The relationship of upwelling to mussel production in the rias on the western coast of Spain. J. Mar. Res. 45 (2), 497–511. doi: 10.1357/002224087788401115
Bradford J. M., Chang F. H., Baldwin R., Chapman B., Downes M., Woods P. (1987). Hydrology, plankton, and nutrients in pelorus sound, new Zealand, July 1981 and may 1982. New Z. J. Mar. Freshw. Res. 21 (2), 223–233. doi: 10.1080/00288330.1987.9516218
Chiswell S. M., Zeldis J. R., Hadfield M. G., Pinkerton M. H. (2017). Wind-driven upwelling and surface chlorophyll blooms in greater cook strait. New Z. J. Mar. Freshw. Res. 51 (4), 465–489. doi: 10.1080/00288330.2016.1260606
de Burgh-Day C. O., Spillman C. M., Smith G., Stevens C. L. (2022). Forecasting extreme marine heat events in key aquaculture regions around new Zealand. J. South. Hemisphere Earth Syst. Sci. 72 (1), 58–72. doi: 10.1071/ES21012
de Burgh-Day C. O., Spillman C. M., Stevens C., Alves O., Rickard G. (2019). Predicting seasonal ocean variability around new Zealand using a coupled ocean-atmosphere model. New Z. J. Mar. Freshw. Res. 53 (2), 201–221. doi: 10.1080/00288330.2018.1538052
Eppley R. W., Harrison W. G., Chisholm S. W., Stewart E. (1977). Particulate organic material in surface waters off Southern California and its relationship to phytoplankton. J. Mar. Res. 35, 671–696
Figueiras F. G., Labarta U., Reiriz M. J. F. (2002). “Coastal upwelling, primary production and mussel growth in the rías baixas of Galicia,” in Sustainable increase of marine harvesting: fundamental mechanisms and new concepts. Eds. Vadstein O., Olsen Y. (Springer Netherlands), 121–131. doi: 10.1007/978-94-017-3190-4_11
Gibbs M. M. (1993). Morphometrically induced estuarine phytoplankton patchiness in pelorus sound, new Zealand. New Z. J. Mar. Freshw. Res. 27 (2), 191–199. doi: 10.1080/00288330.1993.9516557
Glahn H. R., Lowry D. A. (1972). The use of model output statistics (MOS) in objective weather forecasting. J. Appl. Meteorology Climatology 11 (8), 1203–1211. doi: 10.1175/1520-0450(1972)011<1203:TUOMOS>2.0.CO;2
Gómara I., Rodríguez-Fonseca B., Mohino E., Losada T., Polo I., Coll M. (2021). Skillful prediction of tropical pacific fisheries provided by Atlantic niños. Environ. Res. Lett. 16 (5), 054066. doi: 10.1088/1748-9326/abfa4d
Harris TFW (1990). Greater Cook Strait — form and flow. New Zealand Oceanographic Institute, DSIR Marine andFreshwater, Wellington. 212.
Hersbach H., Bell B., Berrisford P., Hirahara S., Horányi A., Muñoz-Sabater J., et al. (2020). The ERA5 global reanalysis. Q. J. R. Meteorological Soc. 146 (730), 1999–2049. doi: 10.1002/qj.3803
Hobday A. J., Spillman C. M., Paige Eveson J., Hartog J. R. (2016). Seasonal forecasting for decision support in marine fisheries and aquaculture. Fisheries Oceanography 25 (S1), 45–56. doi: 10.1111/fog.12083
Huang B., Thorne P. W., Banzon V. F., Boyer T., Chepurin G., Lawrimore J. H., et al. (2017). Extended reconstructed Sea surface temperature, version 5 (ERSSTv5): upgrades, validations, and intercomparisons. J. Climate 30 (20), 8179–8205. doi: 10.1175/JCLI-D-16-0836.1
Jacox M. G., Alexander M. A., Amaya D., Becker E., Bograd S. J., Brodie S., et al. (2022). Global seasonal forecasts of marine heatwaves. Nature 604 (7906), 486–490. doi: 10.1038/s41586-022-04573-9
Jacox M. G., Alexander M. A., Siedlecki S., Chen K., Kwon Y.-O., Brodie S., et al. (2020). Seasonal-to-interannual prediction of north American coastal marine ecosystems: forecast methods, mechanisms of predictability, and priority developments. Prog. Oceanography 183, 102307. doi: 10.1016/j.pocean.2020.102307
Jacox M. G., Alexander M. A., Stock C. A., Hervieux G. (2019). On the skill of seasonal sea surface temperature forecasts in the California current system and its connection to ENSO variability. Climate Dynamics 53 (12), 7519–7533. doi: 10.1007/s00382-017-3608-y
Johnson S. J., Stockdale T. N., Ferranti L., Balmaseda M. A., Molteni F., Magnusson L., et al. (2019). SEAS5: the new ECMWF seasonal forecast system. Geoscientific Model. Dev. 12 (3), 1087–1117. doi: 10.5194/gmd-12-1087-2019
McAdam R., Masina S., Balmaseda M., Gualdi S., Senan R., Mayer M. (2022). Seasonal forecast skill of upper-ocean heat content in coupled high-resolution systems. Climate Dynamics 58 (11–12), 3335–3350. doi: 10.1007/s00382-021-06101-3
Mills K. E., Pershing A. J., Hernández C. M. (2017). Forecasting the seasonal timing of maine’s lobster fishery. Front. Mar. Sci. 4. doi: 10.3389/fmars.2017.00337
Mullan A. B. (1998). Southern hemisphere sea-surface temperatures and their contemporary and lag association with new Zealand temperature and precipitation. Int. J. Climatology 18 (8), 817–840. doi: 10.1002/(SICI)1097-0088(19980630)18:8<817::AID-JOC261>3.0.CO;2-E
New Zealand, A (2022) A sector overview with key facts and statistics for 2022 (New Zealand sustainable aquaculture). Available at: https://drive.google.com/file/d/1-Emyq4uIIt1qYcpyw10ZGu2a-xeFdJGr/view.
Ren J. S., Ross A. H. (2005). Environmental influence on mussel growth: a dynamic energy budget model and its application to the greenshell mussel perna canaliculus. Ecol. Model. 189 (3), 347–362. doi: 10.1016/j.ecolmodel.2005.04.005
Stevens C. L., Spillman C. M., Behrens E., Broekhuizen N., Holland P., Matthews Y., et al. (2022). Horizon scan on the benefits of ocean seasonal forecasting in a future of increasing marine heatwaves for aotearoa new Zealand. Front. Climate 4. doi: 10.3389/fclim.2022.907919
Taboada F. G., Barton A. D., Stock C. A., Dunne J., John J. G. (2019). Seasonal to interannual predictability of oceanic net primary production inferred from satellite observations. Prog. Oceanography 170, 28–39. doi: 10.1016/j.pocean.2018.10.010
Tommasi D., Stock C. A., Alexander M. A., Yang X., Rosati A., Vecchi G. A. (2017). Multi-annual climate predictions for fisheries: an assessment of skill of Sea surface temperature forecasts for Large marine ecosystems. Front. Mar. Sci. 4. doi: 10.3389/fmars.2017.00201
Trenberth K. E. (1976). Fluctuations and trends in indices of the southern hemispheric circulation. Q. J. R. Meteorological Soc. 102 (431), 65–75. doi: 10.1002/qj.49710243106
Verity P. G. (2002). A decade of change in the skidaway river estuary i. hydrography and nutrients. Estuaries 25 (5), 944–960. doi: 10.1007/BF02691343
Wilby R. L., Wigley T. M. L. (1997). Downscaling general circulation model output: a review of methods and limitations. Prog. Phys. Geography: Earth Environ. 21 (4), 530–548. doi: 10.1177/030913339702100403
Zeldis J., Hadfield M., Booker D. (2013). Influence of climate on pelorus sound mussel aquaculture yields: predictive models and underlying mechanisms. Aquaculture Environ. Interact. 4 (1), 1–15. doi: 10.3354/aei00066
Keywords: seasonal forecasting, mussel meat yield, aquaculture, teleconnections, sea surface temperature
Citation: Rampal N, Broekhuizen N, Plew D, Zeldis J, Noll B, Meyers T, Whitehead AL, Fauchereau N and Stenton-Dozey J (2023) Seasonal forecasting of mussel aquaculture meat yield in the Pelorus Sound. Front. Mar. Sci. 10:1195921. doi: 10.3389/fmars.2023.1195921
Received: 29 March 2023; Accepted: 16 May 2023;
Published: 31 May 2023.
Edited by:
Morten Omholt Alver, Norwegian University of Science and Technology, NorwayReviewed by:
Jordan Snyder, University of California, Santa Barbara, United StatesVincenzo Parrino, University of Messina, Italy
Copyright © 2023 Rampal, Broekhuizen, Plew, Zeldis, Noll, Meyers, Whitehead, Fauchereau and Stenton-Dozey. This is an open-access article distributed under the terms of the Creative Commons Attribution License (CC BY). The use, distribution or reproduction in other forums is permitted, provided the original author(s) and the copyright owner(s) are credited and that the original publication in this journal is cited, in accordance with accepted academic practice. No use, distribution or reproduction is permitted which does not comply with these terms.
*Correspondence: Neelesh Rampal, TmVlbGVzaC5SYW1wYWxAbml3YS5jby5ueg==
 Neelesh Rampal
 Niall Broekhuizen
 David Plew
 John Zeldis
 Ben Noll
 Tristan Meyers1