 Tatsuya Kawakami
 Aya Yamazaki1,2
 Hiromichi Ueno
 Akihide Kasai
94% of researchers rate our articles as excellent or good
Learn more about the work of our research integrity team to safeguard the quality of each article we publish.
Find out more
ORIGINAL RESEARCH article
Front. Mar. Sci., 30 August 2023
Sec. Marine Biology
Volume 10 - 2023 | https://doi.org/10.3389/fmars.2023.1193083
This article is part of the Research TopicSharing Technical Knowledge to Understand the Distribution Patterns and Migration History of Marine OrganismsView all 11 articles
Ongoing warming and sea-ice reductions in the Arctic can seriously impact cold-water species, such as polar cod (Boreogadus saida), necessitating biomonitoring to reveal the ecological consequences. Recent methodological advancements in environmental DNA (eDNA) techniques have increased our ability to conduct ecological monitoring at various locations, including the Arctic. This study aimed to provide an overview of the distribution of polar cod across the Bering and Chukchi Seas by employing species-specific detection of eDNA. First, we successfully developed novel species-specific qPCR assay targeting the mitochondrial D-loop region, which exclusively amplifies eDNA derived from polar cod. Subsequently, polar cod eDNA was detected using the assay from the samples that we collected latitudinally across the study area during the open-water season. Polar cod eDNA was primarily detected in the surface water from the central Chukchi Sea shelf and the northernmost observation line (75°N), which was located on the shelf slope, off the Point Barrow, and in the marginal ice zone. In contrast, only trace amounts of eDNA were detected in the Bering Sea. This pattern corresponded well with the distribution of water masses classified based on environmental conditions. The detection of eDNA in surface water was clearly limited to cold (-1 to 5°C) and low salinity (25–32) water, whereas it was detected in a higher salinity range (32–34) in the middle and bottom layers. These findings are consistent with current knowledge about the distribution and habitat of the polar cod, suggesting that eDNA can be regarded as a reliable tool to replace or supplement conventional methods. Incorporating eDNA techniques into large-scale oceanographic surveys can improve the spatial and temporal resolution of fish species detection with a reasonable sampling effort and will facilitate the continuous monitoring of Arctic ecosystems.
Acquiring biological data at various spatiotemporal scales is a considerable challenge for understanding dynamic ecological changes, such as in the Arctic marine ecosystem, which is currently experiencing rapid changes in response to global warming (Huntington et al., 2020; Hirawake et al., 2021). The loss of Arctic sea ice has accelerated recently, and the combination of earlier sea ice melt and delayed freeze-up has expanded ice-free waters, altering the timing and magnitude of phytoplankton and zooplankton blooms (Ardyna and Arrigo, 2020). Increasing temperatures and sea ice reduction have also induced a poleward shift in the distribution of fish, leading to a borealization of fish communities in the Arctic (Fossheim et al., 2015). Such a poleward shift has consequently altered the Arctic marine food webs (Kortsch et al., 2015). Human activities such as commercial fishing, vessel traffic, and resource development have expanded in the Arctic Ocean, coupled with an increasing duration of ice-free periods (Alvarez et al., 2020; Fauchald et al., 2021), while local communities that rely on the presence of sea ice for traditional subsistence activities have also been critically affected (Carothers et al., 2019; Cooley et al., 2020). However, ecological data in the Arctic are rather sporadic, and several studies focusing on Arctic ecosystem changes have emphasized the importance of comprehensive monitoring (e.g., Eamer et al., 2013; Hirawake et al., 2021; Skjoldal, 2022).
Recently, advanced approaches have provided unique insights into the understudied Arctic environment, particularly focusing on sea-ice-associated ecosystems. The Surface and Under-Ice Trawl (SUIT), which can collect animals dwelling beneath sea ice, revealed a close association between polar cod (Boreogadus saida) and the sea ice habitat in the central Arctic Ocean (David et al., 2016). Continuous acoustic measurements via subsurface mooring in the Chukchi Sea revealed that biological variability occurs at multiple temporal scales (i.e., diel, seasonal, and annual) and is closely associated with temporal variability in environmental conditions (Gonzalez et al., 2021). The Multidisciplinary Drifting Observatory for the Study of Arctic Climate (MOSAiC), which moored an icebreaker inside the freezing sea-ice pack for continuous observation, provided a comprehensive suite of observations on the atmosphere, sea ice, ocean, ecosystem, and biogeochemistry over an annual cycle in the Central Arctic (Shupe et al., 2020). One of the most important outcomes of these studies was that overcoming the limitations inherent to conventional methods, such as net sampling, is clearly required to completely understand ecosystem structure and dynamics in the Arctic.
Methodological advances in environmental DNA (eDNA) techniques have improved our ability to conduct ecological monitoring in a variety of environments, including the Arctic (Lacoursière-Roussel et al., 2018; Leduc et al., 2019; Sevellec et al., 2021; Jensen et al., 2023; Merten et al., 2023). eDNA was originally defined as a complex mixture of genomic DNA from many different organisms found in environmental samples (Taberlet et al., 2012). Although the study of eDNA first drew attention in the 1980s by focusing on microbial DNA, pioneering works in the 2000s, which successfully detected eDNA originating from macroorganisms (e.g., Ficetola et al., 2008), stimulated the use of eDNA for ecological studies of aquatic animals such as amphibians, reptiles, fishes, and marine mammals (Taberlet et al., 2018). Fish are one of the most enthusiastically studied groups using eDNA, and an increasing number of studies have been conducted to reveal the ecology of eDNA (i.e., origin, state, fate, and transport; Barnes and Turner, 2016) and to reveal the fish biodiversity hidden beneath the water (Thomsen and Willerslev, 2015; Deiner et al., 2017). These studies have proven the usefulness of eDNA as an alternative or supplement to conventional methods for biodiversity monitoring, owing to its standardized sampling procedure, non-destructive nature, and sensitivity (Thomsen and Willerslev, 2015; Deiner et al., 2017).
Consequently, eDNA is a promising tool for studying the ecological changes in Arctic fish. Poleward shifts in fish associated with warming temperatures and sea-ice loss have been predicted and observed in recent years (Hollowed et al., 2013; Fossheim et al., 2015; Frainer et al., 2017). One of the clear advantages of the eDNA method is that it reduces laborious work in the field: eDNA can be retrieved by collection and filtration of water in situ (Thomsen and Willerslev, 2015), implying that eDNA reduces the limitations in the season, extent, and resolution of the study design, which are often encountered when using net sampling. Moreover, eDNA detection has been shown to have sufficient sensitivity to evaluate the horizontal and vertical distribution of target species in the open ocean, although estimation of their abundance based on eDNA concentration is often controversial (Knudsen et al., 2019; Canals et al., 2021; Shelton et al., 2022). Therefore, studies investigating distribution in Arctic fish would benefit from the application of eDNA techniques.
The polar cod is considered a key species in the Arctic ecosystem because of its circumpolar distribution (Mecklenburg et al., 2018), predominance in fish stocks (Hunt et al., 2013; Goddard et al., 2014), and major importance as a prey item for various predators, including seabirds and marine mammals, transmitting energy to higher trophic levels throughout the Arctic food web (Welch et al., 1992; Harter et al., 2013). Assuming that this species prefers cold water (probably about -1.5–5.0°C; Thorsteinson and Love, 2016) and is potentially dependent on sea ice as a habitat, spawning ground, and nursery ground (Gradinger and Bluhm, 2004; David et al., 2016), polar cod is considered very susceptible to sea ice reduction (Geoffroy et al., 2023). In attempts to prove this, recent model studies predicted the negative effect of warming events on polar cod ecology and suggested that changes are likely to have cascading effects on their predators (Huserbråten et al., 2019; Florko et al., 2021). Despite their prevalence in the Arctic ecosystem, there is a paucity of knowledge about their broad-scale abundance, as well as many ecological aspects regarding their life cycle, stock structures, and population movements with respect to important habitats (Pettitt-Wade et al., 2021; Geoffroy et al., 2023). In particular, mapping of polar cod distribution is essential for understanding the ecological importance of polar cod as a key component of the Arctic ecosystem (Forster et al., 2020).
In this study, we present the first application of species-specific eDNA detection to estimate the distribution of polar cod across the Bering Sea and Chukchi Sea. To illustrate the distribution of polar cod eDNA, we developed a new species-specific quantitative real-time PCR (qPCR) TaqMan assay. We applied this assay to eDNA samples collected from the Bering Sea and Chukchi Sea to estimate the probable distribution of polar cod in the region. Subsequently, the habitat preference of polar cod was determined by combining the results of eDNA detection with environmental conditions.
This study was conducted in the Bering Sea and the Chukchi Sea in the Arctic Ocean during a cruise (MR20-05C) conducted by the ‘R/V Mirai’ of the Japan Agency for Marine-Earth Science and Technology from September 19 to November 2, 2020 (Figure 1). The Bering Sea is surrounded by Alaska to the east, Siberia to the north-west, the Kamchatka Peninsula to the west, and Aleutian Islands to the south. The Bering Sea is divided into two regions: the southwestern part is an ocean basin with a depth of approximately 4,000 m, and the northeastern part is a continental shelf with a depth of less than 200 m. The Chukchi Sea, which connects to the Bering Sea via the Bering Strait, is composed of a continental shelf with a depth of approximately 50 m and is adjacent to the Canada Basin with a maximum depth of approximately 4,000 m.
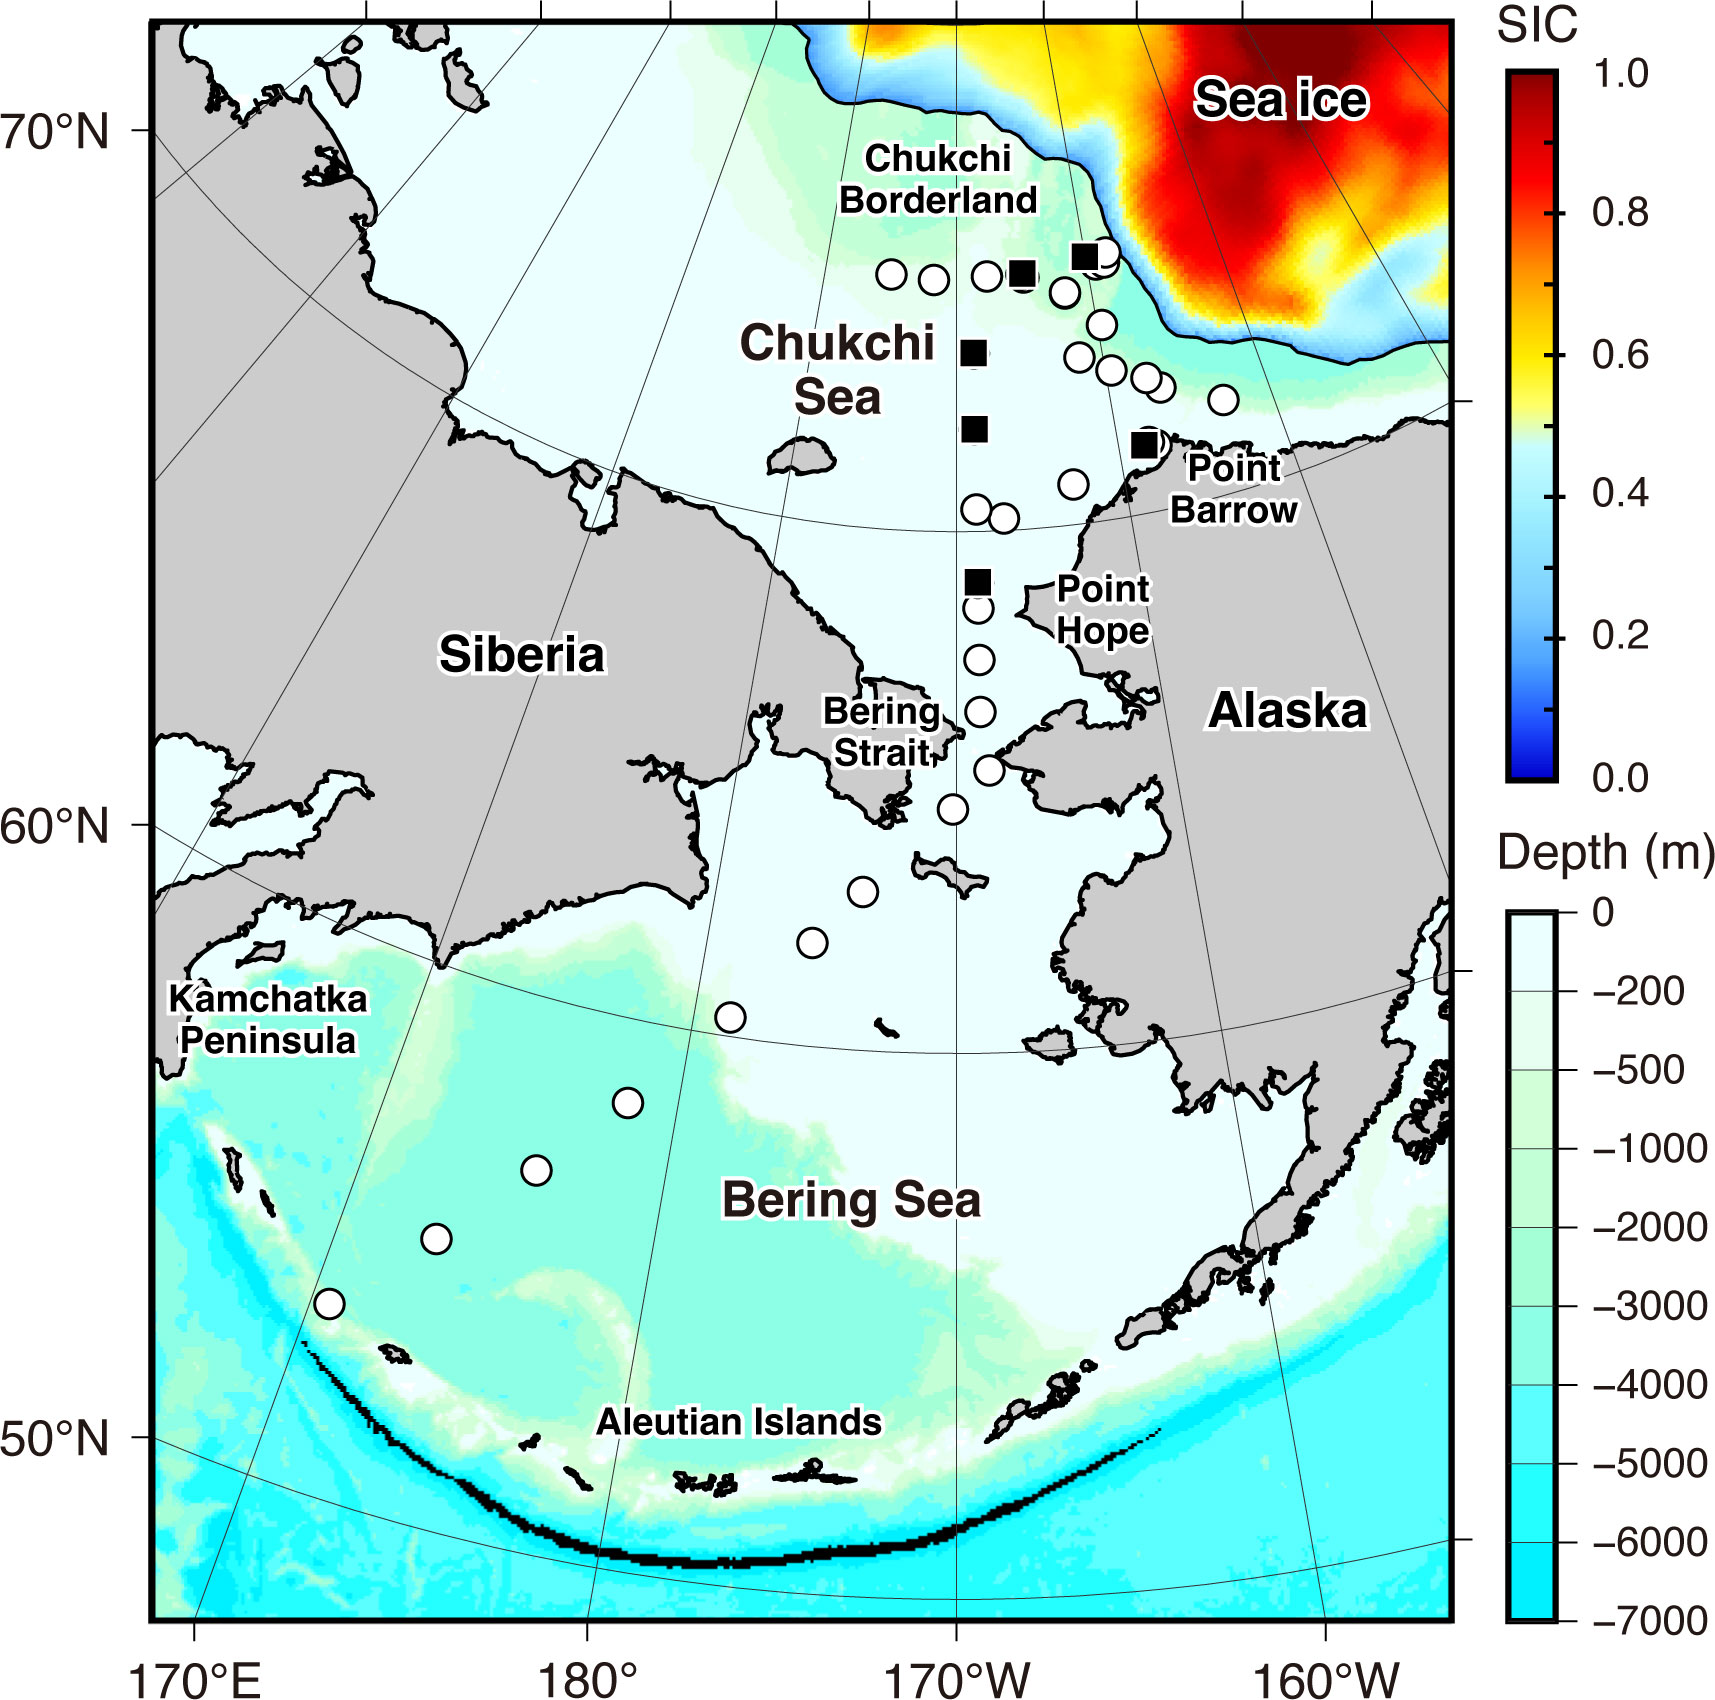
Figure 1 Map with bathymetric depth showing the study sites for eDNA collection. The white circles and black squares represent the locations where eDNA was collected from surface water and surface and middle or bottom layer water, respectively. The sea-ice concentration (SIC) on October 10, 2020, when eDNA sampling began in the Chukchi Sea, is indicated by color based on satellite-based data from Nimbus-7 SMMR and DMSP SSM/I-SSMIS Passive Microwave Data, Version 2, with a 25-km grid provided by the National Snow and Ice Data Center (NSIDC). Solid line enclosed sea ice area indicates the 0.15 concentration contour.
Several distinct water masses have been found in the study area (Danielson et al., 2017). The Bering Slope Current, which flows northwestward along the continental slope, forms the boundary between the southwestern and northeastern parts of the Bering Sea. Three water masses have been recognized in the Bering Sea (Coachman et al., 1975): The Anadyr Water (AnW) is distinguished by its relatively saline, cold, and nutrient-rich water; The Alaska Coastal Water (ACW) is distinguished by its relatively warm and less saline water; The Bering Shelf Water (BeSW) having intermediate characteristics between AnW and ACW. These water masses flow into the Chukchi Sea through the Bering Strait and comprise the Bering-Chukchi Waters (BCSW; Bering-Chukchi Summer Water and BCWW; Bering-Chukchi Winter Water; Danielson et al., 2017). After entering the Chukchi Sea, these water masses flow northward along three major conduits: the Herald Canyon in the west, the Barrow Canyon in the east, and the Central Channel across the mid-shelf (Danielson et al., 2017). The Beaufort Gyre circumscribes the northern shelf slope of the Chukchi Sea shelf in a clockwise direction. The surface of the Canada Basin is covered by a polar mixed layer consisting of a low-salinity sea ice meltwater layer (MW) with near-freezing temperature (Danielson et al., 2017; Skjoldal, 2022).
The cruise was conducted during the open-water season. According to satellite-based sea ice concentration (SIC) data from Nimbus-7 SMMR and DMSP SSM/I-SSMIS Passive Microwave Data, Version 2, with a 25 km grid (provided by the National Snow and Ice Data Center (NSIDC); https://nsidc.org/data/data-access-tool/NSIDC-0051/versions/2), sea ice covered the Alaskan side of the Canada Basin. The northernmost edge of our study area, located around the Chukchi Borderland, was in the marginal ice zone (Figure 1).
The SIC data was also used to approximate the distance between the sampling sites and the sea ice edge. The daily SIC data corresponding to the study period were downloaded from the previously mentioned NSIDC website. The data were visualized using panoply version 5.2.3 (available online: https://www.giss.nasa.gov/tools/panoply/) and then exported as a KMZ file. These KMZ files were imported to Google Earth Pro 7.3.6.9345 (available online: https://www.google.co.jp/earth/about/versions/). The sea ice edge was defined as the contour of SIC = 0.15. The shortest distance between the sampling sites and the sea ice edge of the day was then calculated using the “Measure” function in Google Earth Pro. To avoid the path on a map intersecting land, the coordinates of Diomede, located in the middle of the Bering Strait (65° 45’ 30” N, 168° 57’ 06” W), and a sampling site located off Point Hope (68° 30’ 1.31” N, 168° 49’ 41.84” W), were used as waypoints when calculating the distance from the sampling sites in the Bering Sea.
eDNA samples were collected from 29 sites in the Chukchi Sea and nine sites in the Bering Sea from October 3 to October 24 (Figure 1). The geodesic distance from every sampling site to the nearest one ranged from 2 to 255 km (median [first quartile, third quartile] = 77 [24, 149] km). Based on the distance between our sampling sites and the current speed (m/s) that was obtained with a hull-mounted Acoustic Doppler Current Profiler (Teledyne RD Instruments, San Diego, CA, USA), it is estimated that eDNA shed at a particular site would take approximately 0.1–32 days (3.8 [1.6, 12.9] days) to drift from one sampling site to the nearest neighboring site.
As the surface water, seawater pumped from approximately 4.5 m depth was collected from the laboratory faucet of the ship. Because the seawater was used for continuous measurements of environmental conditions and water quality, it was filtered using a coarse metal scrub brush along the path of intake to remove large materials that could interfere with the measurements. We maintained a constant flow (approximately 5 L/min) of seawater throughout the cruise to ensure that the seawater in derivation pipes and tubes was always replaced with newly taken seawater. The insides of the pipes and tubes were considered to be constantly rinsed with fresh seawater. In addition to the surface water, water samples were collected from the middle or bottom layers using 12 L Niskin bottles mounted on a conductivity–temperature–depth (CTD)/Carousel Water Sampling System at six stations (Figure 1). The middle layer was defined as beneath the mixed layer or at the depth with the highest light attenuation rate, which is expected to be the most turbid layer (Supplementary Figure 1). The bottom layer was defined as being 5 m above the sea floor. For each water sample, a clean, foldable plastic bag was filled with 12 L of collected water.
Detailed sampling procedure for eDNA was described in Kawakami et al. (2023). Briefly, water samples were vacuum-filtered onto a Sterivex-HV filter unit (0.45 µm pore size, PVDF; Millipore, Burlington, MA, USA) using an aspirator (GAS-1N; AS ONE, Osaka, Japan) connected to a manifold (Multivac 310-MS; Rocker, Kaohsiung City, Taiwan) in the ship’s laboratory, which was not used for processing organism samples. Filtration was halted when the filter became severely clogged. The filtration volume was calculated by subtracting the volume of unfiltered water from the initial volume (12L). Consequently, the filtration volume ranged from 1.6 to 12 L. The filtered sample was immersed in 1.6 mL of RNAlater (Thermo Fisher Scientific, Waltham, MA, USA) and stored at –20°C until DNA extraction. For every 10–12 samples of seawater, negative controls were created by filtering 500 mL of Milli-Q water following the same procedure as seawater sampling.
To prevent cross-contaminations, all equipment used for water collection and filtration was decontaminated by soaking them in a 2% bleach solution (approximately 0.12% NaOCl) for at least 10 min. To remove any remaining bleach, the equipment was subsequently rinsed with tap and Milli-Q water. The workspace was decontaminated using bleach disinfectant spray (approximately 0.1% NaOCl). For each water collection and filtration, new gloves and masks were used.
Temperature (°C), salinity (psu), and chlorophyll a (chl a) fluorescence (RFU) of the surface water at the sampling sites were obtained from a Continuous Sea Surface Water Monitoring System (Marine Works Japan Co., Ltd., Kanagawa, Japan). Their vertical profiles were measured by the CTD at sampling sites where the middle and bottom waters were collected. The CTD data are available in the Arctic Data archive System (ADS) managed by the National Institute of Polar Research, Japan, under the ID of A20220803-010 (Nishino, 2020; Nishino, 2022).
DNA was extracted from each filter using the Qiagen DNeasy Blood and Tissue kit (Qiagen, Hilden, Germany), according to Wong et al. (2020), who modified the original extraction protocol to improve the extraction efficiency from the Sterivex filter. Extraction was performed using vacuum-driven liquid processing with a manifold (QiaVac; Qiagen) and vacuum pump (MAS-01; AS ONE). Throughout the process, a VacValve and VacConnector (Qiagen) were utilized in conjunction with the manifold to reduce the risk of contamination from backflow into the columns and direct contact with the manifold.
After removing the RNAlater, 2 mL of a lysis buffer mix containing PBS (990 L), Buffer AL (910 L), and Proteinase K (100 L) was introduced to the Sterivex through its outlet using a 2.5 mL syringe (Terumo Corporation, Tokyo, Japan). The filter was sealed with luer fittings and incubated at 56°C without rotation for 30 minutes. Subsequently, the filter was centrifuged at 2500 g for 10 minutes, and the lysate was retrieved in a 3 mL polypropylene tube. The lysate was filtered using a DNeasy Blood and Tissue kit column after being mixed with 1 mL of 99.5% ethanol (FUJIFILM Wako Pure Chemical Corporation, Osaka, Japan). The column was then washed sequentially with 0.8 mL of AW1 buffer and 0.8 mL of AW2 buffer, followed by 2 minutes of centrifugation at 21,300 g for drying. The adsorbed DNA was eluted from the column into a DNA LoBind Tube (Eppendorf, Hamburg, Germany) twice with 75 μL AE buffer to maximize recovery. A total of 150 μL DNA extract was collected from each filter and stored at –20°C.
We designed novel primers and probes that exclusively amplify DNA derived from polar cod in samples collected from the Bering and Chukchi Seas. The mitochondrial D-loop region was chosen as a candidate region for designing a new specific marker because it is one of the major target regions adopted for species-specific eDNA detection owing to its high inter-specific variability (Tsuji et al., 2019).
Twelve gadid species are known to be distributed in the Arctic region (Mecklenburg et al., 2018). We searched and downloaded the D-loop sequences available for these species from GenBank (http://www.ncbi.nlm.nih.gov/), resulting in a set of D-loop sequences for polar cod and eight other species (saithe, Pollachius virens; Arctic cod, Arctogadus glacialis; saffron cod, Eleginus gracilis; Atlantic cod, Gadus morhua; walleye pollack, G. chalcogrammus; Pacific cod, G. macrocephalus; Haddock, Melanogrammus aeglefinus; and whiting, Merlangius merlangus).
Primer-BLAST (https://www.ncbi.nlm.nih.gov/tools/primer-blast/) was used to generate specific primer pairs for polar cod on the target region. For running Primer-BLAST, a sequence of the D-loop region of polar cod extracted from the reference sequence (NC_010121) was provided as a PCR template, and those of non-target species were set as a database for checking primer pair specificity. Tm of the candidate primers was calculated using the Tm calculator provided by ThermoFisher Scientific (https://www.thermofisher.com/jp/ja/home/brands/hermos-scientific/molecular-biology/molecular-biology-learning-center/molecular-biology-resource-library/hermos-scientific-web-tools/tm-calculator.html). Subsequently, primer pairs with an amplicon length of less than 180 bp and a Tm of 58-60°C were selected. Following that, an MGB probe was designed on the amplicon sequences using PrimerExpress 3.0 (Thermo Fisher Scientific, Waltham, MA, USA) using the default settings.
The specificity of the newly designed primers and probe for polar cod was confirmed in silico using Primer-BLAST (https://www.ncbi.nlm.nih.gov/tools/primer-blast/) against the nr database. Consequently, we selected the primer set and probe described in Table 1 and Supplementary Figure 2 for the polar cod eDNA assay. All available sequences for these regions of polar cod were identical, except for one sequence containing one mismatch in the probe region.
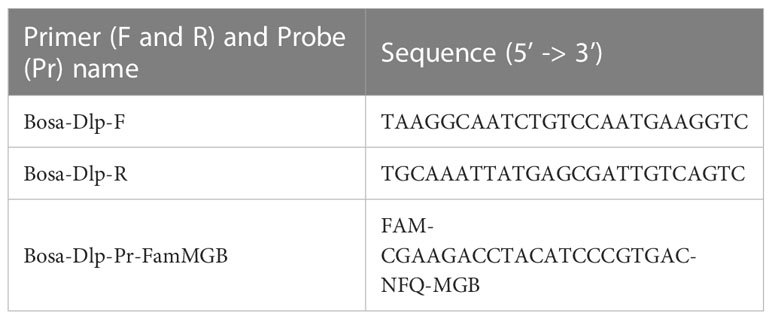
Table 1 Primers and probe designed in this study for species-specific detection of polar cod, Boreogadus saida.
The specificity of the assay was further confirmed in vitro using DNA samples extracted from the tissues of five gadid species (polar cod, Pacific cod, walleye pollock, Atlantic cod, and saffron cod), which may have co-occurred in the study area. Their DNA was extracted using the DNeasy Blood & Tissue kit (Qiagen) following manufacturer’s protocol from the following tissues: the ethanol-preserved muscle of polar cod collected in the Chukchi Sea during the cruise of T/S Oshoro-Maru of Hokkaido University; the ethanol-preserved testis of pacific cod captured off Hokkaido, Japan; purchased dried fish for walleye pollock and saffron cod captured off Hokkaido, Japan; a dried dorsal fin of Atlantic cod, collected around Norway. In the specificity test, these extractions were diluted 10 pg/µL and 100 pg/µL after measuring the concentration using a Qubit dsDNA HS Assay Kit and Qubit 4 Fluorometer (ThermoFisher Scientific).
qPCR with a newly designed species-specific eDNA assay was performed in a StepOne plus real-time PCR system (Life Technologies) with a 15 µL reaction containing 1x Environmental Master Mix 2.0 (ThermoFisher Scientific), 900 nM of each primer, 125 nM of a probe, 0.075 μL of AmpErase™ Uracil N-Glycosylase (Thermo Fisher Scientific, Waltham, MA, USA), and 2 μL of DNA template. A no-template control (NTC) was included in the PCR run using 2.0 μL of nuclease-free water (UltraPure; Invitrogen, Waltham, MA, USA) in place of the DNA template. The thermal conditions were as follows: 50°C for 2 min, 95°C for 10 min, 55 cycles at 95°C for 15 s, and 60°C for 1 min.
A newly designed assay was applied to eDNA samples collected from the Bering and Chukchi Seas to estimate the distribution of polar cod. The assay was performed under the same PCR conditions as those described above. A 2 µL of eDNA extract was used as a template in each PCR. To evaluate cross-contamination, a no-template control (NTC) was included in each PCR run using 2 μL of nuclease-free water (UltraPure; Invitrogen, Waltham, MA, USA) instead of the DNA template. Three technical replicates were used for each sample.
To determine the quantity of target DNA in each sample, 10-fold serial dilutions ranging from 30 to 30,000 copies/reaction of the artificially-synthesized double-stranded DNA (gBlocks; Integrated DNA Technologies, Inc., Coralville, IA, USA) containing the target sequence were included in triplicate for each qPCR run. The concentration of the stock standard solution was quantified using a Qubit dsDNA HS Assay Kit and a Qubit 4 Fluorometer (Thermo Fisher Scientific) and then diluted in TE buffer. To eliminate suspicious detection, reaction resulting in < 1 copies/reaction was converted to 0. After conversion, the mean of the triplicates was used to represent the number of eDNA copies in each sample. The eDNA concentration in seawater (copies/L) was calculated by converting the number of eDNA copies per reaction to the total number of eDNA copies present in the DNA extract, and then dividing this value by the filtration volume.
For DNA extraction and PCR preparation, filter samples were processed in a laboratory dedicated to eDNA analysis, which was isolated from a room for PCR, ensuring neither tissue nor PCR products were handled. PCR amplification was performed in a separate room. During every step of the molecular work, researchers always wore new gloves and masks. The laboratory and all equipment (micropipettes, incubator, and centrifuge) were cleaned with DNA-OFF (Takara, Shiga, Japan) and distilled water. In addition, the extraction apparatus (manifold, valves, and tubes) was decontaminated with a bleach solution, as detailed previously.
All statistical analyses were performed using R v.4.1.2 (R Core Team, 2021) in combination with RStudio v.2022.02.3 (available online: https://www.rstudio.com/) and the packages implemented in it. Additionally, GMT 5.4.5 (Wessel et al., 2013) was used to visualize the results.
To explore the association between the study sites and water masses, the sampling sites were classified using clustering and ordination analyses based on water temperature, salinity, and chl a, which are potential indices of distinct water masses across the Bering and Chukchi Seas (Danielson et al., 2017). First, we performed a clustering analysis based on Euclidean distances using Ward’s linkage. The similarity profile (SIMPROF) test (Clarke et al., 2008) using the “simprof” function of the “clustsig” package in R was subsequently applied to identify statistically significant clusters (the significance threshold was set at 0.05). The SIMPROF test examines the multivariate structure within groups of samples by comparing the similarity profile constructed from the results of the cluster analysis with that constructed from the original data using the iterative permutation procedure. The results of the cluster analysis were visualized by Principal Component Analysis (PCA) using the “prcomp” function of the “stats” package and “fviz_pca_biplot” function of the “factoextra” package in R. Chl a was included in these analyses after log transformation. Before these analyses were conducted, the environmental parameters were normalized.
The environmental conditions were compared between the sampling sites where polar cod eDNA was detected or not detected using the Wilcoxon rank-sum exact test after assuming homoscedasticity based on the results of the Bartlett test. The significance level was set at 0.05.
Multiple logistic regression analysis was used to relate the detection of polar cod eDNA to environmental conditions (water temperature, salinity, chl a, and topography). Prior to the logistic regression, the qPCR results were converted to presence/absence data. The distance from the sea ice edge was excluded from the analysis due to a significant and strong correlation with water temperature (Pearson’s product moment correlation: r = 0.906, t = 12.823, p < 0.001). Chl a was incorporated into the model after log transformation. The topography was roughly determined based on the bottom depth as shelf (< 200 m) and slope or basin (≥ 200 m). The logistic model was fitted to the data with a binomial error distribution and a logit link using the “glm” function in the “stats” package in R. After constructing a full model, the best model was selected using the “stepAIC” function in the “MASS” package in R based on Akaike’s information criterion (AIC).
As a result of qPCR using DNA extracted from the tissues of five gadid species, including polar cod, our newly designed assay exclusively detected the DNA of polar cod at both concentrations (10 pg/µL and 100 pg/µL), except for one sample of walleye pollock containing 100 pg/µL of DNA (Supplementary Figure 3). Although nonspecific detection of walleye pollock DNA was observed, the DNA was not detected at lower concentration (10 pg/µL) and its Ct (45.98) was clearly higher than the intercept of standard curve (41.03, Supplementary Table 1), which corresponds to 1 copy/reaction. This suggested that the risk of false detection of walleye pollock can be negligible when using 1 copy/reaction as a cut-off value for quantity. Therefore, this assay was assumed to be sufficiently specific and was used in subsequent analyses.
The R2, intercept, log-linear slope, and efficiency of the standard curve across four runs for eDNA samples were 0.998 ± 0.001, 41.03 ± 0.37, -3.50 ± 0.07, and 93.19 ± 2.47 (mean ± SD), respectively (Supplementary Table 1). None of the negative controls (field negative controls and NTC for PCR) yielded positive results for polar cod eDNA, indicating that cross-contamination during the experiment was negligible and that the qPCR results obtained in this study were reliable.
The sampling sites were classified into five significant clusters based on the SIMPROF results (Supplementary Figure 4). Overlaying the clustering results on the PCA ordination and a geographical map revealed that these clusters corresponded well with the known water masses throughout the study area (Figure 2A, Table 2, Supplementary Figure 5). Cluster 1 consisted of sampling sites south of 62°N in the Bering Sea, where the water was saline, warm, and high in chl a concentration. The sampling sites across the Bering Strait and central Chukchi Sea shelf comprised two distinct clusters (clusters 2 and 3). Although salinity was comparable between these three clusters, both temperature and salinity decreased gradually with increasing latitude (Table 2, Supplementary Figure 5). The sites along the northernmost edge of our study area (approximately 75°N) were also classified as having subzero temperatures and low salinity (cluster 5). The sites near the Point Barrow were classified as another cluster (cluster 4) with intermediate temperature and salinity compared to those of clusters 3 and 5. In addition, both water temperature and salinity tended to decrease with increasing proximity to the sea ice edge. These clusters corresponded to the water masses identified by Danielson et al. (2017) based on temperature and salinity: ACW (cluster 1), BCSW (clusters 2 and 3), and MW (clusters 4 and 5), respectively.
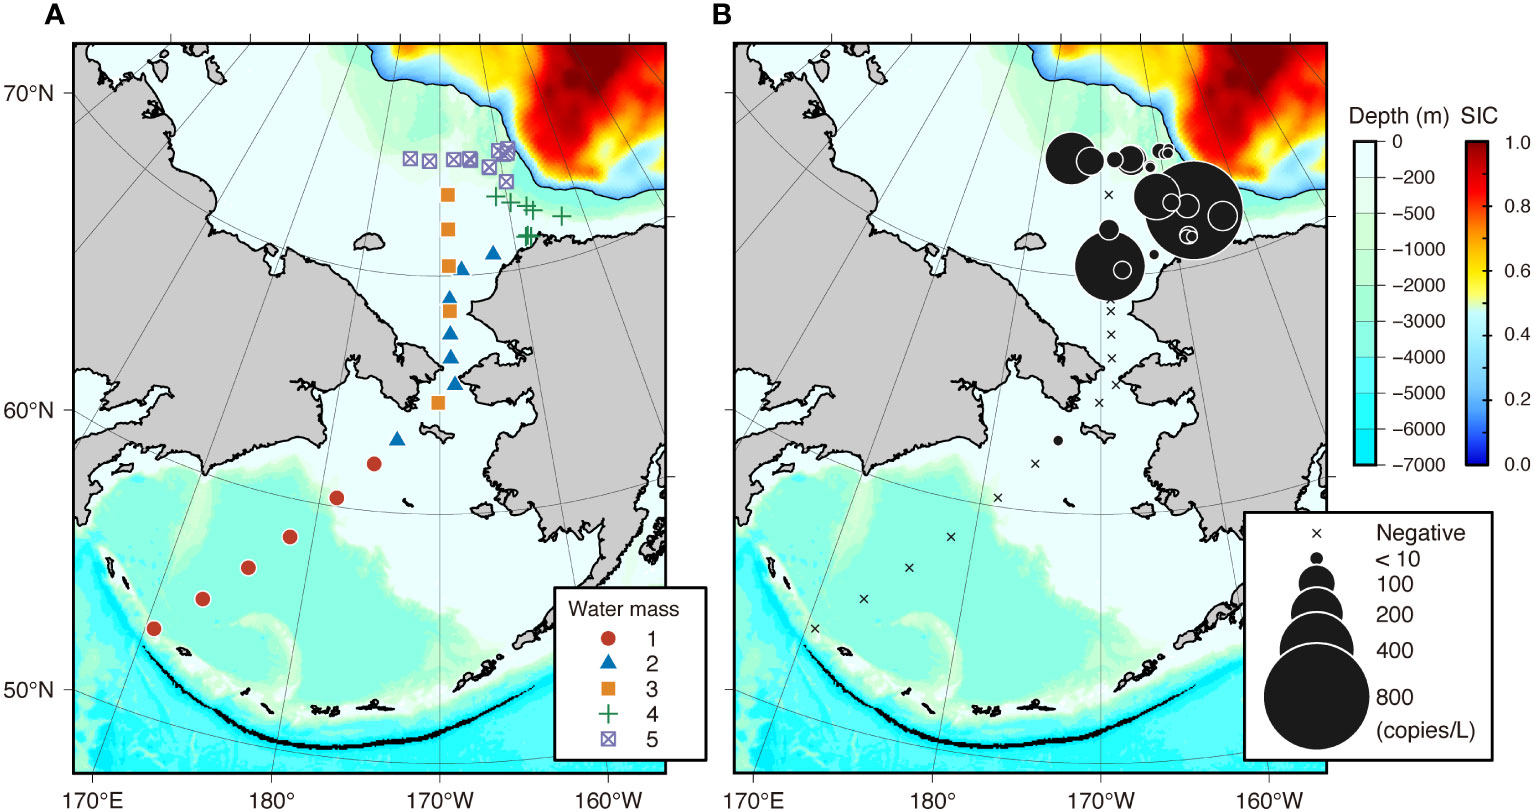
Figure 2 Water mass classification of eDNA sampling sites (A) and horizontal difference in polar cod Boreogadus saida eDNA concentrations (copies/L) across 38 sampling sites in the Bering and Chukchi Seas using a newly designed assay (B). Sea-ice concentration (SIC) was overlaid on the map. Symbols indicating water masses in panel A correspond to the results of clustering analysis with the SIMPROF test shown in Table 2. The area of black circles in (B) indicates the eDNA concentration, while the crosses indicate locations where polar cod eDNA was not detected.
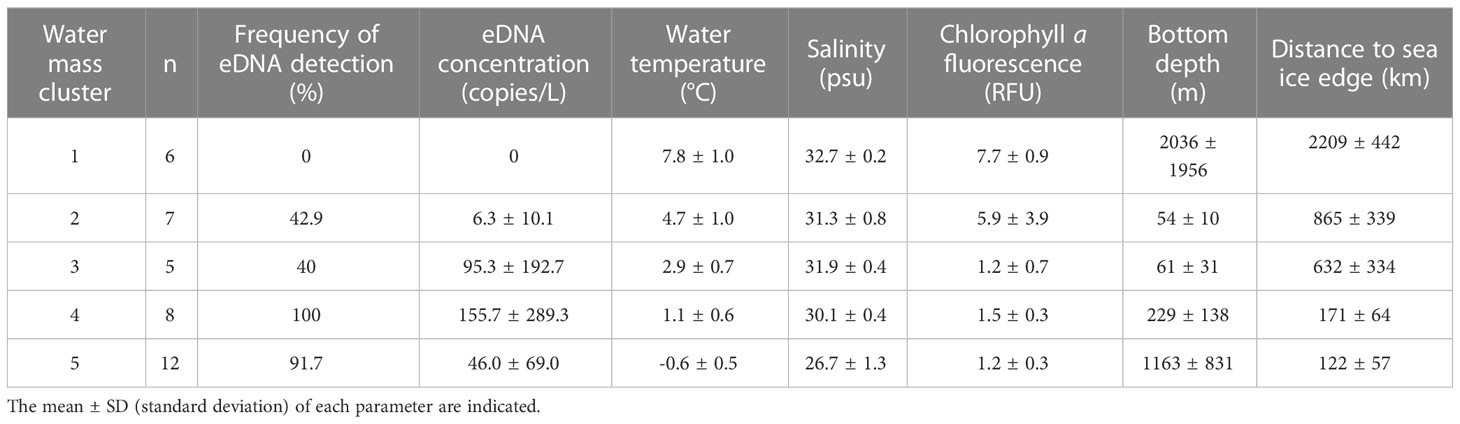
Table 2 Summary of detection results of Polar cod Boreogadus saida eDNA and environmental conditions (water temperature, salinity, chlorophyll a fluorescence, bottom depth, and distance from sea ice edge) in each water mass cluster identified by the SIMPROF test.
Polar cod eDNA was detected primarily in the central part of the Chukchi Sea shelf and in the northernmost observation line, which was located on the shelf slope off the Point Barrow and marginal ice zone (Figure 2B). In contrast, polar cod eDNA was rarely found in the Bering Sea. Based on the classification of water masses, polar cod eDNA was most frequently and abundantly detected in the sites classified as clusters 4 and 5, which showed cold, less saline water (92% with 46 ± 69 copies/L in cluster 4, and 100% with 156 ± 289 copies/L in cluster 5; Table 2). In contrast, no polar cod eDNA was detected in the sites belonging to cluster 1, which showed warm, saline water. At sites belonging to clusters 2 and 3, polar cod eDNA was detected sporadically at moderate concentrations (50% with 7 ± 11 copies/L in cluster 4, and 40% with 95 ± 193 copies/L in cluster 5).
Polar cod eDNA was also detected in the middle and bottom layers of all six sites examined for vertical comparison, including sites where no polar cod eDNA was detected in surface samples (Figure 3). Despite the different environmental conditions of the site’s surface water, polar cod eDNA was detected in the bottom layer across the Chukchi Sea shelf at depths of 50–120 m.
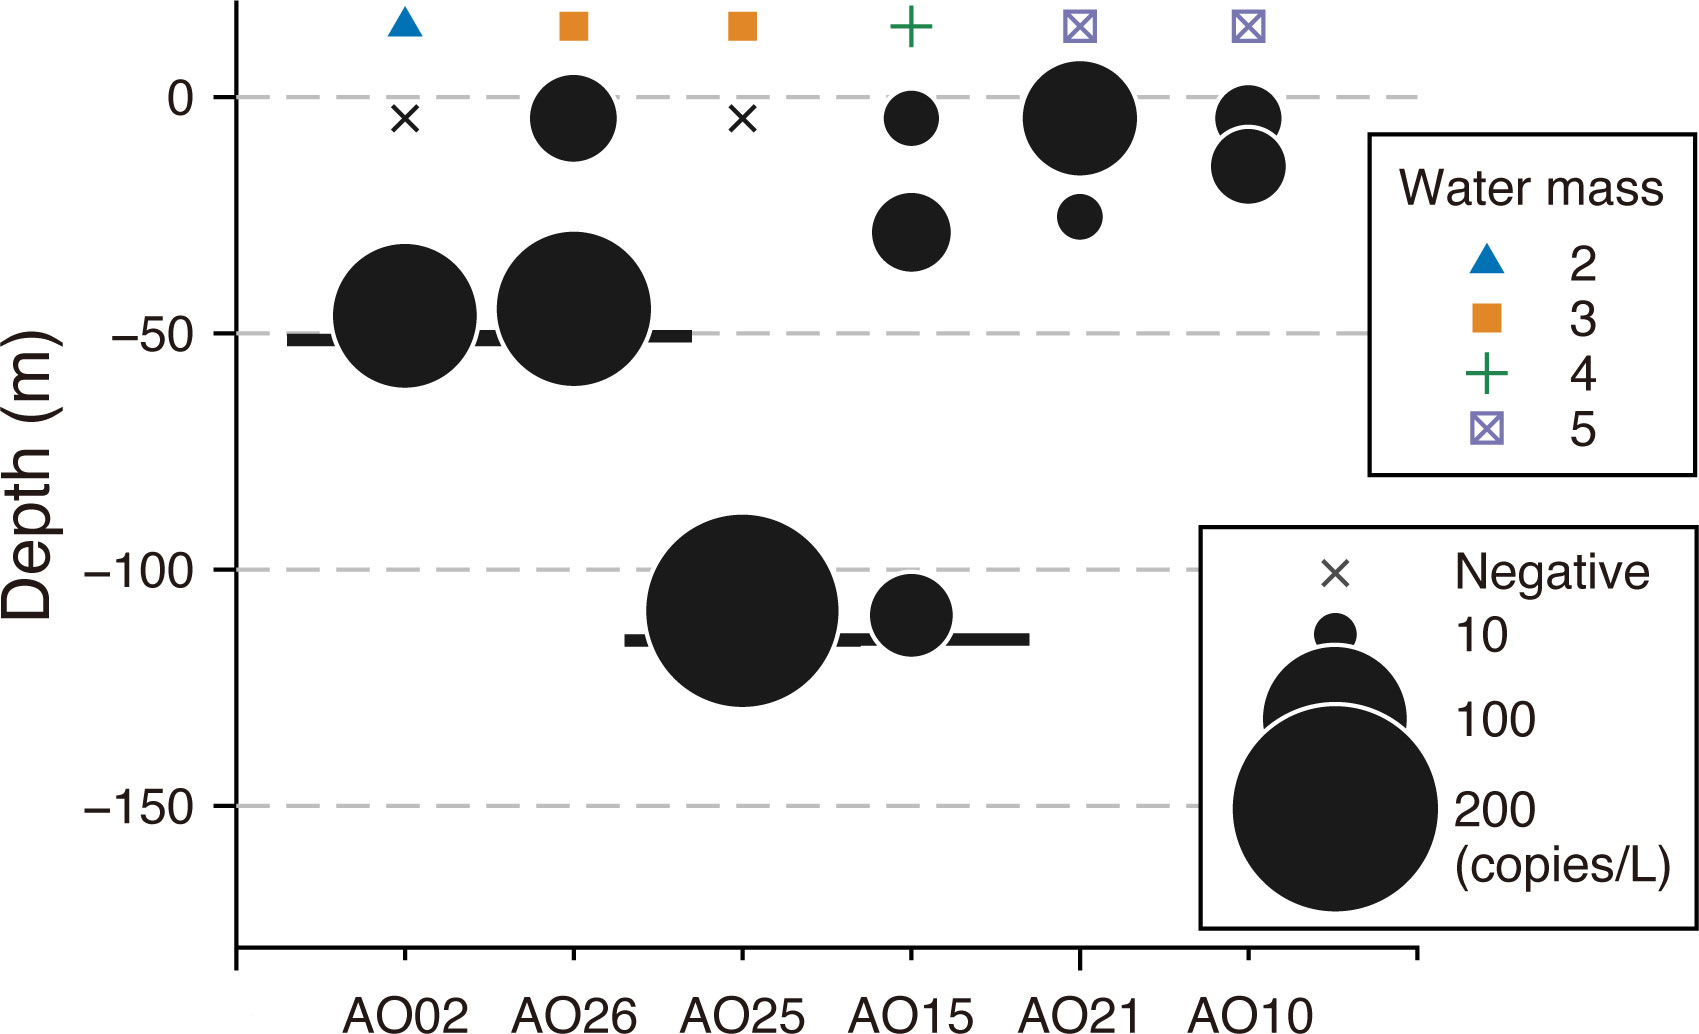
Figure 3 Vertical difference in polar cod Boreogadus saida eDNA concentrations (copies/L) at six sampling sites in the Chukchi Sea using a newly designed assay. The area of the black circles represents the concentration of eDNA (copies/L). Sampling sites were latitudinally arranged from the south (left) to the north (right). Crosses represent the sample in which no polar cod eDNA was detected. The sites along the x-axis were organized latitudinally. The bottom depths at each sampling site are indicated by thick horizontal lines, except for AO10 and AO21, where the bottom depths are 546 m and 1979 m, respectively. The symbols at the top of the panel correspond to the results of the clustering analysis using the SIMPROF test, as shown in Table 2.
The juxtaposition of the concentration of polar cod eDNA on the temperature–salinity diagram showed that the distribution of polar cod eDNA in the surface water was clearly limited to < 5°C in temperature and < 32 psu in salinity (Figure 4). Maximum concentrations of eDNA in surface water occurred at approximately 0°C and 30 psu. There were significant differences in water temperature and salinity between sites where polar cod eDNA was detected and those where it was not (Supplementary Figure 6; Wilcoxon rank-sum exact test; W = 35, p < 0.001 for water temperature; W = 32, p < 0.001 for salinity). Depending on the depth, the relationship between eDNA distribution and environmental conditions varied; polar cod eDNA was detected in more saline water in the middle or bottom layers (> 32 psu) than in the surface water.
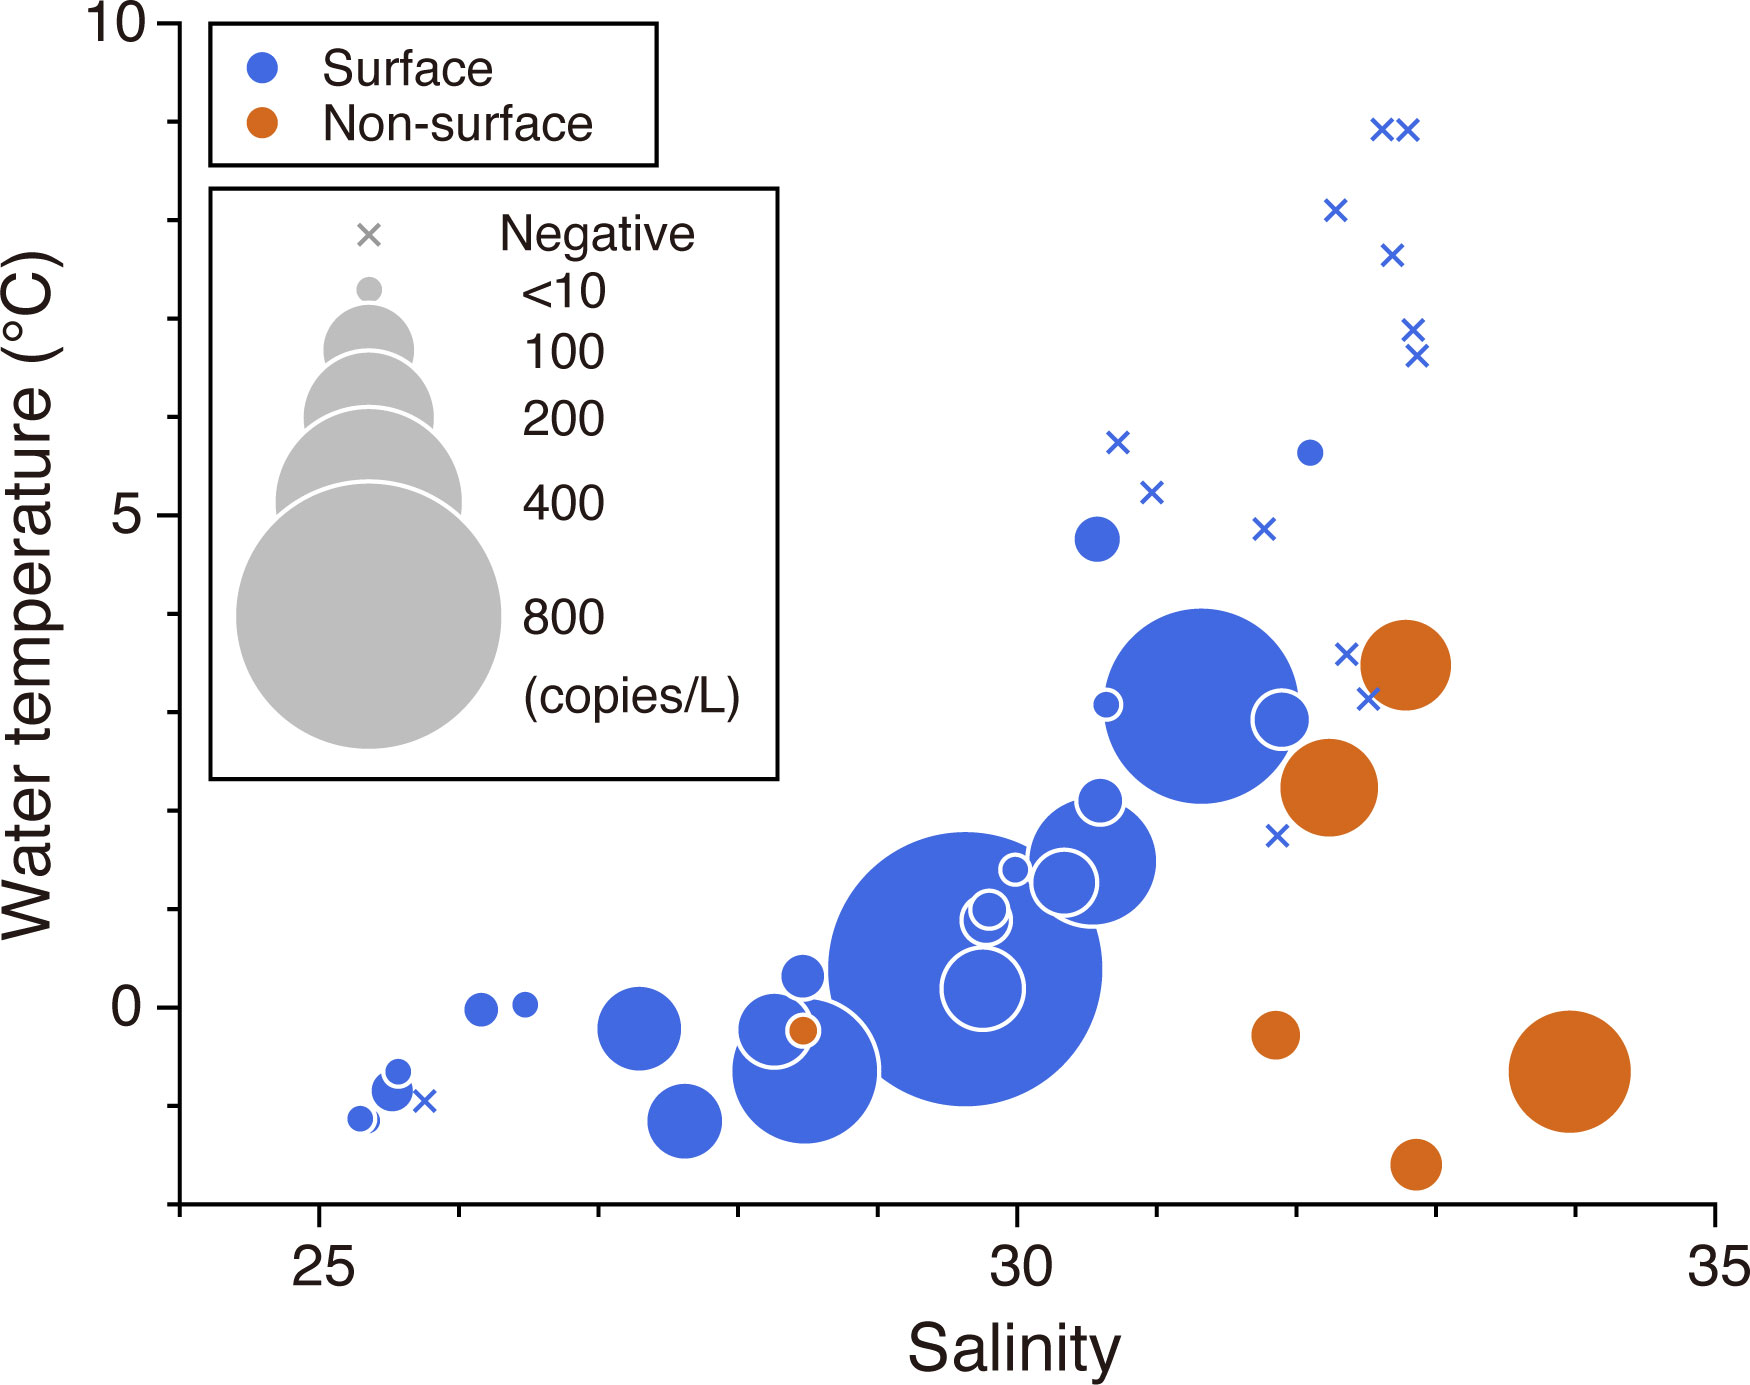
Figure 4 Polar cod Boreogadus saida eDNA concentrations (copies/L) across the Bering and Chukchi Seas plotted on a temperature-salinity diagram. The area of circles represents the concentration of eDNA. Crosses represent the sample in which no polar cod eDNA was detected. The colors blue and red represent the results from the surface water and middle or bottom layers, respectively.
After developing a logistic regression model relating the presence or absence of polar cod eDNA to four environmental conditions (water temperature, salinity, log-transformed chl a, and topography), the model containing only water temperature as an independent variable was deemed the best (Supplementary Table 2). For each 1°C increase, the odds of detecting polar cod eDNA decreased by 50% (95% CI [24%, 67%]). The probability of detecting polar cod eDNA decreased with increasing water temperatures (Figure 5). The water temperature with a 50% detection probability was predicted to be 3.7°C.
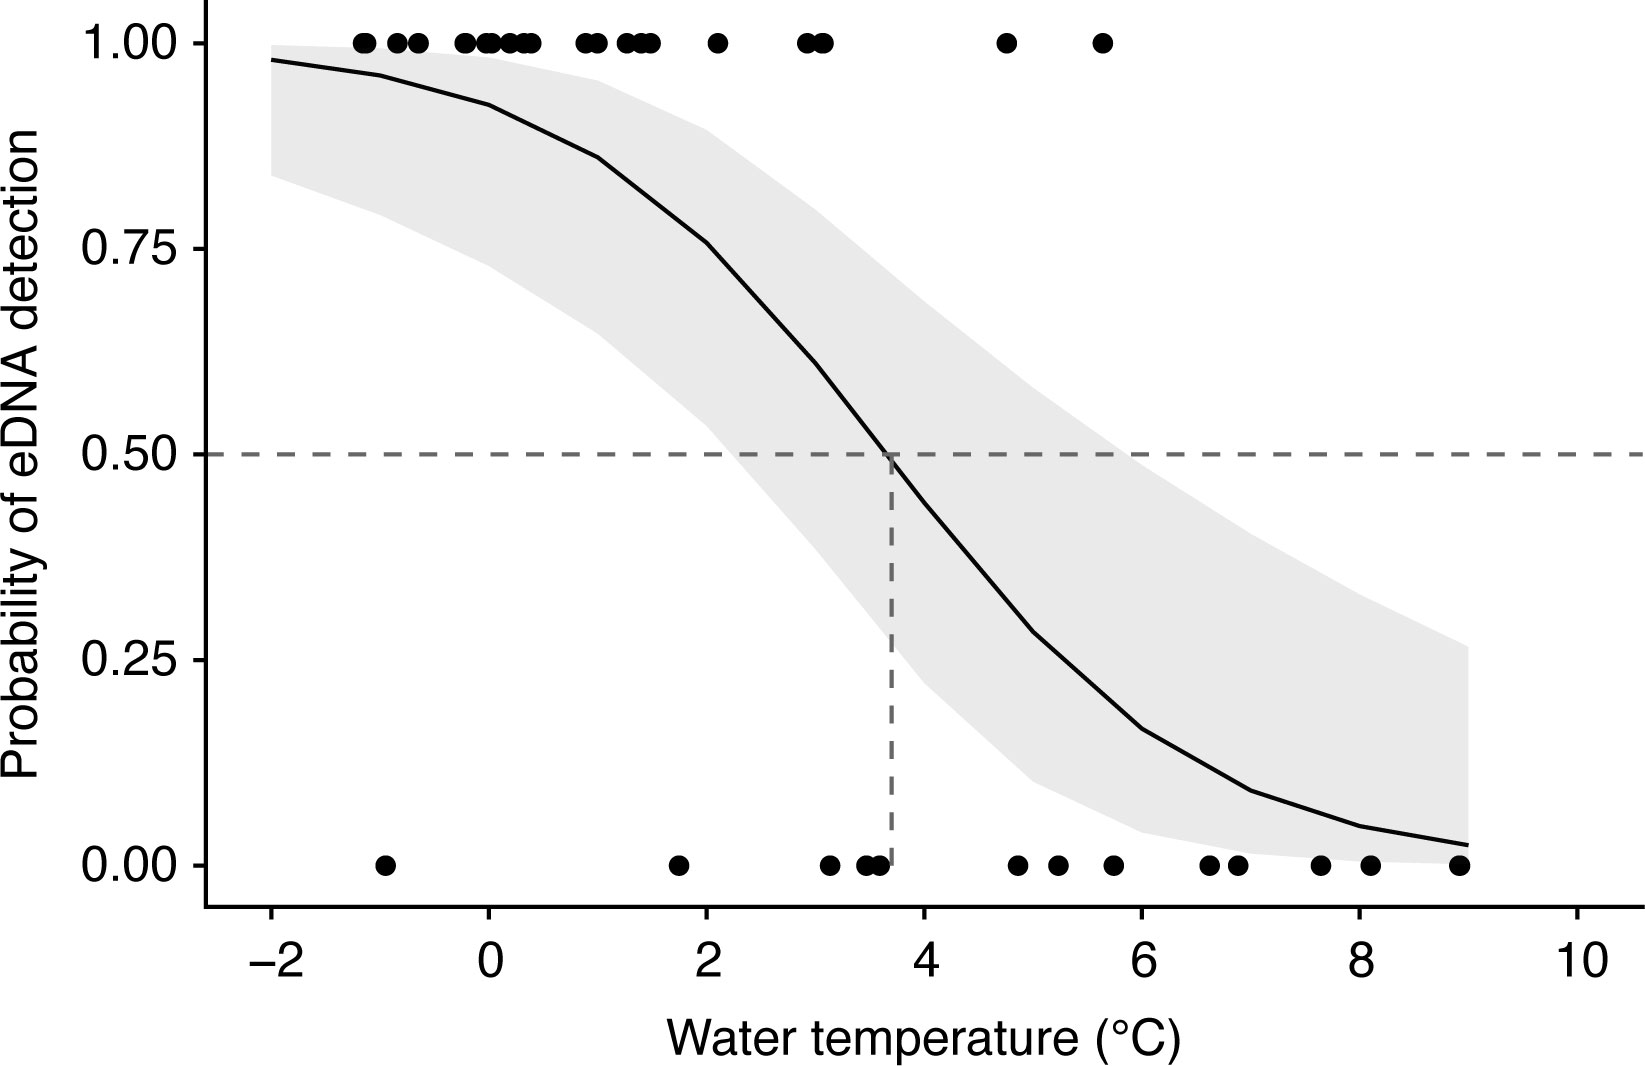
Figure 5 Logistic regression curve predicting the detection probability of polar cod Boreogadus saida eDNA as a function of water temperature. The logistic model was constructed with water temperature as the sole explanatory variable. The shaded area indicates the 95% confidence interval. A horizontal dotted line is drawn at 50% detection, and a vertical dotted line indicates the water temperature at 50% detection.
Using a newly designed species-specific assay, we successfully detected polar cod eDNA and described its horizontal distribution in surface water across the Bering and Chukchi Seas. The relationship between eDNA detection and environmental conditions indicated that polar cod eDNA is abundantly distributed in cold water, particularly in polar mixed layers with low salinity in the Arctic Ocean. Although eDNA analysis has been shown to be a promising method for estimating the distribution of a fish species in the ocean (e.g., Knudsen et al., 2019; Fraija-Fernández et al., 2020), only a few eDNA studies targeting marine fish have been conducted in the Arctic region (Lacoursière-Roussel et al., 2018; Leduc et al., 2019). A pilot study is recommended before applying the eDNA approach to a new field, such as the Arctic, because the persistence and detection probability of eDNA are influenced by site-specific environmental factors (Goldberg et al., 2016; Stoeckle et al., 2017). The success of eDNA detection in this study demonstrated that the common detection protocol was also effective without any special optimization in the Arctic environment, where the ecology of eDNA is poorly understood. The findings of this study can be translated into knowledge regarding the ecology of polar cod after addressing uncertainties regarding eDNA detection (Cristescu and Hebert, 2018).
As eDNA analysis in marine ecosystems detects DNA in water, which is a trace of individual organisms, it can only indirectly suggest the presence of target species. Various biotic factors, such as species, physiological conditions, body size, and developmental stage, influence the amount and rate of eDNA shedding (e.g., Maruyama et al., 2014; Klymus et al., 2015; Takeuchi et al., 2019). The ecology of eDNA following its release is also affected by degradation, particle sinking, adsorption to sediments, and dispersion (Barnes and Turner, 2016; Stoeckle et al., 2017). False negatives (species not detected where they are present) and false positives (target species absent but DNA recovered) in eDNA detection can also arise from a variety of biological, physical, and chemical factors, and technical issues (Barnes and Turner, 2016; Cristescu and Hebert, 2018). Consequently, it is often difficult to infer the distribution and abundance of the source organism based on the detection and quantification of eDNA. These obstacles could confound our inferences about the distribution and habitat preferences of polar cod in the present study, necessitating a careful inspection of the results.
A properly designed primer pair and probe are critical to avoid false results. Primers and probes that lack sufficient specificity can amplify unintended species, whereas high intraspecific variation in priming sites can result in failure to recover eDNA from the target species. Therefore, we rigorously tested the performance of the new assay to ensure its specificity for polar cod, employing publicly available sequences of polar cod and other related species, as well as PCR using DNA extracts of gadoids that may have co-occurred with polar cod in the study area. The results of in silico and in vitro specificity tests confirmed that the newly designed assay had the desired specificity, i.e., the assay was expected to amplify polar cod DNA exclusively. However, the risk of false results remains due to the uncertainty regarding unknown intraspecific diversity. A recent study on the genetic structure of polar cod populations using microsatellite loci found that polar cod in the North Bering, Chukchi, and Western Beaufort Seas formed a genetically distinct group from other regions, with very little genetic differentiation within the group (Nelson et al., 2020). A study that used mitochondrial DNA also suggested no significant structure from the northern Bering Sea to the western Beaufort Sea (Wilson et al., 2020). Although these results cannot directly imply negligible intraspecific diversity in our target region (mitochondrial D-loop), it is unlikely that the new assay produced false negative results due to intraspecific diversity.
As fish eDNA in the ocean is thought to represent only a small fraction of the DNA in seawater (Stat et al., 2017), the concentration of eDNA may be influenced by the dispersion and degradation processes critical for its detection. Therefore, insufficient sampling effort can lead to false-negative errors. However, the volume of water filtered in this study (mean ± SD, 7.4 ± 3.2 L per filter) exceeded that employed in previous fish eDNA surveys in the ocean to comprehensively detect the local diversity of fish fauna (0.5–2 L of seawater per sample, e.g., Thomsen et al., 2016; Sigsgaard et al., 2017; Afzali et al., 2021). Given the prevalence of polar cod in the Arctic and a large amount of water filtered in this study, we expected the occurrence of false negative errors to be negligible.
False positives caused by contamination of space and time should also be considered. Although dispersion lowers eDNA concentration, it can increase the probability of detecting non-local and non-temporal eDNA originating from spatially and temporally remote sources from a study site (Hansen et al., 2018). In the Antarctic, eDNA from the ocellated icefish, Chionodraco rastrospinosus, is expected to disperse up to 648 km from its source in a detectable state, assuming a current velocity and slow decay rate in subzero water temperature (Cowart et al., 2018). Bottom sediments and sea ice are other potential eDNA sources in the ocean, transporting allochthonous extracellular DNA (Collins and Deming, 2011; Kuwae et al., 2020). However, these cases likely represent extremes. Half-lives of marine fish eDNA have been estimated between approximately 7 and 60 h under 4–40°C and 71 h under -1°C (Collins et al., 2018). A field experiment in the temperate zone showed that eDNA shed by white trevally (Pseudocaranx dentex) was only detectable within a narrow range (<100 m) in a bay with a weak current (Murakami et al., 2019). These studies implied that eDNA detection is thought to represent a fish community on a short temporal and small spatial scale. In the present study, approximately 3.8 days (91 h) in the median were required for eDNA shed from a particular site to be transported to the nearest site, assuming the passive transportation of eDNA by the current. Although there is a possibility that the degradation of eDNA could be slower than expected under the Arctic environment, it could be presumed that our sampling sites did not share the same source for eDNA due to the temporal distance between sites.
The distribution of polar cod eDNA corresponded well with the putative water mass distribution, suggesting that the polar cod was heterogeneously distributed in the study area and was likely affected by site-specific environmental conditions. Although eDNA may reliably suggest the polar cod distribution as discussed above, when considering interactions with various environmental conditions, the complex relationship between eDNA concentrations, abundance, and body size of the source organism must be clarified to accurately convert the eDNA distribution into reliable data for conservation purposes (Collins et al., 2018; Jo et al., 2019; Jo and Minamoto, 2021). Across various taxonomic groups, rearing experiments have generally shown positive correlations between the amount of eDNA and the abundance, body weight, and developmental stage of source organisms (e.g., Takahara et al., 2012; Minegishi et al., 2019; Takeuchi et al., 2019). This relationship between eDNA concentration and the abundance of target species has also been supported in coastal environments (Thomsen et al., 2016; Yamamoto et al., 2016; Sato et al., 2021), with some exceptions in the open ocean (Knudsen et al., 2019; Shelton et al., 2022). Although uncertainty remains regarding obtaining comparable quantification from the eDNA results, we discuss what and how environmental conditions shape the polar cod distribution, carefully considering that limitation.
Although oceanographic conditions vary temporally and spatially, previous studies that intensively described polar cod distribution in the Chukchi Sea during the open-water period have shown their prevalence distribution across the shelf, but it was heterogeneous and linked to characteristics of the water mass. Polar cod occupy a remarkably wide range of habitats; they were collected from all parts of the water column, from the coast to offshore (Goddard et al., 2014; Logerwell et al., 2015). Gradual expansion in body size range, in which the maximum body length increased from 66 mm to 260 mm (corresponding to age-0/1 and age-3+, respectively) from the beach to the shelf surface, nearshore bottom, and benthic shelf, suggested a habitat shift linked to growth (Logerwell et al., 2015). Polar cod is the most abundant fish species in the region, except on the shelf surface, where capelin (Mallotus villosus) and saffron cod tend to represent a large proportion of the fish stock (Norcross et al., 2010; Eisner et al., 2013; Goddard et al., 2014; Logerwell et al., 2015). Studies focusing on the early life stage distribution of polar cod suggested that their larvae and juveniles are abundant in cold water ranging between approximately -1.8–5°C (Norcross et al., 2010; Kono et al., 2016; Deary et al., 2021), while their occurrence in warmer water (2.6–11.2°C) was also reported (Eisner et al., 2013).
Hotspots of polar cod eDNA were observed in the central part of the Chukchi Sea shelf, off the Point Barrow, and in proximity to the Chukchi Borderland, while they were scarce in the northern Bering Sea, which corresponds to the southern limit of its distribution (Mecklenburg et al., 2018). These results are congruent with the synthesized distribution of the historical data described above and the recent acoustic-trawl survey targeting polar cod (De Robertis et al., 2017). Therefore, eDNA detection successfully inferred the distribution of the polar cod. In this study, we mainly collected surface seawater for eDNA detection, but eDNA was also detected in the water in the bottom or middle layers. A recent study showed that the distribution of eDNA is vertically different and can reflect the vertical distribution of marine fishes (Canals et al., 2021). Although the comparison between the different depth layers in this study is preliminary, eDNA can be expected to indicate the vertical distribution of polar cod.
The key finding of this study is that eDNA showed a clear linkage between the presence of polar cod and water temperature, implying that polar cod prefer cold water masses as a habitat. Polar cod eDNA was only found in water masses at lower temperatures (<5°C), and detection probability decreased with increasing temperature. This finding is consistent with the previously reported temperature range in which polar cod larvae and juveniles are abundant (Norcross et al., 2010; Kono et al., 2016; Deary et al., 2021). Thus, eDNA provides new empirical evidence that supports the general assumption that polar cod prefer cold water. Rearing experiments have also suggested that polar cod are most active and capable of growing at temperatures below 10°C (Laurel et al., 2016). However, salinity may not have been a decisive factor in polar cod habitat selection because we detected their eDNA in a wide salinity range (25–34 psu) in our study area. In addition to temperature and salinity, other environmental conditions, interactions with other species (predators, prey, and competitors), and internal factors (e.g., density, age, and fish condition) can influence fish distribution (Planque et al., 2011). Considering that polar cod inhabit abundantly in the cracks and crevices beneath the sea ice (Gradinger and Bluhm, 2004), the presence of sea ice itself could also influence the distribution of polar cod and, consequently, the probability of eDNA detection. However, due to the close relationship between the distribution of cold water masses and the presence of sea ice in our study area, it was difficult to determine whether the habitat preference of polar cod was for the water temperature or the habitat availability under sea ice. Although the habitat preferences of polar cod are extensively reviewed (Geoffroy et al., 2023), their details are still being discussed and warrant further investigation.
According to previous studies, the eDNA hotspot in the central Chukchi Sea shelf observed in this study could have captured an aggregation of larval or juvenile polar cods. It has generally been assumed that polar cod spawn in the winter (November to April) beneath the sea ice (Thorsteinson and Love, 2016). Pelagic eggs and larvae that hatch from spring to summer disperse over a broader geographical area (Aune et al., 2021; Deary et al., 2021). Assuming the Kotzebue Sound is a potential source of polar cod, as this area is unknown as a spawning ground in the Chukchi Sea, individual−based models in combination with particle tracking predicted that simulated polar cod hatching in the Kotzebue Sound was transported offshore to the north and to the west, concentrated in the central Chukchi Sea around 70°N (Deary et al., 2021). This estimated dispersal process was consistent with the eDNA distribution. However, the inability of eDNA to distinguish the biological parameters of the source organism (e.g., age, body size, and physiological condition) precludes further estimation of the factors controlling its observed distribution. Another limitation of eDNA is that it does not provide immediate information about target species, necessitating laboratory work after a field investigation. The combined use of the eDNA technique, and the reconstruction of life history traits using otolith microchemistry or tissue stable isotopes, and hydroacoustic surveys with high spatial coverage would expand our understanding of polar cod ecology considerably.
The application of eDNA techniques would likely benefit various studies on tracking the consequences of environmental change, ecological management and conservation, and policy-making decisions (Bohmann et al., 2014). This study demonstrated that species-specific detection of eDNA is an effective method to describe the distribution of polar cod, providing baseline data to reveal its environmental impact. However, uncertainties from eDNA must be overcome before its broad adoption (Bohmann et al., 2014; Cristescu and Hebert, 2018). For example, we were unable to conclusively generate informative relative abundance and population structure data, due to the unknown relationship between the abundance or biological condition of the source organisms and eDNA detection, as well as the unknown ecology of eDNA in the Arctic. Currently, the abundance data of polar cod in the Chukchi Sea are limited (De Robertis et al., 2017; Geoffroy et al., 2023), and if the eDNA technique can indicate its abundance and population structure, it could provide a basis for projecting shifts in distribution and abundance. Experimental studies regarding eDNA shedding from polar cod and its persistence in a subzero environment would facilitate future applications of the eDNA technique. Furthermore, due to the inability of eDNA to provide biological parameters of the source organism, which is invaluable information for conservation and management purposes, the eDNA method should be considered as a complementary tool for other individual-based methods, such as target fishing, otolith microchemistry (Andrade et al., 2020), stable isotopes (Kohlbach et al., 2017), and life history analysis (Bouchard et al., 2017), rather than replacing them. The eDNA method could also supplement hydroacoustic surveys and observations using underwater optical camera by reducing ambiguity in species identification and enabling the production of distributional data at a large spatiotemporal scale with high taxonomic resolution.
Integrating eDNA techniques and oceanographic surveys will enhance our ability to detect predicted ecological changes in polar cod populations. eDNA samples can be collected concurrently with samples for biogeochemical, planktonic, and microbial studies, providing an additional layer for investigating biological interactions. A numerical hydrodynamic model incorporating oceanographical conditions (e.g., current, density, and temperature) and eDNA data (e.g., concentration and persistence) is a possible method for creating an accurate and quantified map of polar cod populations (Fukaya et al., 2020). In addition, recent advances in the application of eDNA, such as population genetic analysis (Sigsgaard et al., 2020; Tsuji et al., 2020) and analysis of eRNA associated with physiological conditions (Tsuri et al., 2021), may provide new insights into the population dynamics of polar cod. As this study may expand the applicability of eDNA techniques for Arctic studies, investigations targeting other species and accumulating basic knowledge of eDNA in the Arctic will facilitate the understanding of the processes and consequences of distributional shifts of fishes (Hollowed et al., 2013; Fossheim et al., 2015) predicted to occur under global warming in the future.
The datasets presented in this study can be found in online repositories. The names of the repository/repositories and accession number(s) can be found below: The Arctic Data archive System (ADS), National Institute of Polar Research, Japan. No. A20230323-002 (https://ads.nipr.ac.jp/dataset/A20230323-002) and Zenodo (https://doi.org/10.5281/zenodo.8213184).
TK, AK, and HU conceived this study. TK collected and processed the eDNA samples. AY developed the species-specific assay. TK, AY, and H-CJ participated in molecular work. TK performed statistical analysis and visualization. TK wrote the first draft of the manuscript. All authors critically reviewed the manuscript and contributed to the final version.
This work was funded by the Arctic Challenge for Sustainability II (ArCS II), Program Grant Number JPMXD1420318865 from the Ministry of Education, Culture, Science and Technology of Japan. This study was partly supported by JSPS KAKENHI Grant Number 22H02415 from the Japan Society for the Promotion of Science (JSPS).
We express our sincere thanks to the captain and crew of the ‘R/V Mirai’ belonging to JAMSTEC for their assistance during the MR20-05C cruise. We thank Drs. Maud Alix and Olav Kjesbu (Institute of Marine Research, Norway), who kindly provided the tissue samples of the gadid species. We are grateful to Marty Kwok-Shing Wong (Atmosphere and Ocean Research Institute, University of Tokyo) for his help with the technical improvements in DNA extraction. We are also grateful to Qi-Fan Zhang (Graduate School of Fisheries Sciences, Hokkaido University) for assisting with the DNA analysis.
The authors declare that the research was conducted in the absence of any commercial or financial relationships that could be construed as a potential conflict of interest.
All claims expressed in this article are solely those of the authors and do not necessarily represent those of their affiliated organizations, or those of the publisher, the editors and the reviewers. Any product that may be evaluated in this article, or claim that may be made by its manufacturer, is not guaranteed or endorsed by the publisher.
The Supplementary Material for this article can be found online at: https://www.frontiersin.org/articles/10.3389/fmars.2023.1193083/full#supplementary-material
Afzali S. F., Bourdages H., Laporte M., Mérot C., Normandeau E., Audet C., et al. (2021). Comparing environmental metabarcoding and trawling survey of demersal fish communities in the Gulf of St. Lawrence, Canada. Environ. DNA. 3, 22–42. doi: 10.1002/edn3.111
Alvarez J., Yumashev D., Whiteman G. (2020). A framework for assessing the economic impacts of Arctic change. Ambio. 49, 407–418. doi: 10.1007/s13280-019-01211-z
Andrade H., van der Sleen P., Black B. A., Godiksen J. A., Locke W. L., Carroll M. L., et al. (2020). Ontogenetic movements of cod in Arctic fjords and the Barents Sea as revealed by otolith microchemistry. Polar Biol. 43, 409–421. doi: 10.1007/s00300-020-02642-1
Ardyna M., Arrigo K. R. (2020). Phytoplankton dynamics in a changing Arctic Ocean. Nat. Clim. Change. 10, 892–903. doi: 10.1038/s41558-020-0905-y
Aune M., Raskhozheva E., Andrade H., Augustine S., Bambulyak A., Camus L., et al. (2021). Distribution and ecology of polar cod (Boreogadus saida) in the eastern Barents Sea: A review of historical literature. Mar. Environ. Res. 166, 105262. doi: 10.1016/j.marenvres.2021.105262
Barnes M. A., Turner C. R. (2016). The ecology of environmental DNA and implications for conservation genetics. Conserv. Genet. 17, 1–17. doi: 10.1016/j.marenvres.2021.105262
Bohmann K., Evans A., Gilbert M. T. P., Carvalho G. R., Creer S., Knapp M., et al. (2014). Environmental DNA for wildlife biology and biodiversity monitoring. Trends Ecol. Evol. 29, 358–367. doi: 10.1016/j.tree.2014.05.012
Bouchard C., Geoffroy M., LeBlanc M., Majewski A., Gauthier S., Walkusz W., et al. (2017). Climate warming enhances polar cod recruitment, at least transiently. Prog. Oceanogr. 156, 121–129. doi: 10.1016/j.pocean.2017.06.008
Canals O., Mendibil I., Santos M., Irigoien X., Rodríguez-Ezpeleta N. (2021). Vertical stratification of environmental DNA in the open ocean captures ecological patterns and behavior of deep-sea fishes. Limnol. Oceanogr. Lett. 6, 339–347. doi: 10.1002/lol2.10213
Carothers C., Sformo T. L., Cotton S., George J. C., Westley P. A. H. (2019). Pacific salmon in the rapidly changing Arctic: Exploring local knowledge and emerging fisheries in Utqiaġvik and Nuiqsut, Alaska. Arctic. 72, 273–288. doi: 10.14430/arctic68876
Clarke K. R., Somerfield P. J., Gorley R. N. (2008). Testing of null hypotheses in exploratory community analyses: similarity profiles and biota-environment linkage. J. Exp. Mar. Biol. Ecol. 366, 56–69. doi: 10.1016/j.jembe.2008.07.009
Coachman L. K., Aagaard K., Tripp R. B. (1975). Bering Strait: The Regional Physical Oceanography (Seattle: University of Washington Press). 172 pp.
Collins R. E., Deming J. W. (2011). Abundant dissolved genetic material in Arctic sea ice Part I: Extracellular DNA. Polar Biol. 34, 1819–1830. doi: 10.1007/s00300-011-1041-y
Collins R. A., Wangensteen O. S., O’Gorman E. J., Mariani S., Sims D. W., Genner M. J. (2018). Persistence of environmental DNA in marine systems. Commun. Biol. 1, 185. doi: 10.1038/s42003-018-0192-6
Cooley S. W., Ryan J. C., Smith L. C., Horvat C., Pearson B., Dale B., et al. (2020). Coldest Canadian Arctic communities face greatest reductions in shorefast sea ice. Nat. Clim. Change. 10, 533–538. doi: 10.1038/s41558-020-0757-5
Cowart D. A., Murphy K. R., Cheng C.-H. C. (2018). Metagenomic sequencing of environmental DNA reveals marine faunal assemblages from the West Antarctic Peninsula. Mar. Genomics 37, 148–160. doi: 10.1016/j.margen.2017.11.003
Cristescu M. E., Hebert P. D. N. (2018). Uses and misuses of environmental DNA in biodiversity science and conservation. Annu. Rev. Ecol. Evol. Syst. 49, 209–230. doi: 10.1146/annurev-ecolsys-110617-062306
Danielson S. L., Eisner L., Ladd C., Mordy C., Sousa L., Weingartner T. J. (2017). A comparison between late summer 2012 and 2013 water masses, macronutrients, and phytoplankton standing crops in the northern Bering and Chukchi Seas. Deep Sea Res. Part II. 135, 7–26. doi: 10.1016/j.dsr2.2016.05.024
David C., Lange B., Krumpen T., Schaafsma F., van Franeker J. A., Flores H. (2016). Under-ice distribution of polar cod Boreogadus saida in the central Arctic Ocean and their association with sea-ice habitat properties. Polar Biol. 39, 981–994. doi: 10.1007/s00300-015-1774-0
Deary A. L., Vestfals C. D., Mueter F. J., Logerwell E. A., Goldstein E. D., Stabeno P. J., et al. (2021). Seasonal abundance, distribution, and growth of the early life stages of polar cod (Boreogadus saida) and saffron cod (Eleginus gracilis) in the US Arctic. Polar Biol. 44, 2055–2076. doi: 10.1007/s00300-021-02940-2
Deiner K., Bik H. M., Mächler E., Seymour M., Lacoursière-Roussel A., Altermatt F., et al. (2017). Environmental DNA metabarcoding: Transforming how we survey animal and plant communities. Mol. Ecol. 26, 5872–5895. doi: 10.1111/mec.14350
De Robertis A., Taylor K., Wilson C. D., Farley E. V. (2017). Abundance and distribution of Arctic cod (Boreogadus saida) and other pelagic fishes over the U.S. Continental Shelf of the Northern Bering and Chukchi Seas. Deep Sea Res. Part II. 135, 51–65. doi: 10.1016/j.dsr2.2016.03.002
Eamer J., Donaldson G. M., Gaston A. J., Kosobokova K. N., Lárusson K. F., Melnikov I. A., et al. (2013). Life Linked to Ice: A guide to sea-ice-associated biodiversity in this time of rapid change. CAFF Assessment Series No. 10 (Iceland: Conservation of Arctic Flora and Fauna).
Eisner L., Hillgruber N., Martinson E., Maselko J. (2013). Pelagic fish and zooplankton species assemblages in relation to water mass characteristics in the northern Bering and southeast Chukchi seas. Polar Biol. 36, 87–113. doi: 10.1007/s00300-012-1241-0
Fauchald P., Arneberg P., Debernard J. B., Lind S., Olsen E., Hausner V. H. (2021). Poleward shifts in marine fisheries under Arctic warming. Environ. Res. Lett. 16, 074057. doi: 10.1088/1748-9326/ac1010
Ficetola G. F., Miaud C., Pompanon F., Taberlet P. (2008). Species detection using environmental DNA from water samples. Biol. Lett. 4, 423–425. doi: 10.1098/rsbl.2008.0118
Florko K. R. N., Tai T. C., Cheung W. W. L., Ferguson S. H., Sumaila U. R., Yurkowski D. J., et al. (2021). Predicting how climate change threatens the prey base of Arctic marine predators. Ecol. Lett. 24, 2563–2575. doi: 10.1111/ele.13866
Forster C. E., Norcross B. L., Mueter F. J., Logerwell E. A., Seitz A. C. (2020). Spatial patterns, environmental correlates, and potential seasonal migration triangle of polar cod (Boreogadus saida) distribution in the Chukchi and Beaufort Seas. Polar Biol. 43, 1073–1094. doi: 10.1007/s00300-020-02631-4
Fossheim M., Primicerio R., Johannesen E., Ingvaldsen R. B., Aschan M. M., Dolgov A. V. (2015). Recent warming leads to a rapid borealization of fish communities in the Arctic. Nat. Clim. Change. 5, 673–677. doi: 10.1038/nclimate2647
Fraija-Fernández N., Bouquieaux M., Rey A., Mendibil I., Cotano U., Irigoien X., et al. (2020). Marine water environmental DNA metabarcoding provides a comprehensive fish diversity assessment and reveals spatial patterns in a large oceanic area. Ecol. Evol. 10, 7560–7584. doi: 10.1002/ece3.6482
Frainer A., Primicerio R., Kortsch S., Aune M., Dolgov A. V., Fossheim M., et al. (2017). Climate-driven changes in functional biogeography of Arctic marine fish communities. PNAS. 114, 12202–12207. doi: 10.1073/pnas.1706080114
Fukaya K., Murakami H., Yoon S., Minami K., Osada Y., Yamamoto S., et al. (2020). Estimating fish population abundance by integrating quantitative data on environmental DNA and hydrodynamic modelling. Mol. Ecol. 30, 3057–3067. doi: 10.1111/mec.15530
Geoffroy M., Bouchard C., Flores H., Robert D., Gjosaeter H., Hoover C., et al. (2023). The circumpolar impacts of climate change and anthropogenic stressors on Arctic cod (Boreogadus saida) and its ecosystem. Elementa-Sci. Anthrop. 11, 00097. doi: 10.1525/elementa.2022.00097
Goddard P., Lauth R., Armistead. C. (2014). Results of the 2012 Chukchi Sea bottom trawl survey of bottomfishes, crabs, and other demersal macrofauna Vol. 278 (U.S. Dep. Commer.: NOAA Tech. Memo. NMFS-AFSC-). 110 p.
Goldberg C. S., Turner C. R., Deiner K., Klymus K. E., Thomsen P. F., Murphy M. A., et al. (2016). Critical considerations for the application of environmental DNA methods to detect aquatic species. Methods Ecol. Evol. 7, 1299–1307. doi: 10.1111/2041-210x.12595
Gonzalez S., Horne J. K., Danielson S. L. (2021). Multi-scale temporal variability in biological-physical associations in the NE Chukchi Sea. Polar Biol. 44, 837–855. doi: 10.1007/s00300-021-02844-1
Gradinger R. R., Bluhm B. A. (2004). In-situ observations on the distribution and behavior of amphipods and Arctic cod (Boreogadus saida) under the sea ice of the High Arctic Canada Basin. Polar Biol. 27, 595–603. doi: 10.1007/s00300-004-0630-4
Hansen B. K., Bekkevold D., Clausen L. W., Nielsen E. E. (2018). The sceptical optimist: challenges and perspectives for the application of environmental DNA in marine fisheries. Fish Fish. 19, 751–768. doi: 10.1111/faf.12286
Harter B. B., Elliott K. H., Divoky G. J., Davoren G. K. (2013). Arctic cod (Boreogadus saida) as prey: Fish length-energetics relationships in the Beaufort Sea and Hudson Bay. Arctic. 66, 191–196. doi: 10.14430/arctic4290
Hirawake T., Oida J., Yamashita Y., Waga H., Abe H., Nishioka J., et al. (2021). Water mass distribution in the northern Bering and southern Chukchi seas using light absorption of chromophoric dissolved organic matter. Prog. Oceanogr. 197, 102641. doi: 10.1016/j.pocean.2021.102641
Hollowed A. B., Planque B., Loeng H. (2013). Potential movement of fish and shellfish stocks from the sub-Arctic to the Arctic Ocean. Fish. Oceanogr. 22, 355–370. doi: 10.1111/fog.12027
Hunt G. L., Blanchard A. L., Boveng P., Dalpadado P., Drinkwater K. F., Eisner L., et al. (2013). The Barents and Chukchi Seas: comparison of two Arctic shelf ecosystems. J. Mar. Syst. 109–110, 43–68. doi: 10.1016/j.jmarsys.2012.08.003
Huntington H. P., Danielson S. L., Wiese F. K., Baker M., Boveng P., Citta J. J., et al. (2020). Evidence suggests potential transformation of the Pacific Arctic ecosystem is underway. Nat. Clim. Change. 10, 342–348. doi: 10.1038/s41558-020-0695-2
Huserbråten M. B. O., Eriksen E., Gjøsæter H., Vikebø F. (2019). Polar cod in jeopardy under the retreating Arctic sea ice. Commun. Biol. 2, 407. doi: 10.1038/s42003-019-0649-2
Jensen M. R., Høgslund S., Knudsen S. W., Nielsen J., Møller P. R., Rysgaard S., et al. (2023). Distinct latitudinal community patterns of Arctic marine vertebrates along the East Greenlandic coast detected by environmental DNA. Divers. Distrib. 29, 316–334. doi: 10.1111/ddi.13665
Jo T., Minamoto T. (2021). Complex interactions between environmental DNA (eDNA) state and water chemistries on eDNA persistence suggested by meta-analyses. Mol. Ecol. Res. 21, 1490–1503. doi: 10.1111/1755-0998.13354
Jo T., Murakami H., Yamamoto S., Masuda R., Minamoto T. (2019). Effect of water temperature and fish biomass on environmental DNA shedding, degradation, and size distribution. Ecol. Evol. 9, 1135–1146. doi: 10.1002/ece3.4802
Kawakami T., Yamazaki A., Asami M., Goto Y., Yamanaka H., Hyodo S., et al. (2023). Evaluating the sampling effort for the metabarcoding-based detection of fish environmental DNA in the open ocean. Ecol. Evol. 13, e9921. doi: 10.1002/ece3.9921
Klymus K. E., Richter C. A., Chapman D. C., Paukert C. (2015). Quantification of eDNA shedding rates from invasive bighead carp Hypophthalmichthys nobilis and silver carp Hypophthalmichthys molitrix. Biol. Conserv. 183, 77–84. doi: 10.1016/j.biocon.2014.11.020
Knudsen S. W., Ebert R. B., Hesselsøe M., Kuntke F., Hassingboe J., Mortensen P. B., et al. (2019). Species-specific detection and quantification of environmental DNA from marine fishes in the Baltic Sea. J. Exp. Mar. Biol. Ecol. 510, 31–45. doi: 10.1016/j.jembe.2018.09.004
Kohlbach D., Schaafsma F. L., Graeve M., Lebreton B., Lange B. A., David C., et al. (2017). Strong linkage of polar cod (Boreogadus saida) to sea ice algae-produced carbon: Evidence from stomach content, fatty acid and stable isotope analyses. Prog. Oceanogr. 152, 62–74. doi: 10.1016/j.pocean.2017.02.003
Kono Y., Sasaki H., Kurihara Y., Fujiwara A., Yamamoto J., Sakurai Y. (2016). Distribution pattern of Polar cod (Boreogadus saida) larvae and larval fish assemblages in relation to oceanographic parameters in the northern Bering Sea and Chukchi Sea. Polar Biol. 39, 1039–1048. doi: 10.1007/s00300-016-1961-7
Kortsch S., Primicerio R., Fossheim M., Dolgov A. V., Aschan M. (2015). Climate change alters the structure of arctic marine food webs due to poleward shifts of boreal generalists. Proc. Royal. Soc B. 282, 20151546. doi: 10.1098/rspb.2015.1546
Kuwae M., Tamai H., Doi H., Sakata M. K., Minamoto T., Suzuki Y. (2020). Sedimentary DNA tracks decadal-centennial changes in fish abundance. Commun. Biol. 3, 558. doi: 10.1038/s42003-020-01282-9
Lacoursière-Roussel A., Howland K., Normandeau E., Grey E. K., Archambault P., Deiner K., et al. (2018). eDNA metabarcoding as a new surveillance approach for coastal Arctic biodiversity. Ecol. Evol. 8, 7763–7777. doi: 10.1002/ece3.4213
Laurel B. J., Spencer M., Iseri P., Copeman L. A. (2016). Temperature-dependent growth and behavior of juvenile Arctic cod (Boreogadus saida) and co-occurring North Pacific gadids. Polar Biol. 39, 1127–1135. doi: 10.1007/s00300-015-1761-5
Leduc N., Lacoursière-Roussel A., Howland K. L., Archambault P., Sevellec M., Normandeau E., et al. (2019). Comparing eDNA metabarcoding and species collection for documenting Arctic metazoan biodiversity. Environ. DNA. 1, 342–358. doi: 10.1002/edn3.35
Logerwell E., Busby M., Carothers C., Cotton S., Duffy-Anderson J., Farley E., et al. (2015). Fish communities across a spectrum of habitats in the western Beaufort Sea and Chukchi Sea. Prog. Oceanogr. 136, 115–132. doi: 10.1016/j.pocean.2015.05.013
Maruyama A., Nakamura K., Yamanaka H., Kondoh M., Minamoto T. (2014). The release rate of environmental DNA from juvenile and adult fish. PLoS One 9, e114639. doi: 10.1371/journal.pone.0114639
Mecklenburg C. W., Lynghammar A., Johannesen E., Byrkjedal I., Christiansen J. S., Dolgov A. V., et al. (2018). Marine Fishes of the Arctic Region (Akureyri, Iceland: Conservation of Arctic Flora and Fauna).
Merten V., Puebla O., Bayer T., Reusch T. B. H., Fuss J., Stefanschitz J., et al. (2023). Arctic nekton uncovered by eDNA metabarcoding: Diversity, potential range expansions, and benthic-pelagic coupling. Environ. DNA. 5, 503–518. doi: 10.1002/edn3.40326374943
Minegishi Y., Wong M. K.-S., Kanbe T., Araki H., Kashiwabara T., Ijichi M., et al. (2019). Spatiotemporal distribution of juvenile chum salmon in Otsuchi Bay, Iwate, Japan, inferred from environmental DNA. PloS One 14, e0222052. doi: 10.1371/journal.pone.0222052
Murakami H., Yoon S., Kasai A., Minamoto T., Yamamoto S., Sakata M. K., et al. (2019). Dispersion and degradation of environmental DNA from caged fish in a marine environment. Fish. Sci. 85, 327–337. doi: 10.1007/s12562-018-1282-6
Nelson R. J., Bouchard C., Fortier L., Majewski A. R., Reist J. D., Præbel K., et al. (2020). Circumpolar genetic population structure of polar cod, Boreogadus saida. Polar Biol. 43, 951–961. doi: 10.1007/s00300-020-02660-z
Nishino S. (2022). CTD Data in MR20-05C, 1.00 (Japan: Arctic Data archive System (ADS). Available at: https://ads.nipr.ac.jp/dataset/A20220803-010.
Norcross B. L., Holladay B. A., Busby M. S., Mier K. L. (2010). Demersal and larval fish assemblages in the Chukchi Sea. Deep Sea Res. Part II., 57, 57–70. doi: 10.1016/j.dsr2.2009.08.006
Pettitt-Wade H., Loseto L. L., Majewski A., Hussey N. E. (2021). Cod movement ecology in a warming world: Circumpolar arctic gadids. Fish Fish. 22, 562–591. doi: 10.1111/faf.12536
Planque B., Loots C., Petitgas P., Lindstrøm U., Vaz S. (2011). Understanding what controls the spatial distribution of fish populations using a multi-model approach. Fish. Oceanogr. 20, 1–17. doi: 10.1111/j.1365-2419.2010.00546.x
R Core Team (2021). R: A Language and Environment for Statistical Computing (Vienna, Austria: R Foundation for Statistical Computing). Available at: http://www.R-project.org/.
Sato M., Inoue N., Nambu R., Furuichi N., Imaizumi T., Ushio M. (2021). Quantitative assessment of multiple fish species around artificial reefs combining environmental DNA metabarcoding and acoustic survey. Sci. Rep. 11, 19477. doi: 10.1038/s41598-021-98926-5
Sevellec M., Lacoursière-Roussel A., Bernatchez L., Normandeau E., Solomon E., Arreak A., et al. (2021). Detecting community change in Arctic marine ecosystems using the temporal dynamics of environmental DNA. Environ. DNA. 3, 575–590. doi: 10.1002/edn3.155
Shelton A. O., Ramón-Laca A., Wells A., Clemons J., Chu D., Feist B. E., et al. (2022). Environmental DNA provides quantitative estimates of Pacific hake abundance and distribution in the open ocean. Proc. R. Soc B. 289, 20212613. doi: 10.1098/rspb.2021.2613
Shupe M. D., Rex M., Dethloff K., Damm E., Fong A. A., Gradinger R., et al. (2020). Arctic report card 2020: The MOSAiC expedition: A year drifting with the Arctic sea ice. Arctic Rep. Card. doi: 10.25923/9g3v-xh92
Sigsgaard E. E., Jensen M. R., Winkelmann I. E., Møller P. R., Hansen M. M., Thomsen P. F. (2020). Population-level inferences from environmental DNA—Current status and future perspectives. Evol. Appl. 13, 245–262. doi: 10.1111/eva.12882
Sigsgaard E. E., Nielsen I. B., Carl H., Krag M. A., Knudsen S. W., Xing Y., et al. (2017). Seawater environmental DNA reflects seasonality of a coastal fish community. Mar. Biol. 164, 128. doi: 10.1007/s00227-017-3147-4
Skjoldal H. R. (Ed.) (2022). Ecosystem assessment of the Central Arctic Ocean: Description of the ecosystem. ICES Cooperative Research Reports, (Copenhagen, Denmark: International Council for the Exploration of the Sea) Vol. 355, 341 pp. doi: 10.17895/ices.pub.20191787
Stat M., Huggett M. J., Bernasconi R., DiBattista J. D., Berry T. E., Newman S. J., et al. (2017). Ecosystem biomonitoring with eDNA: metabarcoding across the tree of life in a tropical marine environment. Sci. Rep. 7, 12240. doi: 10.1038/s41598-017-12501-5
Stoeckle B. C., Beggel S., Cerwenka A. F., Motivans E., Kuehn R., Geist J. (2017). A systematic approach to evaluate the influence of environmental conditions on eDNA detection success in aquatic ecosystems. PloS One 12, e0189119. doi: 10.1371/journal.pone.0189119
Taberlet P., Bonin A., Zinger L., Coissac E. (2018). Environmental DNA (New York: Oxford University Press). 268 pp.
Taberlet P., Coissac E., Hajibabaei M., Rieseberg L. H. (2012). Environmental DNA. Mol. Ecol. 21, 1789–1793. doi: 10.1111/j.1365-294x.2012.05542.x
Takahara T., Minamoto T., Yamanaka H., Doi H., Kawabata Z. (2012). Estimation of fish biomass using environmental DNA. PloS One 7, e35868. doi: 10.1371/journal.pone.0035868
Takeuchi A., Iijima T., Kakuzen W., Watanabe S., Yamada Y., Okamura A., et al. (2019). Release of eDNA by different life history stages and during spawning activities of laboratory-reared Japanese eels for interpretation of oceanic survey data. Sci. Rep. 9, 6074. doi: 10.1038/s41598-019-42641-9
Thomsen P. F., Møller P. R., Sigsgaard E. E., Knudsen S. W., Jørgensen O. A., Willerslev E. (2016). Environmental DNA from seawater samples correlate with trawl catches of subarctic, deepwater fishes. PloS One 11, e0165252. doi: 10.1371/journal.pone.0165252
Thomsen P. F., Willerslev E. (2015). Environmental DNA – An emerging tool in conservation for monitoring past and present biodiversity. Biol. Conserv. 183, 4–18. doi: 10.1016/j.biocon.2014.11.019
Thorsteinson L. K., Love M. S. (Eds.) (2016). Alaska Arctic marine fish ecology catalog: U.S. Geological Survey Scientific Investigations Report 2016-5038 (OCS Study, BOEM 2016-048) (Virginia: U.S. Geological Survey), 768. doi: 10.3133/sir20165038
Tsuji S., Maruyama A., Miya M., Ushio M., Sato H., Minamoto T., et al. (2020). Environmental DNA analysis shows high potential as a tool for estimating intraspecific genetic diversity in a wild fish population. Mol. Ecol. Res. 20, 1248–1258. doi: 10.1111/1755-0998.13165
Tsuji S., Takahara T., Doi H., Shibata N., Yamanaka H. (2019). The detection of aquatic macroorganisms using environmental DNA analysis—A review of methods for collection, extraction, and detection. Environ. DNA. 1, 99–108. doi: 10.1002/edn3.21
Tsuri K., Ikeda S., Hirohara T., Shimada Y., Minamoto T., Yamanaka H. (2021). Messenger RNA typing of environmental RNA (eRNA): A case study on zebrafish tank water with perspectives for the future development of eRNA analysis on aquatic vertebrates. Environ. DNA. 3, 14–21. doi: 10.1002/edn3.169
Welch H. E., Bergmann M. A., Siferd T. D., Martin K. A., Curtis M. F., Crawford R. E., et al. (1992). Energy flow through the marine ecosystem of the lancaster sound region, Arctic Canada. Arctic 45, 343–357. doi: 10.14430/arctic1361
Wessel P., Smith W. H. F., Scharroo R., Luis J., Wobbe F. (2013). Generic mapping tools: Improved version released, EOS trans. AGU 94, 409–410. doi: 10.1002/2013EO450001
Wilson R. E., Sonsthagen S. A., Smé N., Gharrett A. J., Majewski A. R., Wedemeyer K., et al. (2020). Mitochondrial genome diversity and population mitogenomics of polar cod (Boreogadus saida) and Arctic dwelling gadoids. Polar Biol. 43, 979–994. doi: 10.1007/s00300-020-02703-5
Wong M. K.-S., Nakao M., Hyodo S. (2020). Field application of an improved protocol for environmental DNA extraction, purification, and measurement using Sterivex filter. Sci. Rep. 10, 21531. doi: 10.1038/s41598-020-77304-7
Keywords: Arctic, environmental DNA, logistic regression analysis, polar cod (Boreogadus saida), quantitative PCR, sea ice, species-specific assay, water mass classification
Citation: Kawakami T, Yamazaki A, Jiang H-C, Ueno H and Kasai A (2023) Distribution and habitat preference of polar cod (Boreogadus saida) in the Bering and Chukchi Seas inferred from species-specific detection of environmental DNA. Front. Mar. Sci. 10:1193083. doi: 10.3389/fmars.2023.1193083
Received: 24 March 2023; Accepted: 07 August 2023;
Published: 30 August 2023.
Edited by:
Yuki Minegishi, The University of Tokyo, JapanReviewed by:
Haakon Hop, Norwegian Polar Institute, NorwayCopyright © 2023 Kawakami, Yamazaki, Jiang, Ueno and Kasai. This is an open-access article distributed under the terms of the Creative Commons Attribution License (CC BY). The use, distribution or reproduction in other forums is permitted, provided the original author(s) and the copyright owner(s) are credited and that the original publication in this journal is cited, in accordance with accepted academic practice. No use, distribution or reproduction is permitted which does not comply with these terms.
*Correspondence: Tatsuya Kawakami, a2F3YWthbWlAZmlzaC5ob2t1ZGFpLmFjLmpw
Disclaimer: All claims expressed in this article are solely those of the authors and do not necessarily represent those of their affiliated organizations, or those of the publisher, the editors and the reviewers. Any product that may be evaluated in this article or claim that may be made by its manufacturer is not guaranteed or endorsed by the publisher.
Research integrity at Frontiers
Learn more about the work of our research integrity team to safeguard the quality of each article we publish.