 Tarang Khangaonkar
 Su Kyong Yun
- 1Salish Sea Modeling Center, University of Washington, Tacoma, Washington, United States
- 2Pacific Northwest National Laboratory, Marine and Coastal Research Laboratory, Seattle, Washington, United States
The feasibility of reducing nutrient pollution impact by redirecting the effluent to depths below the euphotic zone was investigated for the deep estuarine Puget Sound region of the Salish Sea in the Pacific Northwest of America. The hypothesis tested was that the thickness of the outflow layer in deep estuaries may be greater than the euphotic zone depth, allowing a fraction of nutrients to be exported out passively through the layers immediately below. The euphotic zone depth in Puget Sound varies from 8 to 25 m while the depth of the outflow layer can reach up to ≈ 60 m. Outfall relocation strategies were tested on 99% of the anthropogenic nutrient loads currently delivered to Puget Sound. The impact was quantified using the previously established biophysical Salish Sea Model, using gross primary production and exposure to low dissolved oxygen (DO) levels as the metric (< 2 mg/L for hypoxia and < 5 mg/L for impairment). Eliminating nutrient pollution (above natural) from rivers and wastewater reduced hypoxia exposure by 8.1% and 11.2%, respectively. Relocating the outfalls to deeper waters resulted in improvements, but only in the sill-less sub-basins such as Whidbey, where hypoxia and DO impairment exposure decreased (7.9% and 6.8%, respectively). The presence of multiple sills and circulation cells in Puget Sound resulted in increased exposure and rendered nutrient bypass goals unfeasible as originally envisioned. However, an alternate nutrient export pathway was identified through bottom exchange flow out of Puget Sound via Whidbey Basin and Deception Pass. An unexpected reduction in the exchange outflow magnitude (≈ 4%) due additional (22%) freshwater discharged to the estuary bottom was also noted. The potential loss in circulation strength due to rerouting of natural surface freshwater through submerged deep-water outfalls is identified as a new unforeseen anthropogenic impact.
Highlights
● Eliminating nutrient pollution would reduce average exposure to hypoxia by ≈ 18% in Puget Sound.
● Euphotic zone bypass failed due to effluent trapping in the recirculation cells between sills.
● Outfall relocation provided ≈ 9% reduction in hypoxia exposure in Whidbey Basin (without sill).
● Relocating surface freshwater discharges to depth impacts the strength of estuarine circulation.
1 Introduction
The presence of nutrients (inorganic and organic forms of nitrogen, phosphorous, and carbon) in coastal environments is essential for primary production to occur, to support the food chain, and to sustain a healthy ecosystem. The largest source of nutrients to coastal estuaries is typically the oceanic water delivered via density-driven sub-tidal inflow (exchange flow) along the bottom. If estuaries were fully mixed and could be represented by a continuously stirred reactor box, one would expect that land-based loads would have minimal effect on the estuarine biogeochemical balance. The reality, however, is that estuaries are stratified environments that often support a two-layer circulation of surface outflow layer outflow and bottom inflow layer. At the onset of spring with light and temperatures reaching levels conducive to primary production, algae begin to bloom. Nutrient consumption by algae during the growing season occurs at a rate faster than the diffusive flux of bottom oceanic waters to the surface. This, results in the depletion of nutrients from the euphotic surface layers and creates conditions susceptible to eutrophication. Under these conditions, anthropogenic nutrient loads that reach the euphotic zone more than the natural (ie. nutrient pollution) can lead to harmful algal blooms, resulting in hypoxia and acidic conditions harmful to the ecosystem (National Research Council, 2000). In poorly flushed sub-basins, the produced organic matter is retained and settles to the sediments (Harrison et al., 1994) resulting in high sediment oxygen demand.
Anthropogenic nutrient loading to urbanized estuaries typically occurs through wastewater outfalls that have been constructed over many years, varying in their configuration and placement. Depending on the estuary type (varying from the shallow and well-mixed coastal plain estuary, to a fjord-like highly stratified waterbody), and the physical configuration of wastewater discharges (varying from open-ended pipes along the shoreline to deep water outfall with diffusers), the relative contribution of the anthropogenic nutrient flux to the euphotic zone may vary. Unlike the well-mixed estuaries in the shallow coastal plain along the Atlantic Coast of the U.S. (e.g., Chesapeake Bay, Narragansett Bay, or Delaware Bay), the estuaries in the Pacific Northwest, including Puget Sound in the U.S. and Georgia Basin in Canada, which together with the Strait of Juan de Fuca comprise the Salish Sea (Figure 1), are deep and highly stratified. In such waters, the euphotic zone depth may occupy a smaller fraction of the water column relative to the estuarine outflow depth. In this paper, we explore the possibility of improving water quality through estuary wide cumulative assessment of outfall siting and placement. Specifically, we assess the feasibility of reducing the impact of nutrient pollution by reducing the flux of excess nutrients to the euphotic zone, through avoidance/bypass efforts. The hypothesis is that there may be an opportunity to export some of the excess nutrients out through the lower layers, bypassing the biologically active euphotic zone through outfall relocation and redesign considerations. Export out of Puget Sound would be through Admiralty Inlet and Deception Pass pathways into the Strait of Juan De Fuca for eventual mixing and transport out to the continental shelf.
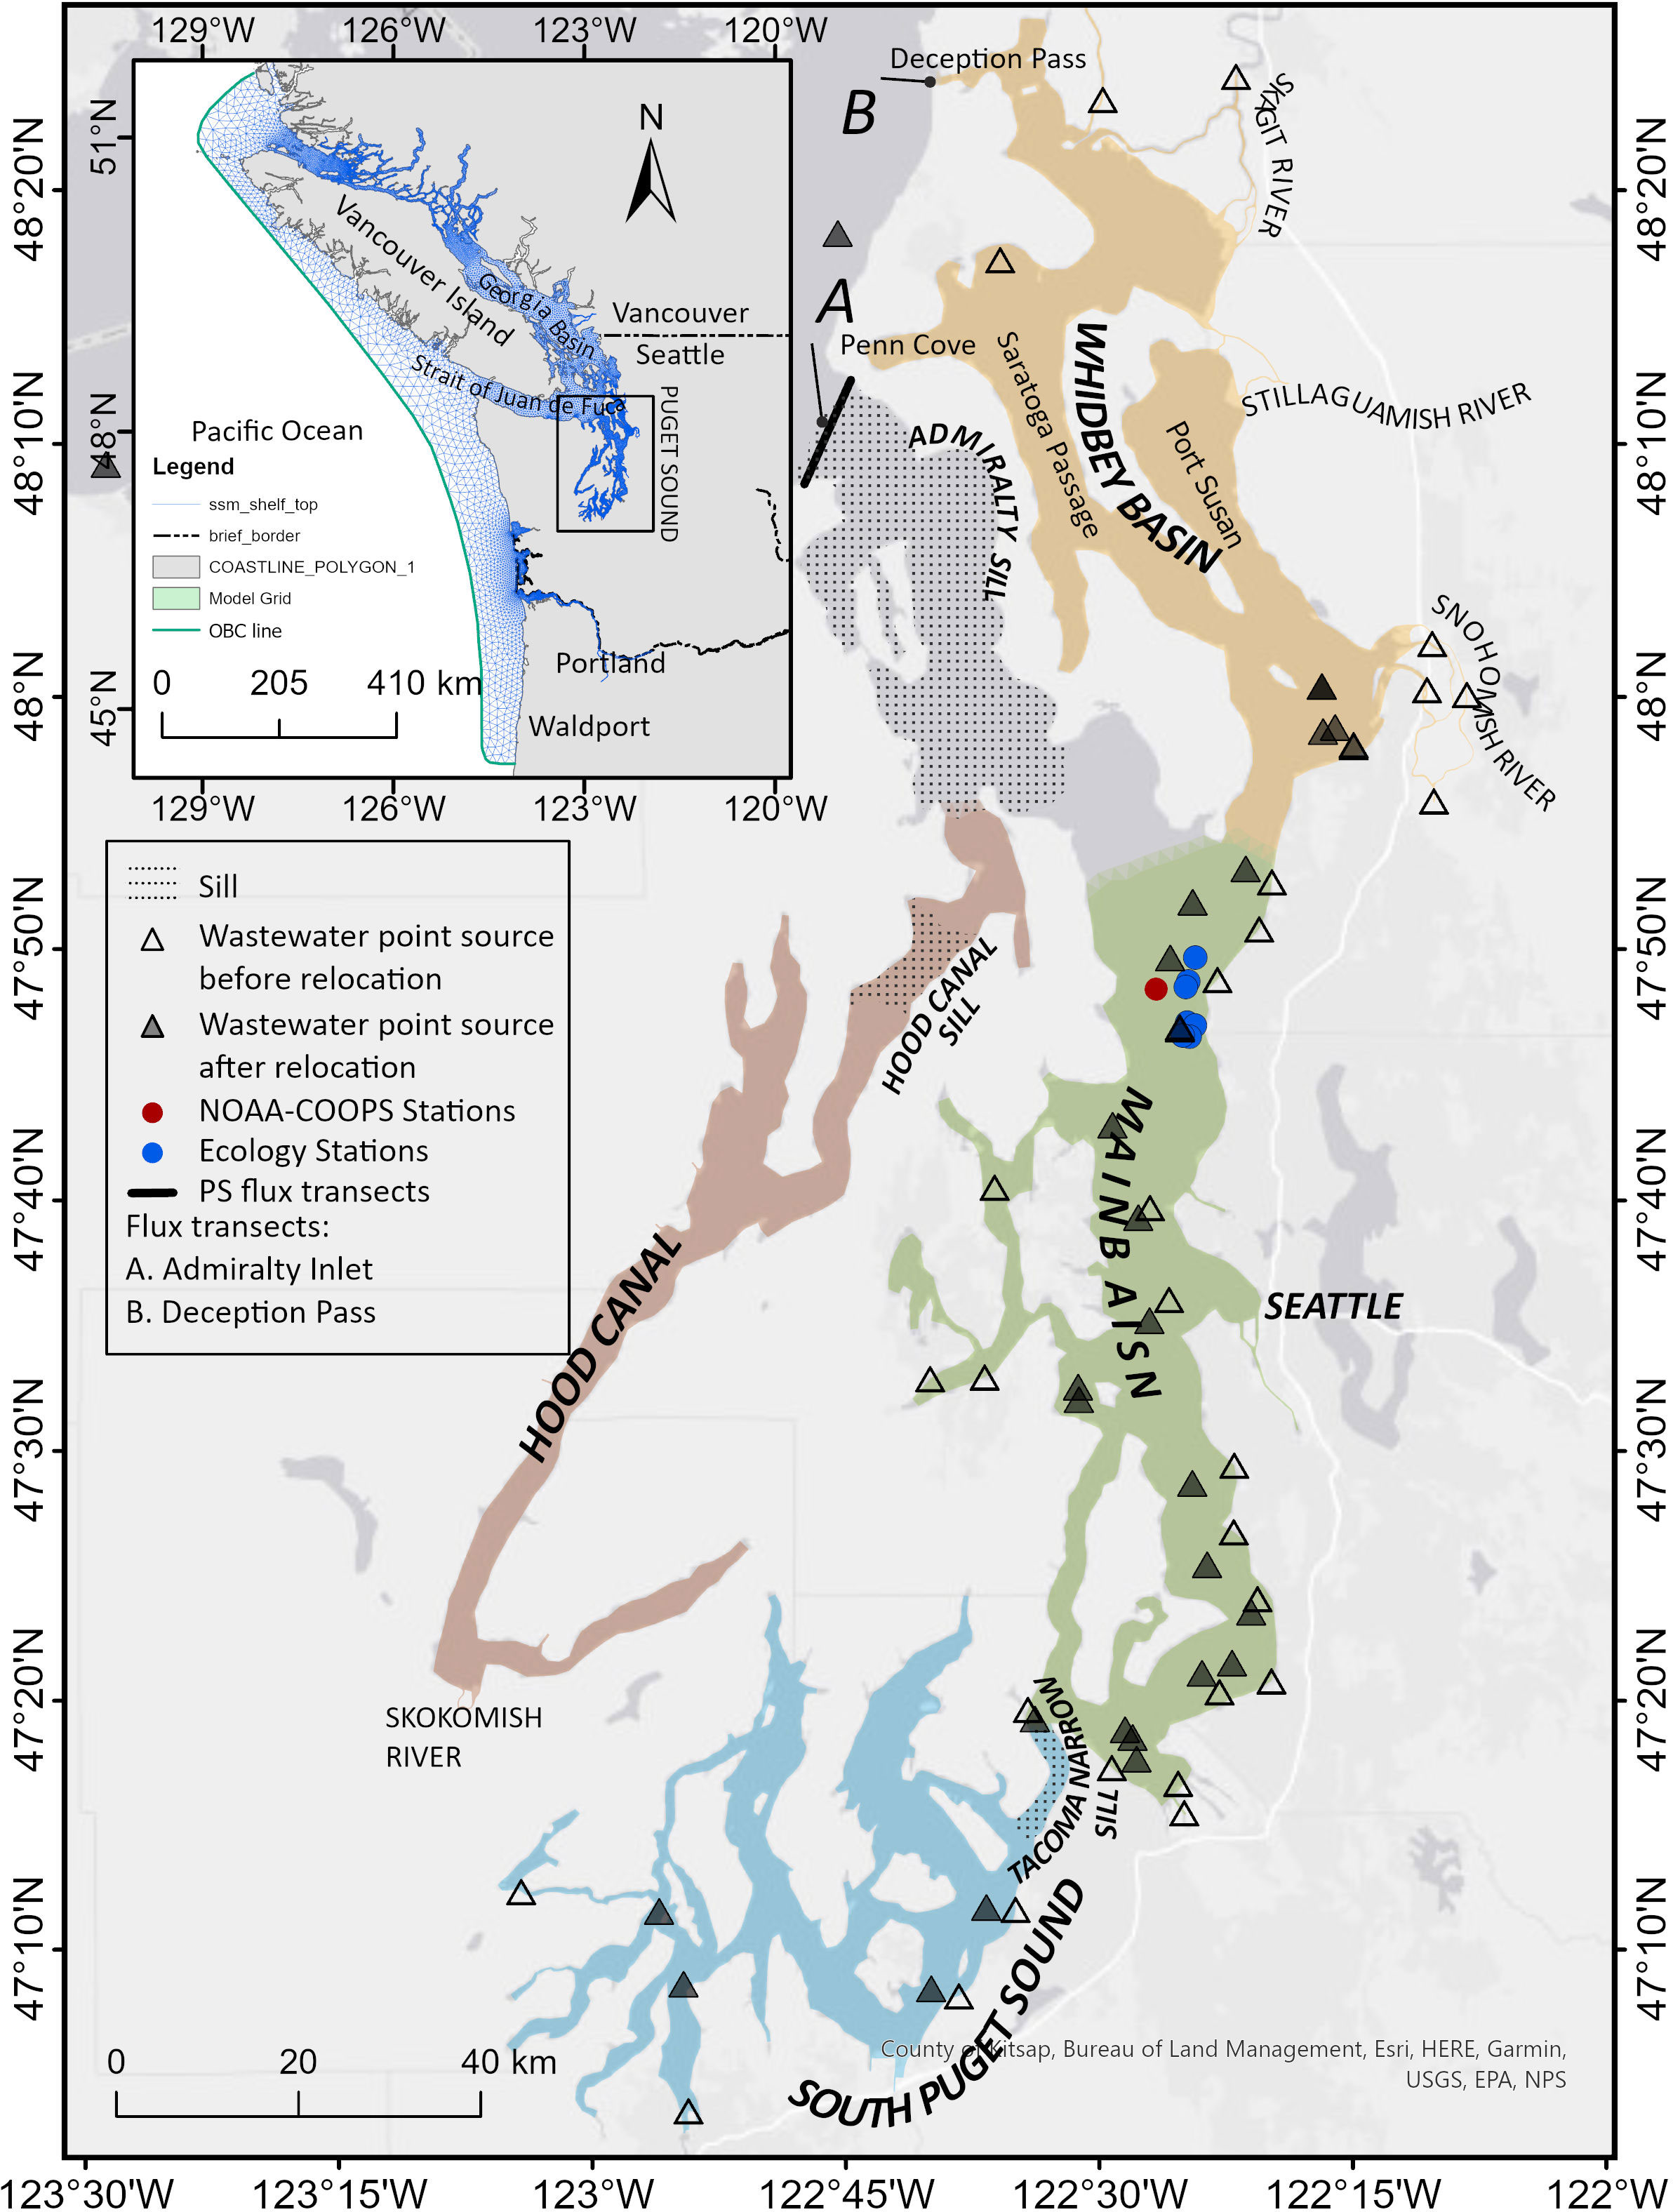
Figure 1 Study area map showing sub-basins within the Puget Sound region of the Salish Sea. The inset shows the entire Salish Sea Model domain. Monitoring data stations indicated include NOAA-COOPS station (red) for currents, Ecology/King County stations for PAR and chlorophyll a data (blue). Transects A and B are locations where volume flux (exchange flow) calculations were conducted. Wastewater point sources (outfalls) are shown as triangles before and after hypothetical relocation. Locations of Tacoma Narrows sill (44 m depth), Admiralty Inlet double sill (64 m and 106 m depths), and Hood Canal Sill (50 m depth) are indicated using dotted pattern fill.
From the 1950s (Barnes and Collias, 1958; Stockner et al., 1979) to more recent times (Harrison et al., 1994; Newton et al., 1995; Embrey and Inkpen, 1998; Albertson et al., 2002; Paulson et al., 2006; Albertson et al., 2007; PSAT, 2007), researchers have documented occurrences of hypoxia (dissolved oxygen [DO]< 2 mg/L) in the Salish Sea. While this may be a natural condition in some of the sub-basins such as Hood Canal, Penn Cove, and East Sound due to fjord-like features, in the Salish Sea, Bricker et al. (1999) reported that symptoms of eutrophic conditions with elevated concentrations of chlorophyll a, macroalgae, toxic blooms, and low DO levels were present over a broader scale and were likely to worsen due to nutrient pollution. More recent data from 1999–2010 has shown potential anthropogenic nutrient enrichment in progress with an increasing trend in nutrient concentrations throughout Puget Sound (Krembs, 2012a; Krembs, 2012b; Krembs, 2013) and accompanied by a decreasing trend in DO in the bottom waters of the Salish Sea in both the U.S. and Canadian regions (https://www.epa.gov/salish-sea/marine-water-quality). A study conducted by the Washington State Department of Ecology (Ecology) confirmed that regional nutrient contributions from humans exacerbate low DO, especially in poorly flushed areas, and that cumulative annual hypoxic volumes defined by DO levels< 2 mg/L were 28-35% higher today relative to pre-anthropogenic reference conditions (Ahmed et al., 2019). Flushing and water renewal are key factors that control the sensitivity of biological response or susceptibility to nutrient load, which affects the time available for the nutrients to be taken up by the biota. Recent assessments of transport time scales in the form of flushing time and residence times show that some of the Salish Sea basins under strong hydraulic control from shoreline complexities, presence of islands, and bathymetric features such as sills exhibit long flushing and residence times (Ahmed et al., 2017; MacCready et al., 2021; Premathilake and Khangaonkar, 2022), making them particularly vulnerable to nutrient pollution impacts. For example, the average “e-folding” flushing time or the time taken for initial concentrations to reduce to 1/e levels in Hood Canal is ≈ 110 days, and the Puget Sound Main Basin requires ≈ 116 days. The flushing times of South Puget Sound and Whidbey Basin are relatively lower at 40 days and 28 days respective but still over 4 weeks long. Sediment oxygen uptake in these basins is also correspondingly higher influenced by higher gross primary production and sedimentation of organic matter (Santana and Shull, 2023).
Based on 2014 conditions, Khangaonkar et al. (2018) estimated that oceanic nitrate flux to the Salish Sea at 64 kg/s was nearly 74 times the magnitude of land-based sources, which totals 0.87 kg/s. These findings are a challenge from the perspective of water quality management, as they indicate that the largest source of nutrient flux to the system is of natural oceanic origin, and lead to the incorrect expectation that anthropogenic nutrient pollution may not contribute significantly to impairment and impact. However, a study by Davis et al. (2014) showed that while estuary-enhanced upwelling was the major source of nitrogen to the Salish Sea, almost 98% of nutrient (nitrate) outflow from the Salish Sea was of oceanic origin. It is important therefore to recognize that a large quantity of nutrients may enter, circulate through the Salish Sea passively, and exit without interacting with the euphotic zone. However, the direct supply of anthropogenic nutrient loads into the euphotic zone of a stratified estuary that is depleted of nutrients in the summer can still have a significant impact on algal growth and primary production, and conversely, limiting the same provides impact reduction benefits as shown by Ahmed et al. (2019) and Khangaonkar et al. (2018). Reduction in nutrient loads to address the DO impacts would require extensive treatment plant upgrades with major cost implications for most wastewater treatment plants in the region.
The overall objective of this modeling-based investigation was to explore if nutrient impact reduction benefits could also be gained through alternate wastewater discharge strategies. Engineering feasibility including costs would be the next step if successful. Here we focus on the deep stratified estuary conditions of the Puget Sound Basin in the Salish Sea, where the thickness of the surface outflow layer is greater than the depth of the euphotic zone. The hypothesis is that a fraction of nutrient pollution could be exported out of the deep estuary passively without participating in the primary production in the upper outflow layer in the photic zone. To test the feasibility of this hypothesis, numerous sensitivity tests were conducted using a previously established biophysical Salish Sea Model. We first quantified the relative impacts of anthropogenic nutrient loads from (a) buoyant river plumes that enter the euphotic zone directly and (b) wastewater outfalls distributed at various depths in Puget Sound. We then explored the feasibility of outfall relocation to deeper depths and mixing wastewater into the exiting conveyance provided by estuarine exchange flow features within the Salish Sea estuarine system. Moving the outfalls to deeper waters would be expected to transport the wastewater plumes away from the euphotic zone. Similarly, relocation away from the shore towards a nearby exchange pathway would allow for improved transport out of the estuary. Results of the scenario tests were evaluated for impact, quantified using gross primary production (GPP) and exposure to low DO levels as the metric (< 2 mg/L for hypoxia and< 5 mg/L for impairment) to allow consistent comparison of environmental benefits.
2 Methods
2.1 Characterization of the Puget Sound euphotic zone and subtidal outflow depth
Using Secchi depth data collected from the Main Basin of Puget Sound from 1998 to 2000, Newton and Van Voorhis (2002) estimated euphotic zone depth to vary from 7 to 46 m with an average value of 21 m. The King County (Washington state) marine monitoring program subsequently collected additional water column profile data using a CTD (conductivity, temperature, and depth) instrument that included direct measurements of photosynthetically active radiation (PAR) and chlorophyll a. Euphotic zone depths were computed at 1% of surface PAR values data from all available profiles from the seven Puget Sound stations over a period from 2002 to 2003 (Figure 1) and were found to vary from 8 to 25 m. Figure 2A shows a composite scatter plot of all measured PAR data from Puget Sound, and sets the maximum euphotic zone depth demarcation at 25 m. Figure 2B includes a scatter plot of corresponding chlorophyll a data. It shows that algal growth is also captured well by the 25 m demarcation/designation of the euphotic zone depth for Puget Sound.
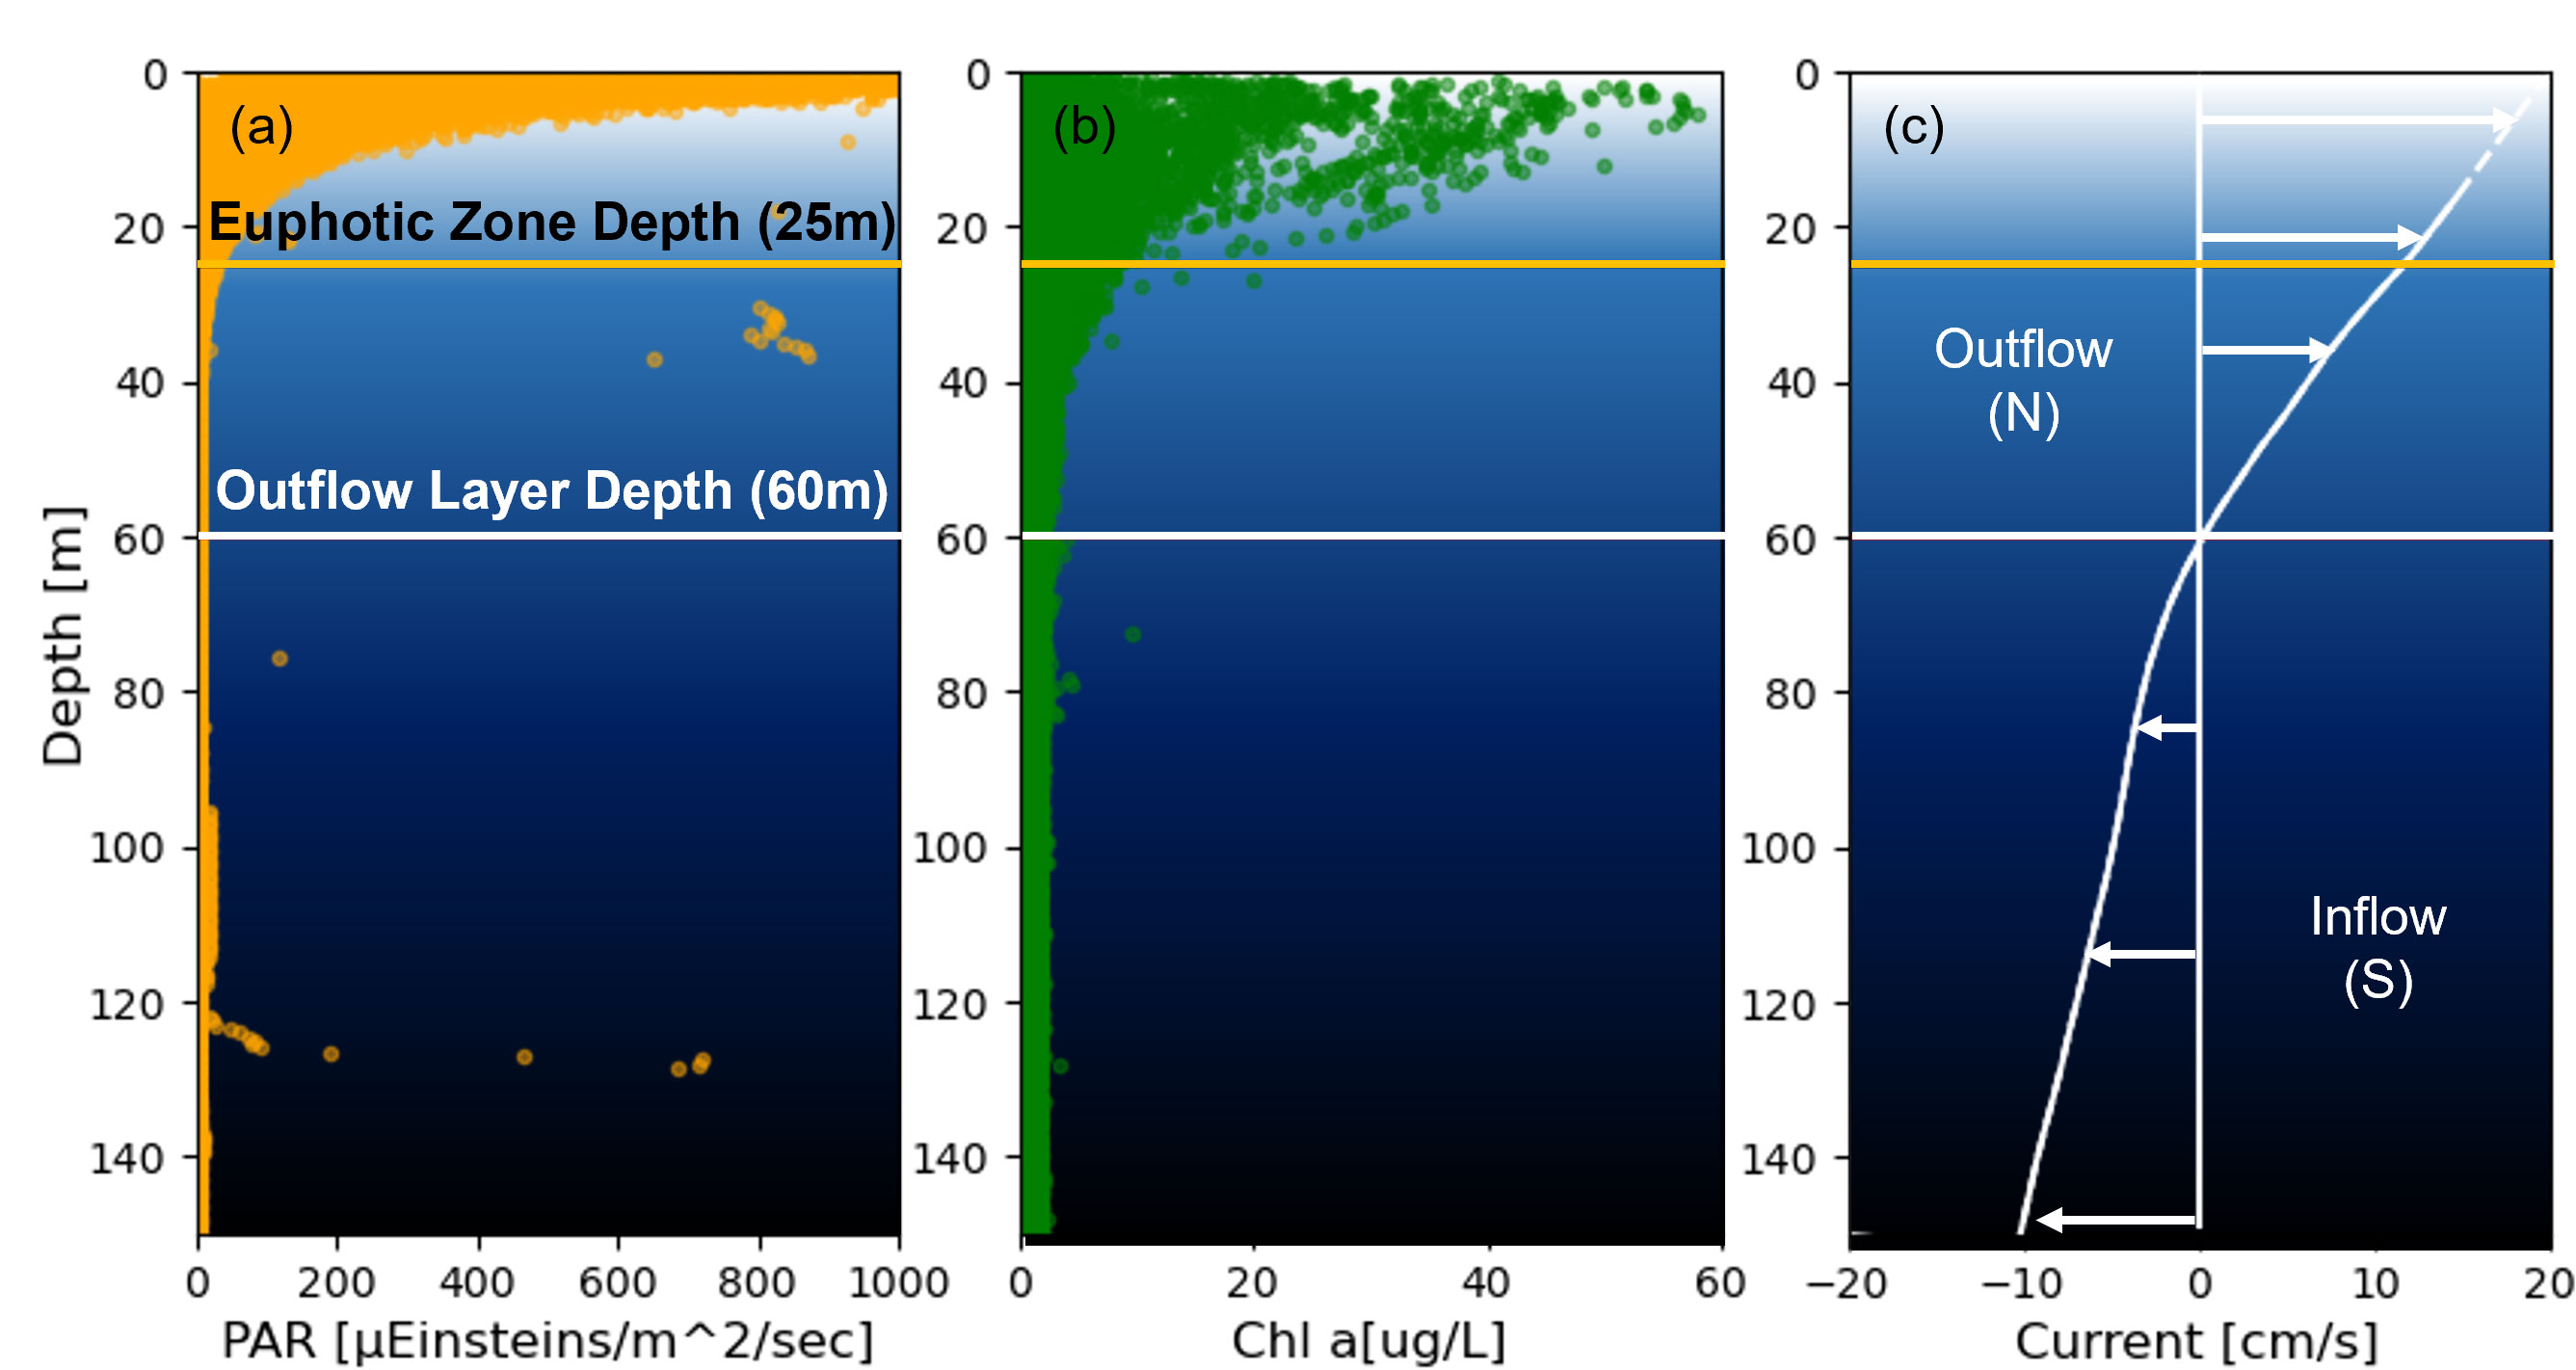
Figure 2 Characterization of the euphotic zone and outflow layer depths in the Puget Sound region of the Salish Sea. (A) PAR measurements from seven stations in Puget Sound from Years 2002 to 2003, (B) chlorophyll a data from the same stations, and (C) tidally averaged currents from Acoustic Doppler Current Profile data collected by NOAA-COOPs in 2015 from a representative Puget Sound Main Basin station. Negative current value represents landward inflow and positive value represents seaward outflow.
The National Oceanic and Atmospheric Administration (NOAA) Center for Operational Oceanographic Products and Services (CO-OPS) collected acoustic doppler current profiles from numerous stations in the Salish Sea from 2015 to 2017 through short-term deployments. Figure 2C shows a tidally averaged velocity profile measured from a centrally located Puget Sound station (Figure 1) from May through September of 2015 as an example. The positive current velocity indicates seaward outflow due north, and the negative values indicate landward inflow due south. Based on this velocity profile, the depth of zero motion or the outflow layer thickness is ≈ 60 m. This outflow layer thickness also varies from station to station and is a function of the circulation characteristics affected by bathymetry and shoreline geometry. In some basins such as Hood Canal or Saratoga Passage, the outflow layer occupies only the upper 10-15% of the water column, but in partially mixed regions such as Puget Sound, Admiralty Inlet, or the Strait of Juan de Fuca, the outflow layer extends to as much as 40-50% of the water depth, well beyond the euphotic zone. This offers the potential for nutrients in the lower layers including the anthropogenic component to be exported out of the system, bypassing the euphotic zone.
2.2 The Salish Sea model – hydrodynamics and biogeochemistry (2013-2020)
To test the proposed hypothesis, we conducted numerous sensitivity tests using the Salish Sea Model (Khangaonkar et al., 2018; Khangaonkar et al., 2019; Khangaonkar et al., 2021). The model domain covers the entire Salish Sea including Puget Sound, Georgia Strait, the Strait of Juan De Fuca, the waters surrounding the Vancouver Island, and the continental shelf as shown in Figure 1 (inset). It is a comprehensive biophysical model that uses the Finite Volume Community Ocean Model (FVCOM, Chen et al., 2003) framework to solve Reynolds-averaged Navier-Stokes equations for turbulent flows in coastal ocean environments. The hydrodynamic solutions are generated using a finite volume framework with an unstructured grid with lateral resolution that varies from a cell size of ≈ 250 m near river mouths to ≈ 800 m in Puget Sound, increasing to ≈ 3 km resolution in the straits and 12 km over the continental shelf. The vertical configuration of the model uses 10 sigma-stretched layers distributed using a power law function with an exponent P-Sigma of 1.5, which provides more layer density near the surface. The biogeochemical component of the Salish Sea Model uses FVCOM-ICM, developed by Kim and Khangaonkar (2012) in collaboration with University of Massachusetts and U.S. Army Corps of Engineers. FVCOM-ICM is based on the kinetics of the CE-QUAL-ICM (Cerco and Cole, 1994; Cerco and Cole, 1995) water-quality model and was developed for use with the FVCOM model framework through external/offline coupling. In addition to temperature and salinity, the biogeochemical model includes state variables associated with the nutrients, phytoplankton, zooplankton, and detritus kinetics, and submerged aquatic vegetation. Specifically, the model simulates two species of phytoplankton (diatoms and dinoflagellates), two species of zooplankton (macro and meso), labile and refractory dissolved organic carbon (DOC) and particulate organic carbon (POC), ammonium (NH4), nitrate (NO2+NO3), labile and refractory dissolved organic nitrogen (DON) and particulate organic nitrogen (PON), phosphate (PO4), labile and refractory dissolved organic phosphorous (DOP), DO, dissolved inorganic carbon (DIC), and total alkalinity (TA). The model includes a sediment diagenesis module that allows directly coupled interaction between the water column and sediments through the processes of organic sediment settling, burial, remineralization, and carbonate chemistry with DIC, TA, pCO2, and pH. Of specific relevance to this study is that a total of 99 wastewater discharges and stream flows from 161 watersheds are already included, with nutrient loads estimated through a combination of monitoring data and multi-variate regression analysis (Mohamedali et al., 2011; Ahmed et al., 2019).
During this effort, the hydrodynamic component of the model was upgraded from FVCOM_v2.7 to v4.3 and recalibrated over a multi-year simulation from 2013 to 2020. This upgrade required corresponding fine-tuning of some of the FVCOM-ICM parameters to ensure that performance and skill in predicting DO, pH, nutrients, and plankton were either improved or maintained at the established levels. Specifically, the settling velocities for the particulate organic required adjustment down from 7.5 to 2.0 m/d. Similarly, an increase in reaeration was implemented for the winter months to further improve the DO calibration. The empirical proportionality constant “a” in reaeration rate was increased from 0.251 to 0.450. The recalibration and validation were conducted over an 8-year continuous simulation to ensure satisfactory model performance compliant with the targets established by the local user community (RMSET< 1°C, RMSES< 1 psu, and RMSEDO< 1 mg/L). Table 1 provides skill assessment results (error statistics and skill scores) for key model constituents, tabulated by year. Skill assessment was conducted using monthly monitoring data collected by Ecology’s Marine Monitoring Program. A snapshot of model results with comparison to measured data is shown in Figure 3 for August of 2019 for temperature, salinity, and DO. The figure shows two transects, one through Whidbey Basin (from Possession Sound to Deception Pass via Saratoga Passage), and one through Puget Sound main basin (from Admiralty Inlet to Tacoma Narrows) and provides information on the bathymetric features in the two basins.
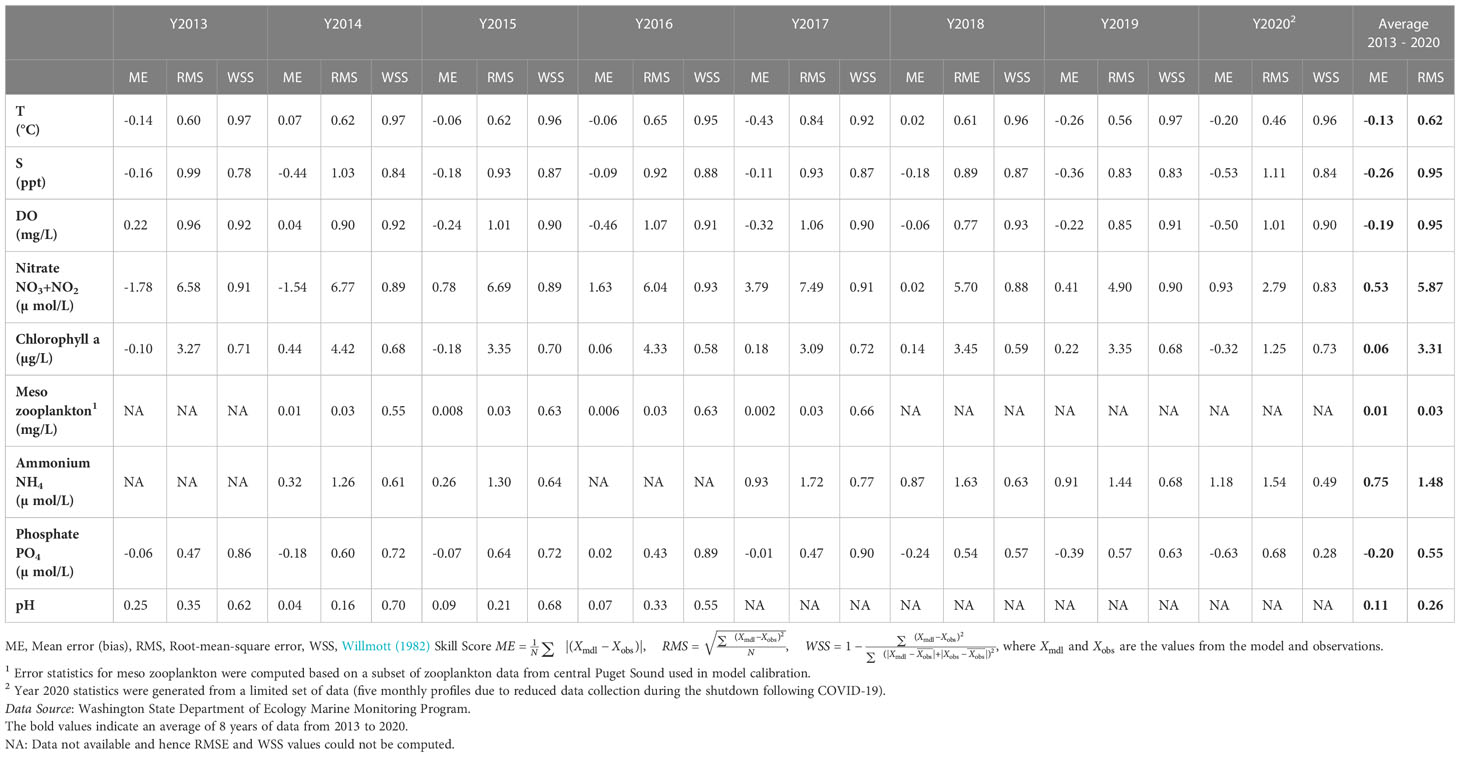
Table 1 The Salish Sea Model error statistics and skill scores for major constituents with calibration data from 2013 to 2020.
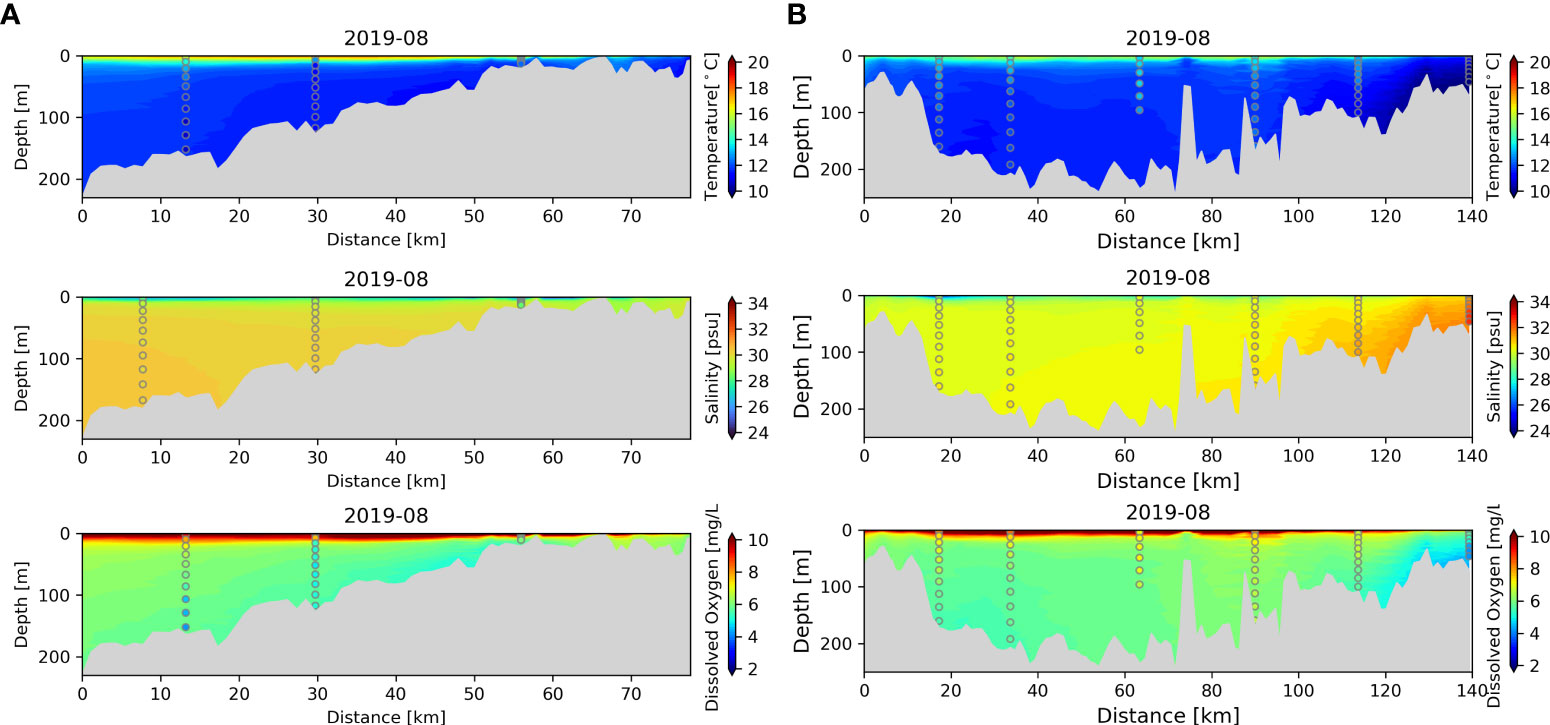
Figure 3 A snapshot comparison of model predictions with measured data collected in August of 2019 is shown through (A) Whidbey basin transect starting from Possession Sound, through Saratoga Passage, to Deception Pass, and (B) Puget Sound Transect from Tacoma Narrows, through East Passage and Main Basin, to Admiralty Inlet. The data are from Washington State Department of Ecology Marine Monitoring Program.
2.3 Characterization of nutrient loads to Puget Sound
Daily concentrations of nutrient and water-quality constituent loads from a total of 161 watershed runoff-based rivers and streams and 99 wastewater point sources were estimated using a combination of hydrological analyses and multiple regression and procedures developed by Ecology (Mohamedali et al., 2011; Ahmed et al., 2019). For this characterization, we focus on the years 2018 to 2020, a period after the passage of the Northeast Pacific marine heatwave through the Salish Sea (Bond et al., 2015; Bond, 2021) from 2014 to 2017, during which hydrology of the system, watershed loads, and the Salish Sea biogeochemical response may have been impacted, as noted by Khangaonkar et al. (2021).
Nutrient loads to the Salish Sea include DON, PON, DOP, phosphate, and DIN (nitrate + ammonium). DIN is the form of nutrient load that is consumed most during primary production, and its availability in the euphotic zone limits or spurs the algal growth during the summer months. Figure 4A shows a distribution of annual average DIN loading rates by region (U.S. or Canada) and by source type (wastewater point source or river). It is interesting to note that watershed-based nitrate load delivered by the rivers are of similar magnitude to ammonium load discharged by wastewater facilities but are delivered directly to the euphotic zone with the river plume. Relevant to this study with a focus on the U.S. loads is the chart in Figure 4B, which shows that 72% of DIN discharged through wastewater point sources in U.S. waters is through submerged outfalls below the euphotic zone already. This leaves the potential for improvement through the modification of 25% of wastewater point source loads that are presently discharged directly to the euphotic zone.
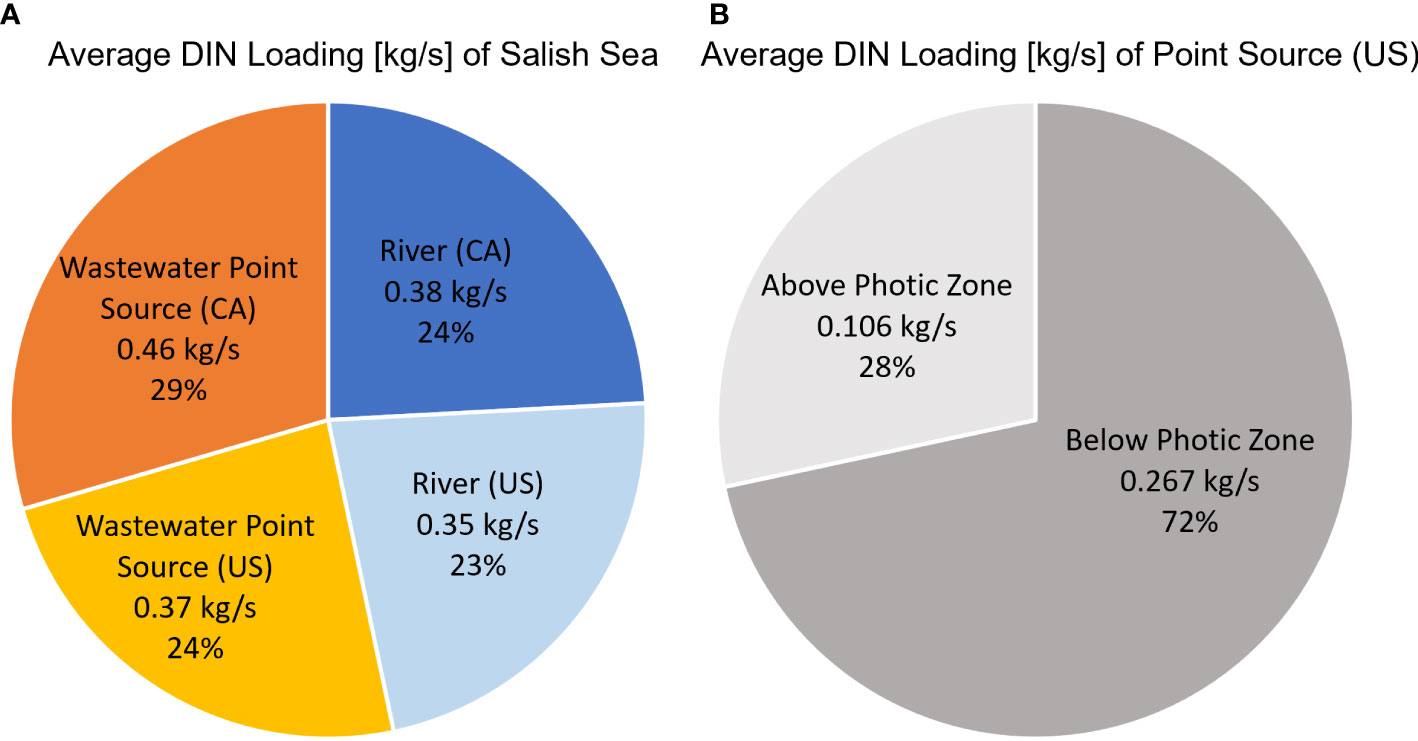
Figure 4 (A) Distribution of average DIN loading [kg/s] for the Salish Sea based on Year 2018, 2019, and 2020 data. The loading values are presented in kg/s, and percentages are relative to the total average DIN loading (1.44kg/s) to the Salish Sea, including Canadian and U.S. regions. (B) Average DIN loading [kg/s] of point sources in the U.S. with percent distribution between above euphotic zone and below euphotic zone.
It is important to note that both sources of nutrients (rivers and wastewater point sources) carry a naturally occurring nutrient load plus the added anthropogenic component. Determining natural loading to any estuarine system is subjective based on the definition of natural condition (pre-historic vs. pre-development, etc.). For this assessment, we have adopted the definition of natural “Reference” condition developed by Ecology as defined in Ahmed et al. (2019). The Reference condition nutrient load was calculated by setting watershed inputs and wastewater point source inputs to an estimated natural load of nitrogen and carbon while keeping the model year climate and hydrology the same as the existing conditions. Specifically, reference nutrient concentrations for rivers were set to 10th percentile of their measured values and wastewater outfall concentrations were reduced to the respective watershed reference river nutrient concentrations. For relatively pristine watersheds, the reference condition was defined by reducing the river concentrations to 50th percentile of the measured values. Although relatively small, the natural nutrient load associated with urban watershed runoff that is collected and routed to wastewater treatment plants is accounted for. Similarly, anthropogenic loads delivered to watershed streams and rivers from land-use practices and urbanization are distinguished from natural runoff.
Figure 5A provides a comparison of existing nutrient loads to the Salish Sea computed for the years 2018 to 2020 and Figure 5B shows estimated natural nutrient loads for the reference conditions from 2018 to 2020. The Reference condition calculation did not affect phosphate and DOP much but POC, NH4, NO3+NO2, DON, and PON show a significant reduction in nutrient loads in the Reference condition compared to the Existing condition. Based on this approach, over the period 2018 to 2020, 72% of DIN, 73% of DON, and 63% of POC in the total nutrient loads to Puget Sound are estimated to be of anthropogenic origin.
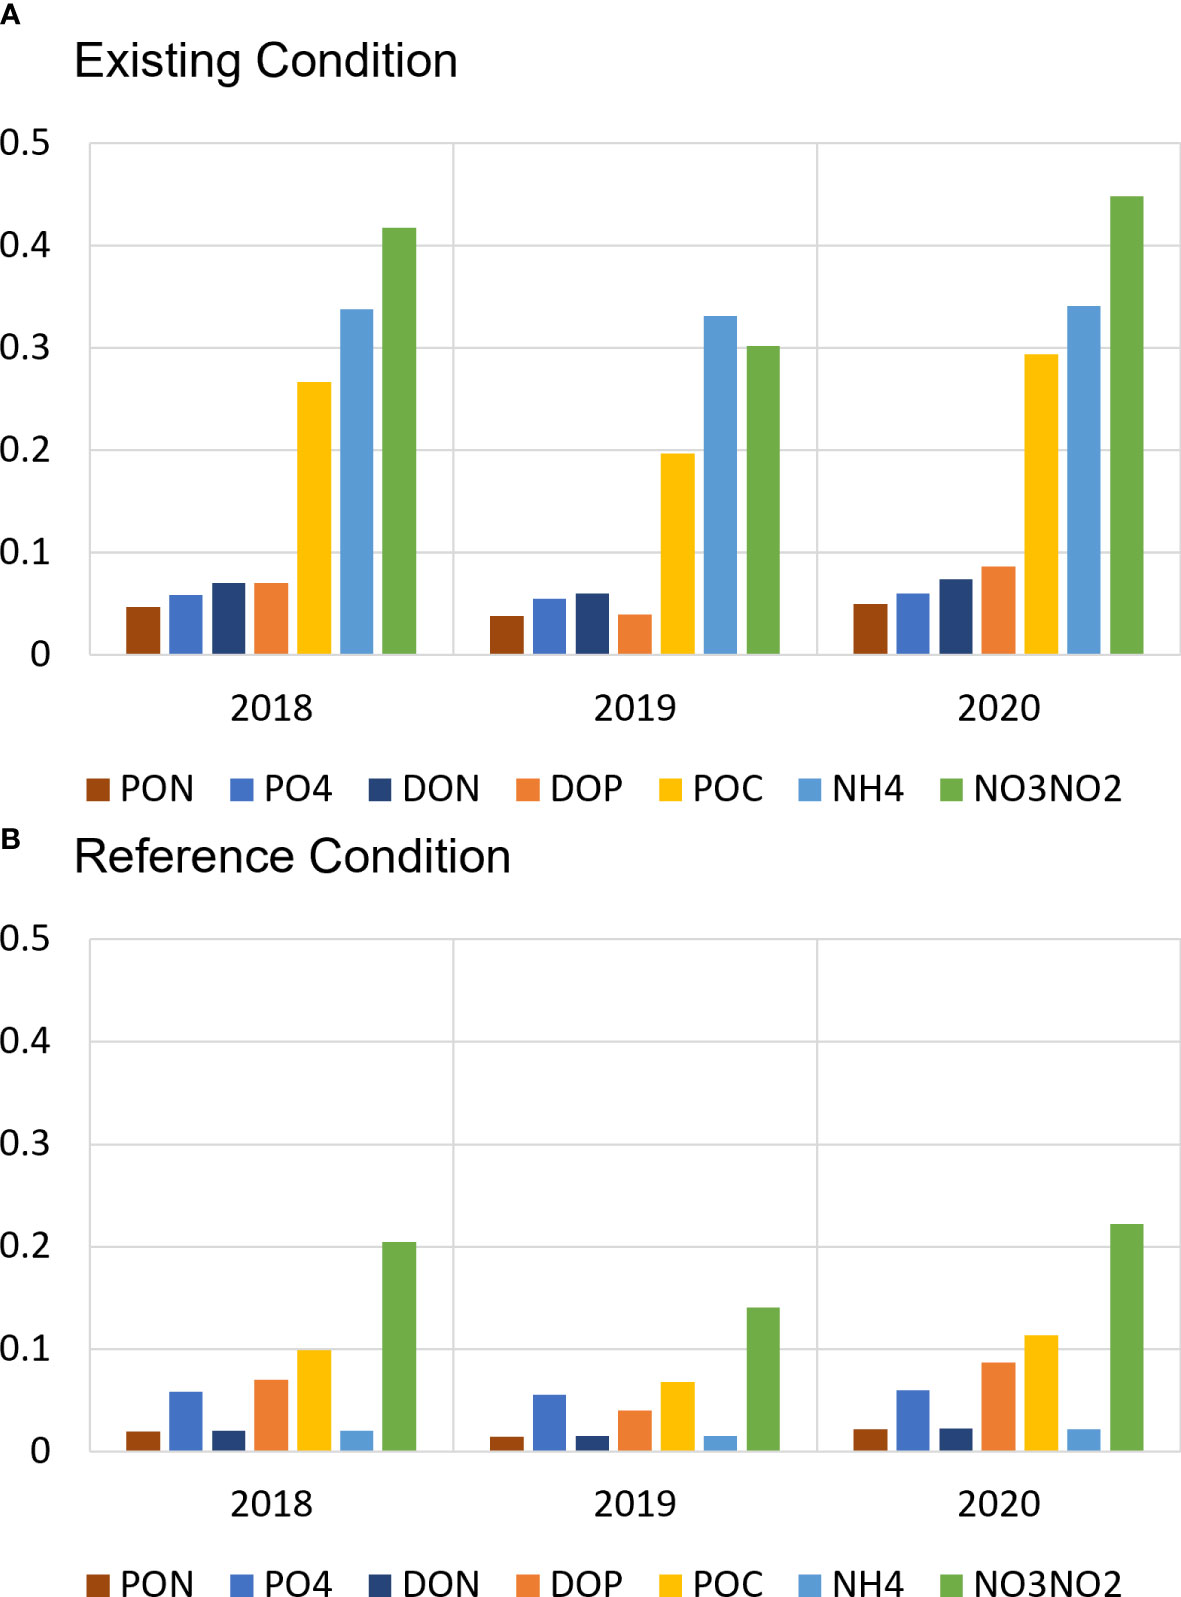
Figure 5 (A) Estimate of Existing condition nutrient mass loading rate in kg/s of particulate and dissolved organic and inorganic constituents entering the Salish Sea from all sources, including rivers and wastewater point sources, based on 2018, 2019, and 2020 data; (B) corresponding estimate of Reference condition nutrient mass loading rate with the anthropogenic constituent removed.
2.4 Governing circulation and transport features in Puget Sound region of Salish Sea
Import of oceanic nutrients, their mixing with loads from anthropogenic sources, and eventual flushing and export is governed by estuary specific circulation features and inter-basin exchange pathways. Unlike classic fjords, with a characteristic single sill near the mouth, parts of the Salish Sea including Puget Sound have multiple basins that are embraced by sills. The Main Basin of Puget Sound is embraced by the large, double-peaked Admiralty sill in the north and the Tacoma Narrows sill in the south. The Tacoma Narrows sill separates South Puget Sound from the Puget Sound Main Basin. Similarly, the Hood Canal sill separates the Hood Canal region from Puget Sound. Whidbey Basin and Saratoga Passage are also deep fjord-like basins but do not have a sill. Ebbesmeyer and Barnes (1980) proposed the concept of Circulation in Embracing Sills that controls the mixing and transport characteristics in Puget Sound. Their estimate that nearly 58% of outflow is returned to Puget Sound was confirmed by Khangaonkar et al. (2017) as part of quantifying inter-basin exchange volume fluxes using this Salish Sea Model. Figure 6A provides a schematic description of circulation cells that are present in the system along a transect starting from entrance to the Strait of Juan de Fuca to the entrance to Puget Sound, through and over the Admiralty Inlet and the sill, to the Puget Sound Main Basin and to the South Puget Sound via the Tacoma Narrows. Quantitative estimates of seaward and landward exchange flow estimates based on Year 2014 conditions are also provided. Circulation cells are present at multiple locations as shown in Figure 6A [(1) the Strait of Juan de Fuca cell, (2) cell over the Admiralty sill, and (3) cell embraced between Admiralty and Tacoma Narrows in Puget Sound Main (Central) Basin.
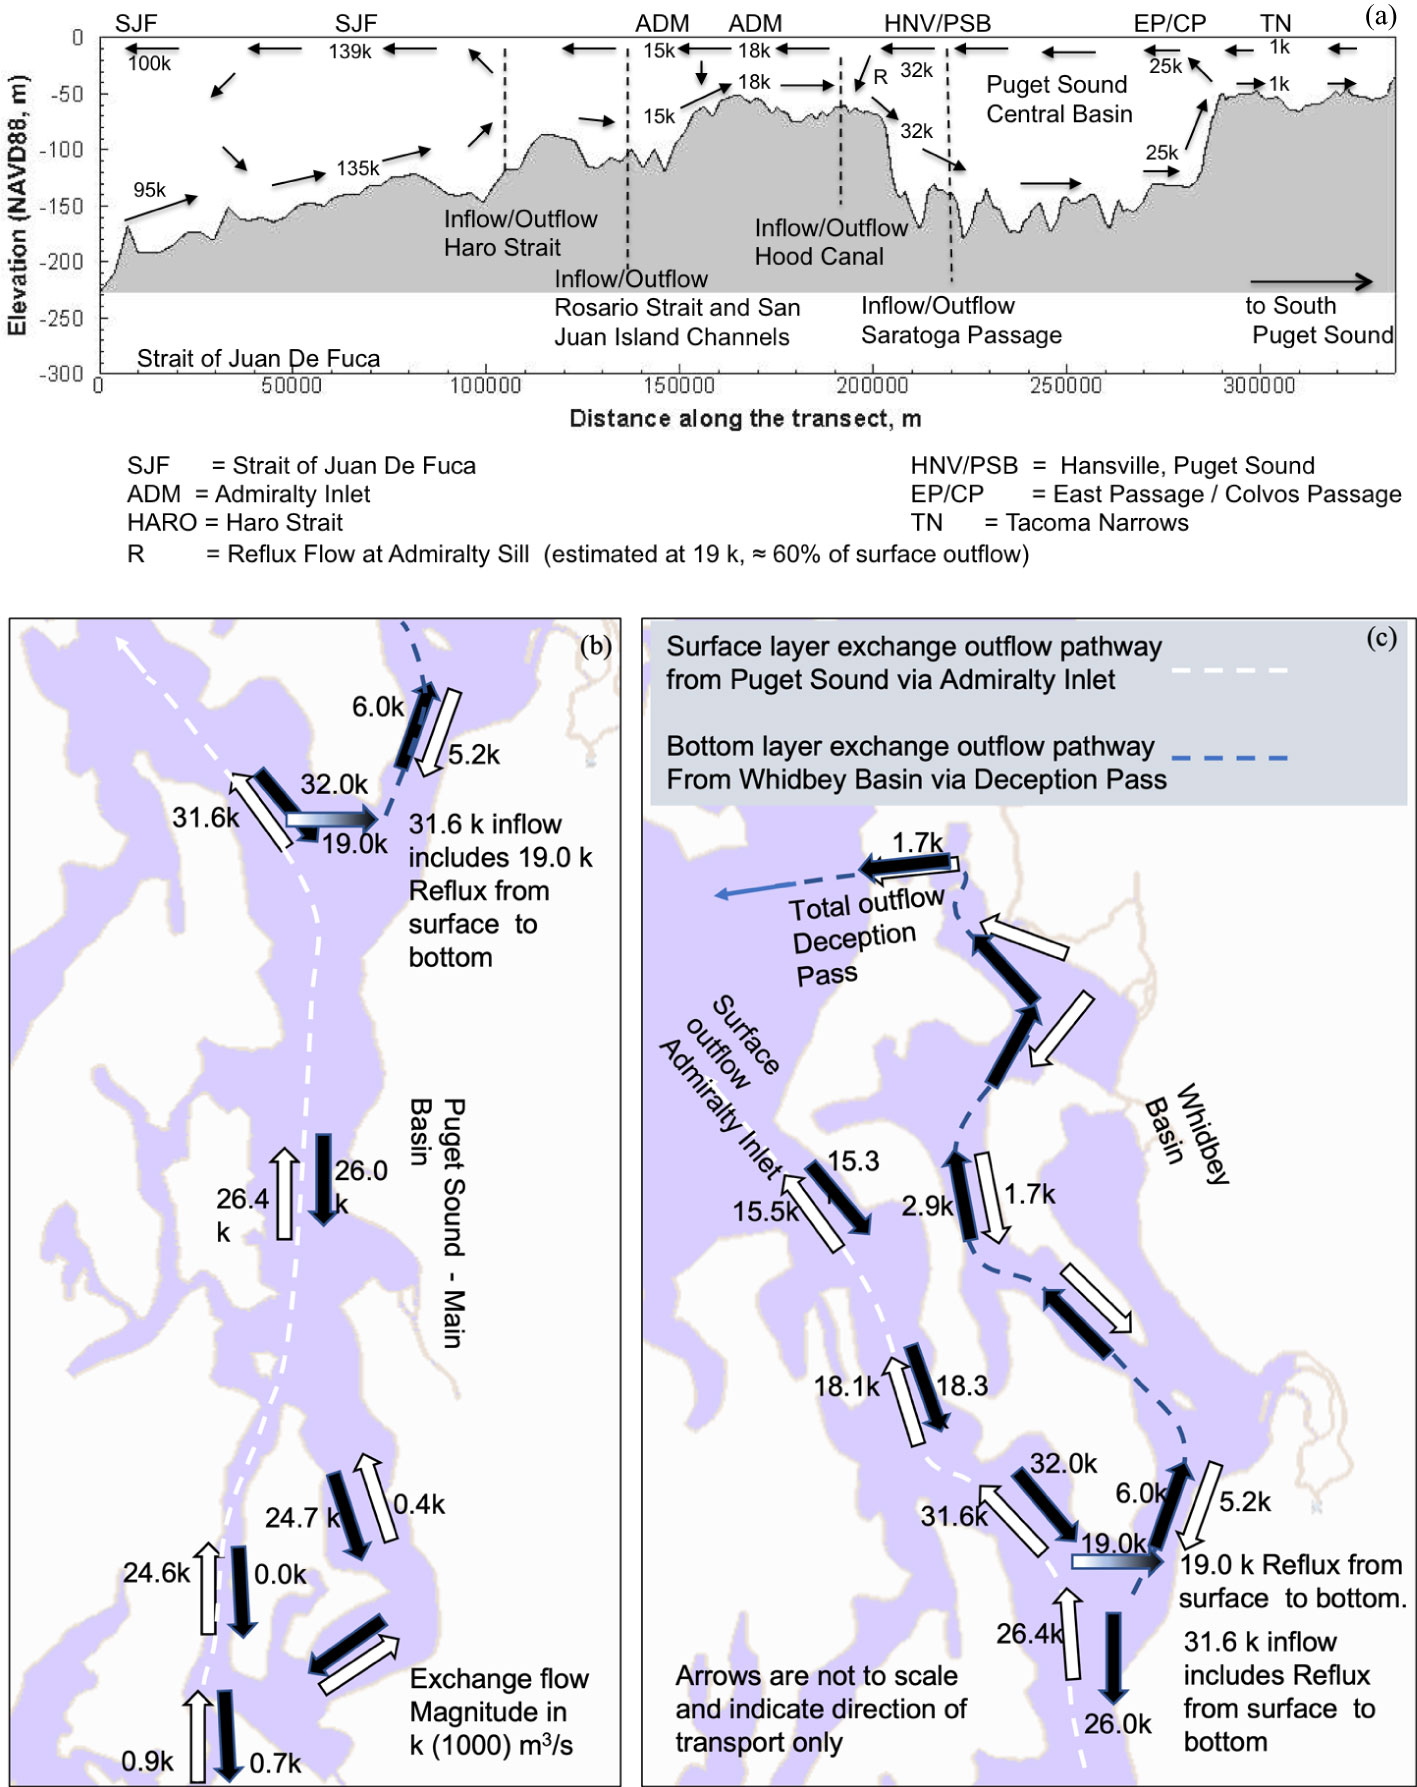
Figure 6 (A) Circulation cells in Puget Sound separated by sills (Khangaonkar et al., 2017. Ocean Modeling), based on Year 2014, (B) Puget Sound Main Basin exchange flow pathways, (C) Whidbey Basin exchange flow pathways. Export out from Puget Sound Main Basin via Admiralty Inlet is through the surface layer (white dashed line). Export out from the Whidbey Basin is via the bottom layer through Deception Pass (blue dashed line).
Figure 6B schematically shows the circulation pathways in the Puget Sound Main Basin in plan-view. The landward exchange flow (32k m3/s) enters Puget Sound along the bottom and splits with 18% (6 k m3/s) turning north towards Whidbey Basin and 82% (26 k m3/s) traveling landward towards inner Puget Sound. Pollutants released to the bottom layers in the Puget Sound Main Basin are therefore carried landward (south), and effluxed to the upper layers at the Tacoma Narrows sill near the entrance to South Puget Sound. A small portion of the effluxed flow enters South Puget Sound and the rest enters the surface outflow stream and begins its seaward journey through the surface layer, only to encounter the reflux flow at the Admiralty Inlet sill and recirculate back.
Whidbey Basin hydrodynamic features have been studied and characterized previously (Cannon, 1983; Sutherland et al., 2011; Khangaonkar et al., 2017). Nearly 70% of Puget Sound freshwater is discharged to the Whidbey Basin, which generates a strong salinity gradient-induced inter basin exchange with the Puget Sound Main Basin. Figure 6C schematically shows the transport pathways in Whidbey Basin in plan-view. As shown, the direction of landward estuarine inflow into the Whidbey Basin is due north through Possession Sound. This inflow passes unimpeded past the Snohomish River Estuary, past Stillaguamish Estuary and Port Susan, and then enters Saratoga Passage. Approximately one-third of the bottom inflow continues north into Skagit Basin and out of Puget Sound through the outlet at Deception Pass.
2.5 Nutrient pollution sensitivity tests and outfall relocation scenarios
Two sets of simulations were conducted and are listed in Table 2. Scenarios 1 to 4 correspond to anthropogenic nutrient pollution impact quantification tests, and scenarios 5 to 7 are outfall relocation impact sensitivity tests. Scenario 1 is the Existing condition, which is also the baseline validation case. Scenario 2 corresponds to removing all anthropogenic inputs, leaving only the estimated natural reference level. This also corresponds to the maximum feasible nutrient pollution reduction benefit. Scenarios 3 and 4 are designed to quantify the respective influence of anthropogenic nutrient loads from rivers, and wastewater point sources that discharge effluent through outfalls. Scenarios 5 and 6 examine whether it is more beneficial to release nutrients through outfalls near the surface in the euphotic zone or through submerged outfalls at the bottom. Direct discharge to the surface layer and the euphotic zone is not preferred, both from an aesthetic point of view and from the perspective of directly feeding algal growth. However, the possibility of more efficiently exporting the nutrients out through the surface exchange outflow relative to bottom discharge cannot be discounted without explicit tests. Scenario 7 examines the effect of relocating the outfalls from their shoreline locations to nearby arbitrarily/strategically selected locations below the euphotic zone, but with the expectation of entrainment into outflow due to buoyancy effects, providing a better opportunity of being entrained and diluted into the major tidal flows in Puget Sound. This scenario tests the possibility that in deep waterbodies such as Puget Sound Main Basin or Whidbey Basin there is potential for some of the released nutrients to be exported out below the euphotic zone, bypassing the uptake and primary production.
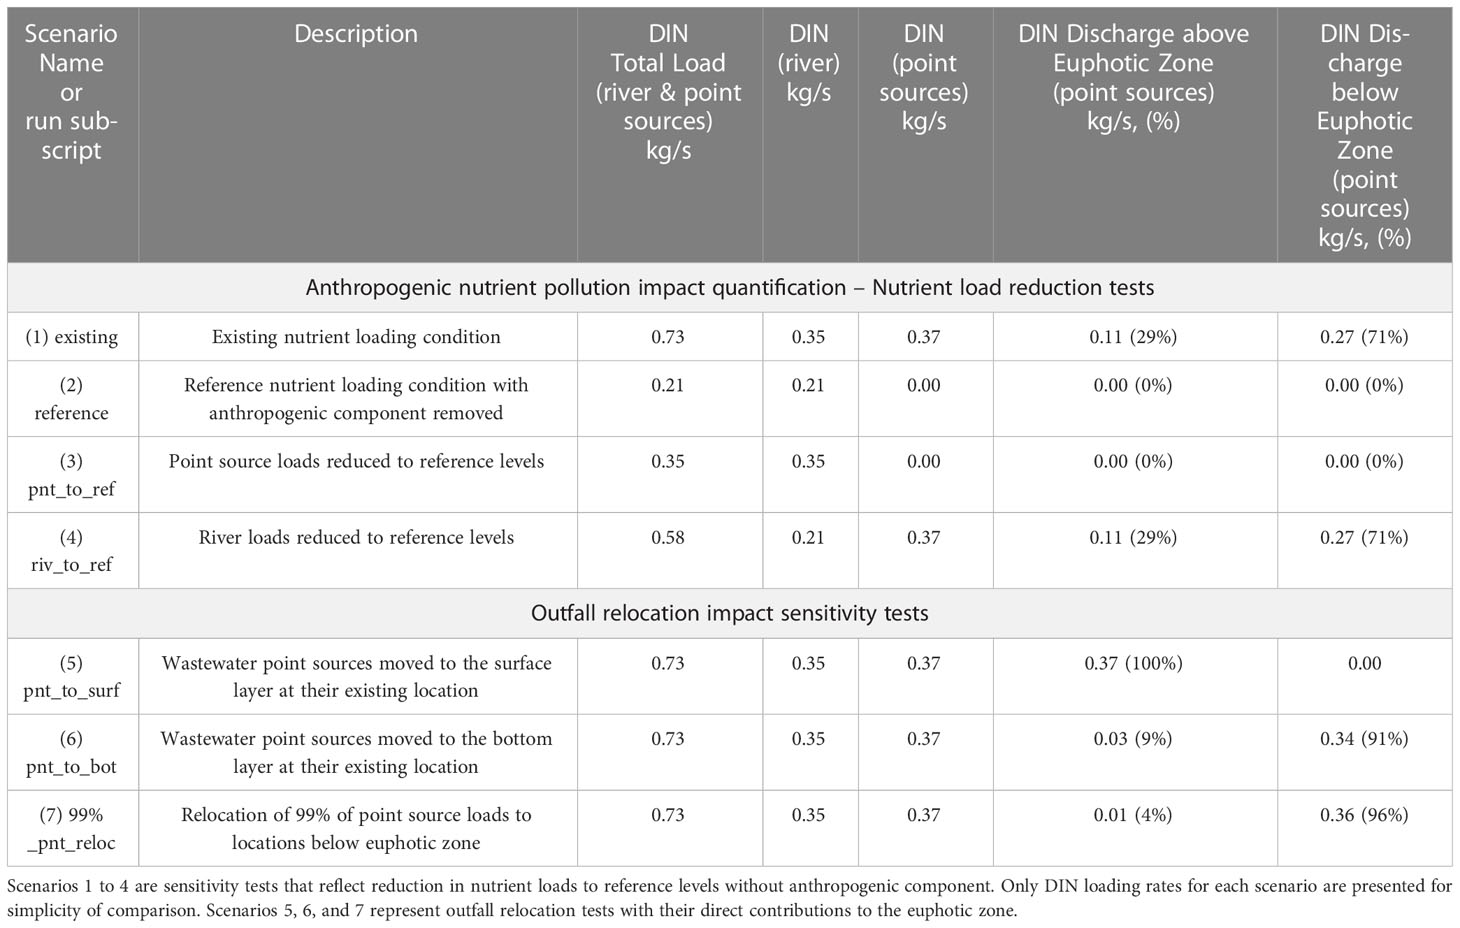
Table 2 Nutrient pollution sensitivity and outfall relocation scenario definitions.
Salish Sea monitoring data over the years 2013 to 2020 shows that the dominant nutrient component is DIN. Maximum consumption of nutrients through algal growth is in the form of the nitrate (NO3 + NO2) component of DIN with concentrations decreasing from high values of ≈ 30 μ mol/L to near zero levels at the surface in Puget Sound. The contribution of nutrients in the form of DOP or direct consumption of ammonium (NH4) from the euphotic zone is relatively small, typically with< 5 μ mol/L of NH4-N or PO4-P variation observed in the ambient surface waters of Salish Sea. DIN is therefore used as the representative nutrient component for the results and discussion to follow. DIN loading rates corresponding to each scenario are shown in Table 2.
All scenarios were initiated in 2018, which is also treated as the warm-up year for model scenarios and is the first year following the recovery from propagation of the 2014-2016 Northeast Pacific marine heatwave through the Salish Sea. Salish Sea temperatures returned to normal levels in 2017. The results were examined and processed for relative comparisons for the years 2019 and 2020.
3 Results
Nutrient pollution impacts for the respective scenarios were quantified using duration of exposure to low DO environment as the metric for comparison. Exposure to hypoxia (DO< 2 mg/L) results in mortality, and the extent of the damage as evidenced by fish kill events is dependent on the spatial extent and exposure duration. However, even at higher DO levels, in the range of 2-4 mg/L, most species of fish are distressed, and a concentration > 5 mg/L is recommended for optimum fish health (Floyd, 2011). Aquatic life DO criteria in marine waters of the U.S. in the Salish Sea, including the Strait of Juan de Fuca and Puget Sound, vary from 4-7 mg/L. For this assessment, we define impairment as DO< 5 mg/L. Impact is quantified based on exposure to hypoxia or impairment DO levels in the units of hypoxia-volume-days or impairment-volume-days.
3.1 Existing or Baseline condition – Scenario 1
Scenario 1 represents the Existing condition. Figure 7A shows cumulative annual exposure to hypoxia plotted for years 2019 and 2020 in the Puget Sound region of the Salish Sea in volume-days. Cumulative DO impairment is shown in Figure 7B. In addition to Hood Canal, regions of the Puget Sound Main Basin and Whidbey Basin also show impairment. Large regions of the Strait of Juan de Fuca carry upwelled low DO water from the continental shelf and are naturally in the range of 4-5 mg/L as shown prominently in the figure. Regions shown in grey are masked areas that lie beyond the U.S geographic border or in intertidal zones with wetting and drying beyond the scope of the model and were excluded from exposure assessment for consistency with Ecology assessment procedures (Ahmed et al., 2021). Not visible at this scale, however, are regions of Penn Cove in the Whidbey Basin and South Puget Sound locations where hypoxia does occur regularly, but over a smaller volume and duration. The model successfully reproduces hypoxia in these locations as shown in a snapshot of DO concentrations in the fall highlighting the regions with hypoxic and impaired waters respectively for September 8, 2020 as shown in Figure 7C. This Existing condition scenario is used as the baseline and all scenarios (2 to 7) are presented as difference relative to the Existing condition.
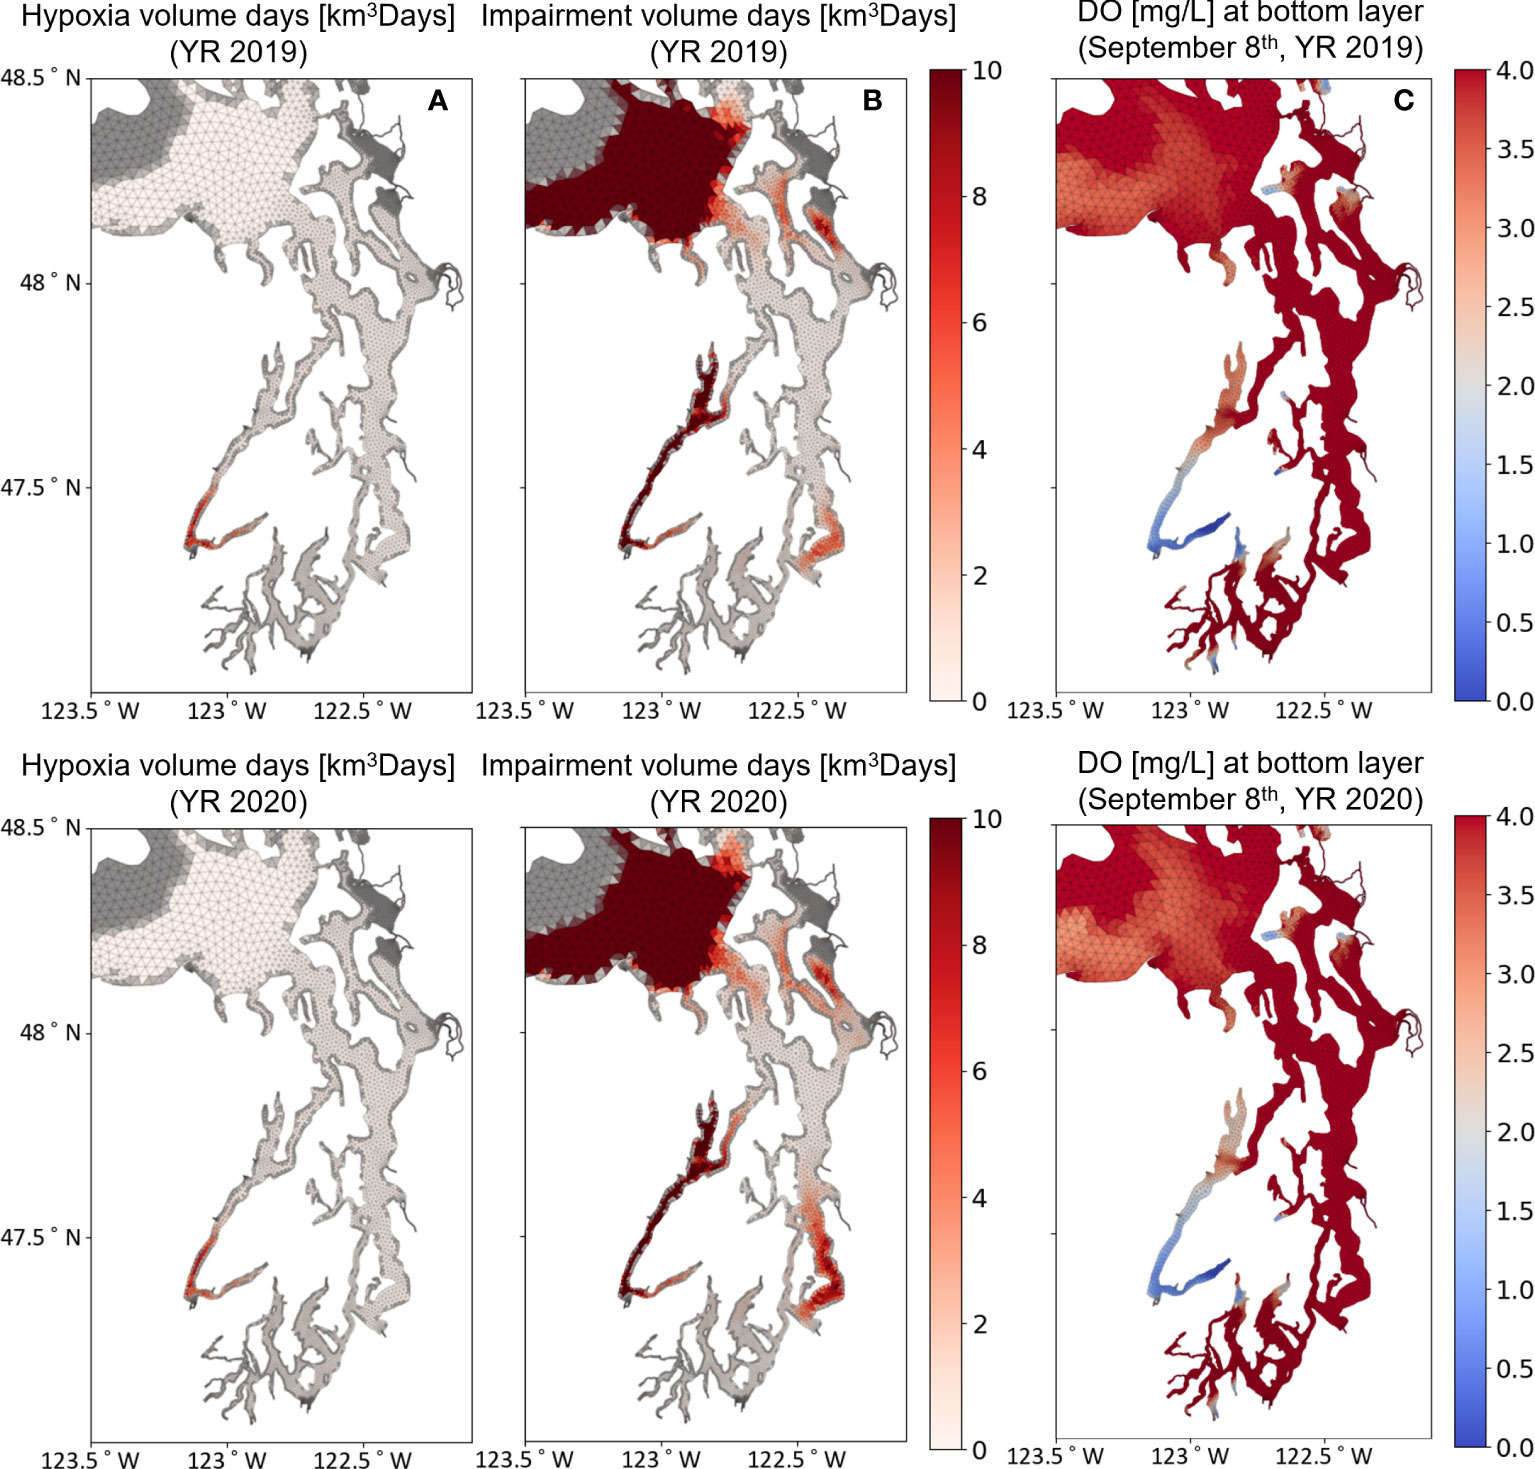
Figure 7 Spatial distribution of exposure to low DO levels in Puget Sound for Years 2019 and 2020 for the Existing condition scenario presented as (A) hypoxia (DO< 2 mg/L) volume days and (B) impairment (DO< 5 mg/L) volume days. The grey area indicates intertidal and shallow subtidal areas or regions beyond U.S borders and were masked consistent with Ecology assessment procedures (Ahmed et al., 2021) (C) Example bottom layer DO concentration snapshot corresponding to September 8th, 2020.
3.2 Nutrient reduction scenarios
For the purpose of this study, nutrient reduction refers only to reduction of DIN.
3.2.1 Reference condition – Scenario 2
Scenario 2 is the Reference condition with the anthropogenic component of the nutrient load removed from the river and the wastewater point sources. The Reference condition with nearly 72% reduction in total DIN load averaged over the simulation years 2018, 2019, and 2020 represents the maximum potential recovery benefit to the ecosystem. Relative to the Existing condition, Scenario 2 had the largest effect on DO level improvement, quantified as 15% and 21% reduction in exposure to hypoxia for years 2019 and 2020, respectively. Similarly, exposure to impaired DO waters decreased by 11% and 15% in the respective years.
3.2.2 River and wastewater load reduction Scenarios 3 and 4
Scenarios 3 and 4 were conducted to provide an understanding of the relative influence of (i) river-based nutrient loads through the river plumes and (ii) the wastewater loads that enter the system at various depths through outfalls. As shown previously in Figure 4A, the total DIN load to the Salish Sea or the U.S. waters is split nearly evenly between the river sources and the wastewater point sources. The anthropogenic component of DIN load to U.S. waters, which accounts for ≈ 72% of the total load to U.S. waters, is attributed 20% to river load and 52% to wastewater point source loads. While 100% of the anthropogenic nutrient load from the rivers enters the euphotic zone through the surface-oriented freshwater river plumes, based on existing outfall configuration, only 28% of DIN from wastewater outfalls enters the euphotic zone and 72% of the DIN load occurs through deeper submerged outfalls below the euphotic zone. Scenario 3, where wastewater point source loads are reduced to reference levels (pnt_to_ref), provides the anthropogenic nutrient impact contribution of point source loads. In this scenario, an average (2019-2020) reduction in hypoxia of 11.2% (9.8% and 12.6%) and reduction in impairment of 9.0 (8.2% to 9.8%) is predicted. Scenario 4, where river loads are reduced to reference levels (riv_to_ref), provides the contribution of river discharges to anthropogenic nutrient impact. In this scenario, an average reduction in hypoxia of 8.1% (6.9% and 9.2%) and reduction in impairment of 4.6% (3.8% to 5.5%) is predicted. Although total anthropogenic nutrient load from the wastewater point sources is nearly 2-3 times the nutrient loads from rivers, the impact to the ecosystem is comparable to river load impacts. This is likely because a majority of the wastewater point source load enters below the euphotic zone while nutrient loads from the river plumes enter directly into the euphotic zone. Results of nutrient pollution impact quantification (or simply nutrient reduction) for scenarios 2, 3, and 4 are plotted in Figures 8A, B, providing a comparison of the predicted exposure to hypoxia and impairment DO levels relative to existing conditions.
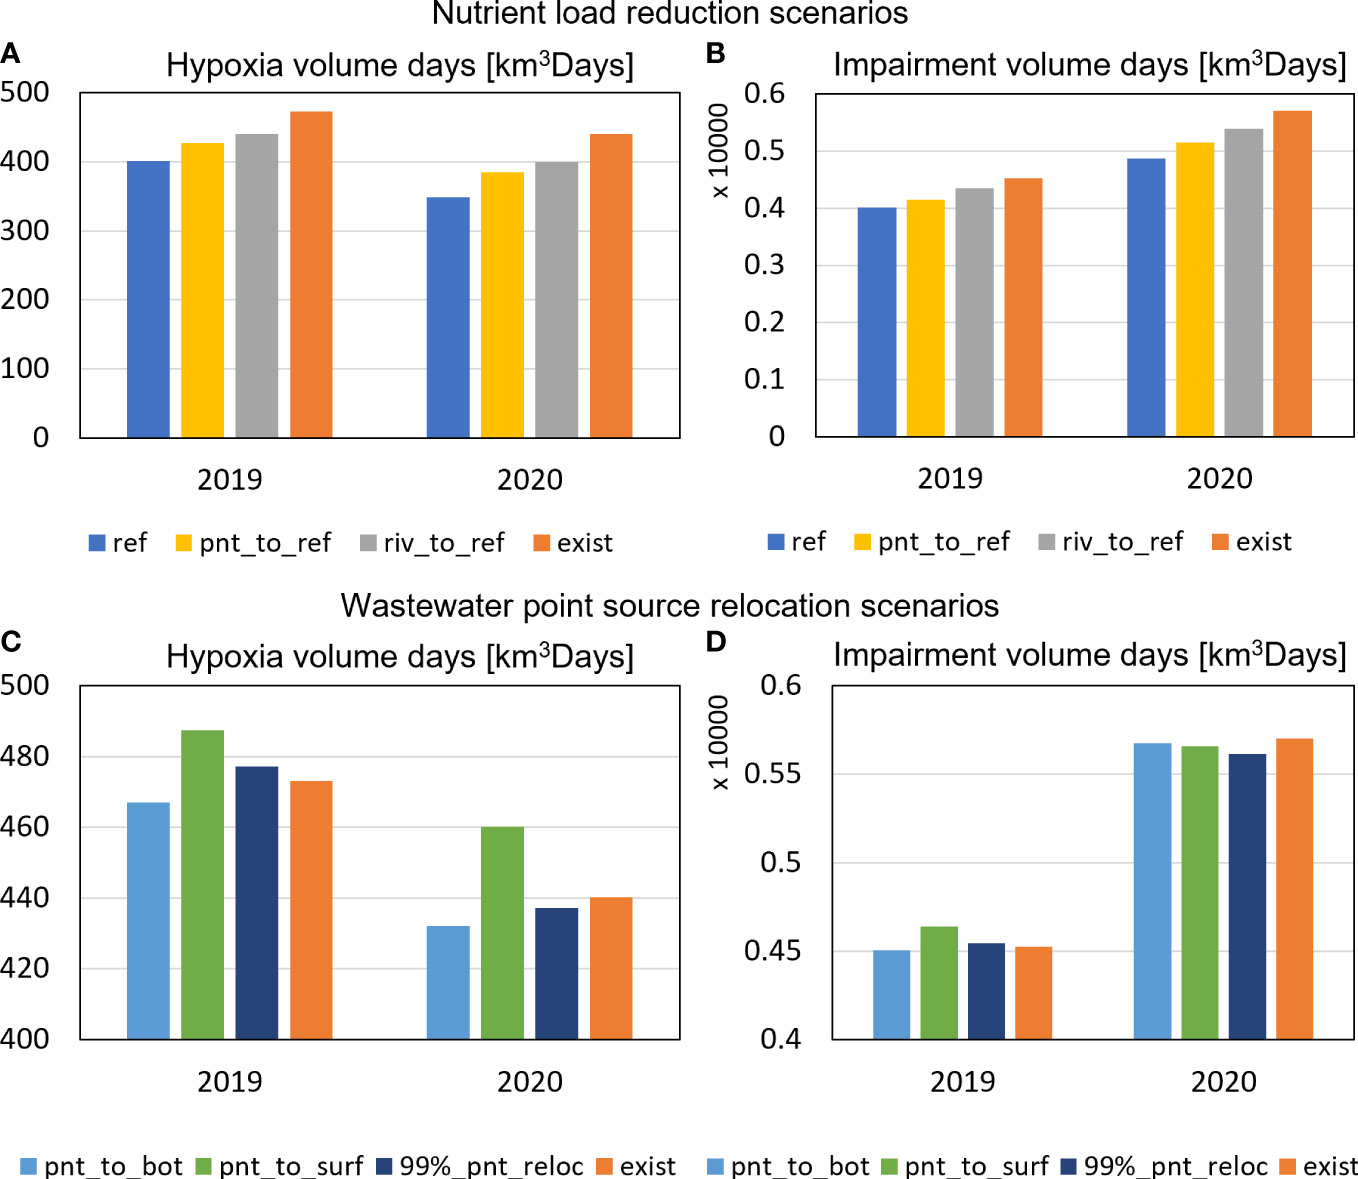
Figure 8 Change in annual exposure to hypoxia (DO< 2 mg/L) and impairment (DO< 5 mg/l) in volume days. (A, B) Nutrient load reduction scenarios (Scenario 1= exist, Scenario 2 = ref, Scenario 3 = pnt_to_ref, Scenario 4 = riv_to_ref), and (C, D) wastewater point source relocation scenarios (Scenario 5 = pnt_to_surf, Scenario 6 = pnt_to_bot, Scenario 7 = 99%_pnt_reloc).
3.3 Outfall relocation scenarios
3.3.1 Surface or submerged outfalls - Scenarios 5 and 6
Scenarios 5 and 6 address the classic debate of whether it is preferable to release wastewater effluent directly to surface waters through outfalls along the shoreline or is it more beneficial to release the effluent through submerged outfalls into deeper waters of Puget Sound. Even in the most simplistic representation of an estuary as a tidal river, the answer is not straightforward and is dependent on site-specific circulation and transport characteristics. In classic tidal river estuaries, the outflow occurs through the surface and the inflow occurs through the bottom layers. In this setting, particularly during the winter high flow condition, nutrient discharge to the surface offers the quickest export out of the system, assuming the surface layer is efficiently removed through a combination of advection and tidal exchange. However, during the summer low river flow months, if the estuary is nutrient-limited, the surface discharge of nutrients could feed and fuel algal growth directly, and nutrients may be consumed more rapidly, leading to increased impairment. Scenario 5 (pnt_to_surf) represents the hypothetical condition where all wastewater point sources in the Puget Sound region and U.S. waters of the Salish Sea are moved to the surface at their existing location, and Scenario 6 (pnt_to_bot) represents the condition where all wastewater point sources are moved from their surface discharge configuration to the bottom layer of the model. While 100% of the discharge from the wastewater outfalls could be moved to the surface and the euphotic zone in Scenario 5, the converse was not feasible in Scenario 6 due to inherent depth limitations at many locations. In the Existing condition, 72% of the nutrients already discharge below the euphotic zone through deep outfalls. In Scenario 6, the percentage of effluent below the euphotic zone increased to 91%. Results plotted in Figures 8C, D show that in Scenario 5, with all nutrients being discharged to the surface, the average hypoxia impact over the periods 2019 and 2020 would increase by 3.8% (3.0% and 4.6%) and impairment impact would increase by 0.9% (2.5% and -0.8%). Conversely, in Scenario 6, when available surface discharges were moved in place to deeper levels, the average hypoxia impairment impact over 2019 and 2020 decreased by 1.5% (1.2% to 1.8%), and impairment decreased by 0.5% (-0.4% and -0.5%) relative to the Existing condition. Moving an additional 28% of nutrient load from shoreline-based outfalls to depths below the euphotic zone in Scenario 6 provided minimal improvement in impairment volume days.
3.3.2 Relocation of major outfalls (99% of total nutrient loads) – Scenario 7
A new scenario (Scenario 7) was designed to improve this lower-than-expected response to Scenario 6. In Scenario 7 (99%_pnt_reloc), 99% of the total nutrient load to Puget Sound carried by 34 outfalls was considered for relocation. The shallow nearshore discharges were moved away from the shoreline to nearby deeper locations and, where possible, well below the euphotic zone, where they had a better chance of being entrained and transported with tidal currents. The results in this scenario were complex, showing an initial increase in impairment in Year 2019 but eventually improving to 0.7% reduction in hypoxia and 1.5% reduction in impairment in Year 2020. However, results quantified in the form of total exposure through summation of all regions of Puget Sound were very similar to the results of Scenario 6 and offered only limited net improvement regionwide.
Given these results, which appear to be contrary to the proposed hypothesis, further fine-tuning or optimization of the outfall siting configurations were not attempted. But to verify that observed DO results were consistent with primary production response, we extracted GPP rates for all scenarios. GPP was estimated based on the growth rate of the two groups of phytoplankton simulated in the model and the predicted algal biomass. GPP averaged over the euphotic zone in Puget Sound and U.S. waters for years 2019 and 2020 was estimated at 0.77 g.C/m2/day. Results shown in Figure 9 do validate our premise that reducing or moving nutrient loads away from the euphotic zone would help reduce primary production. Reducing the nutrient loads to reference levels (Scenario 2) has an immediate and noticeable impact on primary production, which decreased by ≈ 9%. Approximately 7% of this reduction in GPP may be attributed to the reduction of the wastewater point source component. DIN from wastewater point sources is considerably higher than DIN from river sources. Although the bulk of it enters Puget Sound below the euphotic zone and is diluted considerably before reaching the euphotic zone, this strong influence of wastewater point sources on GPP is most likely because DIN in wastewater nutrient load is in the form of ammonium-N. GPP depends on growth rate, which is controlled by nutrient limitation for nitrogen and phosphorous. The nitrogen limitation is a function of uptake preference for ammonium over nitrate. Although much lower in concentration relative to nitrate-N in the ambient water, the increased availability of ammonium-N from anthropogenic sources reduces the nitrogen limitation and results in higher GPP.
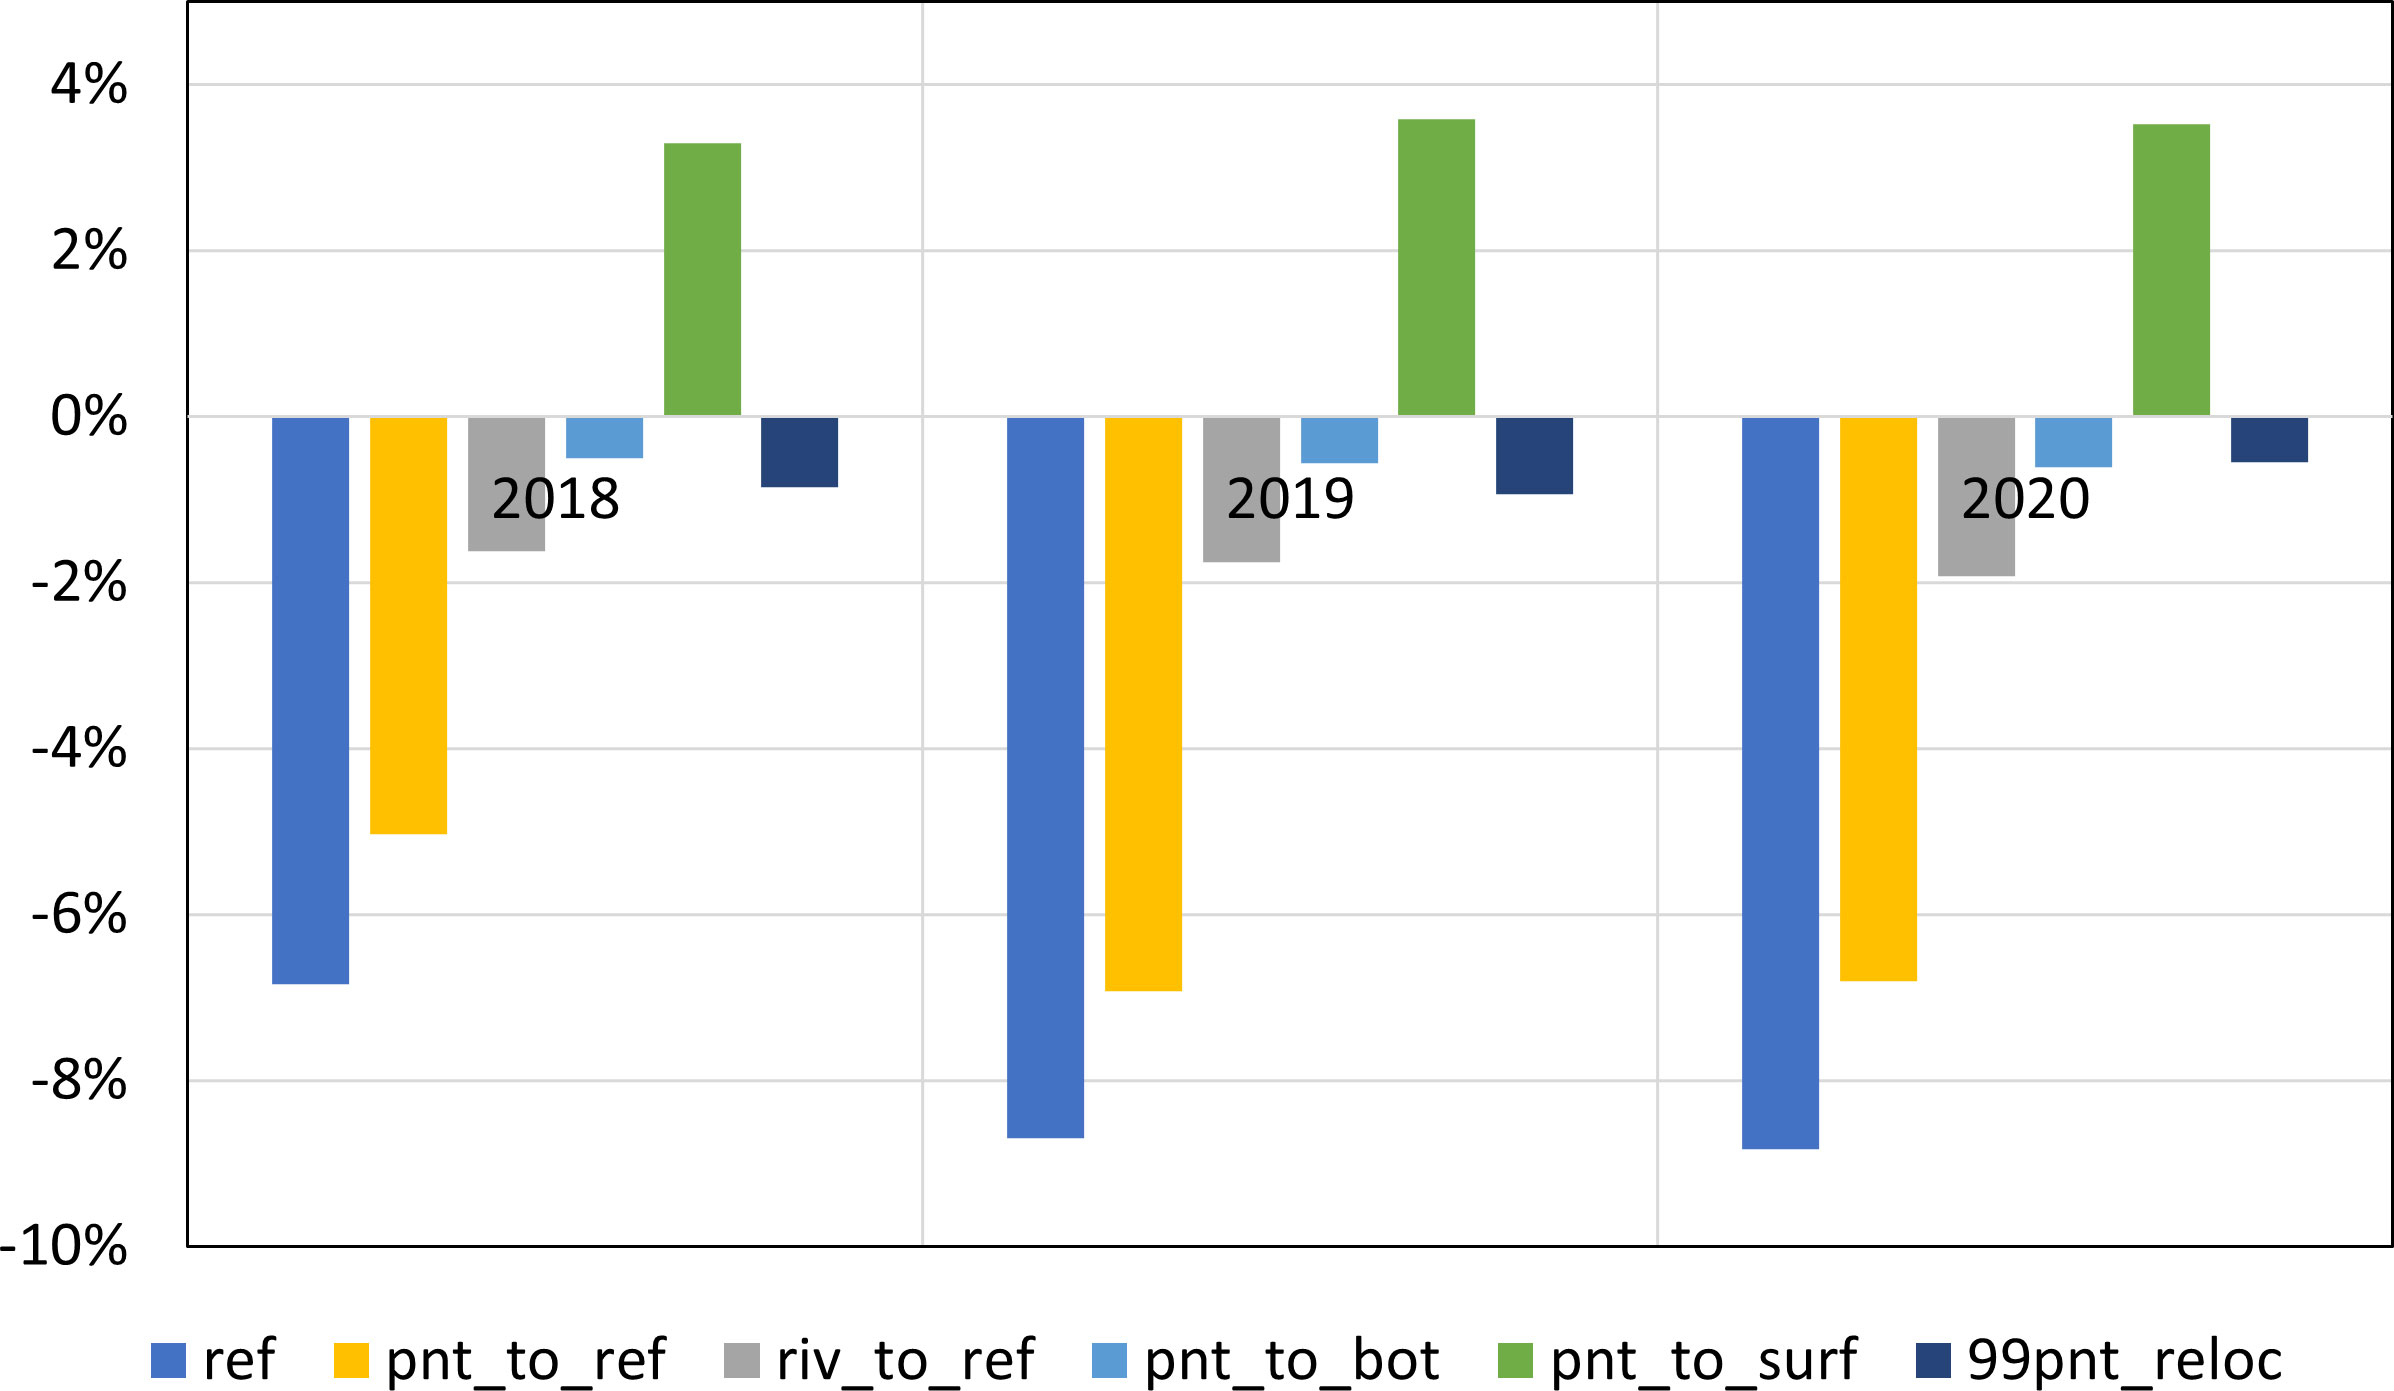
Figure 9 Percent change of GPP at the euphotic zone in Puget Sound compared to Existing condition from 2018 to 2020. Positive indicates increase in GPP at the euphotic zone compared to the Existing condition and negative indicates decrease in GPP for the scenarios.
Relocation of all point sources to the surface in Scenario 5 (pnt_to_surf) increases the GPP by ≈ 4%. But conversely, relocating existing shoreline-based outfalls to deeper depths, in place in Scenario 6 (pnt_to_bot) or nearby locations away from the shore (99%_pnt_reloc) in Scenario 7, provides only a ≈ 1% reduction in primary production. The results are conclusive in that they do confirm the anticipated benefit of relocating the nutrient loads to deeper waters by reducing the primary production. However, the magnitude of change is much smaller relative to the response to nutrient load reduction scenarios.
4 Discussion
The nutrient reduction tests conducted using the updated version of the Salish Sea Model reconfirmed prior results from Khangaonkar et al. (2018) and Ahmed et al. (2019) and showed that reducing nutrient loads (to zero pollution or by ≈ 72% to reference levels) provides significant benefit in terms of reducing GPP and reducing the exposure to low DO levels. Outfall relocation tests were conducted based on the reasoning that large, nutrient-rich oceanic exchange inflow would dilute effluent from submerged outfalls without noticeably changing the nutrient concentrations in the layers below the euphotic zone. The expectation was that outfall relocation tests that affected ≈ 25% of total nutrient loads from the euphotic zone would provide a benefit comparable to nutrient reduction actions. However, the results did not meet expectations, providing only ≈ 1-2% improvement in hypoxia-volume-days and negligible< 1% improvement in impairment-volume-days.
4.1 Effectiveness of Outfall Relocation on Reducing GPP, Hypoxia, and DO Impairment
A more detailed examination of the hypoxia and impairment response was conducted by examining spatial variations of biogeochemical response and the effects on DO level by region and taking circulation and inter-basin transport into consideration. As shown previously in Figure 7, major exposure to hypoxic waters is known to occur in Hood Canal, but selected regions of South Puget Sound and Penn Cove also reach hypoxic conditions in late summer. For the outfall relocation Scenario 7 (99%_pnt_reloc), the hypoxic regions in Penn Cove in the Whidbey Basin showed improvement, but mixed results were obtained for Hood Canal and South Puget Sound, where some regions improved while others showed increase in hypoxic volume days. The response for the DO impairment condition of< 5 mg/L, however, showed clear regional difference. Figures 10A, C show the change in impairment volume days (m3days) as a plan-view plot. The response to outfall relocation change was not spatially uniform. Figure 10 shows that Scenario 7 (99%_pnt_reloc) provides a beneficial response in the Whidbey Basin but increases impairment in the Puget Sound Main Basin and South Puget Sound. Figures 10B, D show a percent change in annual average GPP that is consistent with the predicted DO response. GPP increased in the Main Basin or central regions of Puget Sound and South Puget Sound but decreased in North Puget Sound, including parts of Admiralty Inlet and Whidbey Basin. This explains why the total change in impairment or primary production in response to scenarios 6 and 7, where the outfalls were moved to deeper waters, was less than expected as the improvements in certain regions were compromised by worsening of impairment in other regions.
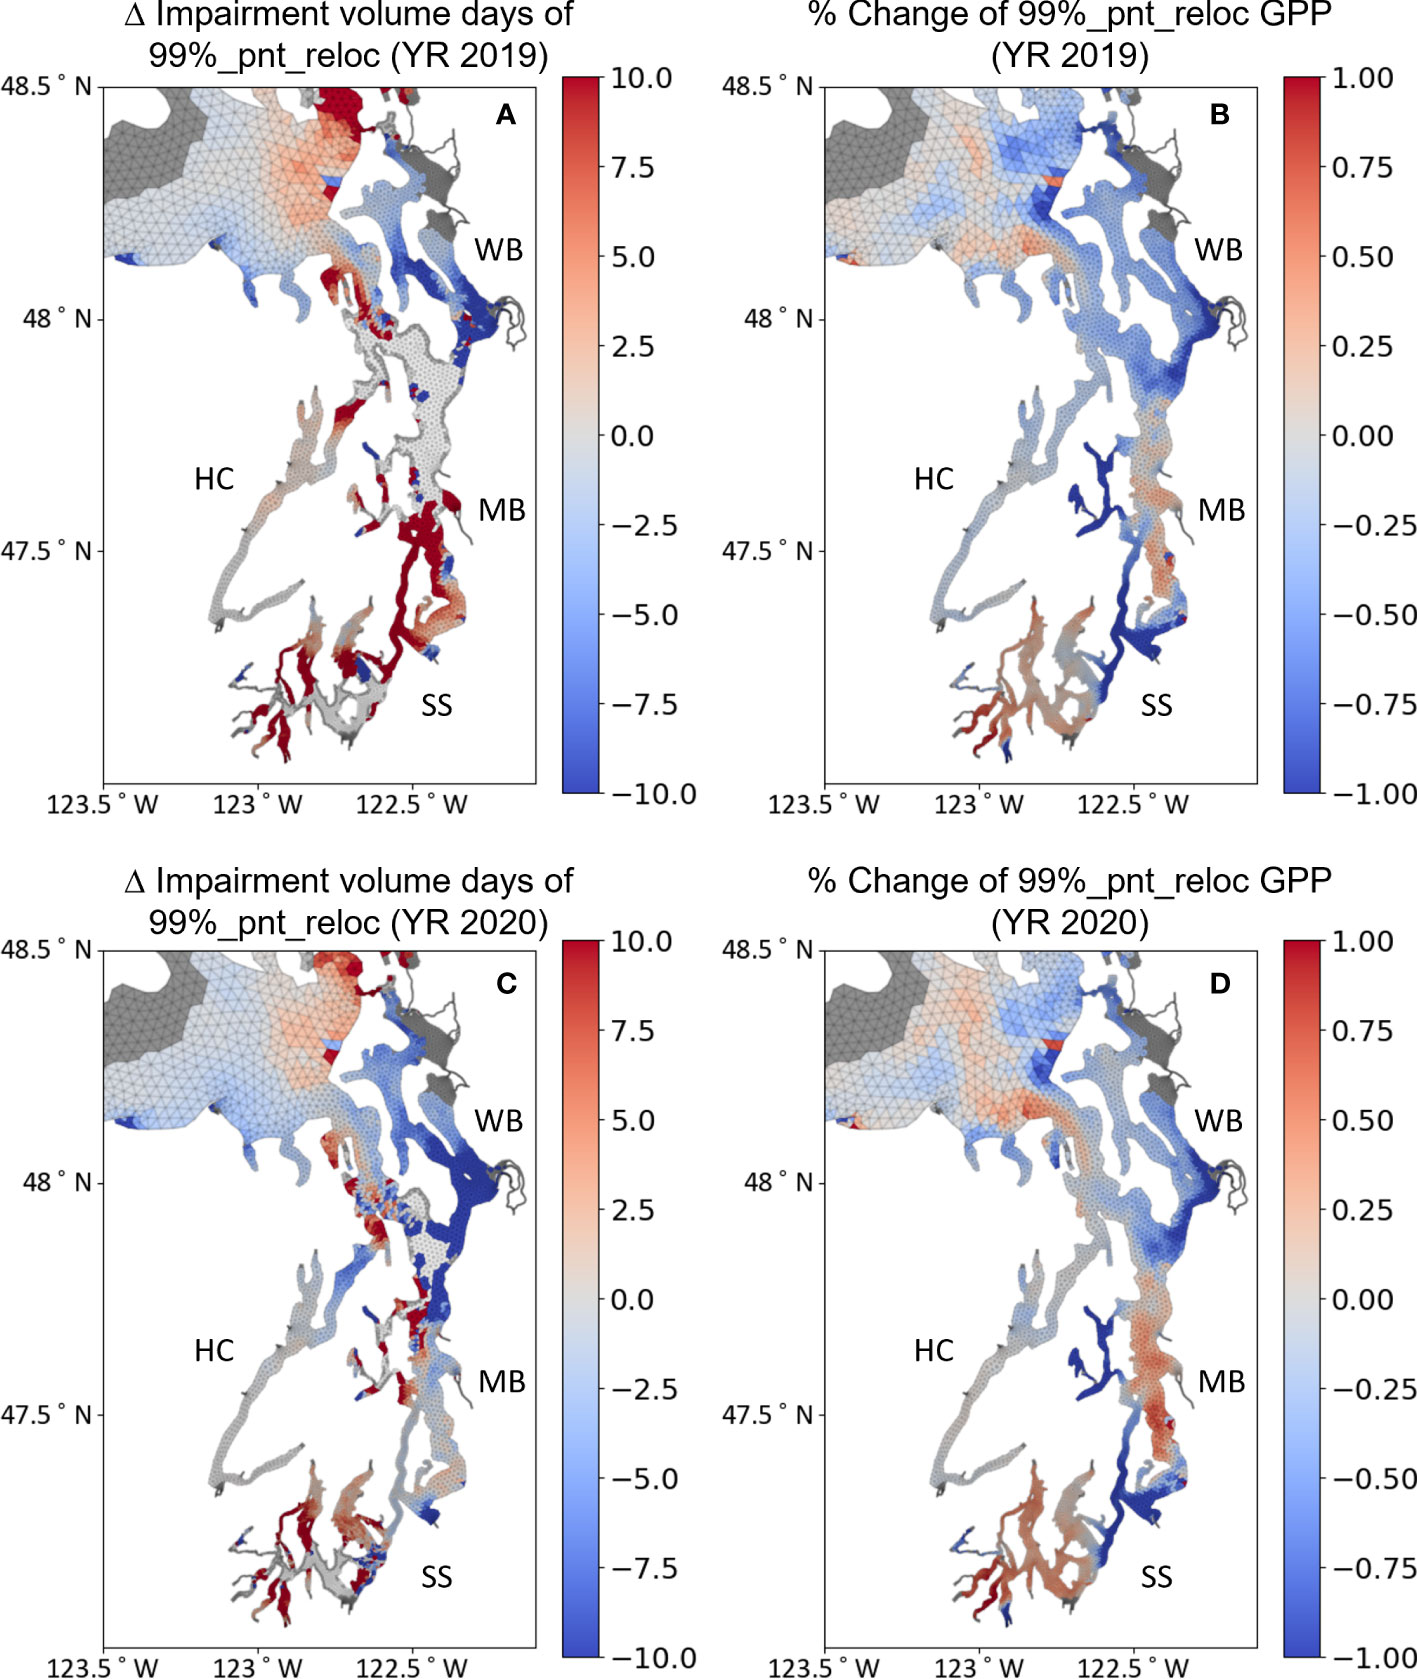
Figure 10 (A, C) Spatial distribution of change in exposure to low DO levels in Puget Sound for Years 2019 and 2020 for Scenario 7 (99%_pnt_reloc) relative to Existing condition scenario presented as impairment (DO< 5 mg/L) volume days. (B, D) Spatial distribution of change in GPP in g.C/m2/day for Scenario 7 (99%_pnt_reloc) relative to Existing condition scenario.
These spatial patterns are recognizable as the effects of circulation in Puget Sound sub-basins separated by sills. The sills generate a strong reflux transport that prevents smooth outflow and export of pollutants out of the system. As shown in Figure 6A even when pollutants are discharged at the surface in central Puget Sound, only approximately 40% would be exported out seaward (north) and the strong reflux circulation would return nearly 60% back to the system. This explains why the goal of reducing GPP by moving the wastewater point sources to the bottom couldn’t be achieved in the Puget Sound Main Basin. Trapped in the circulation cell between the Admiralty sill and Tacoma Narrows sill, moving the nutrient sources to the bottom in the Puget Sound Main Basin appears to increase their residence and availability, resulting in increased GPP. A similar outcome of increased GPP was observed in South Puget Sound, where the outfall relocation Scenario 7 resulted in (a) increased nutrient flux into South Puget Sound from Puget Sound via Tacoma Narrows, and similar (b) trapping of nutrient behind the Tacoma Narrows sill, resulting in increased availability and distribution of nutrients caused more primary production.
In contrast, Whidbey Basin provided a strikingly different response. Unlike South Puget Sound, Hood Canal, or the Puget Sound Main Basin, (i) the Whidbey Basin does not have an entrance sill, and (ii) the Whidbey Basin has an outlet at the upstream end that permits a continuous unidirectional net transport out of Puget Sound into the Strait of Juan de Fuca. Relocating the outfalls to the deeper layers in Whidbey Basin therefore not only achieves the intended purpose of reducing nutrients from the euphotic zone, but also facilitates nutrient export out of Puget Sound. Results show that average GPP in Whidbey Basin is reduced by 1.2% over the years 2019 and 2020 relative to existing conditions for the outfall relocation Scenario 7. Similarly, average hypoxia and DO impairment exposure are shown to decrease by 8.8% and 6.8%, respectively. These results indicate that even small reductions in GPP may result in substantial ecological benefits with respect to exposure to low DO conditions.
4.2 Effectiveness of Outfall Relocation on Improving Nutrient Export from Puget Sound
To further examine if relocating the outfalls below the euphotic zone helped export more nutrients out of the system, we computed net exchange outflow (volume flux) and DIN flux from Puget Sound through the Admiralty Inlet and Deception Pass transects. Figures 11A, B show annual average volume flux and DIN concentration profiles for 2020 as an example. These are the only two significant export pathways that connect Puget Sound to the Strait of Juan de Fuca. The small exchange out through the Swinomish Passage from the Skagit Basin is relatively negligible. The computed fluxes in Table 3 show that relocating an additional 28% of nutrients to below the euphotic zone through Scenario 7 (99%_pnt_reloc) provided results opposite of the intended outcome. Based on regionwide small net reduction in GPP of 0.75% and reduced consumption of nutrients, one would expect that DIN exported out would be higher. But the results show that DIN exported out is reduced by ≈ 4% averaged over the years 2019 and 2020 for Scenario 7. This reduction seems to be more due to the reduction in the strength of exchange flow as opposed to change in DIN concentration. Moving the nutrients from wastewater point sources to below the euphotic zone is accompanied by 22% (4.12 m3/s) freshwater that is now discharged to the bottom layers. Although small relative to total freshwater discharged to Puget Sound, the exchange flow appears to be sensitive to submerged buoyant discharges. The buoyancy and mixing from those newly submerged discharges appear to have affected/reduced the salinity gradients sufficiently to reduce the strength of exchange flow and circulation in Puget Sound. Correspondingly, the strength of reflux at Admiralty Inlet sill also appears to have decreased by ≈ 2.5%.
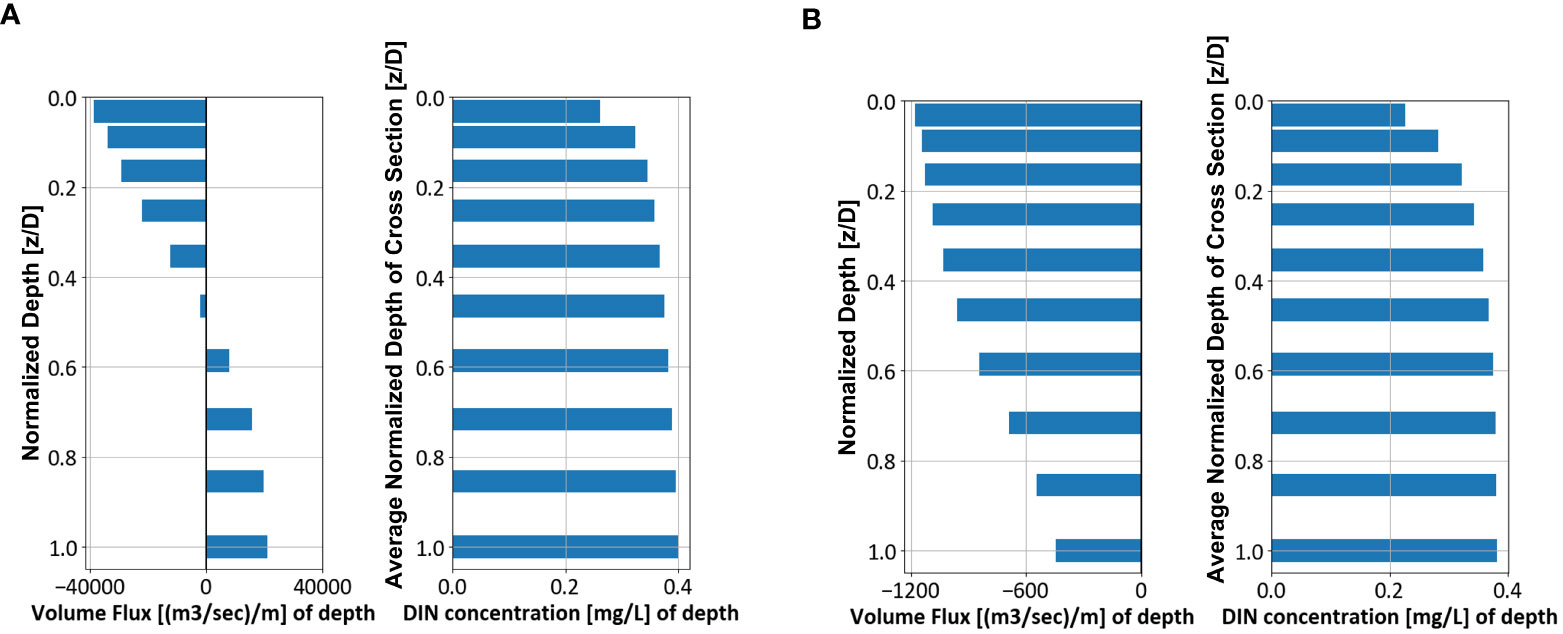
Figure 11 (A) Exchange flow (m3/s) at the entrance to Puget Sound at the Admiralty Inlet north boundary, and DIN concentration (mg/L) profile, and (B) exchange flow (m3/s) at the Deception Pass connection of Puget Sound to the Strait of Juan de Fuca and DIN concentration (mg/L) profile.
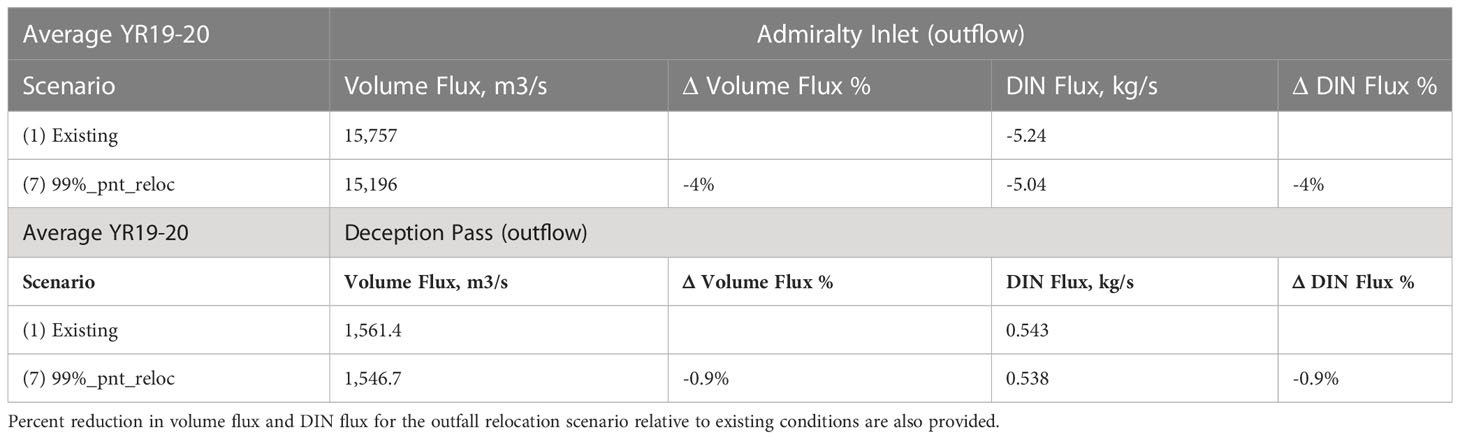
Table 3 Average magnitudes of exchange flow and nutrient flux computed for the existing conditions and the 99 percent nutrients relocated below euphotic zone Scenario 7 (99%_pnt_reloc).
4.3 Limitation of the study
One of the limitations of the Salish Sea Model is its treatment of point source wastewater outfalls. In its present configuration, FVCOM-based Salish Sea Model receives wastewater as a point source discharge released at a specific node into a specific layer. Most of the 99 wastewater sources have been configured as releases from the shorelines through outfall pipes that lay on the seabed. The model does not account for the process of initial dilution and buoyancy-induced plumes, which may sometimes reach the surface in the form of a boil before forming a passive waste field. The error from this limitation is further exacerbated due to the inherent smoothing of the bathymetry required for management of the pressure gradient error (Mellor et al., 1994). This renders the shoreline and the shoreline-based outfalls to enter the domain at depths deeper than their true depths. The results could therefore be improved with the use of a high-resolution version of the Salish Sea Model with more accurate descriptions of the shorelines of an intertidal region (Premathilake and Khangaonkar, 2022) and the implementation of dynamic plume dilution and transport computations using FVCOM-Plume (Premathilake and Khangaonkar, 2019).
5 Conclusion
While overall results were consistent with the expectation that moving the outfalls to deeper waters and away from the euphotic zone would result in reduced primary production, the efforts to relocate outfalls to achieve euphotic zone bypass and improve DO impairment were not as effective as hypothesized. Trapped in the circulation cell between the Admiralty sill and Tacoma Narrows sill, moving the nutrient sources to the bottom of the Puget Sound Main Basin appears to increase their residence and availability, resulting in increased GPP. A similar result was obtained for the South Puget Sound region landward of the Tacoma Narrows sill. Moving all wastewater sources to the surface also results in an increase in primary production and an increase in exposure to hypoxia.
Without an entrance sill, Possession Sound and Saratoga Passage offer a pathway for nutrients in Whidbey Basin to be exported out to the Strait of Juan De Fuca via Deception Pass through bottom layer exchange flow. Relocating the outfalls to depth below the euphotic zone, showed reduction in primary production with 9% reduction in exposure to hypoxia, and 6.8% reduction in exposure to DO impairment in Whidbey Basin. However, we caution that there is likely an upper limit to the capacity of Whidbey Basin to receive additional nutrient loads as northward outflow through the basin does need to upwell in Skagit Basin before exiting through Deception Pass which has not yet been fully examined. The results also re-confirmed that eliminating all anthropogenic nutrient load to Salish Sea would reduce average exposure to hypoxia by ≈ 16% in Puget Sound.
The study showed that releasing additional freshwater (22%, 4.12 m3/s) to the bottom saline waters of Puget Sound likely impacted stratification and salinity gradients that resulted in a loss in the strength of circulation by about 4%. This finding was incidental and deserves further consideration as healthy estuarine circulation and flushing is critical for water quality maintenance in complex settings such as Puget Sound and the Salish Sea. It provides a critical buffer against the effects of climate change and marine heatwaves (Khangaonkar et al., 2019; Khangaonkar et al., 2021). Freshwater withdrawn from rivers for agriculture, human consumption, or industrial use is eventually returned to the marine waters, not to the surface, but as wastewater through submerged outfalls. For most estuaries without complex circulation cells and sills, release of nutrient pollution below the euphotic zone may be the preferred option with respect to impacts to DO and primary production. However, discharge of freshwater at depth has the potential to reduce the strength of natural circulation as shown in this study and could lead to unexpected impacts such as increase in flushing time. This is an anthropogenic stressor that has perhaps gone unnoticed and likely impacts most urbanized estuaries.
Data availability statement
The raw data supporting the conclusions of this article will be made available by the authors, without undue reservation.
Author contributions
TK is the Salish Sea Model Development Program Manager who led the research effort presented in this manuscript. He was responsible for developing the hypothesis for the potential reduction of anthropogenic nutrient pollution impact through the optimization of effluent discharge strategies tested here. He was responsible for the model setup and calibration for the multi-year baseline simulation and the nutrient pollution sensitivity scenarios. SY’s contributions, in addition to writing sections of the manuscript, include processing environmental monitoring data, preparation of model setup files, and helping design and develop alternate discharge strategies. She was responsible for the processing of model results, and graphical presentation plots and tables. She was also responsible for quantitative assessment and interpretation of results including model validation and skill assessment and nutrient pollution impact in the form of hypoxia and impairment exposure. Both authors contributed to the article and approved the submitted version.
Acknowledgments
We would like to express our appreciation for technical input and contributions from our colleagues and collaborators — Ben Cope and Angela Adams of U.S. Environmental Protection Agency who have supported the development of the Salish Sea Model through an Interagency Agreement with Pacific Northwest National Laboratory; Anise Ahmed and Cristiana Figueroa-Kaminsky of the Washington State Department of Ecology, who provided us with land-based inflows and nutrients data; and collaborators from King County and the University of Washington for providing us with monitoring data without which this work would not have been possible. The data used in the model setup and calibration and the data generated through model application and sensitivity tests are available upon request.
Conflict of interest
The authors declare that the research was conducted in the absence of any commercial or financial relationships that could be construed as a potential conflict of interest.
Publisher’s note
All claims expressed in this article are solely those of the authors and do not necessarily represent those of their affiliated organizations, or those of the publisher, the editors and the reviewers. Any product that may be evaluated in this article, or claim that may be made by its manufacturer, is not guaranteed or endorsed by the publisher.
References
Ahmed A., Figueroa-Kaminsky C., Gala J., Mohamedali T., Pelletier G., McCarthy S. (2019). Puget sound nutrient source reduction project volume 1: model updates and bounding scenarios (Olympia, Washington: Washington State Department of Ecology). Available at: https://apps.ecology.wa.gov/publications/documents/1903001.pdf.
Ahmed A., Gala J., Mohamedali T., Figueroa-Kaminsky C., McCarthy S. (2021). “Technical memorandum: puget sound nutrient source reduction project phase –I - optimization scenarios (Year 1),” in Environmental assessment program technical memo activity tracker code: 06-509 (Washington State Department of Ecology). Available at: https://www.ezview.wa.gov/Portals/_1962/Documents/PSNSRP/OptimizationScenarioTechMemo_9_13_2021.pdf.
Ahmed A., Pelletier G., Roberts M. (2017). South puget sound flushing times and residual flows. Estuar. Coast. Shelf. Sci. 187, 9–21. doi: 10.1016/j.ecss.2016.12.027
Albertson S. L., Bos J., Pelletier G., Roberts M. (2007). Estuarine flow into the south basin of puget sound and its effects on near-bottom dissolved oxygen (Olympia, Washington: Washington State Department of Ecology).
Albertson S. L., Erickson K., Newton J. A., Pelletier G., Reynolds R. A., Roberts M. (2002). South puget sound water quality study phase 1 (Olympia, Washington: Washington State Department of Ecology).
Barnes C. A., Collias E. E. (1958). Some considerations of oxygen utilization rates in puget sound. J. Mar. Res. 17 (1), 68–80. Available at: https://elischolar.library.yale.edu/journal_of_marine_research/903.
Bond N. (2021). “The blob: what were its impacts on the salish Sea?,” in The state of the salish Sea. Eds. Sobocinsky K. L., Broadhurst G., Baloy N. J. K. (Salish Sea Institute: Western Washington University). doi: 10.25710/vfhb-3a69
Bond N. A., Cronin M. F., Freeland H., Mantua N. (2015). Causes and impacts of the 2014 warm anomaly in the NE pacific. Geophys. Res. Lett. 42, 3414–3420. doi: 10.1002/2015GL063306
Bricker S. B., Clement C. G., Pirhalla D. E., Orlando S. P., Farrow D. G. G. (1999). “National estuarine eutrophication assessment: effects of nutrient enrichment in the nation’s estuaries,” in Special projects office and the national centers for coastal ocean science (Silver Spring, Maryland: National Ocean Service, National Oceanic and Atmospheric Administration. Silver Spring, MD).
Cannon G. A. (1983). An overview of circulation in the puget sound estuarine system (Pacific Marine Environmental Laboratory, Seattle, Washington: NOAA Technical Memorandum ERL PMEL-48. NOAA).
Cerco C., Cole T. (1994). Three-dimensional eutrophication model of Chesapeake bay (Vicksburg, Mississippi: Technical Report EL-94-4, U.S. Army Corps of Engineers).
Cerco C. F., Cole T. M. (1995). User’s guide to the CE-QUAL-ICM three-dimensional eutrophication model, release version 1.0 (Washington, D.C.: U.S. Army Corps of Engineers), 320.
Chen C., Liu H., Beardsley R. C. (2003). An unstructured, finite-volume, three-dimensional, primitive equation ocean model: application to coastal ocean and estuaries. J. Atmos. Ocean. Technol. 20, 159–186. doi: 10.1175/1520-0426(2003)020<0159:AUGFVT>2.0.CO;2
Davis K. A., Banas N. S., Giddings S. N., Siedlecki S. A., MacCready P., Lessard E. J., et al. (2014). Estuary-enhanced upwelling of marine nutrients fuels coastal productivity in the U.S. pacific Northwest. J. Geophys. Res.: Oceans. 119, 8778–8799. doi: 10.1002/2014JC010248
Ebbesmeyer C. C., Barnes C. A. (1980). Control of a fjord basin’s dynamics by tidal mixing in embracing sill zones. Estuar. Coast. Mar. Sci. 11, 311–330. doi: 10.1016/S0302-3524(80)80086-7
Embrey S. S., Inkpen E. L. (1998). Water-quality assessment of the puget sound basin, Washington, nutrient transport in rivers (Tacoma, Washington: U.S. Geological Survey Water Quality Investigations Report 97–4270), 1980–1993. Available at: http://pubs.er.usgs.gov/publication/wri974270.
Floyd R. S. (2011). This document is FA27, one of a series of the School of Forest Resources and Conservation, Program in Fisheries and Aquatic Sciences, UF/IFAS Extension. Original publication date September 1992. Revised February 2003. Reviewed December 2014 and October 2020. Visit the EDIS website at https://edis.ifas.ufl.edu for the currently supported version of this publication.
Harrison P. J., Mackas D. L., Frost B. W., MacDonald R. W., Crecelius E. A. (1994). “An assessment of nutrients, plankton, and some pollutants in the water column of Juan de fuca strait, strait of Georgia, and puget sound, and their transboundary transport,” in Review of the marine environment and biota of strait of Georgia, puget sound, and Juan de fuca strait. Eds. Wilson R. C. H., Beamish R. J., Airkens F., Bell J. (Vancouver, British Columbia, Canada: proceedings of the BC/Washington symposium on the marine environment).
Khangaonkar T., Long W., Xu W. (2017). Assessment of circulation and inter-basin transport in the salish Sea including Johnstone strait and discovery islands pathways. Ocean. Model. 109, 11–32. doi: 10.1016/j.ocemod.2016.11.004
Khangaonkar T., Nugraha A., Xu W., Balaguru K. (2019). Salish Sea response to global climate change, Sea level rise, and future nutrient loads. J. Geophys. Res.: Oceans. 124 (6), 3876−3904. doi: 10.1029/2018JC014670
Khangaonkar T., Nugraha A., Xu W., Long W., Bianucci L., Ahmed A., et al. (2018). Analysis of hypoxia and sensitivity to nutrient pollution in salish Sea. J. Geophys. Res. Oceans. 123 (7), 4735−4761. doi: 10.1029/2017JC013650
Khangaonkar T. K., Premathilake L., Nugraha A., Keister J., Borde A. (2021). Projections of algae, eelgrass, and zooplankton ecological interactions in the inner salish Sea – for future climate, and altered oceanic states. Ecol. Model. 441 (2021), 109420. doi: 10.1016/j.ecolmodel.2020.109420
Kim T., Khangaonkar T. (2012). An offline unstructured biogeochemical model (UBM) for complex estuarine and coastal environments. Environ. Model. Software. 31, 47–63. doi: 10.1016/j.envsoft.2011.11.010
Krembs C. (2012a). Marine water condition index, publication no. 12-03-013, (Olympia, Washington: Washington State Department of Ecology).
Krembs C. (2012b) Poster: eyes over puget sound: integrating multiple observations to report current conditions of water quality in puget sound and the strait of Juan de fuca. Available at: https://fortress.wa.gov/ecy/publications/summarypages/1203034.html.
Krembs C. (2013). “Eutrophication in puget sound,” in State of physical, biological, and selected fishery resources of pacific Canadian marine ecosystems in 2012. Eds. Irvine J. R., Crawford W. R. (DFO Canadian Science Advisory Secretariat Research Document 2013/032), 106–112. Available at: http://www.dfo-mpo.gc.ca/Csas-sccs/publications/resdocs-docrech/2013/2013_032-eng.pdf.
MacCready P., McCabe R. M., Siedlecki S., Lorenz M., Giddings S. N., Bos J., et al. (2021). Estuarine circulation, mixing, and residence times in the salish Sea. J. Geophys. Res.: Oceans. 126, e2020JC016738. doi: 10.1029/2020JC016738
Mellor G. L., Ezer T., Oey L.-Y. (1994). The pressure gradient conundrum of sigma coordinate ocean models. J. Atmospheric. Oceanic. Technol. 11 (4), 1126–1134. doi: 10.1175/1520-0426(1994)011<1126:TPGCOS>2.0.CO;2
Mohamedali T., Roberts M., Sackmann B. S., Kolosseus A. (2011). Puget sound dissolved oxygen model: nutrient load summary for 1999–2008 (Publication No. 11-03-057. Olympia: Washington State Department of Ecology).
National Research Council (2000). Clean coastal waters: understanding and reducing the effects of nutrient pollution (Washington, DC:National Academies Press). doi: 10.17226/9812
Newton J. A., Thomson A. L., Eisner L. B., Hannach G. A., Albertson S. L. (1995). “Dissolved oxygen concentrations in hood canal: are conditions different than forty years ago?,” in Puget sound resear’h ‘95 proceedings (Olympia, Washington: Puget Sound Water Quality Authority), 1002–1008.
Newton J. A., Van Voorhis K. (2002). Seasonal patterns and controlling factors of primary production in puget sound’s central basin and possession sound (Lacey, Washington: Washington State Department of Ecology).
Paulson A., Konrad C., Frans L., Noble M., Kendall C., Josberger E., et al. (2006). Freshwater and saline loads of inorganic nitrogen to hood canal and lynch cove (Tacoma, Washington: Washington. U.S. Geological Survey in cooperation with Hood Canal Dissolved Oxygen Program), 2006–5106. Available at: www.pubs.usgs.gov/sir/2006/5106.
Premathilake L., Khangaonkar T. (2019). FVCOM-plume – a three-dimensional Lagrangian outfall plume dilution and transport model for dynamic tidal environments: model development. Mar. pollut. Bull. 149, 110554. doi: 10.1016/j.marpolbul.2019.110554
Premathilake L., Khangaonkar T. (2022). Explicit quantification of residence and flushing times in the salish Sea using a sub-basin scale shoreline resolving model, estuarine. Coast. Shelf. Sci. 276, 108022. doi: 10.1016/j.ecss.2022.108022
PSAT (2007). 2007 puget sound update: ninth report of the puget sound assessment and monitoring program (Olympia, Washington: Puget Sound Action Team).
Santana E. I., Shull D. H. (2023). Sedimentary biogeochemistry of the salish Sea: springtime fluxes of dissolved oxygen, nutrients, inorganic carbon, and alkalinity. Estuaries. Coasts 46, 1208–1222. doi: 10.1007/s12237-023-01197-8
Stockner J. G., Cliff D. D., Shortreed K. R. S. (1979). Phytoplankton ecology of British Columbia. J. Fisheries. Res. Board. Canada. 36 (6), 657–666. doi: 10.1139/f79-095
Sutherland D. A., MacCready P., Banas N. S., Smedstad L. F. (2011). A model study of the salish Sea estuarine circulation. J. Phys. Oceanogr. 41 (6), 1125–1143. doi: 10.1175/2011JPO4540.1
Keywords: estuarine nutrient pollution, hypoxia impacts, gross primary production change, euphotic zone avoidance, outfall relocation, circulation modification, exchange flow alteration
Citation: Khangaonkar T and Yun SK (2023) Estuarine nutrient pollution impact reduction assessment through euphotic zone avoidance/bypass considerations. Front. Mar. Sci. 10:1192111. doi: 10.3389/fmars.2023.1192111
Received: 22 March 2023; Accepted: 01 June 2023;
Published: 19 June 2023.
Edited by:
Terry Eugene Whitledge, Retired, Fairbanks, United StatesReviewed by:
Piers Chapman, Texas A and M University, United StatesSolomon Dan, Beibu Gulf University, China
Copyright © 2023 Khangaonkar and Yun. This is an open-access article distributed under the terms of the Creative Commons Attribution License (CC BY). The use, distribution or reproduction in other forums is permitted, provided the original author(s) and the copyright owner(s) are credited and that the original publication in this journal is cited, in accordance with accepted academic practice. No use, distribution or reproduction is permitted which does not comply with these terms.
*Correspondence: Tarang Khangaonkar, dGFyYW5nLmtoYW5nYW9ua2FyQHBubmwuZ292