 Yingqi Wang
 Kui Wang
 Yan Bai
 Di Wu
Di Wu Hao Zheng
95% of researchers rate our articles as excellent or good
Learn more about the work of our research integrity team to safeguard the quality of each article we publish.
Find out more
REVIEW article
Front. Mar. Sci. , 01 June 2023
Sec. Ocean Observation
Volume 10 - 2023 | https://doi.org/10.3389/fmars.2023.1191013
This article is part of the Research Topic Using High-Resolution Observation Methods to Reveal the Effect and Mechanism of Coastal Eutrophication, Deoxygenation, and Acidification View all 8 articles
Net community production (NCP) is defined as the difference between gross primary production (GPP) and total community respiration (R). NCP indicates the balance between the production and consumption of community organic carbon, therefore making it a key parameter for evaluating the efficiency of carbon sequestration using the biological pump (BP). It is difficult to quantify NCP directly via satellite, because there are complex processes in community production and respiration. We reviewed previous research on satellite-based NCP and classified the methods into two primary categories: empirical methods and semi-analytical methods. The former category was established based on numerical relationships between NCP and satellite-based proxies, while the latter was developed by utilizing mechanistic analysis to establish quantitative expressions linking NCP to such proxies. Although satellite-based calculations of NCP have been attempted, they still suffer from significant uncertainties. Future research should focus on the precise calculation of satellite-based NCP by investigating the underlying processes and mechanisms that regulate NCP, developing regional models, and increasing the resolution of satellite sensors, as well as applying satellite lidar and coordinated multi-sensor observation technology.
Oceans are the largest sinks of atmospheric CO2, as they absorb nearly one-third of anthropogenic CO2 (Sabine et al., 2004); therefore, they play an essential role in the Earth’s carbon cycle and climate. As one of the most important mechanisms for marine carbon sequestration, biological pump (BP) refers to the process by which phytoplankton in the euphotic zone synthesize organic carbon (OC) through photosynthesis and transfer it to the deep ocean, where carbon is stored for months to millennia. Without BP, atmospheric CO2 would be 200 ppm higher than the current level it is at (Falkowski, 2002).
NCP and export production (EP) are two critical terms of relevance to biological pump (Figure 1). NCP is defined as the difference between gross primary production (GPP) and total community respiration (R, including the autotrophic respiration (AR) of phytoplankton and the heterotrophic respiration (HR) of other organisms in the community), or the difference between net primary production (NPP, which represents the net fixation of inorganic carbon by autotrophs, equal to GPP minus AR) and HR. NCP estimates the amount of OC produced and available for export (Manning et al., 2017). Similarly, EP is the OC formed via GPP that is not degraded, and ultimately, it is transported to the depths as either particulate (POC) or dissolved organic carbon (DOC) (Brix et al., 2006; Nevison et al., 2018). Therefore, by definition, NCP is equivalent to EP at the steady-state stage; most ocean ecosystems meet this condition (Longhurst, 1995; Brix et al., 2006). The accurate calculation of NCP is essential for quantifying the uptake of atmospheric CO2 by oceans and biological carbon cycling (Stanley et al., 2010; Alkire et al., 2012; Hull et al., 2016).
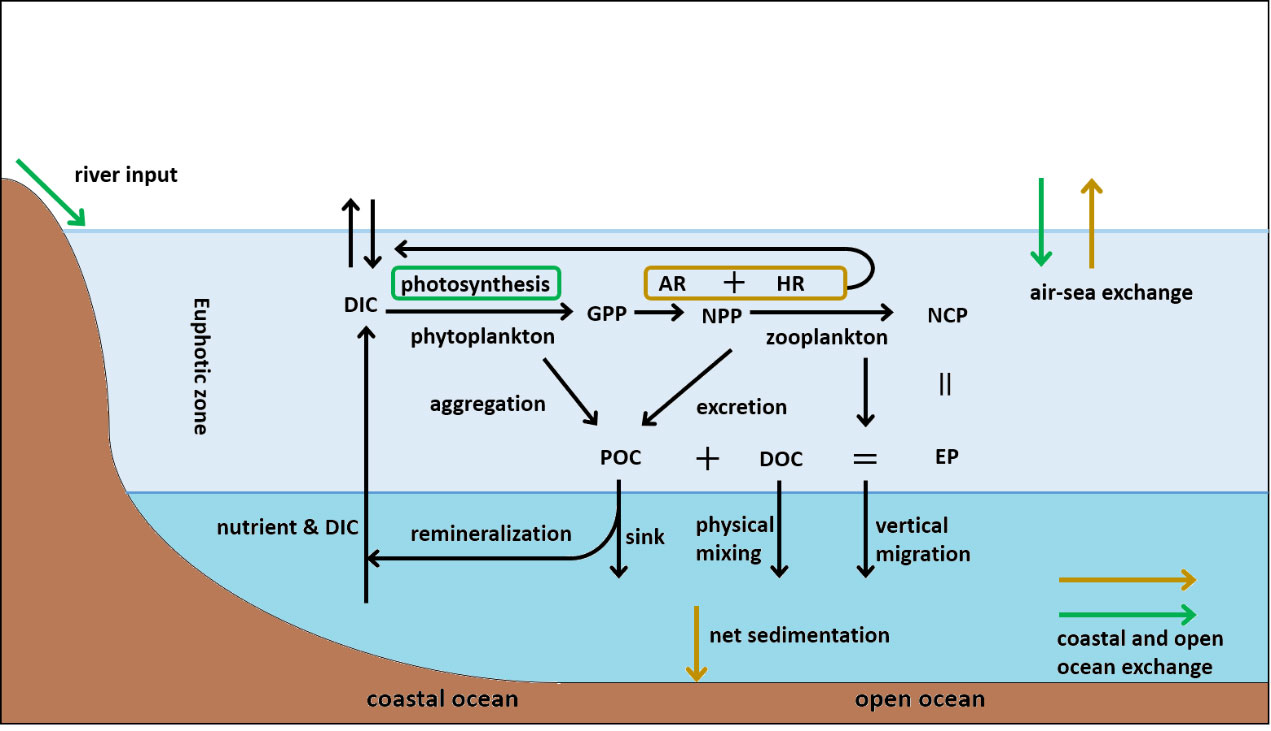
Figure 1 Schematic of the BP and NCP in the global marine organic carbon cycle. The mass-balance assumption that the sum of all inputs must equal that of all outputs is used to derive the OC balance equations for the coastal and open ocean. These equations are expressed as (Del Giorgio and Williams, 2005): ; . In the equations: is the deposition of OC from the atmosphere; is the input of OC from rivers; is the input of OC produced in coastal ocean; is OC exported from the ocean to the atmosphere; is the net sedimentation of OC; is the output from the coastal ocean to open ocean; P is photosynthesis, and R is respiration. The green and brown arrows (boxes) represent the input (production) and the output (consumption) of OC, respectively. OC is transported from upper ocean to depth through gravitational sinking (aggregation, excretion and intact phytoplankton cells), vertical migration (diel or longer timescales (Steinberg and Landry, 2017)) and physical mixing of DOC (Passow and Carlson, 2012; Nowicki et al., 2022). The evolution of NCP, which involves photosynthesis and respiration, is a critical part of the OC cycle.
Various approaches are used to calculate NCP, including in vitro incubation experiments and geochemical mass-balance methods that measure temporal changes in the parameters related to biological activity, such as oxygen (Sarma, 2004; Teeter et al., 2018; Cynar et al., 2022) and various forms of carbon, nitrogen, and phosphorus (Green and Sambrotto, 2006; Emerson, 2014; Yang et al., 2018). However, environmental factors can affect these measurements, such as dissolved inorganic carbon (DIC) in seawater, which is influenced by sea ice melting, river input, vertical mixing, and remineralization (Mathis et al., 2009). Furthermore, these methods have the defects of a low spatial and temporal resolution, and high-resolution and long-term NCP observations on a large scale have to be mainly obtained through the use of satellite remote sensing technology.
Ocean color satellites provide a valuable tool for NCP calculation due to their ability to obtain parameters related to the marine ecological environment. Since the coastal zone colour scanner (CZCS) equipped on the Nimbus-7 satellite was put into operation in the 1970s, ocean color sensors have recently entered the fine application stage. Satellite remote sensing observes the ocean color characteristics and then acquires the composition information of the water column using remote sensing reflectance (). After a series of data processing and inversion algorithm transformations, numerous data products can be derived from the raw data of ocean color satellite, including inherent optical properties (IOPs, e.g., phytoplankton absorption coefficient, particle backscattering coefficient, diffuse attenuation coefficient), constituent concentrations (e.g., chlorophyll concentration, suspended sediment concentration, colored dissolved organic matter concentration), and other secondary products (e.g., phytoplankton carbon biomass, particle size spectra), most of which are often required as inputs for NCP calculation.
Satellite-based NPP algorithms have undergone decades of development, advancing from simple empirical models initially to the current models that incorporate physiological relationships and environmental parameters. Furthermore, models that are specific to certain regions (Kameda and Ishizaka, 2005; Tripathy et al., 2012) and sizes of phytoplankton (Brewin et al., 2017; Curran et al., 2018) have also been developed. Unlike NPP, NCP is difficult to quantify via satellite because community respiration cannot be directly measured. Additionally, when NCP is considered to be the export production occurring at a certain depth and transported by complex pathways from the ocean’s surface, it is challenging to quantify NCP using ocean color remote sensing, which is limited to the first optical depth.
The central idea of NCP calculation using remote sensing is to establish a relationship between satellite-derived proxies and NCP, and then derive NCP indirectly by applying these proxies. This study conducted a literature review of satellite-based methods for estimating NCP and identified two primary categories: empirical models and semi-analytical models. Empirical models refer to establishing the relationship between several observable parameters and NCP through linear, multilinear, and other complex nonlinear regression algorithms. Semi-analytical models simulate NCP evolution processes, analyze the control mechanisms of these processes, and integrate these mechanisms into the satellite algorithm.
Since NCP is equivalent to EP at the steady state, the ratio of NCP to NPP (e-ratio) serves as an indicator of carbon export efficiency in communities (Yang, 2021). One method for calculating satellite-based NCP involves estimating NPP using satellite observations and then multiplying this by the e-ratio. Therefore, selecting suitable models for deriving NPP and the e-ratio from satellite data are critical factors in improving the accuracy of NCP estimates.
Since the first sensor devoted to observing ocean color was developed in the 1970s, a large number of satellite-based algorithms for calculating NPP have been established. Originally, remote sensing was used to retrieve chlorophyll concentration, and simple empirical relationships were used to calculate NPP (Lorenzen, 1970; Eppley et al., 1985). With the development of sensors and the understanding of the intrinsic mechanism of bio-optical properties, more parameters have been incorporated into NPP models, such as euphotic zone depth, photosynthetically active radiation, and the diffuse attenuation coefficient. Semi-analytical models that integrate the photosynthesis process have gradually emerged, and these models can be divided into three categories: chlorophyll-based, phytoplankton carbon-based, and phytoplankton absorption-based models.
Net primary production derives from photosynthesis, and chlorophyll is a critical element in this process. Therefore, a chlorophyll-based NPP calculation model that takes into account phytoplankton physiological processes and the external factors that affect photosynthesis has been developed:
where is the photosynthesis rate, expressed as the product of the energy conversion efficiency factor () and chlorophyll-specific absorption (); is the chlorophyll concentration; and is the absorbed photon energy. Since the spectral signature changes with the depth after the light penetrates the sea’s surface, is expressed as the equation of the light wavelength and depth (Equation 3), and is the diffuse attenuation coefficient (where is the wavelength of light). A wavelength-resolved model of NPP can be expressed as (Behrenfeld and Falkowski, 1997):
It is noteworthy that the distribution of the chlorophyll concentration in the vertical dimension is not uniform, which is influenced by light and nutrients. Currently, data on the vertical distribution of the chlorophyll concentration mainly derives from in situ samples, autonomous platforms, and fluorescence profiles. Satellites can only observe elemental information of the first optical depth (surface waters), which accounts for only one-fifth of the total chlorophyll content in the euphotic zone, thus neglecting the variability of a deeper phytoplankton biomass (Morel and Berthon, 1989). Early studies inferred the vertical distribution pattern of water column chlorophyll based on statistical relationships between surface chlorophyll and that within the entire euphotic zone (Morel and Berthon, 1989). In recent years, researchers have used new analysis methods and modeling techniques such as machine learning to construct the three-dimensional spatial distribution of ocean chlorophyll, which expands the application of satellite-based surface parameters (Sauzède et al., 2015; Sammartino et al., 2018; Hu et al., 2023).
This model is proposed based on two findings, phytoplankton carbon biomass () can be converted from the particle backscattering coefficient () because of its their covariance with light scattering properties, and the phytoplankton growth rate () can be obtained from the ratio of chlorophyll to phytoplankton carbon () (Behrenfeld et al., 2005). The model is expressed as (Behrenfeld et al., 2005; Westberry et al., 2008):
where is a parameter related to light-adjusted physiology and is the euphotic zone depth. Compared with the chlorophyll-based model, the phytoplankton carbon-based model includes the carbon biomass and growth rate of phytoplankton, but satellite-based chlorophyll is still necessary when estimating the phytoplankton growth rate.
According to the radiative transfer theory, is a function of the absorption coefficient () and backscattering coefficient (), in which the absorption coefficient is the main influencing factor. Therefore, in the chlorophyll-based model, can be replaced by the phytoplankton absorption coefficient (). This replacement avoids chlorophyll as an intermediate variable and establishes a direct connection between optical property (i.e., ) and NPP. Thus, this model eliminates the need of (chlorophyll in essence, since ). Furthermore, since the direct product of remote sensing is optical property, the input of this model matches that of remote sensing (Lee et al., 2015).
As for the accuracy of the models, instead of the complexity of the algorithms, this actually depends on the input parameters (Carr et al., 2006). In this respect, Lee et al. (2015) proposed specific parameters to be improved from the algorithm mechanism to narrow the gap between satellite results and field measurements. Li et al. (2015) reviewed the efforts of ultraviolet radiation on the NPP calculation by satellite. In addition, autonomous platforms can provide direct measurements of parameters in the vertical structure of the water column, instead of inferring them from satellite algorithms (Balch et al., 2022). In addition to ocean color sensors, light detection and ranging (lidar) has been used to measure depth-resolved data for calculating NPP because it can detect the subsurface structure of ocean properties (Schulien et al., 2017).
The carbon export efficiency [e-ratio=NCP/NPP; some articles define it in similar forms with a specific dataset (Table 1)] can be calculated with in situ measurements of NPP and NCP, or through the use of the empirical algorithm between the e-ratio and satellite-derived parameters (Henson et al., 2015). However, determining the in situ e-ratio presents a challenge as it requires simultaneous measurements of both NPP and NCP, which may suffer from temporal biases. For example, some particle matter may be too light to sink out of the euphotic zone, and it may take time for phytoplankton to be grazed and converted into zooplankton feces. Another drawback of this approach is the lack of available in situ data. Since the 1970s, scientists have been conducting researching on the empirical algorithm of the e-ratio. Eppley and Peterson (1979) innovatively defined the ratio of new production [supported by nutrient inputs out of the euphotic zone (Dugdale and Goering, 1967)] to NPP as the f-ratio and found a hyperbolic fit between the f-ratio and NPP. In a steady-state system, export production is equivalent to new production (Laws, 1991), so the e-ratio and f-ratio are numerically equivalent. Thereafter, Laws et al. (2000) assumed that the system achieved the steady-state condition and established an equation with temperature and NPP as independent variables to calculate the carbon export efficiency (denoted as the ef-ratio). The results revealed that the ef-ratio was negatively linearly correlated with temperature and positively nonlinearly correlated with NPP (Laws et al., 2011). They also found a hyperbolic relationship between the ef-ratio and NPP (Laws et al., 2000), which was consistent with Eppley’s conclusion. Dunne et al. (2005) proposed that the pe-ratio (defined in the corresponding article) was empirically related to temperature, the chlorophyll concentration, and euphotic zone depth. Henson et al. (2011) introduced the 234Th-drived POC export flux to the NPP ratio (referred to as ) in their study. The relationship between the and temperature was fitted exponentially, which differs from the linear fitting in the research of Laws et al. (2011). Additionally, at the same temperature, the numerical value the of was always less than the ef-ratio as Henson et al. only calculated the export POC flux and did not account for the DOC flux, which is another significant component of carbon export production.
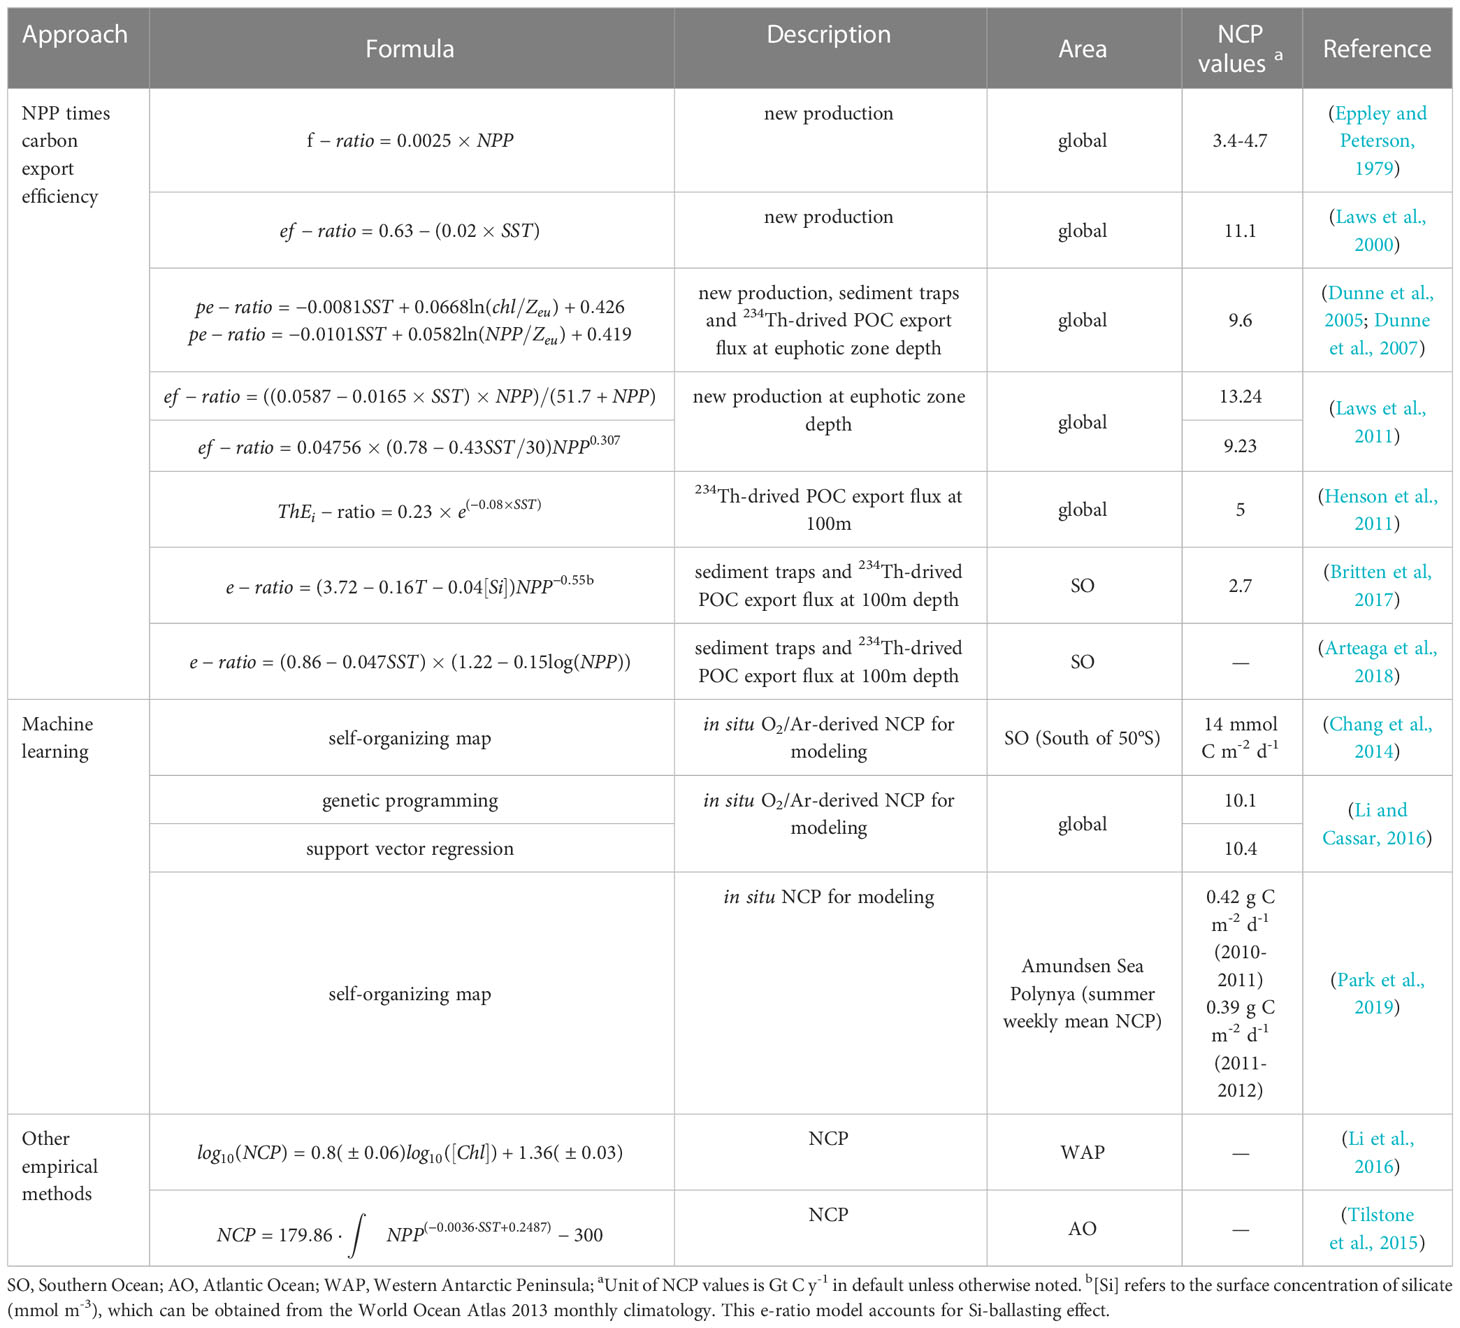
Table 1 Empirical models for NCP calculation using remote-sensing proxies.
Notably, on a global scale, most studies suggest that the e-ratio is positively correlated with NPP and negatively correlated with temperature (Laws et al., 2000; Dunne et al., 2005; Dunne et al., 2007; Henson et al., 2011; Laws et al., 2011). However, there are some areas where this relationship may not hold and even be the opposite (Maiti et al., 2013; Stukel et al., 2013; Arteaga et al., 2018; Kelly et al., 2018; Henson et al., 2019). For example, Fan et al. (2020) discovered a “High Productivity Low E-ratio” phenomenon in the Subantarctic Zone and Polar Front Zone, where the e-ratio was not dependent on temperatures below 6 °C. Kelly et al. (2018) observed a positive correlation between carbon export efficiency and temperature and a negative correlation with NPP in the California Current Ecosystem, which they attributed to the influence of significant horizontal advection in the area. In addition, Henson et al. (2015) found that the e-ratio was positively correlated with NPP at low latitudes and negatively correlated at high latitudes. These conflicting results show that the e-ratio is regionally variable, and simple numerical equations applied on a global scale leads to significant uncertainties. Henson et al. (2011) estimated the global NCP range from approximately 5 to 12 Gt C y-1. Furthermore, several models that have been developed rely on databases of field observations, which are spatially sparse and mainly distributed in the Northern Hemisphere. For example, the modeling data used in Laws et al.’s study (2000) were obtained from 11 stations mainly located at low latitudes, which greatly reduces the global representativeness of the algorithm. In other words, the performance of the model is a function of the data selected to optimize the model coefficients, and the choice of data would affect the interpretation of the model’s results (Bisson et al., 2018).
NCP has been widely calculated using e-ratio models and satellite-based NPP. Munro et al. (2015) used three satellite-based NPP models (vertical generalized production model (VGPM), carbon based production model (CbPM), and a chlorophyll-based model specific to the Southern Ocean) to calculate the NPP of the Southern Ocean, and then combined these data with two common e-ratio models (Dunne et al., 2007; Laws et al., 2011) to predict NCP. Comparing these results with in situ biochemical data, satellite-based approaches suggest a more gradual change in NCP rates over the growing season. Similarly, Nevison et al. (2018) calculated NCP from three satellited-based NPP models (VGPM, CbPM, and a modified VGPM), each paired with two e-ratio algorithms (Laws et al., 2011). Xie et al. (2019) used monthly ocean NPP data predicted by a size-fractionated absorption-based production model (SAbPM) and the e-ratio model of Dunne et al. (2005) to calculate the global ocean POC flux for the period during 2003-2018. Their analysis revealed an annual average POC flux of about 8.5-14.3 Gt C yr-1, which gradually decreased over time.
NCP results vary depending on the empirical models used, including the machine learning methods mentioned below (Table 1). On the one hand, the modeling of the e-ratio differs because of the variations in original datasets and the spatial domains defined for NCP. On a global scale, NCP and POC flux cannot be strictly distinguished. Actually, contributions to NCP also derive from the DOC flux. The average global DOC flux accounts for approximately 17% of NCP in the open ocean, and during algal blooms, it can contribute up to 50%-70% (Hansell and Carlson, 1998). At some stations, annual NCP (ANCP) levels have been found to be three to four times greater than POC fluxes, but this trend is mitigated when considering DOC flux (Emerson, 2014). Roshan and DeVries (2017) suggested that the DOC flux peaks and accounts for half of NCP in oligotrophic subtropical oceans. As global warming continues, these regions will expand, magnifying the role of DOC in carbon export. In addition, various factors influence the e-ratio, including the phytoplankton community structure (which affects aggregation and sedimentation processes (Buesseler, 1998; Francois et al., 2002)), zooplankton activity (such as diel vertical migration and fecal pellets deposition (Cavan et al., 2015)), and the remineralization of microorganisms. On the other hand, estimating the e-ratio accurately can be challenging without sufficient temporal and spatial data for observing seasonal and regional variability. Models such as those proposed by Laws et al. (2000); Henson et al. (2011), and Dunne et al. (2005) replace the annual average e-ratio with an instantaneous value and do not capture seasonal variability, which is a critical factor controlling the carbon export to the deep ocean (Lutz et al., 2007). Several studies have shown that the e-ratio varies seasonally. For example, Yang et al. (2021) found that the maximum value of the e-ratio in the northwest Atlantic Ocean occurred between late August and early October. In the middle of October, the e-ratio turned negative and continued to decrease, reaching its lowest value in December. In regions where the NPP variability is strong, the seasonal variation in the e-ratio is obvious, and the errors of the NCP results may be up to ±60% (Henson et al., 2015).
From the perspective of empirical formulas for the e-ratio, the main input parameters, such as NPP, are obtained through the inversion of multiple satellite-derived parameters (as described in Section 2.1.1). This requires considering the spatiotemporal variations in these parameters, such as the photosynthetic efficiency, which has been a long-standing topic of debate. In addition, in the process of calculating NCP from remote sensing (from fundamental remote sensing reflectance to chlorophyll and inherent optical properties, and subsequently the e-ratio and final NCP), uncertainties of calculation results accumulate at each step and are propagated to the next step. Studies have found that the error in remote reflectance is within 10%, but for the NPP calculation, it may accumulate up to 100% (Carr et al., 2006). This also indicates the necessity of conducting in-depth research on the spatiotemporal patterns of photosynthesis. In terms of space, bio-optical provinces can be delineated, which often exhibit different optical properties due to the varying compositions of the water column. For example, Lewis et al. (2016) divided the Arctic Ocean into three bio-optical provinces, which are mainly influenced by rivers and carried materials (such as colored dissolved organic matter) and found that different regions have their own most suitable ocean color algorithms for chlorophyll. In terms of time, one approach is to study marine phytoplankton phenology through the use of remote sensing; for example, along the coast of the Mediterranean Sea, the growing season of phytoplankton starts in November and reaches its peak in February, with an average duration of about four months (Demetriou et al., 2022). Racault et al. (2012) pointed out that the growing season of phytoplankton in different marine areas around the world is influenced by factors such as light, nutrient supply, and climate patterns (El Niño and La Niña). The development of sensors and autonomous platforms has also improved the temporal spatial coverage of measured e-ratio values. For example, Burt et al. (2018) estimated e-ratio values using NPP from bio-optical measurements and NCP measured by underway mass spectrometry. In another study, Haskell et al. (2020) used biogeochemical profiling floats and a developed algorithm of the carbonate system to calculate NCP and eventually the e-ratio. This approach for assessing the e-ratio could be applied in many other regions.
Some other studies directly developed the empirical relationship between NCP and NPP with field measurements. Tilstone et al. (2015) developed four empirical models based on the data collected from Atlantic, Mediterranean, and Greenland seas. Ford et al. (2021) used these models to calculate the NCP in the Atlantic Ocean and evaluated the driving factors of net autotrophic regimes. In addition, Li et al. (2016) and Huang et al. (2012) studied the inter-annual variability of NCP and its controlling mechanism in the West Antarctica Peninsula region of the Southern Ocean by summarizing the logarithmic relationship between NCP and the sea surface chlorophyll concentration.
Machine learning has been widely used to solve complex problems in the marine field (Chen et al., 2019; Partee et al., 2021; Gloege et al., 2022). Based on the training data, machine learning is used to search for the optimal program that best matches the performance metric from numerous candidates (Jordan and Mitchell, 2015). In the case of calculating NCP, machine learning is used to find the most accurate regression equation between predictors (environmental parameters) and predictand (i.e., NCP). Chang et al. (2014) used O2/Ar-NCP measurements and satellite observations to predict the distribution of NCP in the Southern Ocean through the self-organizing map (SOM). This non-parametric approach is not restricted by prior knowledge. The complexity of the statistical relationship between the predictors and NCP is entirely determined by the data used in the training process. Furthermore, it can easily handle missing predictors, which often occur because of the limited coverage of cloud-free satellite data. Park et al. (2019) also used SOM to calculate the NCP of the Amundsen Sea Polynya. They found that the four variables (i.e., sea surface temperature, mixed layer depth, photosynthetically available radiation, and chlorophyll-a) appropriately reproduced the observed NCP. Moreover, they proposed to resolve the complex process of the bloom with additional NCP observations. Li et al. (2016) put forward genetic programming (GP) and support vector regression (SVR) to calculate global NCP based on Chang et al. (2014). The result showed that annual NCP distribution for the world’s oceans is more spatially uniform. In the same year, a hierarchical Bayesian method was applied to establish the functional relationship between NCP and chlorophyll-a in the Western Antarctic Peninsula (WAP), and the predictions were significantly correlated with in situ measurements (Li et al., 2016). Recently, the satellite NCP calculated with GP has been used to evaluate the impact of the Southern Ocean mixed-layer dynamics on NCP on multiple timescales (Li et al., 2021).
Among these methods, GP follows the principle of survival of the fittest and produces a solution to the given problem through genetic operators such as mutation, crossover, and the selection of a genetic operator. This hierarchical algorithm is typically based on a tree structure and is well-suited to solve non-linear problems. However, it is difficult to set an optimal stopping criterion, which would result in lengthy computing times. The Bayesian hierarchical model transforms the complex posterior probability problem into a conditional distribution problem, making it suitable for modeling temporal spatial data. However, this model requires prior knowledge and a calculation of the distribution of the posterior probability with random samples, which increases the uncertainty of the results. Although machine learning methods are more accurate in prediction compared to linear regression models, they operate similarly to a “black box” and do not provide obvious physical significance or transferability regarding the mechanisms governing NCP from the input parameters. Therefore, site-specific data are desirable to enhance the robustness of the model.
The food web model is a semi-analytical approach that explains the mechanisms of sinking particulate matter creation in the food web. Siegel et al. (2014) developed a simple food web model for predicting global ocean carbon export using satellite data. In this model, the sinking particle flux () at the base of the euphotic zone is composed of algal aggregates () and zooplankton feces () (Equation 7). Furthermore, phytoplankton is divided into small- and large-size classes, and it is assumed that each class is grazed by the corresponding size (small or large) of zooplankton, and a fixed fraction of grazed carbon is converted into fecal pellets ( and , which are 0.1 and 0.3, respectively). The algal export, , is the product of the large-size phytoplankton NPP () and the transformation efficiency () (Equation 8). The is modeled as fixed fractions of herbivory rates on small () and large () phytoplankton averaged over the euphotic zone () (Equation 9). Satellite data are used to calculate NPP, the euphotic zone depth, phytoplankton carbon biomass [for estimating herbivory rates (Behrenfeld, 2010; Behrenfeld et al., 2013)], and particle size spectra [(for partitioning the size class of phytoplankton (Kostadinov et al., 2009)], and subsequently predict TotEZ.
The herbivory rates on each size phytoplankton () can be calculated using Equation (10). The left-hand side of the equation represents the rate of change in the phytoplankton biomass () over time. is the mortality rate of non-grazing phytoplankton, is the mixed layer depth, and equals 1 when represents large phytoplankton and 0 otherwise. A detrainment term is included to account for the assumption that the biomass concentration decreases as the mixed layer deepens, where =1 when x>0 and 0 otherwise. The subscript of the aforementioned parameters denotes the th size class of phytoplankton.
The climatological mean global NCP calculated by the food web model is about 6 Gt C y-1. Compared with the aforementioned empirical models, the food web model includes the ecological process of sinking particles, provides the relationship between biological structure and particle organic matter flux, and estimates the export efficiency (EZ-Ratio = TotEZ/NPP) with ecological realism (Laws et al., 2000; Siegel et al., 2014). Li et al. (2018) used this model to predict the POC export in the northern South China Sea (NSCS) and found the result to be accurate in the NCSC basin. While the aforementioned model primarily focuses on the gravitational sinking of export production, recent studies have also highlighted the significance of the other two pathways. Archibald et al. (2019) incorporated the contribution of zooplankton diel vertical migration (DVM) to the carbon export flux in the food web model. The DVM-mediated flux is the sum of respiratory DIC and fecal pellets in the twilight zone. The global carbon export flux calculated by this method is about 6.5 Gt C y-1, which is approximately 14% higher than that of the pure food web model. Behrenfeld et al. (2019) used satellite-mounted lidar to map the global DVM activities, which is a further refinement of the contributions of DVM to BP. Nowicki et al. (2022) proposed an assimilated data model that provides a comprehensive estimate of carbon export considering all the three pathways of the biological pump. The results showed that the global carbon export and DVM-mediated flux were 10.2 Gt C y-1 and 1.0 Gt C y-1, respectively. The fraction of gravitational sinking, migration, and physical mixing accounts for 70%, 10%, and 20% of the total export flux, respectively.
The calculation of NPP from space has been mature, which is mainly attributed to the strong coupling relationship between NPP and other ecological parameters, as well as the availability of in situ NPP data for developing algorithms. Despite the fact that the pixel-level respiration rate can be calculated by using the empirical method (Westberry et al., 2012), community respiration cannot be directly measured from spectral characteristics, and NCP explicitly depends on the temporal-spatial domains. Therefore, the mechanistic relationship between satellite-derived proxies and NCP has not yet been established (Brewin et al., 2021). In addition, the calculation precision of satellite-based NCP described above (both empirical and semi-analytic methods) requires further enhancement. On the one hand, this is due to the inaccuracies associated with NPP. Research shows that 50% of uncertainty in the satellite-based calculation of NPP is attributable to input variables, among which, the chlorophyll concentration is the strongest influence; 22% of the discrepancy arises from discrepancies of the in situ data (Saba et al., 2011). On the other hand, there is insufficient in situ data to calibrate the algorithms. Future research on satellite-based NCP calculations should focus on the following aspects.
In order to reduce the uncertainties and obtain more constituent information about the water column from the limited ocean color features, it is necessary to optimize the performance of satellite sensors. First, the temporal and spatial coverage must be increased. As the first geostationary ocean color satellite, the Geostationary Ocean Color Imager (GOCI) realized the hourly observation of ocean color and made real-time ocean monitoring possible (Choi et al., 2012). Its successor, GOCI-II, offers a greater functional performance, with ten observations per day with a spatial resolution of about 250m over the Korean sea. An upcoming Geostationary Littoral Imaging and Monitoring Radiometer (GLIMR) is a hyperspectral ocean color sensor. It provides high temporal (70 minutes) and spatial resolution (300m nadir) ocean color data, which will help scientists better understand phytoplankton physiological processes and ecosystem production. Moreover, improving the spectral resolution of ocean color sensors makes it possible to acquire phytoplankton composition, which is conducive to biological pump analysis. In addition, some satellite sensors initially designed other than for the marine field are also playing a role in monitoring the ocean properties. For example, The European TROPOspheric Monitoring Instrument (TROPOMI), carried on Sentinel-5p, has been used for identifying phytoplankton functional types (Losa et al., 2017). Higher-resolution sensors, such as Landsat 8 OLI, have also been used for the retrieval of ocean suspended particulate matter and coastal floating vegetation. This highlights the importance of coordinated observations from multiple satellite sensors. Such integration can also overcome the issue of data gaps caused by the limited lifespan of individual satellites, allowing the construction of continuous time series of ocean color satellite data spanning several decades, providing a foundation for studying marine ecosystems under climate change (Henson et al., 2010). However, it should be noted that different sensors have differences in orbit, spatial resolution, revisit times, as well as the number and location of wavebands. Further efforts are needed for bias elimination and consistency verification of multiple satellite products.
Nevertheless, the aforementioned passive ocean color instruments still have unavoidable limitations, including susceptibility to interference from clouds, aerosols, and the solar zenith angle; a limited detection depth restricted to the sea surface, which is unable to provide the vertical distribution characteristics of seawater components; and the inability to work at night. These limitations hinder our in-depth understanding of marine ecosystems. Comparatively, active satellite instruments, such as satellite lidar, can penetrate the sea surface with a high-power pulsed laser, allowing the detection of vertical profile information of the optical parameters of the water column, which has significant advantages in observing the vertical structure of the ocean. For example, Schulien et al. (2017) improved the accuracy of NPP estimation within the water column by using the backscattering coefficient of suspended particles and the downward irradiance attenuation coefficient obtained from high-spectral-resolution lidar. Zheng et al. (2022) used spaceborne photon-counting lidar to detect the vertical structure of the chlorophyll concentration in upper-layer seawater. Moreover, in high-latitude areas such as the Arctic Ocean, the spatial coverage of ocean color sensors is less than 20% from October to March of the following year due to the influence of clouds and a low solar zenith angle. In contrast, satellite lidar can operate under conditions where ocean color sensors are unable to work. Currently, the use of satellite lidar for marine research is still in its infancy. In the future, with the combination of ocean color sensors and satellite lidar, it is expected to form a synergistic ocean observation constellation. This system will greatly expand the spatiotemporal coverage of global data and contribute to a deeper understanding of the vertical characteristics of the ocean, providing new insights into the development of satellite remote sensing algorithms and marine biogeochemical processes.
Due to the complex and diverse influence factors of NCP, it is difficult to establish pure empirical algorithms with significant regression relationships. The performance of the food web model is comparable to or better than that of purely empirical formulations (Stukel et al., 2015) since this approach models the evolution processes of export production and then integrates these mechanistic relationships into satellite algorithms. A science plan, Export Processes in the Ocean from Remote Sensing (EXPORTS), focuses on ecological and biogeochemical mechanisms that control the carbon export, then tracks the fate of the carbon export from space, estimates its impacts on the global carbon cycle, and even future climate states using Earth system models (Siegel et al., 2016). The Plankton, Aerosol, Cloud, Ocean Ecosystem (PACE) mission aims to improve the knowledge of marine carbon cycles and food webs, which is expected to enable advances in the marine biogeochemistry cycle (Werdell et al., 2019). Above all, the NCP regulating mechanisms, including plankton community composition, food web relationships between community organisms, grazing dynamics, and physical oceanographic processes deserve attention from more in-depth research projects.
It should be noted that the generalized models for calculating global carbon export fluxes are difficult to apply in specific areas. One approach is to use autonomous platforms, such as biogeochemical Argo (Claustre et al., 2020) and underwater gliders (Rudnick, 2016), along with in situ sensors such as acoustic backscatter sensors (Ohman et al., 2019) and optical sediment traps (Estapa et al., 2017). These platforms and sensors can provide a wealth of measured data on physical and biogeochemical properties, as well as zooplankton vertical migration and particle sinking processes. By combining these data with the biogeochemical provinces, regional algorithms can be modeled, and parameters can be fine-tuned. Furthermore, by integrating in situ data and satellite observations, data-assimilated models have been established. For instance, Nowicki et al. (2022) quantified three pathways of carbon export on both regional and global scales, which further deepened our understanding of the biological pump process.
KW conceived and developed the idea of the review. YW wrote the paper. YB provided comments and suggestions to improve the manuscript. DW and HZ polished the manuscript. All authors contributed to the article and approved the submitted version.
This study was funded by the Key R&D Program of Zhejiang (#2023C03011), the National Natural Science Foundation of China (No. 41976154), the Science Foundation of Donghai Laboratory (No. DH-2022KF0205), the Bureau of Science and Technology of Zhoushan (No. 2022C81006), and the Natural Science Foundation of Zhejiang Province of China (LY20D060007).
The authors declare that the research was conducted in the absence of any commercial or financial relationships that could be construed as a potential conflict of interest.
All claims expressed in this article are solely those of the authors and do not necessarily represent those of their affiliated organizations, or those of the publisher, the editors and the reviewers. Any product that may be evaluated in this article, or claim that may be made by its manufacturer, is not guaranteed or endorsed by the publisher.
Alkire M. B., D’Asaro E., Lee C., Perry M. J., Gray A., Cetinić I., et al. (2012) Estimates of net community production and export using high-resolution, Lagrangian measurements of O2, NO3–, and POC through the evolution of a spring diatom bloom in the north atlantic.” Deep Sea Res. Part I: Oceanographic Res. Papers 64, 157–174. doi: 10.1016/j.dsr.2012.01.012
Archibald K. M., Siegel D. A., Doney S. C. (2019). Modeling the impact of zooplankton diel vertical migration on the carbon export flux of the biological pump. Global Biogeochemical Cycles 33 (2), 181–199. doi: 10.1029/2018GB005983
Arteaga L., Haëntjens N., Boss E., Johnson K. S., Sarmiento J. L. (2018). Assessment of export efficiency equations in the southern ocean applied to satellite-based net primary production. J. Geophysical Research: Oceans 123 (4), 2945–2964. doi: 10.1002/2018JC013787
Balch W. M., Carranza M., Cetinic I., Chaves J. E., Duhamel S., Fassbender A., et al. (2022). “IOCCG ocean optics and biogeochemistry protocols for satellite ocean colour sensor validation volume 7.0,” in Aquatic primary productivity field protocols for satellite validation and model synthesis, vol. 7.0. (Dartmouth, NS, Canada: IOCCG).
Behrenfeld M. J. (2010). Abandoning sverdrup’s critical depth hypothesis on phytoplankton blooms. Ecology 91 (4), 977–989. doi: 10.1890/09-1207.1
Behrenfeld M. J., Boss E., Siegel D. A., Shea D. M. (2005). Carbon-based ocean productivity and phytoplankton physiology from space. Global biogeochemical cycles 19 (1), 1–14. doi: 10.1029/2004GB002299
Behrenfeld M. J., Doney S. C., Lima I., Boss E. S., Siegel D. A. (2013). Annual cycles of ecological disturbance and recovery underlying the subarctic Atlantic spring plankton bloom. Global biogeochemical cycles 27 (2), 526–540. doi: 10.1002/gbc.20050
Behrenfeld M. J., Falkowski P. G. (1997). A consumer’s guide to phytoplankton primary productivity models. Limnology oceanography 42 (7), 1479–1491. doi: 10.4319/lo.1997.42.7.1479
Behrenfeld M. J., Gaube P., Della Penna A., O’malley R. T., Burt W. J., Hu Y., et al. (2019). Global satellite-observed daily vertical migrations of ocean animals. Nature 576 (7786), 257–261. doi: 10.1038/s41586-019-1796-9
Bisson K. M., Siegel D. A., DeVries T., Cael B. B., Buesseler K. O. (2018). How data set characteristics influence ocean carbon export models. Global Biogeochemical Cycles 32 (9), 1312–1328. doi: 10.1029/2018GB005934
Brewin R. J. W., Sathyendranath S., Platt T., Bouman H., Ciavatta S., Dall’Olmo G., et al. (2021) Sensing the ocean biological carbon pump from space: a review of capabilities, concepts, research gaps and future developments.” Earth-Science Rev. 217, 103604. doi: 10.1016/j.earscirev.2021.103604
Brewin R. J. W., Tilstone G. H., Jackson T., Cain T., Miller P. I., Lange P. K., et al. (2017). Modelling size-fractionated primary production in the Atlantic ocean from remote sensing. Prog. Oceanography 158, 130–149. doi: 10.1016/j.pocean.2017.02.002
Britten G. L., Wakamatsu L., Primeau FrançoisW. (2017). The temperature-ballast hypothesis explains carbon export efficiency observations in the southern ocean. Geophysical Res. Lett. 44 (4), 1831–1838. doi: 10.1002/2016GL072378
Brix H., Gruber N., Karl D. M., Bates N. R. (2006). On the relationships between primary, net community, and export production in subtropical gyres. Deep Sea Res. Part II: Topical Stud. Oceanography 53 (5-7), 698–717. doi: 10.1016/j.dsr2.2006.01.024
Buesseler K. O. (1998). The decoupling of production and particulate export in the surface ocean. Global Biogeochemical Cycles 12 (2), 297–310. doi: 10.1029/97GB03366
Burt W. J., Westberry T. K., Behrenfeld M. J., Zeng C., Izett R. W., Tortell P. D. (2018). Carbon: chlorophyll ratios and net primary productivity of subarctic pacific surface waters derived from autonomous shipboard sensors. Global Biogeochemical Cycles 32 (2), 267–288. doi: 10.1002/2017GB005783
Carr M.-E., Friedrichs M. A. M., Schmeltz M., Aita M. N., Antoine D., Arrigo K. R., et al. (2006). A comparison of global estimates of marine primary production from ocean color. Deep Sea Res. Part II: Topical Stud. Oceanography 53 (5-7), 741–770. doi: 10.1016/j.dsr2.2006.01.028
Cavan E. L., Moigne FrédéricA. C. LE, Poulton A. J., Tarling G. A., Ward P., Daniels C. J., et al. (2015). Attenuation of particulate organic carbon flux in the Scotia Sea, southern ocean, is controlled by zooplankton fecal pellets. Geophysical Res. Lett. 42 (3), 821–830. doi: 10.1002/2014GL062744
Chang C.-H., Johnson N. C., Cassar N. (2014). Neural network-based estimates of southern ocean net community production from in situ O 2/Ar and satellite observation: a methodological study. Biogeosciences 11 (12), 3279–3297. doi: 10.5194/bg-11-3279-2014
Chen S., Hu C., Barnes B. B., Wanninkhof R., Cai W.-J., Barbero L., et al. (2019). A machine learning approach to estimate surface ocean pCO2 from satellite measurements. Remote Sens. Environ. 228, 203–226. doi: 10.1016/j.rse.2019.04.019
Choi J.-K., Park Y. JE, Ahn J. H., Lim H.-S., Eom J., Ryu J.-H. (2012). GOCI, the world’s first geostationary ocean color observation satellite, for the monitoring of temporal variability in coastal water turbidity. J. Geophysical Research: Oceans 117 (C9), 1–10. doi: 10.1029/2012JC008046
Claustre Hervé, Johnson K. S., Takeshita Y. (2020). Observing the global ocean with biogeochemical-argo. Annu. Rev. Mar. Sci. 12, 23–48. doi: 10.1146/annurev-marine-010419-010956
Curran K., Brewin R. J. W., Tilstone G. H., Bouman H. A., Hickman A. (2018). Estimation of size-fractionated primary production from satellite ocean colour in UK shelf seas. Remote Sens. 10 (9), 1389. doi: 10.3390/rs10091389
Cynar H., Juranek L. W., Mordy C. W., Strausz D., Bell S. (2022). High-resolution biological net community production in the pacific-influenced arctic as constrained by O2/Ar and O2/N2 observations. Deep Sea Res. Part II: Topical Stud. Oceanography 206, 105214. doi: 10.1016/j.dsr2.2022.105214
Del Giorgio P., Williams P. (2005). Respiration in aquatic ecosystems (OUP Oxford: Oxford University Press).
Demetriou M., Raitsos D. E., Kournopoulou A., Mandalakis M., Sfenthourakis S., Psarra S. (2022). Phytoplankton phenology in the coastal zone of Cyprus, based on remote sensing and In situ observations. Remote Sens. 14 (1), 12. doi: 10.3390/rs14010012
Dugdale R. C., Goering J. J. (1967). Uptake of new and regenerated forms of nitrogen in primary productivity 1. Limnology oceanography 12 (2), 196–206. doi: 10.4319/lo.1967.12.2.0196
Dunne J. P., Armstrong R. A., Gnanadesikan A., Sarmiento J. L. (2005). Empirical and mechanistic models for the particle export ratio. Global Biogeochemical Cycles 19 (4), 1–16. doi: 10.1029/2004GB002390
Dunne J. P., Sarmiento J. L., Gnanadesikan A. (2007). A synthesis of global particle export from the surface ocean and cycling through the ocean interior and on the seafloor. Global Biogeochemical Cycles 21 (4), 1–16. doi: 10.1029/2006GB002907
Emerson S. (2014). Annual net community production and the biological carbon flux in the ocean. Global Biogeochemical Cycles 28 (1), 14–28. doi: 10.1002/2013GB004680
Eppley R. W., Peterson B. J. (1979). Particulate organic matter flux and planktonic new production in the deep ocean. Nature 282 (5740), 677–680. doi: 10.1038/282677a0
Eppley R. W., Stewart E., Abbott M., Heyman U. (1985). Estimating ocean primary production from satellite chlorophyll. introduction to regional differences and statistics for the southern California bight. J. Plankton Res. 7 (1), 57–70. doi: 10.1093/plankt/7.1.57
Estapa M., Durkin C., Buesseler K., Johnson R., Feen M. (2017). Carbon flux from bio-optical profiling floats: calibrating transmissometers for use as optical sediment traps.” Deep Sea Res. Part I: Oceanographic Res. Papers 120, 100–111. doi: 10.1016/j.dsr.2016.12.003
Falkowski P. G. (2002). “The ocean’s invisible forest.” Sci. Am. 287 (2), 54–61. doi: 10.1038/scientificamerican0802-54
Fan G., Han Z., Ma W., Chen S., Chai F., Mazloff M. R., et al. (2020). Southern ocean carbon export efficiency in relation to temperature and primary productivity. Sci. Rep. 10 (1), 1–11. doi: 10.1038/s41598-020-70417-z
Ford D., Tilstone G. H., Shutler J. D., Kitidis V., Lobanova P., Schwarz J., et al. (2021). Wind speed and mesoscale features drive net autotrophy in the south Atlantic ocean. Remote Sens. Environ. 260, 112435. doi: 10.1016/j.rse.2021.112435
Francois R., Honjo S., Krishfield R., Manganini S. (2002). Factors controlling the flux of organic carbon to the bathypelagic zone of the ocean. Global Biogeochemical Cycles 16 (4), 34–1-34-20. doi: 10.1029/2001GB001722
Gloege L., Yan M., Zheng T., McKinley G. A. (2022). Improved quantification of ocean carbon uptake by using machine learning to merge global models and pCO2 data. J. Adv. Modeling Earth Syst. 14 (2), e2021MS002620. doi: 10.1029/2021MS002620
Green S. E., Sambrotto R. N. (2006). Net community production in terms of c, n, p and Si in the Antarctic circumpolar current and its influence on regional water mass characteristics. Deep Sea Res. Part I: Oceanographic Res. Papers 53 (1), 111–135. doi: 10.1016/j.dsr.2005.04.008
Hansell D. A., Carlson C. A. (1998). Net community production of dissolved organic carbon. Global Biogeochemical Cycles 12 (3), 443–453. doi: 10.1029/98GB01928
Haskell W. Z., Fassbender A. J., Long J. S., Plant J. N. (2020). Annual net community production of particulate and dissolved organic carbon from a decade of biogeochemical profiling float observations in the northeast pacific. Global Biogeochemical Cycles 34 (10), e2020GB006599. doi: 10.1029/2020GB006599
Henson S., Moigne F. Le, Giering S. (2019). Drivers of carbon export efficiency in the global ocean. Global biogeochemical cycles 33 (7), 891–903. doi: 10.1029/2018GB006158
Henson S. A., Sanders R., Madsen E., Morris P. J., Moigne FrédéricLe, Quartly G. D. (2011). A reduced estimate of the strength of the ocean’s biological carbon pump. Geophysical Res. Lett. 38 (4), 1–5. doi: 10.1029/2011GL046735
Henson S. A., Sarmiento J. L., Dunne J. P., Bopp L., Lima I., Doney S. C., et al. (2010). Detection of anthropogenic climate change in satellite records of ocean chlorophyll and productivity. Biogeosciences 7 (2), 621–640. doi: 10.5194/bg-7-621-2010
Henson S. A., Yool A., Sanders R. (2015). Variability in efficiency of particulate organic carbon export: a model study. Global Biogeochemical Cycles 29 (1), 33–45. doi: 10.1002/2014GB004965
Hu Q., Chen X., Bai Y., He X., Li T., Pan D. (2023). Reconstruction of 3-d ocean chlorophyll a structure in the northern Indian ocean using satellite and BGC-argo data. IEEE Trans. Geosci. Remote Sens. 61, 3233385. doi: 10.1109/TGRS.2022.3233385
Huang K., Ducklow H., Vernet M., Cassar N., Bender M. L. (2012). Export production and its regulating factors in the West Antarctica peninsula region of the southern ocean. Global Biogeochemical Cycles 26 (2), 1–13. doi: 10.1029/2010GB004028
Hull T., Greenwood N., Kaiser J., Johnson M. (2016). Uncertainty and sensitivity in optode-based shelf-sea net community production estimates. Biogeosciences 13 (4), 943–959. doi: 10.5194/bg-13-943-2016
Jordan M. I., Mitchell T. M. (2015). Machine learning: trends, perspectives, and prospects. Science 349 (6245), 255–260. doi: 10.1126/science.aaa8415
Kameda T., Ishizaka J. (2005). Size-fractionated primary production estimated by a two-phytoplankton community model applicable to ocean color remote sensing. J. Oceanography 61 (4), 663–672. doi: 10.1007/s10872-005-0074-7
Kelly T. B., Goericke R., Kahru M., Song H., Stukel M. R. (2018). CCE II: spatial and interannual variability in export efficiency and the biological pump in an eastern boundary current upwelling system with substantial lateral advection. Deep Sea Res. Part I: Oceanographic Res. Papers 140, 14–25. doi: 10.1016/j.dsr.2018.08.007
Kostadinov T. S., Siegel D. A., Maritorena S. (2009). Retrieval of the particle size distribution from satellite ocean color observations. J. Geophysical Research: Oceans 114 (C9), 1–22. doi: 10.1029/2009JC005303
Laws E. A. (1991). Photosynthetic quotients, new production and net community production in the open ocean. Deep Sea Res. Part A. Oceanographic Res. Papers 38 (1), 143–167. doi: 10.1016/0198-0149(91)90059-O
Laws E. A., D’Sa E., Naik P. (2011). Simple equations to estimate ratios of new or export production to total production from satellite-derived estimates of sea surface temperature and primary production. Limnology Oceanography: Methods 9 (12), 593–601. doi: 10.4319/lom.2011.9.593
Laws E. A., Falkowski P. G., Jr. W. O.S., Ducklow H., McCarthy J. J. (2000). Temperature effects on export production in the open ocean. Global biogeochemical cycles 14 (4), 1231–1246. doi: 10.1029/1999GB001229
Lee Z., Marra J., Perry M. J., Kahru M. (2015). Estimating oceanic primary productivity from ocean color remote sensing: a strategic assessment. J. Mar. Syst. 149, 50–59. doi: 10.1016/j.jmarsys.2014.11.015
Lewis K. M., Mitchell B. G., Van Dijken G. L., Arrigo K. R. (2016). Regional chlorophyll a algorithms in the Arctic ocean and their effect on satellite-derived primary production estimates. Deep Sea Res. Part II: Topical Stud. Oceanography 130, 14–27. doi: 10.1016/j.dsr2.2016.04.020
Li T., Bai Y., He X., Xie Y., Chen X., Gong F., et al. (2018). Satellite-based estimation of particulate organic carbon export in the northern south China Sea. J. Geophysical Research: Oceans 123 (11), 8227–8246. doi: 10.1029/2018JC014201
Li T., Bai Y., Li G., He X., Chen C.-T. A., Gao K., et al. (2015). Effects of ultraviolet radiation on marine primary production with reference to satellite remote sensing. Front. Earth Sci. 9, 237–247. doi: 10.1007/s11707-014-0477-0
Li Z., Cassar N. (2016). Satellite estimates of net community production based on O2/Ar observations and comparison to other estimates. Global Biogeochemical Cycles 30 (5), 735–752. doi: 10.1002/2015GB005314
Li Z., Cassar N., Huang K., Ducklow H., Schofield O. (2016). Interannual variability in net community production at the Western Antarctic Peninsula region (1997–2014). J. Geophysical Research: Oceans 121 (7), 4748–4762. doi: 10.1002/2015JC011378
Li Z., Lozier M.S., Cassar N. (2021). Linking southern ocean mixed-layer dynamics to net community production on various timescales. J. Geophysical Research: Oceans 126 (10), e2021JC017537. doi: 10.1029/2021JC017537
Longhurst A. (1995). Seasonal cycles of pelagic production and consumption. Prog. oceanography 36 (2), 77–167. doi: 10.1016/0079-6611(95)00015-1
Lorenzen C. J. (1970). Surface chlorophyll as an index of the depth, chlorophyll content, and primary productivity of the euphotic layer 1. Limnology Oceanography 15 (3), 479–480. doi: 10.4319/lo.1970.15.3.0479
Losa S. N., Soppa M. A., Dinter T., Wolanin A., Brewin R. J. W., Bricaud A., et al. (2017). Synergistic exploitation of hyper-and multi-spectral precursor sentinel measurements to determine phytoplankton functional types (SynSenPFT). Front. Mar. Sci. 4, 203. doi: 10.3389/fmars.2017.00203
Lutz M. J., Caldeira K., Dunbar R. B., Behrenfeld M. J. (2007). Seasonal rhythms of net primary production and particulate organic carbon flux to depth describe the efficiency of biological pump in the global ocean. J. Geophysical Research: Oceans 112 (C10), 1–26. doi: 10.1029/2007JC004628
Maiti K., Charette M. A., Buesseler K. O., Kahru M. (2013). An inverse relationship between production and export efficiency in the southern ocean. Geophysical Res. Lett. 40 (8), 1557–1561. doi: 10.1002/grl.50219
Manning C. C., Stanley R. H. R., Nicholson D. P., Smith J. M., Pennington J.T., Fewings M. R., et al. (2017). Impact of recently upwelled water on productivity investigated using in situ and incubation-based methods in Monterey Bay. J. Geophysical Research: Oceans 122 (3), 1901–1926. doi: 10.1002/2016JC012306
Mathis J. T., Bates N. R., Hansell D. A., Babila T. (2009). Net community production in the northeastern chukchi Sea. Deep Sea Res. Part II: Topical Stud. Oceanography 56 (17), 1213–1222. doi: 10.1016/j.dsr2.2008.10.017
Morel André, Berthon Jean-François (1989). Surface pigments, algal biomass profiles, and potential production of the euphotic layer: relationships reinvestigated in view of remote-sensing applications. Limnol. Oceanogr. 34 (8), 1545–1562. doi: 10.4319/lo.1989.34.8.1545
Munro D. R., Lovenduski N. S., Stephens B. B., Newberger T., Arrigo K. R., Takahashi T., et al. (2015). Estimates of net community production in the Southern Ocean determined from time series observations (2002–2011) of nutrients, dissolved inorganic carbon, and surface ocean pCO(2) in Drake Passage. Deep Sea Res. Part II: Topical Stud. Oceanogr. 114, 49–63. doi: 10.1016/j.dsr2.2014.12.014
Nevison C., Munro D., Lovenduski N., Cassar N., Keeling R., Krummel P., et al. (2018). Net community production in the southern ocean: insights from comparing atmospheric potential oxygen to satellite ocean color algorithms and ocean models. Geophysical Res. Lett. 45 (19), 549–510. doi: 10.1029/2018GL079575
Nowicki M., DeVries T., Siegel D. A. (2022). Quantifying the carbon export and sequestration pathways of the ocean’s biological carbon pump. Global Biogeochem. Cycles 36 (3), e2021GB007083. doi: 10.1029/2021GB007083
Ohman M. D., Davis R. E., Sherman J. T., Grindley K. R., Whitmore B. M., Nickels C. F., et al. (2019). Zooglider: an autonomous vehicle for optical and acoustic sensing of zooplankton. Limnol Oceanogr: Meth 17 (1), 69–86. doi: 10.1002/lom3.10301
Park K., Hahm D., Choi J. Ok, Xu S., Kim H.-C., Lee S. (2019). Spatiotemporal variation in summer net community production in the amundsen Sea polynya: a self-organizing map analysis approach. Continental Shelf Res. 184, 21–29. doi: 10.1016/j.csr.2019.07.001
Partee S., Ellis M., Rigazzi A., Bachman S., Marques G., Shao A., et al. (2021). Using machine learning at scale in numerical simulations with SmartSim: An application to ocean climate modeling. J. Comput. Sci. 62, 101707. doi: 10.1016/j.jocs.2022.101707
Passow U., Carlson C. A. (2012). The biological pump in a high CO2 world. Mar. Ecol. Prog. Ser. 470, 249–271. doi: 10.3354/meps09985
Racault M.-F., Quéré C. Le, Buitenhuis E., Sathyendranath S., Platt T. (2012). Phytoplankton phenology in the global ocean. Ecol. Indic. 14 (1), 152–163. doi: 10.1016/j.ecolind.2011.07.010
Roshan S., DeVries T. (2017). Efficient dissolved organic carbon production and export in the oligotrophic ocean. Nat. Commun. 8 (1), 1–8. doi: 10.1038/s41467-017-02227-3
Rudnick D. L. (2016). Ocean research enabled by underwater gliders. Annu. Rev. Mar. Sci. 8, 519–541. doi: 10.1146/annurev-marine-122414-033913
Saba V. S., Friedrichs M. A. M., Antoine D., Armstrong R. A., Asanuma I., Behrenfeld M. J., et al. (2011). An evaluation of ocean color model estimates of marine primary productivity in coastal and pelagic regions across the globe. Biogeosciences 8 (2), 489–503. doi: 10.5194/bg-8-489-2011
Sabine C. L., Feely R. A., Gruber N., Key R. M., Lee K., Bullister J. L., et al. (2004). The oceanic sink for anthropogenic CO2. science 305 (5682), 367–371. doi: 10.1126/science.1097403
Sammartino M., Marullo S., Santoleri R., Scardi M. (2018). Modelling the vertical distribution of phytoplankton biomass in the Mediterranean Sea from satellite data: a neural network approach. Remote Sens. 10 (10), 1666. doi: 10.3390/rs10101666
Sarma V. V. S. S. (2004). Net plankton community production in the Arabian Sea based on O2 mass balance model. Global biogeochemical cycles 18, (4). doi: 10.1029/2003GB002198
Sauzeède Raphaeülle, Claustre Hervé, Jamet C., Uitz J., Ras J., Mignot A., et al. (2015). Retrieving the vertical distribution of chlorophyll a concentration and phytoplankton community composition from in situ fluorescence profiles: a method based on a neural network with potential for global-scale applications. J. Geophysical Research: Oceans 120 (1), 451–470. doi: 10.1002/2014JC010355
Schulien J. A., Behrenfeld M. J., Hair J. W., Hostetler C. A., Twardowski M. S. (2017). Vertically-resolved phytoplankton carbon and net primary production from a high spectral resolution lidar. Optics Express 25 (12), 13577–13587. doi: 10.1364/OE.25.013577
Siegel D. A., Buesseler K. O., Behrenfeld M. J., Benitez-Nelson C. R., Boss E., Brzezinski M. A., et al. (2016). Prediction of the export and fate of global ocean net primary production: the EXPORTS science plan. Front. Mar. Sci. 3, 22. doi: 10.3389/fmars.2016.00022
Siegel D. A., Buesseler K. O., Doney S. C., Sailley S. F., Behrenfeld M. J., Boyd P. W. (2014). Global assessment of ocean carbon export by combining satellite observations and food-web models. Global Biogeochemical Cycles 28 (3), 181–196. doi: 10.1002/2013GB004743
Stanley R. H. R., Kirkpatrick J. B., Cassar N., Barnett B. A., Bender M. L. (2010). Net community production and gross primary production rates in the western equatorial pacific. Global Biogeochemical Cycles 24 (4), 1–17. doi: 10.1029/2009GB003651
Steinberg D. K., Landry M. R. (2017). Zooplankton and the ocean carbon cycle. Annu. Rev. Mar. Sci. 9, 413–444. doi: 10.1146/annurev-marine-010814-015924
Stukel M. R., Kahru M., Benitez-Nelson C. R., Décima M., Goericke R., Landry M. R., et al. (2015). Using l agrangian-based process studies to test satellite algorithms of vertical carbon flux in the eastern n orth p acific O cean. J. Geophysical Research: Oceans 120 (11), 7208–7222. doi: 10.1002/2015JC011264
Stukel M. R., Ohman M. D., Benitez-Nelson C. R., Landry M. R. (2013). Contributions of mesozooplankton to vertical carbon export in a coastal upwelling system. Mar. Ecol. Prog. Ser. 491, 47–65. doi: 10.3354/meps10453
Teeter L., Hamme R. C., Ianson D., Bianucci L. (2018). Accurate estimation of net community production from O2/Ar measurements. Global Biogeochemical Cycles 32 (8), 1163–1181. doi: 10.1029/2017GB005874
Tilstone G. H., Xie Y.-y., Robinson C., Serret P., Raitsos D. E., Powell T., et al (2015) Satellite estimates of net community production indicate predominance of net autotrophy in the Atlantic ocean.” Remote Sens. Environ. 164, 254–269 doi: 10.1016/j.rse.2015.03.017
Tripathy S. C., Ishizaka J., Siswanto E., Shibata T., Mino Y. (2012). Modification of the vertically generalized production model for the turbid waters of ariake bay, southwestern Japan. Estuarine Coast. Shelf Sci. 97, 66–77. doi: 10.1016/j.ecss.2011.11.025
Werdell P.J., Behrenfeld M. J., Bontempi P. S., Boss E., Cairns B., Davis G. T., et al. (2019). The plankton, aerosol, cloud, ocean ecosystem mission: status, science, advances. Bull. Am. Meteorological Soc. 100 (9), 1775–1794. doi: 10.1175/BAMS-D-18-0056.1
Westberry T., Behrenfeld M. J., Siegel D. A., Boss E. (2008). Carbon-based primary productivity modeling with vertically resolved photoacclimation. Global Biogeochemical Cycles 22 (2), 1–18. doi: 10.1029/2007GB003078
Westberry T. K., Williams P. J.le B., Behrenfeld M. J. (2012). Global net community production and the putative net heterotrophy of the oligotrophic oceans. Global Biogeochemical Cycles 26 (4), 1–17. doi: 10.1029/2011GB004094
Xie F., Tao Z., Zhou X., Lv T., Wang J. (2019). Spatial and temporal variations of particulate organic carbon sinking flux in global ocean from 2003 to 2018. Remote Sens. 11 (24), 2941. doi: 10.3390/rs11242941
Yang Bo. (2021). Seasonal relationship between net primary and net community production in the subtropical gyres: insights from satellite and argo profiling float measurements. Geophysical Res. Lett. 48 (17), e2021GL093837. doi: 10.1029/2021GL093837
Yang Bo, Emerson S. R., Peña M.A. (2018). The effect of the 2013–2016 high temperature anomaly in the subarctic northeast pacific (the “Blob”) on net community production. Biogeosciences 15 (21), 6747–6759. doi: 10.5194/bg-15-6747-2018
Yang Bo, Fox J., Behrenfeld M. J., Boss E. S., Haëntjens N., Halsey K. H., et al. (2021). In situ estimates of net primary production in the western north Atlantic with argo profiling floats. J. Geophysical Research: Biogeosciences 126 (2), e2020JG006116. doi: 10.1029/2020JG006116
Keywords: remote sensing, net community production, carbon export efficiency, biological pump, net primary production
Citation: Wang Y, Wang K, Bai Y, Wu D and Zheng H (2023) Research progress in calculating net community production of marine ecosystem by remote sensing. Front. Mar. Sci. 10:1191013. doi: 10.3389/fmars.2023.1191013
Received: 21 March 2023; Accepted: 16 May 2023;
Published: 01 June 2023.
Edited by:
Xiangbin Ran, Ministry of Natural Resources, ChinaReviewed by:
Yonghui Gao, Shanghai Jiao Tong University, ChinaCopyright © 2023 Wang, Wang, Bai, Wu and Zheng. This is an open-access article distributed under the terms of the Creative Commons Attribution License (CC BY). The use, distribution or reproduction in other forums is permitted, provided the original author(s) and the copyright owner(s) are credited and that the original publication in this journal is cited, in accordance with accepted academic practice. No use, distribution or reproduction is permitted which does not comply with these terms.
*Correspondence: Kui Wang, a3dpQHpqdS5lZHUuY24=
Disclaimer: All claims expressed in this article are solely those of the authors and do not necessarily represent those of their affiliated organizations, or those of the publisher, the editors and the reviewers. Any product that may be evaluated in this article or claim that may be made by its manufacturer is not guaranteed or endorsed by the publisher.
Research integrity at Frontiers
Learn more about the work of our research integrity team to safeguard the quality of each article we publish.