
95% of researchers rate our articles as excellent or good
Learn more about the work of our research integrity team to safeguard the quality of each article we publish.
Find out more
ORIGINAL RESEARCH article
Front. Mar. Sci. , 31 July 2023
Sec. Marine Biogeochemistry
Volume 10 - 2023 | https://doi.org/10.3389/fmars.2023.1190677
This article is part of the Research Topic Multi-scale Variability of Ecosystem Functioning in European and Chinese Shelf Seas View all 16 articles
The dilution experiment technique was used in two cruises in July-August (summer) and October-November (autumn) 2020, with a total of 14 stations. The grazing impact of microzooplankton on phytoplankton in the interior of Bohai Bay was comprehensively investigated. We compared phytoplankton growth rates (μ0) and microzooplankton grazing rates (m) spatially (distance between experimental stations and shore far vs. near) and seasonally (summer vs. autumn). Both m and μ0 values were significantly higher in summer than in autumn, and the phytoplankton growth rate μ0 was positively correlated to temperature. Offshore stations showed higher values. There is no significant spatial and seasonal differences in the ratio of microzooplankton grazing rate and phytoplankton growth rate (m/μ0) indicating that daily consumption of primary production by microzooplankton was similar in the two seasons. Therefore, our research showed a close coupling between microzooplankton grazing with phytoplankton growth in the Bohai Bay.
Phytoplankton is the most fundamental component of the marine biological network, the leading primary producer, and plays a crucial role in the marine ecosystem. Photosynthesis of phytoplankton in the marine food web directly converts inorganic carbon to organic carbon (Sun et al., 2013). Microzooplankton are the zooplankton with body lengths of less than 200 μm. It includes ciliates, heterotrophic dinoflagellates, and flagellates which consume most of the primary production and affect the community composition of phytoplankton (Landry and Calbet, 2004; Banse, 2007; Jyothibabu et al., 2008). Microzooplankton is the main phytoplankton grazers and can control phytoplankton growth through grazing, known as “top-down” control, and can also influence phytoplankton growth due to “bottom-up effects” of nutrient availability (e.g., nitrogen, phosphorus, silicon, and iron) (Landry and Hassett, 1982; Landry and Calbet, 2004; Strom et al., 2007; Schmoker et al., 2013).
Since Landry and Hassett proposed the dilution method in 1982, it has been widely used to estimate phytoplankton growth and microzooplankton grazing rate in marine ecosystems. However, the increasing utilization of this method has faced criticism and has been the subject of ongoing improvements (Landry and Hassett, 1982; Dolan and McKeon, 2005; Schmoker et al., 2013). The ratio of the microzooplankton grazing rate to the phytoplankton growth rate (m/μ0) is a crucial parameter that influences the efficiency of the biological pump. It quantifies the fraction of primary production consumed by microzooplankton, with the remainder being either consumed by mesozooplankton or sinking out of the euphotic zone (Landry et al., 1998a; Landry et al., 2003). A higher m/μ0 indicated a more active microbial food web in the region. The m/μ0 ratio is often reasonably believed to be greater in oligotrophic waters where phytoplankton are dominated by small-sized species which are more edible for microzooplankton, whereas in eutrophic waters, mesozooplankton grazing and sinking should be more important for the loss of phytoplankton production, contributing to greater efficiency of carbon export than in oligotrophic waters (Laws, 2003). Using a global dataset, Calbet and Landry (2004) showed that the mean value of m/μ0 decreased from 70% in the oligotrophic seas to about 60% in coastal and estuarine areas, although they did not find a significant correlation between m/μ0 and Chlorophyll a (Chl a) concentration in the pooled dataset of all dilution experiments. Liu et al. (2002) observed that in the Bering Sea, where diatoms dominate the taxa, only one-third of the daily primary production was consumed by microzooplankton because perhaps some diatoms were too large to be effectively grazed. In a separate study by Strom et al. (2007). in the coastal Gulf of Alaska, the authors examined the relationship between microzooplankton grazing rates and phytoplankton size. Their findings indicated that microzooplankton grazing rates were generally lower for large phytoplankton (>20 μm) compared to small phytoplankton (<20 μm) within this specific marine environment. Furthermore, Chen and Liu (2010) demonstrated a negative correlation between the m/μ0 ratio and mean phytoplankton size, indicating that as the average size of phytoplankton increased, the ratio of microzooplankton grazing rate to phytoplankton growth rate decreased.
Seawater temperature is another important factor that may decouple phytoplankton growth and microzooplankton grazing rates. Caron (2007) showed that maximal zooplankton growth rate increases faster with temperature than maximal phytoplankton growth rate. Quantitatively, the slope between the growth rate of ln phytoplankton and temperature was 0.06 (Q10 = 1.82), and the slope between the growth rate of ln herbivorous microzooplankton and temperature was 0.10 (Q10 = 2.72) The implication is that other things being equal, m/μ0 should increase with temperature with a Q10 of 1.49. According to a global database, Schmoker et al. (2013) found that seasonal variations in phytoplankton communities and environmental parameters caused seasonal change in microzooplankton grazing and phytoplankton growth in temperate, polar, and subpolar regions. However, there is a need for further studies on phytoplankton growth and microzooplankton grazing in coastal nearshore areas (Landry et al., 1995; Landry et al., 1998b; Caron and Dennett, 1999; Landry et al., 2011; Chen et al., 2013).
Bohai Bay is a typical inland semi-enclosed bay in the southwestern Bohai Sea. It is connected to the central Bohai Sea on the east and surrounded by several major coastal cities on the other three sides. There are many factories, farmlands, and aquaculture bases in the city. A lot of pollutants such as nitrogen and phosphorus generated by human activities can enter the ocean through surface runoff and rivers, leading to the eutrophication of seawater and thus affecting the marine ecosystem of the Bohai Bay (Wang et al., 2013; Liu et al., 2022). Through hydrodynamic model simulations, there are two eddies inside Bohai Bay, one of which is a counterclockwise eddy in the southern part of the estuary, and the other is a clockwise eddy in the northwestern part of the bay. At the same time, there is a relatively stable counterclockwise wake circulation in the bay (Ma et al., 2014). Driven by the currents, seawater from the Yellow Sea will flow from the north of the Bohai Strait to the middle of the Bohai Sea, then enter the north side of the mouth of the Bohai Bay through Liaodong Bay, and finally flow from the south side of the mouth of the Bohai Bay. As the connection between the coastal land area and the central Bohai Sea, Bohai Bay is influenced by the circulation of the Yellow and Bohai Seas and human activities. Therefore, it has become increasingly important to investigate the condition of the marine ecosystem environment within Bohai Bay (Lin et al., 2001; Ma et al., 2014).
Based on the above basis, we try to test the following two hypotheses: (i) is phytoplankton growth rate (μ0) higher in summer than in autumn due to temperature difference? (ii) will the phytoplankton growth rate decrease due to the decrease in nutrient supply rate and the m/μ0 ratio show an increasing change? In this study, the spatial and seasonal characteristics of plankton ecosystem of Bohai Bay were investigated. It included temperature, salinity, nutrients, chlorophyll a, and phytoplankton communities, using dilution methods to determine phytoplankton growth and microzooplankton grazing rates. Based on these data, we investigated the spatial and seasonal variation in phytoplankton growth rates and microzooplankton grazing rates. The relationship between these parameters and environmental factors (e.g., temperature and nutrients) was explored. We also investigated the relationship between phytoplankton growth rates and microzooplankton grazing rates, which was critical for understanding coastal marine ecological food web structure, nutrient cycling, and carbon export (Steinberg and Landry, 2017). The outcome of this study can provide useful references for understanding marine planktonic ecosystems and the cycling of essential elements.
Dilution experiments were conducted at a total of 14 stations during two cruises, one during the summer (22 July to 4 August 2020; 8 stations) and the other in autumn (22 October to 6 November 2020; 6 stations) in the Bohai Bay, aboard the “JinHan 04700” (Figure 1). To identify the spatial distance, we divided the stations into three categories based on their distance to continent. Where region I is less than 35 km from land, II is between 35 km and 111 km, and region III is more than 111 km from land (Figure 1).
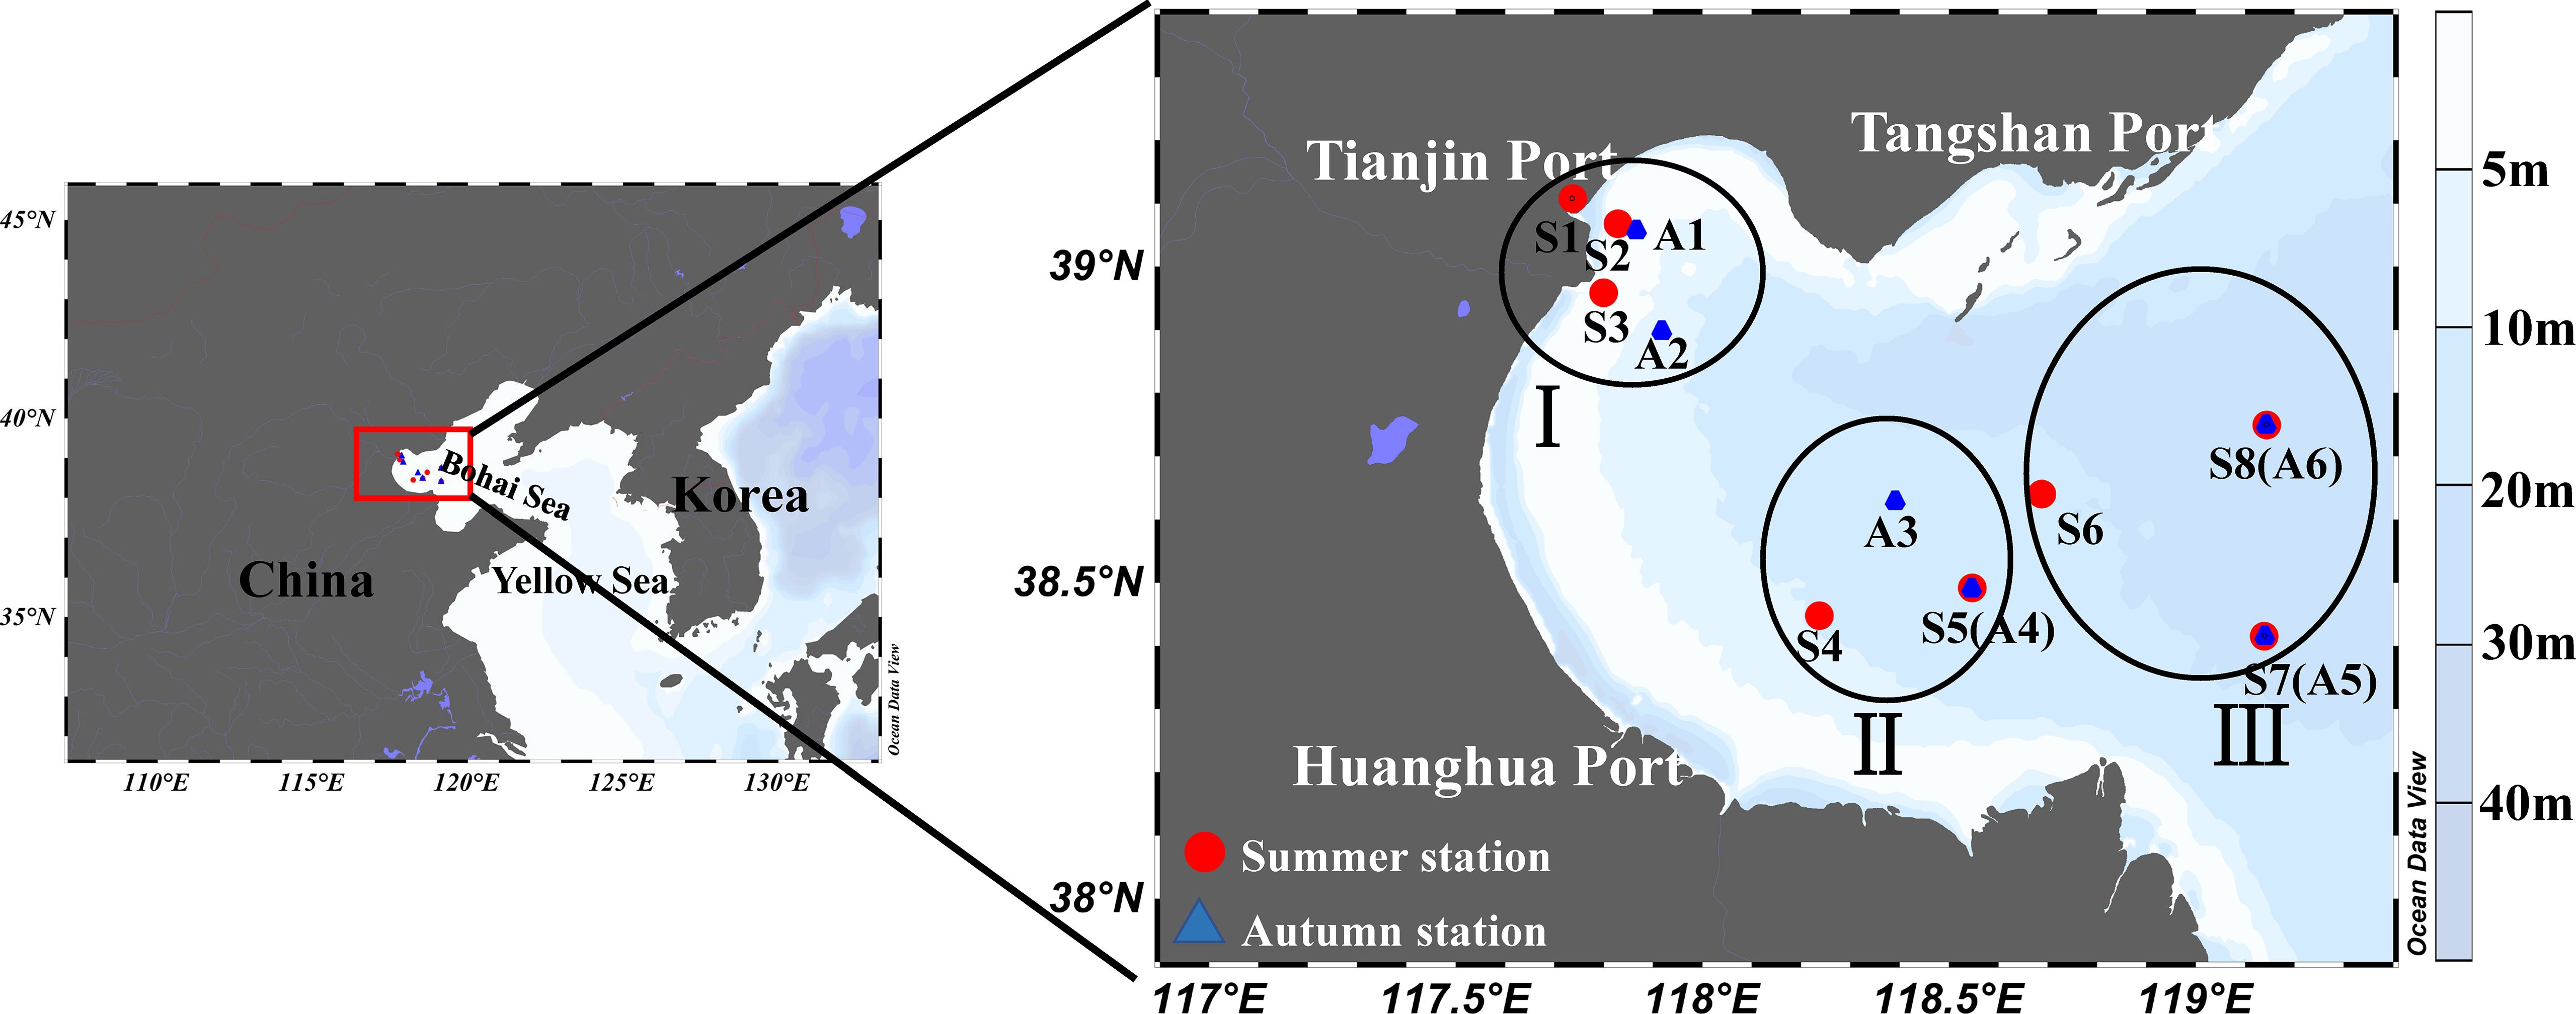
Figure 1 Map of experimental stations in the Bohai Bay, China. The distance from land is less than 35 km (I), between 35 km and 111 km (II), and more than 111 km (III).
The seawater used for the dilution experiment was collected from a depth of 1 m using a clean ZKS-C01H reinforced marine glass water sampler (5L). Then it was first pre-screened through a nylon mesh filter (200 μm) sieve with gravity filtration and slowly poured into a polycarbonate bottle called raw seawater and then filtered through 0.7 μm pore-size membrane (Whatman GF/F, USA) filter to obtain particle-free seawater. In the dilution experiments, particle-free seawater was diluted at 10%, 25%, 50%, 75%, and 100% dilution multiples of the original seawater and slowly poured into 350 ml clean polycarbonate bottles in triplicate. All bottles were incubated for 24 h in a seawater bath with flow through surface seawater and covered by a mesh to reduce irradiance at a depth of 1 meter. All containers, bottles, and filters were soaked in 10% HCl for over 24 hours and cleaned with deionized water and Milli-Q water before departure on each survey cruise. To follow the assumptions of the dilution experiment (Landry and Hassett, 1982), additional nutrients were added to all culture flasks (within the cultivation system concentration of 20 μmol/L NaNO3, 1.25 μmol/L KH2PO4, 20 μmol/L Na2SiO3, and 1.0 nmol/L FeSO4) to ensure that the phytoplankton would grow stably. A non-filtered seawater bottle without nutrients added is set as a control for each dilution group.
Before the start of each culture experiment, 150 ml of raw seawater was collected and filtered through a 25 mm Whatman GF/F glass fiber filter under less than 0.02 MPa pressure conditions to obtain the initial Chl a concentration. After filtration, the samples were stored in dark at -20°C. For each incubation bottle, the same procedures were used to determine Chl a concentrations to calculate microzooplankton grazing rates and phytoplankton growth rates after incubation. Using 100 ml of raw seawater was filtered through 0.45 μm acetate membrane and stored at -20°C for nutrient analysis. Before initializing culturing, 1 L seawater was fixed with formaldehyde (final concentration 1%) to identify the phytoplankton community. These samples were stored cool in dark until they were returned to the laboratory for identification using the Utermöhl method (Hans, 1958).
At each station, seawater samples were collected using 6 L Niskin bottles equipped with a Sea-bird CTD (Conductivity, Temperature, and Depth; SBE 19 Plus) rosette sampler. Temperature and salinity were recorded in situ at the same time using the CTD sensors. The filters of Chl a samples were extracted with 5 ml 90% acetone and stored in dark for 24h at -20°C. Then the Chl a concentrations were measured with a Turner-Designs Trilogy fluorometer (Welschmeyer, 2003). Nutrients including phosphate (), ammonium (), nitrate (), nitrite (), and silicate () were analyzed using the Technicon Auto-Analyzer 3 (Bran + Luebbe, SEAL, Germany) (Hansen and Koroleff, 2007). For quantitative and qualitative analysis of phytoplankton communities, it is necessary to precipitate a 1 L sample for 24 h and then concentrate it to 10 ml, siphon the supernatant, and then measure it under an inverted microscope at a magnification of 200× or 400× and count it according to the Utermöhl method (Hans, 1958).
According to the calculation and analysis steps of the dilution experiment proposed by Landry and Hassett (1982) and an assumed exponential growth model, the net growth rate (kd) of phytoplankton under dilution conditions can be calculated according to the equation:
Where d is the dilution ratio (the proportion of unfiltered seawater), and t is incubation time. Pt is the concentration of Chl a after incubation, and P0 is the concentration of Chl a before initial incubation. The phytoplankton growth rate (μn, d-1) and microzooplankton grazing rate (m, d-1) were calculated by least squares regression between kd and the actual dilution factor. The m and μn values were calculated as the absolute value of the slope and the intercept of the linear regression equation, respectively. In situ, phytoplankton instantaneous growth rates (μ0, d-1) were calculated as the sum of grazing rates (m) and net growth rate in control bottles without added nutrients (Landry, 1993). The nutrient limitation index, which indicates the adequacy of nutrients for phytoplankton growth, is assessed by the ratio of μ0/μn, which generally varies with the nutrient status within the ecosystem (Landry et al., 1998b). In contrast, the impact of microzooplankton grazing on phytoplankton growth is generally assessed by the ratio of the microzooplankton grazing rate to the phytoplankton growth rate (m/μ0) and measures the extent to which daily phytoplankton production is taken up and consumed by microzooplankton (Landry et al., 1998b).
A station map was created using Ocean Data View 5.6.2 (ODV). Color scatter diagrams and linear regressions were processed by OriginPro 2021. All calculations in this study were performed using SPSS 14.0. Tukey’s test (t-test) was used to compare differences in parameters, and Pearson’s test was used to test correlations between variables.
The basic parameters of the hydrological environment for 14 survey stations in two cruises in different seasons were shown in Table 1. It can be seen that the surface seawater temperature varied significantly between the two seasons. In summer, the temperature was always above 25°C, with a range of 25.69 to 28.92°C and an average of 27.21±1.12°C (Arithmetic mean±S.D.). Autumn temperature ranged from 15.11 to 17.32°C, with an average temperature of 16.02±0.74°C. Seasonal temperature difference reached 10°C or more. While the difference in surface salinity was very small, the range of surface salinity in summer was 25.60 to 31.92, and the average value was 30.38±2.09. Autumn surface salinity ranged from 29.39 to 31.82, with an average of 30.93±0.91. Therefore, it can be seen that the temperature tended to decrease from west to east in the study area, while the salinity tended to decrease in the opposite direction (Table 1). The nutrient concentrations of surface seawater varied considerably among the survey stations. The NOx (nitrate plus nitrite) concentration at station S3 was 15.45 μmol/L and the lowest NOx concentration at station S6 was only 0.31 μmol/L. Silicate concentrations vary from 0.30 to 5.92 μmol/L in summer and from 1.77 to 5.41 μmol/L in autumn. Phosphate concentrations at all stations were low in both seasons, ranging from 0.13 to 1.10 μmol/L in summer and 0.04 to 0.24 μmol/L in autumn. Except for station S1 where the ammonium concentration was very high at 12.00 μmol/L, the concentrations at the remaining stations ranged from 0.74 to 3.26 μmol/L, and the autumn range was 0.45 to 0.96 μmol/L (Table 1). In summer, all nutrient parameters were higher at station S1 than other stations, primarily due to the station’s proximity to the land bank and the opening of the river reservoir during operation.
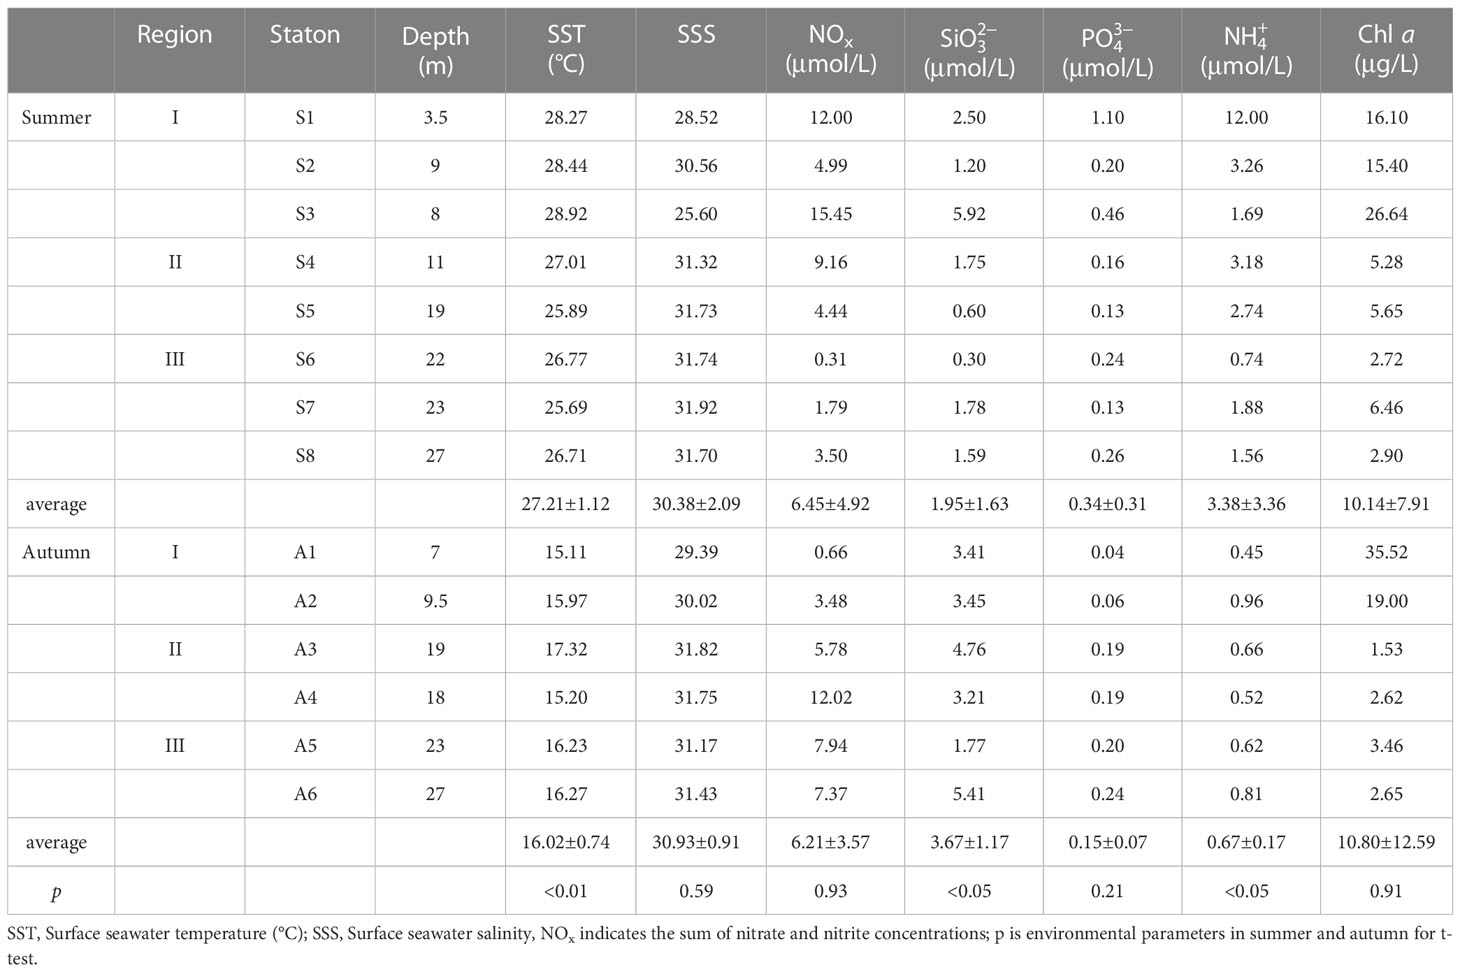
Table 1 Background information on hydrological and environmental parameters at the experimental stations.
Chl a concentrations ranged from 2.72 to 26.64 μg/L with an average of 10.14±7.91 μg/L in summer and ranged from 1.53 to 35.52 μg/L with an average of 10.82±12.95 μg/L in autumn, respectively. The differences in Chl a concentrations between summer and autumn in the same area were insignificant (paired Wilcoxon test, p>0.05). Spatially, the Chl a concentration showed a decreasing trend in both seasons in the order of I, II, and III (Table 1).
There were significant differences in environmental parameters in summer and autumn (Table 1). The surface seawater temperature in summer (27.21±1.12)°C was significantly higher than that in autumn (16.02±0.74)°C (t-test, p<0.01), While the surface seawater salinity (t-test, p=0.59) and the concentrations of Chl a (t-test, p=0.91) The difference between the two seasons were not statistically significant. The silicate concentrations in summer (1.95±1.63) μmol/L were less than in autumn (3.67±1.17) μmol/L (t-test, p<0.05), and the ammonium concentrations were higher in summer than in autumn (t-test, p<0.05).
The results of Pearson correlation analysis between different environmental parameters in two seasons were shown in Figure 2. The results obtained from different seasons were also different. Chl a concentrations were significantly and positively correlated (p<0.01 or p<0.05) with SST, silicate, and NOx concentrations during summer, showed a significant negative correlation with SSS (p<0.001) (Figure 2A). Chl a concentrations showed a negative correlation (p<0.01 or p<0.05) with SST, phosphate, and NOx in autumn (Figure 2B). NOx was positively correlated with silicate and SST (p<0.01 or p<0.05) and negatively correlated with SSS (p<0.01) in summer (Figure 2A). In contrast, it showed a positive correlation with SSS only in autumn (p<0.05) (Figure 2B).
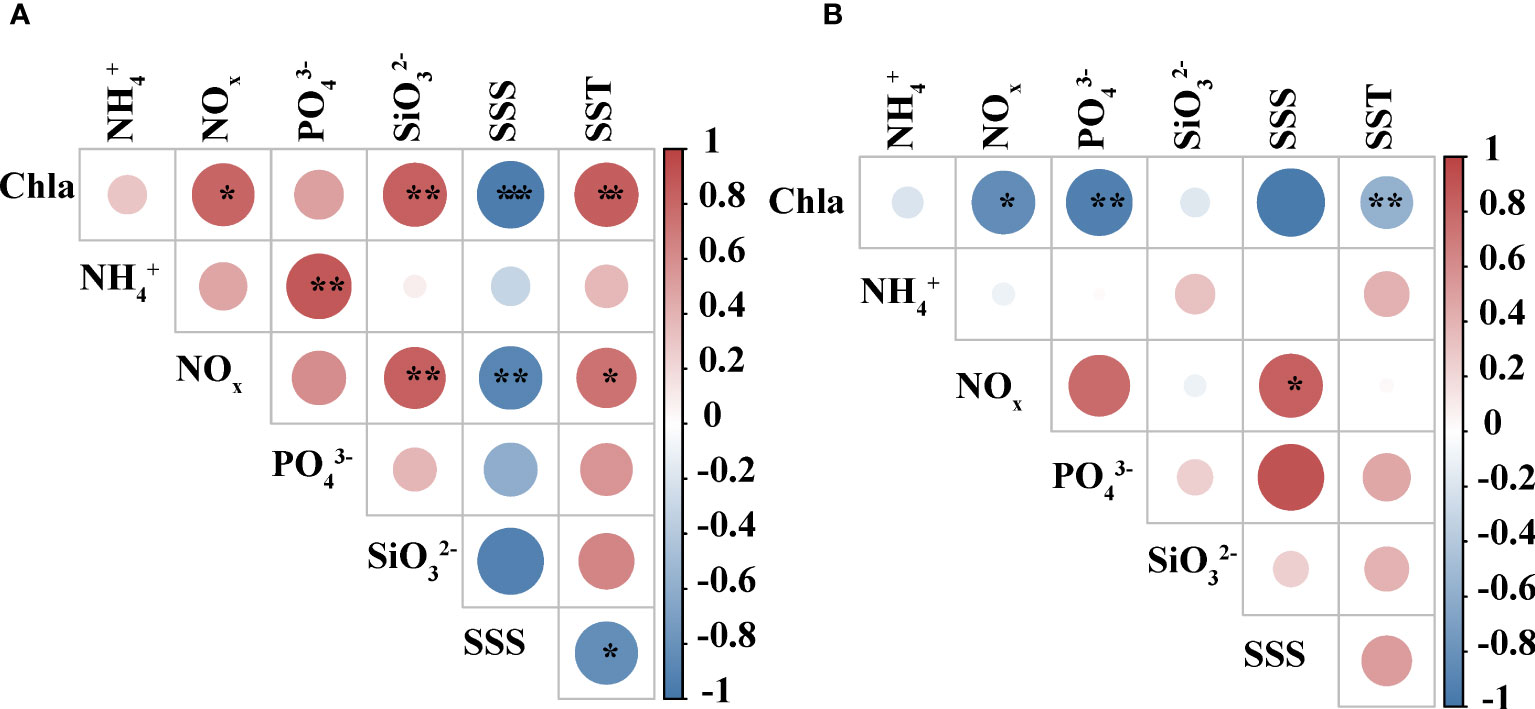
Figure 2 Correlation analysis among different environmental factors. (A) summer (B) autumn. The color and size of the circles represent Pearson’s correlation coefficient (r). *, **, and ***represents a significance level of p<0.05, p<0.01, and p<0.001, respectively.
A total of 79 species in 54 genera of phytoplankton belonging to Bacllariophyta, Dinophyta, Chlorophyta, Chrysophyta, and Cyanophyta were identified in the initial phytoplankton samples collected from 12 stations in two seasons (The station data of S6 and A6 were missing due to failed sampling). Among them, Cyanobacteria are only found in the summer. Bacllariophyta was the most diverse group in both summer and autumn, with 12 genera and 18 species in summer and 17 genera and 31 species in autumn. The species composition of dinophyta was also significant, with 9 genera and 12 species in summer, and 10 genera and 12 species were found in the autumn. Chlorophyta and Chrysophyta were observed in both seasons but in small numbers (Table 2).
The minimum phytoplankton abundance in summer was 2,560 cells/L, the maximum value was 185,960 cells/L, and the mean value was 43,706 cells/L. In autumn, the minimum value was 5,240 cells/L, and the maximum value was 94,060 cells/L, with a mean value of 42,168 cells/L. The difference in phytoplankton abundance between the two seasons was not significant. However, in terms of cell abundance, the stations with a large proportion of Dinophyta were more abundant. The summer Dinophyta accounted for 68% of the total phytoplankton abundance, and its dominant species was Prorocentrum dentatum (Figure 3). The mean cell abundance of 40 cells/L (station S5) ~115,000 cells/L (station S3) was 16,451 cells/L. In autumn, it reached 60% of the total phytoplankton abundance. The dominant species was Akashiwo sanguine, with cell abundance ranging from 560 cells/L (station A3) to 82,500 cells/L (station A1), with an average abundance of 24,132 cells/L. The composition of the phytoplankton community at each station is shown in Figure 3. The abundance of Dinophyta was higher than that of Bacllariophyta at most of the stations in both seasons, and the dominant Bacllariophyta at most of the stations in summer were Paralia sulcata, Thalassiosira sp., and Guinardia delicatula. The dominant algae of Dinophyta are Prorocentrum dentatum and Gymnodinium sp. In autumn, the dominant species of Bacllariophyta are Paralia sulcata, Schröderella delicatula, and Pseudo-nitzschia delicatissima. The dominant Dinophyta are Akashiwo sanguine and Gymnodinium sp.
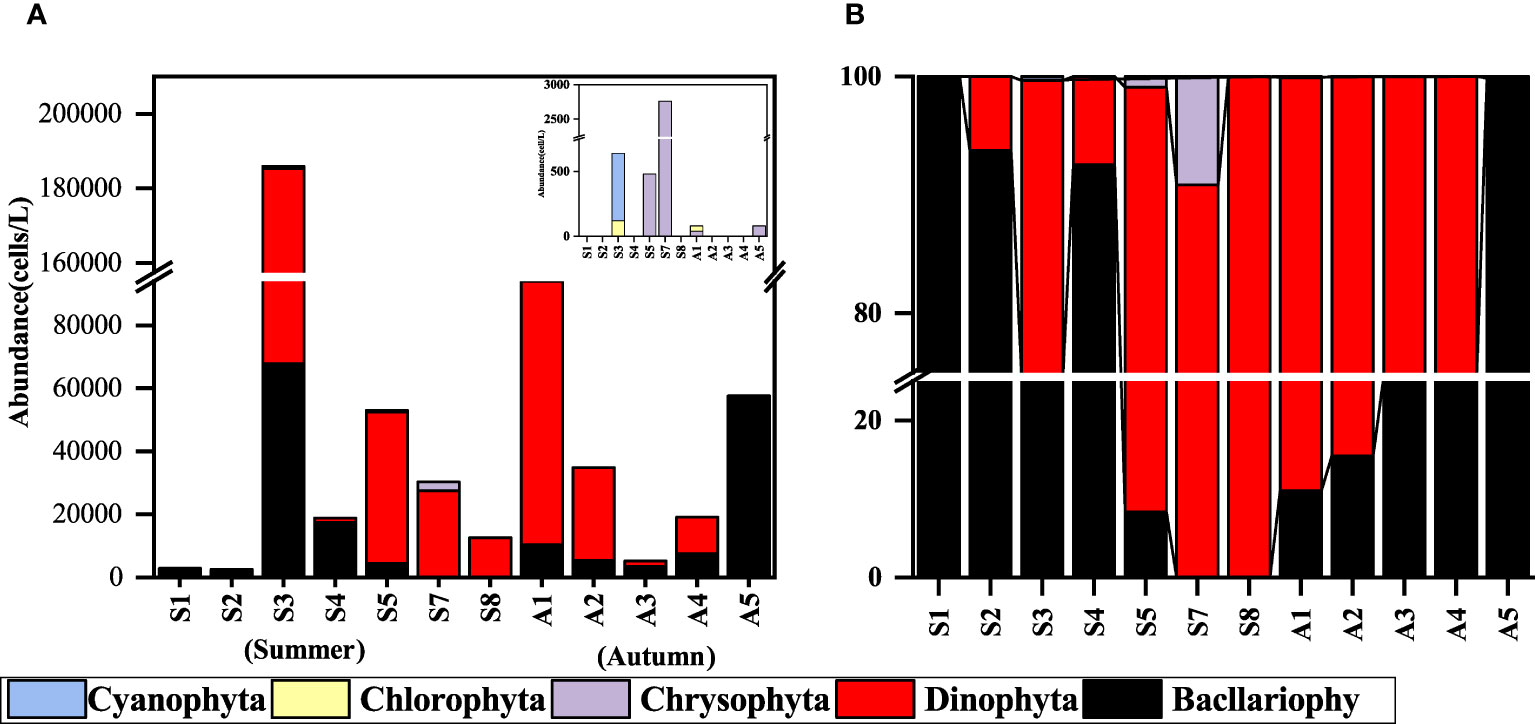
Figure 3 Phytoplankton community composition at each experimental station. (A) abundance (cells/L); (B) proportion (%). (The station data of S6 and A6 were missing due to failed sampling).
Microzooplankton grazing rates (m) and phytoplankton growth rates (μ0) at the investigated experimental stations are shown in Table 3. The microzooplankton grazing rates were 1.42±0.78 d-1 and 0.53±0.42 d-1 in summer and autumn, respectively, when data from each region were integrated, and data collected in summer was significantly higher than in autumn (t-test, p<0.05) (Figure 4A, Table 4). Phytoplankton growth rates were 1.80±0.78 d-1 and 0.58±0.51 d-1for summer and autumn, and growth rates were significantly higher in summer than in autumn, which is similar to the patterns of grazing rates (t-test, p<0.01) (Figure 4B, Table 4). In contrast, the proportion of daily primary production consumed by microzooplankton (m/μ0) did not differ significantly between the two seasons, Summer (Average value ± Standard deviation, 0.85±0.43) and autumn (1.33±0.98) (t-test, p>0.05) (Figure 4C, Table 4).
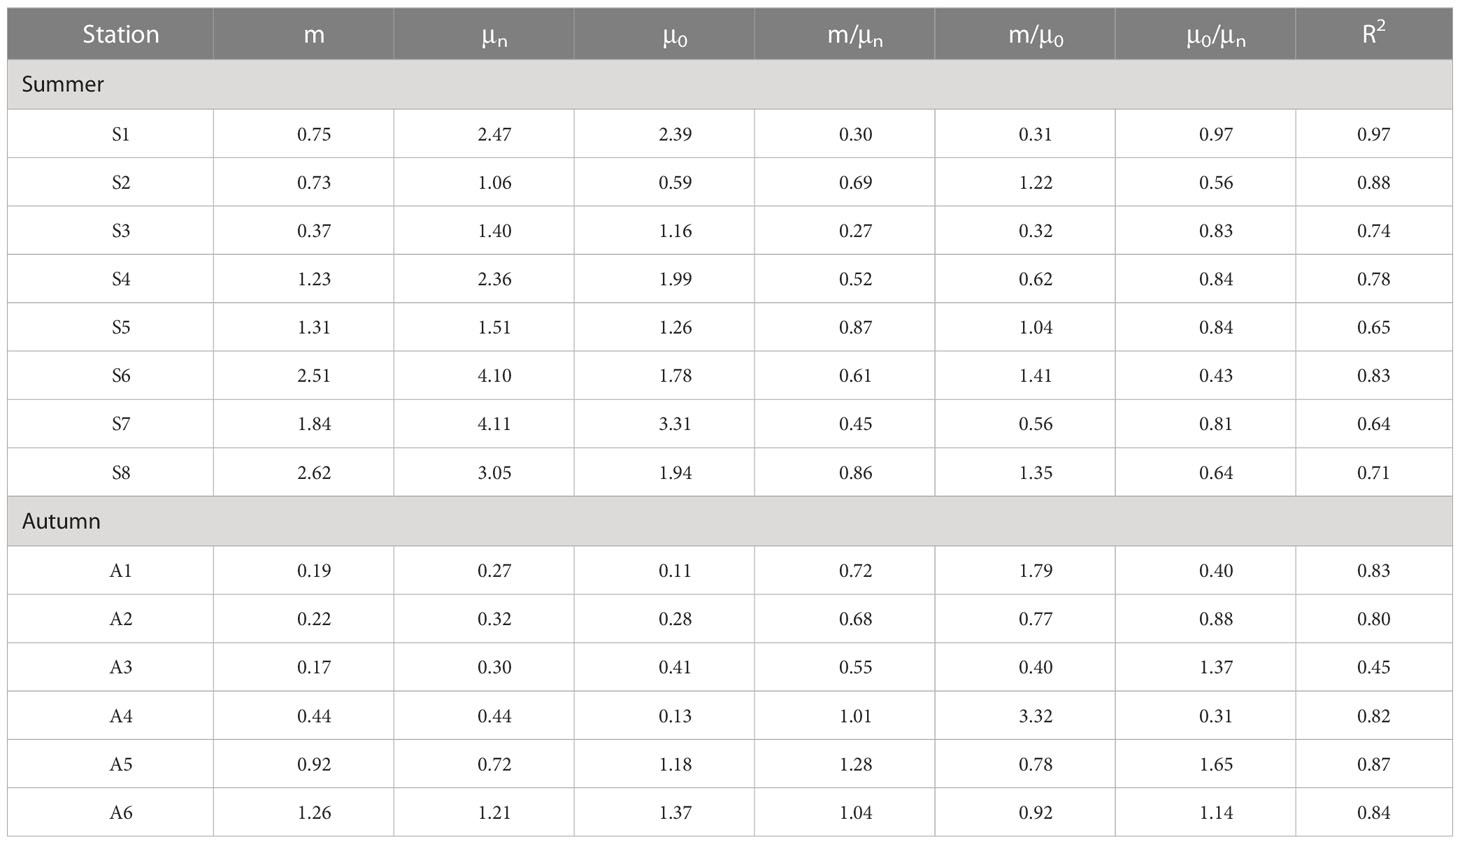
Table 3 Summary result of the phytoplankton growth rates (μ, d-1), microzooplankton grazing rates (m, d-1) phytoplankton growth rate with nutrient enrichment (μn), phytoplankton instantaneous growth rate (μ0). and related parameters for all experimental stations in the Bohai Bay in the summer and autumn of 2020.
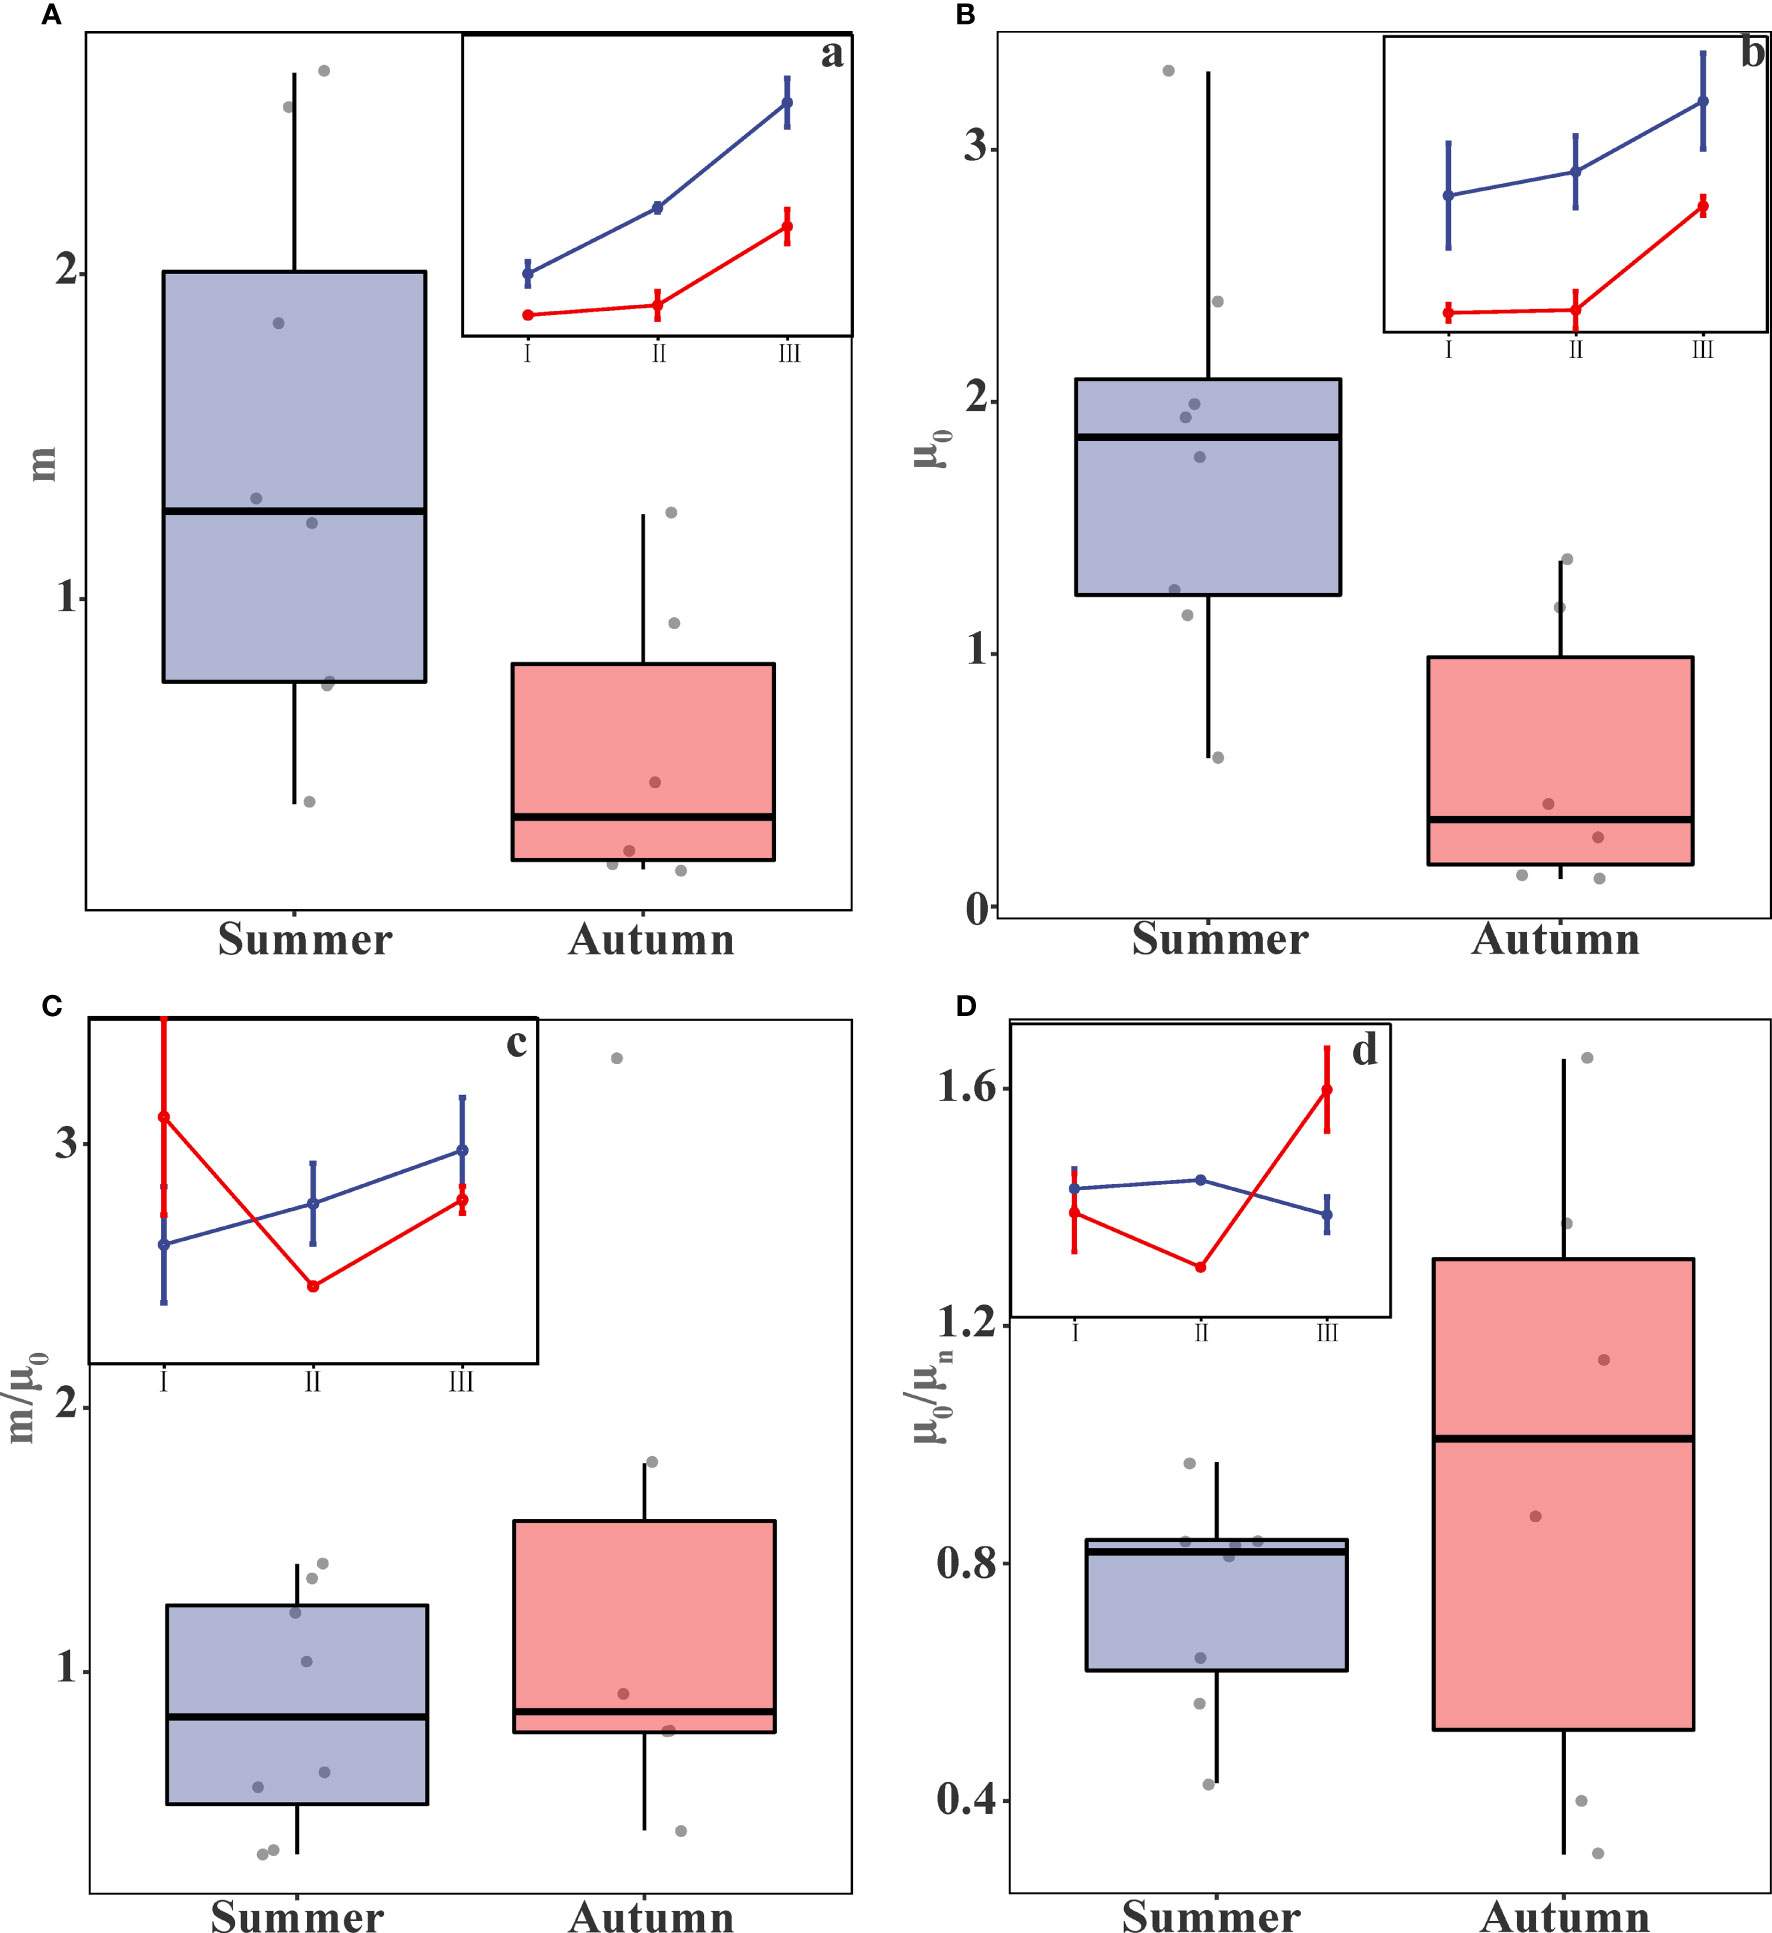
Figure 4 Box plots of the (A) microzooplankton grazing rates (m), (B) phytoplankton growth rates (μ0), (C) m/μ0, and (D) μ0/μn (where a, b, c, and d represent the trend plots of each parameter by region in different seasons).
The nutrient limitation index (μ0/μn) exhibited a wide distribution range in this study. In summer, the index ranged from 0.43 to 0.97 with an average value of 0.74±0.17. In Autumn, the range expanded from 0.31 to 1.65, with an average value of 0.96±0.49 (Table 3, 4). The wide distribution of nutrient limitation indices indicated that the nutrient composition of the stations differed significantly. In autumn, the ratio reached 0.96 on average, which indicated that the phytoplankton growth rate (μn) obtained after nutrient addition treatment (μ0) was essentially the same as that of the control group without nutrient addition, there was no nutrient limitation in the autumn. The mean value of nutrient limitation index (μ0/μn) in summer was only 0.77 and the ratios of μ0/μn for all 8 stations were less than 1, indicating that nutrients had become a limiting factor for phytoplankton growth in summer. However, the differences between the two seasons were not statistically significant and did not show differences (t-test, p>0.05) (Figure 4D, Table 4).
The phytoplankton growth rates (μ0) were higher in summer than in autumn, which might be related to high temperature in summer, Because μ0 was positively correlated with temperature in the combined data analysis (p<0.05) (Figure 5A), it did not show a correlation with Chl a concentration (p>0.05) (Figure 5B). The microzooplankton grazing rates (m) showed a negative correlation with the concentration of Chl a (p<0.05) (Figure 5C). However, m did not show a correlation with temperature (only an upward trend was shown). This is also consistent with the relationship between grazing rate and temperature found by Liu et al. (2021) in the ecological theory of metabolism (Figure 5D). The m/μ0 ratios did not correlate with either temperature or Chl a (Figures 5E, F).
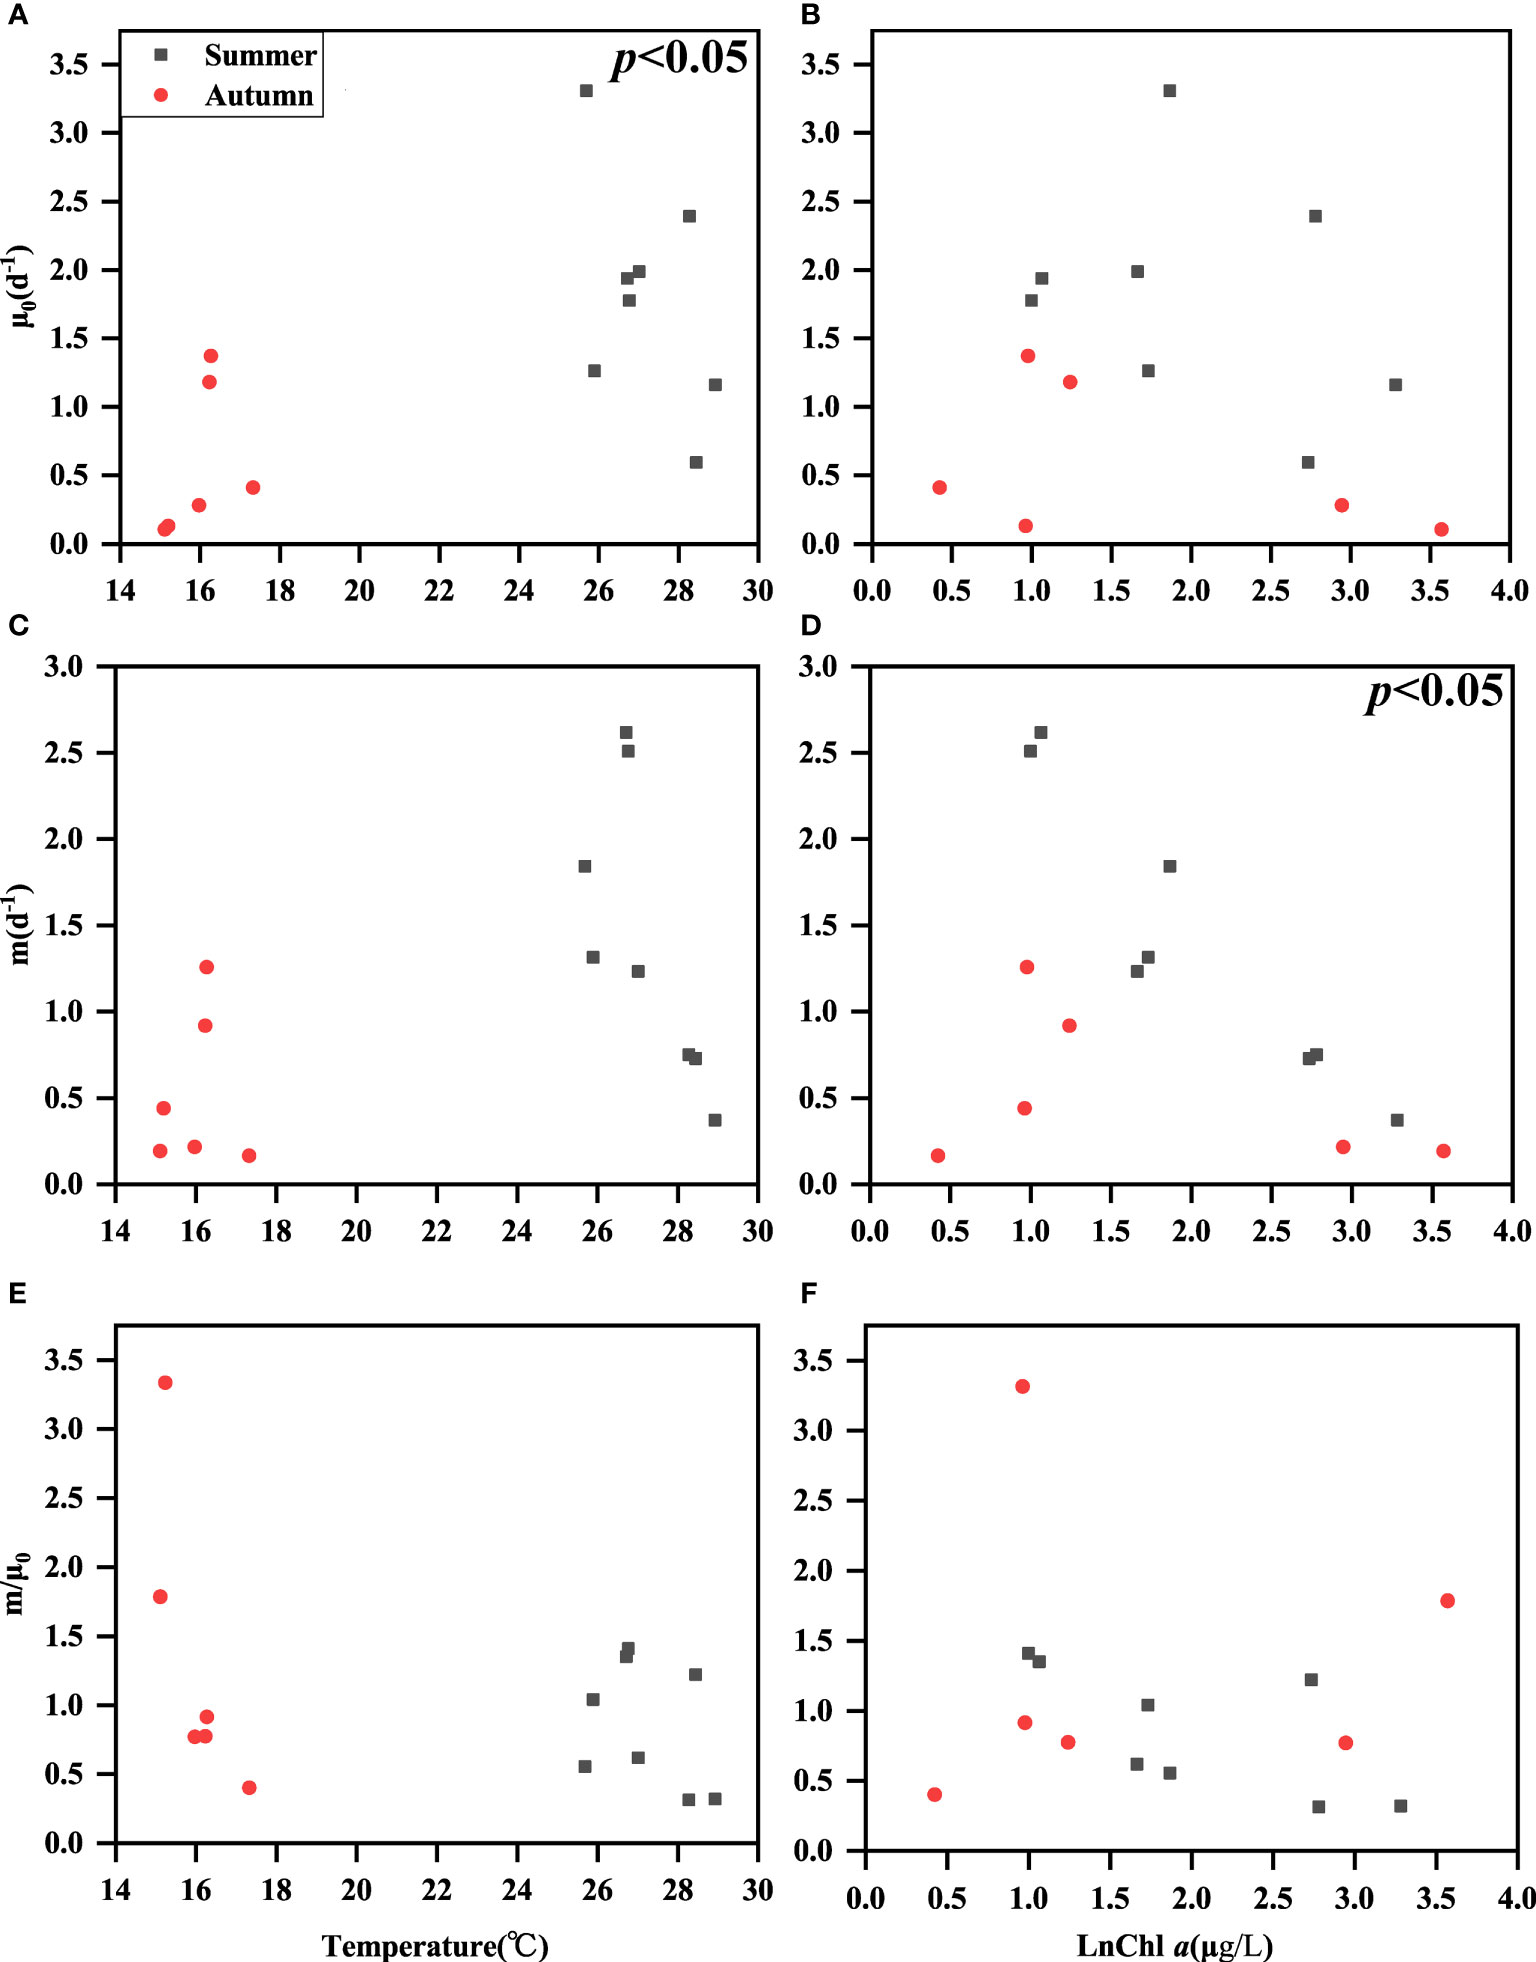
Figure 5 Relationships among surface seawater temperature and ln Chl a concentration with μ0 (A, B), m (C, D), and m/μ0 (E, F).
Our results showed significant seasonal variations in phytoplankton growth and microzooplankton grazing in the Bohai Bay. However, the ratios of microzooplankton grazing to phytoplankton growth (m/μ0) and the nutrient limitation index (μ0/μn) showed insignificant seasonal variations (Table 4). Seasonal variations in phytoplankton growth and microzooplankton grazing have been found in many studies in temperate and high-latitude waters and many representative areas (Kim et al., 2007; Calbet et al., 2008; Lawrence and Menden-Deuer, 2012; Dong et al., 2021).
The growth of phytoplankton in the ocean is influenced by various factors such as temperature, nutrients, light, and community structure (Li et al., 2010). The temperature has been considered an essential driver of phytoplankton growth (G-Yull and Gotham, 1981). In our study, it revealed a significant temperature difference between summer and autumn. Furthermore, the obtained results align with our initial hypothesis presented in the previous section. The phytoplankton growth rate in summer was significantly higher than in autumn (Figure 5A). The mean surface temperature of seawater in summer was approximately 10°C higher than in autumn. Assuming that Q10 is 1.82 (Caron, 2007), 10°C of temperature difference would lead to 2.3 times μ0 difference. Based on the data provided by Quevedo and Anadon (2001), it was calculated that the phytoplankton growth rate (μ0) and microzooplankton grazing rate (m) in the subtropical NE Atlantic were higher in summer (0.61±0.43 d-1 and 0.49 ±0.28 d-1) than in spring (0.33±0.27 d-1 and 0.29±0.18 d-1). It had also been recently reported that the average winter μ0 and m in the subtropical East China Sea region was lower than in the summer (Guo et al., 2014). Furthermore, the latest study by Liu et al. (2021) not only explored the correlation between temperature and phytoplankton growth but also quantified this relationship. Through their research, they were able to establish a predictive model for phytoplankton growth under specific environmental conditions. These findings were consistent with the seasonal changes in phytoplankton growth and microzooplankton grazing reported in this study.
Contrary to our second hypothesis, the results obtained for the spatial variation did not show a decrease in phytoplankton growth rate (μ0) as the distance from the shore increased and nutrient availability decreased. This unexpected finding may be explained by the potential influence of nutrient excretion by herbivores and intermittent nutrient supply from below the nutrient line, which can provide additional nutrients to support phytoplankton growth (Chen et al., 2013). Consequently, the nutrient content present in the seawater could sufficiently meet the growth requirements of phytoplankton, thereby mitigating the anticipated decrease in growth rate with increasing distance from the shore. These findings highlight the complex interplay of factors influencing phytoplankton dynamics in different spatial contexts.
Bacllariophyta and Dinophyta predominated at all stations during both seasons. To further investigate the relationship between their abundance, the ratio of the two groups, the grazing rate (m), and the parameter m/μ0, was conducted, and the results were presented in Figure 6. This analysis could provide valuable insights into the dynamics and interactions of these phytoplankton groups and their potential influence on grazing rates and the overall ecosystem. Changes in phytoplankton community species and size composition have been found to affect microzooplankton grazing (Teixeira and Figueiras, 2009). Most ciliates were resistant grazers to Bacllariophyta, while some larger heterotrophic methanogens (e.g., Gyrodinium) preferentially grazed on Bacllariophyta (Robinson et al., 1999; Huang et al., 2011). In this study, we found that the microzooplankton grazing rates (m) negatively correlated with the abundance of Dinophytas in summer. As the abundance of Dinophytas in the stations decreased, the grazing rate increased (Figure 6C). This might be due to the resistance of microzooplankton to Dinophytas in the study stations. In a recent study, microzooplankton grazing on the phytoplankton of different size classes was also investigated, and the results showed that microzooplankton usually grazed on smaller pico-phytoplankton at a higher rate (Zhou et al., 2011; Dong et al., 2021). The species composition and abundance of different microzooplankton also affected the grazing and growth rates of phytoplankton (Gómez, 2007).
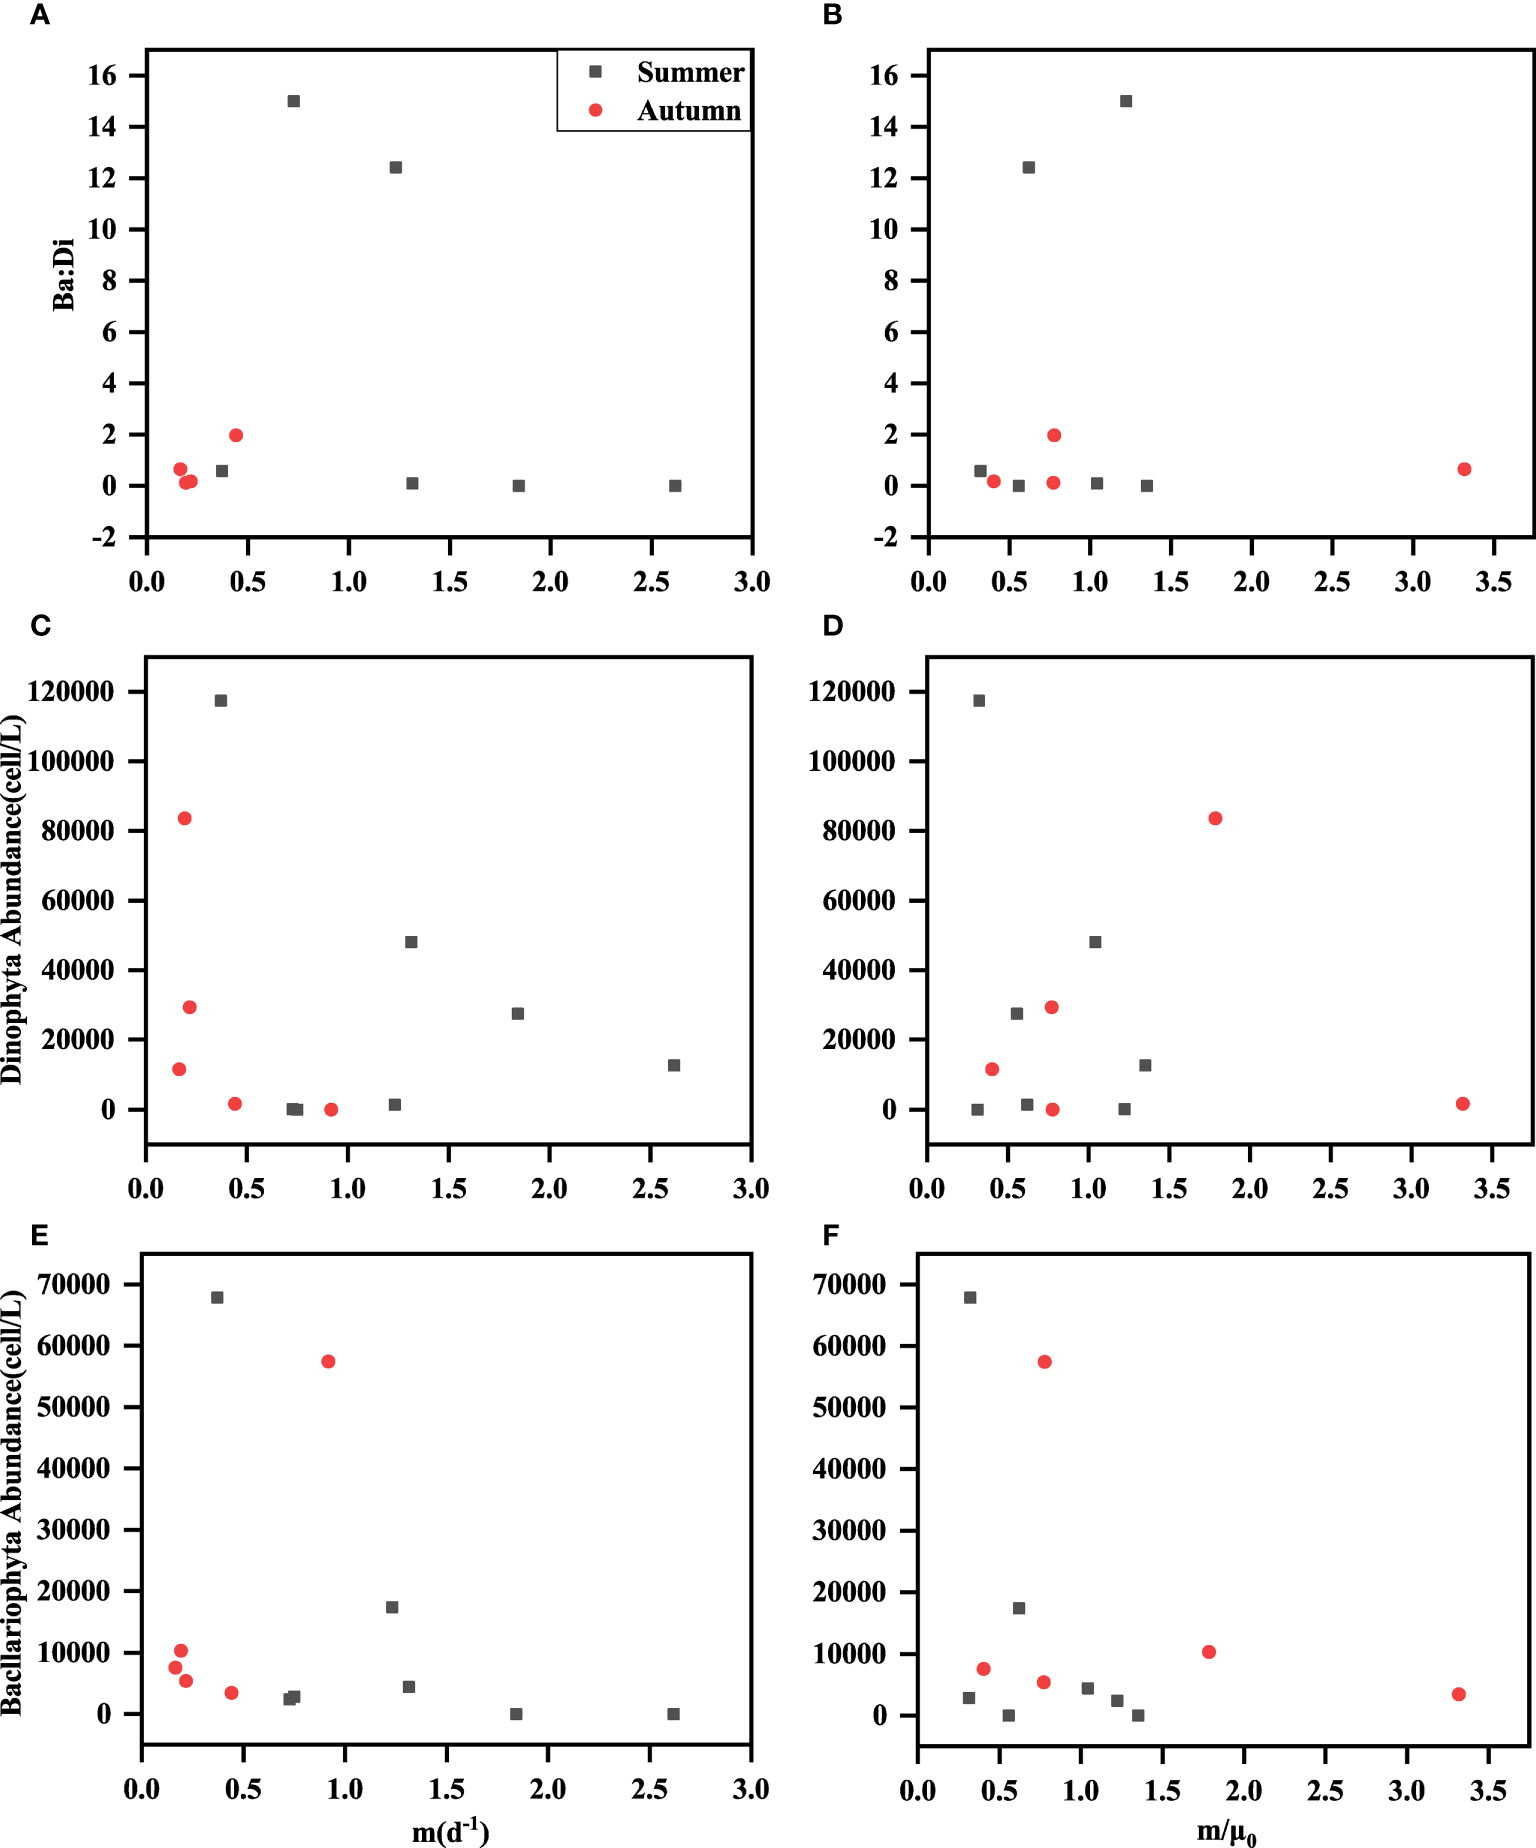
Figure 6 Relationships among grazing rate (m) and m/μ0 with Bacllariophyta abundance (cells/L) (E, F), Dinophyta abundance (cells/L) (C, D) and Ba: Di (A, B); Ba: Di was Bacllariophyta abundance: Dinophyta abundance.
Calbet and Landry (2004) showed a significant positive correlation between phytoplankton growth rates and microzooplankton grazing rates based on data sets collected from the Open Global Ocean and Offshore Marine System (R2 = 0.37, p<0.001). The present study also found that the growth rate of phytoplankton was closely related to the grazing rate of microzooplankton and showed a positive correlation (Figure 6). At the same time, this was consistent with the results of previous studies in other seas (Claire et al.; Burkill et al., 1987; Calbet and Landry, 2004; Kim et al., 2007; Zhou et al., 2011; Schmoker et al., 2013). The passive grazing of microzooplankton always prioritizes faster-growing species to obtain a more stable food source and maintain their growth. Moreover, the high coupling of microzooplankton grazing rates and phytoplankton growth rates will contribute to maintaining ecosystem stability (Strom, 2002; Sun et al., 2007).
According to previous studies, phytoplankton mortality due to microzooplankton grazing was lower in coastal environments with high nutrient concentration and higher in open ocean areas with low nutrient concentration (Landry et al., 1998a; Calbet and Landry, 2004). In the present experimental study, a similar phenomenon was observed. In summer, it was obvious that the nutrient concentrations in regions I, II, and III changed from high to low (Table 1). It was consistent with the regional environmental characteristics presented with the distance from the coastal area from near to far. In summer, m/μ0 gradually increase (Figure 5C). In our study, the temperature in summer was significantly higher than in autumn. The grazing rate of microzooplankton was more sensitive to temperature than the growth rate of phytoplankton (Caron, 2007). This implies that the phytoplankton growth rate may be smaller than microzooplankton grazing rate with increasing temperature (Lopez-Urrutia et al., 2006; Caron, 2007; Lopez-Urrutia, 2008; Chen et al., 2012). The high grazing impact in the experiment maybe because the increase in microzooplankton grazing rate was more significant than the increase in phytoplankton growth rate.
There were some other points to be considered. Since the estimation errors of μ, m are not independent, Gutierrez-Rodriguez et al. (2009) indicated that the correlation between microzooplankton grazing rates and phytoplankton growth rates was influenced mainly by the conditions assumed in the dilution experiment (k = μ - m). As demonstrated by Zhou et al. (2015), the effect of method artifacts was minimal (methodological R-spearman = 0.137) in the correlation analysis of grazing rate and growth rate. This correlation reflects a real ecological relationship; that is, there is a strong coupling between phytoplankton and microzooplankton (Strom, 2002). Firstly, the close correlation between microzooplankton grazing and phytoplankton growth rates, as depicted in Figure 7 was often explained as microzooplankton exerting a higher grazing rate on the faster-growing phytoplankton that enhanced the coupling between phytoplankton and microzooplankton (Burkill et al., 1987). Secondly, the correlation could also be explained as being the result of increased phytoplankton growth due to an increase in recycled nutrient supply from phytoplankton mortality through grazing by microzooplankton, especially in oligotrophic waters (Capblancq, 1990; Banse, 2013).
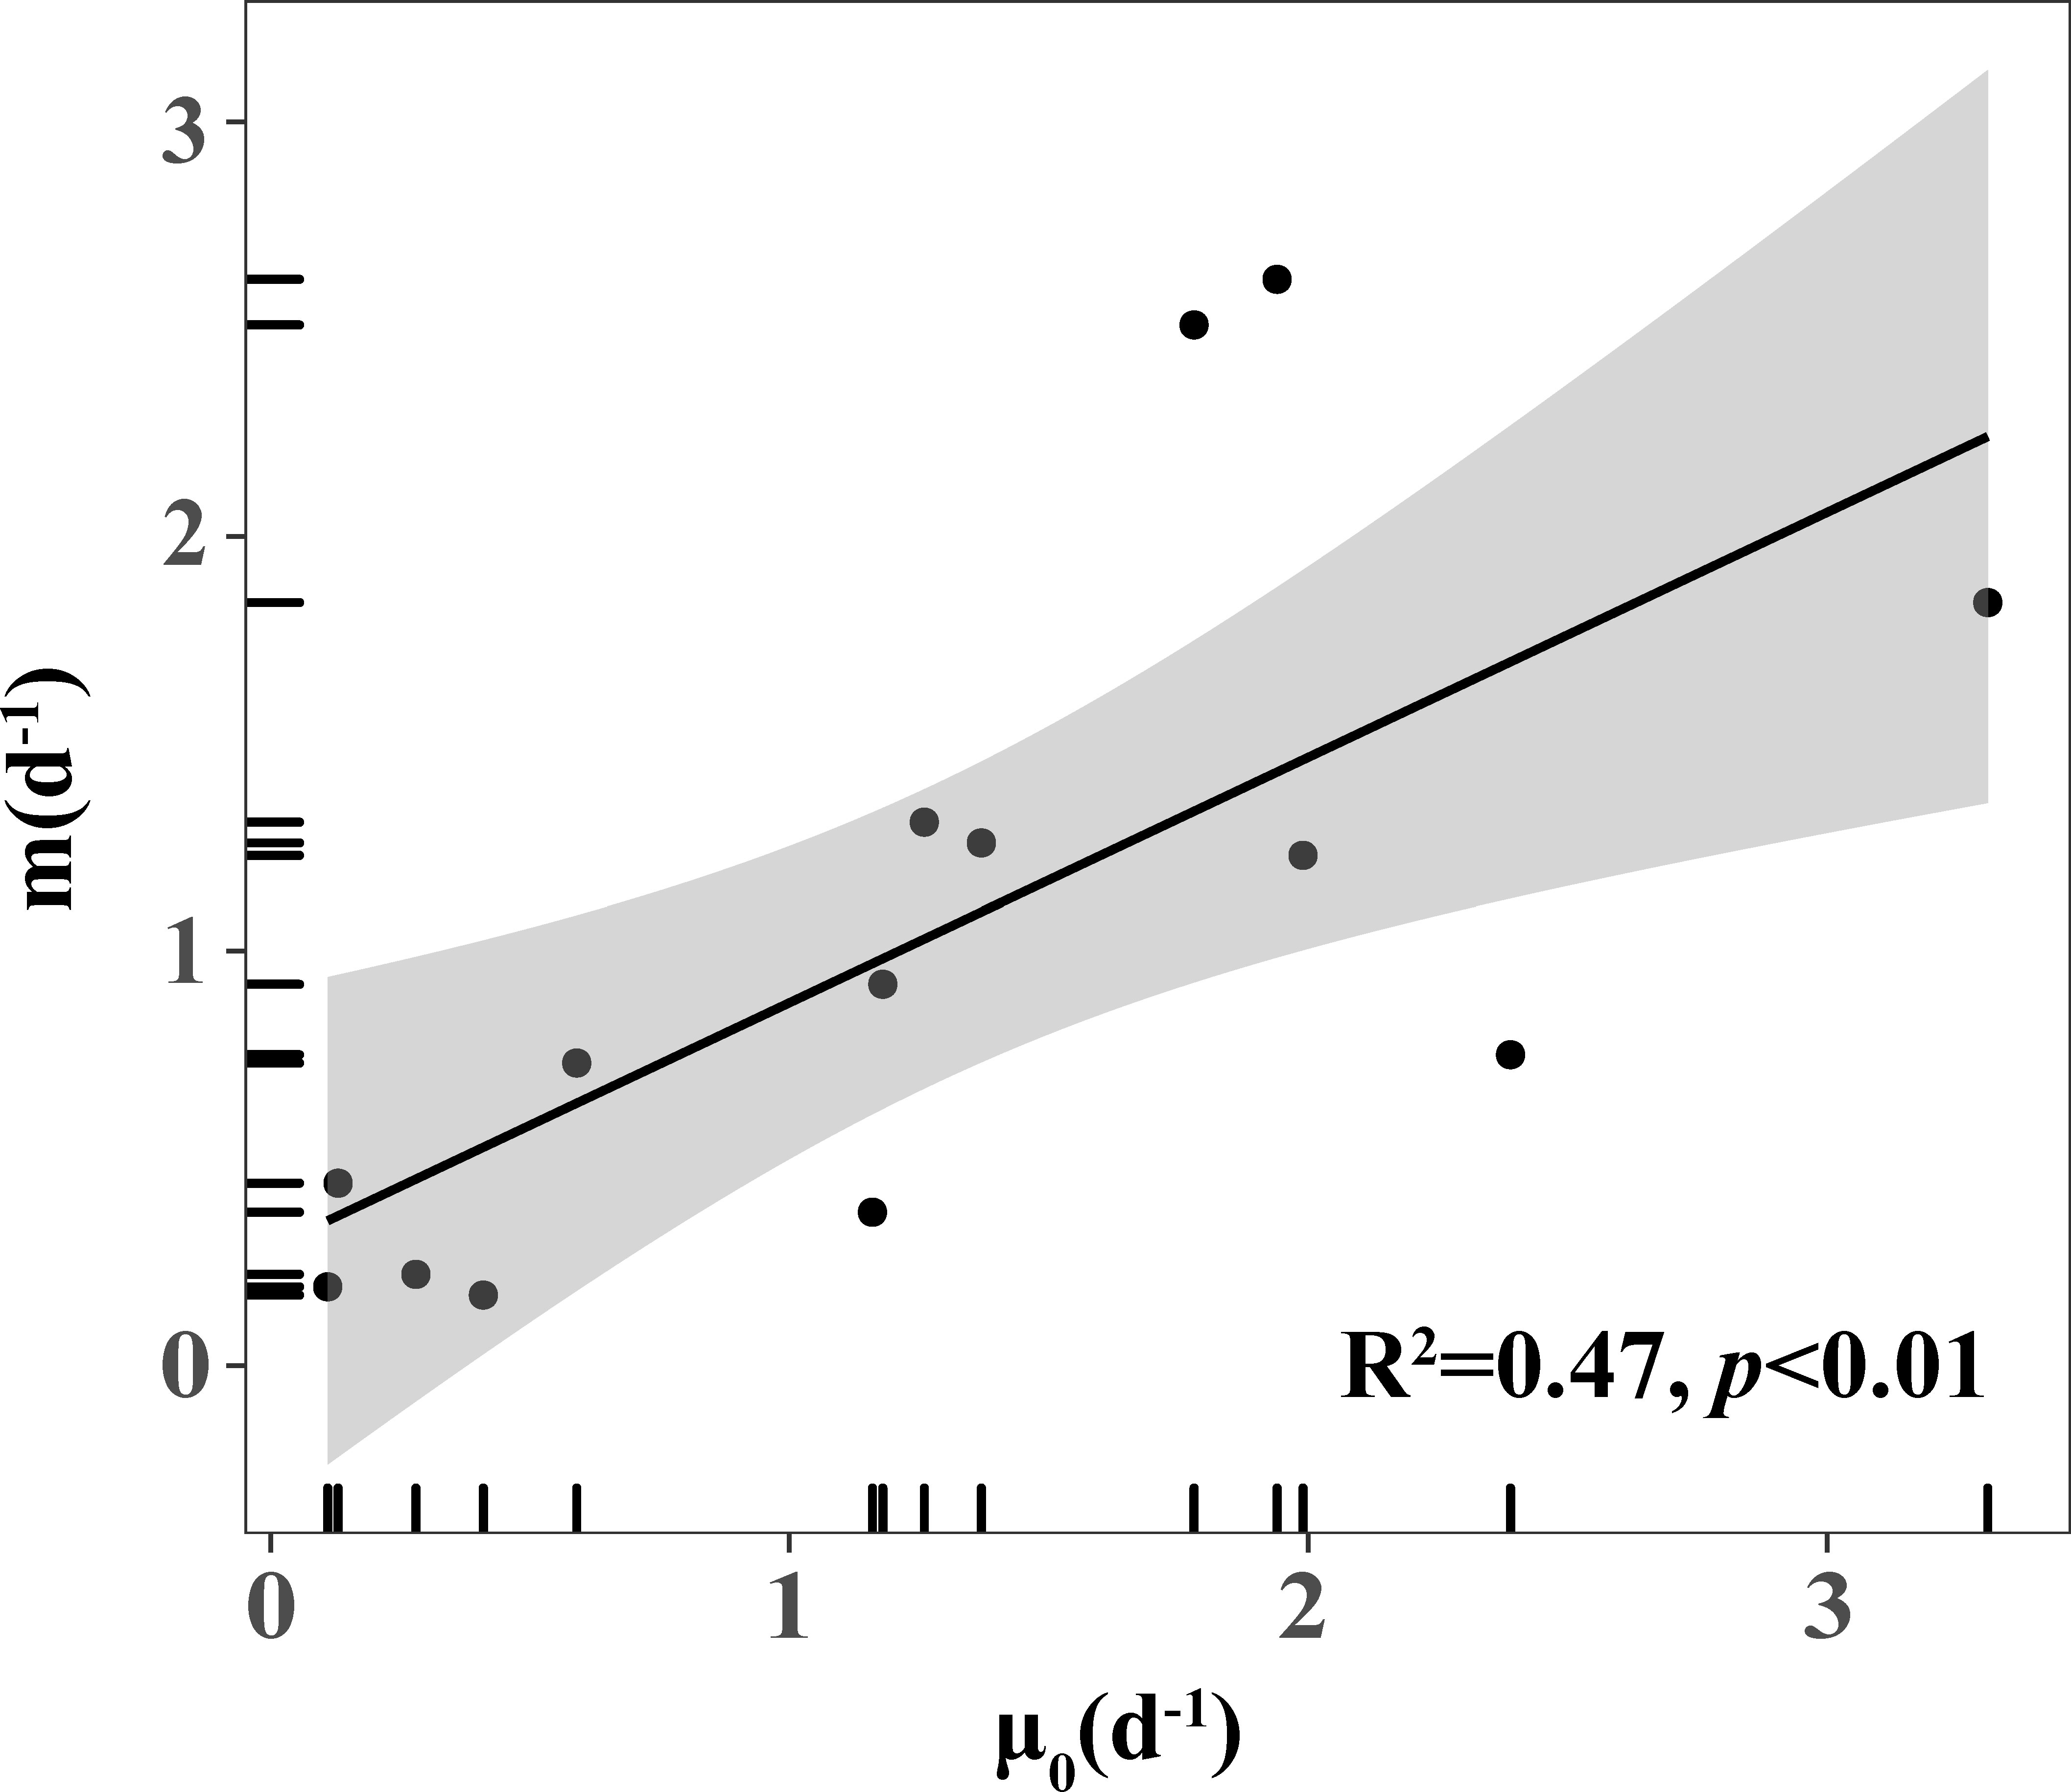
Figure 7 Positive correlation between phytoplankton growth rate (μ0) and microzooplankton grazing rate (m).
Microzooplankton grazing is one of the important ways to phytoplankton losses. This study showed that the value of m/μ0 in summer was 0.85±0.43, and removed the maximum departure point in autumn was 0.88±0.44 (Table 4). It indicates that most primary production passes through the microzooplankton to higher trophic levels or food webs. Compared to microzooplankton, mesozooplankton (>200 μm) prefer to graze on large phytoplankton, so their contribution to grazing was less than microzooplankton (Calbet and Landry, 1999; Steinberg and Landry, 2017; Karu et al., 2020). Zooplankton generally consumes 12% of primary production (Calbet, 2001; Liu et al., 2010); in the coastal waters near the Pearl River estuary, it was in the range of 0.7% to 31% variation. At the same time, microzooplankton feed on ultramicro zooplankton to a greater extent than micro phytoplankton, which may indicate that microzooplankton is size-selective for prey grazing (Chen et al., 2015).
In summary, there was a close relationship between phytoplankton growth and microzooplankton grazing. Meanwhile, the high impact of microzooplankton grazing on the whole phytoplankton community may result from the close coupling between phytoplankton and microzooplankton. Closer coupling was facilitated by the bottom-up effects of continuous nutrient supply from phytoplankton mortality and the top-down effects of grazing through microzooplankton.
We comprehensively studied microzooplankton grazing and phytoplankton growth in the Bohai Bay during summer and autumn. Significant seasonal variations in some hydrological parameters, phytoplankton growth rates, and microzooplankton grazing rates were found. We also focused on the relationship between phytoplankton growth and microzooplankton grazing. Although microzooplankton grazing is an important pathway for primary production, insufficient measurement data still supports it (Landry et al., 2011). Therefore, theoretical studies on microzooplankton grazing are still not widely accepted by the academic community and can be easily fitted to in situ data. Current estimates of the global average of primary production grazed by microzooplankton accounts for approximately 60% to 80%. However, the actual ratio of m/μ0 can vary between 0 and 100%, showing almost unpredictable (Calbet and Landry, 2004; Chen et al., 2012). The real ocean state can be disturbed by various physical phenomena (e.g., eddies, typhoons, etc.), deviating the ocean from its steady state. Although coupling between phytoplankton growth rates and microzooplankton grazing rates was frequently observed in this study, it was sometimes physically interfered with and decoupled (Murrell et al., 2002).
The raw data supporting the conclusions of this article will be made available by the authors, without undue reservation.
WY: Conduct experiment, data analysis, writing-original draft. GDZ: Investigation and environmental data. YS: Phytoplankton sample analysis. GCZ: Investigation, data curation, writing-review & editing, funding acquisition. JS: Conceptualization, methodology, project administration, resources, supervision, review & editing. All authors contributed to the article and approved the submitted version.
This research was financially supported by the National Key Research and Development Program of China (No. 2019YFC1407804), the National Natural Science Foundation of China (Nos. 42106095 and 41276124), and the Changjiang Scholar Program of Chinese Ministry of Education (No. T2014253).
We wish to thank the captains and crew of R/V Jinhan 04700 and all scientists and technicians who helped with sample collection and CTD data during the cruise. Data acquisition and sample collection were supported by the National Key Research and Development Program of China. This cruise was conducted onboard R/V Jinhan 04700 by the Tianjin University of Science and Technology, China.
The authors declare that the research was conducted in the absence of any commercial or financial relationships that could be construed as a potential conflict of interest.
All claims expressed in this article are solely those of the authors and do not necessarily represent those of their affiliated organizations, or those of the publisher, the editors and the reviewers. Any product that may be evaluated in this article, or claim that may be made by its manufacturer, is not guaranteed or endorsed by the publisher.
Banse K. (2007). Do we live in a largely top-down regulated world? J. Biosci. 32 (4), 791–796. doi: 10.1007/s12038-007-0080-6
Banse K. (2013). Reflections about chance in my career, and on the top-down regulated world. Ann. Rev. Mar. 5 (1), 1–19. doi: 10.1146/annurev-marine-121211-172359
Burkill P. H., Mantoura R., Llewellyn C. A., Owens N. (1987). Microzooplankton grazing and selectivity of phytoplankton in coastal waters. Mar. Biol. 93 (4), 581–590. doi: 10.1007/BF00392796
Calbet A. (2001). Mesozooplankton grazing effect on primary production: A global comparative analysis in marine ecosystems. Limnol. Oceanogr. 46 (7), 1824–1830. doi: 10.4319/lo.2001.46.7.1824
Calbet A., Landry M. R. (1999). Mesozooplankton influences on the microbial food web: Direct and indirect trophic interactions in the oligotrophic open ocean. Limnol. Oceanogr. 44 (6), 1370–1380. doi: 10.4319/lo.1999.44.6.1370
Calbet A., Landry M. R. (2004). Phytoplankton growth, microzooplankton grazing, and carbon cycling in marine systems. Limnol. Oceanogr. 44 (6), 1370–1380. doi: 10.4319/lo.2004.49.1.0051
Calbet A., Trepat I., Almeda R., Salo V., Simo R. (2008). Impact of micro- and nanograzers on phytoplankton assessed by standard and size-fractionated dilution grazing experiments. Aquat. Microb. Ecol. 50 (2), 145–156. doi: 10.3354/ame01171
Capblancq J. (1990). Nutrient dynamics and pelagic food web interactions in oligotrophic and eutrophic environments: an overview. Hydrobiologia 207 (1), 1–14. doi: 10.1007/BF00041435
Caron R. (2007). Does low temperature constrain the growth rates of heterotrophic protists? Evidence and implications for algal blooms in cold waters. Limnol. Oceanogr. 52 (2), 886–895. doi: 10.2307/40006135
Caron D. A., Dennett M. R. (1999). Phytoplankton growth and mortality during the 1995 Northeast Monsoon and Spring Intermonsoon in the Arabian Sea. Deep-Sea Res. II 46 (8-9), 1665–1690. doi: 10.1016/S0967-0645(99)00039-9
Chen B. Z., Landry M. R., Huang B. Q., Liu H. B. (2012). Does warming enhance the effect of microzooplankton grazing on marine phytoplankton in the ocean? Limnol. Oceanogr. 57 (2), 519–526. doi: 10.4319/lo.2012.57.2.0519
Chen B., Liu H. (2010). Relationships between phytoplankton growth and cell size in surface oceans: Interactive effects of temperature, nutrients, and grazing. Limnol. Oceanogr. 55 (3), 965–972. doi: 10.4319/lo.2010.55.3.0965
Chen M., Liu H., Song S., Sun J. (2015). Size-fractionated mesozooplankton biomass and grazing impact on phytoplankton in northern South China Sea during four seasons. Deep-Sea Res. II 117 (7), 108–118. doi: 10.1016/j.dsr2.2015.02.026
Chen B., Zheng L., Huang B., Song S., Liu H. (2013). Seasonal and spatial comparisons of phytoplankton growth and mortality rates due to microzooplankton grazing in the northern South China Sea. Biogeosciences 10 (4), 2775–2785. doi: 10.5194/bg-10-2775-2013
Dolan J. R., McKeon K. (2005). The reliability of grazing rate estimates from dilution experiments: Have we over-estimated rates of organic carbon consumption by microzooplankton? Ocean. Sci. 1 (1), 1–7. doi: 10.5194/os-1-1-2005
Dong Y., Li Q., Wu Z., Chen Y. (2021). Biophysical controls on seasonal changes in the structure, growth, and grazing of the size-fractionated phytoplankton community in the northern South China Sea. Copernicus. GmbH. 18 (24), 6423–6434. doi: 10.5194/bg-18-6423-2021
Gómez F. (2007). Trends on the distribution of ciliates in the open Pacific Ocean. Acta Oecol. 32 (2), 188–202. doi: 10.1016/j.actao.2007.04.002
Guo C., Liu H., Zheng L., Song S., Chen B., Huang B. (2014). Seasonal and spatial patterns of picophytoplankton growth, grazing and distribution in the East China Sea. Biogeosciences 11 (7), 1847–1862. doi: 10.5194/bg-11-1847-2014
Gutierrez-Rodriguez A., Latasa M., Mourre B., Laws E. A. (2009). Coupling between phytoplankton growth and microzooplankton grazing in dilution experiments: potential artefacts. Mar. Ecol. Prog. Ser. 383, 1–9. doi: 10.3354/meps08005
G-Yull R., Gotham I. J. (1981). The effect of environmental factors on phytoplankton growth: Temperature and the interactions of temperature with nutrientlimitation. Limnol. Oceanogr. 26 (4), 635–648. doi: 10.4319/lo.1981.26.4.0635
Hans U. (1958). Zur Vervollkommnung der quantitativen Phytoplankton-Methodik: Mit 1 Tabelle und 15 abbildungen im Text und auf 1 Tafel. Sil. Communications 9 (1), 1–38. doi: 10.1080/05384680.1958.11904091
Hansen H. P., Koroleff F. (2007). Determination of nutrients. Methods Seawater Anal., 159–228. doi: 10.1002/9783527613984.ch10
Huang B. Q., Xiang W. G., Zeng X. B., Chiang K. P., Tian H. J., Hu J., et al. (2011). Phytoplankton growth and microzooplankton grazing in a subtropical coastal upwelling system in the Taiwan Strait. Cont. Shelf. Res. 31 (6), S48–S56. doi: 10.1002/9783527613984.ch10
Jyothibabu R., Devi C. R. A., Madhu N. V., Sabu P., Jayalakshmy K. V., Jacob J., et al. (2008). The response of microzooplankton (20-200 mu m) to coastal upwelling and summer stratification in the southeastern Arabian Sea. Cont. Shelf. Res. 28 (4-5), 653–671. doi: 10.1016/j.csr.2007.12.001
Karu F., Kobari T., Honma T., Kanayama T., Kume G. (2020). Trophic sources and linkages to support mesozooplankton community in the Kuroshio of the East China Sea. Fish. Oceanogr. 29 (4), 442–456. doi: 10.1002/9783527613984.ch10
Kim S., Park M. G., Moon C., Shin K., Man C. (2007). Seasonal variations in phytoplankton growth and microzooplankton grazing in a temperate coastal embayment, Korea. Estuar. Coas. Shelf. S 71 (1-2), 159–169. doi: 10.1016/j.ecss.2006.07.011
Landry M. R. (1993). “Estimating rates of growth and grazing mortality of phytoplankton by the dilution method.” in Handbook of methods in aquatic microbial ecology. Eds. Kemp P. J., Cole J. J., Sherr B. F., Sherr E. B. (New York: CRC Press), 715–722.
Landry M. R., Barber R. T., Bidigare R. R., Chai F., Coale K. H., Dam H. G., et al. (2003). Iron and grazing constraints on primary production in the central equatorial Pacific: An EqPac synthesis. Limnol. Oceanogr. 53 (5), 2046–2047. doi: 10.4319/lo.1997.42.3.0405
Landry M. R., Brown S. L., Campbell L., Constantinou J., Liu H. (1998b). Spatial patterns in phytoplankton growth and microzooplankton grazing in the Arabian Sea during monsoon forcing. Deep-Sea Res. II 45 (10), 2353–2368. doi: 10.1016/S0967-0645(98)00074-5
Landry M. R., Calbet A. (2004). Microzooplankton production in the oceans. Ices J. Mar. Sci. 61 (4), 501–507. doi: 10.1016/j.icesjms.2004.03.011
Landry M. R., Constantinou J., Kirshtein J. (1995). Microzooplankton grazing in the central equatorial Pacific during February and Augus. Deep-Sea Res. II 53 (5), 2046–2047. doi: 10.1016/0967-0645(95)00024-K
Landry M., Constantinou J., Latasa M., Brown S., Bidigare R., Ondrusek M. (1998a). Biological response to iron fertilization in the eastern equatorial Pacific (IronEx II). III. Dynamics of phytoplankton growth and microzooplankton grazing. Am. J. Cardiol. 81 (10), 1249–1252. doi: 10.3354/meps201027
Landry M. R., Hassett R. P. (1982). Estimating the grazing impact of marine micro-zooplankton. Mar. Biol. 67 (3), 283–288. doi: 10.1007/BF00397668
Landry M. R., Selph K. E., Taylor A. G., Décima M., Balch W. M., Bidigare R. R. (2011). Phytoplankton growth, grazing and production balances in the HNLC equatorial Pacific. Deep-Sea Res. II 58 (3-4), 524–535. doi: 10.1016/j.dsr2.2010.08.011
Lawrence C., Menden-Deuer S. (2012). Drivers of protistan grazing pressure: Seasonal signals of plankton community composition and environmental conditions. Mar. Ecol. Prog. 459, 39–52. doi: 10.3354/meps09771
Laws E. A. (2003). Mesozooplankton grazing and primary production: An alternative assessment. Limnol. Oceanogr. 48 (3), 1357–1359. doi: 10.4319/lo.2003.48.3.1357
Li Q. P., Franks P., Landry M. R., Goericke R., Taylor A. G. (2010). Modeling phytoplankton growth rates and chlorophyll to carbon ratios in California coastal and pelagic ecosystems. J. Geophys. Res-Atmos 115 (G4), G04003. doi: 10.1029/2009JG001111
Lin C., Su J., Xu B., Tang Q. (2001). Long-term variations of temperature and salinity of the Bohai Sea and their influence on its ecosystem. Prog. Oceanogr. 49 (1), 7–19. doi: 10.1016/S0079-6611(01)00013-1
Liu H., Chen M., Suzuki K., Chong K. W., Chen B. (2010). Mesozooplankton selective feeding in subtropical coastal waters as revealed by HPLC pigment analysis. Mar. Ecol. Prog. Ser. 407, 111–123. doi: 10.3354/meps08550
Liu K., Chen B., Zheng L., Su S., Huang B., Chen M., et al. (2021). What controls microzooplankton biomass and herbivory rate across marginal seas of China? Limnol. Oceanogr. 66 (1), 61–75. doi: 10.1002/lno.11588
Liu J. Y., Feng Y., Zhang Y., Liang N., Wu H. L., Liu F. D. (2022). Allometric releases of nitrogen and phosphorus from sediments mediated by bacteria determines water eutrophication in coastal river basins of Bohai Bay. Ecotox. Environ. Safe. 235, 11. doi: 10.1016/j.ecoenv.2022.113426
Liu H., Suzuki K., Saino T. (2002). Phytoplankton growth and microzooplankton grazing in the subarctic Pacific Ocean and the Bering Sea during summer 1999. Deep-Sea Res. I 49 (2), 363–375. doi: 10.1016/S0967-0637(01)00056-5
Lopez-Urrutia A. (2008). The metabolic theory of ecology and algal bloom formation. Limnol. Oceanogr. 53 (5), 2046–2047. doi: 10.4319/lo.2008.53.5.2046
Lopez-Urrutia A., San Martin E., Harris R. P., Irigoien X. (2006). Scaling the metabolic balance of the oceans. P. Nati. Acad. Sci. U.S.A. 103 (23), 8739–8744. doi: 10.1073/pnas.0601137103
Ma Y., Ke Z., Huang L., Tan Y. (2014). Identification of human-induced perturbations in Daya Bay, China: Evidence from plankton size structure. Cont. Shelf. Res. 39 (8), 1985–1992. doi: 10.1016/j.csr.2013.10.012
Murrell M. C., Stanley R. S., Lores E. M., Didonato G. T., Flemer D. A. (2002). Linkage between microzooplankton grazing and phytoplankton growth in a Gulf of Mexico estuary. Estuar. Coast. 25 (1), 19–29. doi: 10.1007/BF02696046
Quevedo M., Anadon R. (2001). Protist control of phytoplankton growth in the subtropical north-east Atlantic. Mar. Ecol. Prog. Ser. 221, 29–38. doi: 10.3354/meps221029
Robinson C., Archer S. D., Williams P. J. L. (1999). Microbial dynamics in coastal waters of East Antarctica: plankton production and respiration. Mar. Eco. Prog. Ser. 180, 23–36. doi: 10.3354/meps180023
Schmoker C., Hernandez-Leon S., Calbet A. (2013). Microzooplankton grazing in the oceans: impacts, data variability, knowledge gaps and future directions. J. Plankton. Res. 35 (4), 691–706. doi: 10.1093/plankt/fbt023
Steinberg D. K., Landry M. R. (2017). Zooplankton and the ocean carbon cycle. Ann. Rev. Mar. 9 (1), 413–444. doi: 10.1146/annurev-marine-010814-015924
Strom S. (2002). Novel interactions between phytoplankton and microzooplankton: their influence on the coupling between growth and grazing rates in the sea. Hydrobiologia 480 (1-3), 41–54. doi: 10.1023/A:1021224832646
Strom S. L., Macri E. L., Olson M. B. (2007). Microzooplankton grazing in the coastal Gulf of Alaska: Variations in top-down control of phytoplankton. Limnol. Oceanogr. 52 (4), 1480–1494. doi: 10.4319/lo.2007.52.4.1480
Sun J., Feng Y. Y., Wang D., Song S. Q., Jiang Y., Ding C. L., et al. (2013). Bottom-up control of phytoplankton growth in spring blooms in Central Yellow Sea, China. Deep-Sea Res. II 97, 61–71. doi: 10.1016/j.dsr2.2013.05.006
Sun J., Feng Y., Zhang Y., Hutchins D. A. (2007). Fast microzooplankton grazing on fast-growing, low-biomass phytoplankton: a case study in spring in Chesapeake Bay, Delaware Inland Bays and Delaware Bay. Hydrobiologia 589 (1), 127–139. doi: 10.1007/s10750-007-0730-6
Teixeira I. G., Figueiras F. G. (2009). Feeding behaviour and non-linear responses in dilution experiments in a coastal upwelling system. Aquat. Microb. Ecol. 55 (1), 53–63. doi: 10.3354/ame01281
Wang L., Liu L., Zheng B., Zhu Y., Wang X. (2013). Analysis of the bacterial community in the two typical intertidal sediments of Bohai Bay, China by pyrosequencing. Mar. pollut. Bull. 72 (1), 181–187. doi: 10.1016/j.marpolbul.2013.04.005
Welschmeyer N. A. (2003). Fluorometric analysis of chlorophyll a in the presence of chlorophyll b and pheopigments. Limnol. Oceanogr. 39 (8), 1985–1992. doi: 10.4319/lo.1994.39.8.1985
Zhou L., Tan Y., Huang L., Huang J., Liu H., Lian X. (2011). Phytoplankton growth and microzooplankton grazing in the continental shelf area of northeastern South China Sea after Typhoon Fengshen. Cont. Shelf. Res. 31 (16), 1663–1671. doi: 10.1016/j.csr.2011.06.017
Keywords: dilution technique, phytoplankton growth, microzooplankton grazing, phytoplankton community, the Bohai Bay
Citation: Wen Y, Zhang G, Song Y, Zhang G and Sun J (2023) Seasonal and spatial comparisons of microzooplankton grazing and phytoplankton growth in the Bohai Bay, China. Front. Mar. Sci. 10:1190677. doi: 10.3389/fmars.2023.1190677
Received: 21 March 2023; Accepted: 17 July 2023;
Published: 31 July 2023.
Edited by:
Jie Xu, University of Macau, ChinaReviewed by:
Ruifeng Zhang, Shanghai Jiao Tong University, ChinaCopyright © 2023 Wen, Zhang, Song, Zhang and Sun. This is an open-access article distributed under the terms of the Creative Commons Attribution License (CC BY). The use, distribution or reproduction in other forums is permitted, provided the original author(s) and the copyright owner(s) are credited and that the original publication in this journal is cited, in accordance with accepted academic practice. No use, distribution or reproduction is permitted which does not comply with these terms.
*Correspondence: Guicheng Zhang, Z3VpY2hlbmcuZ29vZEAxNjMuY29t; Jun Sun, cGh5dG9wbGFua3RvbkAxNjMuY29t
Disclaimer: All claims expressed in this article are solely those of the authors and do not necessarily represent those of their affiliated organizations, or those of the publisher, the editors and the reviewers. Any product that may be evaluated in this article or claim that may be made by its manufacturer is not guaranteed or endorsed by the publisher.
Research integrity at Frontiers

Learn more about the work of our research integrity team to safeguard the quality of each article we publish.