 Simona A. Ceriani1*
 Susan Murasko1
 David S. Addison2David Anderson3Greg Curry4Nicole A. Desjardin5Scott F. Eastman6Daniel R. Evans7Nancy Evou8
 Mariana M. P. B. Fuentes9
 Matthew H. Godfrey10
 Kristen M. Hart11Paul Hillbrand12
 Sarah E. Hirsch13
 Cody R. Mott14Katherine L. Mansfield15Kristen T. Mazzarella16Sarah V. Norris4S. Michelle Pate17
 Katrina F. Phillips15
 Kirt W. Rusenko3Brian M. Shamblin18Amber Stevenson5
 Kelly A. Sloan19
 Anton D. Tucker16,20Ryan C. Welsh14
 Paolo Casale21
- 1Fish and Wildlife Research Institute, Florida Fish and Wildlife Conservation Commission, Saint Petersburg, FL, United States
- 2Science Department, Conservancy of Southwest Florida, Naples, FL, United States
- 3Gumbo Limbo Nature Center, Boca Raton, FL, United States
- 4Rookery Bay National Estuarine Reserve Research, Florida Department of Environmental Protection, Naples, FL, United States
- 5Ecological Associates Inc., Jensen Beach, FL, United States
- 6Office of Resilience and Coastal Protection, Florida Department of Environmental Protection, St. Augustine, FL, United States
- 7Sea Turtle Conservancy, Gainesville, FL, United States
- 8Panama City Beach Turtle Watch, Panama City Beach, FL, United States
- 9Department of Earth, Ocean, and Atmospheric Science, Florida State University, Tallahassee, FL, United States
- 10North Carolina Wildlife Resources Commission, Beaufort, NC, United States
- 11Wetland and Aquatic Research Center, U.S. Geological Survey, Davie, FL, United States
- 12Bald Head Island Conservancy, Bald Head Island, NC, United States
- 13Loggerhead Marinelife Center, Juno Beach, FL, United States
- 14Inwater Research Group, Jensen Beach, FL, United States
- 15Marine Turtle Research Group, Department of Biology, University of Central Florida, Orlando, FL, United States
- 16Mote Marine Laboratory, Sarasota, FL, United States
- 17South Carolina Department of Natural Resources, Charleston, SC, United States
- 18Daniel B. Warnell School of Forestry and Natural Resources, University of Georgia, Athens, GA, United States
- 19Coastal Wildlife Department, Sanibel Captiva Conservation Foundation, Sanibel, FL, United States
- 20Marine Science Program, Department of Biodiversity, Conservation and Attractions, Perth, WA, Australia
- 21Department of Biology, University of Pisa, Pisa, Italy
Assessing the linkage between breeding and non-breeding areas has important implications for understanding the fundamental biology of and conserving animal species. This is a challenging task for marine species, and in sea turtles a combination of stable isotope analysis (SIA) and satellite telemetry has been increasingly used. The Northwest Atlantic (NWA) loggerhead (Caretta caretta) Regional Management Unit, one of the largest sea turtle populations in the world, provides an excellent opportunity to investigate key biological patterns as well as methodological aspects related to the use of stable isotopes to infer spatial distribution of turtles in foraging areas. We provide the first comprehensive assessment of the annual distribution of NWA adult female loggerheads among foraging areas and investigate the efficacy of various analytical approaches as well as the effect of sample size in these types of studies. A total of 5168 individual females were sampled from seven Management Units (MUs) between 2013-2018. We provide the first estimate of the proportion of females originating from each MU that uses each foraging area and show how this proportion varies over time. We also estimate the relative importance (in terms of number of turtles) of each foraging area to the overall loggerhead breeding aggregation nesting in Florida and in the NWA for each year of the study. The foraging area used by reproductively active females differs considerably across MUs. One of these, the Subtropical NWA, is by far the most important foraging area in terms of both number of individuals and genetic diversity, and therefore this region may be considered as a conservation priority. Through simulations, we show that limited sizes of sample groups (unknowns; training; priors) may result in false geographic differentiation and consequently mislead interpretations. We provide thresholds and methodological recommendations for future studies. This study establishes a fundamental baseline for monitoring the annual contribution of foraging area to a terrestrial-based breeding aggregation of a marine animal in a cost-effective way. This type of monitoring allows for early detection of changes in foraging distributions—a possible effect of climate change on marine ecosystems or of area-specific anthropogenic threats.
Introduction
For many highly mobile species, food resources and suitable breeding habitat are separated by hundreds or thousands of kilometers, necessitating reproductive migrations (Webster et al., 2002; Costa et al., 2012). Individuals breeding at a specific site may not all use the same general foraging area; thus, understanding migratory connectivity can improve our knowledge on the biology of a species and can inform its conservation (Webster et al., 2002). Assessing the strength of the linkages between breeding and non-breeding areas is especially challenging for migratory marine species (Costa et al., 2012; Dunn et al., 2019), although terrestrial-based reproduction in some taxa (e.g., sea turtles, pinnipeds, albatross, penguins) represents a valuable research opportunity due to ease of access to the study animal at this time (Costa, 1991; Hays and Hawkes, 2018).
The study of animal migration and connectivity among different areas has advanced in recent years thanks to a variety of techniques (Hobson et al., 2019). Each technique has advantages and limitations; thus, combining complementary techniques may improve our understanding of migratory connectivity (e.g., Rundel et al., 2013). In the case of determining the foraging areas for animals encountered at breeding sites, satellite telemetry can provide fine-scale movement information at the individual level, but the high cost limits the number of individuals that can be tracked at each breeding site on an annual basis, which can lead to results biased by low sample size (Shimada et al., 2021). Stable isotope analysis (SIA) of light elements (C, H, N, O, and S) in tissue samples taken from breeding individuals can be a relatively quick and cost-effective complementary approach for studying large-scale migratory connectivity in a variety of taxa, allowing population-level questions to be addressed although at a coarser spatial resolution than that possible using satellite telemetry (Hobson, 1999). Briefly, stable isotopes are intrinsic markers that are assimilated through diet into tissues and reflect information on both food and water sources as well as geographic locations where individuals feed (Hobson, 1999; Rubenstein and Hobson, 2004). If organisms move between isotopically distinct areas and retain quantifiable isotopic differences in tissues that can be linked to past locations, then stable isotopes act as forensic recorders of migratory and foraging behaviors (Hobson et al., 2019). The general approach for estimating geographic origin of migratory animals based on stable isotope values of their tissues is to develop or calibrate an assignment model based on tissues of known geographic origin (Wunder, 2012). One of the commonly used approaches is a likelihood-based assignment test, which is considered as a nominal assignment framework because it requires an a priori definition of all potential geographic regions utilized as foraging grounds and the isotopic characterization of each area (Wunder, 2012). Then, for each individual with an unknown foraging area, probabilities of foraging in the different areas are estimated based on the isotopic values of its tissue sample (Wunder, 2012). Determining likely foraging areas for individuals of unknown foraging area is the purpose of the methodology and, if the results are to be used to represent the population of interest, the sample size needs to be sufficiently large. However, to increase the potential reliability of the assignment model, individuals are assigned to a foraging area only if their posterior probabilities are over a specific threshold (Wunder, 2012). A disadvantage of this approach is that it reduces the number of individuals that can be assigned.
Adult sea turtles regularly congregate in breeding areas where they are relatively easy to observe. However, their distribution across multiple and distant foraging areas makes them more difficult to study, although identifying and monitoring these sites have important implications for conservation (Rees et al., 2016). For instance, the type and level of anthropogenic impacts on a population may differ among foraging areas. Moreover, climate change may alter marine ecosystems and productivity, impacting sea turtle distributions at sea (Pikesley et al., 2015; Willis-Norton et al., 2015). Such changes are difficult to study but monitoring possible changes of preferred foraging areas across time would provide valuable information to understand the effects of climate change on sea turtles and other organisms.
Geographic assignment based on stable isotope values of tissue of nesting turtles for which the foraging area is unknown that has been conducted to date has been done visually (by plotting isotopic values in a graph to determine the presence of clusters without performing statistical analysis, Hatase et al., 2002; Reich et al., 2010; Eder et al., 2012; Cardona et al., 2014) or using a likelihood-based nominal approach through discriminant function analysis (e.g., Ceriani et al., 2012; Coffee et al., 2020; Okuyama et al., 2022) except for one study that used a continuous approach based on a spatially explicit model (isoscapes; Ceriani et al., 2017). Previous work on determining the foraging areas of sea turtles based on stable isotope values and this nominal approach used as few as 12 known individuals for model training (Okuyama et al., 2022), no priors (Ceriani et al., 2012; Bradshaw et al., 2017; Pfaller et al., 2020), or a variable number of priors (Vander Zanden et al., 2015) and as few as 57 unknown individuals to assign to a putative foraging area (Ceriani et al., 2012). In some cases, successive studies of the same nesting aggregation produced differing results (Ceriani et al., 2012; Pajuelo et al., 2012; Ceriani et al., 2015), and it is unclear whether these discrepancies were caused by differences in the above-mentioned sample sizes or by some other factor. The effect that different sample sizes have on the performance and results of this type of geographic assignment has not been previously evaluated.
The Northwest Atlantic (NWA) loggerhead (Caretta caretta) Regional Management Unit (RMU [i.e., spatially explicit population segments defined by biogeographical data of marine turtle species]; Wallace et al., 2011) provides an excellent opportunity to investigate key biological patterns of sea turtles as well as methodological aspects related to the use of stable isotopes for geographic assignment. It is the largest RMU of the species (Casale and Tucker, 2017) and one of the largest RMUs of sea turtles globally (Wallace et al., 2010). An estimated 97% of this RMU nests along the Southeast United States coast, while the remaining 3% nests in the Greater Caribbean, mainly Mexico (Ceriani and Meylan, 2017). It is one of the best studied sea turtle RMUs in the world, with hundreds of post-nesting females that have been tracked using satellite telemetry in the last 35 years. Females are known to forage mostly on the continental shelves of the southeastern United States, eastern Gulf of Mexico, and the wider Caribbean, in particular the Bahama Banks and the Cuban shelf, and only rarely undertake short excursions in the pelagic environment (Dodd and Byles, 2003; Griffin et al., 2013; Hardy et al., 2014; Tucker et al., 2014; Evans et al., 2019; Iverson et al., 2020; Phillips et al., 2021). NWA adult loggerheads tend to remain in one foraging area year-round (Hardy et al., 2014; Hart et al., 2015; Evans et al., 2019; Phillips et al., 2021) or occupy one area during the non-breeding summer months and another during winter months (Hawkes et al., 2011; Ceriani et al., 2012). Eight distinct management units (MUs; Shamblin et al., 2011) or demographically discrete populations with respect to female natal homing have been identified, seven of which are in the southeastern United States, an area that is therefore critical to global conservation and recovery efforts for the species.
The NWA loggerhead RMU has been extensively studied using a dual stable isotopes approach (carbon and nitrogen) in the likelihood-based nominal framework (Ceriani et al., 2012; Pajuelo et al., 2012; Vander Zanden et al., 2014; Ceriani et al., 2015; Pfaller et al., 2020). Isotope-based assessments of foraging area use over multiple years focused on a single nesting beach sampled consistently (Ceriani et al., 2012; Ceriani et al., 2015), intermittently (Vander Zanden et al., 2014), or on multiple beaches across different MUs sampled both intermittently and during differing periods (Pfaller et al., 2020). Moreover, previous studies have used different numbers of putative foraging areas (Ceriani et al., 2012; Ceriani et al., 2015; Vander Zanden et al., 2015; Pfaller et al., 2020), a variety of training sample size (n = 14 to 60; Ceriani et al., 2012; Pajuelo et al., 2012), priors (Vander Zanden et al., 2015) or no priors (e.g., Ceriani et al., 2015), various thresholds for assignment (0.5 ≤ p ≤ 0.8; e.g., Pajuelo et al., 2012; Ceriani et al., 2015) and various sample size of turtles with unknown foraging area to derive aggregation estimates (n = 57 to 1019; Ceriani et al., 2012; Pfaller et al., 2020). Each of these variables has the potential to impact the results and the accuracy of foraging area assignment based on SIA.
This study aims to provide the first comprehensive assessment of the annual distribution of loggerheads that nest in the NWA among regional foraging areas and to provide a definitive analysis of what can be done with the likelihood-based nominal framework using a dual isotope approach (carbon and nitrogen). We used a large sample size (n = 7469 or seven times the previous largest such sample of any sea turtle study (Pfaller et al., 2020) and, to the best of our knowledge, of any taxa) collected using consistent and representative multi-year sampling at each MU (which intrinsically should provide results representative of the RMU), a large training sample and a large priors sample. Our objectives were to: (i) infer the relative importance of different regional foraging areas for each MU and for the entire NWA nesting aggregation; (ii) assess whether the relative importance of regional foraging areas changes over time; (iii) assess the composition, in terms of MU of origin, of individuals using each regional foraging area; (iv) investigate consistency in isotopic values over time and quantify regional foraging area fidelity among adult females, and (v) investigate the efficiency of different analytical approaches and the effect of sample size in this type of study.
Methods
Study sites and sample collection
In juvenile loggerheads, epidermis samples reflect the turtle’s dietary history over a period of up to four months (Reich et al., 2008). The time-period represented in adults is likely much longer, because the rates of isotopic incorporation slow with reduced growth rates (Reich et al., 2008) and increasing body mass (Martínez Del Rio and Carleton, 2012). Sea turtles are capital breeders and yolk is synthesized from nutrients acquired and stored during the non-breeding period (Hamann, 2003). Hence, both epidermis and eggs (fresh egg yolk [FEY] and unhatched egg [UHE]) sampled at breeding areas are assumed to reflect the isotopic values of the foraging areas used by females during the non-breeding season prior to migration and nesting activity and are widely used to infer the putative foraging area used by nesting females (Hatase et al., 2002; Seminoff et al., 2012; Ceriani et al., 2015). In this study, three types of samples were collected: (i) skin samples from nesting females, (ii) UHE at nest excavation (minimum three days after hatchling emergence or 70 days after deposition, if hatchling emergence was not observed, (Ceriani et al., 2014a) and (iii) fresh eggs (the morning after deposition).
Samples were collected at 21 beaches in the southeastern United States (from Florida to North Carolina) (Figure 1 and Supplementary Table 1) during the 2013-2018 nesting seasons (May-September). Sampling encompassed four loggerhead Recovery Units (RU) (the Northern RU, the Peninsular Florida RU, the Dry Tortugas RU, and the Northern Gulf of Mexico RU; National Marine Fisheries Service and U.S. Fish Wildlife Service, 2008). Subsequent genetic analyses further subdivided the Peninsular Florida RU into five additional MUs and refined the boundary between the Northern and Peninsular Florida RUs (Shamblin et al., 2011). For simplicity and to distinguish between originally defined Recovery Units and the genetically-revised MUs that were proposed later, these populations will be referred to in the MU context hereafter as northern MU (NMU [Northern Recovery Unit + St. Johns County, Florida or SJC]), central-east Florida MU (CE), southeast Florida MU (SE), Dry Tortugas MU (DRTO), southwest Florida MU (SW), central-west Florida MU (CW) and northwest Florida MU (NW) (Figure 1).
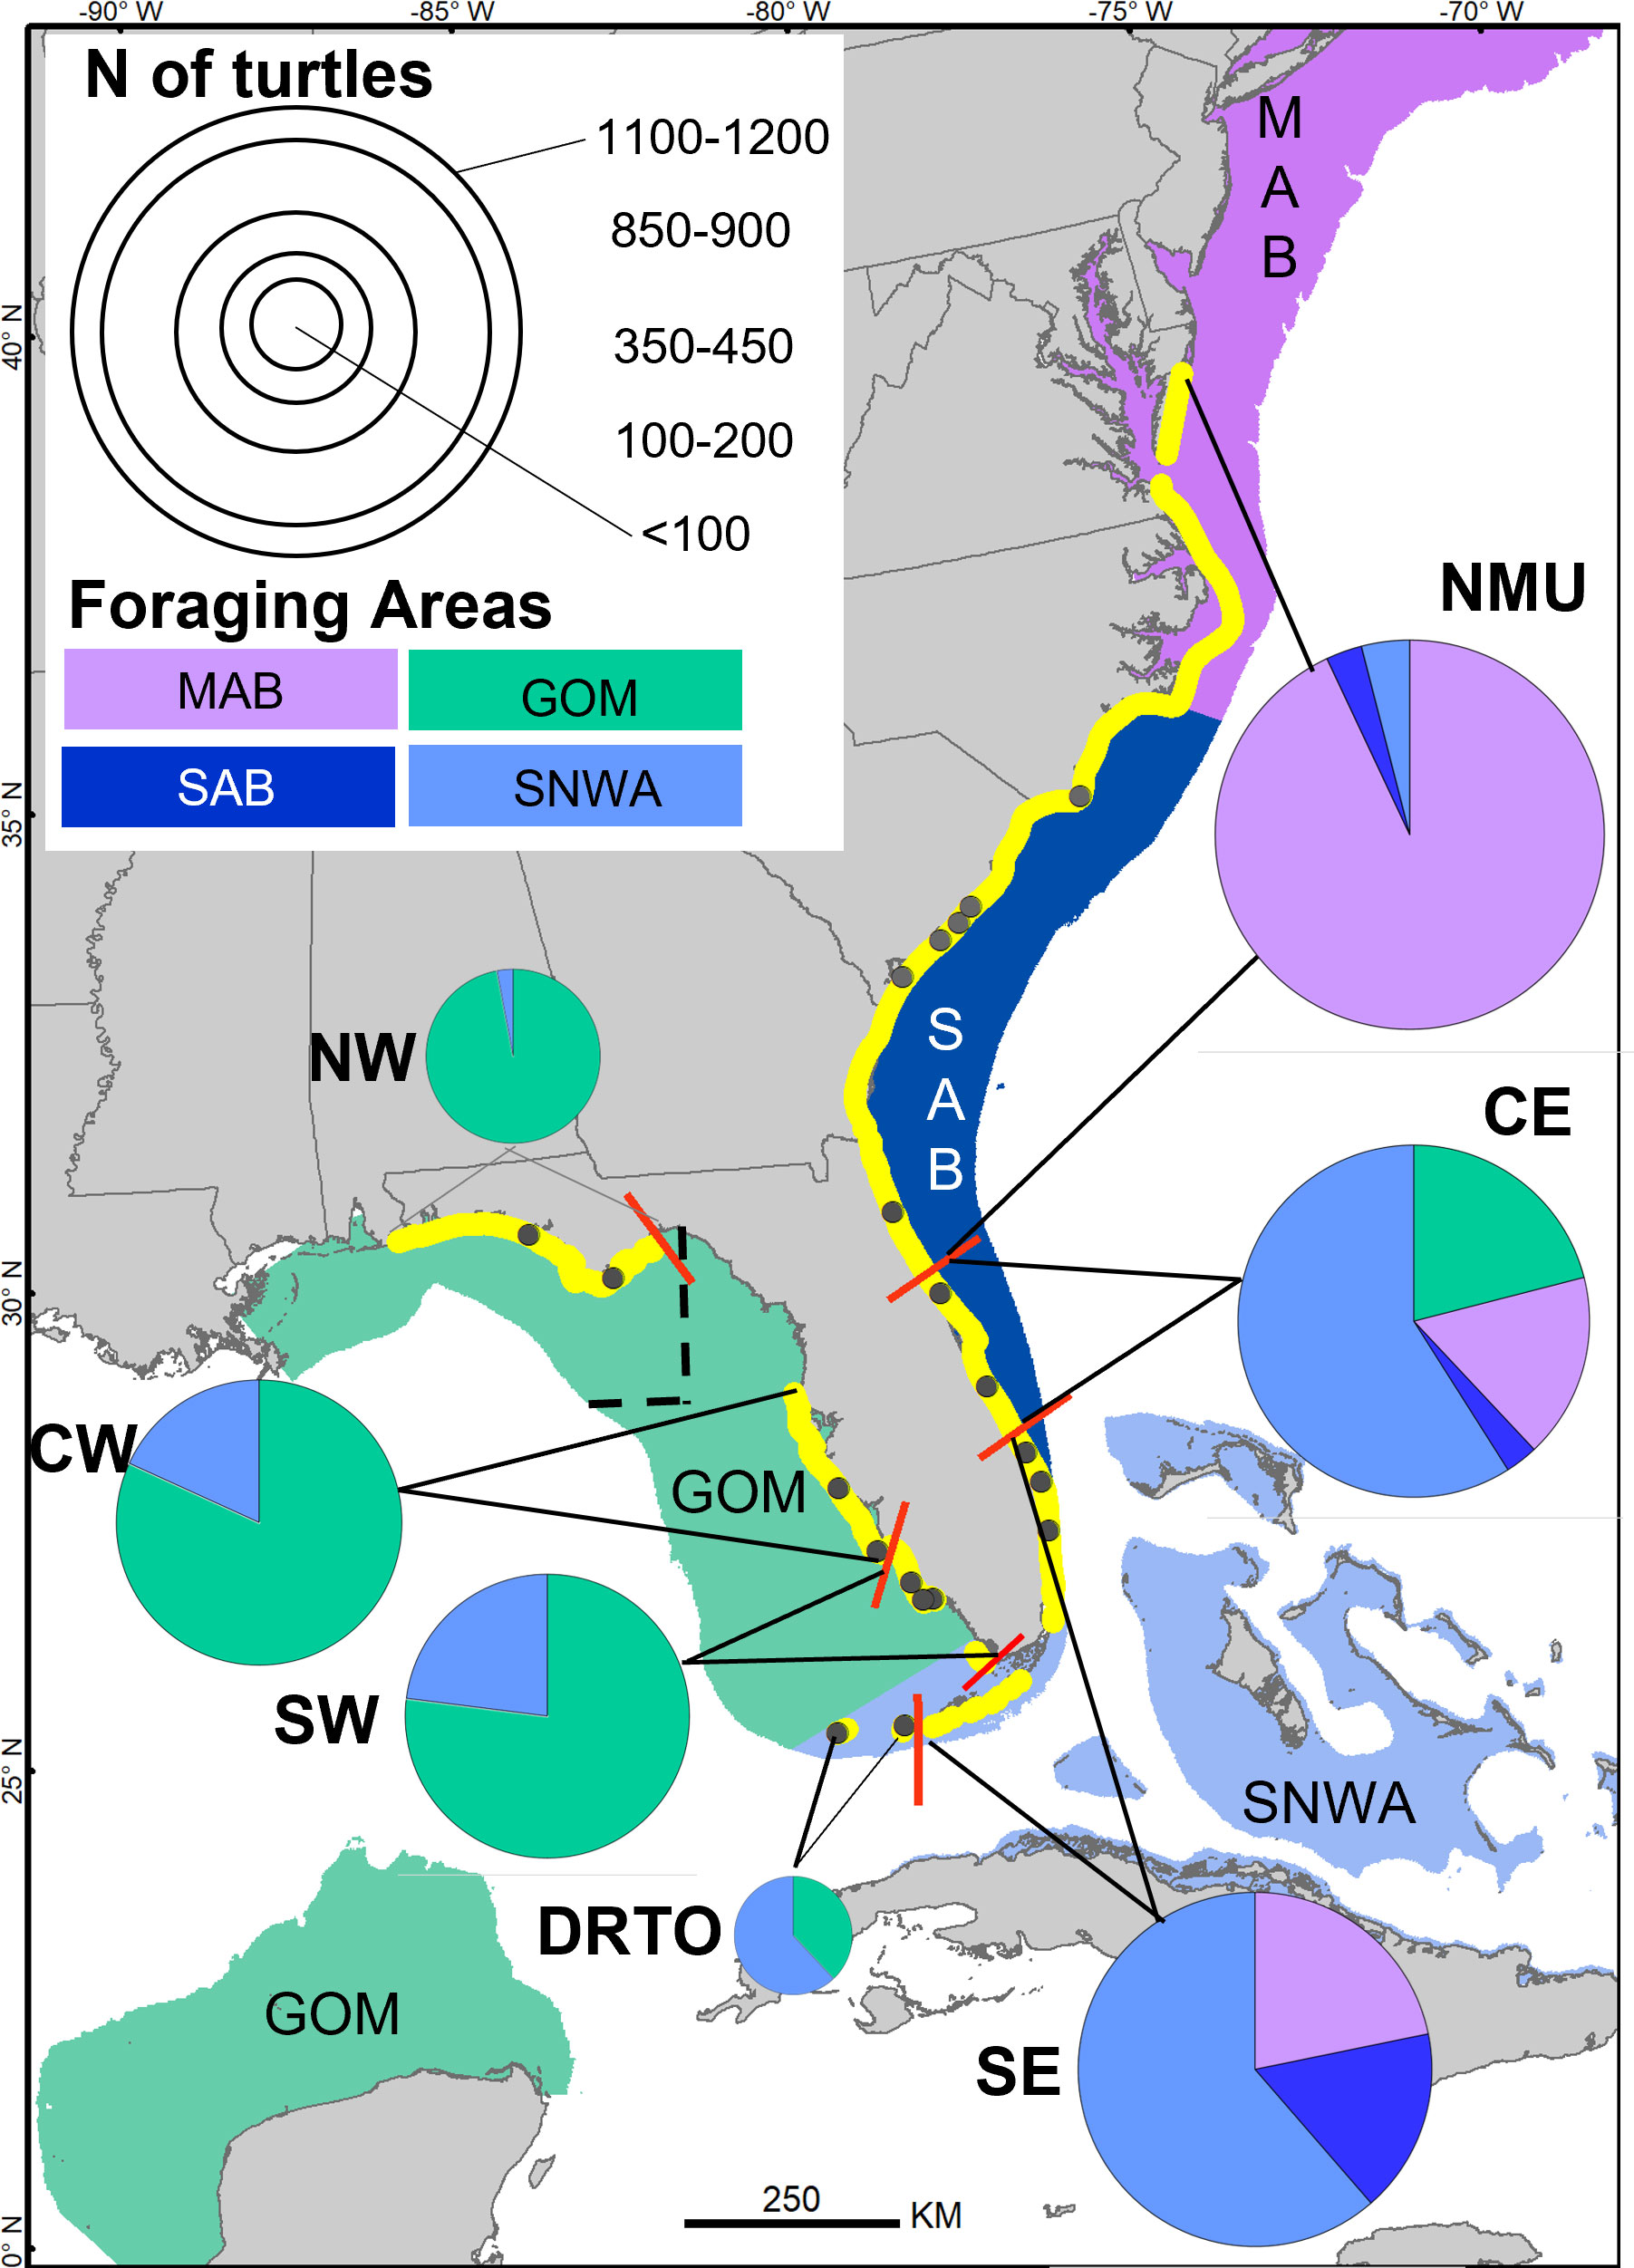
Figure 1 Utilization of four regional foraging areas by loggerheads of Management Units (MU) nesting in the southeastern United States based on stable isotope analysis of samples from 4057 nesting turtles (individual-assignment approach). The four regional foraging areas are along the continental shelfs and are the MAB (Mid-Atlantic Bight), the SAB (South Atlantic Bight), the SNWA (Subtropical Northwest Atlantic) and the GOM (Gulf of Mexico). GOM is separated (dashed black line) into three sub-areas: NGOM, EGOM and SGOM described in the methods but that were not used in the final analysis. Red bars separate the nesting beaches (in yellow) used by different MUs, which are the NMU (Northern MU), CE (Central-East Florida MU), SE (Southeast Florida MU), DRTO (Dry Tortugas MU), SW (Southwest Florida MU), CW (Central-West Florida MU), NW (Northwest Florida MU). Black dots depict nesting sites where samples were collected for this study (listed in Supplementary Table 1). Size of pie charts reflects the number of females sampled from each MU during 2013–2018 and assigned to a foraging area (p ≥ 0.667). The sample sizes for each MU are as follows: NMU = 1196, CE = 878, SE = 886, DRTO = 73, SW = 397, CW = 436, and NW = 191.
Skin samples were collected from nesting females at five sites (ACNWR: Archie Carr National Wildlife Refuge located in CE MU; KEE: Keewaydin Island located in SW; CK: Casey Key located in CW MU; SGI: St. George Island located in NW MU; DRTO: Dry Tortugas National Park (Hart et al., 2022) located in DRTO MU) in conjunction with nighttime tagging mark-recapture programs. The identity of each female sampled was determined using physical tags (Inconel metal tags and/or PIT tags) (Tucker et al., 2014; Ceriani et al., 2015; Hart et al., 2015; Phillips et al., 2021; Silver-Gorges et al., 2021). Skin samples were collected using 4-6 mm biopsy punches from either the right shoulder or the soft skin from the inside trailing edge of the rear flipper. Skin samples were preserved in 70% ethanol (n = 1589), in a non-frost-free freezer at −20°C (n = 446) or in 95% ethanol (n = 167) until analysis. The former two methods are widely used and have no (or negligeble) effect on skin tissue isotopic compositions (Barrow et al., 2008). The effects that a > 70% ethanol concentration has on the isotopic values of stored samples have been less studied but Bradshaw et al. (2017) found no significant differences in stable isotope values in green turtle epidermis preserved in 70% ethanol and 96% ethanol. Thus, we considered all skin samples as one sample group regardless of the preservation method.
Whole UHE (3-5/clutch) were collected and preserved frozen until analysis. UHE were collected instead of skin samples from clutches of identified females at an additional site where females were identified through nighttime tagging mark-recapture (SAN: Sanibel Island). At the remaining Florida sites, where only next-day nesting beach surveys were conducted, the identity of the female was unknown. Thus, some level of pseudoreplication cannot be excluded, particularly from four sites (PAN: Panama City, TTINWR: Ten Thousand Island National Wildlife Refuge, CRFL: Cape Romano, and NSB: New Smyrna Beach) with low nest density (< 325 clutches/year). However, most sites had high nest densities (range: 680–7930 clutches/year). Regardless of the nesting site, sampled clutches were chosen using a spatially and temporally systematic strategy (i.e., if the goal was to sample 50 clutches at a site that hosted an average of 1000 clutches/season, we sampled every 20th clutch laid) (Brost et al., 2015) since it is unknown whether foraging area of origin influences time of arrival to the nesting site. We analyzed an average ± SD of 14% ± 12% (range: 3%–42%) and 2% ± 2% (range: 1%–10%) of the clutches laid each year at low- and high-nest density sites, respectively. Hence, we expect pseudoreplication to be low.
FEY were collected within 12 hours of deposition from clutches deposited on NMU beaches (from SJC to BHI [Bald Head Island, North Carolina]) in conjunction with a genetic fingerprinting study (Shamblin et al., 2017) that determined the identity of each female via multi-locus genetic tags extracted from maternal DNA found in the shell of freshly laid eggs. Egg components were separated with an egg separator and FEY was either frozen or preserved in 95% ethanol for SIA. Both preservation methods have been used in the past and conversion equations from differently preserved FEY to epidermis have been developed (Kaufman et al., 2014).
Laboratory analyses
Skin samples were prepared for SIA of carbon and nitrogen following standard procedures (Ceriani et al., 2014a). UHE were thawed, rinsed to remove sand, and opened while ensuring the egg contents did not touch the external surface of the eggshell. It is often not possible to distinguish between egg components; thus, the entire contents of UHE were used for analysis. If the UHE contained an embryo with a distinct yolk sac, only the yolk sac was retained for analysis. Frozen contents of FEY and UHE were freeze-dried for 72 hours and then homogenized with mortar and pestle. Subsamples of FEY preserved in 95% ethanol were pipetted into weigh boats, placed under a fume hood for 48 hours and then dried at 60°C for 48−72 hours to remove any residual ethanol. Prior to pipetting, ethanol-preserved FEY were shaken and mixed well to obtain a homogenous portion of the liquid (Kaufman et al., 2014). Dry epidermis and a subset of FEY and UHE homogenized material were lipid-extracted using an accelerated solvent extractor (ASE 300) with petroleum ether as solvent for three consecutive cycles (Kaufman et al., 2014).
Subsamples of prepared tissues (0.3–0.7 mg) were weighed with a microbalance and sealed into sterile 3 mm x 5 mm tin capsules and analyzed for % carbon, % nitrogen, δ13C, and δ15N values. Analyses were performed at the Marine Environmental Chemistry Laboratory at the University of South Florida College of Marine Science (St. Petersburg, FL, USA), where samples were converted to N2 and CO2 using a Carlo-Erba NA EA1108 Elemental Analyzer (Thermoquest Italia, S.p.A., Rodano, Italy) and analyzed with a continuous flow isotope ratio mass spectrometer (Delta PlusXP, Thermo Finnigan, Bremen, Germany). Stable isotope ratios were expressed in conventional notation as parts per thousand (‰) according to the following equation:
Where X is 15N or 13C, and R represents the corresponding ratios of heavy to light isotopes (15N:14N and 13C:12C) in the sample and international standard, respectively.
Raw measurements were calibrated relative to VPDB (δ13C) and AT-Air (δ15N) with certified reference materials NIST 8574 (δ13C = +37.63 ± 0.10 ‰, δ15N = +47.57 ± 0.22 ‰, N = 9.52%, C = 40.81%, C:N [molar] = 5.0) and NIST 8573 (δ13C = -26.39 ± 0.09‰, δ15N = -4.52 ± 0.12‰ N = 9.52%, C = 40.81%, C:N [molar] = 5.0). Estimates of analytical precision were obtained by replicate (n = 1139) measurements of an internal laboratory reference material (NIST1577b Bovine liver, δ13C = -21.69 ± 0.14‰, δ15N = 7.83 ± 0.16‰, %N = 9.95 ± 0.48%, %C =48.04 ± 0.71%, C:N [molar] = 5.63 ± 0.27) and yielded a precision (reflecting ±1 SD) ≤ 0.36 ‰ for δ13C and ≤ 0.26 ‰ for δ15N.
We chose to use epidermis as reference tissue for this study because epidermis accounted for the largest portion of the samples analyzed. The isotopic values of frozen and 95% ethanol-preserved FEY were converted into epidermis values using the equations described in Kaufman et al. (2014). Two to three UHE/clutch were processed, and the average δ13C and δ15N values were used to represent each clutch isotopically (Ceriani et al., 2014a). Only clutches with low unhatched egg isotopic variability (SE ≤ 0.5 ‰) were retained and included in the dataset for the remaining analysis. The averaged isotopic values of UHE were converted to epidermis values using the equation by Ceriani et al. (2014a).
Data analyses
The likelihood-based nominal assignment approach requires three sample groups and their sample size can affect the results: 1) the training group or training dataset includes individuals with known foraging areas, whose isotopic values should therefore represent those foraging areas, and is used to calibrate the assignment model, 2) the priors group represents the relative importance of each foraging area based on telemetry or mark-recapture studies and is used to inform the model, and 3) the unknown group or the individuals of unknown foraging area. To assign turtles of unknown foraging area to a likely foraging area through isotope values of their tissues, first the isotopic values of different foraging areas need to be established. To this aim, a sample of 207 adult loggerheads with both a known foraging area (192 from satellite tracking data and 15 captured at the foraging site) and isotopic value was used to determine the following six arbitrary foraging areas on the continental shelf (waters< 200 m depth) known to be used by adult females of the NWA loggerhead breeding aggregation (Figure 1). These were the Mid-Atlantic Bight (MAB), South Atlantic Bight (SAB), Subtropical Northwest Atlantic (SNWA), Eastern Gulf of Mexico (EGOM), Northern Gulf of Mexico (NGOM), and Southern Gulf of Mexico (SGOM). The MAB is defined as the region enclosed by the coastline from Cape Cod (Massachusetts) to Cape Hatteras (North Carolina). The SAB extends from Cape Hatteras (North Carolina) to West Palm Beach (Florida). The SNWA encompasses the water surrounding the Bahamas Banks and Florida Keys. The EGOM includes waters on the continental shelf north of Cape Sable, Florida to Apalachee Bay, Florida. The NGOM foraging area extends from Apalachee Bay, Florida, as far west as we currently have data. The SGOM foraging area is located to the north of the Yucatán Peninsula (Mexico), also known as the Campeche Bank. These regional foraging sites were described in previous studies (Ceriani et al., 2015; Vander Zanden et al., 2015). The isotopic values and the regional foraging area for 60 individuals were obtained from Pfaller et al. (2020). The remaining 147 of the 207 individuals were either females equipped with satellite tags and sampled for SIA after nesting on beaches in Florida (N = 118, from Tucker et al., 2014; and Ceriani et al., 2017) or were females with isotopic values presented here for the first time and with post-nesting migration and foraging area use that have been described elsewhere (N = 10 from KEE and N = 19 from ACNWR, Evans et al., 2019; Phillips et al., 2021). The centroid of the foraging area of each female was determined by averaging the best daily locations of a minimum of 30 days once displacement distance from the rookery reached an asymptote, which is considered as indicating the beginning of residency (Ceriani et al., 2012). The centroid of the foraging area of each of these 147 females (all within neritic waters< 200 m depth) was then used to group them into one of the six regional foraging areas.
We–as others (Hatase et al., 2002; Ceriani et al., 2012; Seminoff et al., 2012)–assumed that the isotopic values of tissues from turtles sampled at the nesting site represent the isotopic values of the foraging areas used by females during the non-breeding period. We also assumed that females exhibit fidelity to foraging area and consistency in resource use and thus, the foraging area used by a post-nesting female identified using satellite telemetry is the same foraging area from which the female will migrate to return for breeding a few years later. These assumptions are supported by repeated tracking of post-nesting loggerheads in the NWA (Hawkes et al., 2011; Tucker et al., 2014; Evans et al., 2019; Phillips et al., 2021) and elsewhere (Broderick et al., 2007; Marcovaldi et al., 2010) and by serial measurements of isotope values in tissues collected from satellite-tracked females (e.g., scute: Vander Zanden et al., 2016) (epidermis: Tucker et al., 2014; Bradshaw et al., 2017). However, while this applies to most NWA post-nesting loggerheads that have year-round residency (Hardy et al., 2014; Hart et al., 2014), this is not exactly true for loggerheads foraging at high latitudes along the Atlantic coast of the United States that use two foraging areas. After nesting they first migrate and forage in the MAB until October and then they overwinter in the SAB (November-April) (Mansfield et al., 2009; Hawkes et al., 2011). Thus, for these individuals the above method to calculate the foraging centroid represents the summer location (MAB). Yet, the stable isotopic composition of the tissue sampled at the nesting area probably also reflects the isotopic values of the summer foraging area (MAB) instead of the winter foraging area (SAB), despite the latter being the last area frequented before nesting, for these females because metabolic rates and, thus, tissue turnover rates, increase during summer months (Wallace and Jones, 2008) and skin turnover rate in adult sea turtles is on the order of many months (see Study Sites and Sample Collection, above).
We used the Anderson-Darling test and Levene’s test to examine normality and homogeneity of variance in δ13C and δ15N values of the 207 adult loggerhead turtles with a known foraging area. Since δ13C data were not normal and did not meet equal variance, we: (i) conducted PERMANOVA and post-hoc tests (functions adonis2 and pairwise.perm.manova of the packages vegan and RVAideMemoire) to identify significant differences, in δ13C and δ15N values, among the six regional foraging areas, (ii) combined foraging areas that were not significantly different and contiguous (NGOM, EGOM and SGOM; see Results) and (iii) on the resulting four new foraging areas we performed another PERMANOVA and post-hoc test.
The stable isotope values of the 207 individuals with known foraging areas were used as training data in the quadratic discriminant function analysis (QDA), run through the package MASS for R, to estimate the probabilities of turtles with unknown foraging area to frequent the different foraging areas. QDA calculates posterior probabilities for each turtle to forage in each area. The sum of the posterior probabilities for each turtle is 1. If one of the putative foraging areas has a posterior probability greater than a certain arbitrary threshold (e.g., 0.67, 0.8), the turtle is assigned to that foraging area. If none of the putative foraging areas has a posterior probability greater than the threshold, the turtle is considered unassigned. QDA was used instead of LDA (linear discriminant analysis) because the data did not meet the assumption of equal variance required by the latter. While LDA needs a training sample with just one case per foraging area, QDA needs at least three cases in our context with four foraging areas (the number of foraging areas isotopically distinct; see Results). The QDA was run with either uniform or non-uniform priors (i.e., MU-specific priors based on a large number of satellite-tracked females; n = 395; Table 1). We did not use previously summarized priors (Vander Zanden et al., 2015; Pfaller et al., 2020) because (i) they are outdated and new information has become available (Hart et al., 2021), (ii) we identified some errors of duplications (i.e., the same individual was included in more than one publication and counted multiple times) in prior summary efforts, and (iii) we set more stringent criteria of inclusion (i.e., we included only females that remained a minimum of 30 days at the foraging area).
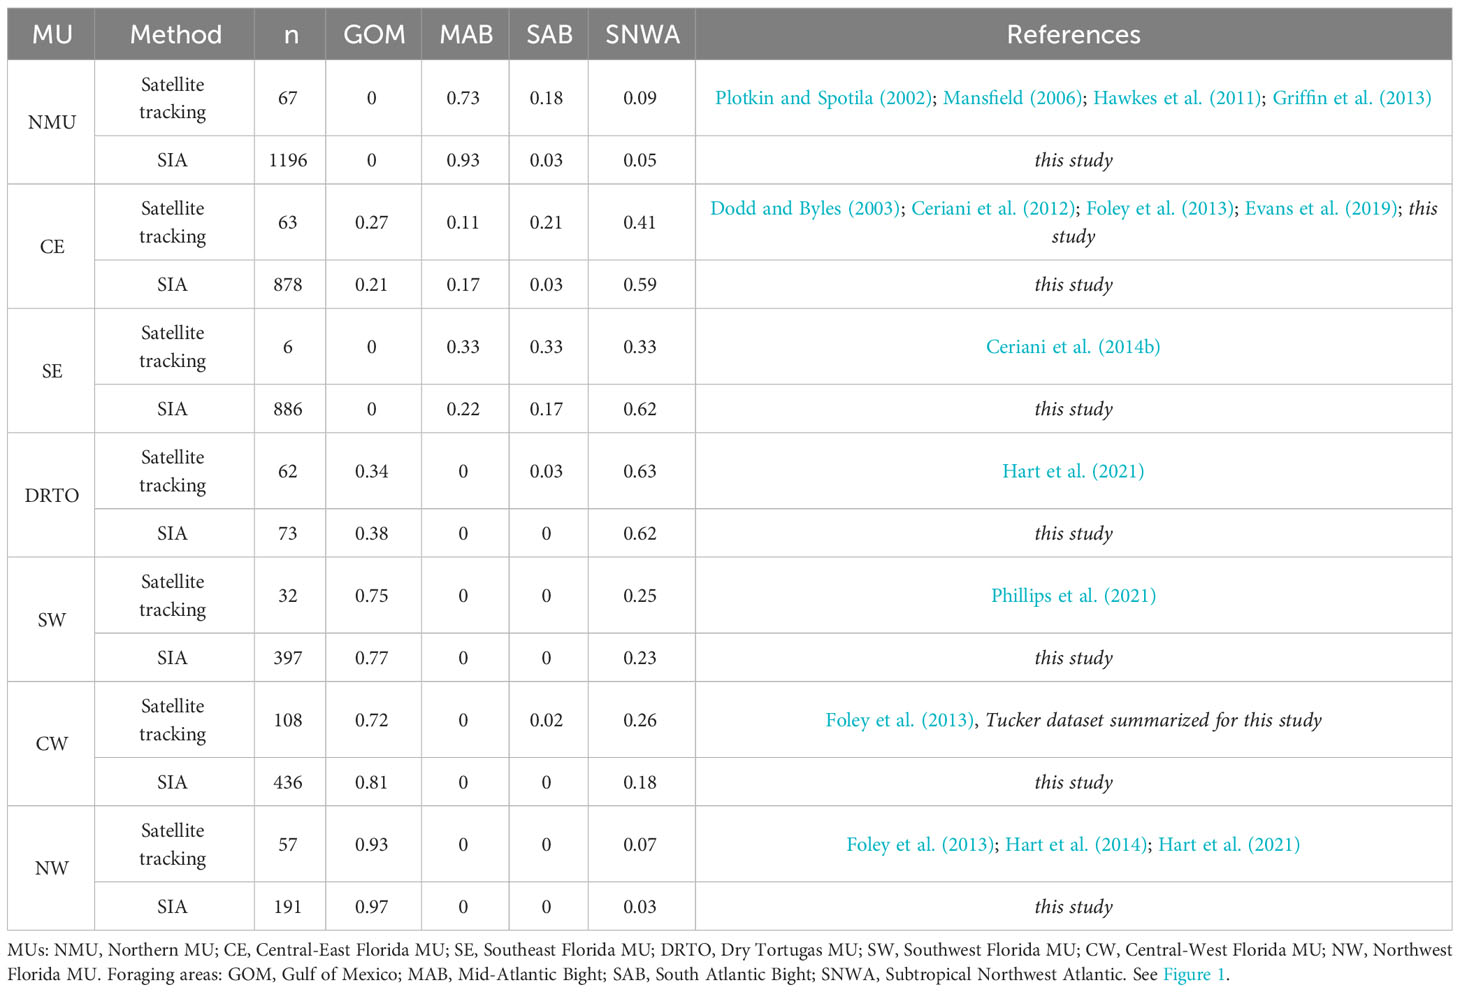
Table 1 Proportion of satellite-tracked loggerheads (n = 395, from nesting beach to foraging area based on published and unpublished data) and proportion of individuals assigned (n = 4057) to likely foraging area using stable isotope analysis (SIA), from each of the seven Management Units (MUs) found in the southeastern United States that used one of the four foraging areas described in this study.
To estimate the proportions of a nesting assemblage (MU, Florida, or NWA assemblage) that use each regional foraging area, we undertook two different approaches. The first approach (here called the individual-assignment approach) is commonly used (Ceriani et al., 2015; Bradshaw et al., 2017; Pfaller et al., 2020; Okuyama et al., 2022). In this approach, each nesting female is assigned to a regional foraging area through QDA (see above). With this approach, several individuals will result to be “unassigned” (i.e., it is not possible to assign it to any foraging area), if all areas have a posterior probability below the threshold. The second approach (here called population approach) estimates the proportion of nesting females that use a regional foraging area as the average probability of those nesting females to use that foraging area (obtained from the QDA). This approach assumes that if a group has an average probability to use a certain area, then a corresponding proportion of the group will occur in that area (and vice versa, as assumed with the use of priors above). Because it does not require individual assignments, the population approach has the advantage of (i) avoiding the arbitrariness of thresholds and of (ii) using all the available information, including data from individuals discarded by the individual-assignment approach. To our knowledge, this is the first time that this approach is applied in sea turtle studies.
To explore the trade-off between assignment accuracy and sample size, we used the leave-one-out procedure of the QDA. The probabilities of using each regional foraging area were estimated for one individual at a time among the 169 nesting females (out of the 207) with both known foraging area and known MU, with the other 168 used as the training group. The comparison between the estimated and the real foraging area provided the error of the assessment. The procedure was performed two times on the same dataset, using uniform and non-uniform priors. For assessing the individual-assignment approach, we repeated the leave-one-out procedure using four posterior probability thresholds used in prior studies: p ≥ 0.5 (Ceriani et al., 2015), p ≥ 0.667 (Ceriani et al., 2014b), p ≥ 0.8 (Pajuelo et al., 2012) and p ≥ 0.9 (Ceriani et al., 2014b). With four possible regional foraging areas, these thresholds provide a three-fold, six-fold, 12-fold, and 27-fold improvement over random odds (Wunder, 2012), respectively. For comparing the population approach to the individual approach, we estimated the number of individuals of an MU using each regional foraging areas by multiplying the average probabilities of using each foraging areas by the number of sampled nesting females of the MU. These estimated numbers were rounded to the nearest integer and in case of mismatch of the total number of turtles in the MU, the estimated number closer to 0.5 was manually rounded to the other nearest integer.
To explore the effect of sample size of the training sample, we conducted the same leave-one-out procedure described above but with different training datasets including only 10, 15, 20, 25, 30, 50, 80, 110, or 140 of the 169 turtles of the whole training dataset. For each of these sample sizes, 100 training datasets were obtained by random sampling. For the sample size limitations of QDA mentioned above, only subsamples of a minimum of 20 turtles could be tested. To test lower samples (with 10 and 15 turtles), an exception was made to use LDA for this exercise, although not appropriate for the nature of the data (see above). To explore the effect of sample size of turtles providing unequal priors, we conducted the same leave-one-out procedure but with different prior datasets including only 10, 20, 30, 50, 100, 150, 200, or 300 of the 395 turtles available. For each of these sample sizes, 100 prior datasets were obtained by random sampling.
All epidermis or egg samples from female loggerheads with unknown foraging areas were included in the QDA to cross-check foraging-area assignments when individual females were sampled repeatedly within or across seasons, but each individual was included only once–the oldest sample was used as per Pfaller et al. (2020)–when inferring foraging area use at a population scale and comparing the contribution of different foraging areas to each MU and for the overall Florida and NWA.
To compare the proportion of females using each regional foraging areas among MUs and among years within MU and between the individual-assignment and population approaches, we used Fisher’s exact test (with post-hoc pair-wise comparison with Holm-Bonferroni correction, when needed). To extrapolate the importance of each regional foraging area to the overall breeding aggregation nesting in Florida and in the NWA, we weighed the relative importance of each MU for each year of the study with nest counts (nest count data for Florida: Ceriani et al., 2019, FWC Statewide Nesting Beach Survey Program database; Georgia: GADNR Sea Turtle Conservation Program; South Carolina: SCDNR Marine Turtle Conservation Program; North Carolina: NC Wildlife Resources Commission).
To investigate foraging site fidelity, a group of females that were sampled multiple times (within season and over multiple breeding seasons) was used to (i) examine isotopic consistency among serially collected samples using the first sampling event as a reference and to (ii) investigate consistency in regional foraging area assignment. Since here the focus is on the individual history, the individual-assignment approach was used.
Results
Samples, values, and foraging areas
A total of 7469 samples (2202 skin samples, 1567 FEY samples and 3700 UHE from 1749 clutches), representing 5168 individual females, were collected from 21 nesting sites in the NWA between 2013 and 2018 and processed for SIA (Supplementary Table 1, Hart et al., 2022). Thirty-four females (out of 5168) were equipped with a satellite transmitter after nesting in conjunction with other projects. Two hundred and eighty-nine females were sampled repeatedly (n = 246 individuals were sampled twice, n = 32 females were sampled three times, n = 7 females sampled four times, n = 3 females sampled 5 times and n = 1 sampled six times) within the same season (n = 148), across seasons (n = 119) or both within and among seasons (n = 22). The same tissue was sampled for 277 females, different tissues were sampled for 12 individuals.
The epidermis isotopic values (measured in the laboratory or derived from tissue-tissue conversion equations) for the 5484 samples collected from females with unknown foraging area ranged from −23.54 to −5.77 ‰ and 0.22 to 21.41 ‰ for δ13C and δ15N, respectively (n = 5484; Supplementary Figure 1A). Mean values were −14.61 ± 2.72 (SD) ‰ and 11.23 ± 3.34 (SD) ‰ for δ13C and δ15N, respectively.
A summary of the epidermis isotopic values by known foraging area for the 207 adult loggerheads that were used as the training dataset in the QDA is provided in Supplementary Table 2 and Supplementary Figure 1B. The combined δ13C and δ15N values of loggerhead epidermis varied significantly among the six regional foraging areas used by these 207 individuals (PERMANOVA, p< 0.001). However, the post-hoc test did not detect significant differences between turtles using the NGOM, EGOM and SGOM. Being isotopically homogenous, these three areas of the Gulf of Mexico were pooled into one broad geographic area (GOM). Among the resulting four regional foraging areas (Figure 1), discrete differences were found in the combined δ13C and δ15N isotope values (PERMANOVA, p< 0.001). All post-hoc pairwise comparisons among areas showed significant differences in δ13C, δ15N or both isotopes.
Method validation
The use of non-uniform priors increased the assignment accuracy of both individual-assignment and population approaches. For the individual-assignment approach, thresholds higher than 0.667 did not represent a real improvement (Table 2). Setting a p-value threshold ≥ 0.667 allowed us to include more females than a p-value threshold ≥ 0.8 (10% more individuals: 82.2% vs. 72.8%) while losing only 1% accuracy (89.2% vs. 90.2%). With this configuration (non-uniform priors and p-value threshold of 0.667), from a total of 5168 individual females, 4057 individuals (79%) were assigned to one of the four foraging areas (see Table 3 for numbers and proportions by year and MU). The population approach showed the best trade-off between accuracy (91.7%) and sample size (100%) compared to the individual-assignment approach (regardless of the threshold of posterior probability of group membership considered) (Table 2). The effect of sample size of the training and prior datasets on the accuracy is shown in Figures 2 and 3.
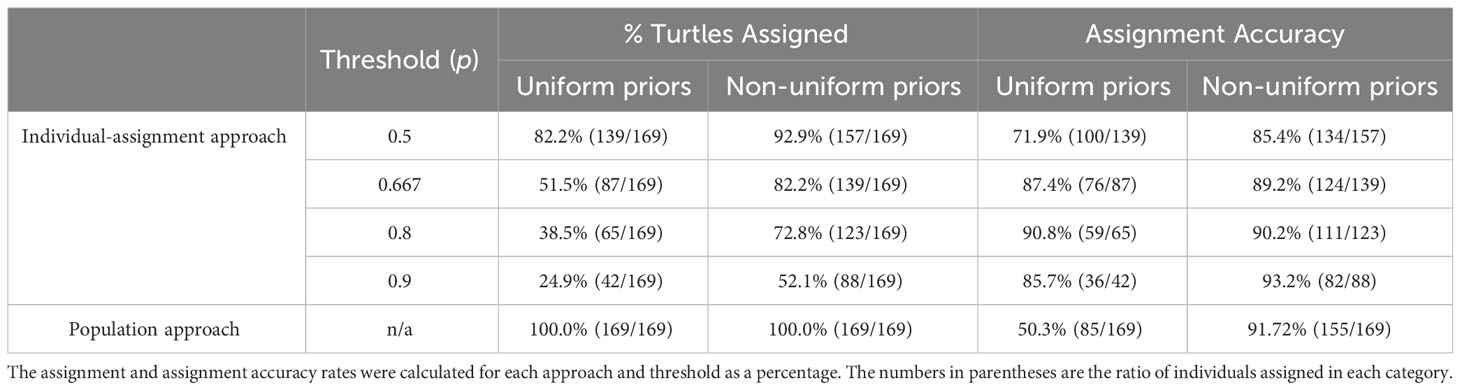
Table 2 Leave-one-out cross validation of the geographic assignment (QDA) with uniform and non-uniform (MU-based) priors conducted for 169 females satellite-tracked from nesting sites in Florida. Results of the individual-based (using various threshold of posterior probability of group membership) and the population approach (last row) are provided.
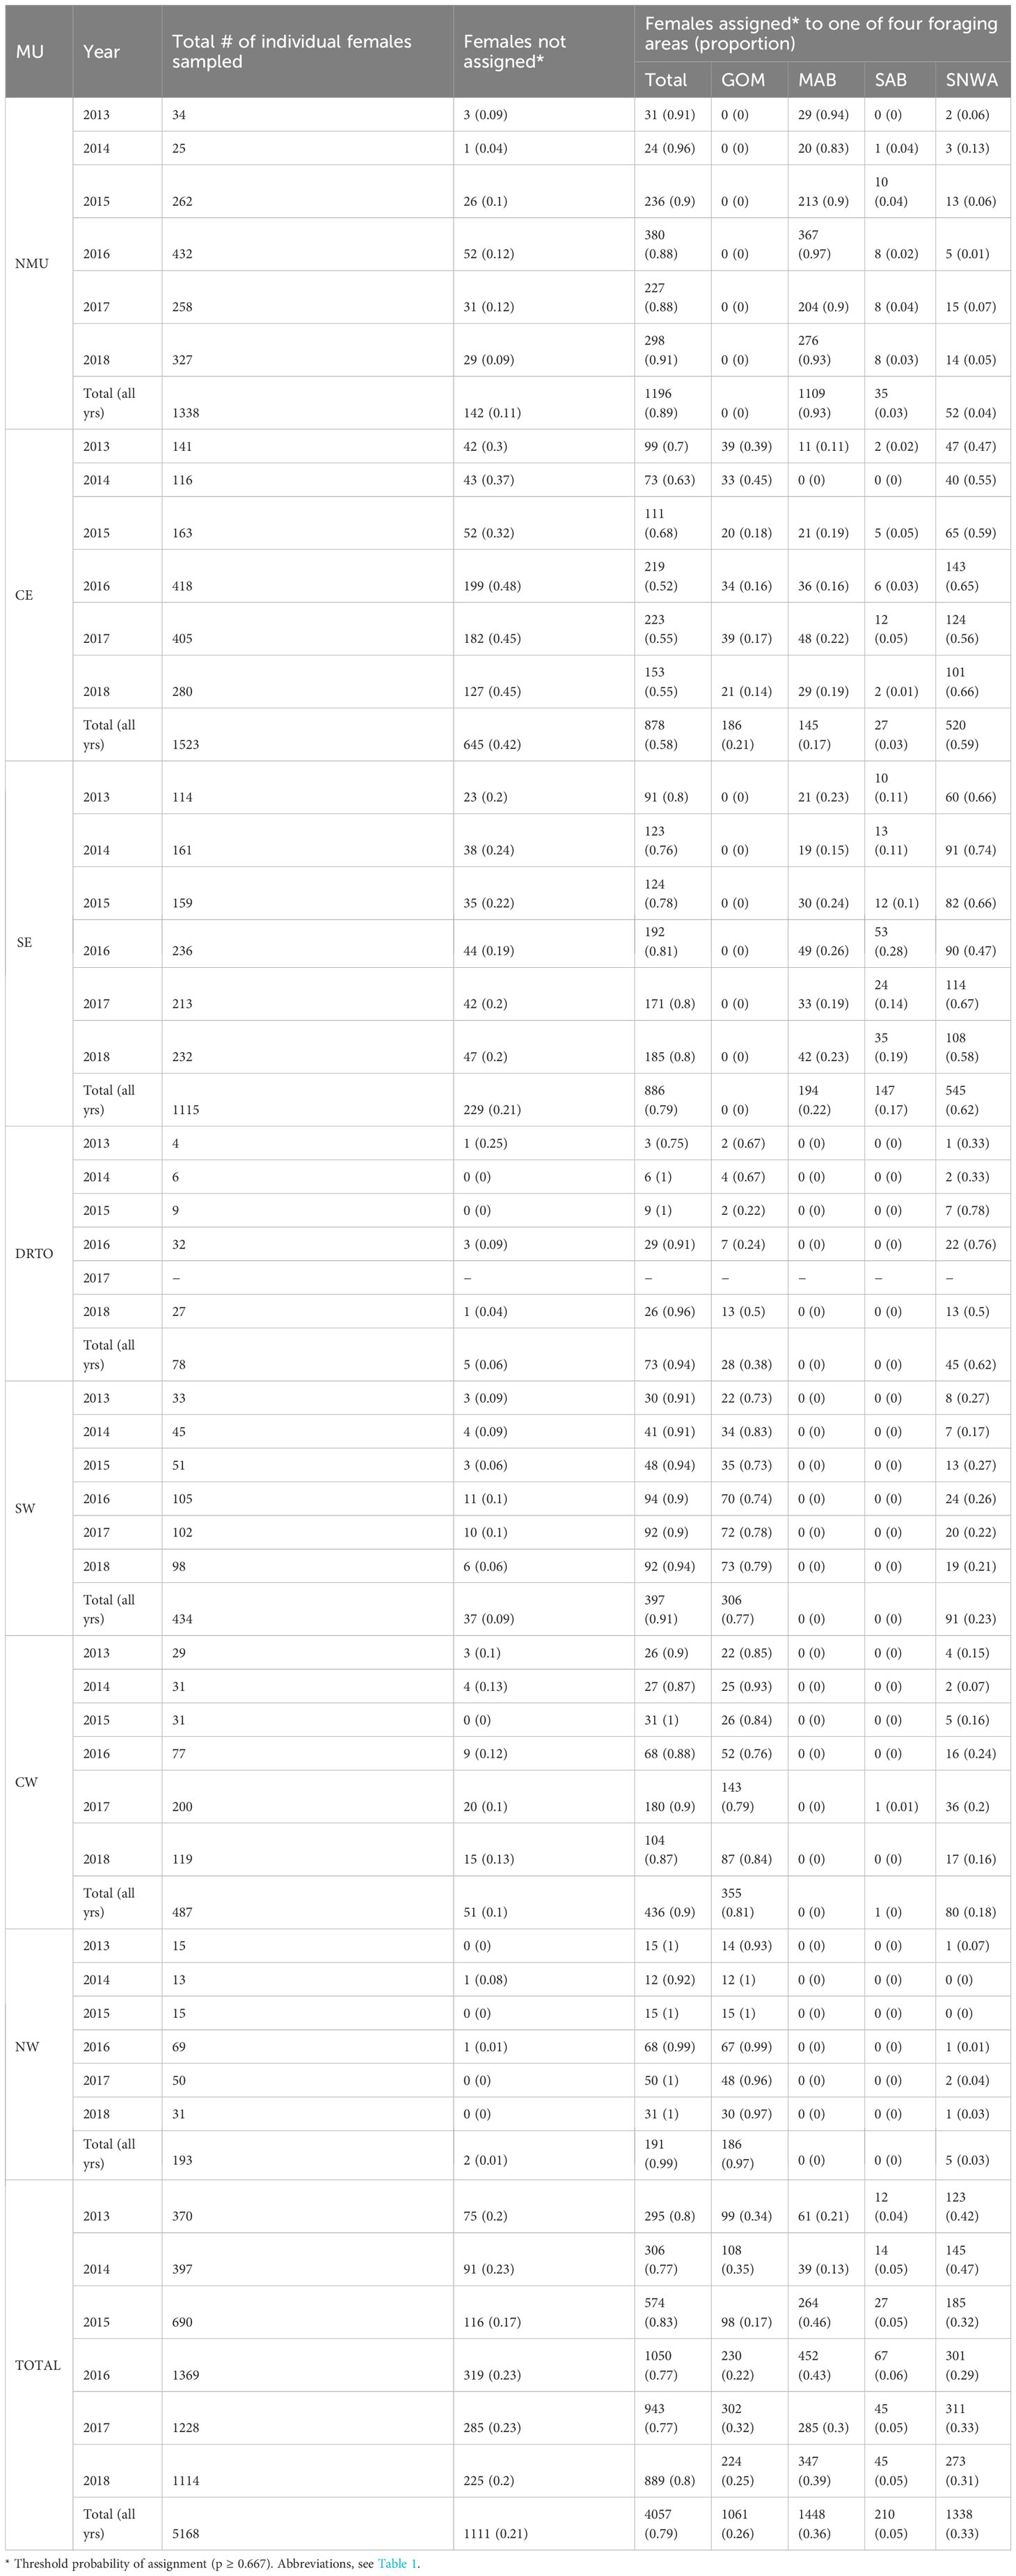
Table 3 Summary of regional foraging area assignments based on stable isotope analysis of samples from loggerheads nesting in the southeastern United States (individual assignment approach).
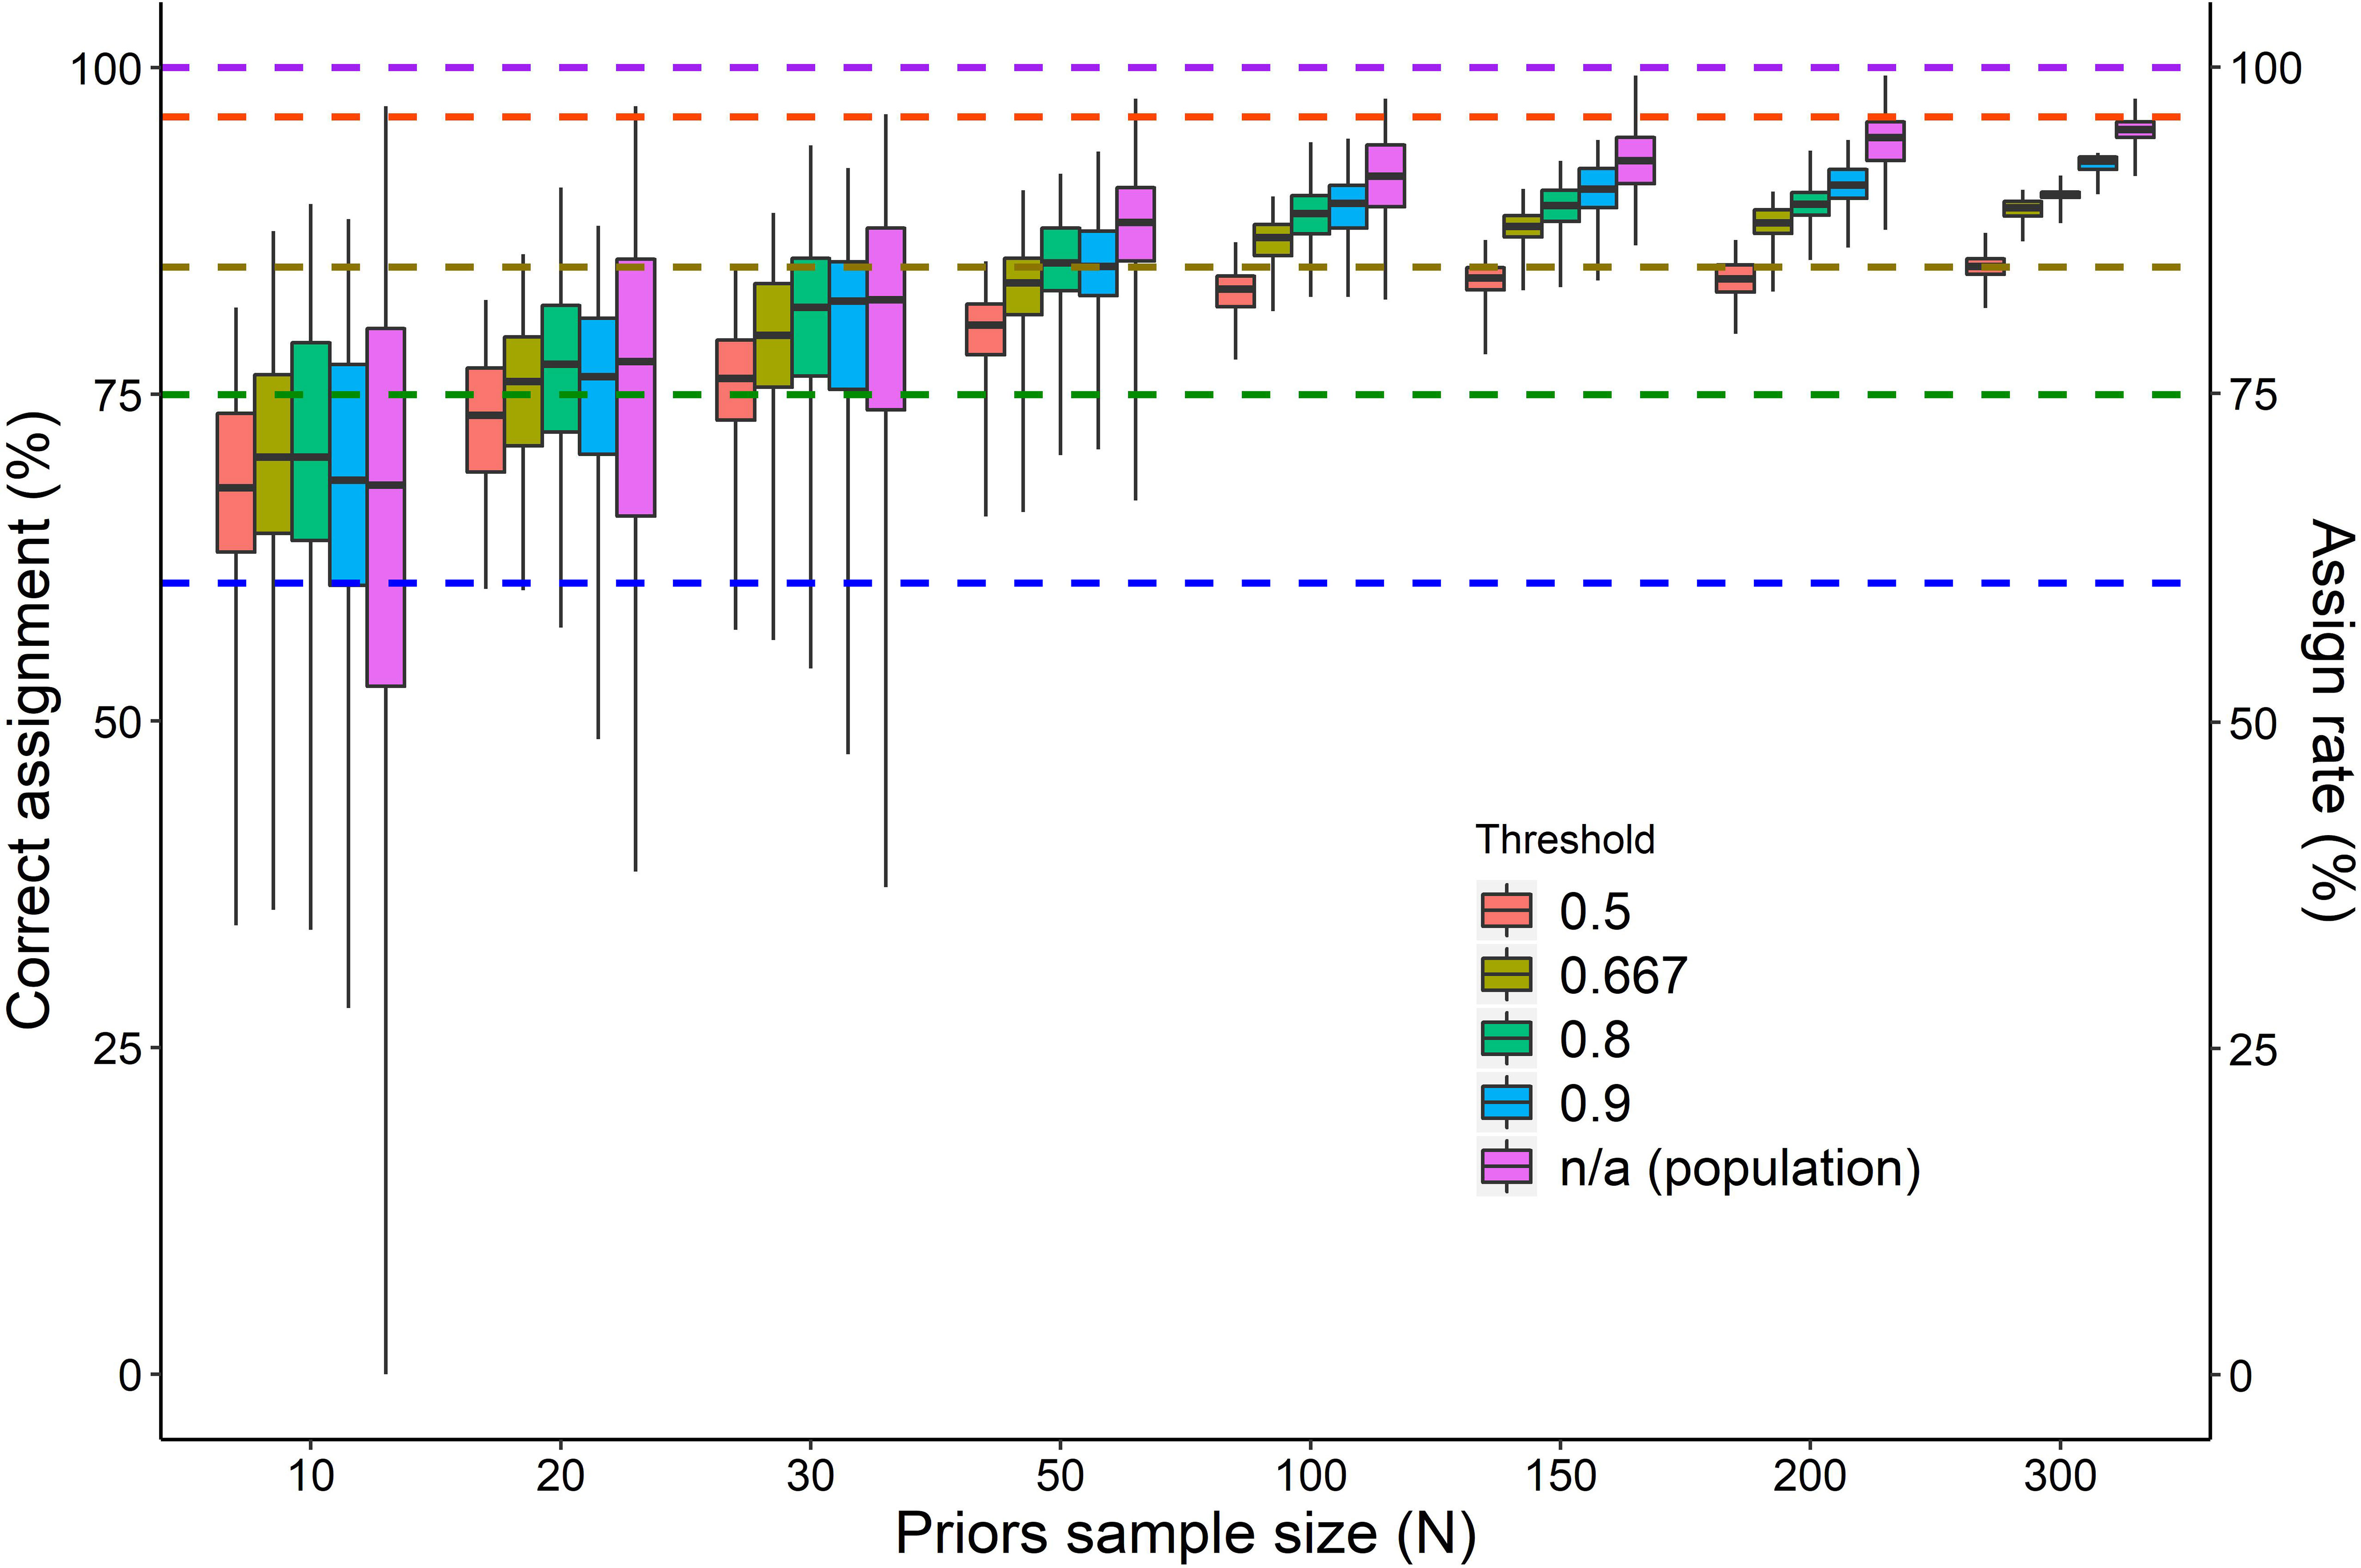
Figure 2 The percentage of test samples correctly assigned to a foraging area resulting from QDA conducted with unequal priors of different sample size (ranging from 10 to 300 turtles out of 395) and different thresholds (individual assignment approach) or no threshold (population assignment approach). For each combination of prior sample size and threshold boxplots of 100 random samplings are shown (median and IQR 25%-75%; whiskers: min-max). Mean assignment rates for the different thresholds are shown as dashed horizontal lines.
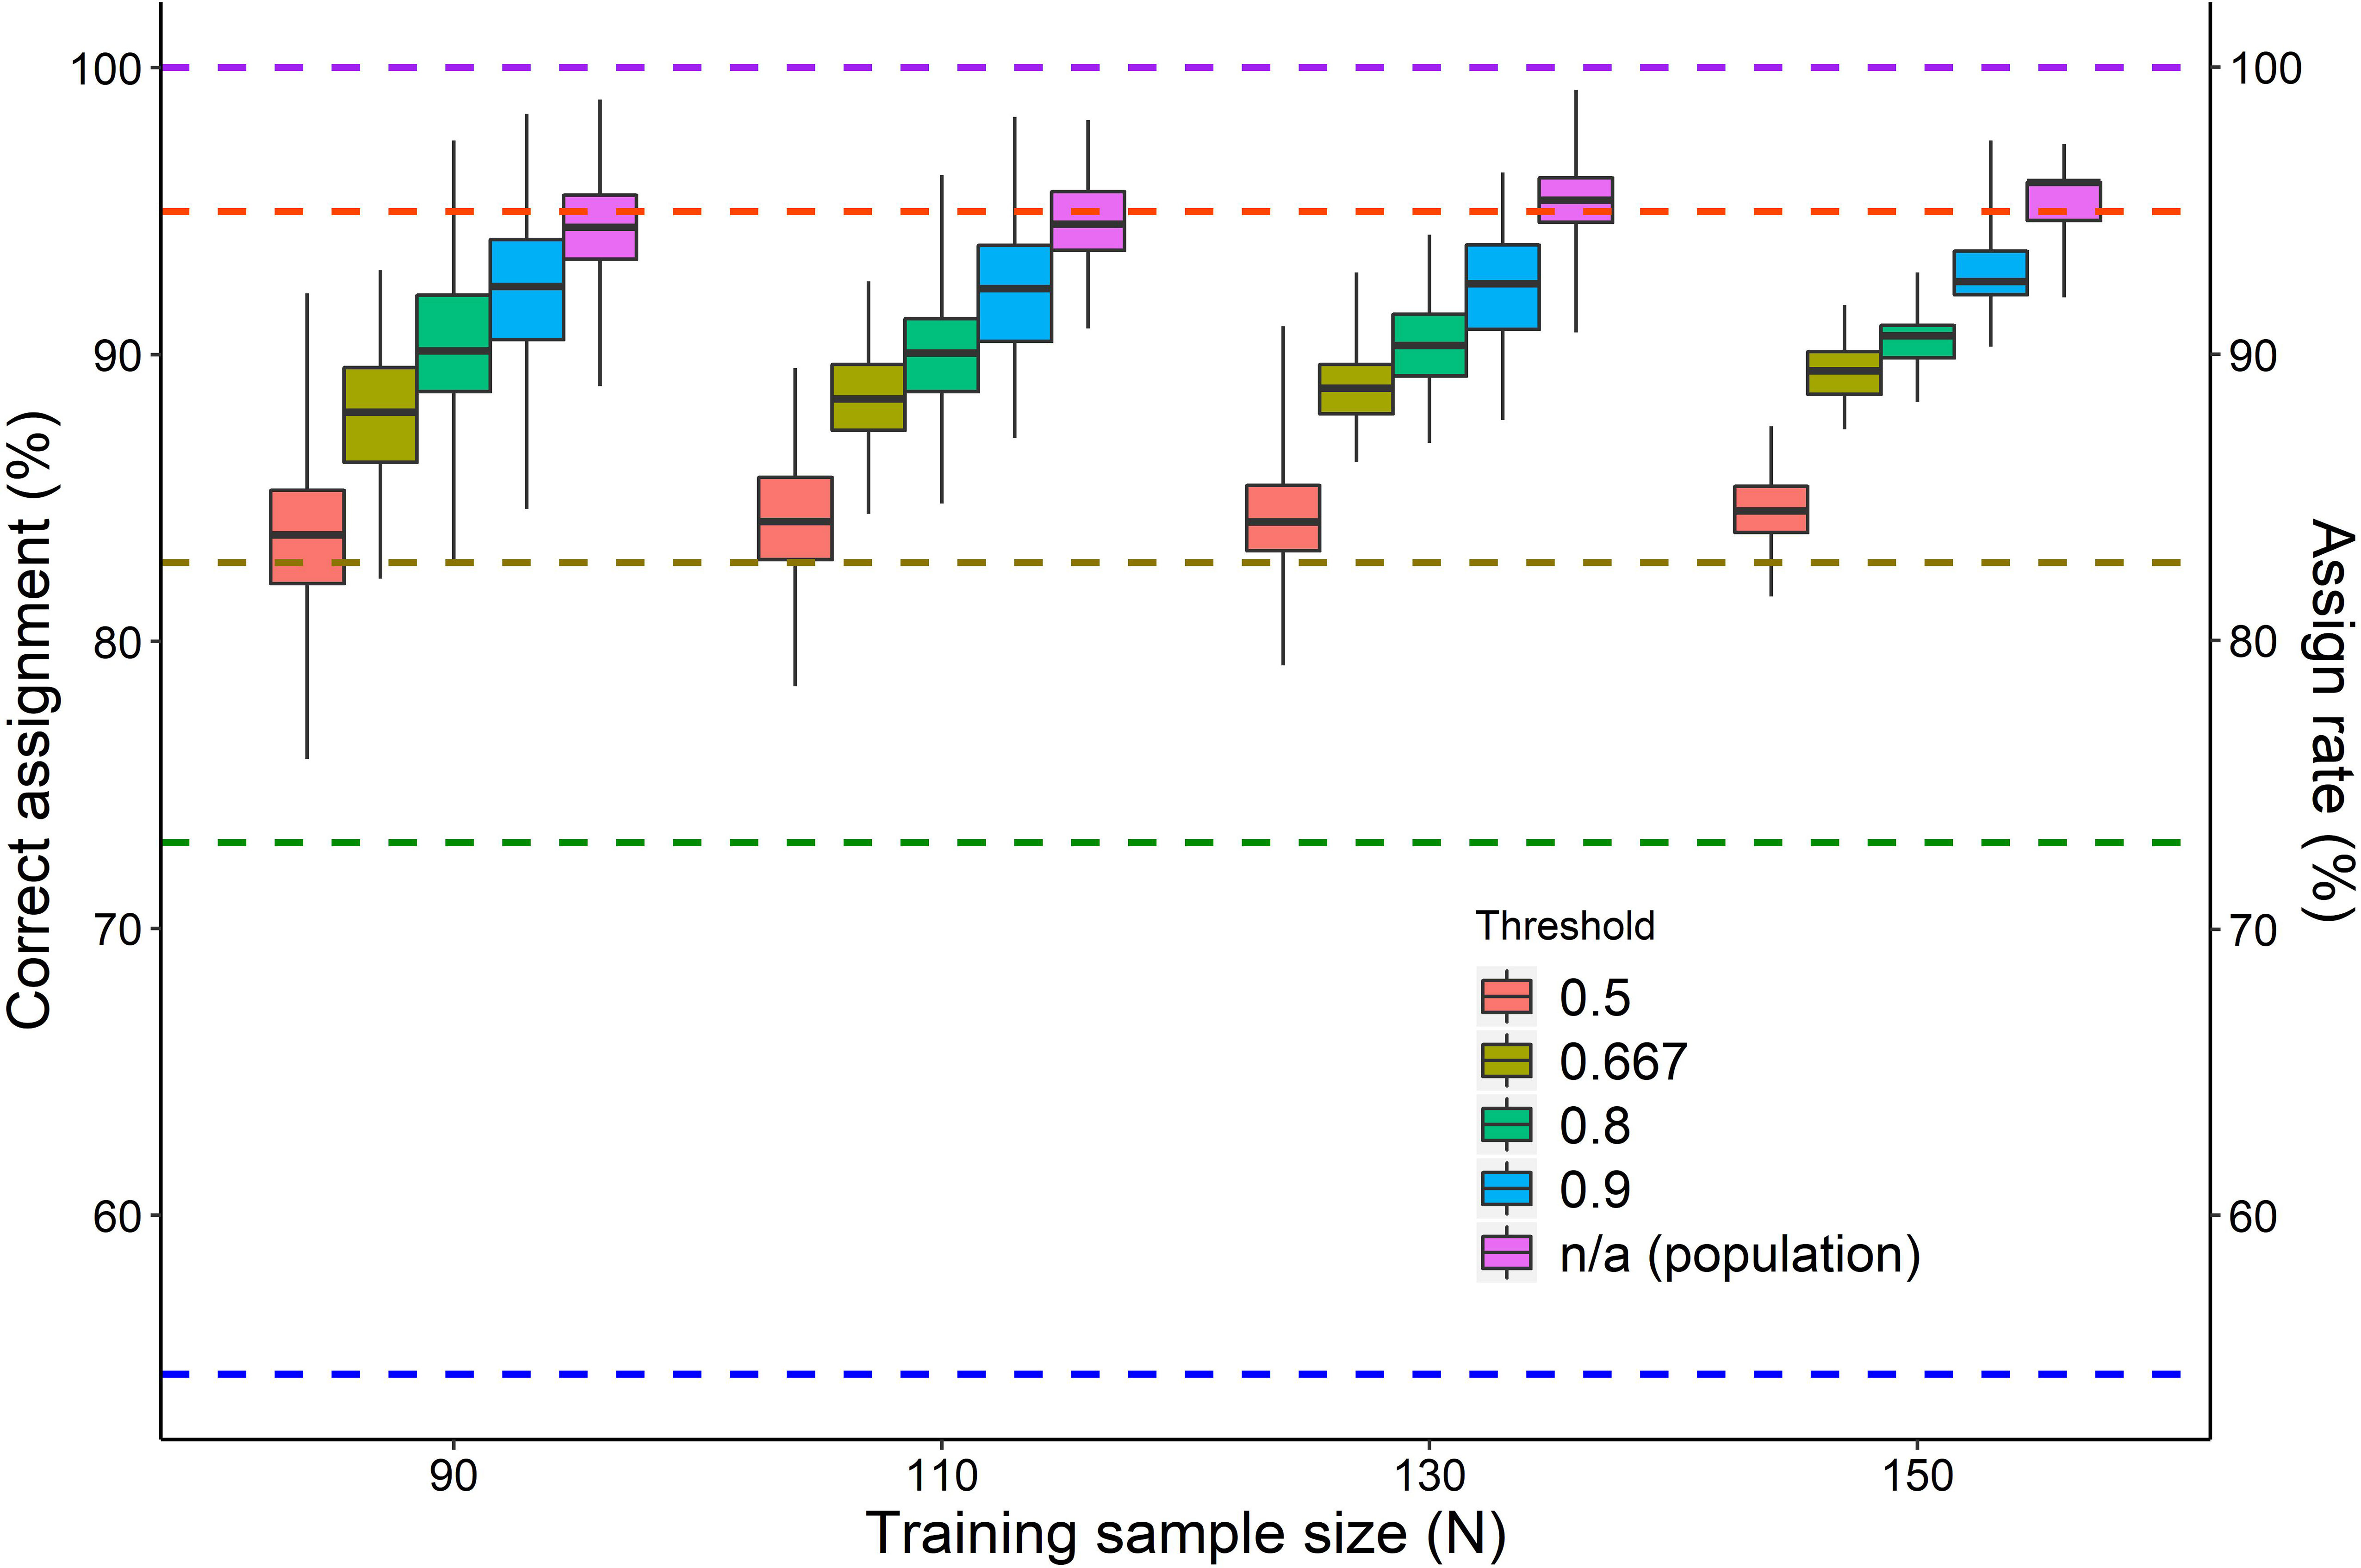
Figure 3 The percentage of test samples correctly assigned to a foraging area resulting from a differentiation analysis (QDA or LDA) conducted with a training sample of different sizes (ranging from 10 to 150 turtles out of 169), with unequal priors and with different thresholds (individual assignment approach) or no threshold (population assignment approach). For each combination of training, sample size and threshold boxplots of 100 random samplings are shown (median and IQR 25%-75%; whiskers: min-max). Mean assign rates for the different thresholds are shown as dashed horizontal lines. Note: Due to sample size limitations of QDA, samples sizes of 10 and 15 turtles were analyzed by means of an LDA.
Estimated spatio-temporal occurrence at foraging areas
The two approaches (individual-assignment and population) provided significantly different estimates of foraging contributions for four of the seven MUs (NMU, CE, SE, CW; Fisher exact test; p< 0.0005; n = 9225). The proportion of nesting females using each of the four regional foraging areas was significantly different among all MUs (Fisher’s exact test: p = 0.0005; Holm-Bonferroni post-hoc comparisons) with the population approach (n = 5168) and among all MUs except between the CW and SW with the individual-assignment approach (n = 4057) (Figures 1, 4).
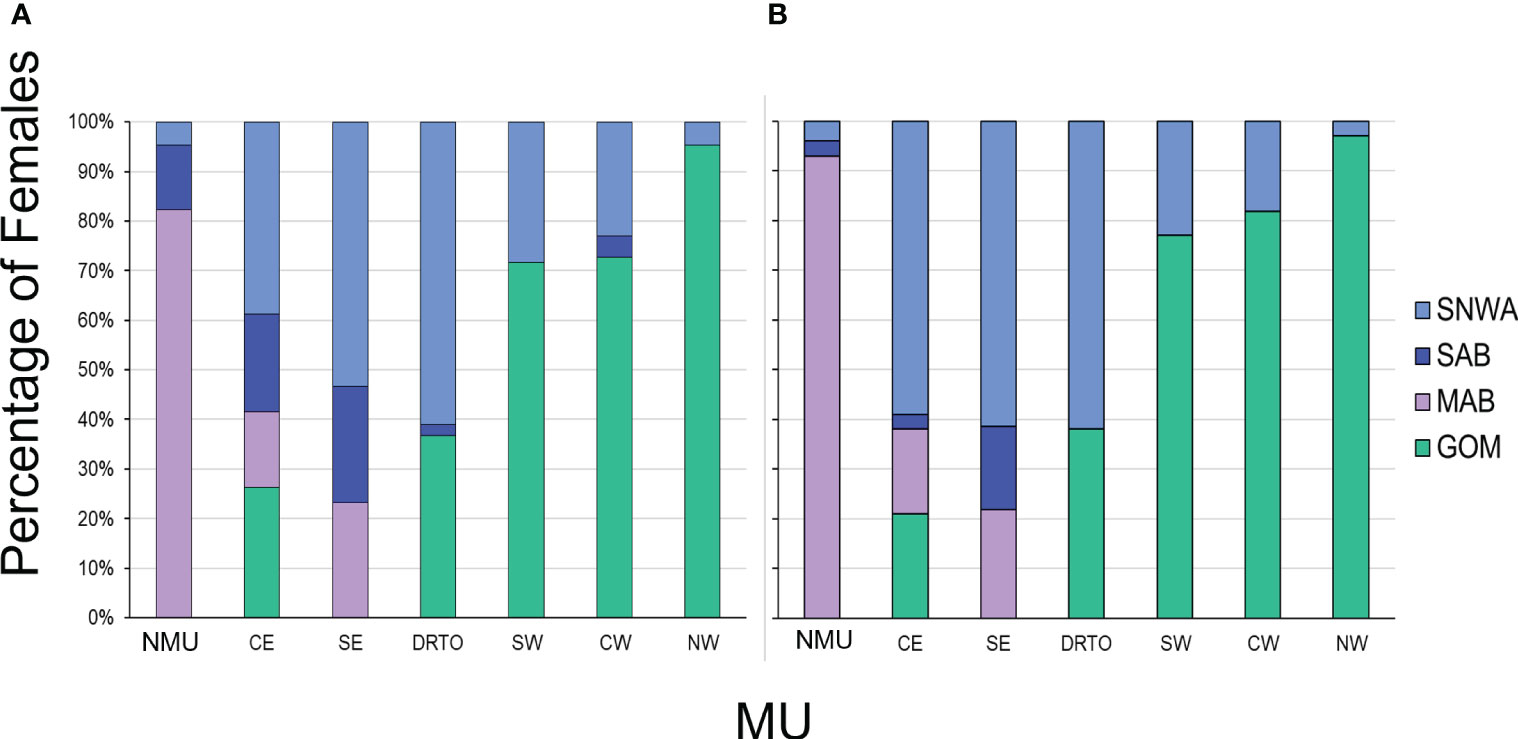
Figure 4 Percentage of adult female loggerheads by Management Unit (MU) assigned to each of the four regional foraging areas during 2013–2018 based on (A) the population-level approach (n = 5168) and (B) the individual-assignment approach (n = 4057). The MUs are NMU (Northern MU), CE (Central-East Florida MU), SE (Southeast Florida MU), DRTO (Dry Tortugas MU), SW (Southwest Florida MU), CW (Central-West Florida MU), and NW (Northwest Florida MU). The foraging areas are MAB (Mid-Atlantic Bight), SAB (South Atlantic Bight), SNWA (Subtropical Northwest Atlantic), and GOM (Gulf of Mexico).
The relative importance of the four regional foraging areas for the overall NWA nesting female aggregation (estimated by both approaches and weighted for the relative abundance of each MU), is shown in Figure 5. Proportions estimated from SIA and those obtained from satellite tracking are compared in Table 1. The SNWA was found to be the most important foraging area for the NWA nesting aggregation, accounting for more than 40% of individuals and supporting the highest genetic diversity in terms of MUs: females from all seven MUs forage in the SNWA, in contrast with the other three foraging areas that host females from three to five MUs. The MAB and GOM each accounted for approximately 20% of females, with the GOM supporting a higher genetic diversity than the MAB (five vs. three MUs, respectively). The relative importance of the SAB differed depending on the approach, probably because of the large number of unassigned individuals (n = 1111 (21%) of 5168 individual females) when using the individual-assignment approach (Figure 5).
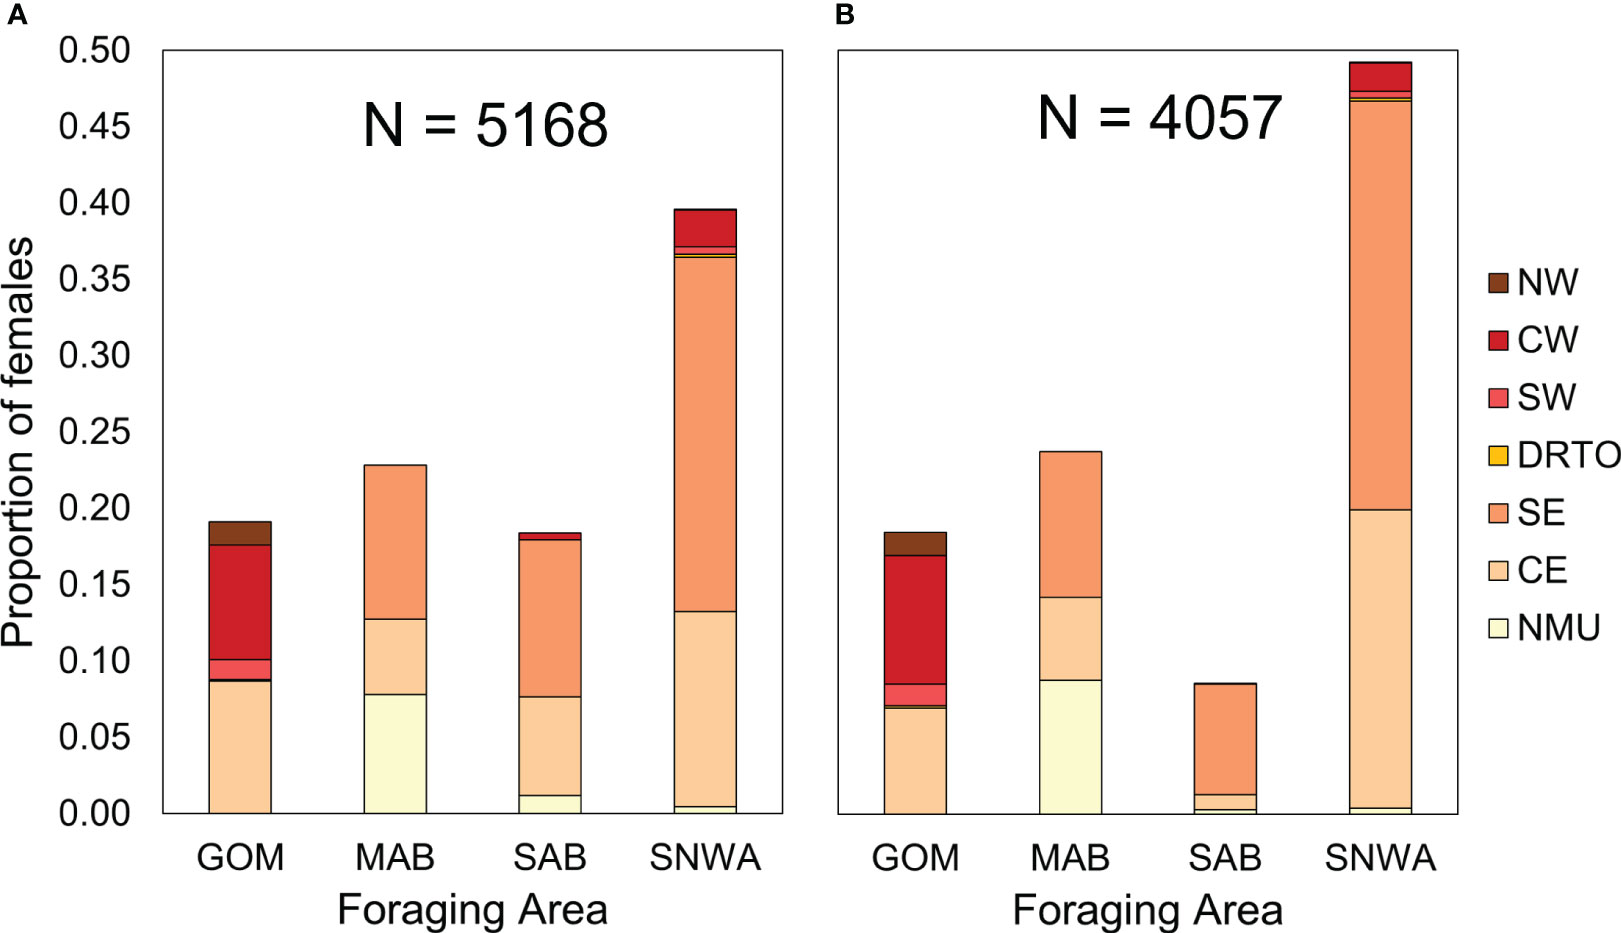
Figure 5 Proportion of adult female loggerheads of the Northwest Atlantic Regional Management Unit (NWA RMU) using each of four regional foraging areas during 2013–2018 based on (A) the population-level approach and (B) the individual-assignment approach. The foraging areas are the GOM (Gulf of Mexico), MAB (Mid-Atlantic Bight), SAB (South Atlantic Bight), and SNWA (Subtropical Northwest Atlantic). The proportion of loggerheads at each foraging area by Management Unit (MU) of the NWA RMU are also indicated. The MUs are the NW (Northwest Florida MU), CW (Central-West Florida MU), SW (Southwest Florida MU), DRTO (Dry Tortugas MU), SE (Southeast Florida MU), CE (Central-East Florida MU), and NMU (Northern MU).
Interannual differences in the proportion of females using each of the regional foraging areas were observed within the CE and SE from both the individual-assignment and population approaches as well as within the NMU from the individual-assignment approach (Fisher’s exact test with Holm-Bonferroni correction; Supplementary Table 3). The annual frequency distributions (2013-2018) of nesting females among the four regional foraging areas for the overall NWA (weighted for the relative importance of each MU) and by MU are shown in Figures 6 and 7 using the individual approach and population approach, respectively. The frequency distribution of females nesting in Florida (weighted for the relative importance of each MU) is shown in Supplementary Figure 2.
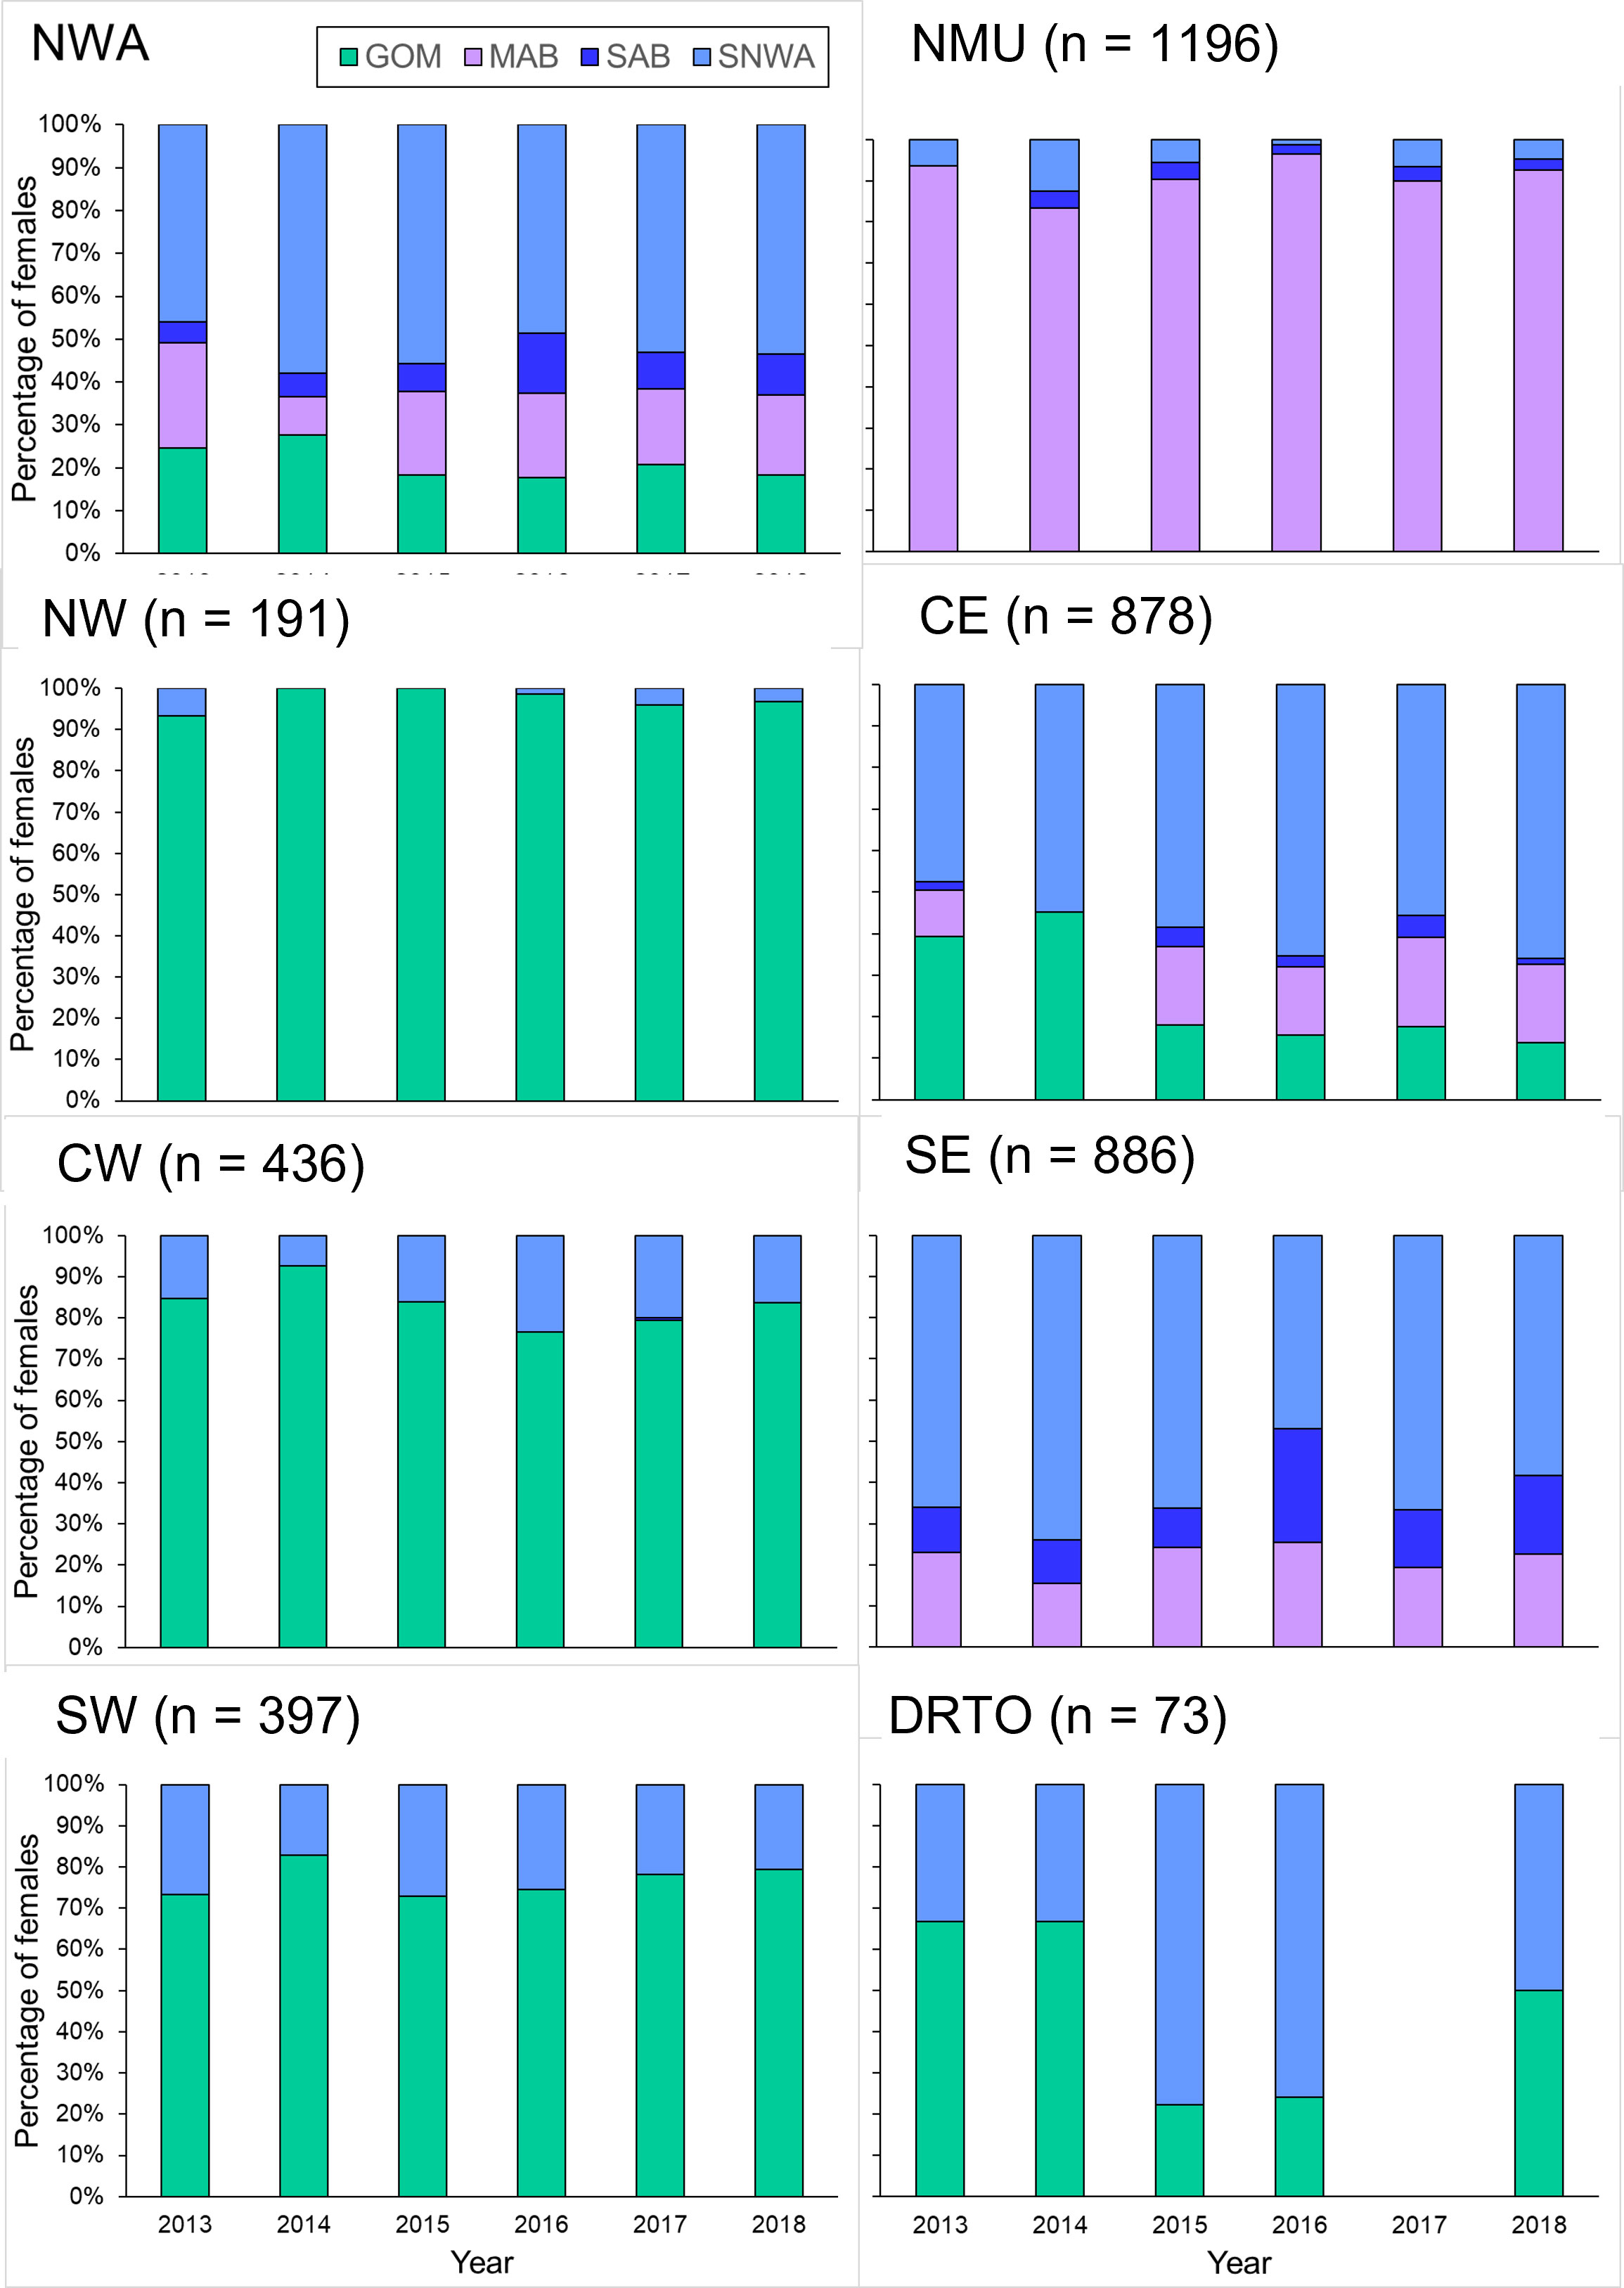
Figure 6 Percentage of adult female loggerheads of the Northwest Atlantic Regional Management Unit (NWA) and of each individual Management Unit (MU) found each year during 2013–2018 at each of the four regional foraging areas based on the individual-assignment approach (n = 4057). The percentage of adult female loggerheads for the overall NWA was weighted for the relative importance of each MU. The MUs are the NMU (Northern MU), NW (Northwest Florida MU). CE (Central-East Florida MU), CW (Central-West Florida MU), SE (Southeast Florida MU), SW (Southwest Florida MU), and DRTO (Dry Tortugas MU). The regional foraging areas are the GOM (Gulf of Mexico), MAB (Mid-Atlantic Bight), SAB (South Atlantic Bight), and SNWA (Subtropical Northwest Atlantic).
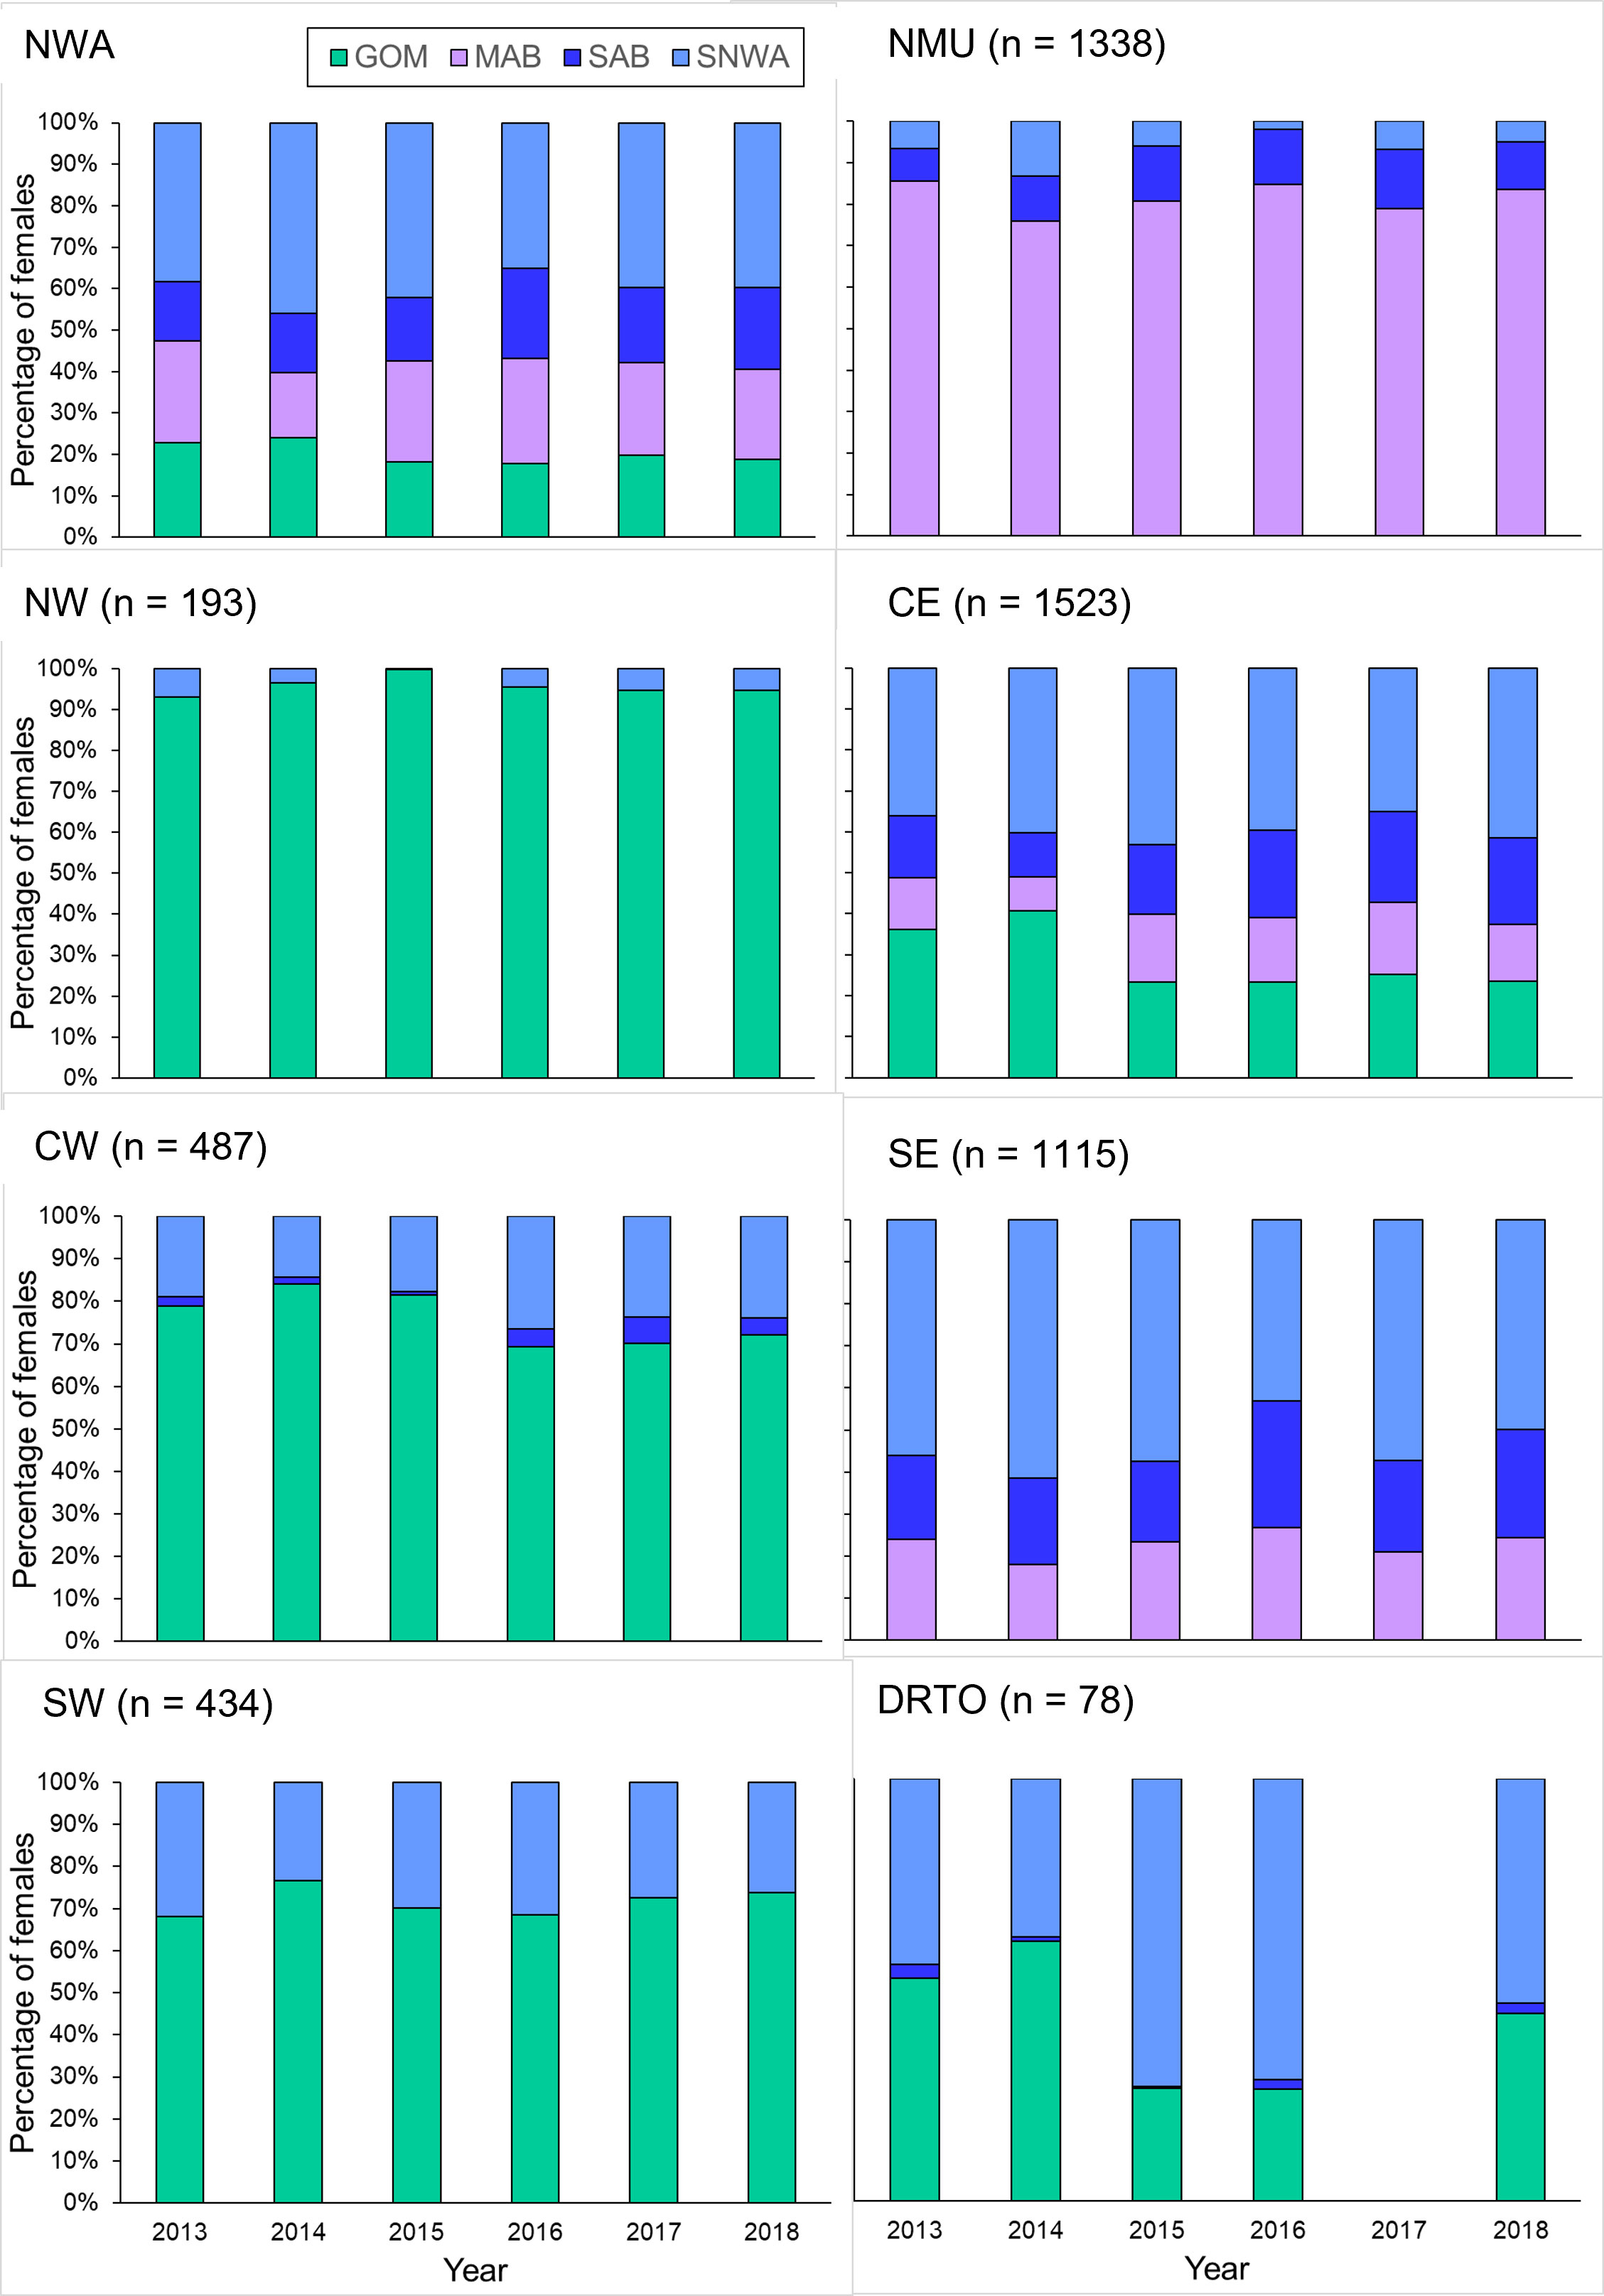
Figure 7 Percentage of adult female loggerheads of the Northwest Atlantic Regional Management Unit (NWA) and of each individual Management Unit (MU) found each year during 2013–2018 at each of the four regional foraging areas based on the population-level approach (n = 5168). The percentage of adult female loggerheads for the overall NWA was weighted for the relative importance of each MU. The MUs are the NMU (Northern MU), NW (Northwest Florida MU). CE (Central-East Florida MU), CW (Central-West Florida MU), SE (Southeast Florida MU), SW (Southwest Florida MU), and DRTO (Dry Tortugas MU). The regional foraging areas are the GOM (Gulf of Mexico), MAB (Mid-Atlantic Bight), SAB (South Atlantic Bight), and SNWA (Subtropical Northwest Atlantic).
Fidelity to foraging areas
The δ13C and δ15N values of females sampled repeatedly within and among seasons were remarkably consistent over time (median: 2 years, range: 1-6 years). Differences in δ13C and δ15N values in serially collected samples were similar, with 62% and 83% of samples differing by ≤ 0.5‰ and by ≤ 1.0‰, respectively, in subsequent samples regardless of whether repeated sampling took place within or among seasons and regardless of the isotope considered (Figure 8). The overall mean difference between measurements (n = 290 females) was 0.02 ‰ ± 1.04‰ (SD) for δ13C and −0.02‰ ± 1.07‰ for δ15N, the median difference was −0.01‰ and +0.02‰ for δ13C and δ15N, respectively, while the overall range in δ13C among these females was 9.50‰ and 10.73‰ for δ15N, respectively. The intra-seasonal mean difference between measurements (n = 171 females) was −0.02 ‰ ± 0.99‰ for δ13C and +0.08‰ ± 0.83‰ for δ15N, the median difference was 0.00‰ and +0.09‰ for δ13C and δ15N, respectively, while the overall range in δ13C among these females was 8.62‰ and 9.40‰ for δ15N. The inter-seasonal mean difference between measurements (n=143 females) was 0.05‰ ± 1.01‰ for δ13C and −0.08‰ ± 1.30‰ for δ15N, the median difference was −0.05‰ and −0.07‰ for δ13C and δ15N, respectively, while the overall range in δ13C among these females was 8.94‰ and 10.73‰ for δ15N.
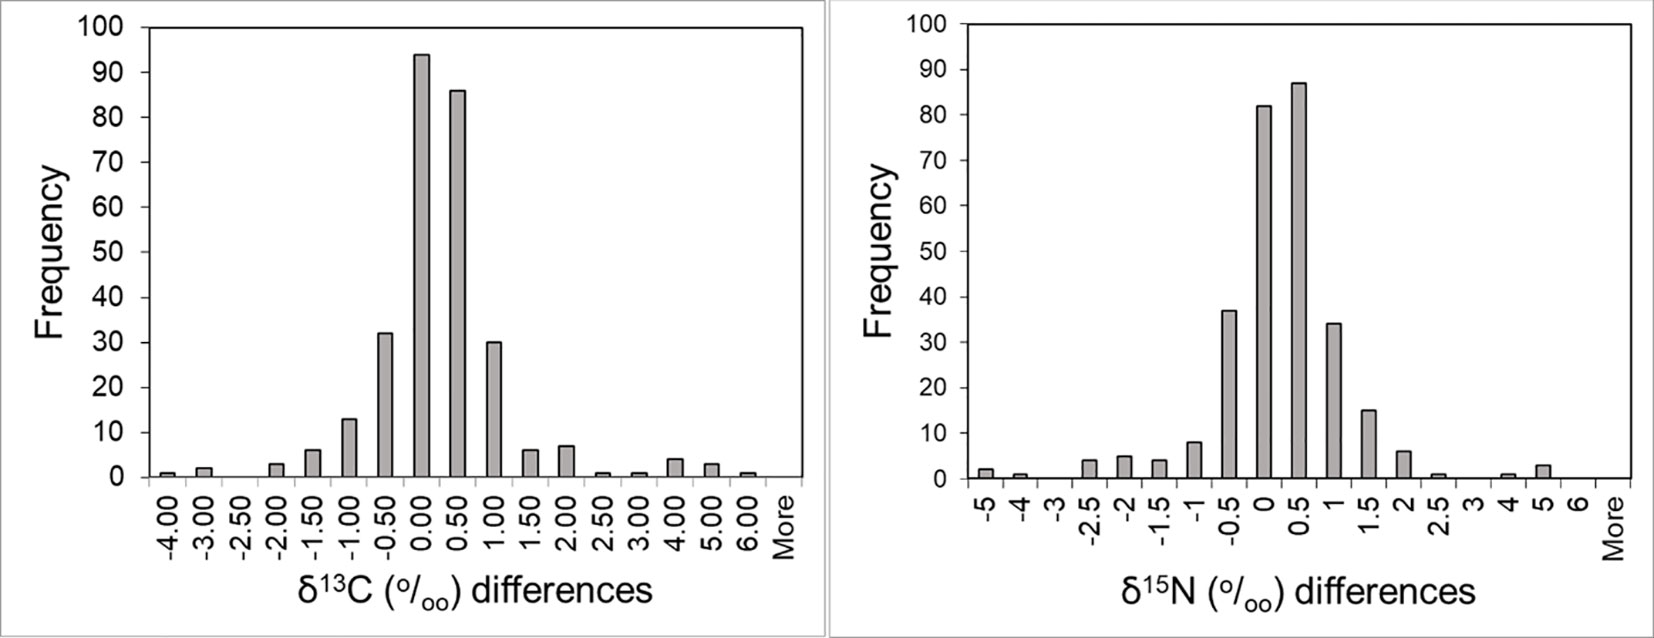
Figure 8 Within individual absolute difference in δ13C and δ15N values among serially collected samples using the first sample as a reference.
Two hundred and eighty-nine individuals were sampled repeatedly (246 turtles were sampled two times, 32 three times, seven four times, three five times and one was sampled six times). Some samples could not be assigned to a regional foraging area with the threshold of p ≥ 0.667, although values fell within the isotopic range of the foraging areas examined. None of the samples from 19 turtles could be assigned. In 27 turtles, only one sample could be assigned to a regional foraging area, and the highest posterior probability from the unassigned sample indicated assignment to the same (n = 15) or a different (n = 12) regional foraging area. In eight of the latter cases, the discrepancies were between the MAB and SAB. In 241 turtles, all multiple samples were consistently assigned to the same regional foraging area, while in three turtles samples were assigned to different regional foraging areas. When two different tissues (skin and FEY) were sampled from the same individual (n = 12), they were either assigned to the same regional foraging area (11 individuals, 92%) or not assigned at all. Turtles with no or different assignments were excluded from analysis of annual contribution.
Discussion
The present study represents the most comprehensive assessment of foraging areas for any sea turtle breeding RMU in terms of sample size, geographic scale, temporal period, and genetic diversity, and to the best of our knowledge represents the most comprehensive assessment of migratory connectivity to date, regardless of taxa. Hence, the study was able to clarify biological patterns and previous misinterpretations about this specific sea turtle RMU (one of the largest worldwide) but also to highlight limits of the dual stable isotope approach (carbon and nitrogen) in the likelihood-based geographic assignment and to propose new analytical methods.
Relative importance of regional foraging areas for the NWA loggerhead RMU and each MU
For the first time, the annual relative importance of each of four regional foraging areas for the overall NWA loggerhead RMU is provided. This is the largest nesting aggregation for this species (Casale and Tucker, 2017; Ceriani et al., 2019) and one of the largest sea turtle aggregations worldwide (Wallace et al., 2010). Such a complex achievement, representing a fundamental baseline for any future study, required consistently sampling a representative number of females at nesting grounds across all seven NWA MUs over six consecutive years. We found that the SNWA is by far the single most important regional foraging area both in terms of proportion of individuals and genetic diversity harbored. We estimated that about half of the females that nested in the NWA during 2013–2018 from all seven MUs foraged in the SNWA. The MAB was the second most important regional foraging area followed closely by the GOM. However, the GOM hosts greater population diversity (5 MUs: the NW, CW, SW, DRTO, and CE) than the MAB (3 MUs: the NMU, SE, CE) but the MAB supported over 90% of nesters in the NMU; thus, any threats and management actions in the MAB is likely to have a disproportionate impact on the relatively small NMU aggregation. The importance of the SAB, which is used by the two largest MUs (the SE and CE) varied considerably based on the geographic assignment method used. When using the population approach that allows the inclusion of all females, the MAB, SAB and GOM appeared to be similarly important, while the importance of the SAB decreased greatly when using the individual approach (due to the higher number of unassigned turtles resulting from this approach). These results highight the value of a spatio-temporally comprehensive investigation to overcome the inherent uncertainty of previous assessments focused on a single beach that was sampled consistently (Ceriani et al., 2012; Ceriani et al., 2015; Ceriani et al., 2017) or intermittently (Vander Zanden et al., 2014) or on multiple beaches across three different MUs that were sampled both inconsistently and during differing time series (Pfaller et al., 2020).
The regional foraging areas used by adult females differ considerably across the nesting range of NWA loggerhead examined (MUs). As a general pattern, the present study shows that turtles nesting along the Atlantic coast predominantly forage in the Atlantic, those nesting along the GOM forage in the GOM, while those nesting close to the border between the Atlantic and GOM (the DRTO) share foraging areas with both nesting groups in equal proportions. Additionally, turtles nesting along the Atlantic coast appear to forage in different areas of the Atlantic Ocean depending on their MU and to forage predominantly in the northern (MAB) and southern (SNWA) areas and relatively few turtles forage in the SAB. For example, over 90% of turtles from the NMU, with most nesting at sites adjacent to the SAB, and nearly a quarter of the even more southern nesters of the CE and SE, forage in the MAB, while most turtles from the CE and SE forage in the SNWA. This bimodal distribution of foraging areas by turtles nesting along the Atlantic (predominantly foraging either in the MAB or SNWA) may be due to a similar dispersal—possibly induced by currents—of juveniles while recruiting at neritic foraging areas (Godley et al., 2010; Putman and Naro-Maciel, 2013; Casale and Mariani, 2014) or to a higher trophic productivity of these two areas relative to other areas or to a combination of the two. We hypothesize that the SE nesters may utilize the highly productive waters of the MAB in large numbers despite the considerable distance necessary to migrate to the nesting beach and back because of the proximity of the Gulf Stream to the shoreline and the ease of reaching and entering the Gulf Stream current and then traveling with that flow to the MAB.
Our results concur with previous telemetry work about turtles nesting in the Gulf of Mexico (NW, CW, SW) and DRTO MUs in terms of proportion of females foraging in the GOM and SNWA (Girard et al., 2009; Foley et al., 2013; Hart et al., 2014; Hart et al., 2021; Phillips et al., 2021). Overall, both our study and previous telemetry work identified the MAB as the main residence area for NMU loggerheads (Hawkes et al., 2011; Griffin et al., 2013), although our results suggest an almost exclusive reliance of NMU turtles on this foraging area. Our results agree only partially with published telemetry work on CE and SE MU females and suggest that more than half of the females nesting in these two MUs forage in the SNWA, representing a 25-50% increased importance of SNWA than reported by telemetry studies alone (Ceriani et al., 2014b). We suspect this discrepancy might be attributed to the unusually large number of CE MU nesters that could not be assigned and the extremely low sample size of females from the SE MU that have been satellite tracked so far, respectively.
Comparison between our assignment results and previous isotopic studies are limited to the few MUs that have been investigated using this technique (NMU, CE, SE, NW). Our findings agree with previous isotopic-based studies for turtles from the NMU (Pfaller et al., 2020), NW (Silver-Gorges et al., 2021) and one study for CE MU (Ceriani et al., 2015). However, our results disagree with a prior study focusing on turtles from the CE MU (Ceriani et al., 2012) and the only study about turtles from the SE MU (Pajuelo et al., 2012), probably because these studies had small sample sizes and did not include the GOM as a regional foraging area in their analyses.
Our work contributes to the overall knowledge of migratory connectivity for NWA loggerheads, particularly for the following understudied MUs. Turtles from the SE have been little studied (Pajuelo et al., 2012) despite the importance of this MU (43.5% of all the clutches deposited by loggerheads nesting in the Southeast United States during the 2013–2018 period). Further, this is the first study to use stable isotopes to infer foraging area use for loggerheads of unknown foraging areas that are nesting in the Dry Tortugas or along the Gulf of Mexico coast other than Silver-Gorges et al. (2021) (n = 22 loggerhead turtles).
Temporal patterns at population and individual levels
The present study provides information on population-level change in the distribution of individuals among regional foraging areas. This adds to the relatively few previous studies that have done this (Pajuelo et al., 2012; Ceriani et al., 2015; Bradshaw et al., 2017; Pfaller et al., 2020).
Inter-annual variations in the frequency distributions of females among regional foraging areas were detected for CE, SE, and NMU. The lack of these variations for the other MUs examined is not surprising considering that most females from the NW, CW, and SW reside in the GOM, which is isotopically homogenous and cannot be divided in further sub-areas. Even with such limitations, our results show that the likelihood-based geographic assignment based on SIA can detect inter-annual changes. Therefore, SIA represents a cost-effective tool to investigate the biological effects of climate change, because it allows early detection of changes in frequency distribution at foraging area that might be associated with climate change impacts on quality and suitability of foraging areas or with new anthropogenic threats suddenly impacting a foraging area). Moreover, SIA allows management agencies to identify and monitor the foraging-area composition of loggerhead turtles at the different MUs of the NWA.
Our results corroborate the findings of Ceriani et al. (2017), which were based on a single important nesting site from CE, who found some inter-annual differences. We also observed an increased and more consistent number of females foraging in the MAB in lieu of the GOM from 2013–2014 to 2015–2018. We hypothesize that the increased contribution of the MAB might reflect either a real increase in number of females foraging in the MAB, a decrease in remigration interval of these females, or a combination of the two. The MAB is one of the most productive areas in the NWA (Wilkinson et al., 2009), and females from the CE and SE migrate there despite the longer distance. Ceriani et al. (2015) found that females nesting at the ACNWR (CE) and migrating to the MAB had longer remigration intervals than those migrating to closer areas such as the SNWA, but the authors cautioned that this conclusion was based on a small sample size of recaptured individuals. Moreover, the study ended in 2012 and would not reflect any environmental changes that occurred more recently.
Through study of individuals over time, the present study also provides information on adult female fidelity to a foraging area. This topic has been investigated through satellite tracking of the same female multiple times over many years (Broderick et al., 2007; Schofield et al., 2010; Thomson et al., 2012; Hart et al., 2015; Shimada et al., 2016; Evans et al., 2019; Phillips et al., 2021), through multiple stable isotope values across years (serial analysis of scute layers that represent different periods of the past: Pajuelo et al., 2016; Vander Zanden et al., 2016;skin: Bradshaw et al., 2017;FEY: Pfaller et al., 2020) or a combination of the two (Tucker et al., 2014; Bradshaw et al., 2017). Based on a much larger sample size and, thus, confidence, our results indicate that most females exhibit fidelity to foraging areas and that a single tissue sample (skin tissue or egg content) collected at any time during the nesting season can be used to infer foraging areas of each turtle, facilitating the sampling design of future studies.
Limits of the dual-isotope approach
The large sample size of this study unveiled a problematic case that may represent a more general problem in such studies. We found that the GOM is isotopically homogenous (carbon and nitrogen) and thus, the current method cannot be used to further resolve the migratory connectivity of loggerheads nesting along the GOM (NW, CW and SW MUs) that forage almost exclusively or largely in the GOM. Our results agree with Tucker et al. (2014), which is not surprising because Tucker’s dataset (n = 82 females) is included in our larger dataset (n = 207 females). Tucker et al. (2014) hypothesized that the observed isotopic homogeneity is due to the influence of coastal topography and shifting biogeographic boundaries such as the Loop Current that may cause strong ocean water mixing. In contrast along the Atlantic coast, latitude appears to be the main factor driving isotopic differences in both carbon and nitrogen (Ceriani et al., 2012; Pajuelo et al., 2012). Our results differ from the findings of Vander Zanden et al. (2015), who identified three isotopically distinct regions within the GOM (the SGOM, EGOM, NGOM). We suggest that this difference may be due to four possible factors. The first is sample size (the dataset for the MANOVA analysis we used included 82 sampled and satellite-tracked females between 2006 and 2017 residing in the GOM vs. 29 individuals in 2011 and 2012; 16 of the 29 individuals are included in both datasets). The second is temporal isotopic differences in the GOM (12 years vs. 2 years). The third is a mismatch between SIA values (reflecting foraging area used several months prior to sampling) and satellite telemetry (reflecting foraging area used after nesting). The fourth is the statistical analysis performed (non-parametric PERMANOVA vs. parametric MANOVA). However, analysis of serial layers of scute of loggerheads in the GOM (Vander Zanden et al., 2016) indicated consistency over time (up to 18 years). Moreover, loggerheads satellite tracked multiple times from nesting beaches in the GOM (Tucker et al., 2014; Hart et al., 2021; Phillips et al., 2021) and elsewhere (Broderick et al., 2007; Marcovaldi et al., 2010) showed consistency in foraging area use across years, suggesting that the second and third factors are unlikely. Thus, we conclude that sample size (see also below regarding our simulation results on sample size) is the most likely explanation for the differences observed between the results of Vander Zanden et al. (2015) vs. those of Tucker et al. (2014) and the current study.
Another example of the limits of SIA of carbon and nitrogen is the inability to identify regional foraging areas of loggerhead turtles nesting along the east coast of Australia (Coffee et al., 2020). These results as well as those from the present study are an indication of the limitations of the value of using SIA of carbon and nitrogen for animal tracking. While a dual-element approach has been successfully used to identify regional foraging areas utilized by loggerheads in the southeastern United States and sea turtles in other regions worldwide (Eder et al., 2012; Seminoff et al., 2012; Bradshaw et al., 2017; Okuyama et al., 2022) and to study migration in other marine organisms (Mccarthy and Waldron, 2000; Madigan et al., 2021; Shipley et al., 2021), we conclude that this approach cannot be assumed to be effective in general and should be calibrated with an appropriate sample size of known individuals (satellite-tracked individual and/or individuals sampled at foraging sites).
Methodological aspects affecting result quality
We investigated five methodological aspects of the likelihood-based geographic assignment of foraging areas for individuals of unknown origin based on stable isotope values of their tissues: the use of non-uniform priors, sample size of the training dataset, sample size of the prior dataset, probability thresholds for individual assignment, and individual-assignment approach vs. population approach. We found that non-uniform priors based on satellite telemetry data, which reduce undue influences of otherwise spurious isotope-based results (Wunder, 2012), can considerably improve the estimates of the frequented foraging areas. In the case of the NWA loggerhead RMU, simulations showed that the highest performance is reached with at least 60 training cases and 100 priors. We advise against using fewer training cases and smaller priors sample sizes because they are more likely to produce erroneous results.
In the individual assignment approach, choosing a threshold to identify the single most likely foraging area used by the individual is arbitrary and poses a trade-off between improvement over randomness and sample size (i.e., the number of individuals that can be unambiguously assigned); thus, many thresholds and odds ratios have been used in the literature as a cut-off (Wunder, 2012). Based on the largest sample size assembled so far in the study area, we found that a posterior probability threshold of 0.667 represents the best compromise between confidence in the assignment (six-fold improvement over chance) and sample size (allows for inclusion of 75% samples), confirming previous findings (Ceriani et al., 2014b).
Studies on the geographic assignment of likely foraging areas for individuals are ultimately interested in estimating relative contribution of areas to the overall population to draw general conclusions at the population level, with limited specific interest about an individual’s preferred foraging area. In such cases, the population approach can be used in combination with priors. The population approach has the advantage of including the whole sample (in contrast to the individual-assignment approach) and our simulations showed that with the large sample of training cases and priors recommended above (over 60 and 100, respectively), the population approach performs better than the individual-assignment approach at any threshold.
Conclusions and recommendations
We provide evidence about the importance of the SNWA as a foraging area for NWA loggerhead turtles and suggest that conservation efforts focused on this area may benefit the largest number of individuals and conserve the greatest genetic diversity. At present, the SNWA includes the continental shelf area around the Bahamas, Cuba, and the Florida Keys (including the Dry Tortugas). The waters surrounding the first two areas are the only critically important foraging grounds identified for NWA loggerheads outside U.S. jurisdiction, while the latter area is protected as either part of the Florida Keys National Marine Sanctuary, a regional Marine Protected Area, or the Dry Tortugas National Park. Therefore, identifying further subdivisions within the SNWA, particularly being able to quantify what proportion of NWA loggerheads is likely to reside outside U.S. jurisdiction, may help guide management actions, including strategies for international cooperation.
Our results not only corroborate the findings of prior studies based only on satellite telemetry (Hart et al., 2012; Foley et al., 2013; Hardy et al., 2014; Tucker et al., 2014; Hart et al., 2020; Phillips et al., 2021), genetic assessments (Stewart et al., 2019) or SIA (Pajuelo et al., 2012; Ceriani et al., 2015; Pfaller et al., 2020) but also provide the first estimate of the proportion of females from each MU that use each of four foraging areas. Therefore, our results represent a fundamental baseline for monitoring annual foraging area contributions to nesting aggregations in a cost-effective way and enable early detection of changes in this frequency distribution at foraging areas. This monitoring could provide an early warning mechanism. For instance, a sudden drop in contribution from a foraging area may indicate a change in habitat quality or threats at the foraging area and prompt managers to further investigate with other higher resolution spatial tools. Moreover, long-term trends in this frequency distribution could aid in our understanding of the effects of climate change on marine ecosystems.
The present study also shows that limited sampling may result in false geographic differentiation and consequently may lead to misleading interpretations. Therefore, caution is needed before deriving conclusions from a small sample size. An adequate sample size should be decided case by case (in the present case with four putative foraging areas, a minimum of 60 training individuals and 100 priors would be needed).
From the current study the following research priorities have been identified. For the specific case study (NWA loggerhead RMU), (i) improving our knowledge about the anthropogenic threats (e.g., level of bycatch, consumption, habitat degradation, pollution) occurring in the most important foraging area (SNWA) could help to inform population status, management actions and international cooperation efforts. Moreover, (ii) the geographic accuracy and definition of foraging areas could be enhanced, in particular the wider SNWA and GOM. For the NWA loggerhead RMU as well as other RMUs, additional priorities include: (iii) increasing the number of intrinsic markers to overcome the limits of classical dual-element approach that may not be always obvious in early investigations with a low sample size. In the meantime, where only carbon and nitrogen are available, (iv) attempting a spatially explicit approach (i.e., isoscapes) that appears promising (Ceriani et al., 2017; Silver-Gorges et al., 2021). This approach needs further investigation with a larger sample size of known-foraging area individuals and needs to be tested, for instance, in both the Atlantic and the Gulf of Mexico simultaneously. In general, future isotopic studies, regardless of taxa, may benefit from v) use of non-uniform priors and increase in their sample size whenever possible, (vi) performing leave-one-out simulations to estimate accuracy, and vii) use of the population approach when the individual is not the focus of the study and if enough priors are available.
Data availability statement
The raw data supporting the conclusions of this article will be made available by the authors, without undue reservation.
Ethics statement
Ethical approval was not required for the study involving animals in accordance with the local legislation and institutional requirements because it was not required for conducting our type of study.
Author contributions
Conceptualization: SAC. Methodology: SAC. Formal analysis: SAC, PC, BMS. Resources: DSA, DA, GC, NAD, SFE, DRE, NE, MMPBF, KMH, PH, SEH, CRM, KLM, KTM, SVN, SMP, KFP, KWR, BMS, AS, KAS, ADT, RCW. Data curation: SAC, SM. Writing–original Draft: SAC, PC. Writing–Review and edits: all authors. Funding acquisition: SAC, SMP. All authors contributed to the article and approved the submitted version.
Funding
This publication was prepared by SAC using Federal funds under award NA16NMF4720077 and NA16NMF4720076 from NOAA-NMFS, U.S. Department of Commerce. Collection of samples in South Carolina was done using Federal funds under award NA16NMF4720071 from NOAA-NMFS, U.S. Department of Commerce, to South Carolina Department of Natural Resources. Stable isotope analyses were also funded through the Florida Sea Turtle Grant Program award 13-028R and 14-010R to SC. Sample collection at LMC were funded in part by the Florida Sea Turtle Grant Program award 17-002C to SH. Portions of LMC data were collected under contract with Palm Beach County Department of Environmental Resources Management. The Sea Turtle Grants Program is funded from proceeds from the sale of the Florida Sea Turtle License Plate. Learn more at www.helpingseaturtles.org. Collection of USGS samples in Dry Tortugas National Park was funded by the U. S. Geological Survey Priority Ecosystem Science Program. Loggerhead sampling from St. George Island was funded by Waterlust.
Acknowledgments
This work would not have been possible without the enthusiastic support of the many sea turtle beach monitoring projects along the Southeast coast of the United States. We gratefully acknowledge the personnel representing the authors’ institutions, organizations, and agencies as well as hundreds of surveyors who have collected samples for this study over the years. We also acknowledge K. Watson for supporting and facilitating sample collection at Panama City Beach; I. Silver-Gorges, who coordinated sample collection at SGI; E. Hardin and J. Reneker, who coordinated sample collection at BHI; UCF interns, in particular F. Gusmao, who prepared a portion of the 2013-2014 samples when SAC was a member of the UCFMTRG; FWRI interns who prepared thousands of samples for stable isotope analysis, FWRI staff who helped with sample transfer; E. Goddard for assistance with stable isotope analysis; E. Peebles for providing laboratory space; R. Hardy for his help with the map represented in Figure 1; MG Dodd for his role in securing funds to analyze samples collected north of Florida and A.M. Foley, J.A. Seminoff, K. Kylus, T.M. Long and two reviewers for reviewing the manuscript.
Conflict of interest
Authors ND and AS is/was respectively employed by the company Ecological Associates Inc.
The remaining authors declare that the research was conducted in the absence of any commercial or financial relationships that could be construed as a potential conflict of interest.
Publisher’s note
All claims expressed in this article are solely those of the authors and do not necessarily represent those of their affiliated organizations, or those of the publisher, the editors and the reviewers. Any product that may be evaluated in this article, or claim that may be made by its manufacturer, is not guaranteed or endorsed by the publisher.
Author disclaimer
The statements, findings, conclusions and recommendations are those of the author(s) and do not necessarily reflect the views of the NOAA-NMFS or the U.S. Department of Commerce. Any use of trade, firm, or product names is for descriptive purposes only and does not imply endorsement by the U.S. Government.
Supplementary material
The Supplementary Material for this article can be found online at: https://www.frontiersin.org/articles/10.3389/fmars.2023.1189661/full#supplementary-material
References
Barrow L. M., Bjorndal K. A., Reich K. J. (2008). Effects of preservation method on stable carbon and nitrogen isotope values. Physiol. Biochem. Zoology 81, 688–693. doi: 10.1086/588172
Bradshaw P. J., Broderick A. C., Carreras C., Inger R., Fuller W., Snape R., et al. (2017). Satellite tracking and stable isotope analysis highlight differential recruitment among foraging areas in green turtles. Mar. Ecol. Prog. Ser. 582, 201–214. doi: 10.3354/meps12297
Broderick A. C., Coyne M. S., Fuller W. J., Glen F., Godley B. J. (2007). Fidelity and over-wintering of sea turtles. Proc. R. Soc. B-Biological Sci. 274, 1533–1538. doi: 10.1098/rspb.2007.0211
Brost B., Witherington B., Meylan A., Leone E., Ehrhart L., Bagley D. (2015). Sea turtle hatchling production from Florida (USA) beache-2012, with recommendations for analyzing hatching success. Endangered Species Res. 27, 53–68. doi: 10.3354/esr00653
Cardona L., Clusa M., Eder E., Demetropoulos A., Margaritoulis D., Rees A. F., et al. (2014). Distribution patterns and foraging ground productivity determine clutch size in Mediterranean loggerhead turtles. Mar. Ecol. Prog. Ser. 497, 229–241. doi: 10.3354/meps10595
Casale P., Mariani P. (2014). The first 'lost year' of Mediterranean sea turtles: dispersal patterns indicate subregional management units for conservation. Mar. Ecol. Prog. Ser. 498, 263–274. doi: 10.3354/meps10640
Casale P., Tucker A. D. (2017). Caretta caretta (amended version of 2015 assessment). In: The IUCN Red List of Threatened Species 2017: e.T3897A119333622. Available at: https://dx.doi.org/10.2305/IUCN.UK.2017-2.RLTS.T3897A119333622.en (Accessed 03 January 2023).
Ceriani S. A., Casale P., Brost M., Leone E. H., Witherington B. E. (2019). Conservation implications of sea turtle nesting trends: elusive recovery of a globally important loggerhead population. Ecosphere 10 (161), 2257–2268. doi: 10.1002/ecs2.2936
Ceriani S. A., Meylan A. B. (2017). Caretta caretta (North West Atlantic subpopulation) (amended version of 2015 assessment). In: The IUCN red list of threatened species 2017. Available at: https://dx.doi.org/10.2305/IUCN.UK.2017-2.RLTS.T84131194A119339029.en (Accessed 03 January 2023).
Ceriani S. A., Roth J. D., Ehrhart L. M., Quintana-Ascencio P. F., Weishampel J. F. (2014a). Developing a common currency for stable isotope analyses of nesting marine turtles. Mar. Biol. 161, 2257–2268. doi: 10.1007/s00227-014-2503-x
Ceriani S. A., Roth J. D., Evans D. R., Weishampel J. F., Ehrhart L. M. (2012). Inferring foraging areas of nesting loggerhead turtles using satellite telemetry and stable isotopes. PloS One 7. doi: 10.1371/journal.pone.0045335
Ceriani S. A., Roth J. D., Sasso C. R., Mcclellan C. M., James M. C., Haas H. L., et al. (2014b). Modeling and mapping isotopic patterns in the Northwest Atlantic derived from loggerhead sea turtles. Ecosphere 5. doi: 10.1890/ES14-00230.1
Ceriani S. A., Roth J. D., Tucker A. D., Evans D. R., Addison D. S., Sasso C. R., et al. (2015). Carry-over effects and foraging ground dynamics of a major loggerhead breeding aggregation. Mar. Biol. 162, 1955–1968. doi: 10.1007/s00227-015-2721-x
Ceriani S. A., Weishampel J. F., Ehrhart L. M., Mansfield K. L., Wunder M. B. (2017). Foraging and recruitment hotspot dynamics for the largest Atlantic loggerhead turtle rookery. Sci. Rep. 7. doi: 10.1038/s41598-017-17206-3
Coffee O. I., Booth D. T., Thia J. A., Limpus C. J. (2020). When isotopes fail: Importance of satellite telemetry and multi-site validation when estimating the foraging grounds of migratory species. Mar. Ecol. Prog. Ser. 633, 197–206. doi: 10.3354/meps13179
Costa D. P. (1991). Reproductive and foraging energetics of high latitude penguins, albatrosses and pinnipeds: implications for life history patterns. Am. Zoologist 31, 111–130. doi: 10.1093/icb/31.1.111
Costa D. P., Breed G. A., Robinson P. W. (20122012). New insights into pelagic migrations: implications for ecology and conservation. Annu. Rev. Ecology Evol. Systematics 43. doi: 10.1146/annurev-ecolsys-102710-145045
Dodd C. K., Byles R. Jr. (2003). Post-nesting movements and behavior of loggerhead sea turtles (Caretta caretta) departing from east-central Florida nesting beaches. Chelonian Conserv. Biol. 4, 530–536.
Dunn D. C., Harrison A.-L., Curtice C., Deland S., Donnelly B., Fujioka E., et al. (2019). The importance of migratory connectivity for global ocean policy. Proc. R. Soc. B 286, 20191472. doi: 10.1098/rspb.2019.1472
Eder E., Ceballos A., Martins S., Pérez-García H., Marín I., Marco A., et al. (2012). Foraging dichotomy in loggerhead sea turtles Caretta caretta off northwestern Africa. Mar. Ecol. Prog. Ser. 470, 113–122. doi: 10.3354/meps10018
Evans D. R., Carthy R. R., Ceriani S. A. (2019). Migration routes, foraging behavior, and site fidelity of loggerhead sea turtles (Caretta caretta) satellite tracked from a globally important rookery. Mar. Biol. 166, 134. doi: 10.1007/s00227-019-3583-4
Foley A. M., Schroeder B. A., Hardy R., Macpherson S. L., Nicholas M., Coyne M. S. (2013). Postnesting migratory behavior of loggerhead sea turtles Caretta caretta from three Florida rookeries. Endangered Species Res. 21, 129–142. doi: 10.3354/esr00512
Girard C., Tucker A. D., Calmettes B. (2009). Post-nesting migrations of loggerhead sea turtles in the Gulf of Mexico: dispersal in highly dynamic conditions. Mar. Biol. 156, 1827–1839. doi: 10.1007/s00227-009-1216-z
Godley B. J., Barbosa C., Bruford M., Broderick A. C., Catry P., Coyne M. S., et al. (2010). Unravelling migratory connectivity in marine turtles using multiple methods. J. Appl. Ecol. 47, 769–778. doi: 10.1111/j.1365-2664.2010.01817.x
Griffin D. B., Murphy S. R., Frick M. G., Broderick A. C., Coker J. W., Coyne M. S., et al. (2013). Foraging habitats and migration corridors utilized by a recovering subpopulation of adult female loggerhead sea turtles: Implications for conservation. Mar. Biol. 160, 3071–3086. doi: 10.1007/s00227-013-2296-3
Hamann M. (2003). “Reproductive cycles of males and females,” in The biology of sea turtles, vol. II . Eds. Lutz P. L., Musick J. A., Wyneken J. (Boca Raton, London, New York, Washington D.C: CRC Marine Biology Series, CRC Press, Inc), 135–161.
Hardy R. F., Tucker A. D., Foley A. M., Schroeder B. A., Giove R. J., Meylan A. B. (2014). Spatiotemporal occurrence of loggerhead turtles (Caretta caretta) on the west Florida shelf and apparent overlap with a commercial fishery. Can. J. Fisheries Aquat. Sci. 71, 1924–1933. doi: 10.1139/cjfas-2014-0128
Hart K. M., Cherkiss M. S., Ceriani S. A. (2022). Stable isotope values for Dry Tortugas nesting loggerheads sampled 2013-2018. U.S. Geological Survey Data Release. doi: 10.5066/P93JKNLR
Hart K. M., Guzy J. C., Smith B. J. (2021). Drivers of realized satellite tracking duration in marine turtles. Movement Ecol. 9, 1–14. doi: 10.1186/s40462-020-00237-3
Hart K. M., Lamont M. M., Fujisaki I., Tucker A. D., Carthy R. R. (2012). Common coastal foraging areas for loggerheads in the Gulf of Mexico: Opportunities for marine conservation. Biol. Conserv. 145, 185–194. doi: 10.1016/j.biocon.2011.10.030
Hart K. M., Lamont M. M., Iverson A. R., Smith B. J. (2020). The importance of the northeastern gulf of Mexico to foraging loggerhead sea turtles. Front. Mar. Sci. 7. doi: 10.3389/fmars.2020.00330
Hart K. M., Lamont M. M., Sartain A. R., Fujisaki I. (2014). Migration, foraging, and residency patterns for northern gulf loggerheads: Implications of local threats and international movements. PloS One 9. doi: 10.1371/journal.pone.0103453
Hart K. M., Sartain A. R., Fujisaki I. (2015). Bahamas connection: residence areas selected by breeding female loggerheads tagged in Dry Tortugas National Park, USA. Anim. Biotelemetry 3, 3. doi: 10.1186/s40317-014-0019-2
Hatase H., Takai N., Matsuzawa Y., Sakamoto W., Omuta K., Goto K., et al. (2002). Size-related differences in feeding habitat use of adult female loggerhead turtles Caretta caretta around Japan determined by stable isotope analyses and satellite telemetry. Mar. Ecology-Progress Ser. 233, 273–281. doi: 10.3354/meps233273
Hawkes L. A., Witt M. J., Broderick A. C., Coker J. W., Coyne M. S., Dodd M., et al. (2011). Home on the range: spatial ecology of loggerhead turtles in Atlantic waters of the USA. Diversity Distributions 17, 624–640. doi: 10.1111/j.1472-4642.2011.00768.x
Hays G. C., Hawkes L. A. (2018). Satellite tracking sea turtles: opportunities and challenges to address key questions. Front. Mar. Sci. 5. doi: 10.3389/fmars.2018.00432
Hobson K. A. (1999). Tracing origins and migration of wildlife using stable isotopes: A review. Oecologia 120, 314–326. doi: 10.1007/s004420050865
Hobson K. A., Norris D. R., Kardynal K. J., Yohannes E. (2019). “Animal migration: a context for using new techniques and approaches,” in Tracking animal migration with stable isotopes (London, U. K.: Elsevier), 1–23.
Iverson A. R., Benscoter A. M., Fujisaki I., Lamont M. M., Hart K. M. (2020). Migration corridors and threats in the gulf of Mexico and florida straits for loggerhead sea turtles. Front. Mar. Sci. 7. doi: 10.3389/fmars.2020.00208
Kaufman T. J., Pajuelo M., Bjorndal K. A., Bolten A. B., Pfaller J. B., Williams K. L., et al. (2014). Mother–egg stable isotope conversions and effects of lipid extraction and ethanol preservation on loggerhead eggs. Conserv. Physiol. 2. doi: 10.1093/conphys/cou049
Madigan D. J., Shipley O. N., Hussey N. E. (2021). “Applying isotopic clocks to identify prior migration patterns and critical habitats in mobile marine predators,” in Conservation physiology: applications for wildlife conservation and management (Oxford, U. K.: Oxford University Press), 69–85.
Mansfield K. L. (2006). Sources of mortality, movements and behavior of sea turtles in Virginia. Ph.D. thesis, College of William and Mary. Available at: https://scholarworks.wm.edu/etd/1539616760/.
Mansfield K. L., Saba V. S., Keinath J. A., Musick J. A. (2009). Satellite tracking reveals a dichotomy in migration strategies among juvenile loggerhead turtles in the Northwest Atlantic. Mar. Biol. 156, 2555–2570. doi: 10.1007/s00227-009-1279-x
Marcovaldi M. A., Lopez G., Soares L., Lima E., Thomé J., Almeida A. (2010). Satellite-tracking of female loggerhead turtles highlights fidelity behavior in northeastern Brazil. Endangered Species Res. 12, 263–272. doi: 10.3354/esr00308
Martínez Del Rio C., Carleton S. A. (2012). How fast and how faithful: the dynamics of isotopic incorporation into animal tissues. J. Mammalogy 93, 353–359. doi: 10.1644/11-MAMM-S-165.1
Mccarthy I. D., Waldron S. (2000). Identifying migratory Salmo trutta using carbon and nitrogen stable isotope ratios. Rapid Commun. Mass Spectrometry 14, 1325–1331. doi: 10.1002/1097-0231(20000815)14:15<1325::AID-RCM980>3.0.CO;2-A
National Marine Fisheries Service and U.S. Fish Wildlife Service (2008). “Recovery plan for the northwest Atlantic population of the loggerhead sea turtle (Caretta caretta), Second Revision,” in National marine fisheries service, silver spring, MD. (Silver Spring, MD: National Marine Fisheries Service).
Okuyama J., Watabe A., Takuma S., Tanaka K., Shirai K., Murakami-Sugihara N., et al. (2022). Latitudinal cline in the foraging dichotomy of loggerhead sea turtles reveals the importance of East China Sea for priority conservation. Divers. Distrib. 28, 1568–1581. doi: 10.1111/ddi.13531
Pajuelo M., Bjorndal K. A., Arendt M. D., Foley A. M., Schroeder B. A., Witherington B. E., et al. (2016). Long-term resource use and foraging specialization in male loggerhead turtles. Mar. Biol. 163, 1–11. doi: 10.1007/s00227-016-3013-9
Pajuelo M., Bjorndal K. A., Reich K. J., Vander Zanden H. B., Hawkes L. A., Bolten A. B. (2012). Assignment of nesting loggerhead turtles to their foraging areas in the Northwest Atlantic using stable isotopes. Ecosphere 3 (10), 1–18. doi: 10.1890/ES12-00220.1
Pfaller J. B., Pajuelo M., Vander Zanden H. B., Andrews K. M., Dodd M. G., Godfrey M. H., et al. (2020). Identifying patterns in foraging-area origins in breeding aggregations of migratory species: Loggerhead turtles in the Northwest Atlantic. PloS One 15. doi: 10.1371/journal.pone.0231325
Phillips K. F., Addison D. S., Sasso C. R., Mansfield K. L. (2021). Postnesting migration routes and fidelity to foraging sites among loggerhead turtles in the western North Atlantic. Bull. Mar. Sci. 97, 1–18. doi: 10.5343/bms.2019.0099
Pikesley S. K., Broderick A. C., Cejudo D., Coyne M. S., Godfrey M. H., Godley B. J., et al. (2015). Modelling the niche for a marine vertebrate: A case study incorporating behavioural plasticity, proximate threats and climate change. Ecography 38, 803–812. doi: 10.1111/ecog.01245
Plotkin P. T., Spotila J. R. (2002). Post-nesting migrations of loggerhead turtles Caretta caretta from Georgia, USA: conservation implications for a genetically distinct subpopulation. Oryx 36, 396–399. doi: 10.1017/S0030605302000753
Putman N. F., Naro-Maciel E. (2013). Finding the ‘lost years’ in green turtles: insights from ocean circulation models and genetic analysis. Proc. R. Soc. B: Biol. Sci. 280. doi: 10.1098/rspb.2013.1468
Rees A. F., Alfaro-Shigueto J., Barata P. C. R., Bjorndal K. A., Bolten A. B., Bourjea J., et al. (2016). Are we working towards global research priorities for management and conservation of sea turtles? Endangered Species Res. 31, 337–382. doi: 10.3354/esr00801
Reich K. J., Bjorndal K. A., Frick M. G., Witherington B. E., Johnson C., Bolten A. B. (2010). Polymodal foraging in adult female loggerheads (Caretta caretta). Mar. Biol. 157, 113–121. doi: 10.1007/s00227-009-1300-4
Reich K. J., Bjorndal K. A., Martínez Del Rio C. (2008). Effects of growth and tissue type on the kinetics of 13C and 15N incorporation in a rapidly growing ectotherm. Oecologia 155, 651–663. doi: 10.1007/s00442-007-0949-y
Rubenstein D. R., Hobson K. A. (2004). From birds to butterflies: Animal movement patterns and stable isotopes. Trends Ecol. Evol. 19, 256–263. doi: 10.1016/j.tree.2004.03.017
Rundel C. W., Wunder M. B., Alvarado A. H., Ruegg K. C., Harrigan R., Schuh A., et al. (2013). Novel statistical methods for integrating genetic and stable isotope data to infer individual-level migratory connectivity. Mol. Ecol. 22, 4163–4176. doi: 10.1111/mec.12393
Schofield G., Hobson V. J., Fossette S., Lilley M. K. S., Katselidis K. A., Hays G. C. (2010). Fidelity to foraging sites, consistency of migration routes and habitat modulation of home range by sea turtles. Divers. Distrib. 16, 840–853. doi: 10.1111/j.1472-4642.2010.00694.x
Seminoff J. A., Benson S. R., Arthur K. E., Eguchi T., Dutton P. H., Tapilatu R. F., et al. (2012). Stable isotope tracking of endangered sea turtles: validation with satellite telemetry and δ15 analysis of amino acids. PloS One 7, e37403. doi: 10.1371/journal.pone.0037403
Shamblin B., Dodd M., Bagley D., Ehrhart L., Tucker A., Johnson C., et al. (2011). Genetic structure of the southeastern United States loggerhead turtle nesting aggregation: evidence of additional structure within the peninsular Florida recovery unit. Mar. Biol. 158, 571–587. doi: 10.1007/s00227-010-1582-6
Shamblin B. M., Dodd M. G., Griffin D. B. B., Pate S. M., Godfrey M. H., Coyne M. S., et al. (2017). Improved female abundance and reproductive parameter estimates through subpopulation-scale genetic capture-recapture of loggerhead turtles. Mar. Biol. 164, 138. doi: 10.1007/s00227-017-3166-1
Shimada T., Limpus C., Jones R., Hazel J., Groom R., Hamann M. (2016). Sea turtles return home after intentional displacement from coastal foraging areas. Mar. Biol. 163, 1–14. doi: 10.1007/s00227-015-2771-0
Shimada T., Thums M., Hamann M., Limpus C. J., Hays G. C., Fitzsimmons N. N., et al. (2021). Optimising sample sizes for animal distribution analysis using tracking data. Methods Ecol. Evol. 12, 288–297. doi: 10.1111/2041-210X.13506
Shipley O. N., Newton A. L., Frisk M. G., Henkes G. A., Labelle J. S., Camhi M. D., et al. (2021). Telemetry-validated nitrogen stable isotope clocks identify ocean-to-estuarine habitat shifts in mobile organisms. Methods Ecol. Evol. 12, 897–908. doi: 10.1111/2041-210X.13567
Silver-Gorges I., Ingels J., Dos Santos G., Valdes Y., Pontes L. P., Silva A. C., et al. (2021). Epibionts reflect spatial and foraging ecology of gulf of Mexico loggerhead turtles (Caretta caretta). Front. Ecol. Evol. 9. doi: 10.3389/fevo.2021.696412
Stewart K. R., Lacasella E. L., Jensen M. P., Epperly S. P., Haas H. L., Stokes L. W., et al. (2019). Using mixed stock analysis to assess source populations for at-sea bycaught juvenile and adult loggerhead turtles (Caretta caretta) in the north-west Atlantic. Fish Fisheries 20, 239–254. doi: 10.1111/faf.12336
Thomson J. A., Heithaus M. R., Burkholder D. A., Vaudo J. J., Wirsing A. J., Dill L. M. (2012). Site specialists, diet generalists? Isotopic variation, site fidelity, and foraging by loggerhead turtles in Shark Bay, Western Australia. Mar. Ecology-Progress Ser. 453, 213–226. doi: 10.3354/meps09637
Tucker A. D., Macdonald B. D., Seminoff J. A. (2014). Foraging site fidelity and stable isotope values of loggerhead turtles tracked in the Gulf of Mexico and northwest Caribbean. Mar. Ecol. Prog. Ser. 502, 267–279. doi: 10.3354/meps10655
Vander Zanden H. B., Bolten A. B., Tucker A. D., Hart K. M., Lamont M. M., Fujisaki I., et al. (2016). Biomarkers reveal sea turtles remained in oiled areas following the Deepwater Horizon oil spill. Ecol. Appl. 26, 2145–2155. doi: 10.1002/eap.1366
Vander Zanden H. B., Pfaller J. B., Reich K. J., Pajuelo M., Bolten A. B., Williams K. L., et al. (2014). Foraging areas differentially affect reproductive output and interpretation of trends in abundance of loggerhead turtles. Mar. Biol. 161, 585–598. doi: 10.1007/s00227-013-2361-y
Vander Zanden H. B., Tucker A. D., Hart K. M., Lamont M. M., Fujisaki I., Addison D. S., et al. (2015). Determining origin in a migratory marine vertebrate: a novel method to integrate stable isotopes and satellite tracking. Ecol. Appl. 25, 320–335. doi: 10.1890/14-0581.1
Wallace B. P., Dimatteo A. D., Bolten A. B., Chaloupka M. Y., Hutchinson B. J., Abreu-Grobois F. A., et al. (2011). Global conservation priorities for marine turtles. PloS One 6, e24510. doi: 10.1371/journal.pone.0024510
Wallace B. P., Dimatteo A. D., Hurley B. J., Finkbeiner E. M., Bolten A. B., Chaloupka M. Y., et al. (2010). Regional management units for marine turtles: a novel framework for prioritizing conservation and research across multiple scales. PloS One 5, e15465. doi: 10.1371/journal.pone.0015465
Wallace B. P., Jones T. T. (2008). What makes marine turtles go: A review of metabolic rates and their consequences. J. Exp. Mar. Biol. Ecol. 356, 8–24. doi: 10.1016/j.jembe.2007.12.023
Webster M. S., Marra P. P., Haig S. M., Bensch S., Holmes R. T. (2002). Links between worlds: unraveling migratory connectivity. Trends Ecol. Evol. 17, 76–83. doi: 10.1016/S0169-5347(01)02380-1
Wilkinson T. A., Wiken E., Creel J. B., Hourigan T. F., Agardy T., Herrmann H., et al. (2009). Marine ecoregions of north america. (Montreal, Canada: Commission for Environmental Cooperation), 200.
Willis-Norton E., Hazen E. L., Fossette S., Shillinger G., Rykaczewski R. R., Foley D. G., et al. (2015). Climate change impacts on leatherback turtle pelagic habitat in the southeast pacific. Deep-Sea Res. Part II: Topical Stud. Oceanography 113, 260–267. doi: 10.1016/j.dsr2.2013.12.019
Keywords: carbon, Caretta caretta, foraging area, nitrogen, stable isotope, satellite telemetry and tracking
Citation: Ceriani SA, Murasko S, Addison DS, Anderson D, Curry G, Desjardin NA, Eastman SF, Evans DR, Evou N, Fuentes MMPB, Godfrey MH, Hart KM, Hillbrand P, Hirsch SE, Mott CR, Mansfield KL, Mazzarella KT, Norris SV, Pate SM, Phillips KF, Rusenko KW, Shamblin BM, Stevenson A, Sloan KA, Tucker AD, Welsh RC and Casale P (2023) Monitoring population-level foraging distribution of a marine migratory species from land: strengths and weaknesses of the isotopic approach on the Northwest Atlantic loggerhead turtle aggregation. Front. Mar. Sci. 10:1189661. doi: 10.3389/fmars.2023.1189661
Received: 19 March 2023; Accepted: 16 October 2023;
Published: 27 October 2023.
Edited by:
André Chiaradia, Phillip Island Nature Parks, AustraliaReviewed by:
Hideaki Nishizawa, Kyoto University, JapanMichele Thums, Australian Institute of Marine Science (AIMS), Australia
Copyright © 2023 Ceriani, Murasko, Addison, Anderson, Curry, Desjardin, Eastman, Evans, Evou, Fuentes, Godfrey, Hart, Hillbrand, Hirsch, Mott, Mansfield, Mazzarella, Norris, Pate, Phillips, Rusenko, Shamblin, Stevenson, Sloan, Tucker, Welsh and Casale. This is an open-access article distributed under the terms of the Creative Commons Attribution License (CC BY). The use, distribution or reproduction in other forums is permitted, provided the original author(s) and the copyright owner(s) are credited and that the original publication in this journal is cited, in accordance with accepted academic practice. No use, distribution or reproduction is permitted which does not comply with these terms.
*Correspondence: Simona A. Ceriani, simona.ceriani@myfwc.com