 Masuma Chowdhury1,2*
 César Vilas3,4
 Stef van Bergeijk3
 Gabriel Navarro4,5
 Irene Laiz1
 Isabel Caballero4,5
- 1Departamento de Física Aplicada, Instituto Universitario de Investigación Marina (INMAR), Universidad de Cádiz, Puerto Real, Cádiz, Spain
- 2Quasar Science Resources, S. L., Madrid, Spain
- 3Andalusian Institute of Agricultural and Fisheries Research and Training (IFAPA)-Centro El Toruño El Puerto de Santa Maria, Cádiz, Spain
- 4Associate Research Unit “Blue Growth” Spanish National Research Council (CSIC) - Andalusian Institute of Agricultural and Fisheries Research and Training (IFAPA), Cádiz, Spain
- 5Department of Ecology and Coastal Management, Institute of Marine Sciences of Andalusia (ICMAN) - Spanish National Research Council (CSIC), Puerto Real, Cádiz, Spain
The Guadalquivir estuary (southern Spain) occasionally experiences medium to high turbidity, reaching above 700 Formazin Nephelometric Unit (FNU) during extreme events, thus negatively influencing its nursery function and the estuarine community structure. Although several turbidity algorithms are available to monitor water quality, they are mainly developed for mapping turbidity ranges of 0-100 FNU. Thus, their use in a highly turbid region may not give accurate results, which is crucial for estuarine ecosystem management. To fill this gap, we developed a multi-conditional turbidity algorithm that can retrieve turbidity from 0 to 600 FNU using the Sentinel-2 red and red-edge bands. Four major steps are implemented: atmospheric and sun glint correction of the Level-1C Sentinel-2 data, spectral analysis for different water turbidity levels, regression modelling between in situ turbidity and remote sensing reflectance (Rrs) for algorithm development, and validation of the best-suited model. When turbidity was < 85 FNU, the Rrs increased firstly in the red wavelength (665 nm), but it saturated beyond a certain turbidity threshold (> 250 FNU). At this time, Rrs started to increase in the red-edge wavelength (704 nm). Considering this spectral behavior, our algorithm is designed to automatically select the most sensitive turbidity vs. Rrs, thus avoiding the saturation effects of the red bands at high turbidity levels. The model showed good agreement between the satellite derived turbidity and the in situ measurements with a correlation coefficient of 0.97, RMSE of 15.93 FNU, and a bias of 13.34 FNU. Turbidity maps derived using this algorithm can be used for routine turbidity monitoring and assessment of potential anthropogenic actions (e.g., dredging activities), thus helping the decision-makers and relevant stakeholders to protect coastal resources and human health.
1 Introduction
Being an optical property of water, turbidity measures the amount of light scattered by the material present in the water and indicates its relative clarity when light shines through it (Swanson and Baldwin, 1965; Grobbelaar, 2009; Bozorg-Haddad et al., 2021). The higher the turbidity of a water body, the larger the amount of scattered light that will result (Swanson and Baldwin, 1965). Turbidity makes the water cloudy or opaque and the materials responsible for it may include nutrients, bacteria, algae, dissolved colored organic compounds, and other very tiny organic and inorganic matters (Swanson and Baldwin, 1965; Grobbelaar, 2009; Scholz, 2016; Bozorg-Haddad et al., 2021). Turbidity has been reported to affect ecosystems in several ways. For example, it reduces light penetration throughout the water column impeding photosynthesis and thus, it can inhibit phytoplankton growth. It might indicate nutrient loading that can initiate eutrophication and algae blooms (Cloern, 1987; Pennock and Sharp, 1994; Ritchie et al., 2003; Neukermans et al., 2012; Wang and Yang, 2019). Besides, high and persistent turbidity events can affect the nursery function of the estuaries by modifying the availability of prey (indirectly, through phytoplankton depletion, or directly by reducing their fecundity) and by reducing the density of fish recruits (by increasing larval mortality or reducing the individuals’ physiological condition), which may have important ecological and socioeconomic implications (Le Pape et al., 2007; González-Ortegón et al., 2010; De Carvalho-Souza et al., 2019). The latter is particularly relevant in regions considered essential fish habitats (EFHs), such as estuaries. Furthermore, in sediment transport applications, turbidity is used as a measurable proxy for the concentration of total suspended matter (TSM) due to its close relationship with the backscattering of TSM (Dogliotti et al., 2015). Therefore, knowledge about turbidity plumes such as their origin, spatial distribution, variations, and plume dynamics, provides important information about several processes, including phytoplankton production, eutrophication, the abundance of marine recruits, and the global biogeochemical cycles (González-Ortegón et al., 2010; Ruiz et al., 2013; Caballero et al., 2014). This information is critical for the coastal decision-makers, who are responsible for the challenging short-term management and long-term policy decisions to protect water quality, ecosystems, and human health (Caballero et al., 2014; De Carvalho-Souza et al., 2019).
Currently, water quality monitoring and management are gaining increasing importance. Among others, turbidity (measured in various units, i.e., Formazin Turbidity Unit (FTU), Nephelometric Turbidity Unit (NTU), Formazin Nephelometric Unit (FNU)) is pertinent as an indicator of the water quality status that needs to be measured and monitored to comply with the European Union’s Marine Strategy Framework Directive (MSFD) (Dogliotti et al., 2015). The MSFD applies the Ecosystem Approach to the management of human activities with the aim of achieving a Good Environmental Status (GES). Within MSFD, monitoring turbidity has been included in descriptors D1 (Biological diversity is maintained. The quality and occurrence of habitats and the distribution and abundance of species are in line with prevailing physiographic, geographic and climate conditions) and D5 (Human-induced eutrophication is minimized, especially adverse effects thereof, such as losses in biodiversity, ecosystem degradation, harmful algal blooms and oxygen deficiency in bottom waters). More specifically, turbidity is linked to the descriptors 1.6.3, for the assessment of habitat condition, and 5.2.2, for the assessment of water transparency (Zampoukas et al., 2012). To support these descriptors, satellite-based remote sensing techniques that measure the quantity of light reflected/absorbed by the water surface to correlate it with different water quality parameters can be considered as a promising tool. It ensures a cost-effective alternative to sampling and/or measuring methods that require extensive time for field data collection and laboratory analysis (Caballero et al., 2018a; Maimouni et al., 2022). Besides, it provides beneficial information concerning water properties in greater spatial coverage with finer resolution and increased temporal frequency (Kim et al., 2017; Shaikh et al., 2018). Given these advantages, the potential of this tool has been explored and different models based on a single band and/or multiple bands were developed. To date, several studies have reported a good correlation between different turbidity levels and the reflectance of the satellite bands located in the red and near-infrared (NIR) parts of the spectrum. For example, Bustamante et al. (2009) used reflectances at 630-690 nm of Landsat 5 and 7 satellites (30 m spatial resolution) to map turbidity (ranging between 1.5-8 NTU) in the Doñana marshes of the Guadalquivir River catchment areas in Spain. Chen et al. (2007) and Petus et al. (2010) used the MODIS 250 m resolution band at 645 nm to map turbidity ranging between 0.9-8 NTU and 0.5-70 NTU in the Tampa Bay (USA) and Adour River (France), respectively. The MERIS 681 nm band also showed the best fit for turbidity values ranging from 1-25 FTU in three different tropical waters of New Caledonia, Cuba, and Fiji (Ouillon et al., 2008). A multiple linear regression analysis using Landsat bands at 630-690 nm and 750-900 nm was also used to map turbidity in a glacial lake in Alaska (Liversedge, 2007). All these models are based on medium and low-resolution data with spatial coverage of 30 m to 1 km, which are good for large regions with less variability. Again, their use may not give accurate results in highly turbid regions like estuaries. Monitoring estuaries, bays, ports, or beaches that have very dynamic environments due to their physical, chemical, and biological variabilities, requires the use of higher spatial resolution data such as the Sentinel-2 satellite data from the European Union’s Earth Observation Copernicus programme.
Sentinel-2 is a wide-swath, high-resolution open-source satellite mission, comprised of two satellites, i.e., Sentinel-2A and Sentinel-2B that were launched in 2015 and 2017, respectively. Their single instrument, a Multispectral Imager (MSI), is designed to collect data in 13 spectral bands using a push broom technology with a wide field of view of 290 km. Sentinel-2 has a revisit cycle of 10 days at the equator with one satellite, and 5 days with both satellites, which implies having a 2-3 day revisit time at mid-latitudes. The bands have a spatial resolution of 10, 20, and 60 m. This satellite product is by default a 100 km by 100 km squared ortho-image in UTM/WGS84 projection system. Even though these satellites were primarily designed for land applications, their freely available higher-resolution data motivated the scientific community to investigate their potential for coastal applications. To date, several studies have reported their successful use in coastal and estuarine environments, i.e., Caballero et al. (2018b; 2019; 2020; 2022); Caballero and Stumpf (2020); Cao and Tzortziou (2021); Haro et al. (2022); Maimouni et al. (2022); Sebastiá-Frasquet et al. (2019); Wang et al. (2022); Zhang et al. (2021), among others. Caballero et al. (2019) showed that the spectral bands of Sentinel-2 and Sentinel-3 in the red-edge and NIR regions allow turbidity detection in optically shallow waters. Even though several turbidity models are available, the direct use of these models in other water bodies imposes some constraints due to the local variable conditions that significantly affect the water-leaving reflectance (Carpintero et al., 2013), thus demanding the development of region-specific models for an accurate and more reliable monitoring system.
The Guadalquivir River is a major watercourse in southern Spain, the last 110 km of which fall under the Guadalquivir estuary (Figure 1). It occasionally experiences medium to high discharge episodes (Losada et al., 2017) laden with suspended sediments (Caballero et al., 2018b). This results in different turbidity levels in the outer estuary and its adjacent coastal areas, ranging from less than 75 FNU in summer, up to 150 FNU in spring and autumn, and 300 FNU or higher in winter, although it might reach values above 700 FNU during extreme events (González-Ortegón et al., 2010). An assessment carried out using 18 years (1997-2015) of in situ turbidity data along with abundances of European anchovy and three mysid species (i.e., anchovy preys, namely, M. slabberi, N. integer, and R. tartessicus) indicated that turbidity values ≥ 100 FNU resulted in a lower abundance of anchovy and two of its preys (M. slabberi, which is the anchovy main prey, and R. tartessicus) (De Carvalho-Souza et al., 2019). Previous studies had shown that, while normal turbidity values provide favorable conditions for phytoplankton growth (Navarro and Ruiz, 2006) and high biological activity in this region (Baldó et al., 2006), extreme and persistent turbidity events negatively influence its nursery function by affecting the recruitment of fishes and crustacean decapods and the estuarine community structure in general (González-Ortegón et al., 2010; González-Ortegón et al., 2018). High and persistent turbidity events also affect negatively the extensive sustainable aquaculture companies settled on both shores (which directly pump water from the estuary for its activity) by clogging and filling fish culture ponds. Removal of mud and sludge generates a considerable effort in mechanical works thus causing serious economic damages, and even real companies shut down in the recent past. Therefore, a high temporal resolution turbidity monitoring system in the Guadalquivir estuary becomes necessary for optimizing water management in these facilities to avoid pumping water in, when water quality is worse. Furthermore, the Guadalquivir estuary is used as a navigable channel (Guadalquivir Euroway E.60.02) by commercial vessels (up to 40000 Tones) to sail upwards to Seville harbor, producing sediment resuspension, intertidal plains, and shores erosion by bow waves and a continuous dredging activity to optimize the channel’s operational depth. Hence, an accurate and reliable turbidity monitoring system in this region is necessary for a better understanding of its plume dynamics and distribution, including the effects of dredging. This in turn can help the establishment of ecosystem-based management of its vulnerable coastal resources and the estuarine community.
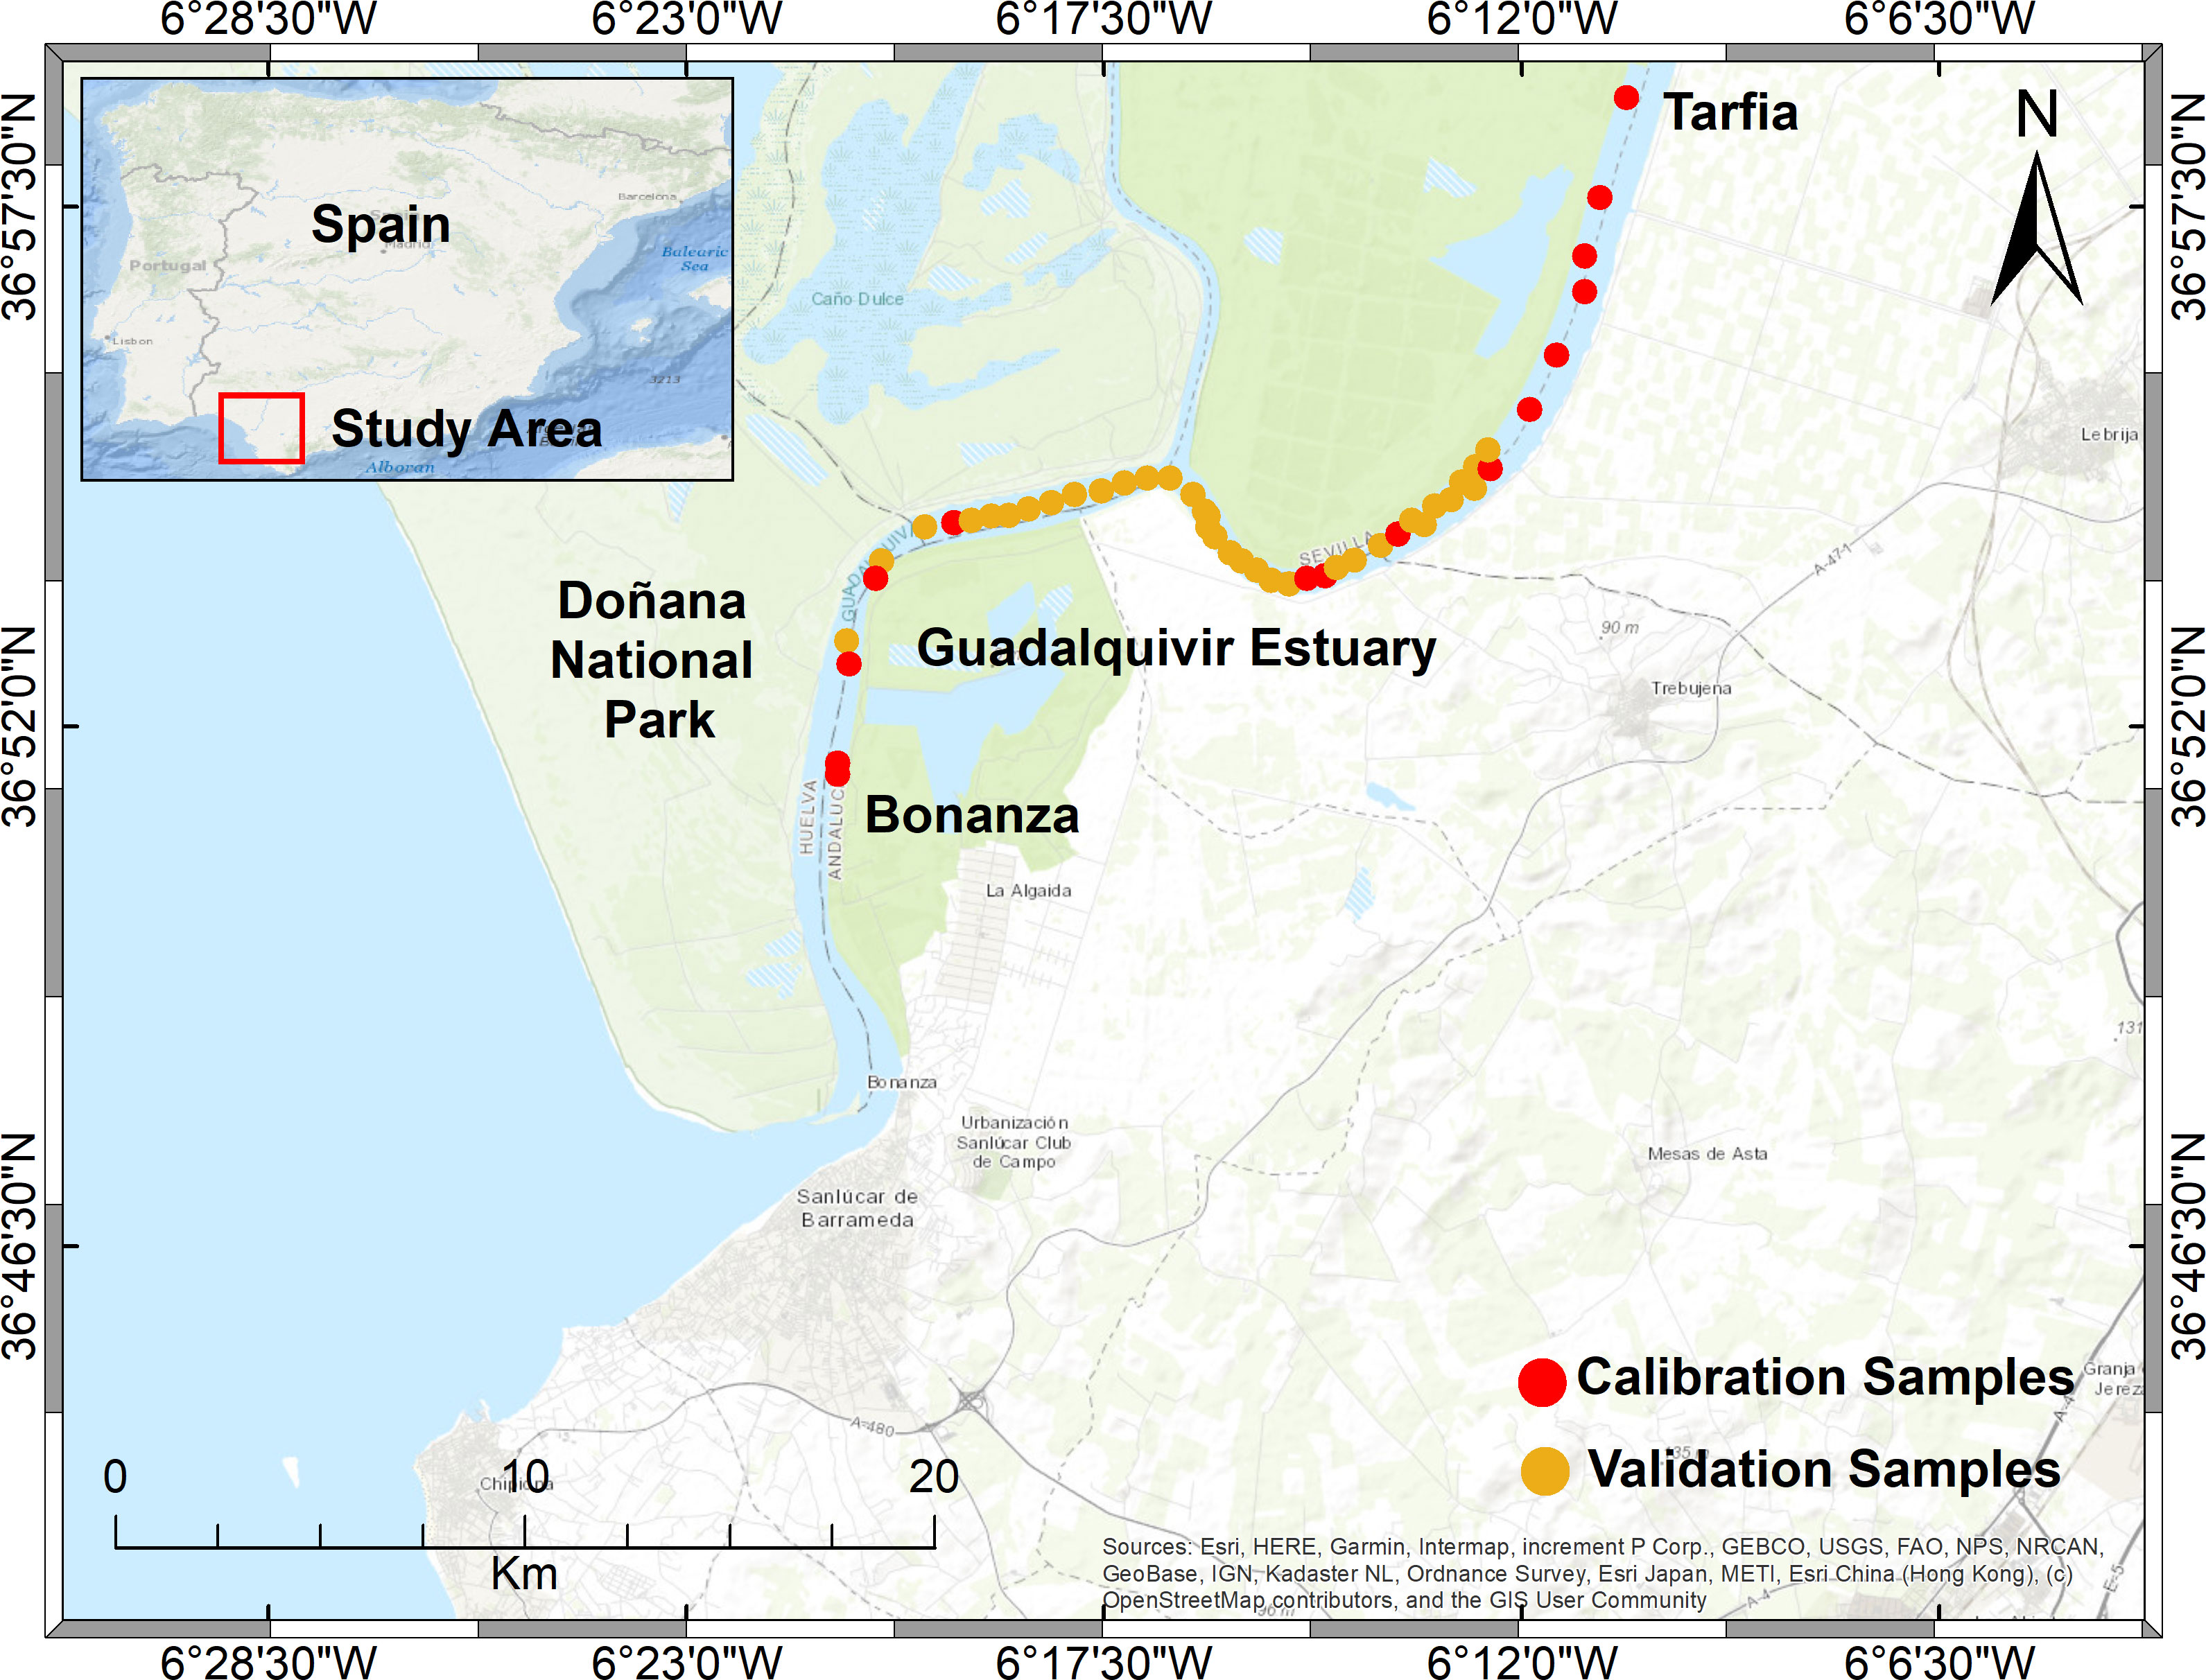
Figure 1 Location of the study area: Guadalquivir estuary. The red and yellow dots indicate field locations for the calibration and validation data points, respectively, collected for the development and validation of the regional multi-conditional turbidity algorithm using Sentinel-2 satellite data.
In 2018, a multi-conditional total suspended solids (TSM, mg/l) algorithm (using the 665 and 865 nm bands from Sentinel-2A) for this region was developed by Caballero et al. (2018b). However, in comparison to TSM, turbidity is more tightly related to the backscattering coefficient and thus to the reflectance (Dogliotti et al., 2015). This singularity of turbidity was strongly evident in the Guadalquivir estuary and its adjacent coastal and offshore region (Figure 2), where the water reflectance, especially in the red and the red-edge bands of the Sentinel-2 satellites were found very sensitive to different turbidity levels. This motivated us to investigate the potential of the high-resolution Sentinel-2 satellite data to accurately retrieve and estimate turbidity in this region. Therefore, this study aims to develop a turbidity algorithm for a highly variable estuary such as the Guadalquivir using Sentinel-2 (both Sentinel-2A and 2B) data to retrieve turbidity with a finer spatial resolution and higher temporal frequency, thus, complementing the existing conventional field-based monitoring system.
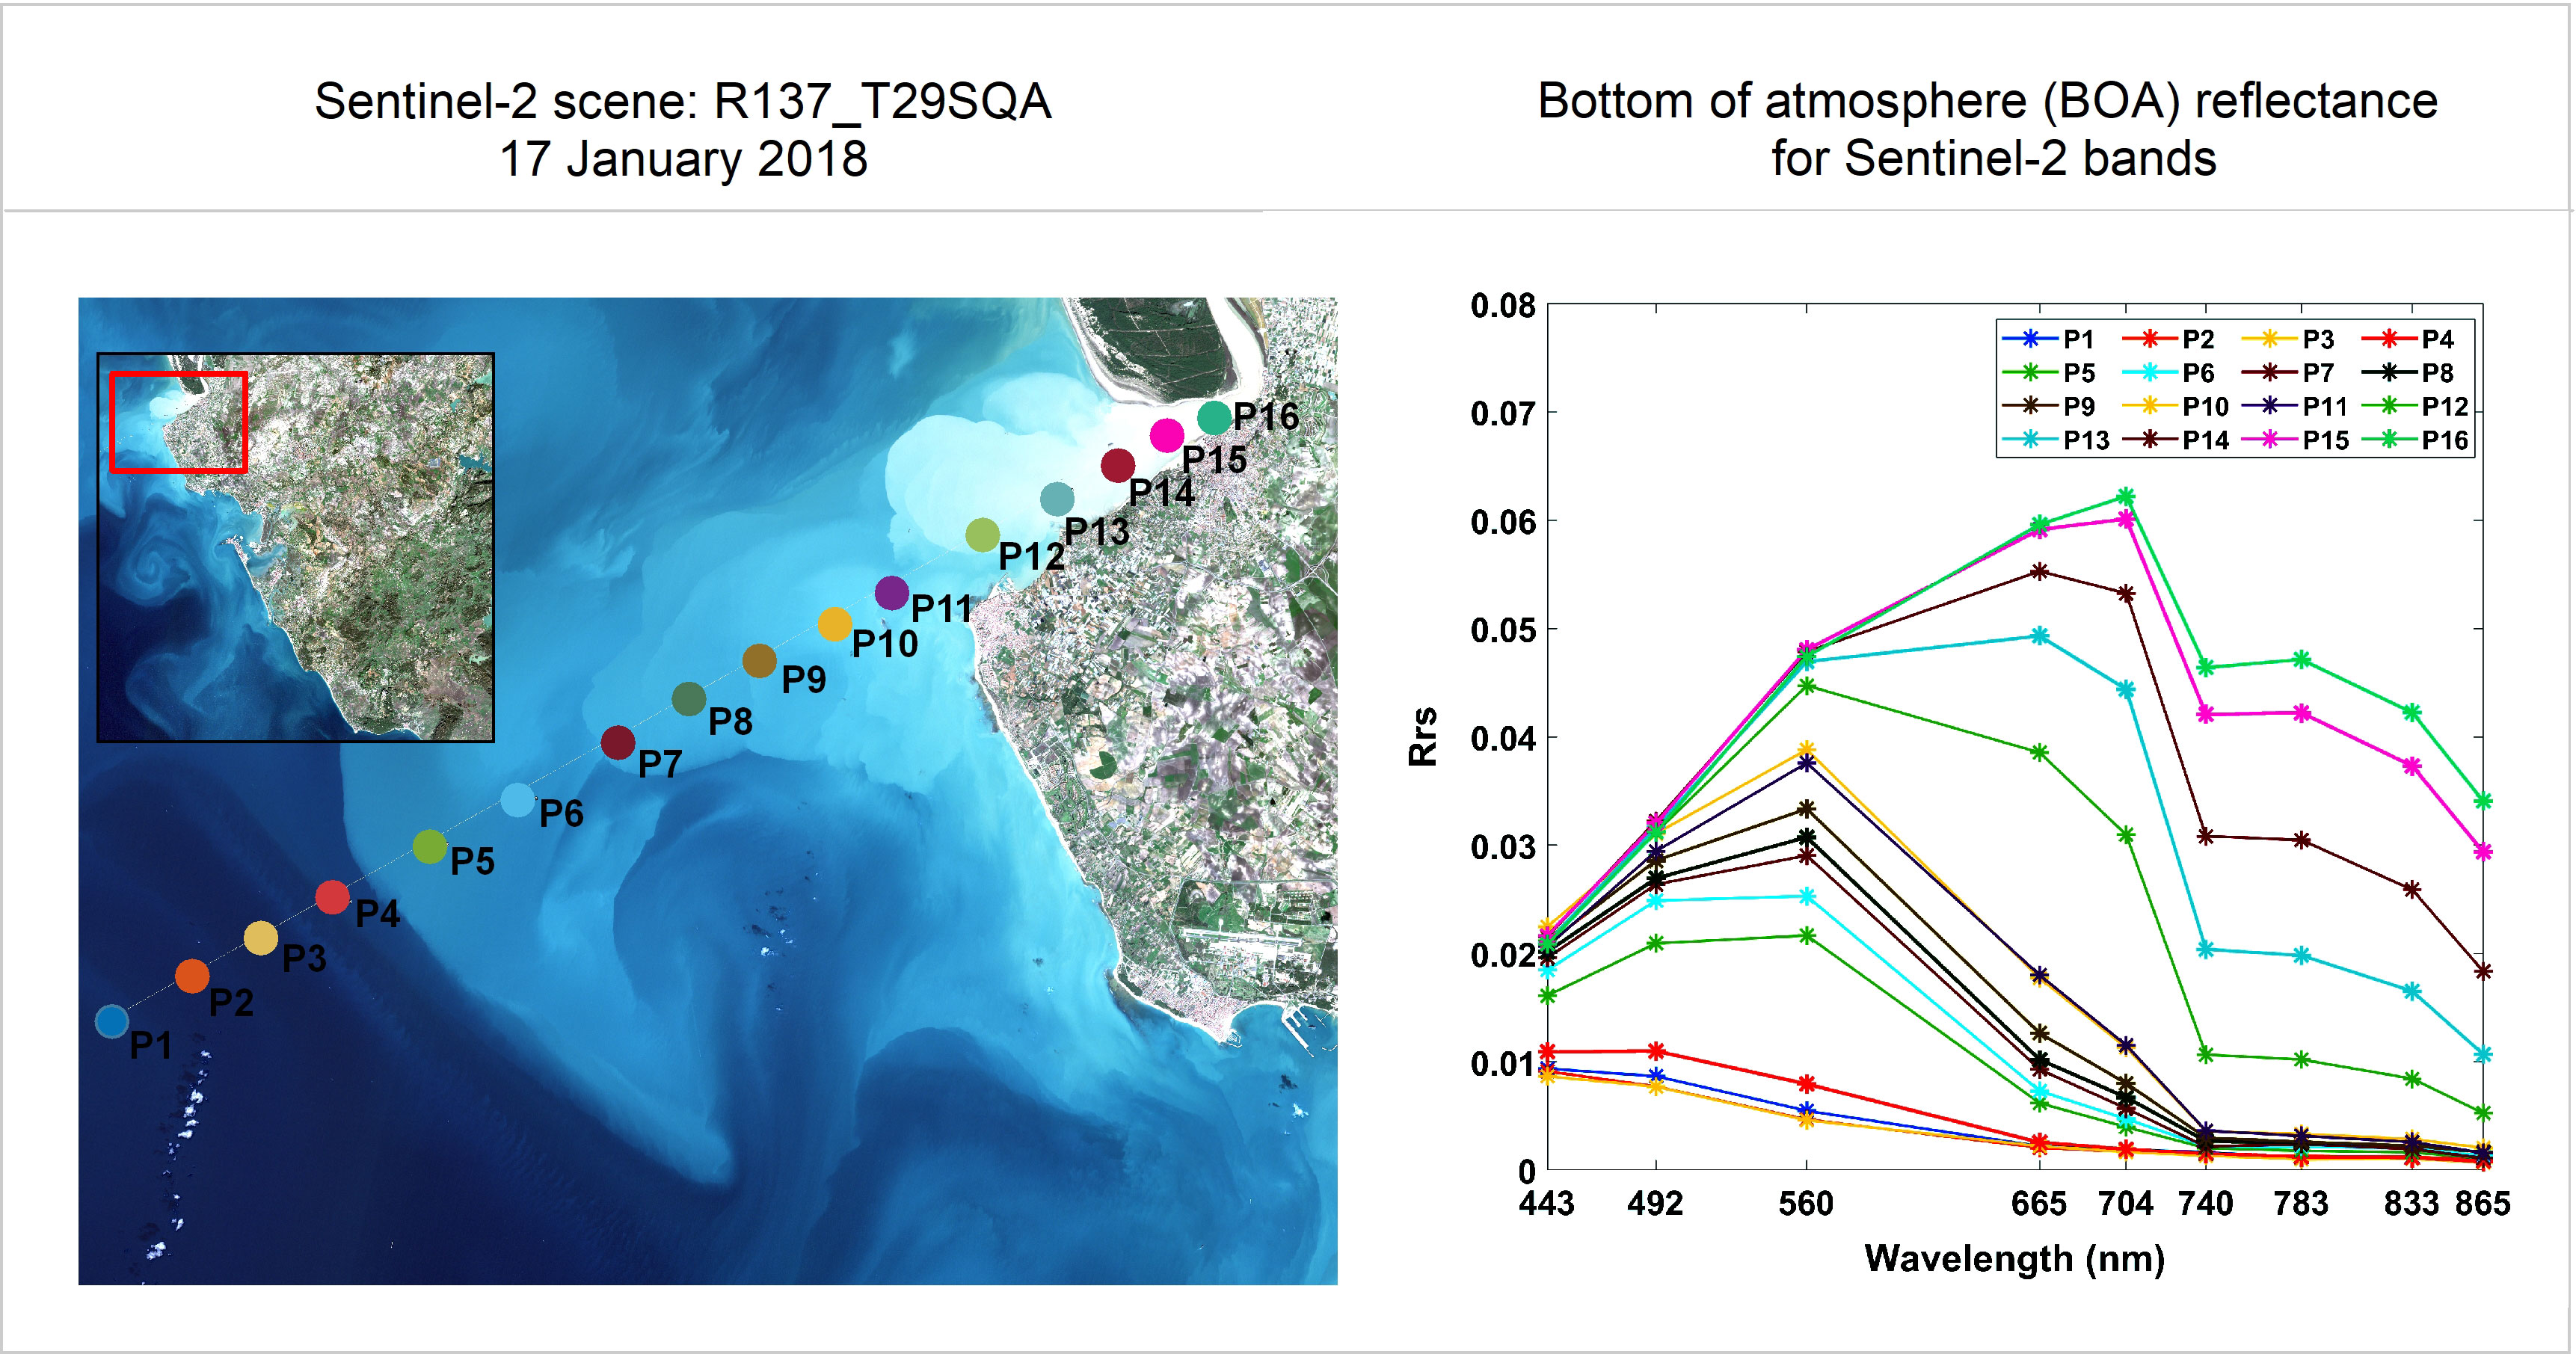
Figure 2 Sentinel-2A image on 17 January 2018. Left panel: RGB composite at bottom of atmosphere (BOA); the dots indicate a transit from offshore clear water to a higher turbidity level in the estuary mouth. Right panel: the corresponding spectral signature (Remote sensing reflectance, Rrs, 1/sr) for each dot from different turbidity levels along this transit. Note the different colours of the dots (left panel) with the corresponding spectra (right panel).
2 Materials and methods
2.1 Study area
The Guadalquivir estuary (Figure 1) (36°43’N - 37°32’N, 5°56’W - 6°30’W) is located between the basin of the Guadalquivir River and the Gulf of Cadiz. The width of the estuary mouth is 800 m, with a mean depth of 7.1 m. The bed of the upper part of the estuary is principally composed of fine-grained mud (over 90%), whereas the rest of the estuary is composed of sand (80%) as well as silt and clay (20%) (Díez-Minguito et al., 2014). The estuary is navigable between the Atlantic Ocean and Seville. The UNESCO world heritage site and Spain’s most important biosphere reserve, Doñana National Park, is located in the northern part of this estuary.
The estuary is subject to a Mediterranean climate with an average annual precipitation of 573 mm ranging between 260-983 mm, which influences sediment transport and the turbidity plume at the river mouth (Gutiérrez et al., 2015). The water resources of this river are highly regulated by several dams that significantly control the transport of materials from the river basin. In this sense, the annual discharges from the Alcala del Rio dam, although highly correlated with the winter North Atlantic Oscillation (NAO) index (Laiz et al., 2020), have been strongly altered since the 1970s (Navarro et al., 2012), along with the development of intensive agriculture and increased water demands. As a result, large river discharges might be observed in winter when the dams are opened due to heavy rainfall or in spring and summer when the dams are opened for irrigating the adjacent fields (Contreras and Polo, 2012). The main land uses in the entire river basin are forestry (49.1%), agriculture (47.2%), urban areas (1.9%), and wetlands (1.8%) (Confederación Hidrográfica del Guadalquivir, 2005). Therefore, the main pressure in the basin is agriculture irrigation with almost 88% of total water abstraction, followed by urban use (10%), and industrial and energetic uses, with less than 2% (Gutiérrez et al., 2015).
The Guadalquivir estuary is the most important contributor to the productivity of the Gulf of Cadiz (Prieto et al., 2009) by exporting nutrients and large amounts of dissolved organic matter, a major component of the organic matter pool playing a key role in the global ocean functioning (González-Ortegón et al., 2018). However, water quality is a significant problem throughout the river basin. The main sources of pollution include urban and industrial wastewater discharge, erosion, and nutrients and pesticide runoff from agricultural lands (Confederación Hidrográfica del Guadalquivir, 2005). Besides, this estuary intermittently experiences medium to high sediment discharges throughout the year. All these phenomena make turbidity one of the key water quality indicators in this estuary. The fluctuations in timing and magnitude of total river discharge, the ambient current, tidal conditions, and meteorology modify the spatial and temporal extent of the turbidity plumes at its mouth (Caballero et al., 2014; Caballero and Navarro, 2018; Navarro et al., 2012).
2.2 Data sets
2.2.1 In situ data
In the lower course of the Guadalquivir estuary, the Andalusian Institute of Agricultural and Fisheries Research and Training (IFAPA) runs a Long-Term Ecological Research program (GUADALQUIVIR_LTER 1997-2022) for monitoring water quality. IFAPA collects field data at two sampling sites, i.e., Tarfia (36°57’34.33” N and 6°10’36.19” W) and Bonanza (36°52’9.02” N and 6°20’49.18” W) (Figure 1) using an EXO turbidity digital smart sensor with a measurement range between 0 to 4000 FNU. The sensor has a resolution of 0.01 FNU with an accuracy of ±2% for 0 to 999 FNU and a resolution of 0.1 FNU with an accuracy of ±5% for 1000 to 4000 FNU. All sensors of the EXO are routinely calibrated on an annual basis by the company Instrumentación Analítica, S. A. Besides, the turbidity sensor is calibrated in the laboratory every several months using the appropriate AMCO-AEPA turbidity standards (YSI). A 24-hour sampling is carried out once a month at each site at 1.5 m depth, covering the full tidal cycle, i.e., two high tides and two low tides, and the data are logged every 5 minutes. The water depth at the sampling sites is between 3-4 m. Because of high turbidity in the estuary, bottom effects do not contribute to the water-leaving reflectance.
In this study, in situ turbidity field data collected by IFAPA at the two stations between November 2017 and May 2021 were considered. These in situ measurements were synchronized with the Sentinel-2 scenes (Table 1) considering a temporal window of ±3 min of the satellite overpass to ensure having in situ and satellite data for the same date and time. This resulted in only 11 in situ data points despite having a long time series data from IFAPA. Therefore, the Andalusian Institute of Marine Science (ICMAN-CSIC) organized three field campaigns on 21 May and 28 September 2021, and on 6 April 2022, coinciding with the Sentinel-2 pass (temporal window of ±30 min of the satellite overpass), to cover a wide range of area and water turbidity levels in the estuary. In this case, the same EXO turbidity digital smart sensor was used to measure surface water turbidity in the Guadalquivir estuary. The satellite-synchronized in situ dataset from IFAPA, along with the data from 21 May 2021 and 6 April 2022 field campaigns (turbidity range: 26 – 600 FNU) were used for the turbidity model development, whereas data from the other field campaign, i.e., 28 September 2021 (turbidity range: 12 – 130 FNU) were used for the model validation. The red and yellow dots in Figure 1 indicate the field measurements used for the turbidity model calibration and validation, respectively.
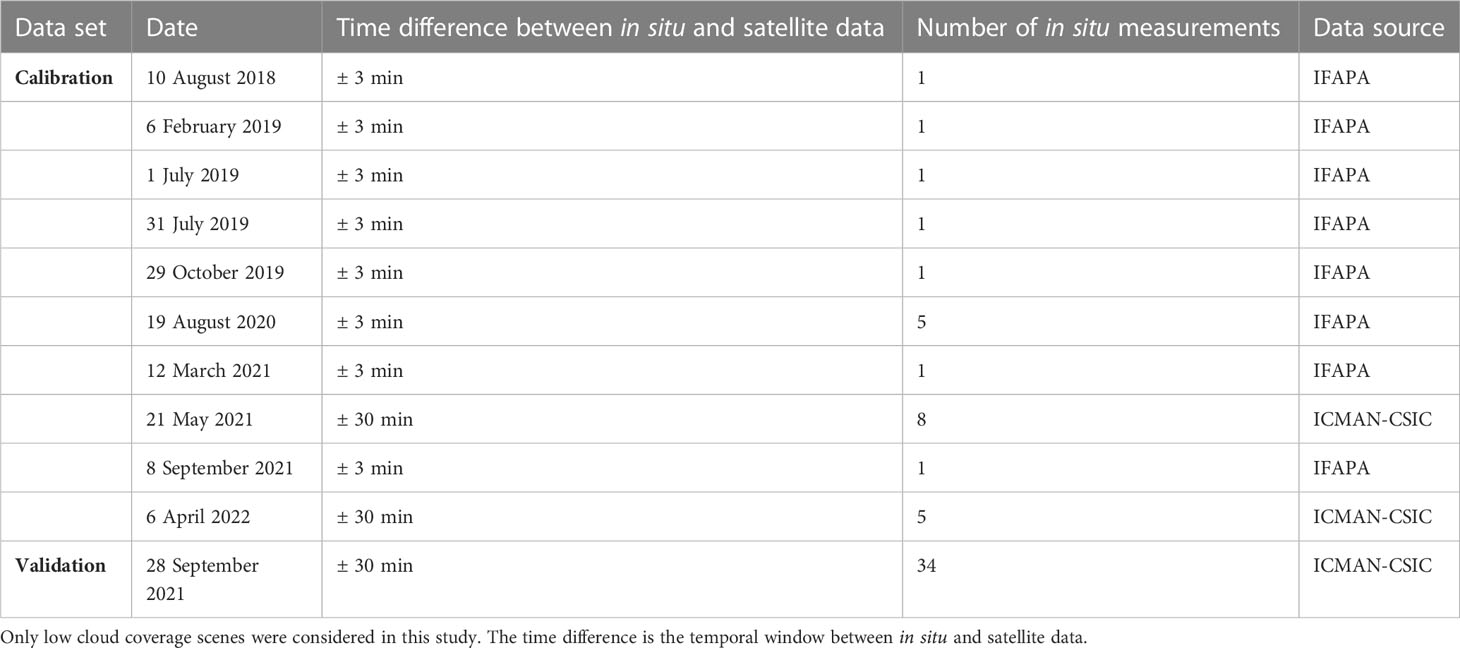
Table 1 List of synchronized Sentinel-2 images with in situ sampling dates.
2.2.2 Sentinel-2 data
In this study, the Sentinel-2 images from tile 29SQA (Sentinel-2 mission gridding system) were used. These images corresponded to Level-1C (L1C) products at the top of the atmosphere (TOA). Sentinel-2 datasets with a creation date of less than 180 days were retrieved from the Sentinel’s Scientific Data Hub (https://scihub.copernicus.eu), whereas datasets older than 180 days were obtained from one of the Copernicus Data and Information Access Services i.e., ONDA DIAS (https://www.onda-dias.eu). Even though Sentinel-2 has a high temporal and spatial resolution, one of the main constraints of this dataset is the presence of clouds and cloud shadows. Besides, during spring and summer, much of the Sentinel-2 archive over the Guadalquivir estuary is affected by sun glint (Caballero et al., 2018b). Hence, only clear-sky L1C images with no or few sun glint effects were selected and downloaded for the period of interest (2017-2022) (Table 1).
2.3 Atmospheric correction of Sentinel-2 imagery
As the high-resolution Sentinel-2 satellite was designed for land applications and characterized by a low signal-to-noise ratio (SNR), atmospheric correction (AC) is a crucial step when using this data for aquatic applications (Vanhellemont and Ruddick, 2016). AC aims to separate TOA reflectance observed by the satellite sensor into the signal from the atmosphere and the signal from the surface (bottom of atmosphere, BOA) (Vanhellemont and Ruddick, 2018). In this study, Sentinel-2 L1C images were processed to Level-2A (L2A) data by using the ACOLITE (v2022.02.22) AC processor developed by the Royal Belgian Institute of Natural Sciences (RBINS). By default, ACOLITE performs AC using the ‘dark spectrum fitting (DSF)’ algorithm which is used for aerosol correction with an assumption of the existence of ‘black’ water pixels in the NIR and short-wave infrared (SWIR) bands and the spatial homogeneity of aerosols (Vanhellemont, 2019). The DSF computes the lowest atmospheric path reflectance (ρpath) based on multiple dark targets in the scene with no a priori-defined dark band (the optimal band is selected during the AC processing) (Vanhellemont and Ruddick, 2018; Vanhellemont, 2019). However, the DSF avoids severe glint by dynamically choosing the bands used to derive ρpath. As a result, the glint effects can still be found in the DSF-derived surface reflectance (ρs) which is crucial for nadir-viewing sensors like Sentinel-2 (Vanhellemont and Ruddick, 2018). To overcome this, an optional sun glint correction algorithm based on SWIR bands has been included within the ACOLITE processor with an assumption of the absence of signal in the SWIR bands from below the water surface (Vanhellemont and Ruddick, 2018).
During spring and summer, sun glint is a common problem in most of the Sentinel-2 images over the study area (Caballero et al., 2018b). Hence, both the DSF approach with and without the optional sun glint correction algorithm were evaluated and presented in Figure S1 in the Supplementary Materials. As the ACOLITE processor is image-based, no in situ radiometric measurements were required. We inspected the water-leaving reflectance (ρw) from three places in the Guadalquivir estuary (see location for the green, orange, and blue dots in Figure S1 upper panel), extracted from the mean values of 5×5 pixels after DSF with and without sun glint correction. It was found that ACOLITE atmospheric correction played a significant role by removing the atmospheric effects, especially atmospheric aerosol scattering, thus improving the clarity of the images (Figure S1 upper panel). Besides, the retrieval of the water leaving radiance improved when the sun glint correction was coupled with the DSF algorithm (Figure S1 lower panel). Based on this evaluation, the DSF along with the sun glint correction algorithm was applied for the selected Sentinel-2 images (Table 1). The outputs of the ACOLITE atmospheric correction were the Rrs at BOA in all the visible, red-edge, and NIR bands with multiple other parameters. The outputs were resampled to a 10 m pixel size, in which the values from the 20 m and 60 m bands were replicated 4 and 36 times, respectively, to form 10 m grids (see Figure 3 for detailed information on the schematic workflow).
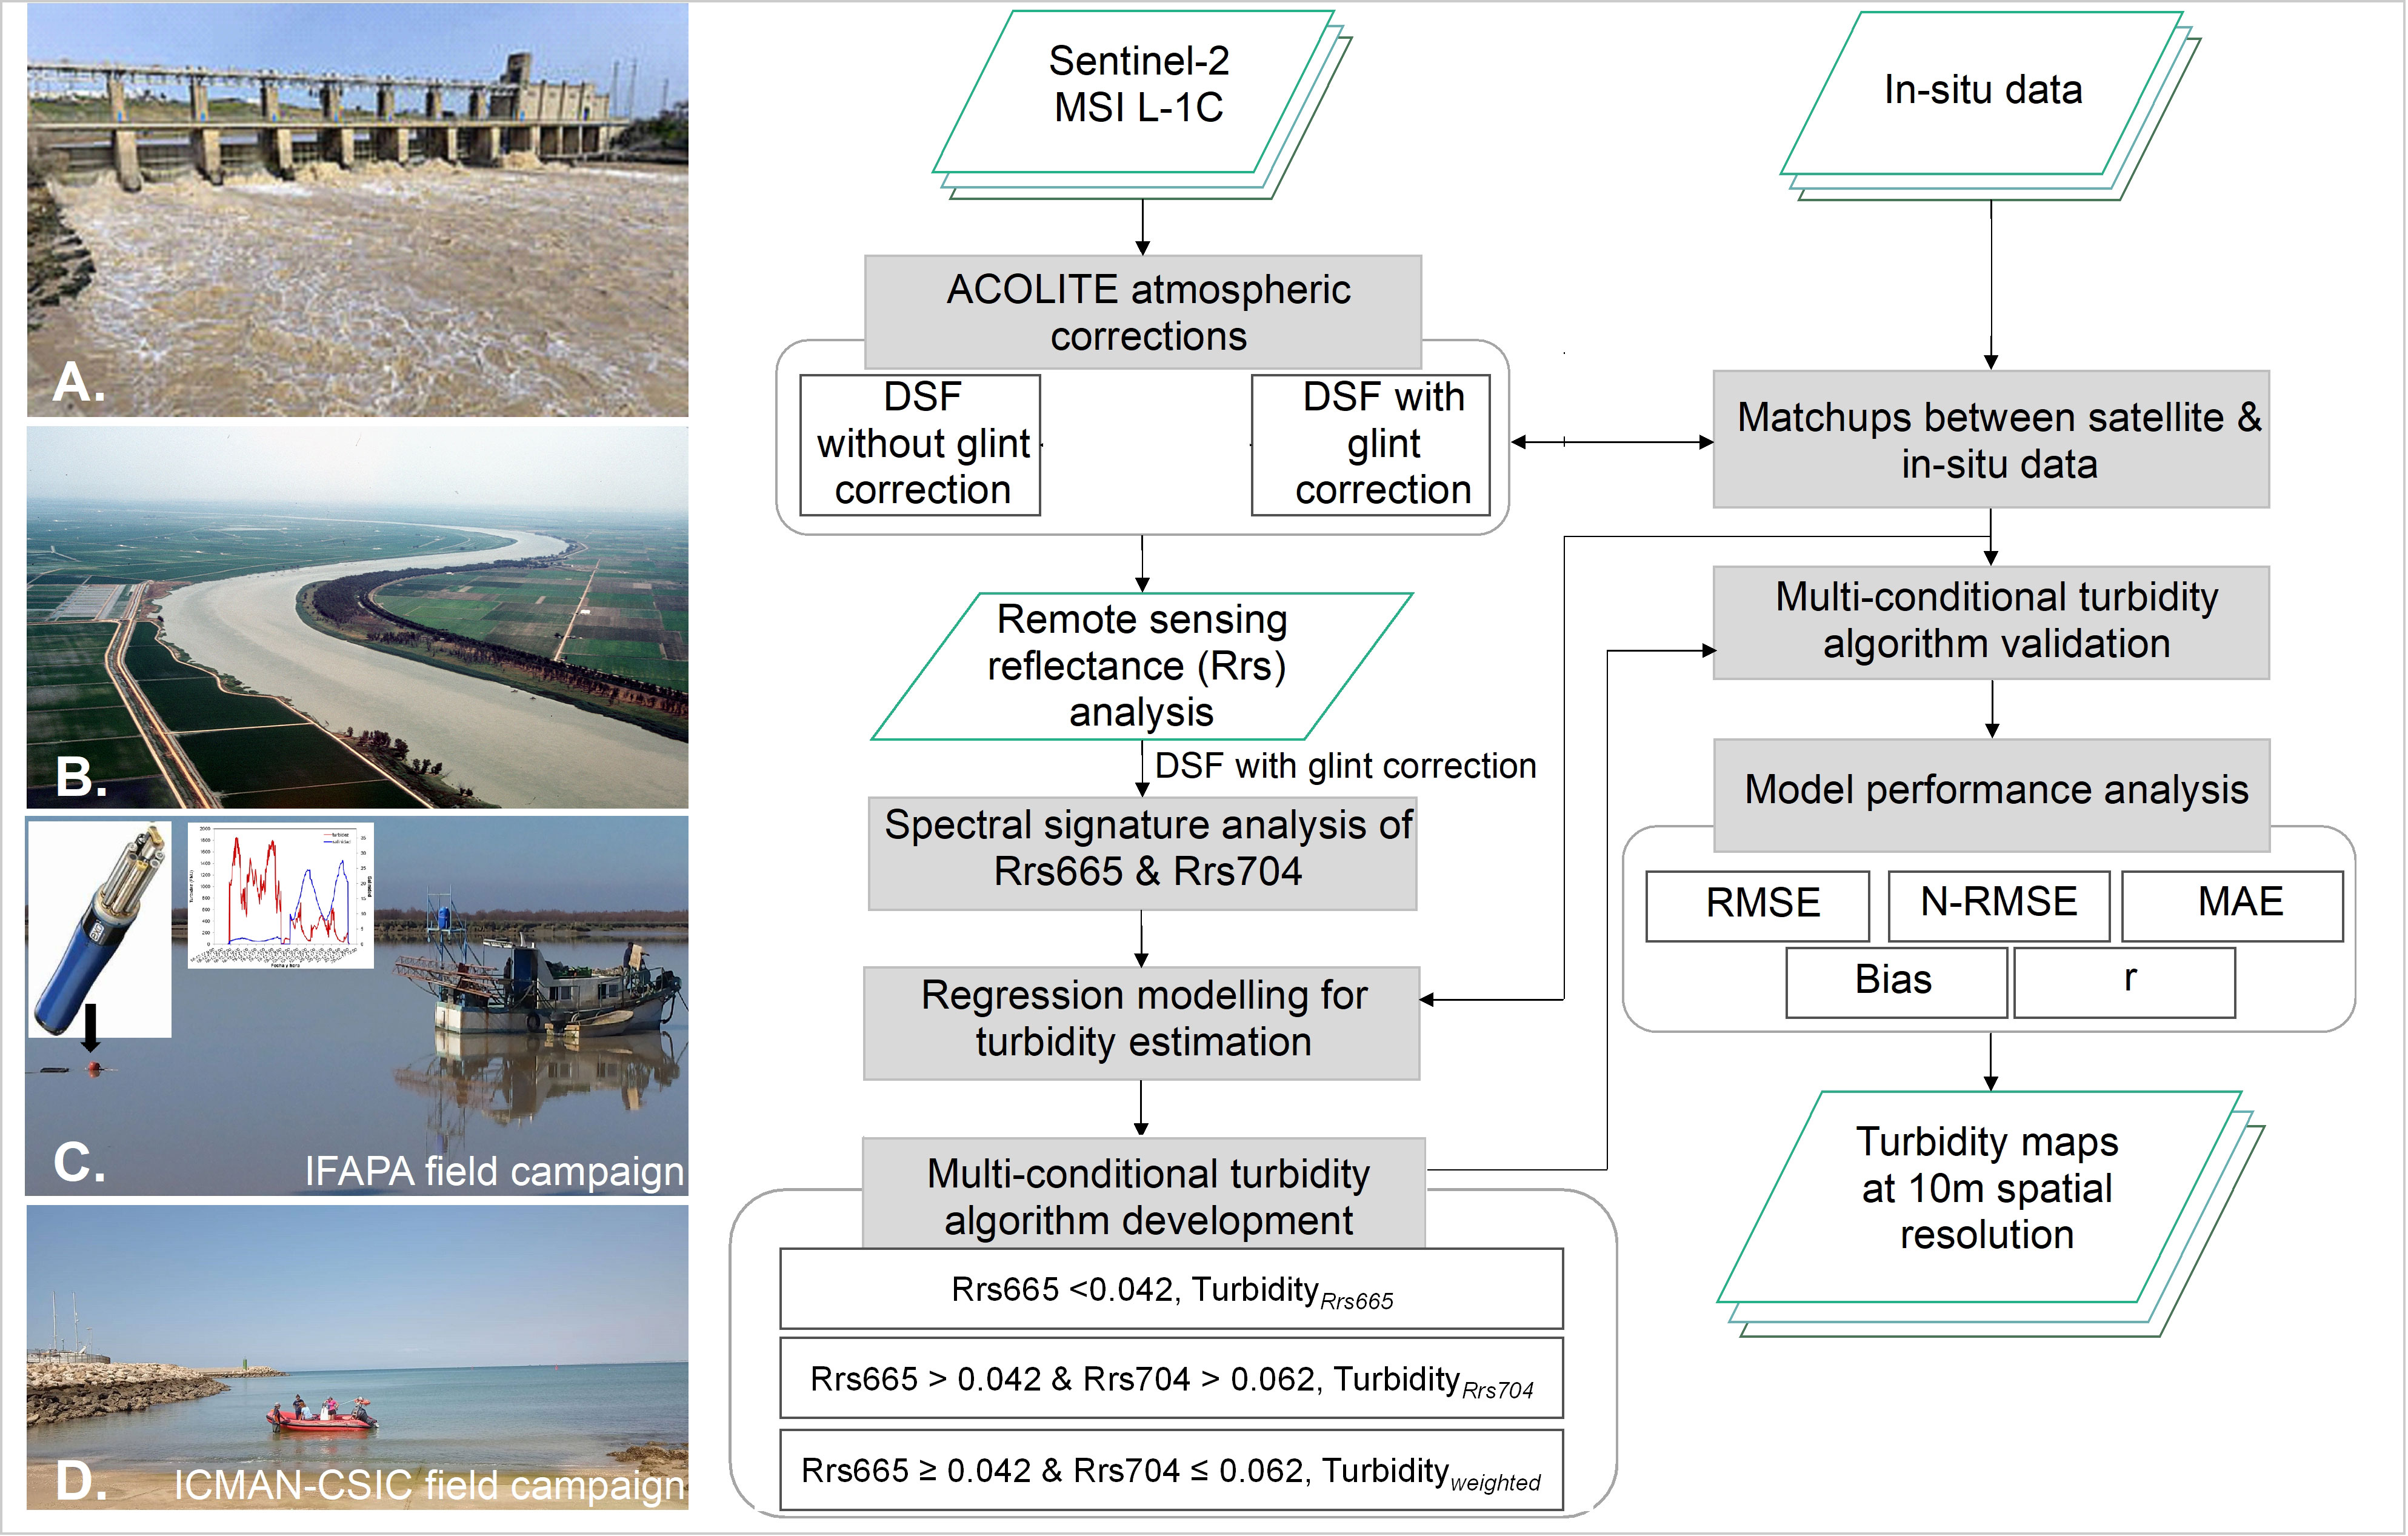
Figure 3 Left panel: Alcala del Rio dam (A), Guadalquivir estuary (B), field campaigns by IFAPA (C) and ICMAN-CSIC (D); Right panel: schematic workflow of the turbidity retrieval approach using Sentinel-2 MSI. L-1C is level-1C data, DSF is dark spectrum fitting algorithm, RMSE is root mean squared error, N-RMSE is normalized RMSE, MAE is mean absolute error and r is Pearson correlation coefficient.
2.4 Multi-conditional turbidity algorithm
Motivated by Figure 2 in Section 1, a detailed inspection of the Rrs containing the spectral information of the water masses for the Sentinel-2 bands was performed during two turbid episodes on 18 November and 18 December 2017 in the Guadalquivir estuary (see Figure S2 in the Supplementary Materials). It was evident that during a turbid episode of < 300 FNU (corresponding TSM: < 350 mg/l) on 18 November 2017, the typical turbidity band at the red channel (Rrs665) performed better by providing more signal compared to the red-edge channel (Rrs704). However, while turbidity was > 400 FNU (corresponding TSM: > 480 mg/l) on the 18 December 2017, Rrs665 saturated (Rrs665 > 0.058) and Rrs704 provided increasing values with increasing turbidity. This indicated the joint-capability of both bands to estimate a wide range of turbidity in the Guadalquivir estuary: while Rrs665 performed better at low to medium turbidity, Rrs704 performed better at high to extremely high turbidity. Similar behavior was found by Caballero et al. (2018b) and Ouillon et al. (2008) but for TSM. Therefore, based on these findings, the red and red-edge bands at 665 and 704 nm, respectively, were selected for the multi-conditional turbidity model development. The pin-pixel reflectances corresponding to the in situ sampling locations for each selected band were extracted from the mean values of 3×3 pixels and plotted against the in situ turbidity measurements. The multiple determination coefficient (R2) was calculated to identify the best-fitted curve for each band.
To overcome the saturation effects of Rrs665 for deriving more accurate and reliable turbidity maps, a switching model was defined between the Rrs665 and the Rrs704 derived turbidity models (hereinafter TurbidityRrs665 and TurbidityRrs704, respectively). This was implemented following the approach mentioned in Caballero and Stumpf (2020). The Rrs665 and Rrs704 switching values were chosen based on the saturation of the most sensitive bands through band comparison. The switch between the models used the following conditions:
The Turbidityweighted model was determined by a simple linear weighing calculation to account for a smooth transition:
Where α and β are determined by:
After model adjustment, the multi-conditional algorithm was applied to the atmospherically corrected scene from 28 September 2021. Therefore, the satellite-derived turbidity values were retrieved for the in situ sampling locations. These data were plotted against the in situ turbidity measurements to assess the model performance. Several statistical indicators between the measured and satellite-derived turbidity data, including root mean squared error (RMSE), normalized RMSE (N-RMSE), mean absolute error (MAE), bias, and Pearson correlation coefficient (r) were calculated.
3 Results
3.1 Multi-conditional algorithm
The scatter plots of in situ turbidity measurements (ranging from 26 - 600 FNU) against Rrs665 and Rrs704 are presented in Figure 4. The peak turbidity level (600 FNU) was recorded on 6 February 2019 at Bonanza station (single point measurement) during a high turbid (600 FNU) episode. For the rest of the sampling dates that were synchronized with the satellite overpass, turbidity mostly ranged between 26 to 300 FNU. It was evident that the SNR of the Rrs665 was high at turbidity levels < 85 FNU whereas the SNR of Rrs704 was high at turbidity levels > 250 FNU. In between 85 to 250 FNU, the SNR of Rrs665 and Rrs704 fluctuated but provided similar values.
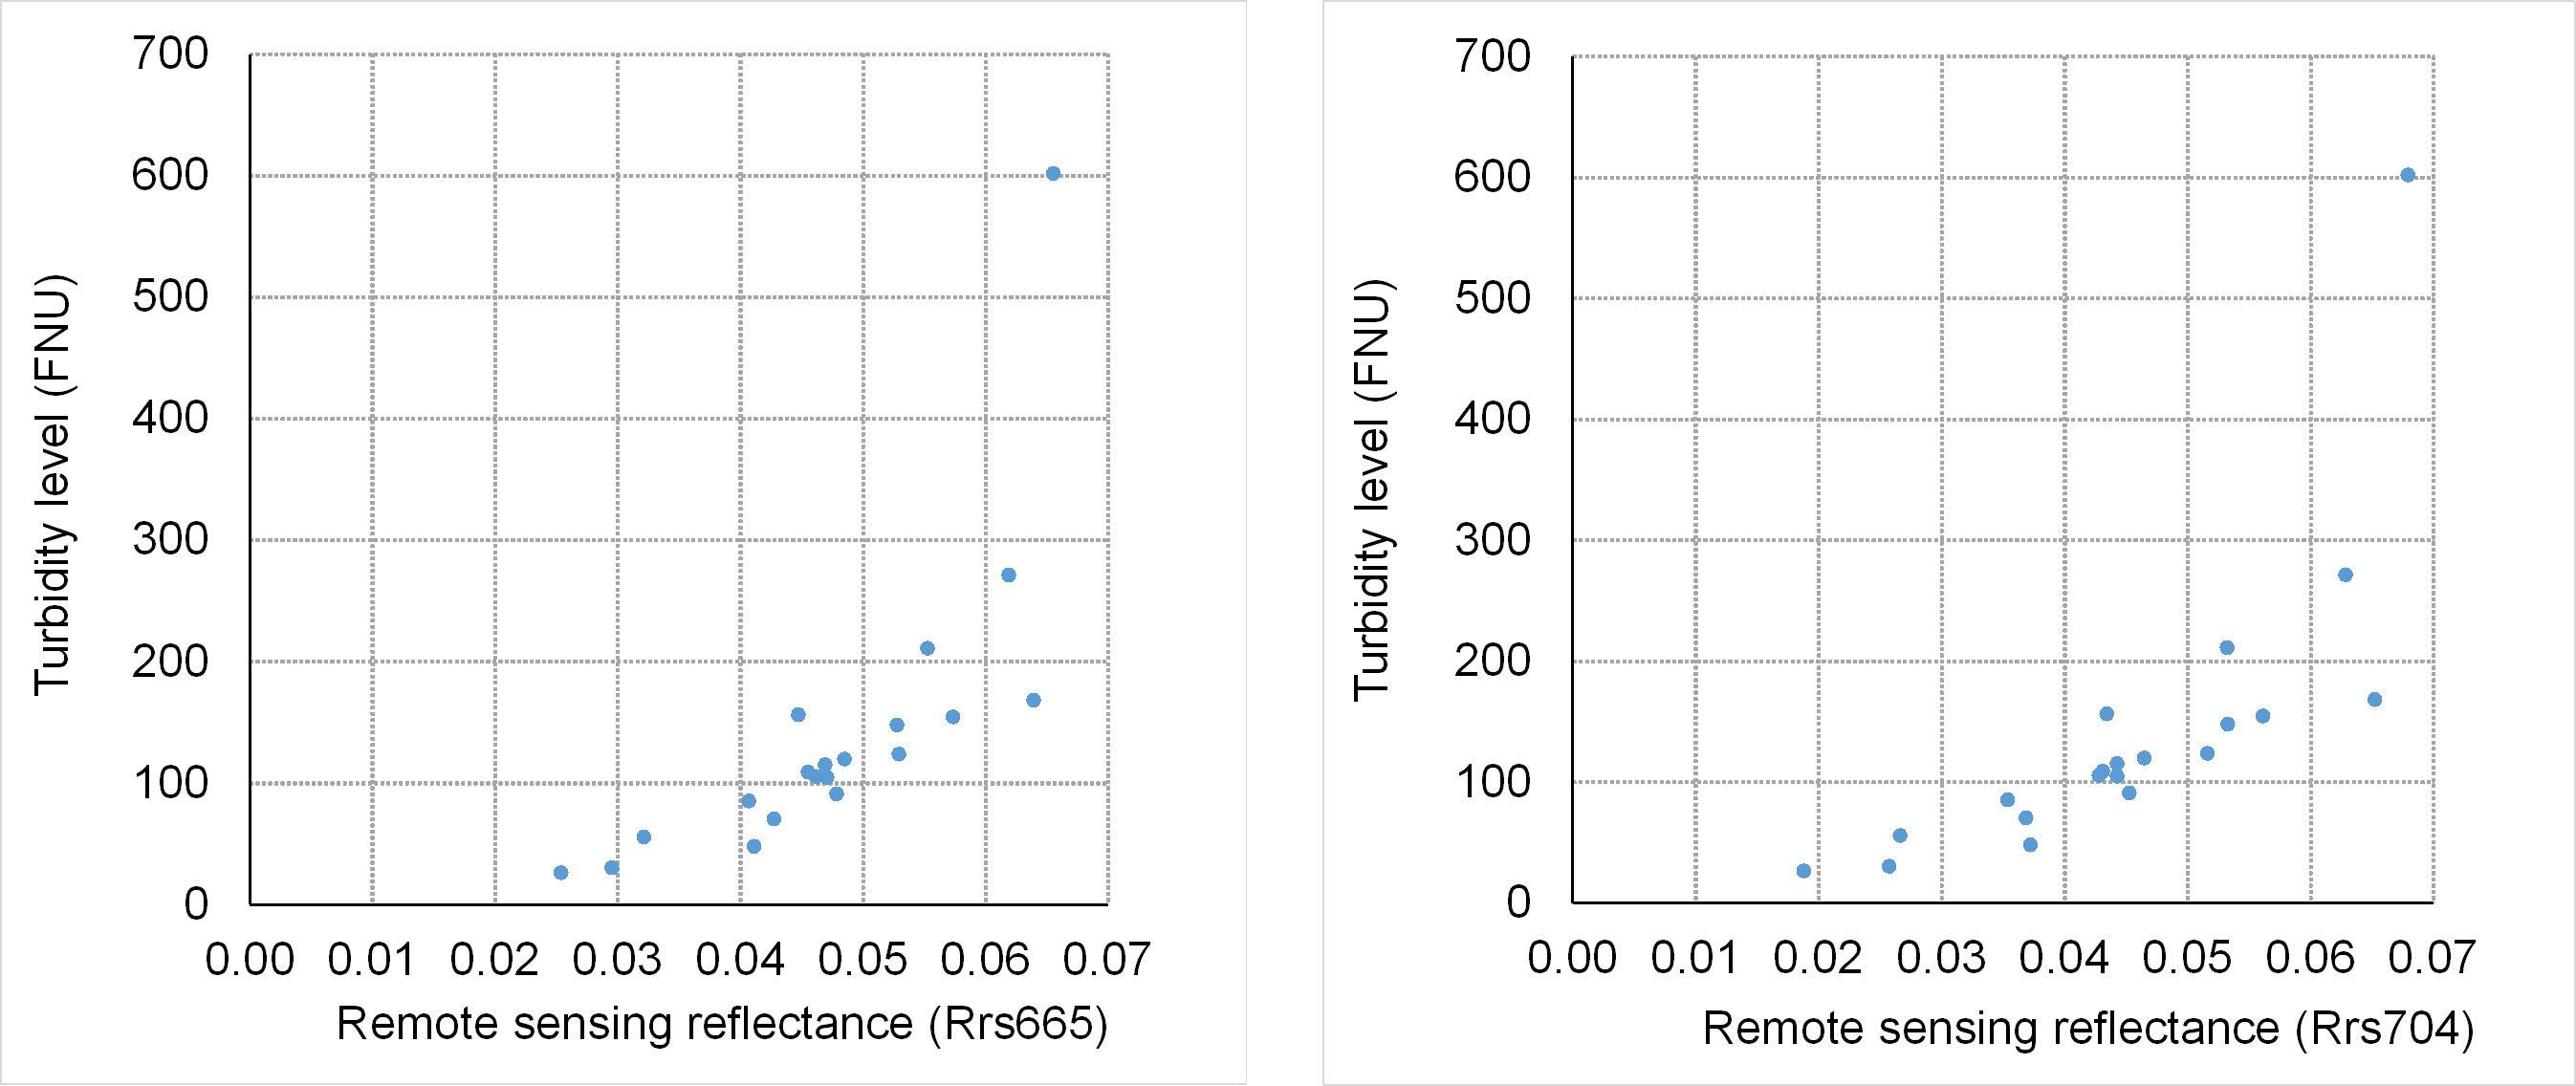
Figure 4 Scatter plot of in situ turbidity levels (FNU) and remote sensing reflectance (Rrs) of Sentinel-2 satellite bands: Rrs665 (left) and Rrs704 (right). In situ data are as in Table 1. See Figure 1 for the locations of in situ data.
A summary of the tested regression models with their R2 values is given in Table 2 for Rrs665 and Rrs704. For both bands, the exponential regression model displayed the best-fit curve with R2 of up to 0.84 and 0.85 for Rrs665 and Rrs704, respectively. Therefore, these models were used to define the multi-conditional model using the band-switching criterion mentioned in section 2.4.
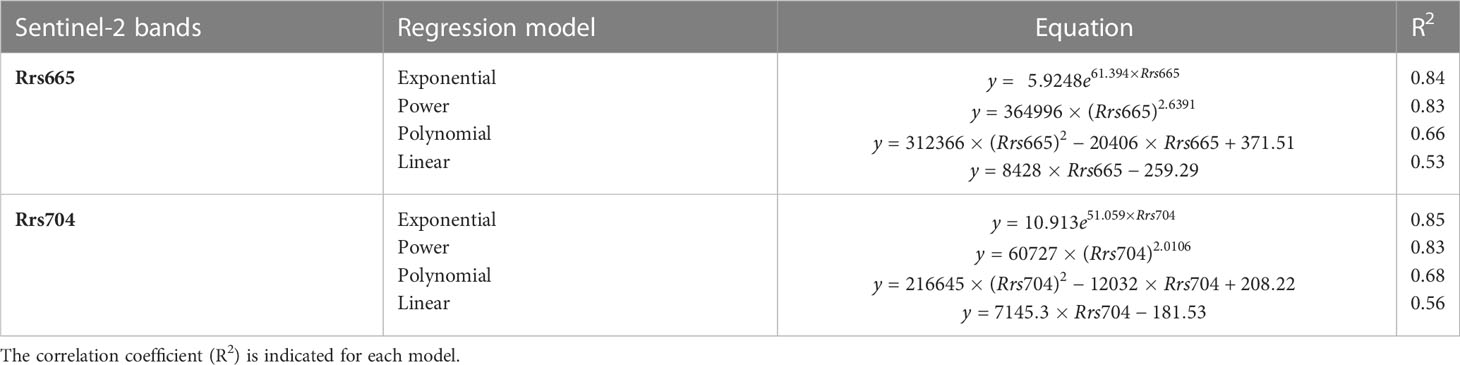
Table 2 Regression models tested for turbidity estimation in the Guadalquivir estuary using Rrs665 and Rrs704. Sample size n = 25.
The scatter plot between in situ turbidity and satellite-derived turbidity using the Turbiditymulti-conditional algorithm (described in section 2.4) on 28 September 2021 is presented in Figure 5, whereas the summary of the performance of all the turbidity models, i.e., Turbiditymulti-conditional, TurbidityRrs665, TurbidityRrs704, and Turbidityweighted, is presented in Table 3. Results showed that the TurbidityRrs665 model had the lowest RMSE, NRMSE, and bias compared to the Turbiditymulti-conditional, and TurbidityRrs704models. This was because of the low to moderate turbidity levels (ranging between 12 to 130 FNU) during the sampling period. The influence of the turbidity levels was also evident in the multi-conditional algorithm that selects the most suitable turbidity models among TurbidityRrs665, TurbidityRrs704, and Turbidityweighted depending on the Rrs thresholds at different turbidity levels. It was evident that at turbidity levels < 85 FNU, the multi-conditional algorithm used the TurbidityRrs665 model to retrieve turbidity (Table S1 in the Supplementary Materials). However, it switched to the Turbidityweighted model (the smoothing bounds between TurbidityRrs665and TurbidityRrs704 to avoid saturation of the Rrs665 as well as sharp inclination between the two models) at turbidity levels > 85 FNU, hence ensuring smaller MAE with enhanced r-value.
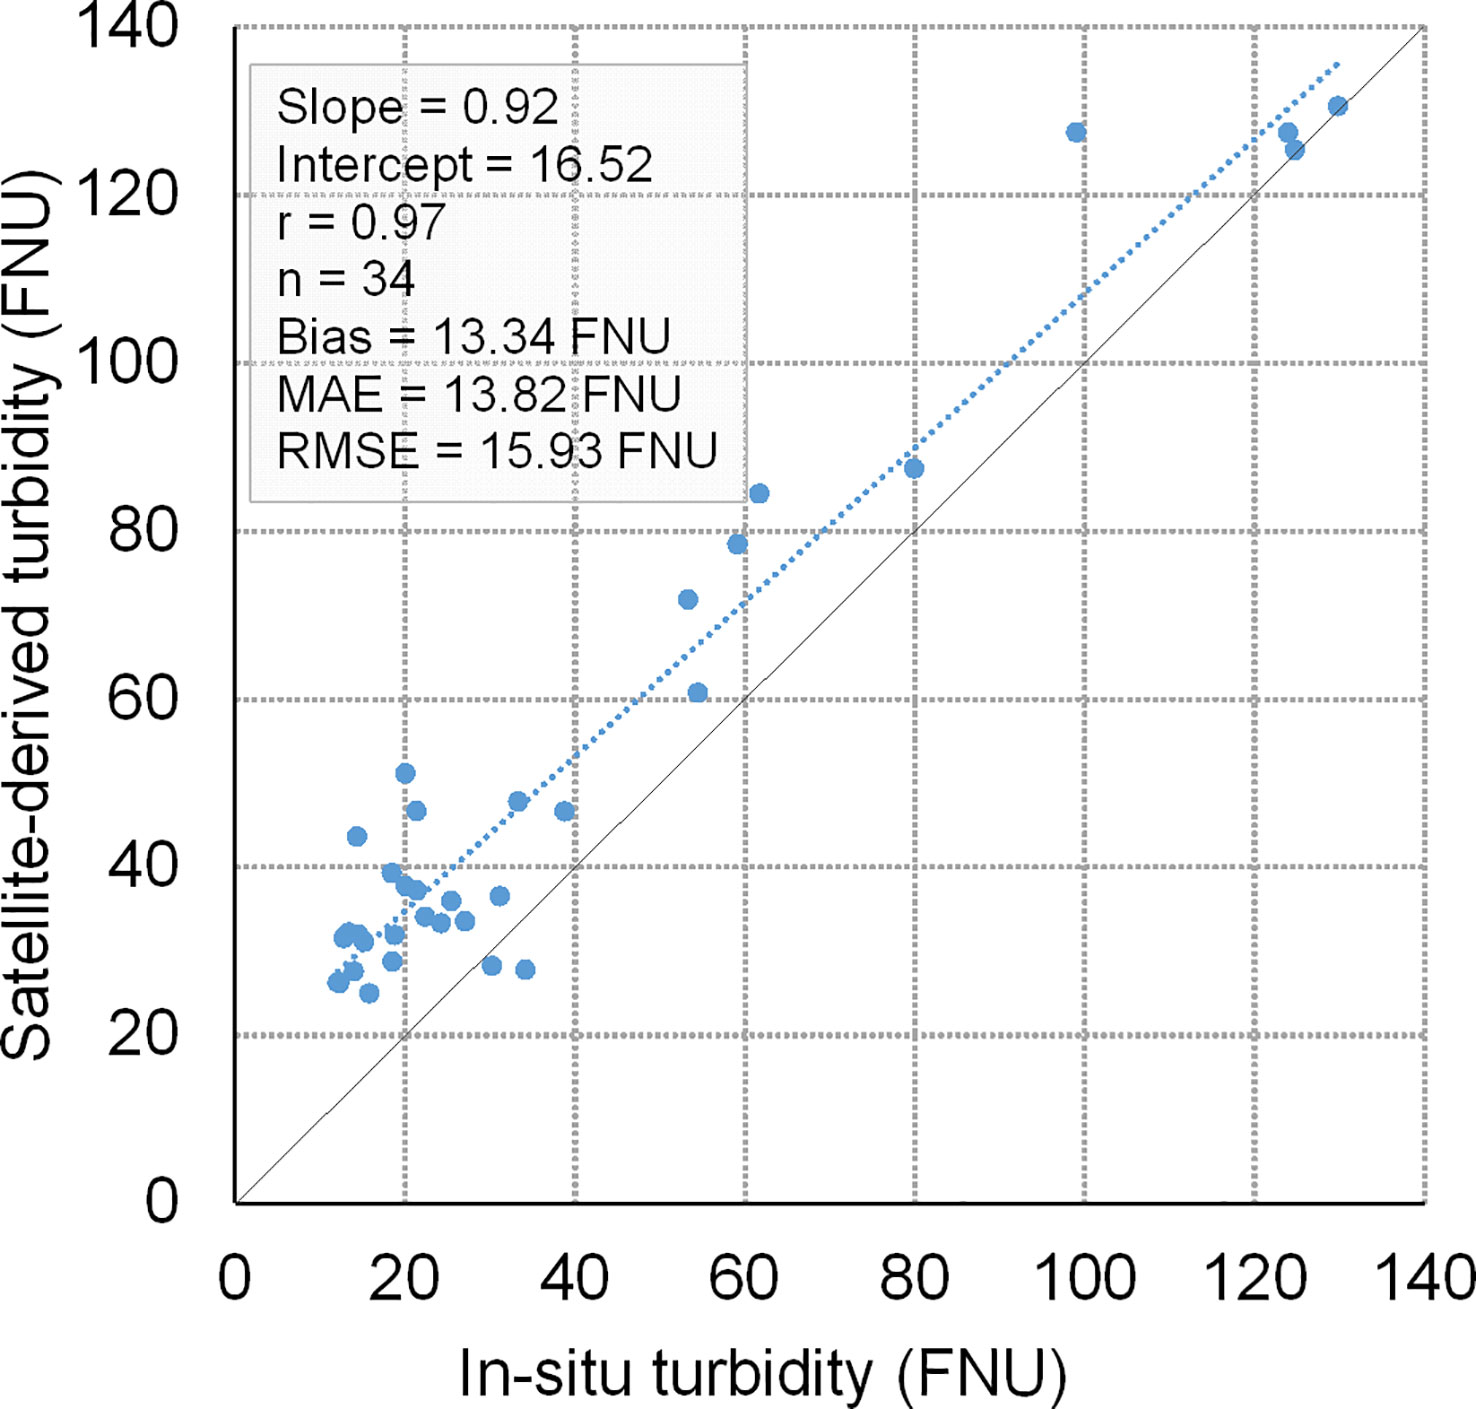
Figure 5 Scatter plot showing the comparison between in situ turbidity and satellite-derived turbidity levels (FNU) using the Turbiditymulti-conditional algorithm during the field campaign of 28 September 2021 by ICMAN-CSIC in the Guadalquivir estuary. The black line is the 1:1 fitted line.
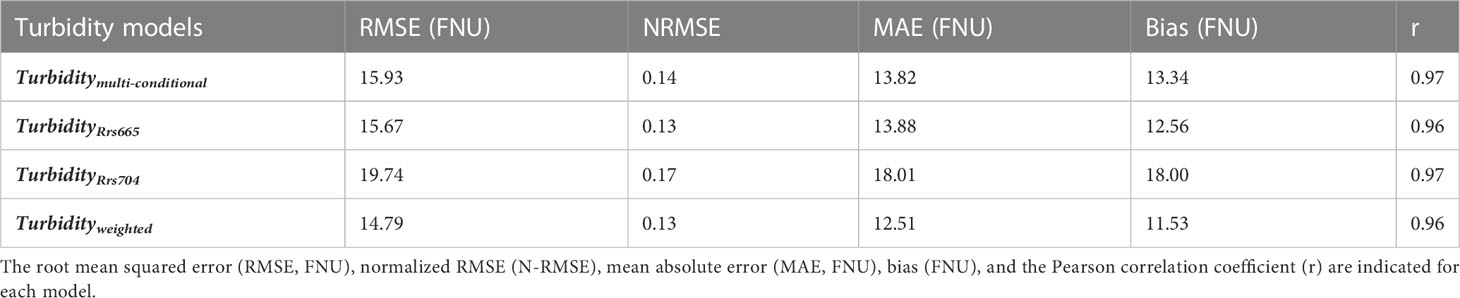
Table 3 Models for turbidity estimation in the Guadalquivir estuary.
3.2 Application of the turbidity multi-conditional algorithm
An example application of the multi-conditional turbidity model with switching and smoothing criteria is presented in Figure 6. Figure 6A shows the final turbidity map on 12 March 2021 derived by the Turbiditymulti-conditional algorithm. In contrast, Figures 6B-D present turbidity derived by TurbidityRrs665, Turbidityweighted, and TurbidityRrs704 models, respectively, indicating the contribution of each model to estimating different ranges of turbidity. Model switching of the multi-conditional algorithm is observed in the figure: a lower level of turbidity (< 85 FNU) mostly at the river mouth and the relatively clear offshore region was derived by TurbidityRrs665 model, turbidity ranged from 85 to 250 FNU within the meanders in Bonanza (downstream) and the right-hand-side shoreline - more upstream in Tarfia was derived by Turbidityweighted model, and finally, higher turbidity values (> 250 FNU) mostly in upstream were derived by TurbidityRrs704 model.
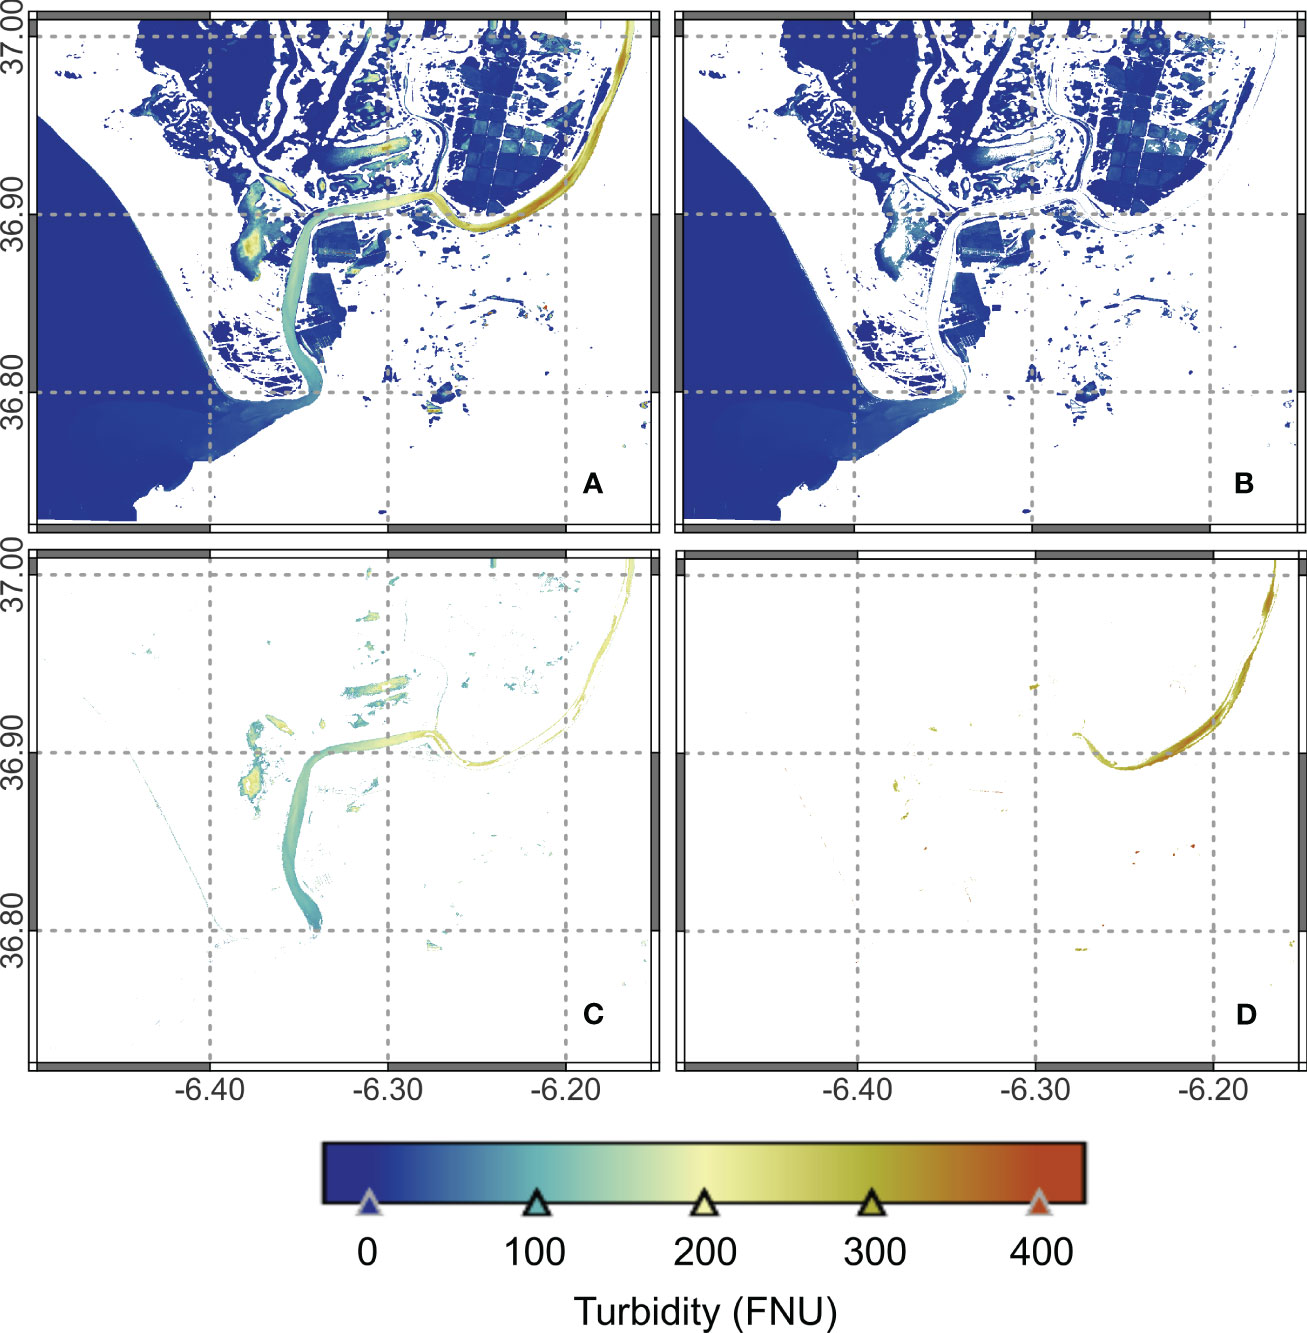
Figure 6 Turbidity (FNU) derived from the multi-conditional algorithm for the atmospherically corrected Sentinel-2A scene on 12 March 2021. Maps correspond to the performance of the Turbiditymulti-conditional algorithm (A), indicating its switching capabilities among different turbidity models, i.e., TurbidityRrs665 (B), Turbidityweighted (C), and TurbidityRrs704 (D) to estimate a wide range of turbidity levels in the Guadalquivir estuary.
Figure 7 shows another example of turbidity mapping derived from the Turbiditymulti-conditional algorithm during three turbidity episodes: high, medium, and low on 6 February 2019, 8 September 2021, and 28 September 2021, respectively. These images were selected based on no sun glint issues and minimal cloud coverage. It was evident that the model was capable of estimating turbidity levels at a wide range of scales from 0 to 600 FNU. The spatial distribution of the turbidity level along a longitudinal transect (42 km) within the estuarine channel is illustrated for these dates (Figure 8). Overall, turbidity increased longitudinally from offshore to upstream along the transect, although it exhibited different spatial fluctuations. These findings agreed with the in situ observations carried out in the estuary on the respective dates.
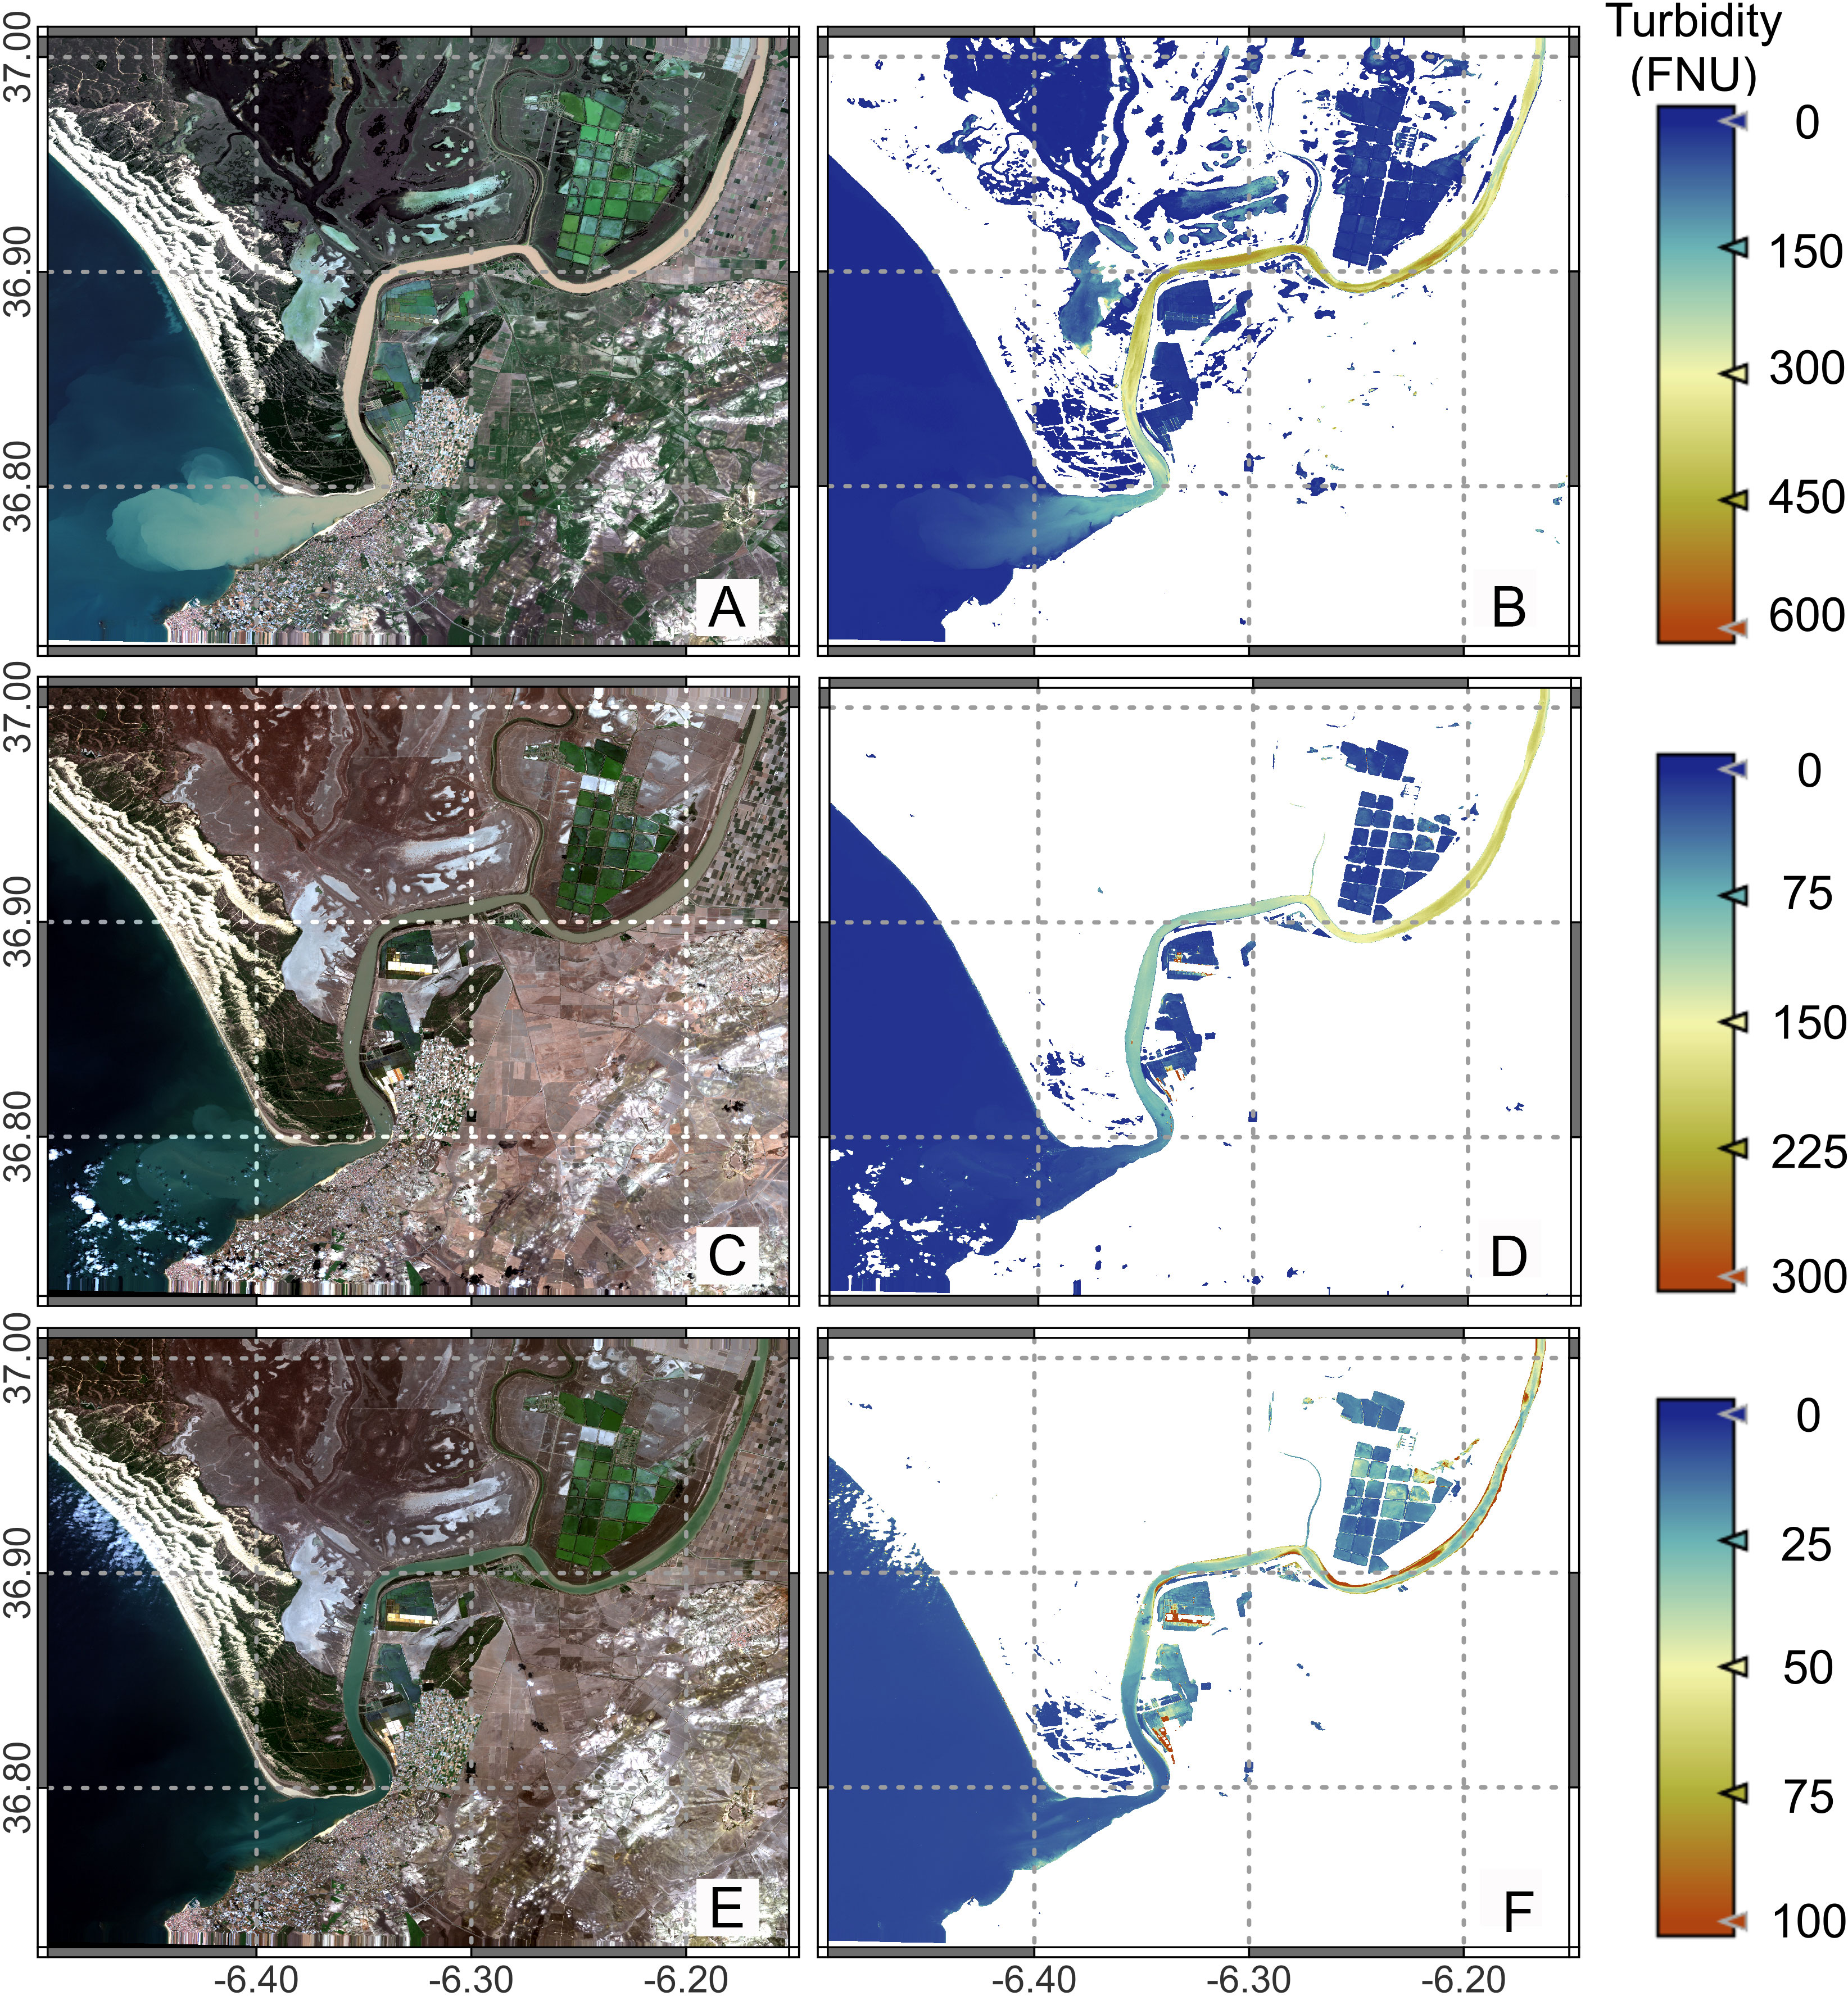
Figure 7 Turbidity (FNU) derived from the multi-conditional algorithm for atmospherically corrected Sentinel-2B scene in the Guadalquivir estuary on 6 February 2019 (A, B), and Sentinel-2A scenes on 8 September 2021 (C, D), and 28 September 2021 (E, F) during high, moderate, and low turbid episodes, respectively. Note the different ranges in the colour bar (turbidity level).
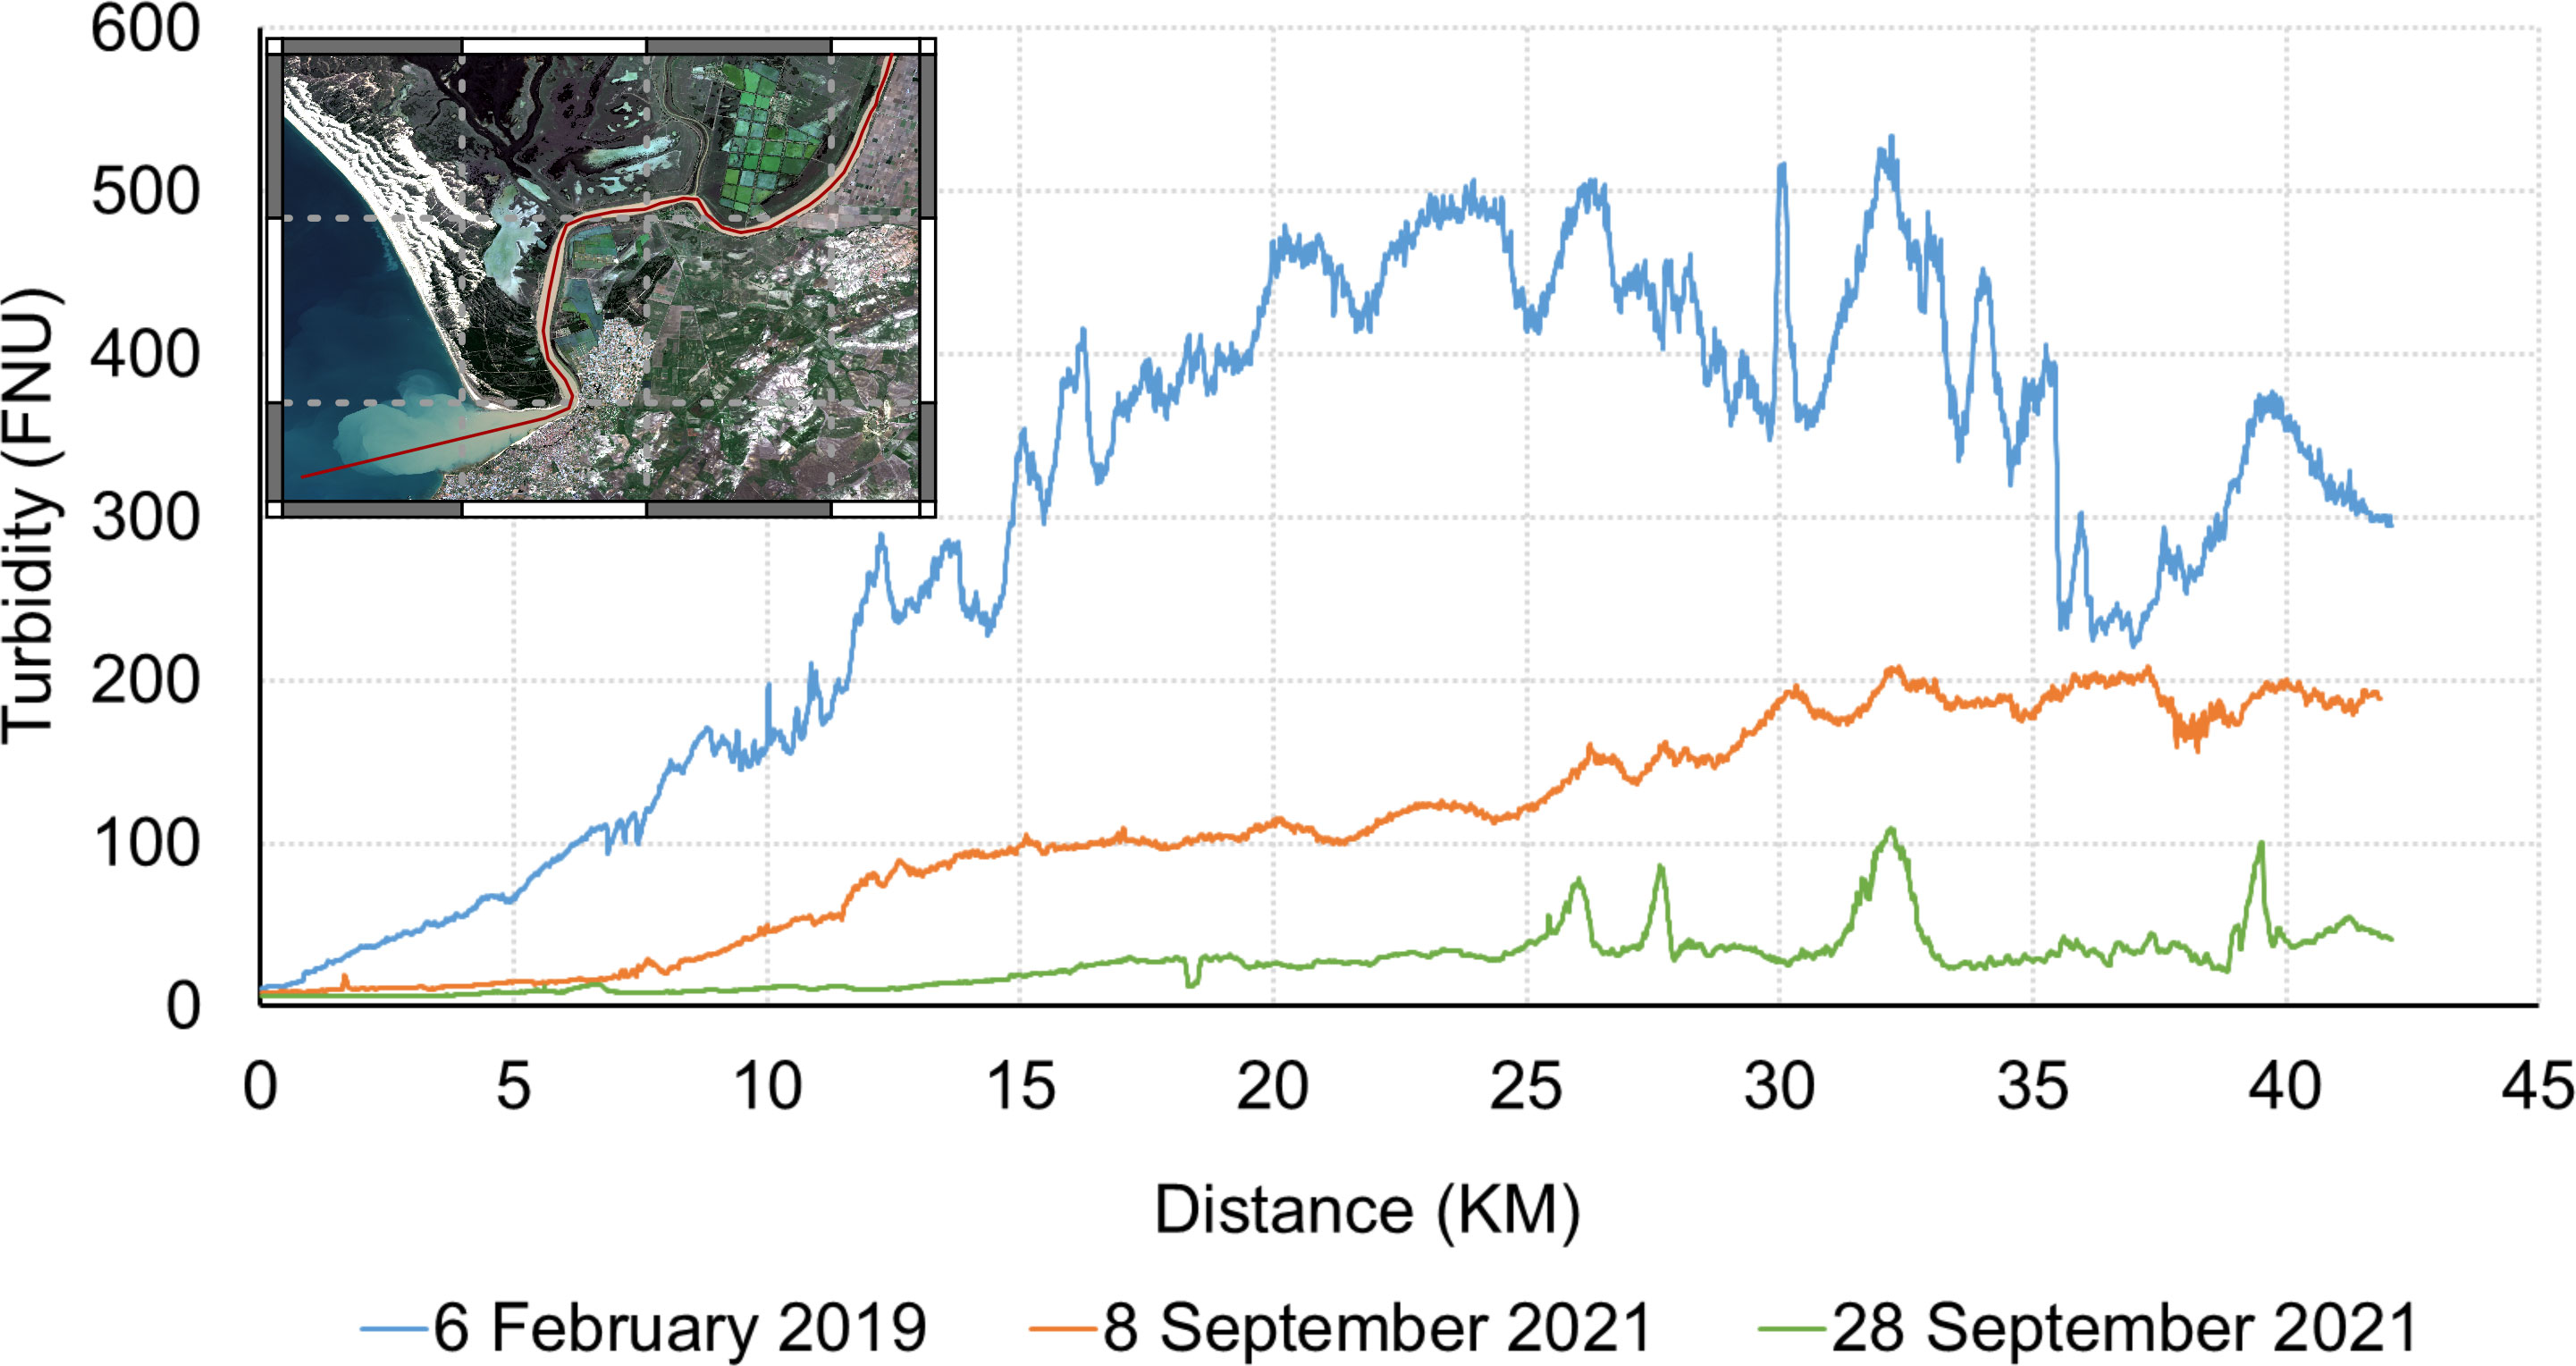
Figure 8 Satellite-derived turbidity (FNU) levels in the longitudinal transect of the first 42 km of the Guadalquivir estuary on 6 February 2019, 8 September 2021, and 28 September 2021 during high, moderate, and low turbid episodes, respectively.
4 Discussion
This study demonstrates the promising capability of the Sentinel-2A/B red and red-edge bands to accurately estimate and map water turbidity, thus providing a valuable tool for monitoring turbidity in highly variable estuaries. Generally, water turbidity increases the reflectance in the visible and NIR portion of the spectrum. With increasing turbidity, Rrs increases initially in the green wavelength (between 500 and 600 nm), then at the higher wavelength from the red portion (between 600 and 700 nm), to the NIR region (around 800 nm) (Forget and Ouillon, 1998; Doxaran et al., 2003; Moore et al., 1999; Ouillon et al., 2008). However, in our case, Rrs665 was found preferably sensible for low turbid waters < 85 FNU whereas Rrs704 was found more sensitive for the highest turbidity encountered > 250 FNU (Figure 2). The switching method between these two channels allowed a smooth transition from the low turbid waters to the moderate and high turbid waters within the estuary (Figure 6), consequently avoiding the saturation issues observed in Figure S2. Therefore, this study illustrates the importance of applying a multi-conditional algorithm rather than a simple model in the red or/and red-edge part of the spectrum for a high/wide-scale turbid region, like the Guadalquivir estuary. Our proposed multi-conditional algorithm is capable of estimating turbidity ranging from 0-600 FNU with r = 0.97, bias = 13.34 FNU and RMSE = 15.93 FNU. This is an improved result compared to Dogliotti et al. (2015) turbidity model (r = 0.82, bias = -39.10 FNU and RMSE = 54.57 FNU) applied to this region. The deviation of our multi-conditional algorithm from the 1:1 fit in Figure 5 has several explanations. For example, it could be related to the AC processing or residuals, where overestimation can happen at the red and red-edge bands due to the presence of sun glint during spring and summer over the Guadalquivir estuary (Caballero et al., 2018b). Adjacency effects can also be a contributing factor to this deviation by modifying the water reflectance. However, the severity of this impact depends on the amount of signal originating from the air-water interface and/or adjacency (Vanhellmont, 2022).
When considering the available approaches to derive and map turbidity in coastal waters, it was found that the two-band algorithms based on either the blue and red ratio (i.e., 412/620, 443/670) or the green and red ratio (i.e., 510/681), as well as the three-band algorithms using the blue and red (412, 620, 681 nm) or green and red wavelengths (510, 620, 681 nm), are the most preferable choice for turbidity estimation (Ouillon et al., 2008). Even though these ratios are less sensitive to uncertainty in atmospheric correction (Bowers and Binding, 2006), they are likely more sensitive to the organic matter content of the water compared to the single-band algorithms at red or near-infrared wavelengths (Ouillon et al., 2008). In the Guadalquivir estuary, the most sensitive bands of Sentinel-2 for turbidity estimation were the red and red-edge bands at the wavelength of 665 and 704 nm, respectively, as shown in Figures 2 and S2. The green band at the wavelength of 560 nm (Rrs560) also provided significant signals at low turbidity; however, we did not consider it due to its sensitivity to the organic matter content, i.e., colored dissolved organic matter (CDOM) and phytoplankton, which are the other key water quality indicators in the Guadalquivir estuary (Navarro and Ruiz, 2006; González-Ortegón et al., 2018). Hence, our multi-conditional algorithm was developed using a single-band approach with the switching and smoothing criteria between the two most sensitive turbidity bands, i.e., Rrs665 and Rrs704. Finally, it would be worth investigating the NIR band at the wavelength of 740 nm (Rrs740) during episodes of extremely high turbidity (~1000 FNU) and incorporating it within this multi-conditional algorithm, together with other switching and smoothing criteria to increase the algorithm’s applicability.
This study is an improvement of Caballero et al. (2018b), where a TSM model was developed based on the red (Rrs665) and NIR (Rrs865) bands of Sentinel-2A satellite for the Guadalquivir estuary. However, the implication of this TSM model may vary due to the variance of the reflectance-TSM relationship as a function of particle characteristics, i.e., grain size, density, composition, and refraction (Woźniak and Stramski, 2004; Binding et al., 2005). In this sense, turbidity has advantages over TSM for being an optical property of water. Besides, Ouillon et al. (2004) showed that turbidity and TSM are closely related when TSM is mainly composed of fine particles like silt and clays. In the Guadalquivir estuary, abundant fine-grained mud is present upstream, and sand, silt, and clay mineral fractions are found in the rest of the estuary. The correlation between in situ TSM and turbidity (Figure 9) in this region showed an adjusted R2 value of 0.82 with an intercept of 34.9, a slope of 0.756, and a p-value of 2.78e-81. This implies that the turbidity multi-conditional algorithm developed in this study can also be used as a proxy for TSM measurements due to its close relationship with the backscatter properties of TSM, thus providing information for the study of sediment transport and mineralogy in the Guadalquivir estuary. Furthermore, this multi-conditional algorithm can be used to implement a near-real-time monitoring system of the spatial and temporal variability and thus, assess the ecological status of the Guadalquivir estuary, which could help decision makers when managing the Alcala del Rio dam.
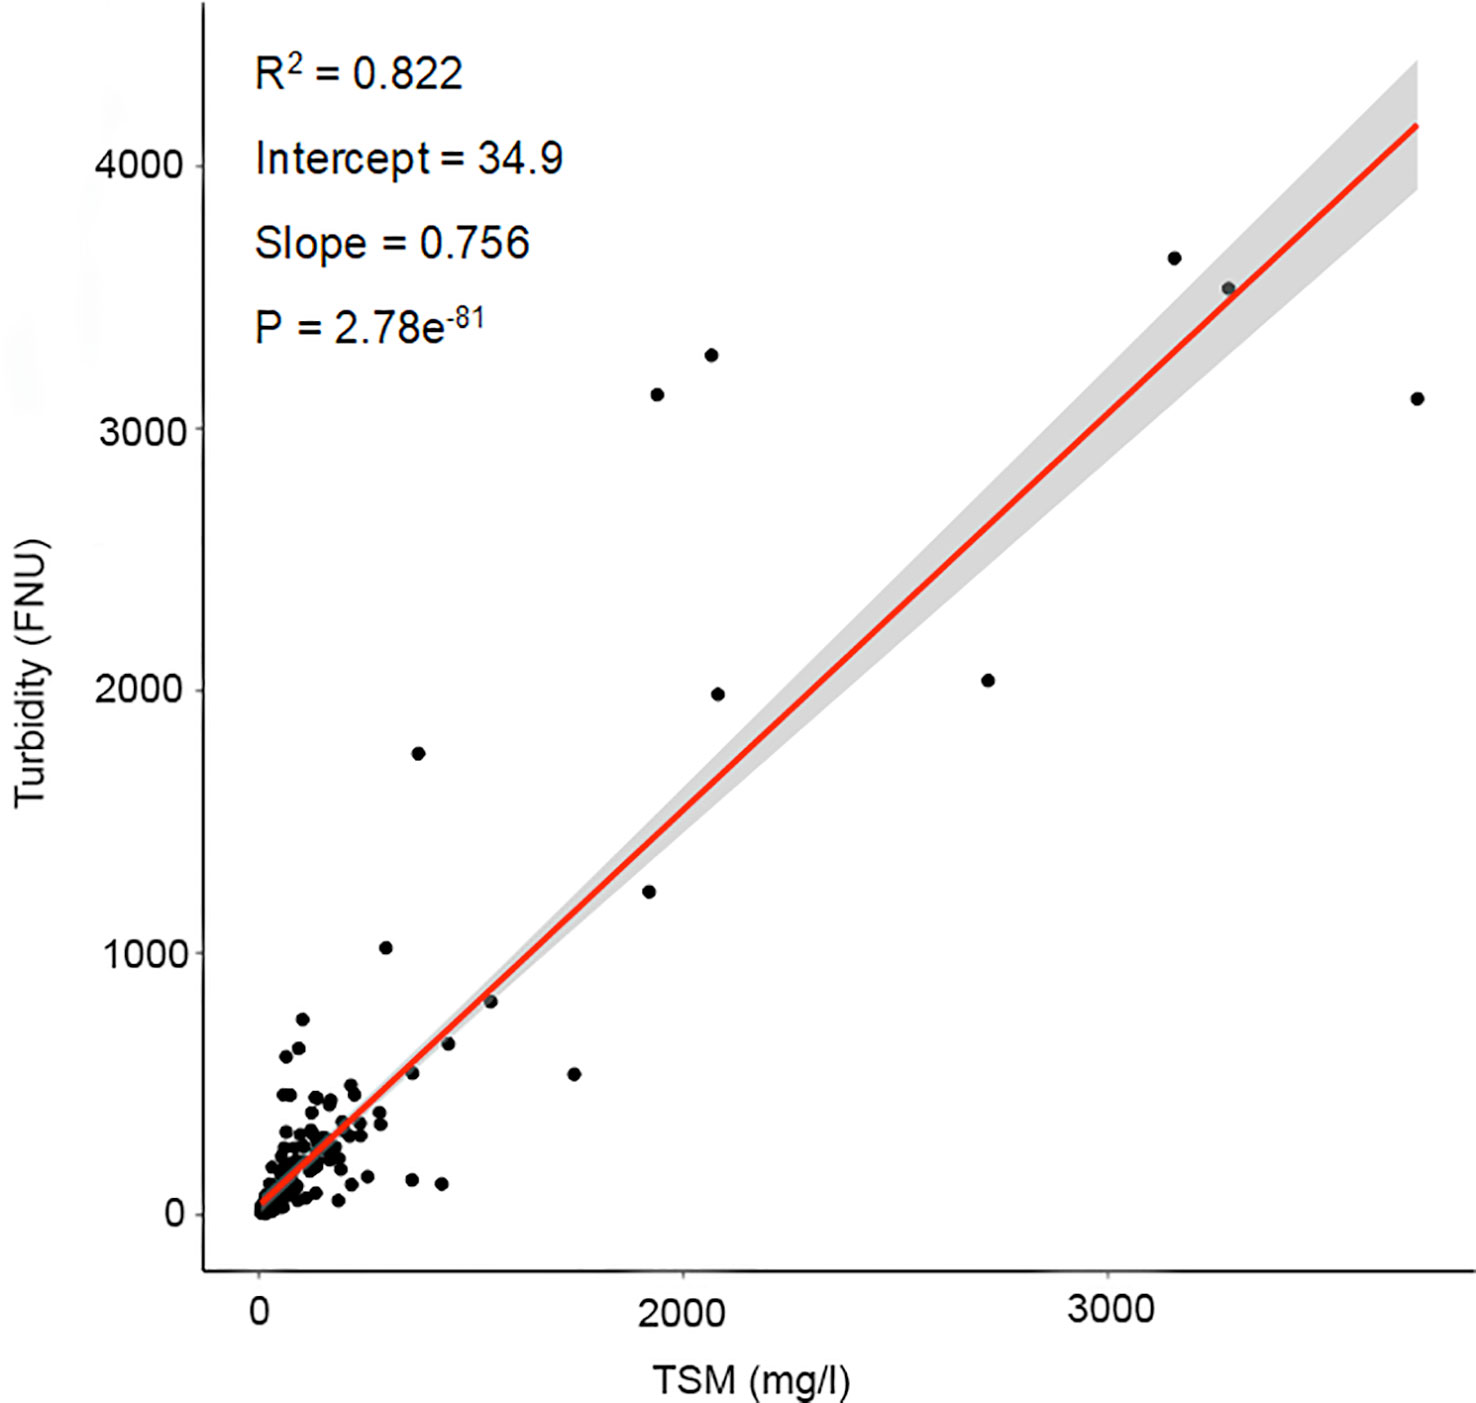
Figure 9 Correlation between TSM (mg/l) and turbidity (FNU).
It should be noted that during satellite-based algorithm development for water quality monitoring or/and coastal management, one of the main prerequisites is having good quality in situ datasets covering the spatial and temporal scales for the region of interest, which can be expensive and limited due to economic, time and logistic constraints. In this regard, data from the existing monitoring facilities run by different regional and local authorities can be a good source of long-time-series data. However, these data need to be synchronized with the satellite overpass. In this study, a portion of the in situ data came from IFAPA, an entity responsible for monitoring water quality in the lower course of the Guadalquivir estuary. Even though IFAPA has been collecting in situ data since 2017, most of the field data did not coincide with the Sentinel-2 satellite overpass and therefore could not be considered during the model development and validation. Long-term in situ data can provide us with information about the composition, nature, and evolution of an environmental crisis locally whereas satellite data can reveal the extent and evolution of the crisis over a wide range of areas. Both these data are complementary to each other to define a robust regional monitoring system. Therefore, this study stresses the importance of reorganizing the existing in situ monitoring systems to synchronize with the most suitable satellite overpass for developing a robust regional monitoring system, thus facilitating climate change studies and sustainable coastal resources management.
Finally, the application of the multi-conditional algorithm with the switching and smoothing criteria implemented in this study shows the promising capabilities of the Sentinel-2 satellite data to estimate turbidity over a wide range of values with 10 m spatial resolution. The 5-day revisit cycle (which will further increase with the launch of Sentinel-2C in 2024) under cloud-free and low glint effects over the Guadalquivir region also allows frequent monitoring of the river plume patterns, thus helping the adjacent coastal and marine resources management. Moreover, the information retrieved can help plan dredging operations, maritime defense, dam control, and fisheries practices, and evaluate the response of the coastal ecosystem to environmental changes. Therefore, the next step of this study is to develop a near-real-time operational monitoring system for the Guadalquivir estuary using the Sentinel-2 satellite data. In addition, combining Sentinel-2 data with other satellite data, i.e., Landsat-8/9 constellation can also help to build long time series that can provide perceptions on vital ecosystem dynamics and their relationship with climate change.
5 Conclusion
This study demonstrates the application of a multi-conditional algorithm to estimate a wide range of turbidity levels, using the Rrs665 and Rrs704 bands of the Sentinel-2 satellites with a high spatial resolution of 10 m. The algorithm is based on switching and smoothing criteria that automatically select the most sensitive turbidity vs. Rrs, thus avoiding the saturation effects of the red bands at higher turbidity levels. The model showed good agreement between the satellite-derived turbidity and in situ measured data with an r of 0.97, RMSE of 15.93 FNU, and a bias of 13.34 FNU. Maps derived using this algorithm can be used for regular turbidity monitoring and assessment of the potential anthropogenic actions in highly variable turbid regions, such as the Guadalquivir estuary, and thus can complement the in situ monitoring program. The information obtained through this study is helpful for the coastal decision-makers and relevant stakeholders who are responsible for the challenging short-term management and long-term policy decisions to protect water quality, ecosystems, and human health.
Data availability statement
The original contributions presented in the study are included in the article/Supplementary Material. Further inquiries can be directed to the corresponding author.
Author contributions
MC, CV, GN, IL and IC contributed with ideas to design the research objectives. MC created the algorithms to process the images and the computer codes to analyze and validate the remote sensing data, with support from IC. CV, SB and IC provided the necessary in situ data. MC wrote the original manuscript. All authors contributed to the interpretation and discussion of results and the final manuscript. IC, CV, GN, and IL provided part of the financial support leading to this publication.
Funding
This research was partly funded by grants RTI2018-098784-JI00 (Sen2Coast Project) and IJC2019-039382-I (Juan de la Cierva-Incorporación) from the MCIN/AEI/10.13039/501100011033 and by “ERDF A way of making Europe”. The research was also supported by the Andalusia Regional Government (PY20-00244), National Project OAPN (Observatorio TIAMAT, REF: 2715/2021) and the European Union-NextGenerationEU Agreement between MITECO, CSIC, AZTI, SOCIB, and the universities of Vigo and Cadiz, to promote research and generate scientific knowledge in the field of marine sustainability. Estuary monitoring and in situ data were provided by IFAPA-Junta de Andalucıá projects GUADALQUIVIR_LTER-PP.FEM. PPA201700.5 and GUADACONECT-PR.FEM.PPA201900.005, 75% co-funded by the European Maritime and Fisheries Fund (EMFF) 2014-2020. The three field campaigns were supported by the Spanish Ministerio de Ciencia e Innovación, the Agencia Estatal de Investigación, and the European Regional Development Fund in the frame of the Sen2Coast Project. MC is a PhD student at the University of Cadiz who is currently employed by the company Quasar Science Resources S.L. Consequently, MC is 50% funded by Quasar and 50% by the Industrial Doctorate Program of the Spanish Ministerio de Ciencia e Innovación (ref. DIN2020-010979/AEI/10.13039/501100011033). This work is part of MC’s PhD within the SIMBAD project (ref. QSR-ESABIC-2018-001, incubated by ESA-BIC Madrid region) and the University of Cadiz, and was partly supported by a grant funded by the European Commission under the Erasmus Mundus Joint Master Degree Programme in Water and Coastal Management (WACOMA; Project num. 586596-EPP-1-2017-1-IT-EPPKA1-JMD-MOB) and represents a contribution to CSIC Thematic Interdisciplinary Platform PTI TELEDETECT and PTI Oceans+.
Acknowledgments
The authors would like to thank the European Space Agency, the European Commission, and the Copernicus programme for distributing Sentinel-2 imagery. This work is a collaboration of the Associate Research Unit CSIC-IFAPA “Blue Growth”. The authors are thankful to Collin Roesler and Quinten Vanhellemont for their guidance to improve the research methodology. The open access fee was co-funded by the QUALIFICA Project (QUAL21-0019, Junta de Andalucía).
Conflict of interest
Author Masuma Chowdhury was employed by company Quasar Science Resources, S. L.
The remaining authors declare that the research was conducted in the absence of any commercial or financial relationships that could be construed as a potential conflict of interest.
The authors declare that this study received funding from Quasar Science Resources, S. L. The funder had the following involvement in the study: study design and the decision to submit it for publication.
Publisher’s note
All claims expressed in this article are solely those of the authors and do not necessarily represent those of their affiliated organizations, or those of the publisher, the editors and the reviewers. Any product that may be evaluated in this article, or claim that may be made by its manufacturer, is not guaranteed or endorsed by the publisher.
Supplementary material
The Supplementary Material for this article can be found online at: https://www.frontiersin.org/articles/10.3389/fmars.2023.1186441/full#supplementary-material
Supplementary Figure 1 | Sentinel-2B scene on 10 August 2018. Upper panel: left - RGB composites at TOA, right - RGB composites at BOA after DSF with sun glint correction. Lower panel: comparison between the DSF algorithm with and without sun glint correction. Spectra for P1, P2, and P3 (locations are indicated in the upper panel) extracted from the mean values of 5 x 5 pixels at BOA reflectance.
Supplementary Figure 2 | Sentinel-2A images on 18 November and 18 December 2017. Left panel: RGB composite at BOA; the dots indicate a transit along the Guadalquivir estuary. Right panel: the corresponding spectral signature for each dots in the transit.
References
Baldó F., García-Isarch E., Jiménez M. P., Romero Z., Sánchez-Lamadrid A., Catalán I. A. (2006). Spatial and temporal distribution of the early life stages of three commercial fish species in the northeastern shelf of the gulf of cádiz. Deep Sea Res. Part II Top. Stud. Oceanogr. Gulf Cadiz Oceanogr.: A Multidiscip. View 53, 1391–1401. doi: 10.1016/j.dsr2.2006.04.004
Binding C. E., Bowers D. G., Mitchelson-Jacob E. G. (2005). Estimating suspended sediment concentrations from ocean colour measurements in moderately turbid waters; the impact of variable particle scattering properties. Remote Sens. Environ. 94, 373–383. doi: 10.1016/j.rse.2004.11.002
Bowers D. G., Binding C. E. (2006). The optical properties of mineral suspended particles: a review and synthesis. Estuar. Coast. Shelf Sci. 67, 219–230. doi: 10.1016/j.ecss.2005.11.010
Bozorg-Haddad O., Delpasand M., Loáiciga H. A. (2021). Water quality, hygiene, and health. Econ. Polit. Soc Issues Water Resour, 217–257. doi: 10.1016/B978-0-323-90567-1.00008-5
Bustamante J., Pacios F., Díaz-Delgado R., Aragonés D. (2009). Predictive models of turbidity and water depth in the doñana marshes using landsat TM and ETM+ images. J. Environ. Manage. GlobWetland Symposium: Looking at wetlands space 90, 2219–2225. doi: 10.1016/j.jenvman.2007.08.021
Caballero I., Fernández R., Escalante O. M., Mamán L., Navarro G. (2020). New capabilities of sentinel-2A/B satellites combined with in situ data for monitoring small harmful algal blooms in complex coastal waters. Sci. Rep. 10, 8743. doi: 10.1038/s41598-020-65600-1
Caballero I., Morris E. P., Pietro L., Navarro G. (2014). The influence of the guadalquivir river on spatio-temporal variability in the pelagic ecosystem of the eastern gulf of cádiz. Mediterr. Mar. Sci. 15, 721–738. doi: 10.12681/mms.844
Caballero I., Navarro G. (2018). Application of extended full resolution MERIS imagery to assist coastal management of the area adjacent to the guadalquivir estuary. Prog. Oceanogr. 165, 215–232. doi: 10.1016/j.pocean.2018.06.007
Caballero I., Navarro G., Ruiz J. (2018a). Multi-platform assessment of turbidity plumes during dredging operations in a major estuarine system. Int. J. Appl. Earth Obs. Geoinformation 68, 31–41. doi: 10.1016/j.jag.2018.01.014
Caballero I., Román A., Tovar-Sánchez A., Navarro G. (2022). Water quality monitoring with sentinel-2 and landsat-8 satellites during the 2021 volcanic eruption in la palma (Canary islands). Sci. Total Environ. 822, 153433. doi: 10.1016/j.scitotenv.2022.153433
Caballero I., Steinmetz F., Navarro G. (2018b). Evaluation of the first year of operational sentinel-2A data for retrieval of suspended solids in medium- to high-turbidity waters. Remote Sens. 10, 982. doi: 10.3390/rs10070982
Caballero I., Stumpf R. P. (2020). Towards routine mapping of shallow bathymetry in environments with variable turbidity: contribution of sentinel-2A/B satellites mission. Remote Sens. 12, 451. doi: 10.3390/rs12030451
Caballero I., Stumpf R. P., Meredith A. (2019). Preliminary assessment of turbidity and chlorophyll impact on bathymetry derived from sentinel-2A and sentinel-3A satellites in south Florida. Remote Sens. 11, 645. doi: 10.3390/rs11060645
Cao F., Tzortziou M. (2021). Capturing dissolved organic carbon dynamics with landsat-8 and sentinel-2 in tidally influenced wetland–estuarine systems. Sci. Total Environ. 777, 145910. doi: 10.1016/j.scitotenv.2021.145910
Carpintero M., Contreras E., Millares A., Polo M. J. (2013). Estimation of turbidity along the guadalquivir estuary using landsat TM and ETM+ images. Proc SPIE, 8887, Remote Sensing for Agriculture, Ecosystems, and Hydrology XV, 88870B. doi: 10.1117/12.2029183
Chen Z., Muller-Karger F. E., Hu C. (2007). Remote sensing of water clarity in Tampa bay. Remote Sens. Environ. 109, 249–259. doi: 10.1016/j.rse.2007.01.002
Cloern J. E. (1987). Turbidity as a control on phytoplankton biomass and productivity in estuaries. Cont. Shelf Res. Dyn. Turbid Coast. Environ. 7, 1367–1381. doi: 10.1016/0278-4343(87)90042-2
Confederación Hidrográfica del Guadalquivir (2005) Acuerdo por el agua de la cuenca del guadalquivir (Ecologistas en Acción). Available at: https://www.ecologistasenaccion.org/2401/acuerdo-por-el-agua-de-la-cuenca-del-guadalquivir/ (Accessed 10.23.21).
Contreras E., Polo M. J. (2012). Measurement frequency and sampling spatial domains required to characterize turbidity and salinity events in the guadalquivir estuary (Spain). Nat. Hazards Earth Syst. Sci. 12, 2581–2589. doi: 10.5194/nhess-12-2581-2012
De Carvalho-Souza G. F., González-ortegón E., Baldó F., Vilas C., Drake P., Llope M. (2019). Natural and anthropogenic effects on the early life stages of European anchovy in one of its essential fish habitats, the guadalquivir estuary. Mar. Ecol. Prog. Ser. 67-79, 617–618. doi: 10.3354/meps12562
Díez-Minguito M., Baquerizo Azofra A., de Swart H., Losada M. (2014). Structure of the turbidity field in the guadalquivir estuary: analysis of observations and a box model approach. J. Geophys. Res. Oceans 119, 7190–7204. doi: 10.1002/2014JC010210
Dogliotti A. I., Ruddick K. G., Nechad B., Doxaran D., Knaeps E. (2015). A single algorithm to retrieve turbidity from remotely-sensed data in all coastal and estuarine waters. Remote Sens. Environ. 156, 157–168. doi: 10.1016/j.rse.2014.09.020
Doxaran D., Froidefond J.-M., Castaing P. (2003). Remote-sensing reflectance of turbid sediment-dominated waters. reduction of sediment type variations and changing illumination conditions effects by use of reflectance ratios. Appl. Opt. 42, 2623–2634. doi: 10.1364/ao.42.002623
Forget P., Ouillon S. (1998). Surface suspended matter off the Rhone river mouth from visible satellite imagery. Oceanol. Acta 21, 739–749. doi: 10.1016/S0399-1784(99)80003-6
González-Ortegón E., Amaral V., Baldó F., Sánchez-Leal R. F., Bellanco M. J., Jiménez M. P., et al. (2018). Sources and coastal distribution of dissolved organic matter in the gulf of cadiz. Sci. Total Environ. 630, 1583–1595. doi: 10.1016/j.scitotenv.2018.02.293
González-Ortegón E., Subida M. D., Cuesta J. A., Arias A. M., Fernández-Delgado C., Drake P. (2010). The impact of extreme turbidity events on the nursery function of a temperate European estuary with regulated freshwater inflow. Estuar. Coast. Shelf Sci. Mech. OF SEDIMENT RETENTION IN ESTUARIES 87, 311–324. doi: 10.1016/j.ecss.2010.01.013
Grobbelaar J. U. (2009). “Turbidity,” in Encyclopedia of inland waters. Ed. Likens G. E. (University of the Free State, Bloemfontein, South Africa: Academic Press, Oxford), 699–704. doi: 10.1016/B978-012370626-3.00075-2
Gutiérrez C., Berbel J., Borrego-Marín M. M. (2015). System of Water Accounting in Guadalquivir River Basin (SYWAG). Final Report. Helvia. Universidad de Cordoba, 76. Available at: http://helvia.uco.es/xmlui/handle/10396/12557
Haro S., Jesus B., Oiry S., Papaspyrou S., Lara M., González C. J., et al. (2022). Microphytobenthos spatio-temporal dynamics across an intertidal gradient using random forest classification and sentinel-2 imagery. Sci. Total Environ. 804, 149983. doi: 10.1016/j.scitotenv.2021.149983
Kim H.-C., Son S., Kim Y. H., Khim J. S., Nam J., Chang W. K., et al. (2017). Remote sensing and water quality indicators in the Korean West coast: spatio-temporal structures of MODIS-derived chlorophyll-a and total suspended solids. Mar. pollut. Bull. 121, 425–434. doi: 10.1016/j.marpolbul.2017.05.026
Laiz I., Plecha S., Teles-Machado A., González-Ortegón E., Sánchez-Quiles D., Cobelo- García A., et al. (2020). The role of the gulf of cadiz circulation in the redistribution of trace metals between the Atlantic ocean and the Mediterranean Sea. Sci. Total Environ. 719, 134964. doi: 10.1016/j.scitotenv.2019.134964
Le Pape O., Guillet C., Riou P., Morin J., Amara R., Désaunay Y. (2007). Convergent signs of degradation in both the capacity and the quality of an essential fish habitat: state of the seine estuary (France) flatfish nurseries. Hydrobiologia 588, 225–229. doi: 10.1007/s10750-007-0665-y
Liversedge L. (2007). Turbidity mapping and prediction in ice marginal lakes at the Bering glacier system, Alaska (University of Michigan Library). pp. 59.
Losada M. A., Díez-Minguito M., Reyes-Merlo M.Á. (2017). Tidal-fluvial interaction in the guadalquivir river estuary: spatial and frequency-dependent response of currents and water levels. J. Geophys. Res. Oceans 122, 847–865. doi: 10.1002/2016JC011984
Maimouni S., Moufkari A. A., Daghor L., Fekri A., Oubraim S., Lhissou R. (2022). Spatiotemporal monitoring of low water turbidity in Moroccan coastal lagoon using sentinel-2 data. Remote Sens. Appl. Soc Environ. 26, 100772. doi: 10.1016/j.rsase.2022.100772
Moore G. F., Aiken J., Lavender S. J. (1999). The atmospheric correction of water colour and the quantitative retrieval of suspended particulate matter in case II waters: application to MERIS. Int. J. Remote Sens. 20 (9), 1713–1733. doi: 10.1080/014311699212434
Navarro G., Ruiz J. (2006). Spatial and temporal variability of phytoplankton in the gulf of cádiz through remote sensing images. Deep Sea Res. Part II Top. Stud. Oceanogr. Gulf Cadiz Oceanogr.: A Multidiscip. View 53, 1241–1260. doi: 10.1016/j.dsr2.2006.04.014
Navarro G., Huertas I. E., Costas E., Flecha S., Díez-Minguito M., Caballero I., et al. (2012). Use of a real-time remote monitoring network (RTRM) to characterize the guadalquivir estuary (Spain). Sensors 12 (2), 1398–1421. doi: 10.3390/s120201398
Neukermans G., Ruddick K. G., Greenwood N. (2012). Diurnal variability of turbidity and light attenuation in the southern north Sea from the SEVIRI geostationary sensor. Remote Sens. Environ. 124, 564–580. doi: 10.1016/j.rse.2012.06.003
Ouillon S., Douillet P., Andréfouët S. (2004). Coupling satellite data with in situ measurements and numerical modeling to study fine suspended-sediment transport: a study for the lagoon of new Caledonia. Coral Reefs 23, 109–122. doi: 10.1007/s00338-003-0352-z
Ouillon S., Douillet P., Petrenko A., Neveux J., Dupouy C., Froidefond J.-M., et al. (2008). Optical algorithms at satellite wavelengths for total suspended matter in tropical coastal waters. Sensors 8, 4165–4185. doi: 10.3390/s8074165
Pennock J. R., Sharp J. H. (1994). Temporal alternation between light- and nutrientlimitation of phytoplankton production in a coastal plain estuary. Mar. Ecol. Prog. Ser. 111, 275–288. doi: 10.3354/meps111275
Petus C., Chust G., Gohin F., Doxaran D., Froidefond J.-M., Sagarminaga Y. (2010). Estimating turbidity and total suspended matter in the adour river plume (South bay of Biscay) using MODIS 250-m imagery. Cont. Shelf Res. 30, 379–392. doi: 10.1016/j.csr.2009.12.007
Prieto L., Navarro G., Rodríguez-Gálvez S., Huertas I. E., Naranjo J. M., Ruiz J. (2009). Oceanographic and meteorological forcing of the pelagic ecosystem on the gulf of cadiz shelf (SW Iberian peninsula). Cont. Shelf Res. 29, 2122–2137. doi: 10.1016/j.csr.2009.08.007
Ritchie J. C., Zimba P. V., Everitt J. H. (2003). Remote sensing techniques to assess water quality. Photogramm. Eng. Remote Sens. 69, 695–704. doi: 10.14358/PERS.69.6.695
Ruiz J., Macías D., Losada M., Díez-Minguito M., Prieto L. (2013). A simple biogeochemical model for estuaries with high sediment loads: application to the guadalquivir river (SW Iberia). Ecol. Model. 265, 194–206. doi: 10.1016/j.ecolmodel.2013.06.012
Scholz M. (2016). “Chapter 20 - constructed wetlands” in Wetlands for water pollution control, 2nd ed. Ed. Scholz M. (Elsevier), 137–155. doi: 10.1016/B978-0-444-63607-2.00020-4
Sebastiá-Frasquet M.-T., Aguilar-Maldonado J. A., Santamaría-Del-Ángel E., Estornell J. (2019). Sentinel 2 analysis of turbidity patterns in a coastal lagoon. Remote Sens. 11, 2926. doi: 10.3390/rs11242926
Shaikh S., Aziz A., Ahmed F., Ahmed, Fahad, Shahzad A., Khan U., et al. (2018). Mapping turbidity levels in the lake’s water using satellite remote sensing technique. Int. J. Econ. Environ. Geol 9 (3), 40–43.
Swanson H. A., Baldwin H. L. (1965). A primer on water quality. US Geol. Surv, 33. doi: 10.3133/7000057
Vanhellemont Q. (2019). Adaptation of the dark spectrum fitting atmospheric correction for aquatic applications of the landsat and sentinel-2 archives. Remote Sens. Environ. (Czech Republic: ESA Living Planet Symposium) 225, 175–192. doi: 10.1016/j.rse.2019.03.010
Vanhellemont Q., Ruddick K. (2016). “Acolite for sentinel-2: aquatic applications of MSI imagery,” in Proceedings of the 2016 ESA Living Planet Symposium, Prague, Czech Republic. 9–13.
Vanhellemont Q., Ruddick K. (2018). Atmospheric correction of metre-scale optical satellite data for inland and coastal water applications. Remote Sens. Environ. 216, 586–597. doi: 10.1016/j.rse.2018.07.015
Vanhellmont Q. (2022) Does my image have glint or adjacency effects? - ACOLITE forum. Available at: https://odnature.naturalsciences.be/remsem/acolite-forum/viewtopic.php?t=310 (Accessed 9.4.22).
Wang Y., He X., Bai Y., Tan Y., Zhu B., Wang D., et al. (2022). Automatic detection of suspected sewage discharge from coastal outfalls based on sentinel-2 imagery. Sci. Total Environ. 853, 158374. doi: 10.1016/j.scitotenv.2022.158374
Wang X., Yang W. (2019). Water quality monitoring and evaluation using remote sensing techniques in China: a systematic review. Ecosyst. Health Sustain. 5, 47–56. doi: 10.1080/20964129.2019.1571443
Woźniak S. B., Stramski D. (2004). Modeling the optical properties of mineral particles suspended in seawater and their influence on ocean reflectance and chlorophyll estimation from remote sensing algorithms. Appl. Opt. 43, 3489–3503. doi: 10.1364/AO.43.003489
Zampoukas N., Piha H., Bigagli E., Hoepffner N., Hanke G., Cardoso A. C. (2012). Monitoring for the marine strategy framework directive: requirements and options (Publications Office of the European Union: European Commission Joint Research Centre), 42. doi: 10.2788/77640
Keywords: Sentinel-2, atmospheric correction, multi-conditional algorithm, turbidity, Guadalquivir estuary, ecosystem management
Citation: Chowdhury M, Vilas C, van Bergeijk S, Navarro G, Laiz I and Caballero I (2023) Monitoring turbidity in a highly variable estuary using Sentinel 2-A/B for ecosystem management applications. Front. Mar. Sci. 10:1186441. doi: 10.3389/fmars.2023.1186441
Received: 14 March 2023; Accepted: 23 June 2023;
Published: 13 July 2023.
Edited by:
Vincent Le Fouest, Université de la Rochelle, FranceReviewed by:
Ana Laura Delgado, CONICET Instituto Argentino de Oceanografía (IADO), ArgentinaGeorgios Sylaios, Democritus University of, Thrace, Greece
Isabelle Brenon, Université de la Rochelle, France
Copyright © 2023 Chowdhury, Vilas, van Bergeijk, Navarro, Laiz and Caballero. This is an open-access article distributed under the terms of the Creative Commons Attribution License (CC BY). The use, distribution or reproduction in other forums is permitted, provided the original author(s) and the copyright owner(s) are credited and that the original publication in this journal is cited, in accordance with accepted academic practice. No use, distribution or reproduction is permitted which does not comply with these terms.
*Correspondence: Masuma Chowdhury, bWFzdW1hLmNob3dkaHVyeUB1Y2EuZXM=