 Kohei Matsuoka
 Tomomichi Tatsuyama
 Shotaro Takano
 Yoshiki Sohrin
- Institute for Chemical Research, Kyoto University, Uji, Japan
Molybdenum and tungsten are redox-sensitive elements, and their stable isotope ratios have attracted attention as paleoceanographic proxies. However, our knowledge of the distribution of stable Mo and W isotopes in the modern hydrosphere remains limited. In this study, we provided the concentrations and isotope ratios of dissolved Mo and W in the oceans (the North Pacific and Indian Oceans), marginal seas (the East China Sea and Sea of Japan), and a river-estuary system in Japan (from the Uji-Yodo rivers to Osaka Bay). In the North Pacific and Indian Oceans, the W concentration was 48.2 ± 6.2 pmol/kg (ave ± 2sd, n = 109), δ186/184W was 0.52 ± 0.06 ‰, the Mo concentration was 105.1 ± 8.0 nmol/kg, and δ98/95Mo was 2.40 ± 0.06 ‰. The results indicate that W has the constant concentration and isotopic composition in the modern ocean as well as Mo. In the East China Sea and the Sea of Japan, the W concentration and δ186/184W in the upper water (< 1000 m depth) were different from those in the ocean (W = 56 ± 18 pmol/kg, δ186/184W = 0.45 ± 0.06 ‰, n = 24). However, the concentrations in deeper water were congruent with those in the oceans (W = 49.9 ± 7.6 pmol/kg, δ186/184W = 0.50 ± 0.02 ‰, n = 7). The Mo concentration was 105.4 ± 3.1 nmol/kg and δ98/95Mo was 2.36 ± 0.03 ‰ (n = 31) throughout the water column, congruent with those in the ocean. In the Uji River-Yodo River-Osaka Bay system, the W concentration reached 1074 pmol/kg and δ186/184W reached 0.20 ‰. We propose that the enrichment of W with a low δ186/184W in the river-estuary system and marginal seas is caused by anthropogenic pollution. Anthropogenic Mo pollution was not detected in marginal seas. However, the Mo concentration and δ98/95Mo showed high anomalies above the mixing line of river water and seawater in the lower Yodo River and Osaka Bay, implying possible anthropogenic pollution of Mo in the metropolitan area.
1 Introduction
The chemical species of dissolved molybdenum and tungsten depend on the concentrations of oxygen and sulfide in the aquatic environment (Emerson and Huested, 1991; Helz et al., 1996; Cui et al., 2021), which in turn change their concentrations and stable isotope ratios in the sediments (Tsujisaka et al., 2019), making them useful redox proxies for paleoceanography. In modern aquatic environments, the concentrations and stable isotope ratios of Mo and W are of interest as tracers of oceanic cycles because the stable isotope ratios of Mo and W change owing to sources and chemical processes, such as adsorption on particles (Goldberg et al., 2009; Kashiwabara et al., 2017).
Mo has seven stable isotopes: 92Mo (14.84%), 94Mo (9.25%), 95Mo (15.92%), 96Mo (16.68%), 97Mo (9.55%), 98Mo (24.13%), and 100Mo (9.63%) (De Laeter et al., 2003). Among Mo isotope ratios, the 98Mo/95Mo ratio is conventionally used as a tracer. The isotope ratio of Mo is presented as the delta value (‰) relative to that of the NIST SRM 3134 standard, which is defined as +0.25 ‰ for easy comparison with literature (Nagler et al., 2014):
Mo is the most abundant transition metal in the modern oxic ocean, with a concentration of ~ 107 nmol/kg (Nakagawa et al., 2012), where it exists as a hexavalent oxoacid ion (). Mo shows a conservative vertical profile because is hardly scavenged, and its amount in the surface water is much higher than that assimilated by phytoplankton. Its concentration is globally constant because the residence time of 740,000 years in the ocean (Firdaus et al., 2008) is sufficiently longer than the time required for oceanic general circulation. The isotopic composition of Mo is also homogeneous in the ocean; δ98/95Mo = 2.34 ± 0.10‰ (Nakagawa et al., 2012), which is higher than δ98/95Mo = –0.08 ± 0.46‰ in the continental crust (Nagler et al., 2014; Willbold and Elliott, 2017). Mo is adsorbed onto oxide minerals, such as manganese oxides and iron hydroxides (Bertine and Turekian, 1973; Shimmield and Price, 1986; Kashiwabara et al., 2017). Lighter isotopes of Mo tend to be adsorbed more readily, resulting in higher δ98/95Mo values in the oxic seawater than those found in the continental crust (Barling et al., 2001; Siebert et al., 2003). It has been experimentally confirmed that Mo adsorption on manganese oxides results in a positive isotope fractionation of +2.0–3.0 ‰ for dissolved species (Barling and Anbar, 2004). However, it has been experimentally confirmed that Mo adsorption on iron oxides and hydroxides causes a positive isotope fractionation of dissolved species of +1.0–2.0 ‰ (Goldberg et al., 2009). In general, river water has lower Mo concentrations than seawater, and the concentrations and isotopic ratios of Mo are affected by the geology, ecosystem, and chemical reactions, resulting in a wide range of values (Mo = 0.7–139 nM, δ98/95Mo = 0.2–1.4 ‰) (Anbar and Rouxel, 2007; Neubert et al., 2011). The impact of anthropogenic Mo pollution on river water and seawater has also been suggested (Wong et al., 2021). Under a strong reducing environment, Mo reacts with H2S to form thiomolybdate ion (0 ≤ x ≤ 3). When the concentration of H2S exceeds 11 μmol/kg, is quantitatively converted to (Cui et al., 2021), which is readily adsorbed on iron sulfides and organic matters in sediments and is removed from the water column. In addition, molybdenum sulfides are formed by reduction to Mo(IV), which causes the depletion of Mo in submarine high-temperature hydrothermal fluids (Ishibashi and Urabe, 1995). Under euxinic conditions, the most of Mo is removed from the water to the sediments, resulting in small isotope fractionation (Anbar and Rouxel, 2007). Therefore, the Mo concentration and δ98/95Mo in sediments vary greatly depending on redox conditions, being useful proxies for paleoceanographic studies (Rimmer, 2004; Tribovillard et al., 2006; Pattan and Pearce, 2009). In the modern euxinic water columns of the Black Sea and the Baltic Sea, dissolved Mo is depleted in concentration and enriched in the heavy isotope (δ98/95Mo values up to+2.9‰) (Nägler et al., 2011).
W has five stable isotopes: 180W (0.12%), 182W (26.50%), 183W (14.31%), 184W (30.64%), and 186W (28.43%) (De Laeter et al., 2003). Among W isotope ratios, the 186W/184W ratio is conventionally used as a tracer. The isotope ratio of W is presented as the delta value (‰) relative to the NIST SRM 3163 standard (Tsujisaka et al., 2019):
In modern oxic seawater, W exists as a hexavalent oxoacid () and exhibits a conserved vertical profile similar to that of . However, in modern oxic ocean, the W concentration was approximately 49 pmol/kg (Sohrin et al., 1987; Sohrin et al., 1999), which is only 1/2000 of the Mo concentration. This was due to the high partitioning ratio of to iron hydroxides and manganese oxides (Sohrin et al., 1987; Kashiwabara et al., 2013). Consequently, the oceanic residence time of W ranges from 14,000 to 61,000 years, which is shorter than that of Mo but longer than the oceanic circulation time (Sohrin et al., 1987; Sohrin et al., 1999). In modern rivers, the W concentration varies in the range of 26–1000 pmol/kg (Firdaus et al., 2008), and the average W concentration has been reported to be 160 pmol/kg (Li, 2000). W adsorption on manganese oxides has been experimentally confirmed to cause a positive isotope fractionation of dissolved species of +0.7–1.0 ‰, and iron oxides and hydroxides cause a positive isotope fractionation of +0.7–0.8 ‰ (Kashiwabara et al., 2017). The isotopic ratios of W in seawater have been reported at several stations in the North Pacific Ocean, Atlantic Ocean, and South China Sea (Fujiwara et al., 2020; Kurzweil et al., 2021). According to these results, δ186/184W is 0.55 ± 0.12 ‰ in the North Pacific Ocean, 0.55 ± 0.06 ‰ in the Atlantic Ocean, and 0.51 ± 0.05 ‰ in the South China Sea. Only one study reported a stable isotopic ratio of W in river water (Yang et al., 2022). Under strongly reducing conditions, W forms thiotungstate ions but requires a higher H2S concentration than Mo (Cui et al., 2021). Thiotungstate ions cannot be easily removed by adsorption onto solids. In addition, W is hardly reduced to W(IV) and does not precipitate as sulfides. These factors result in high W concentrations in submarine hydrothermal fluids (Kishida et al., 2004). However, there is no data on the stable isotope ratios of W in hydrothermal fluids. W is also expected to be a proxy for paleoceanography. However, further data collection from the modern hydrosphere is required to better understand the circulation of W.
We recently developed a method for determining the stable isotope ratios of Mo and W in seawater (Fujiwara et al., 2020). In this method, Mo and W are pre-concentrated by solid-phase extraction using an 8-hydroxyquinoline resin (TSK-8HQ) and chromatography using an AG1-X8 anion exchange resin. In the present study, we improved this method and applied it to seawater and river water samples. A total of 150 samples collected from the open ocean (Pacific and Indian Oceans), marginal seas (East China Sea and Sea of Japan), and Yodo River system, including Osaka Bay in a metropolitan area, were analyzed. We discuss the features of the distribution of Mo and W in the modern hydrosphere and suggest the anthropogenic pollution of Mo and W in aquatic environments.
2 Material and methods
2.1 Reagents and materials
Reagent-grade HF, HCl, HNO3, H2O2, tetramethylammonium hydroxide (TMAH), and NH3 (FUJIFILM Wako Pure Chemical, Japan) were used for cleaning and analysis. The NIST SRM 3134 and NIST SRM 3163 standards (National Institute of Standards and Technology, USA) were used to prepare standard solutions for the determination of the isotopic compositions and concentrations of Mo and W, respectively (Irisawa and Hirata, 2006). Standard solutions of Ru and Re (AccuStandard, USA) were diluted and added to the preconcentrated sample solutions as external element standards for Mo and W, respectively. Ultrapure water (UW) prepared using a Milli-Q Gradient-A10 system (Merck Millipore, Germany) was used for cleaning and analysis. Standard solutions of Mo and W were prepared by diluting 1000 ppm standard solutions for atomic absorption spectrometry (FUJIFILM Wako Pure Chemical) and were used for preliminary experiments.
We used perfluoroalkoxy alkane (PFA) vials (Savillex, USA) for chemical separation and low-density polyethylene (LDPE) bottles (Nalgene Nunc Inc., USA) for solution storage and preparation. All the vials and bottles were soaked in 5% SCAT (Nacalai Tesque, Japan) overnight and rinsed with UW at least five times. Next, they were soaked in 4 mol/kg HCl overnight and rinsed with UW 5 times. Finally, the samples were soaked in 2 mol/kg NH3 overnight and rinsed with MQW 5 times. Other materials such as micropipette tips, columns, and tubes were cleaned similarly.
We synthesized the TSK-8HQ resin following previous studies (Firdaus et al., 2007; Fujiwara et al., 2020). The TSK-8HQ resin (dry weight ~200 mg, adsorption capacity of W 1.6 mmol/g) was packed in a polypropylene column (Type L, Tomoe Works, Japan) with an inner diameter of 12 mm and a bed height of 6.5 mm and stopped with polyethylene frits.
Anion exchange resin AG1-X8 (200–400 mesh, Bio-Rad, USA) was cleaned with five aliquots of ethanol until the cleaning solvent became colorless. The resin was rinsed with UW. Approximately 400 mg of AG1 X8 resin was charged in a polypropylene column (Mini-column S, Muromachi Chemicals, Japan) with an internal diameter of 5 mm and a bed height of 30 mm.
2.2 Sampling
Samples were collected from the Pacific Ocean, Indian Ocean, East China Sea, Sea of Japan, Osaka Bay, and the Uji and Yodo Rivers (Figure 1). Seawater samples from the Pacific Ocean were collected during cruises KH-10-2, KH-14-6, and KH-17-3 of the Hakuho Maru scientific research vessel. Seawater samples from the Indian Ocean were collected during cruise KH-09-5; those from the East China Sea were collected during cruise KH-15-3; and those from the Sea of Japan were collected during the KH-10-2 cruise. These stations are shown in Figure 1A. Sampling was conducted using a clean system (Sohrin and Bruland, 2011). A portion of seawater for the determination of dissolved species was filtered through a 0.8/0.2 µm pore size AcroPak capsule filter (PALL, USA), collected in a 5 l polyethylene container (SEKISUI SEIKEI, Japan), added with HCl up to 40 mmol/kg, and stored at room temperature.
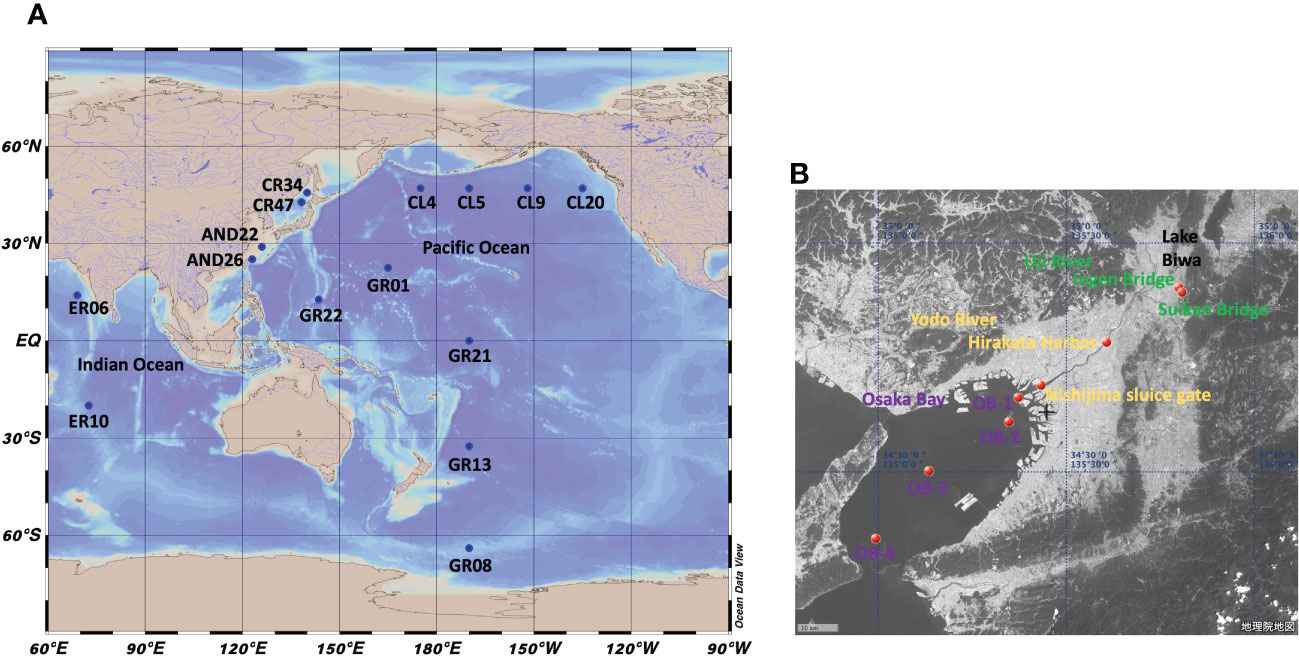
Figure 1 Maps showing sampling points of this study. (A): Global map. (B): Map of the Uji River-Yodo River-Osaka Bay system.
The sampling points in the Yodo River system are shown in Figure 1B. In the Yodo River system, water flows from Lake Biwa, the largest lake in Japan, through the Uji and Yodo Rivers, to Osaka Bay. The Yodo River flows in the Osaka metropolitan area. River water samples were simultaneously collected and filtered on-site using a MasterFlex peristaltic pump (Cole-Parmer, USA). PharMed tube (06508-13, SAINT-GOBAIN, France) was used for the flow path, one end was inserted into the river and the other was connected to a Millex-HP 0.45 µm filter (Merck Millipore, Germany). The filtered sample was collected in a 5 l polyethylene container, brought back to our laboratory, and HCl was added up to 40 mmol/kg (pH 1.4).
Samples from Osaka Bay were collected using a clean 5 l Niskin-X water sampler from the fishing boat Kaiko Maru. Within a week after sampling, samples were filtered through a Millex-HP 0.45 µm filter and added with HCl up to 40 mmol/kg (pH 1.4).
2.3 Chemical separation
2.3.1 Solid-phase extraction using the chelating resin TSK-8HQ
The solid-phase extraction procedure was almost identical to that described in a previous study (Fujiwara et al., 2020). The preconcentration system of solid-phase extraction is shown in Figure S1, which was constructed with serially connected two columns of TSK-8HQ, PFA tubes with a 2 mm internal diameter, PharMed tubes with a 1.6 mm internal diameter, Tygon tubes with a 4 mm internal diameter, and a MasterFlex pump. Each step of the chemical analysis was performed in a clean hood. This procedure is summarized in Table 1. The chelating resin columns were cleaned by flowing 100 ml 2 mol/kg NH3, 10 ml UW, 100 ml 3 mol/kg HNO3, and 10 ml UW. The columns were then conditioned using a flow of 20 ml 0.04 mol/kg HCl (pH 1.4). Flow rates were maintained at 1 ml/min. Approximately 3 kg of a sample (pH 1.4) was introduced into the columns at 4 ml/min, and 50 ml 0.04 mol/kg HCl (pH 1.4) was flowed into the columns to remove the remaining matrices. The chelating resin columns were detached from the preconcentration system and connected to a polypropylene syringe for elution. Compared with the previous study (Fujiwara et al., 2020) we reduced the volume of an eluent to improve an efficiency. Thirty eluents of 30 ml 5 mol/kg HF were passed through the columns in the direction opposite to that for sample loading by gravity flow at a flow rate of 0.3 ml/min. The eluates were collected in a PFA vial. The chelating resin columns were mounted on the preconcentration system and cleaned with 20 ml UW for subsequent use. One cycle of the solid-phase extraction required approximately 15 h for completion.
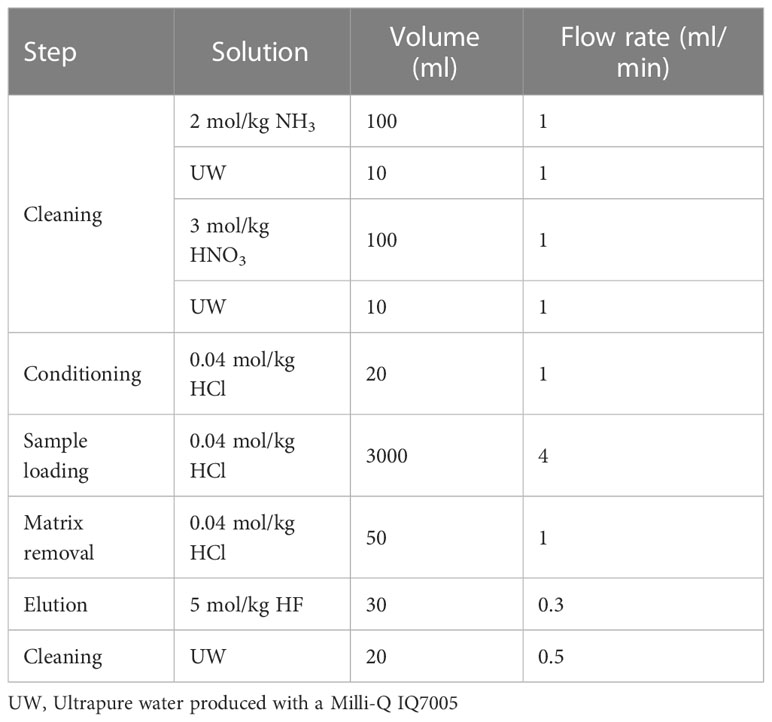
Table 1 Procedure of chelating solid-phase extraction with TSK-8HQ.
The eluate in a PFA vial was heated to complete dryness at 170 °C for 6 h on a hot plate (Analab, France). The residual organic matter from the chelating resin was decomposed by adding 2 ml 13 mol/kg HNO3, 0.2 ml 10 mol/kg H2O2, and 0.1 ml 0.3 mol/kg H2SO4. The vial was loosely capped and heated at 160 °C for 12 h on a hot plate. Then the cap was removed, and the solution was heated at 170 °C, leaving H2SO4 in the vial. The sample was added with a 2 ml mixture of 0.5 mol/kg HF and 0.4 mol/kg HCl and heated at 80 °C for 3 h.
2.3.2 Chromatography using the anion exchange resin AG1 X8
Compared to a previous study (Fujiwara et al., 2020), we reduced the size of the anion exchange resin column and modified the procedure (Table 2) to improve efficiency. Each solution was passed through the column by gravity at a flow rate of 0.15 ml/min. The column was first cleaned by flowing 2.5 ml 6 mol/kg HNO3 twice, 1 ml UW, and 0.3 ml 0.5 mol/kg HF–0.4 mol/kg HCl 3 times. The sample solution was loaded onto the resin. Matrix elements were eluted using a flow of 0.2 ml 0.05 mol/kg HF–9 mol/kg HCl 4 times. Tungsten was eluted thrice with 2 ml 5 mol/kg HCl and collected in a PFA vial. Mo was eluted with 1 ml 1 mol/kg HNO3 three times and collected in another PFA vial. One cycle of anion-exchange separation required approximately 4 h for completion.
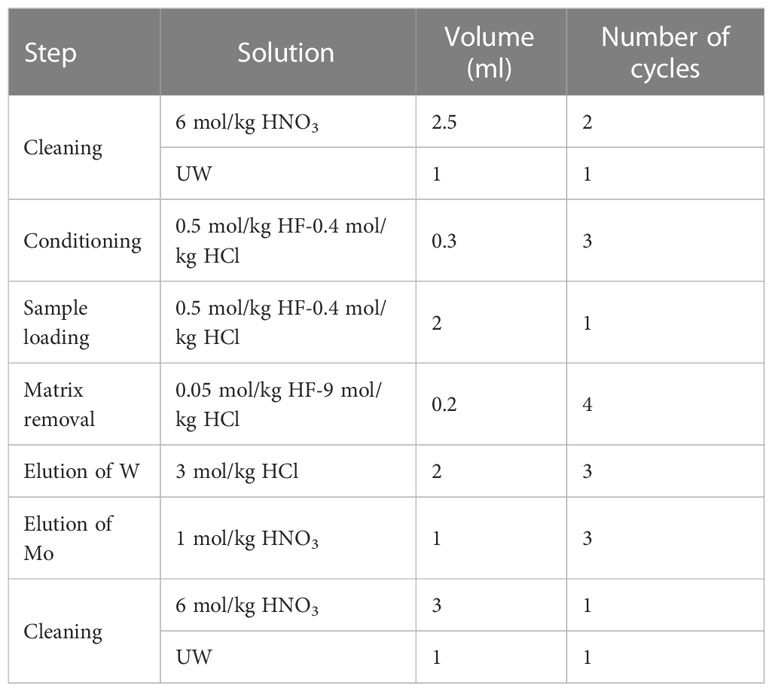
Table 2 Procedure of anion exchange chromatography with AG1-X8.
The eluates of Mo and W in PFA vials were evaporated at 170°C on a hot plate. The residual organic materials from the anion-exchange resin decomposed like that described in the previous section but without the addition of H2SO4. After evaporation of the acids, the Mo sample was redissolved with 20 g 0.15 mol/kg HNO3, and the W sample was redissolved with 0.5 g 5.5 mmol/kg TMAH by heating at 80 °C for 3 h. An accurate concentration factor was calculated on a weight basis.
2.4 Measurement
The external standard solutions of Ru and Re were added to the Mo and W sample solutions obtained using the procedures described in 2.3 respectively. A Ru standard solution diluted with 0.15 mol/kg HNO3 was added to the Mo sample solution to produce a mole ratio of Mo: Ru = 1:1. The Re standard solution diluted with 5.6 mmol/kg TMAH was added to the W sample solution such that the molar ratio of W: Re = 1:2. The obtained sample solutions were introduced into a Neptune Plus MC-ICP-MS (Thermo Fisher Scientific, USA) at the Research Institute for Humans and Nature (RIHN) to determine the concentrations and stable isotope ratios of Mo and W. Major conditions of the measurement are shown in Tables 3 and 4. The instrumental mass bias was corrected by standard-sample bracketing combined with external mass bias correction using Ru and Re. The measurements and data processing were performed as previously described (Tsujisaka et al., 2019; Fujiwara et al., 2020).
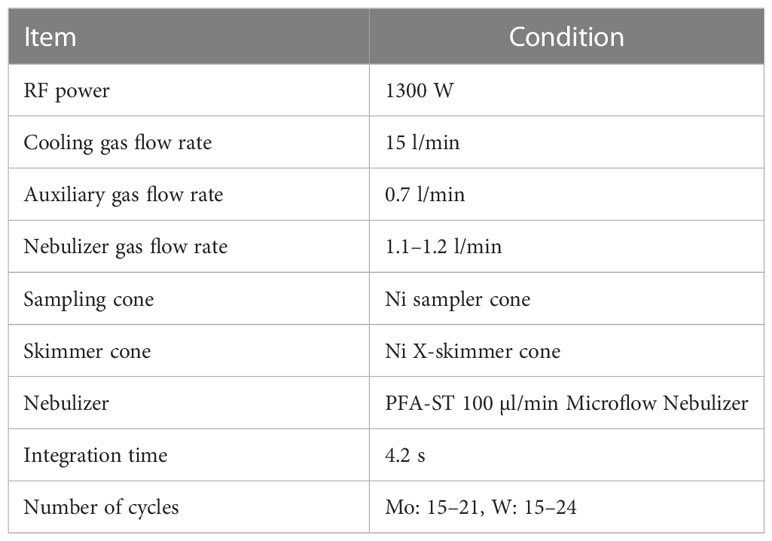
Table 3 Major conditions of MC-ICP-MS measurement.
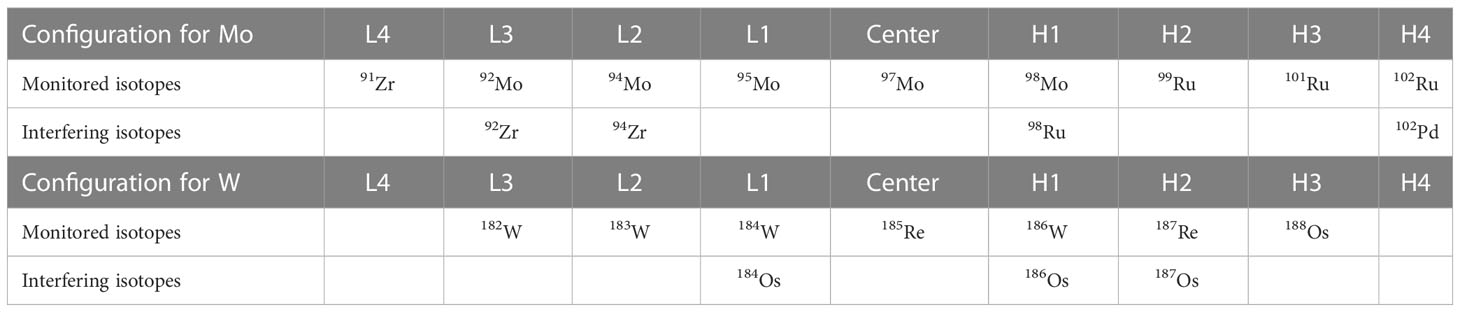
Table 4 Cup configurations of Neptune plus for Mo and W measurement.
For preliminary experiments, the concentrations of Mo and W were measured using an Element 2 HR-ICP-MS (Thermo Fisher Scientific, USA). The major measurement conditions are listed in Table S1.
2.5 Verification of the analytical method
To determine the operational blanks of Mo and W, chelating solid-phase extraction and anion-exchange chromatography were performed using 3 kg of UW as the sample. The concentrations of Mo and W in the pre-concentrated solutions were measured using Element 2 HR-ICP-MS. The results are summarized in Table S2. The operational blank was 0.01 ± 0.02 nmol/kg (average (ave) ± 2 standard deviation (sd), n = 4) for Mo and 0.7 ± 0.8 pmol/kg (n = 4) for W.
Furthermore, a recovery experiment was conducted using UW as the sample. Mo and W from the NIST SRM 3134 and NIST SRM 3163 standards were added to 3 kg of UW at 100 nmol/kg and 50 pmol/kg, respectively. The results are summarized in Table S3. The recovery was 104.7 ± 2.8% (n = 4) for Mo and 101.6 ± 1.9% (n = 4) for W, indicating that both elements were quantitatively recovered. The isotope ratios of Mo and W in the pre-concentrated solutions were measured using MC-ICP-MS. δ98/95Mo was 0.26 ± 0.09 ‰ (n = 4) and δ186/184W was –0.02 ± 0.02 ‰ (n = 4), which was congruent with the isotope ratio of added Mo and W. This is indicating that significant isotope fractionation did not occur during the analytical method.
The concentrations and isotope ratios of Mo and W were measured using a large volume of mixed seawater as samples, originally collected from at some depths of station TR-16 during the KH-11-7 cruise. The experimental results are listed in Table S4. The Mo concentration was 104 ± 9 nmol/kg (n = 8), δ98/95Mo was 2.37 ± 0.07 ‰ (n = 8), the W concentration was 50 ± 5 pmol/kg (n = 9), and δ186/184W was 0.53 ± 0.05 ‰ (n = 9). These values agree with those observed at a station in the western North Pacific within a range of errors (Fujiwara et al., 2020).
3 Results
3.1 Concentrations and isotope ratios of Mo and W in water samples
All Mo and W data in this study are summarized in Table S5. Vertical profiles of the concentrations and stable isotope ratios of Mo at nine stations in the Pacific Ocean and two stations in the Indian Ocean are shown in Figures 2A, C, respectively. The Mo concentration was 93.6–114.7 nmol/kg and δ98/95Mo was 2.31–2.47 ‰ (n = 109). The average and standard deviation values at each station and for all oceanic samples are listed in Table 5. These results are consistent with previously reported Mo concentration and δ98/95Mo (Mo = 106 ± 7 nmol/kg, δ98/95Mo = 2.41 ± 0.15 ‰, n = 168) in the Pacific, Atlantic, and Antarctic Oceans (Collier, 1985; Nakagawa et al., 2012; Fujiwara et al., 2020).
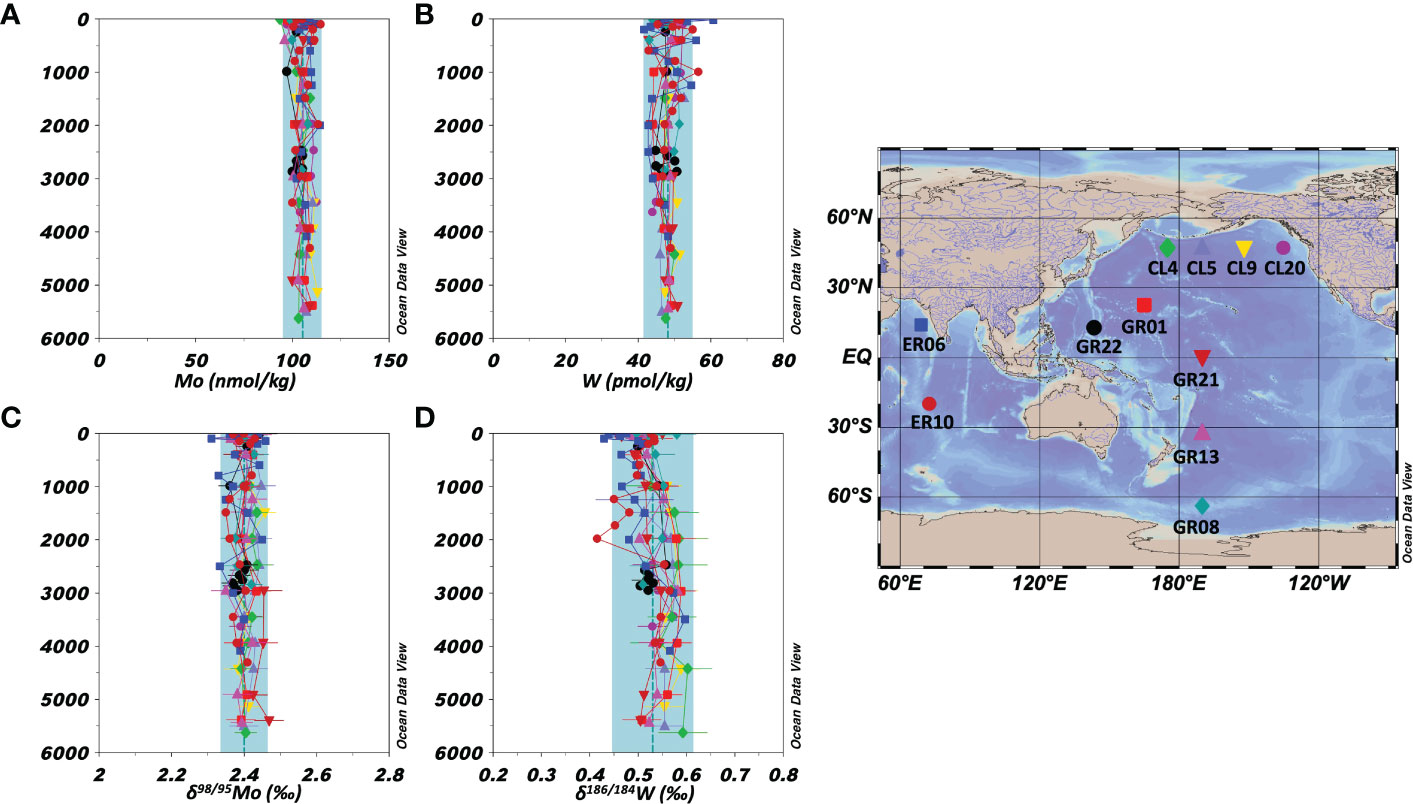
Figure 2 Vertical profiles of the concentrations and isotope ratios of Mo and W in the open oceans (the Pacific and Indian Oceans). The data symbols are consistent with the sampling point symbols on the map. The error bar shows a standard deviation ( ± 1sd). The blue columns show ranges of ave ± 2sd for all oceanic samples. (A): Mo concentration. (B): W concentration. (C): δ98/95Mo. (D): δ186/184W.
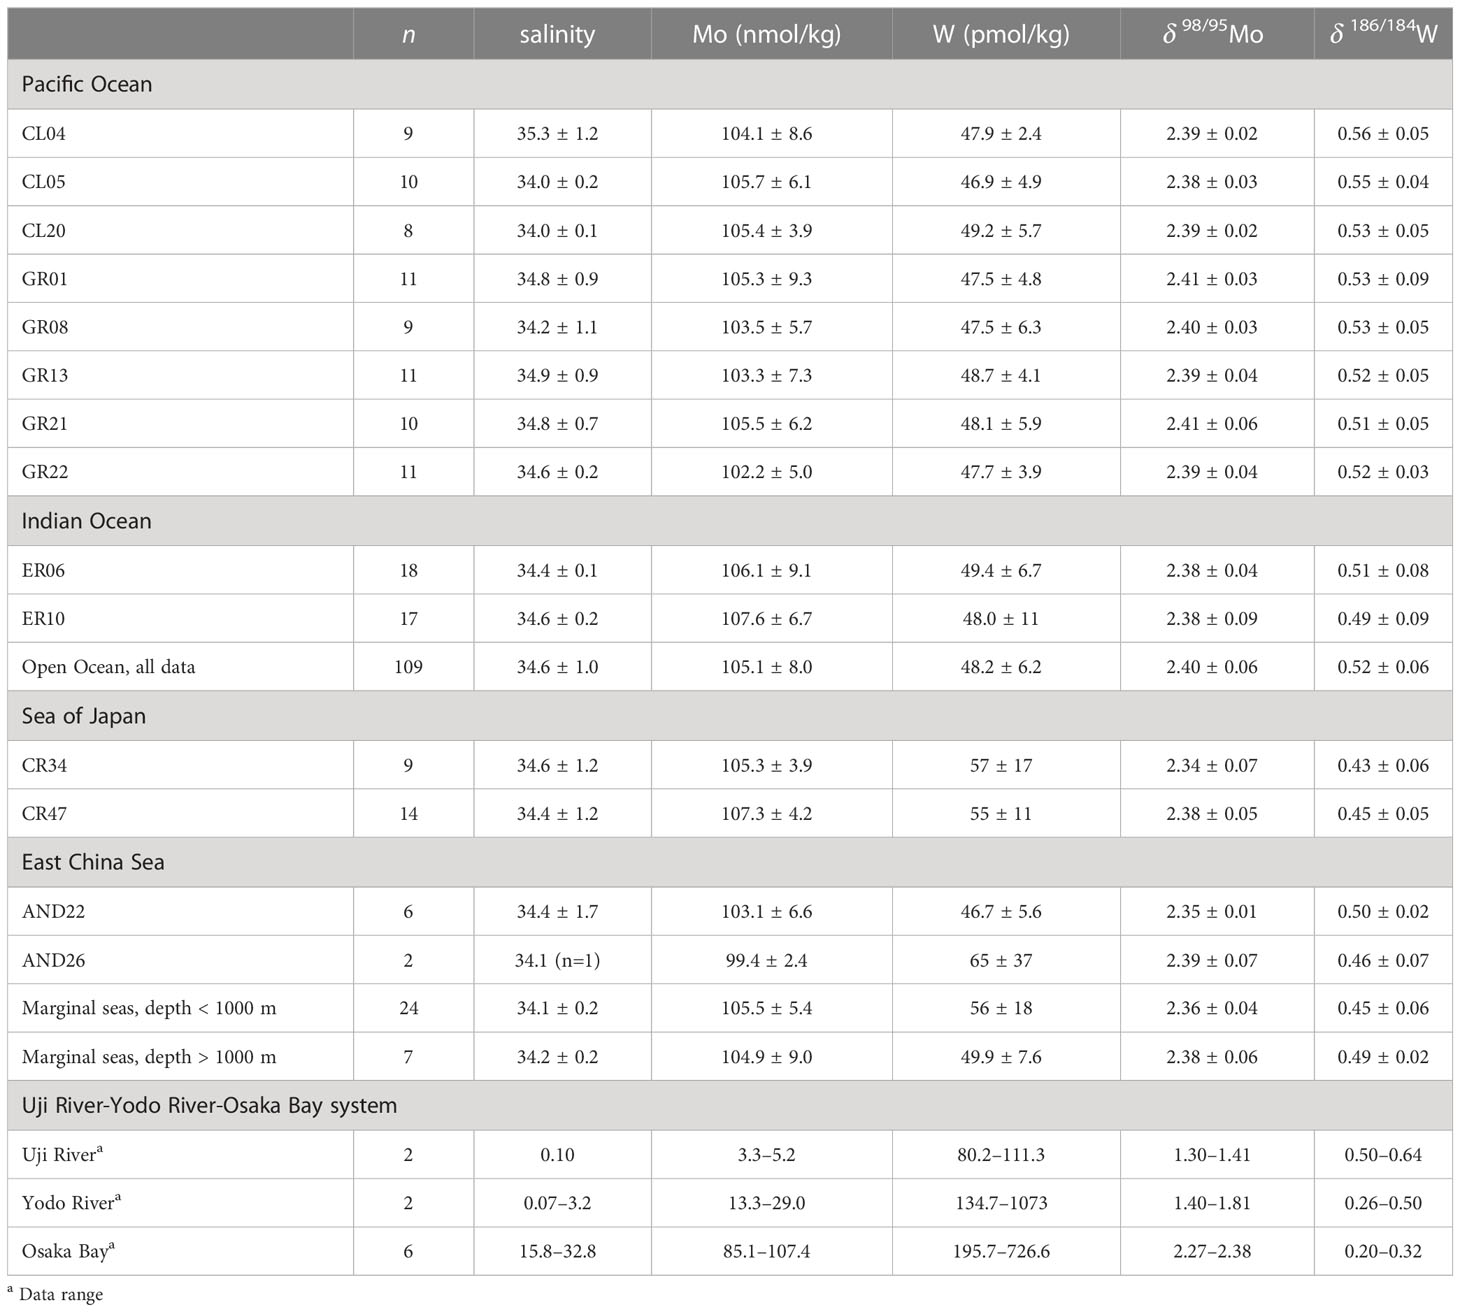
Table 5 Mo and W data in this study (ave ± 2sd).
The vertical profiles of the concentrations and stable isotope ratios of W at the nine stations in the Pacific Ocean and two stations in the Indian Ocean are shown in Figures 2B, D, respectively. The W concentration was 41.6–60.7 pmol/kg and δ186/184W was 0.41–0.60 ‰ (n = 109). The average and standard deviation values at each station and for all oceanic samples are listed in Table 5. Although significantly higher W concentration and significantly lower δ186/184W were found at 2 stations, the other data were within the range of ave ± 2sd of the 11 stations. The total averages of the 11 stations are congruent with recently reported W concentration and δ186/184W (W = 52 ± 4 pmol/kg, δ186/184W = 0.50 ± 0.05 ‰, n = 19) in the North Pacific and Atlantic Oceans (Fujiwara et al., 2020; Kurzweil et al., 2021).
Vertical profiles of the concentrations and stable isotope ratios of Mo at two stations in the East China Sea and two stations in the Sea of Japan are shown in Figures 3A, C, respectively. The Mo concentration was 98.6–111.3 nmol/kg and δ98/95Mo was 2.29–2.45 ‰ (n = 31). The average values in marginal sea water (Mo = 106 ± 3 nmol/kg, δ98/95Mo = 2.37 ± 0.03 ‰, n = 31) agreed with those in the open ocean water within an error range.
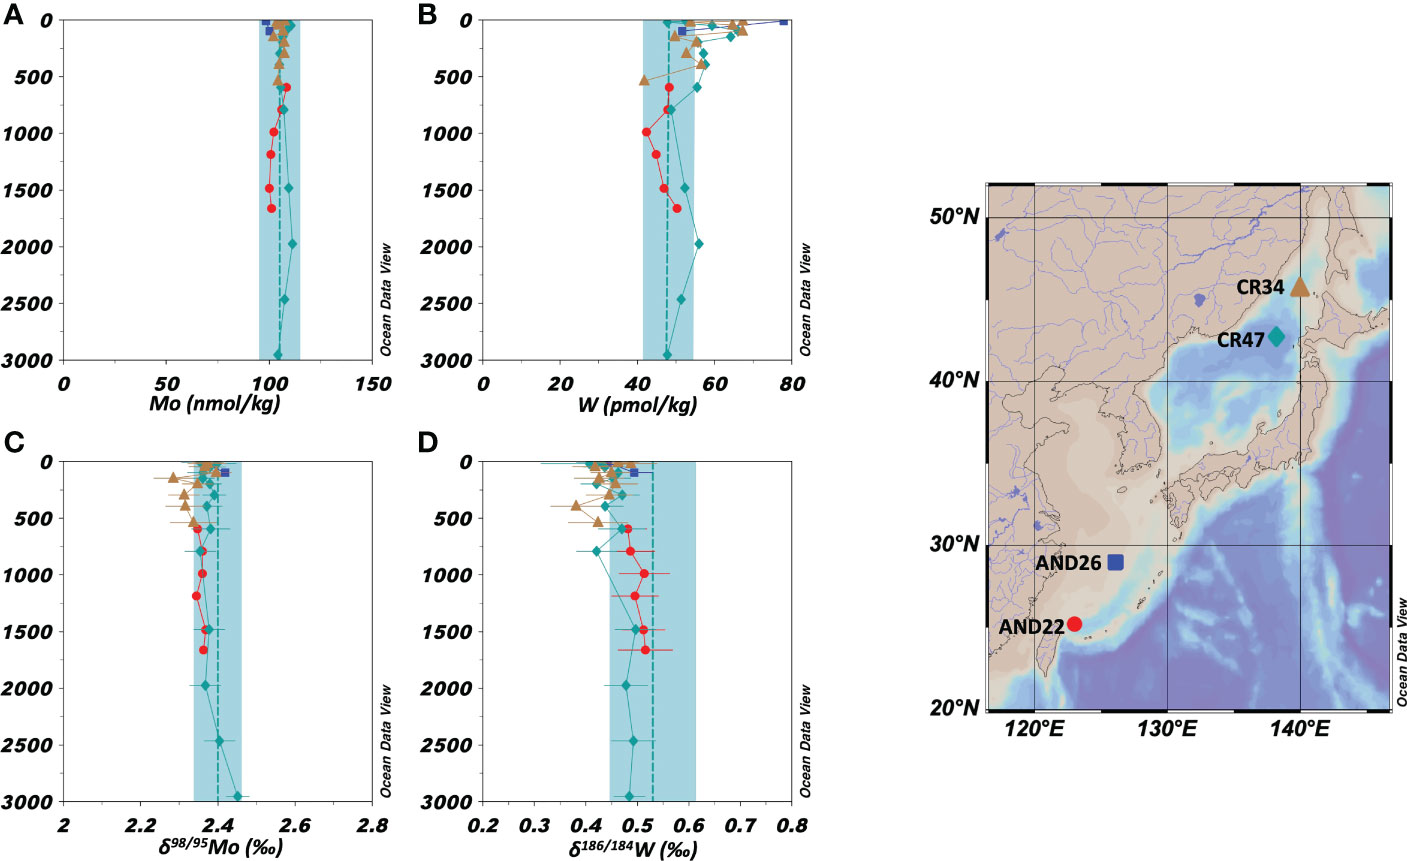
Figure 3 Vertical profiles of the concentrations and isotope ratios of Mo and W in the marginal seas (the East China Sea and the Sea of Japan). The data symbols are consistent with the sampling point symbols on the map. The error bar shows a standard deviation ( ± 1sd). (A): Mo concentration. The blue columns show ranges of ave ± 2sd for all oceanic samples. (B): W concentration. (C): δ98/95Mo. (D): δ186/184W.
Vertical profiles of the concentrations and stable isotope ratios of W at two stations in the East China Sea and two stations in the Sea of Japan are shown in Figures 3B, D, respectively. There was a significant difference between data from depths above 1000 m (upper layer) and those from depths below 1000 m (deeper layer). In the depths below 1000 m, the W concentration was 56 ± 18 pmol/kg (n = 24), being significantly higher than that in the open ocean water, and δ186/184W was 0.45 ± 0.06 ‰ (n = 24), being significantly lower than that in the open ocean water. However, at depths below 1000 m, the W concentration was 50 ± 8 pmol/kg and δ186/184W was 0.49 ± 0.02 ‰ (n = 7), which were congruent with those in the open ocean water.
The range of Mo concentration in the Uji River water in this study (Table 5) included the previously reported value of 4.4 nmol/kg (Firdaus et al., 2008), and the range of Mo concentration in the Yodo River water was within the previously reported range of 2.0–68.6 nmol/kg (Sohrin et al., 1989). The δ98/95Mo values in the Uji and Yodo Rivers water are reported for the first time in this study. The W concentration in the Uji River water in this study was lower than that of 171 pmol/kg reported in the past (Firdaus et al., 2008). The range of W concentrations in the Yodo River water was within the previously reported range of 26–3290 pmol/kg (Sohrin et al., 1989). The δ186/184W values in the Uji and Yodo Rivers water are reported for the first time in this study. Figure 4 compares the Mo and W concentrations in river water between this study and previous studies(Archer and Vance, 2008; Firdaus et al., 2008; Neubert et al., 2011; Yang et al., 2022). The concentrations and isotope ratios of Mo and W in the Uji and Yodo Rivers were slightly higher than those in rivers worldwide.
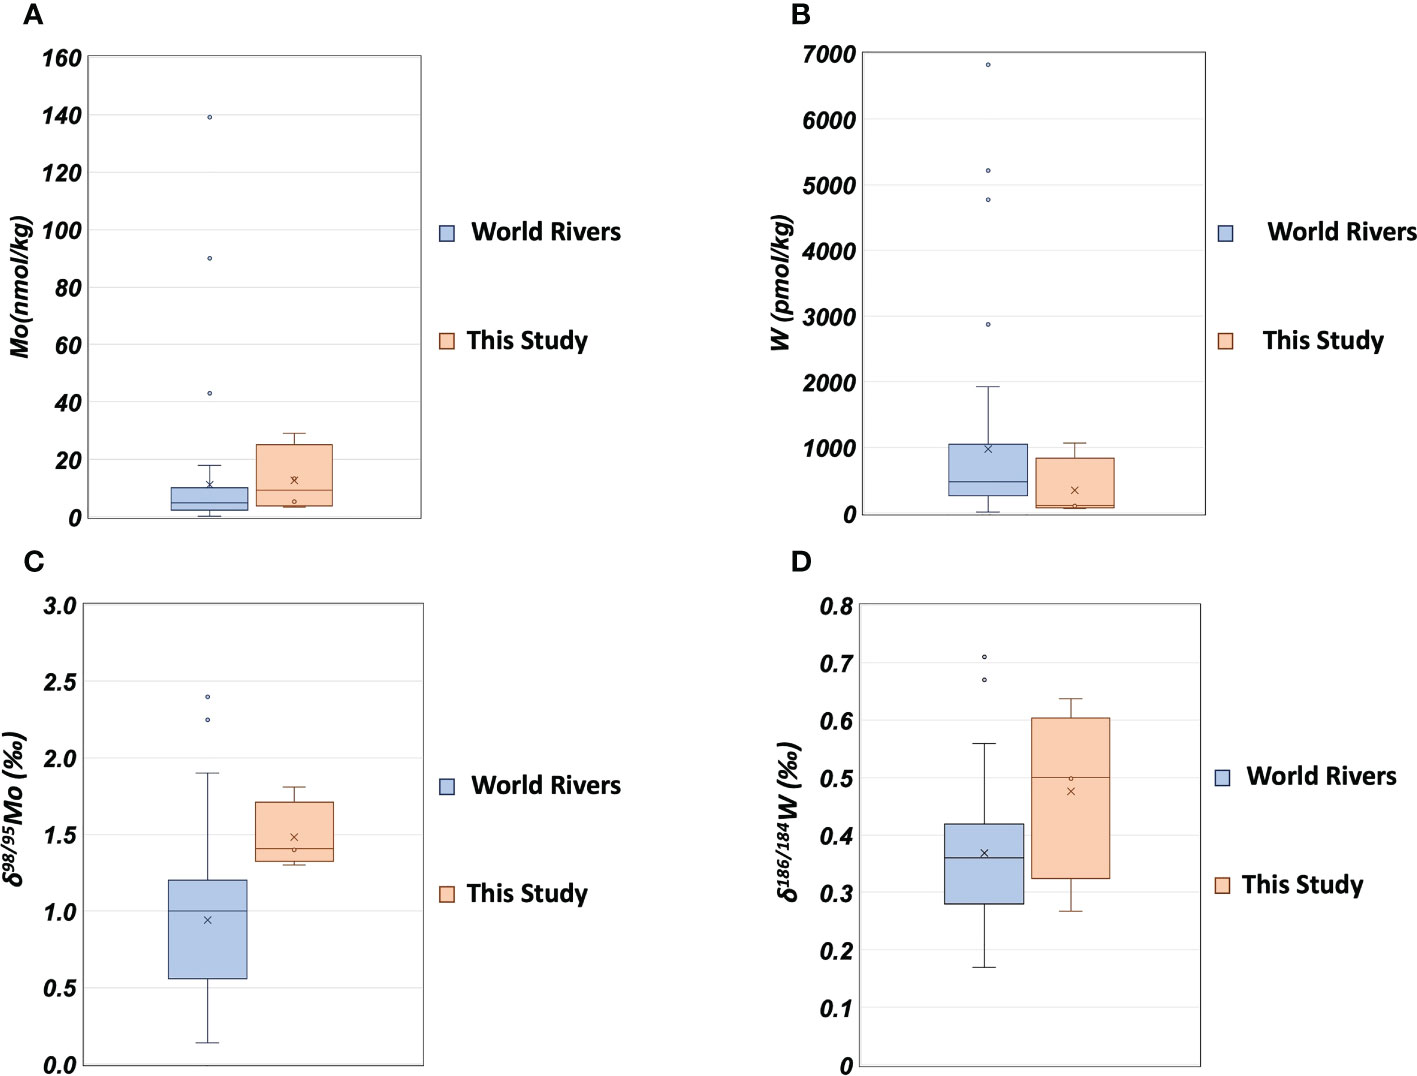
Figure 4 The concentrations and isotope ratios of Mo and W in river water. (A): Mo concentration; blue: world rivers (Archer and Vance, 2008; Firdaus et al., 2008; Neubert et al., 2011), orange: this study. (B): W concentration; blue: world rivers (Firdaus et al., 2008; Yang et al., 2022), orange: this study. (C): δ98/95Mo; blue: world rivers (Archer and Vance, 2008; Neubert et al., 2011), orange: this study. (D): δ186/184W; blue: world rivers (Yang et al., 2022), orange: this study.
4 Discussion
4.1 The Pacific and Indian Oceans
In a previous study (Nakagawa et al., 2012), we reported that δ98/95Mo and Mo concentration in the modern open ocean are uniform, also supported by the data obtained in this study. So far, δ186/184W in the open ocean water has been reported from only two stations in the North Pacific and the South Atlantic (Fujiwara et al., 2020; Kurzweil et al., 2021). The data from the Pacific and Indian Oceans water in this study are congruent with the previous data, indicating δ186/184W is uniform as well as the W concentration in the modern open ocean. Although the uniform distribution of δ186/184W was confirmed at 11 stations in the open ocean, anomalies in δ186/184W were observed in the surface layer at ER06 and around 2000 m depth at ER10 (Figures 2B, D). ER06 was located 530 km from the Indian coast, where high W concentrations and low δ186/184W were observed in the surface water, possibly due to anthropogenic pollution from India. This hypothesis is a deduction of the discussion in sections 4.2-4.3. In contrast, ER10 is located east of the Indian Ocean Central Ridge, and the maxima of Mn and Fe have been reported at depths of 1700–3000 m, which are attributed to a hydrothermal plume (Thi Dieu Vu and Sohrin, 2013). The minimum of δ186/184W appeared at depths of 1240–1980 m, which might be caused by the hydrothermal plume.
4.2 The Uji River-Yodo River-Osaka Bay system
The concentration of Mo varied significantly between the Uji and Yodo Rivers (Figure 5A). The concentration of Mo at Hirakata Harbor on the Yodo River was approximately six times higher than that at Ingen Bridge on the Uji River. δ98/95Mo varied from 1.4 ‰ of the Uji River water to 2.5 ‰ of the open ocean water (Figure S2A). The Mo concentration and δ98/95Mo vary depending on the geology of the river basin, chemical reactions, and biological activities in the river (Neubert et al., 2011). However, since the Uji and Yodo Rivers belong to the same river system, the variations in the Mo concentration and δ98/95Mo suggest the influence of non-natural local sources. As the Yodo River flows through a metropolitan area, possibly it was affected by anthropogenic pollution.
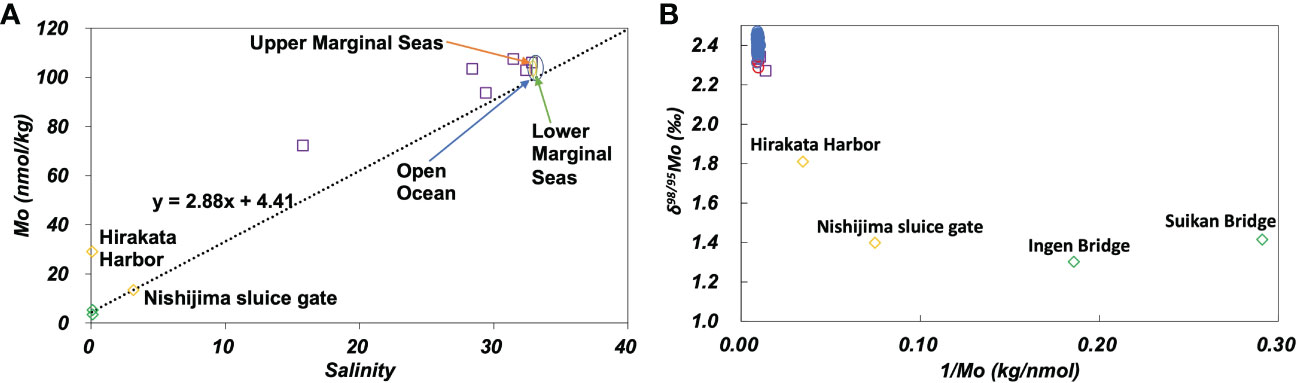
Figure 5 (A): Mo concentration plotted against salinity. The dotted line passes the average of the Uji River and the average of the open ocean. (B): δ98/95Mo plotted against the inverse Mo concentration. Green diamonds: the Uji River, yellow diamonds: the Yodo River, purple squares: Osaka Bay, blue circles: the open ocean, red circles: marginal seas.
In the plot of the Mo concentration against salinity (Figure 5A), the Mo concentrations in the Yodo River (Hirakata Harbor) and Osaka Bay were significantly higher than those on the mixing line with the end members of the Uji River and open ocean waters. These anomalies may be attributed to the anthropogenic contamination of Mo. However, concentration anomalies were not observed at Nishijima Sluice Gate, Yodo River (Figure 5A). On the plot of δ98/95Mo against the inverse Mo concentration (Figure 5B), the data of Osaka Bay were plotted close to those of the ocean. The data from the Uji and Yodo Rivers showed substantial variation. This plot cannot be explained by the mixing of the Uji River and Osaka Bay waters. This indicates that the distribution of the Mo concentration and δ98/95Mo in the Uji River-Yodo River-Osaka Bay system were affected by various factors other than simple mixing. One possibility is that multiple anthropogenic sources with different Mo concentrations and δ98/95Mo. Another possibility is that local anoxia occurs in the Uji River-Yodo River-Osaka Bay system, which functions as a local sink for Mo.
We compared the Mo concentration and δ98/95Mo in Osaka Bay with those of estuaries of the Narmada River, the Tapi River (India), and the Itchen River (UK) (Archer and Vance, 2008; Rahaman et al., 2014). The Mo concentration is plotted against salinity in Figure S3A and δ98/95Mo is plotted against the inverse Mo concentration in Figure S3B. For samples with the same salinity, the Mo concentrations in the Narmada and Tapi Rivers were lower than those in Osaka Bay. The Mo concentrations in the Itchen River at salinity > 30 were similar to those in Osaka Bay. The δ98/95Mo in Osaka Bay were congruent with those of samples with high Mo concentrations in the Narmada, Tapi, and Itchen Rivers (Figure S2B). The effect of anthropogenic pollution on Mo is not clear from these data.
The variations in the W concentration and δ186/184W in the Uji River-Yodo River-Osaka Bay system were substantial. As well as the case of Mo, this may be due to anthropogenic pollution. Data on δ186/184W from nine Asian rivers have been reported in a previous study (Yang et al., 2022) (Figure 4D). However, the effects of anthropogenic pollution on W have not been explicitly discussed.
In the plot of W concentration against salinity (Figure 6A), data from the Yodo River (Hirakata Harbor) and Osaka Bay plotted at substantially higher positions than the mixing line with end members of the Uji River and open ocean water. δ186/184W of the Yodo River and Osaka Bay was significantly lower than that of the Uji River and the open ocean (Figure 6B). These results are probably due to anthropogenic pollution as well as pollution of Mo. On the plot of δ186/184W versus the inverse W concentration (Figure 6B), all data from the Uji River, Yodo River, and Osaka Bay show a linear relationship:
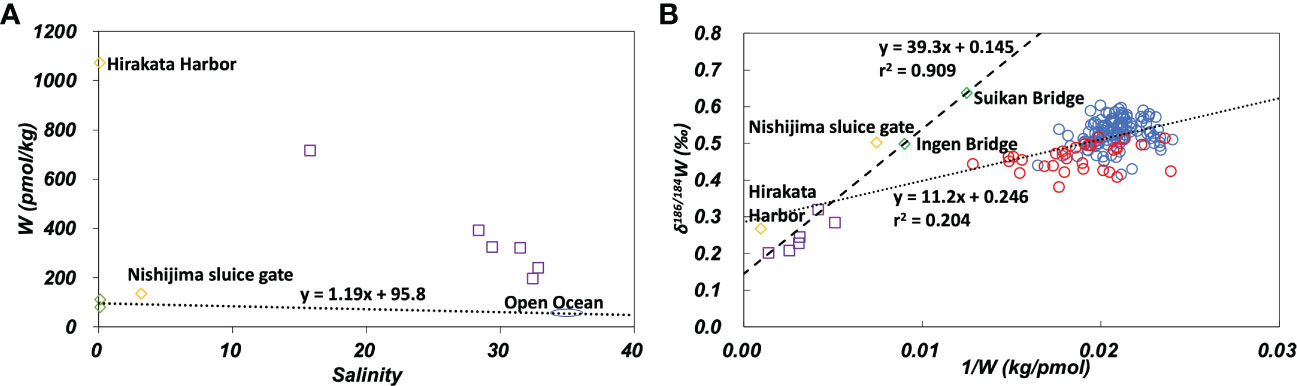
Figure 6 (A): W concentration plotted against salinity. The dotted line passes the average of the Uji River and the average of the open ocean. (B): δ186/184W plotted against the inverse W concentration. The dashed line is the regression line (eq. 3) for data of the Uji River-Yodo River-Osaka Bay system. The dotted line is the regression line (eq. 4) for the open ocean and marginal seas data. Green diamonds: the Uji River, yellow diamonds: the Yodo River, purple squares: Osaka Bay, blue circles: the open ocean, red circles: marginal seas.
This indicates that the concentration and isotope ratio of W in the Uji River-Yodo River-Osaka Bay system can be explained by the mixing of Uji River water and an anthropogenic source. The anthropogenic source endmember is distinct from open ocean water. In previous studies, the analysis of W concentration suggested the influence of anthropogenic W pollution in the Yodo River (Sohrin et al., 1989). The analysis of stable isotope ratios in this study confirmed the possibility of anthropogenic pollution of W in the Yodo River and Osaka Bay (Figures 6 and S2B). Further observations of the river and estuarine water in the Yodo River-Osaka Bay system are needed to understand the detailed mechanism of anthropogenic pollution.
4.3 The East China and Japan Seas
The Mo concentration and δ98/95Mo in the East China Sea and the Sea of Japan were not significantly different from those in the open ocean. Therefore, it is considered that anthropogenic Mo pollution has little influence on the East China Sea and the Sea of Japan.
In contrast, the W concentration in the surface water of the marginal seas was significantly higher than that of the open ocean water (Figure 3B), and δ186/184W was significantly lower than that of the open ocean water (Figure 3D). At station AND 26 in the East China Sea at a depth of 11 m, the W concentration reached 78 pmol/kg and δ186/184W was 0.44. In the Sea of Japan, anomalies in W concentration and δ186/184W extended from the surface to a depth of approximately 1000 m. In the deeper layers, the W concentration and δ186/184W were congruent with those in the open ocean water. This indicates that anthropogenic W did not significantly reach the deep water. The vertical profile of W in the Sea of Japan is similar to that of chlorofluorocarbons, which are anthropogenic pollutants (Tsunogai et al., 2003). The surface water of the Sea of Japan is mainly formed from warm, low-density seawater carried by the Tsushima Current and mixes slowly with deep water. However, when cold water carried by the Liman Current is strongly cooled in winter once every few decades, convection reaches the bottom of the Sea of Japan. Convection was most recently observed in 2001 when chlorofluorocarbons were transported to the bottom water (Tsunogai et al., 2003). However, this convection was not sufficiently large to eliminate the differences in the concentrations of chlorofluorocarbons between the upper and lower layers. Therefore, it is likely that anthropogenic W was introduced into the Sea of Japan concurrently with chlorofluorocarbons primarily after 1950.
All the data from the open ocean and marginal seas in this study are plotted in Figure 6B. The data show weak linearity.
One end member of this line is open ocean water. The other end member is located near Osaka Bay. This suggests that a similar anthropogenic W endmember can explain the distribution of W in the marginal seas as well as the Uji River-Yodo River-Osaka Bay system.
The data in this study are compared with data from the Yangtze River and the South China Sea (Kurzweil et al., 2021; Yang et al., 2022) on the plot of δ186/184W vs. 1/W in Figure 7. The dotted line in Figure 7 represents the regression line of eq. (4) in Figure 6B. Data from the South China sea are plotted along this regression line. This suggests that the influence of anthropogenic W is similar in the Sea of Japan, the East China Sea, and the South China Sea. Data from the Yangtze River estuary are plotted above the regression line. It has been suggested that the Yangtze River estuary is affected by the contribution of benthic W reflux from estuarine sediments (Yang et al., 2022). Figure 7 suggests that the anthropogenic endmember of W for the Sea of Japan, East China Sea, and South China Sea has intermediate characteristics between those of Osaka Bay and the Yangtze River estuary.
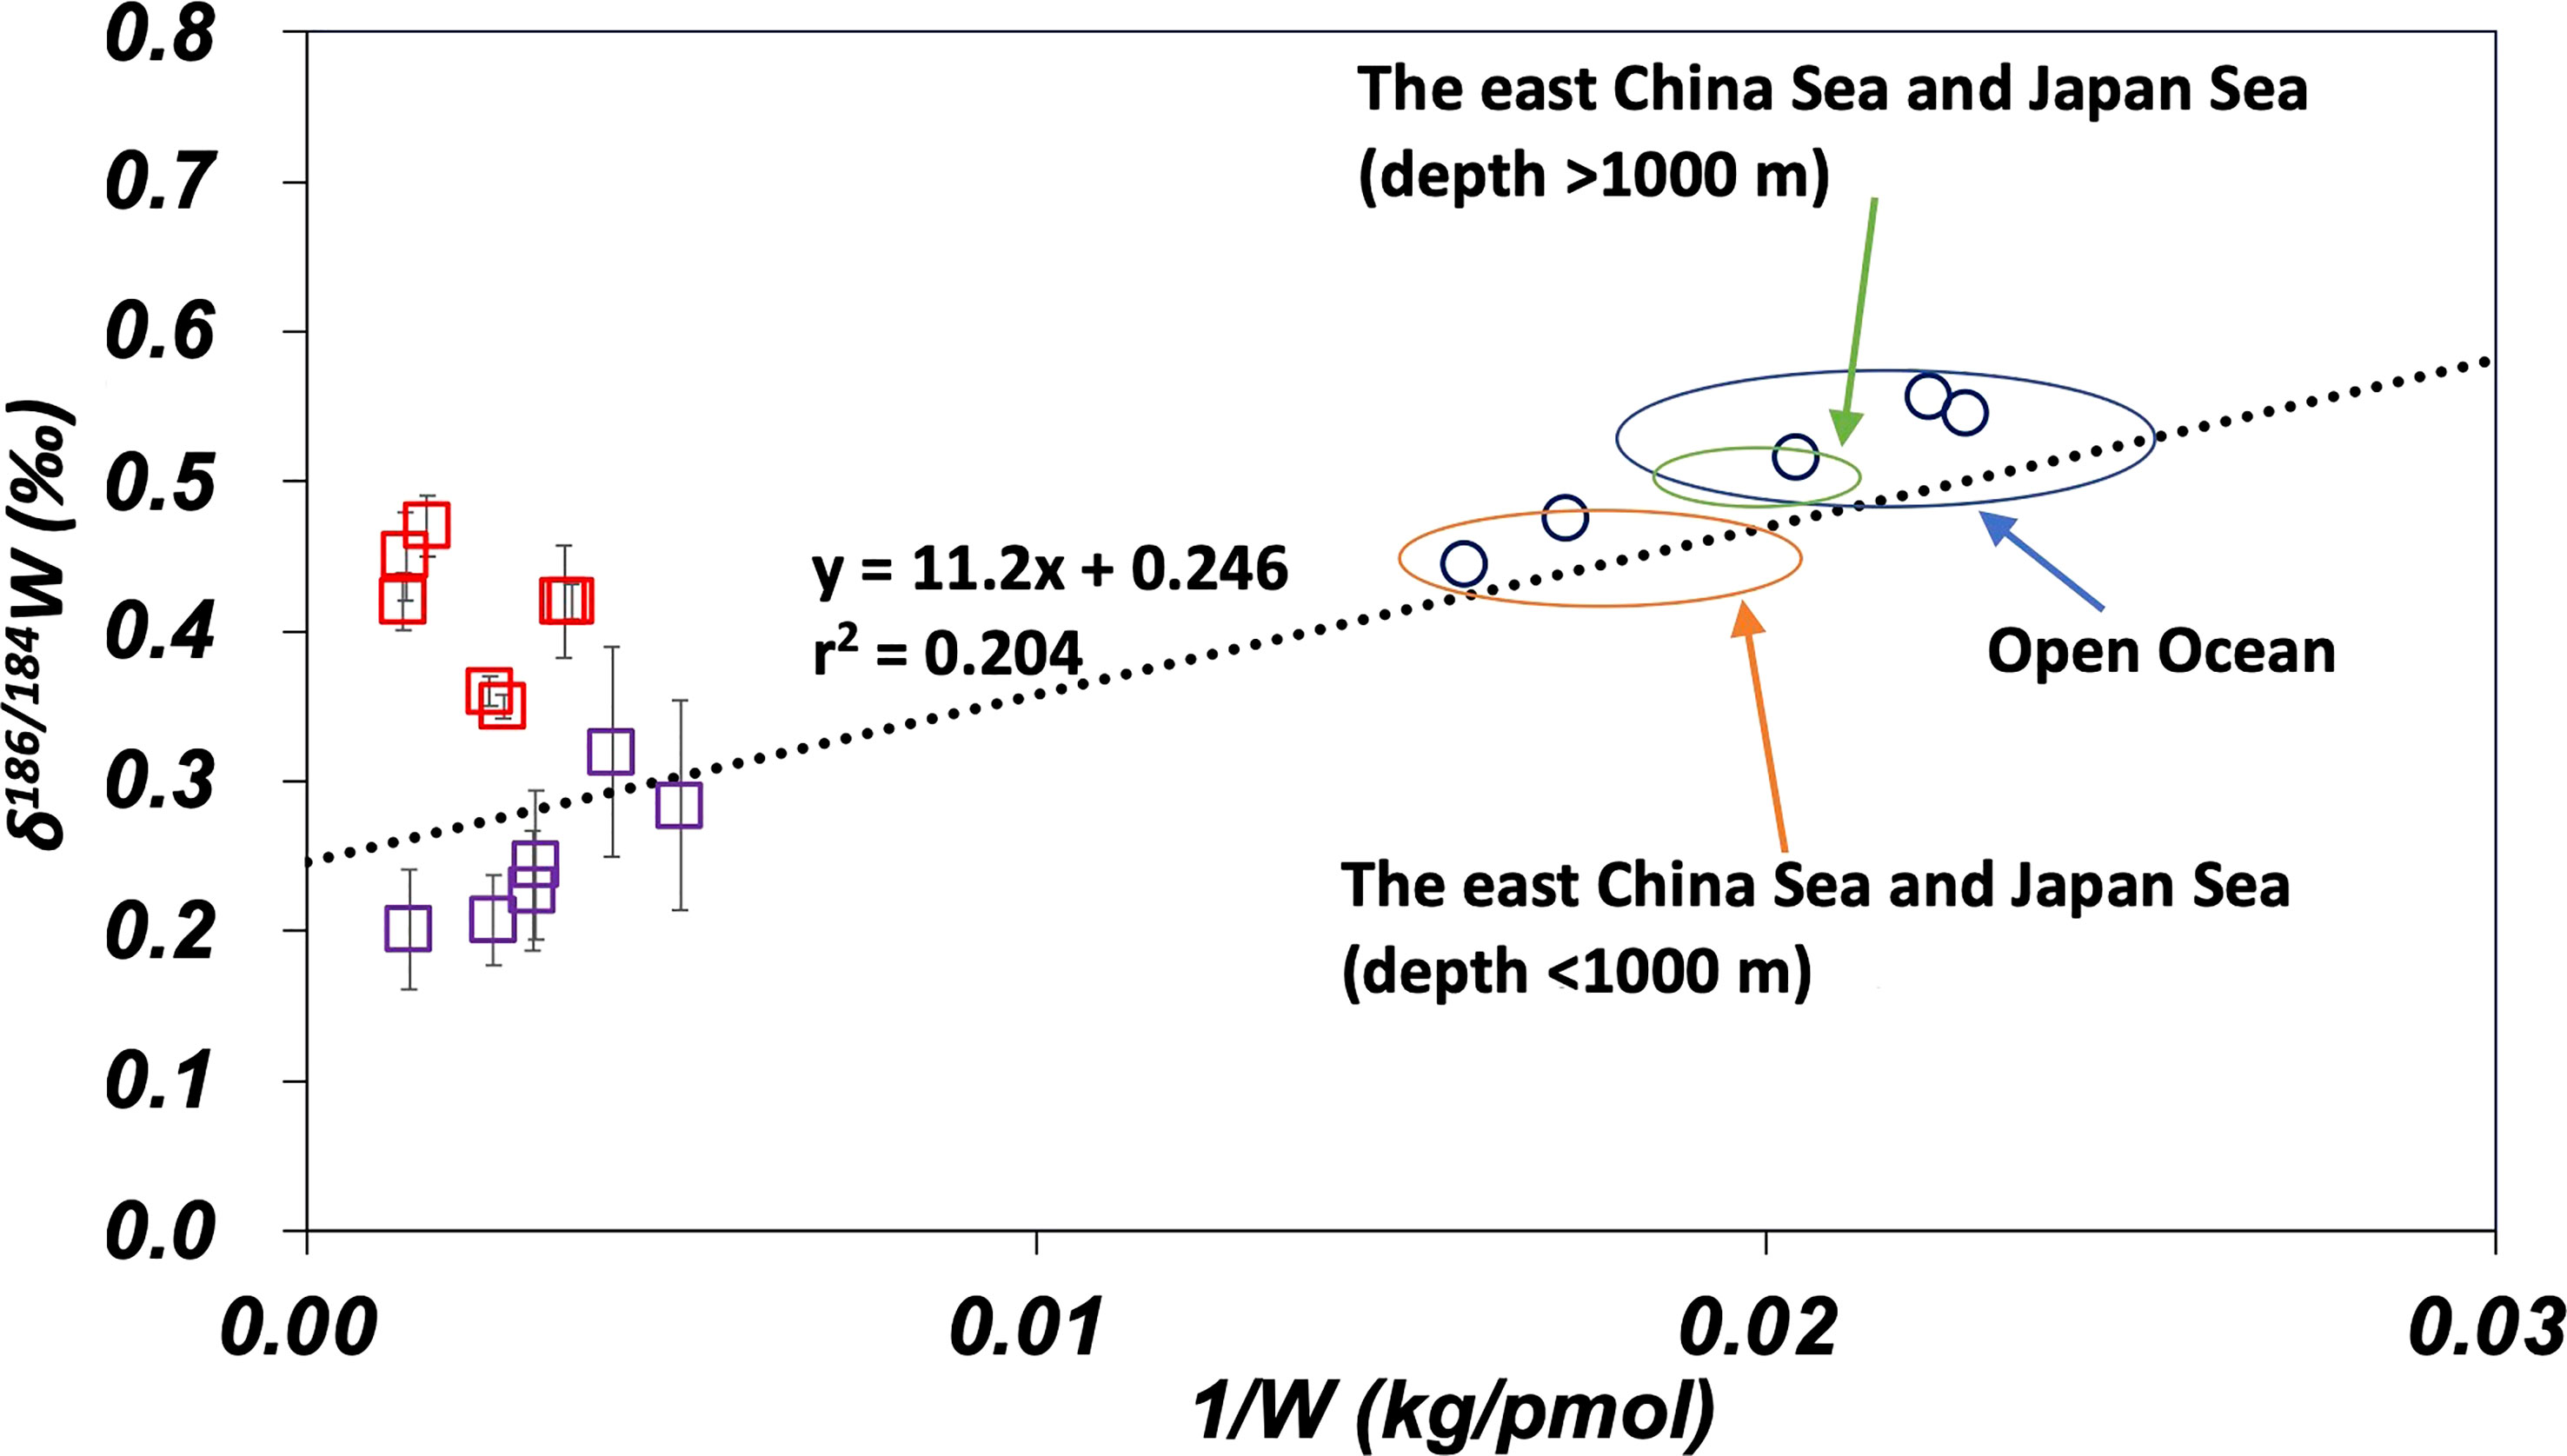
Figure 7 Comparison of W data of this study with literature on the plot of δ186/184W vs. 1/W. The dotted line is the regression line (eq. 4) for the open ocean and marginal seas data. The error bar shows a standard deviation ( ± 1sd). Purple squares: Osaka Bay, red squares: the Yangtze River estuary (Yang et al., 2022), and blue circles: the South China Sea (Kurzweil et al., 2021).
5 Conclusions
In the Pacific and Indian Oceans, a uniform distribution of δ186/184W was observed in addition to the uniformity of the concentrations of Mo and W, and δ98/95Mo, which has already been reported in the literature. In the Indian Ocean, some small anomalies in δ186/184W were observed, possibly because of the influence of anthropogenic pollution and hydrothermal plumes. The high concentrations of Mo and W observed in the Yodo River water were attributed to anthropogenic pollution, whereas the effect of anthropogenic pollution was small in the Uji River. The δ186/184W data are useful for understanding the sources of W in water samples. For the Uji River-Yodo River-Osaka Bay system, the δ98/95Mo vs. 1/Mo plot suggests multiple sources and sinks. However, the δ186/184W vs. 1/W plot indicates a simple mixing with the Uji River water and an anthropogenic source. Further analysis is required to understand the exact mechanisms controlling the distributions of Mo and W in this system. In the marginal seas (the East China Sea and the Sea of Japan), the Mo concentration and δ98/95Mo are congruent with those in the open ocean. However, significantly high W concentration and low δ186/184W occur in surface and upper water, which is attributed to the anthropogenic contamination of W. The extrapolated anthropogenic endmember has the W concentration and δ186/184W that closely resemble those in water samples from the Yangtze River estuary and Osaka Bay. As far as we know, the effects of anthropogenic pollution of W in an estuary and marginal seas are clearly shown for the first time in this study.
Data availability statement
The original contributions presented in the study are included in the article/Supplementary Material. Further inquiries can be directed to the corresponding author.
Author contributions
KM performed the analyses and drafted the original manuscript. TT improved the analytical method and performed the analyses. ST supervised the analyses. YS designed the study and reviewed the manuscript. All authors contributed to the article and approved the submitted version.
Funding
This study was supported by the KAKENHI grants (15H01727 and 19H01148 to YS) from the Japan Society for the Promotion of Science (JSPS).
Acknowledgments
The authors thank the crew, technicians, students, and scientists onboard the scientific research vessel Hakuho Maru cruises KH-09-5, KH-10-2, KH-14-6, KH-15-3, and KH-17-3 for their assistance with the sampling and analysis of routine data. Prof. Yuzuru Nakagawa is acknowledged for providing Osaka Bay samples. The Neptune Plus MC-ICP-MS (Thermo Fisher Scientific) used in this study is a joint facility at the Research Institute for Humanity and Nature (RIHN), Japan. We thank Dr. Ki-Cheol Shin who provided technical advice regarding the MC-ICP-MS measurements.
Conflict of interest
The authors declare that the research was conducted in the absence of any commercial or financial relationships that could be construed as a potential conflict of interest.
Publisher’s note
All claims expressed in this article are solely those of the authors and do not necessarily represent those of their affiliated organizations, or those of the publisher, the editors and the reviewers. Any product that may be evaluated in this article, or claim that may be made by its manufacturer, is not guaranteed or endorsed by the publisher.
Supplementary material
The Supplementary Material for this article can be found online at: https://www.frontiersin.org/articles/10.3389/fmars.2023.1182668/full#supplementary-material
References
Anbar A. D., Rouxel O. (2007). Metal stable isotopes in paleoceanography. Annu. Rev. Earth Planet Sci. 35, 717–746. doi: 10.1146/annurev.earth.34.031405.125029
Archer C., Vance D. (2008). The isotopic signature of the global riverine molybdenum flux and anoxia in the ancient oceans. Nat. Geosci. 1 (9), 597–600. doi: 10.1038/ngeo282
Barling J., Anbar A. D. (2004). Molybdenum isotope fractionation during adsorption by manganese oxides. Earth Planet. Sci. Lett. 217 (3-4), 315–329. doi: 10.1016/s0012-821x(03)00608-3
Barling J., Arnold G. L., Anbar A. D. (2001). Natural mass-dependent variations in the isotopic composition of molybdenum. Earth Planet. Sci. Lett. 193 (3-4), 447–457. doi: 10.1016/s0012-821x(01)00514-3
Bertine K. K., Turekian K. K. (1973). Molybdenum in marine deposits. Geochim. Cosmochim. Acta 37 (6), 1415–1434. doi: 10.1016/0016-7037(73)90080-x
Collier R. W. (1985). Molybdenum in the northeast pacific ocean. Limnol. Oceanogr. 30 (6), 1351–1354. doi: 10.4319/lo.1985.30.6.1351
Cui M. M., Luther G. W., Gomes M. (2021). Cycling of W and Mo species in natural sulfidic waters and their sorption mechanisms on MnO2 and implications for paired W and Mo records as a redox proxy. Geochim. Cosmochim. Acta 295, 24–48. doi: 10.1016/j.gca.2020.12.007
De Laeter J. R., Bohlke J. K., De Bievre P., Hidaka H., Peiser H. S., Rosman K. J. R., et al. (2003). Atomic weights of the elements: review 2000 - (IUPAC technical report). Pure Appl. Chem. 75 (6), 683–800. doi: 10.1351/pac200375060683
Emerson S. R., Huested S. S. (1991). Ocean anoxia and the concentrations of molybdenum and vanadium in seawater. Mar. Chem. 34 (3-4), 177–196. doi: 10.1016/0304-4203(91)90002-E
Firdaus M. L., Norisuye K., Nakagawa Y., Nakatsuka S., Sohrin Y. (2008). Dissolved and labile particulate zr, hf, Nb, Ta, Mo and W in the Western north pacific ocean. J. Oceanogr. 64 (2), 247–257. doi: 10.1007/s10872-008-0019-z
Firdaus M. L., Norisuye K., Sato T., Urushihara S., Nakagawa Y., Umetani S., et al. (2007). Preconcentration of zr, hf, Nb, Ta and W in seawater using solid-phase extraction on TSK-8-hydroxyquinoline resin and determination by inductively coupled plasma-mass spectrometry. Anal. Chim. Acta 583 (2), 296–302. doi: 10.1016/j.aca.2006.10.033
Fujiwara Y., Tsujisaka M., Takano S., Sohrin Y. (2020). Determination of the tungsten isotope composition in seawater: the first vertical profile from the western north pacific ocean. Chem. Geol. 555, 1–9. doi: 10.1016/j.chemgeo.2020.119835
Goldberg T., Archer C., Vance D., Poulton S. W. (2009). Mo Isotope fractionation during adsorption to fe (oxyhydr)oxides. Geochim. Cosmochim. Acta 73 (21), 6502–6516. doi: 10.1016/j.gca.2009.08.004
Helz G. R., Miller C. V., Charnock J. M., Mosselmans J. F. W., Pattrick R. A. D., Garner C. D., et al. (1996). Mechanism of molybdenum removal from the sea and its concentration in black shales: EXAFS evidence. Geochim. Cosmochim. Acta 60 (19), 3631–3642. doi: 10.1016/0016-7037(96)00195-0
Irisawa K., Hirata T. (2006). Tungsten isotopic analysis on six geochemical reference materials using multiple collector-ICP-mass spectrometry coupled with a rhenium-external correction technique. J. Anal. At. Spectrom. 21 (12), 1387–1395. doi: 10.1039/b607945h
Ishibashi J.-i., Urabe T. (1995). Hydrothermal activity related to arc-backarc magmatism in the western pacific. Backarc basins: tectonics magmatism, 451–495. doi: 10.1007/978-1-4615-1843-3_13
Kashiwabara T., Kubo S., Tanaka M., Senda R., Iizuka T., Tanimizu M., et al. (2017). Stable isotope fractionation of tungsten during adsorption on fe and Mn (oxyhydr) oxides. Geochim. Cosmochim. Acta 204, 52–67. doi: 10.1016/j.gca.2017.01.031
Kashiwabara T., Takahashi Y., Marcus M. A., Uruga T., Tanida H., Terada Y., et al. (2013). Tungsten species in natural ferromanganese oxides related to its different behavior from molybdenum in oxic ocean. Geochim. Cosmochim. Acta 106, 364–378. doi: 10.1016/j.gca.2012.12.026
Kishida K., Sohrin Y., Okamura K., Ishibachi J. (2004). Tungsten enriched in submarine hydrothermal fluids. Earth Planet. Sci. Lett. 222 (3-4), 819–827. doi: 10.1016/j.epsl.2004.03.034
Kurzweil F., Archer C., Wille M., Schoenberg R., Munker C., Dellwig O. (2021). Redox control on the tungsten isotope composition of seawater. Proc. Natl. Acad. Sci. U.S.A. 118 (18), 1–6. doi: 10.1073/pnas.2023544118
Li Y.-H. (2000). A compendium of geochemistry: from solar nebula to the human brain (Princeton, USA:Princeton University Press).
Nagler T. F., Anbar A. D., Archer C., Goldberg T., Gordon G. W., Greber N. D., et al. (2014). Proposal for an international molybdenum isotope measurement standard and data representation. Geostand. Geoanal. Res. 38 (2), 149–151. doi: 10.1111/j.1751-908X.2013.00275.x
Nägler T., Neubert N., Böttcher M., Dellwig O., Schnetger B. (2011). Molybdenum isotope fractionation in pelagic euxinia: evidence from the modern black and Baltic seas. Chem. Geol. 289 (1-2), 1–11. doi: 10.1016/j.chemgeo.2011.07.001
Nakagawa Y., Takano S., Firdaus M. L., Norisuye K., Hirata T., Vance D., et al. (2012). The molybdenum isotopic composition of the modern ocean. Geochem. J. 46 (2), 131–141. doi: 10.2343/geochemj.1.0158
Neubert N., Heri A. R., Voegelin A. R., Nagler T. F., Schlunegger F., Villa I. M. (2011). The molybdenum isotopic composition in river water: constraints from small catchments. Earth Planet. Sci. Lett. 304 (1-2), 180–190. doi: 10.1016/j.epsl.2011.02.001
Pattan J., Pearce N. J. G. (2009). Bottom water oxygenation history in southeastern Arabian Sea during the past 140 ka: results from redox-sensitive elements. Palaeogeogr. Palaeoclimatol. Palaeoecol. 280 (3-4), 396–405. doi: 10.1016/j.palaeo.2009.06.027
Rahaman W., Goswami V., Singh S. K., Rai V. K. (2014). Molybdenum isotopes in two Indian estuaries: mixing characteristics and input to oceans. Geochim. Cosmochim. Acta 141, 407–422. doi: 10.1016/j.gca.2014.06.027
Rimmer S. M. (2004). Geochemical paleoredox indicators in Devonian–Mississippian black shales, central Appalachian basin (USA). Chem. Geol. 206 (3-4), 373–391. doi: 10.1016/j.chemgeo.2003.12.029
Shimmield G. B., Price N. B. (1986). The behaviour of molybdenum and manganese during early sediment diagenesis — offshore Baja California, Mexico. Mar. Chem. 19 (3), 261–280. doi: 10.1016/0304-4203(86)90027-7
Siebert C., Nagler T. F., von Blanckenburg F., Kramers J. D. (2003). Molybdenum isotope records as a potential new proxy for paleoceanography. Earth Planet. Sci. Lett. 211 (1-2), 159–171. doi: 10.1016/s0012-821x(03)00189-4
Sohrin Y., Bruland K. W. (2011). Global status of trace elements in the ocean. Trac-Trends Anal. Chem. 30 (8), 1291–1307. doi: 10.1016/j.trac.2011.03.006
Sohrin Y., Isshiki K., Kuwamoto T., Nakayama E. (1987). Tungsten in north pacific waters. Mar. Chem. 22 (1), 95–103. doi: 10.1016/0304-4203(87)90051-x
Sohrin Y., Isshiki K., Nakayama E., Kihara S., Matsui M. (1989). Simultaneous determination of tungsten and molybdenum in Sea-water by catalytic current polarography after preconcentration on a resin column. Anal. Chim. Acta 218 (1), 25–35. doi: 10.1016/s0003-2670(00)80279-2
Sohrin Y., Matsui M., Nakayama E. (1999). Contrasting behavior of tungsten and molybdenum in the Okinawa trough, the East China Sea and the yellow Sea. Geochim. Cosmochim. Acta 63 (19-20), 3457–3466. doi: 10.1016/s0016-7037(99)00273-2
Thi Dieu Vu H., Sohrin Y. (2013). Diverse stoichiometry of dissolved trace metals in the Indian ocean. Sci. Rep. 3 (1), 1–5. doi: 10.1038/srep01745
Tribovillard N., Algeo T. J., Lyons T., Riboulleau A. (2006). Trace metals as paleoredox and paleoproductivity proxies: an update. Chem. Geol. 232 (1-2), 12–32. doi: 10.1016/j.chemgeo.2006.02.012
Tsujisaka M., Takano S., Murayama M., Sohrin Y. (2019). Precise analysis of the concentrations and isotopic compositions of molybdenum and tungsten in geochemical reference materials. Anal. Chim. Acta 1091, 146–159. doi: 10.1016/j.aca.2019.09.003
Tsunogai S., Kawada K., Watanabe S., Aramaki T. (2003). CFC Indicating renewal of the Japan Sea deep water in winter 2000–2001. J. Oceanogr. 59 (5), 685–693. doi: 10.1023/B:JOCE.0000009597.33460.d7
Willbold M., Elliott T. (2017). Molybdenum isotope variations in magmatic rocks. Chem. Geol. 449, 253–268. doi: 10.1016/j.chemgeo.2016.12.011
Wong M. Y., Rathod S. D., Marino R., Li L. L., Howarth R. W., Alastuey A., et al. (2021). Anthropogenic perturbations to the atmospheric molybdenum cycle. Glob. Biogeochem. Cycles 35 (2), 1–25. doi: 10.1029/2020gb006787
Keywords: molybdenum, tungsten, isotopic composition, anthropogenic pollution, GEOTRACES
Citation: Matsuoka K, Tatsuyama T, Takano S and Sohrin Y (2023) Distribution of stable isotopes of Mo and W from a river to the ocean: signatures of anthropogenic pollution. Front. Mar. Sci. 10:1182668. doi: 10.3389/fmars.2023.1182668
Received: 09 March 2023; Accepted: 03 April 2023;
Published: 20 April 2023.
Edited by:
Hermano Melo Queiroz, University of São Paulo, BrazilReviewed by:
Yanbin Li, Ocean University of China, ChinaChen-Feng You, National Cheng Kung University, Taiwan
Copyright © 2023 Matsuoka, Tatsuyama, Takano and Sohrin. This is an open-access article distributed under the terms of the Creative Commons Attribution License (CC BY). The use, distribution or reproduction in other forums is permitted, provided the original author(s) and the copyright owner(s) are credited and that the original publication in this journal is cited, in accordance with accepted academic practice. No use, distribution or reproduction is permitted which does not comply with these terms.
*Correspondence: Kohei Matsuoka, bWF0c3Vva2Eua291aGVpLjU2c0BzdC5reW90by11LmFjLmpw