 Hyung Jeek Kim1
 Dongseon Kim2
 Young-Gyu Park3
 Jong-Yeon Park4
 Ki-Young Choi2
 Joon Sang Park5
 Sung Min An6
 Kyungman Kwon1
 Jae Hoon Noh7
 Jeomshik Hwang8*
- 1Tropical & Subtropical Research Center, Korea Institute of Ocean Science & Technology, Jeju, Republic of Korea
- 2Marine Environmental Research Department, Korea Institute of Ocean Science & Technology, Busan, Republic of Korea
- 3Ocean Circulation and Climate Research Department, Korea Institute of Ocean Science & Technology, Busan, Republic of Korea
- 4Department of Earth and Environmental Sciences, Jeonbuk National University, Jeonju, Republic of Korea
- 5Library of Marine Samples, Korea Institute of Ocean Science & Technology, Geoje, Republic of Korea
- 6Department of Microbial Resources, National Marine Biodiversity Institute of Korea, Seocheon, Republic of Korea
- 7Ocean Climate Response & Ecosystem Research Department, Korea Institute of Ocean Science & Technology, Busan, Republic of Korea
- 8School of Earth and Environmental Sciences/Research Institute of Oceanography, Seoul National University, Seoul, Republic of Korea
We examined the flux and composition of sinking particles collected at a water depth of 800 m in the northwest Pacific from November 2017 to August 2018 to assess the impact of dust deposition on organic carbon export. The fluxes of total particulate matter and particulate organic carbon averaged over the study period were 88 ± 63 mg m-2 d-1 and 9.0 ± 5.8 mg m−2 d−1, respectively. Biogenic particles accounted for 82% of the sinking particles, on average. There were two notable pulses in the particle fluxes of both biogenic and lithogenic material in February and May 2018. These flux peaks were decoupled from net primary production in the surface waters but coincided with intervals of high rates of atmospheric dust deposition. The biogenic component of the two peaks was dominated by two different phytoplankton communities, which may have influenced carbon export efficiency. Correlations between the sinking particle flux and the lithogenic flux are found at several locations in the northwest Pacific, implying that East Asian dust deposition has a prevalent influence on the biological pump. Attention should be paid to the effects of changes in the continental dust supply to the oceans on oceanic carbon export.
1 Introduction
The ocean mainly sequesters atmospheric CO2 via the biological pump (Sabine et al., 2004; Buesseler et al., 2020; Omand et al., 2020). The North Pacific subtropical/subarctic boundary region (30°N−40°N) accounts for ~25% of the annual oceanic sink of atmospheric CO2 (Takahashi et al., 2002; Takahashi et al., 2009; Ayers and Lozier, 2012). However, CO2 absorption in this region fluctuates seasonally, with the region being a strong sink in winter–spring and a weak source in summer (Takahashi et al., 2009; Ayers and Lozier, 2012). The seasonal exchange of CO2 with the atmosphere is mainly related to seawater temperature and primary production (PP), which are controlled by mixing of the surface waters with the cold, nutrient-rich subsurface waters (Takahashi et al., 1993; Ayers and Lozier, 2012).
Atmospheric dust deposition and its effects on carbon sequestration via changes in PP has long been suggested as one of the controlling factors in glacial–interglacial fluctuations (Martin, 1990; Tegen et al., 1996; Mahowald, 2011). Particularly in the oligotrophic North Pacific Subtropical Gyre (NPSG), atmospheric dust deposition can be a significant source of nutrients such as nitrogen (N) and iron (Fe) to the surface ocean, thus affecting phytoplankton growth rate (Tan et al., 2013; Yoon et al., 2019; Zhang et al., 2020). Yoon et al. (2019) suggested that East Asian Dust (EAD) events that occur in spring enhance the PP by up to 50% in the northwest Pacific, compared with background conditions. Studies examining particle fluxes in the northwest Pacific have found high biogenic particle fluxes during EAD deposition events and suggested that the enhanced nutrient supply by EAD could have stimulated PP (Li et al., 2004). Bishop et al. (2002) found that suspended particulate organic carbon (POC) concentration doubled after the passage of a dust cloud using data from Argo-type floats deployed near Station PAPA in the North Pacific. In addition, aeolian dust particles can be incorporated into biogenic particles in the water column where they act as ballast minerals, potentially increasing the settling velocity and enhancing the efficiency of carbon export (i.e., transport of carbon from surface water to the interior) (Ittekkot and Haake, 1990; Klaas and Archer, 2002; Pabortsava et al., 2017). Kim et al. (2021) assessed the role of atmospheric dust deposition on the biological pump in the NPSG based on observations of particle fluxes, satellite-derived net primary production (NPP), and atmospheric dust deposition. They reported doubling of the efficiency of the biological pump during the atmospheric dust deposition events (Kim et al., 2021).
Despite the fact that EAD from the East Asian continent is widely known to affect PP and export carbon flux in the northwest Pacific (e.g., Uematsu et al., 2003; Kim et al., 2021), its impact on plankton communities is poorly understood. The northwest Pacific is a suitable place to study the influence of EAD deposition because of its proximity to the source. In this study, we examined the flux and composition of sinking particles collected by a time-series sediment trap in the northwest Pacific between November 2017 and August 2018. Specifically, we investigated changes in phytoplankton communities and POC export efficiency in relation to atmospheric dust deposition.
2 Methods
2.1 Collection of sinking particles by sediment trap deployment
The Korea Institute of Ocean Science and Technology (KIOST) occupied a monitoring station (KE08: 33°41.8′N, 156°39.7′E, water depth = 5,330 m) to investigate carbon export processes in the northwest Pacific (Figure 1). A time-series sediment trap (McLane PARFLUX Mark 78H-21) was deployed at a water depth of 800 m from November 2017 to August 2018, and a current meter (Aanderaa SeaGuard RCM DW) was deployed at 835 m water depth (35 m below the sediment trap). Sinking particles were collected at 10-day intervals from February to June 2018 and at monthly intervals over the remaining time (Table 1). Sample bottles were filled with filtered seawater collected from the trap deployment depth at the same site and a sodium-borate-buffered, 5% formalin solution was added as a preservative. Upon recovery, samples were stored in a refrigerator at 2−4°C.
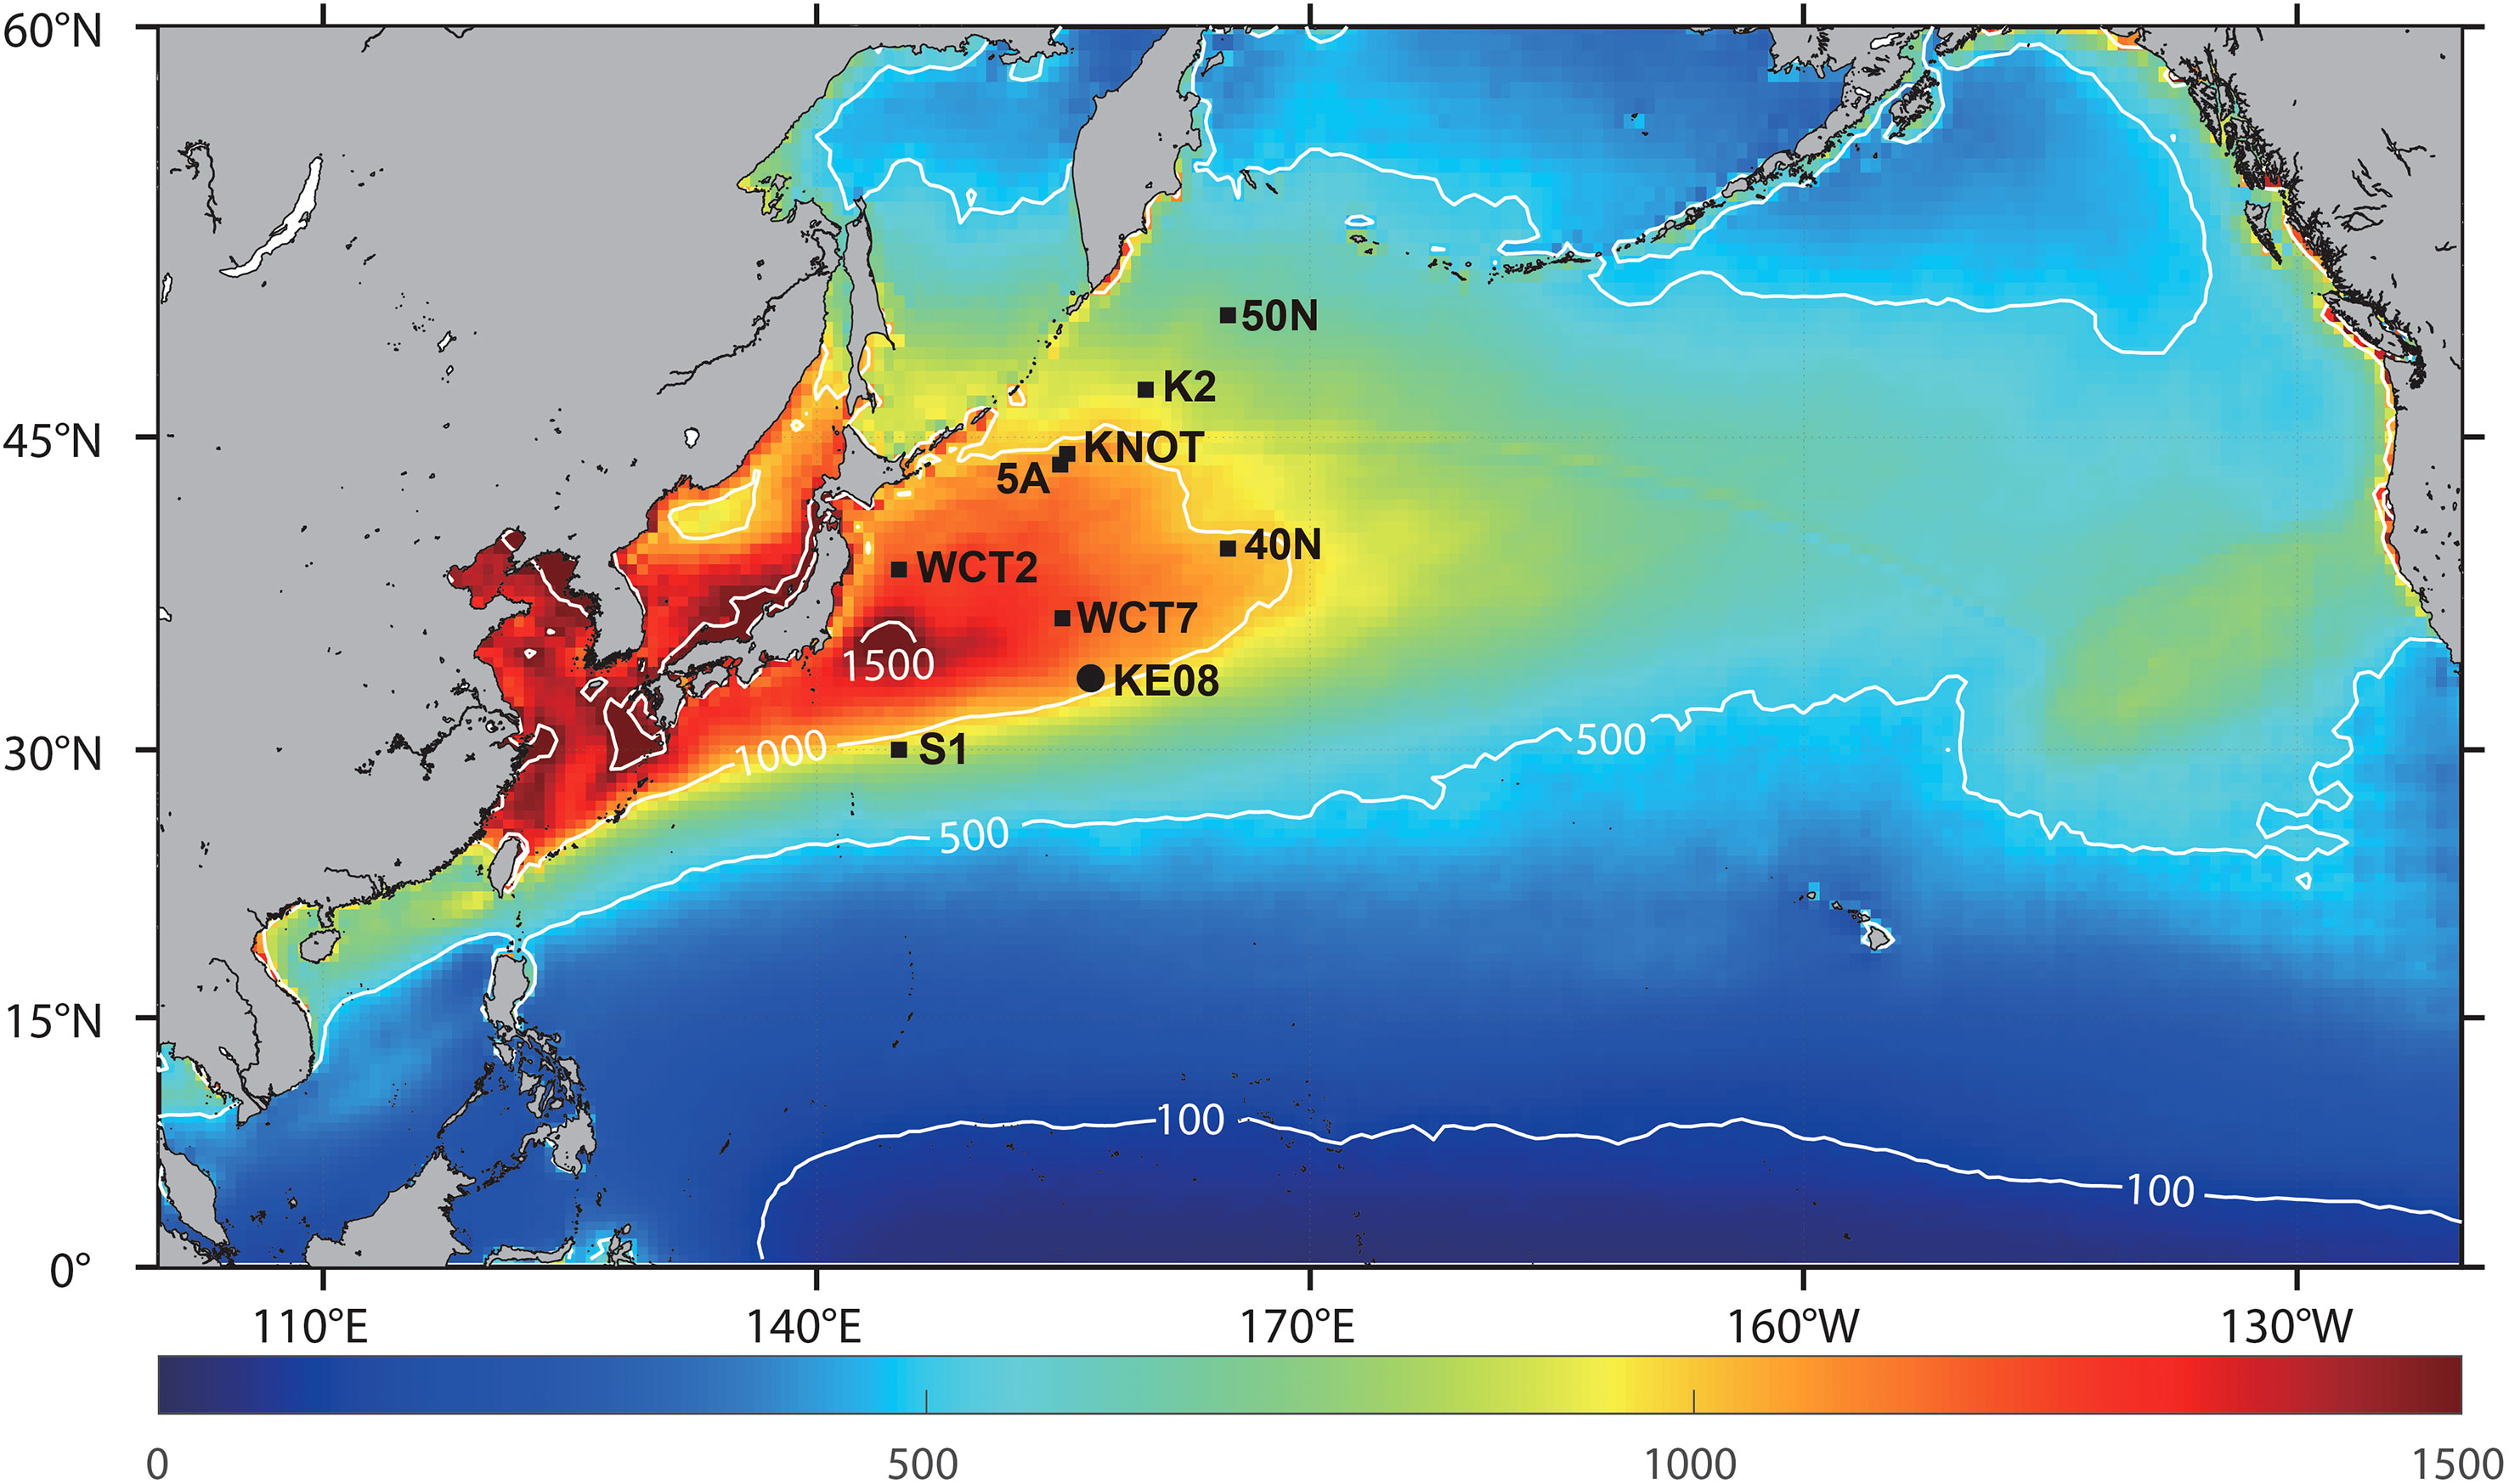
Figure 1 Map showing the location of Station KE08 in the northwest Pacific. Color shading shows the flux of atmospheric dust deposition to the ocean in mg m−2 yr−1, averaged over the 2011–2021 period. Data are from the Modern-Era Retrospective analysis for Research and Applications, version 2 (MERRA -2; http://giovanni.gsfc.nasa.gov/giovanni/). The locations of other sediment trap study sites are also indicated.
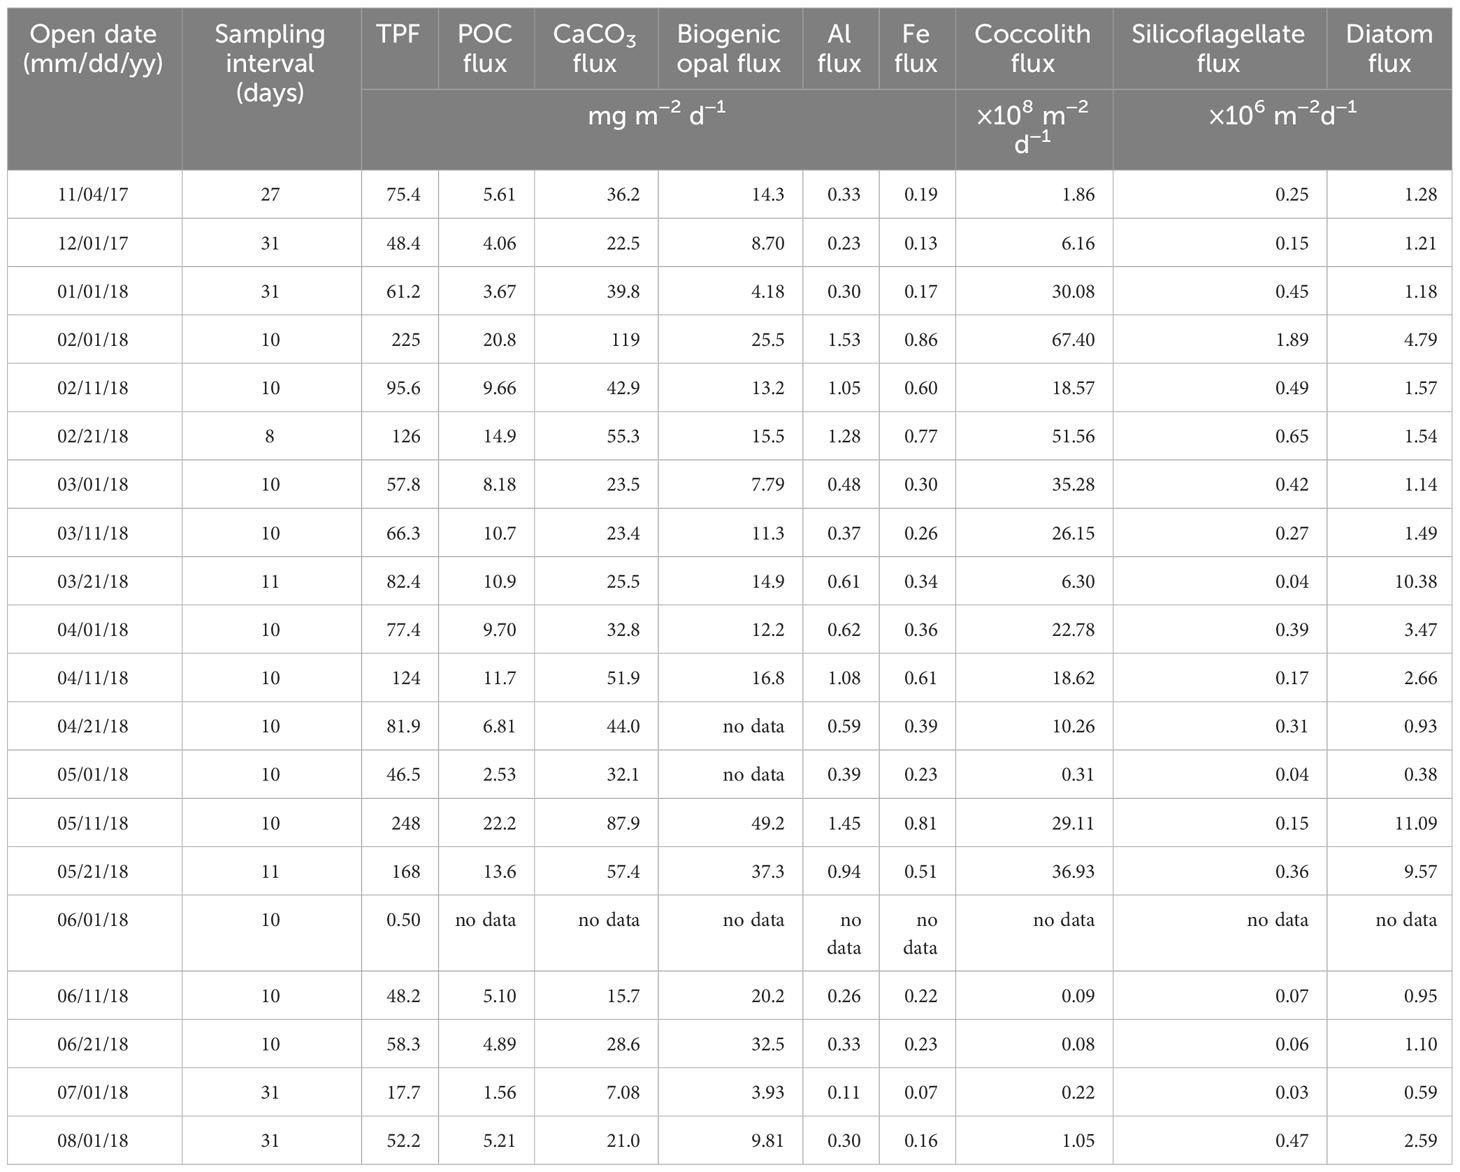
Table 1 Particle flux data from Station KE08 between November 2017 and August 2018.
2.2 Geochemical analysis
Geochemical analyses of samples were performed within a month after sample recovery. In the laboratory, swimmers larger than ~1 mm were hand-picked from the samples upon inspection with the naked eye. Samples were split into five equal aliquots using a wet sample divider (WSD-10, McLane Research Labs, USA). Three aliquots of each sample were combined and rinsed with Milli-Q water to remove salts and residual formalin solution. The washed samples were freeze-dried and weighed for total particle flux (TPF). All freeze-dried samples except for one in early June were ground with an agate mortar and pestle for further analysis. The total carbon (TC) contents of each sample were determined using a Flash EA1112 NC analyzer (Thermo Electron Corporation, USA) with an uncertainty smaller than 1% relative standard deviation (RSD), based on repeat analyses of standard material (sulfanilamide, CE Instruments). Total inorganic carbon (TIC) contents were measured using a UIC CO2 coulometer (CM5014, UIC Inc., USA) with an uncertainty of <0.2% RSD, based on repeat measurements of standard material (Calcium carbonate, Sigma-Aldrich). Calcium carbonate (CaCO3) contents were calculated by multiplying the TIC contents by 8.33 (Trapote et al., 2018). POC contents were estimated as the difference between TC and TIC contents. Biogenic silicon contents were measured via a sequential extraction method using 0.5N NaOH solution at 85°C (DeMaster, 1981; Kim et al., 2011). The precision of the silicon analyses was <4% (standard deviation), based on duplicate analyses. Biogenic opal contents were calculated by multiplying biogenic silicon contents by 2.4 (Lee et al., 2003).
For the analysis of metals, ~50 mg of each dried sample was dissolved in a 4:4:1 mixture of HF, HNO3, and HClO4 and then further diluted with 2% HNO3 (German et al., 2002). The Al and Fe concentrations were determined by inductively coupled plasma–mass spectrometry (ICP–MS; ICAP Q, Thermo Fischer Scientific). A marine sediment standard (MESS4, National Research Council of Canada) was used as the certified reference material. The analytical recoveries obtained via multiple analyses (n = 5) of the certified reference material were 98% and 95% for Fe and Al, respectively.
2.3 Satellite and model data
The net primary production (NPP) was obtained from the Ocean Productivity website (http://sites.science.oregonstate.edu/ocean.productivity), which estimates the NPP using the vertically generalized production model (VGPM) with an 8-day temporal resolution. The VGPM is a widely used depth-integrated model that estimates regional to global ocean NPP based on surface chlorophyll-a concentrations, sea surface temperature (SST), and photosynthetically active radiation (Behrenfeld and Falkowski, 1997). The median NPP value in the 4° × 4° grid box that included the study site was used for comparison with the particle flux data. This resolution was chosen to obtain more consistent results by avoiding patchiness of the data. However, the 2° × 2° data were virtually identical to the 4° × 4° data in terms of both magnitude and temporal variations (Figure S1). We compared three commonly used satellite-based NPP estimates (i.e., VGPM, Eppley, and CbPM), each having limitations in the estimation process (Pennington et al., 2006; Friedrich and Oschlies, 2009). The estimates were all comparable in a qualitative sense, as shown by previous studies (e.g., Gomez-Letona et al., 2017), and using other estimates than the VGPM result would not change the story. SST data were obtained from the National Oceanic and Atmospheric Administration (NOAA) optimum interpolation SST product (https://downloads.psl.noaa.gov/Datasets/noaa.oisst.v2.highres/; Reynolds et al., 2002), with monthly and 8-day mean SST fields generated using in situ temperature data and satellite-derived SST. We used the 1° × 1° SST data around the study site. The mixed layer depth (MLD) was obtained from the National Centers for Environmental Prediction Global Ocean Data Assimilation System (GODAS; MLD data can be found at https://downloads.psl.noaa.gov/Datasets/godas/), which has a 1° × 1° spatial resolution (Behringer and Xue, 2004).
The hourly dry and wet dust deposition flux data around Station KE08 were obtained from the Modern-Era Retrospective analysis for Research and Applications, version 2 (MERRA-2; https://disc.gsfc.nasa.gov/datasets?keywords=deposition&page=1), which is developed and maintained by the NASA Goddard Earth Sciences Data and Information Services Center (GES DISC) (Acker and Leptoukh, 2007). We used the hourly dust deposition flux to estimate the dust deposition flux averaged over each sediment trap sampling period. The backward trajectory used to show the dust transport pathways was obtained from the HYSPLIT model, which was developed by NOAA (US National Oceanic and Atmospheric Administration/Air Resources Laboratories; https://www.ready.noaa.gov).
2.4 Phytoplankton analysis
One aliquot of each sample was used to count diatom and silicoflagellate frustules to determine their fluxes. The samples were rinsed with Milli-Q water to remove preservatives and seawater. Organic material in the samples was removed following the methods of Simonsen (1974). Equal amounts of saturated potassium permanganate and 33% hydrochloric acid were added and boiled at 80°C until the sample color disappeared. The samples were then rinsed with Milli-Q water to remove acids. Slides for qualitative and quantitative analyses were prepared by settling the acid-cleaned material onto coverslips using a random settling method (Moore, 1973). The coverslips were affixed with a mount media (Pleurax, Wako, Japan), and three permanent slides per sample were used for diatom analysis. A standard enumeration methodology was employed, wherein a minimum of 500 frustules total were counted along random transects on the triplicate slides. The resulting counts were converted to daily diatom flux, according to Sancetta and Calvert (1988).
For the coccolith analysis, l/25 of each sample was filtered on Mixed Cellulose Ester Membrane filters (0.45 μm pore width, Advantec) under vacuum. The filters were dried at 55°C for >4 hours and kept dry in a desiccator with silica gel. Dried filters were coated with platinum and analyzed using a scanning electron microscope (S-4300, Hitachi, Japan). Coccolith flux was calculated following the methods of Young et al. (1999). We estimated the coccolith carbonate flux based on morphology, such as the average length and mass of CaCO3 for coccoliths of individual species, following the method of Young and Ziveri (2000).
3 Results
The satellite-derived SST data from the study site exhibit seasonal variations, with the lowest value in March−April and the highest value in June−July (Figure 2A). This is typical of this region based on the monthly SST data between 2002 and 2019. The MLD varied between 215 m in February and 12 m in July 2018 (Figure 2A), and NPP varied between 209 and 964 mg C m−2 d−1 (Figure 2B). NPP started to increase in January to a peak value in April and then decreased to its lowest value in August 2018 (Figure 2B). The NPP values in March−May 2018 were nearly three times higher than the mean value (380 ± 101 mg C m−2 d−1) over the remaining time.
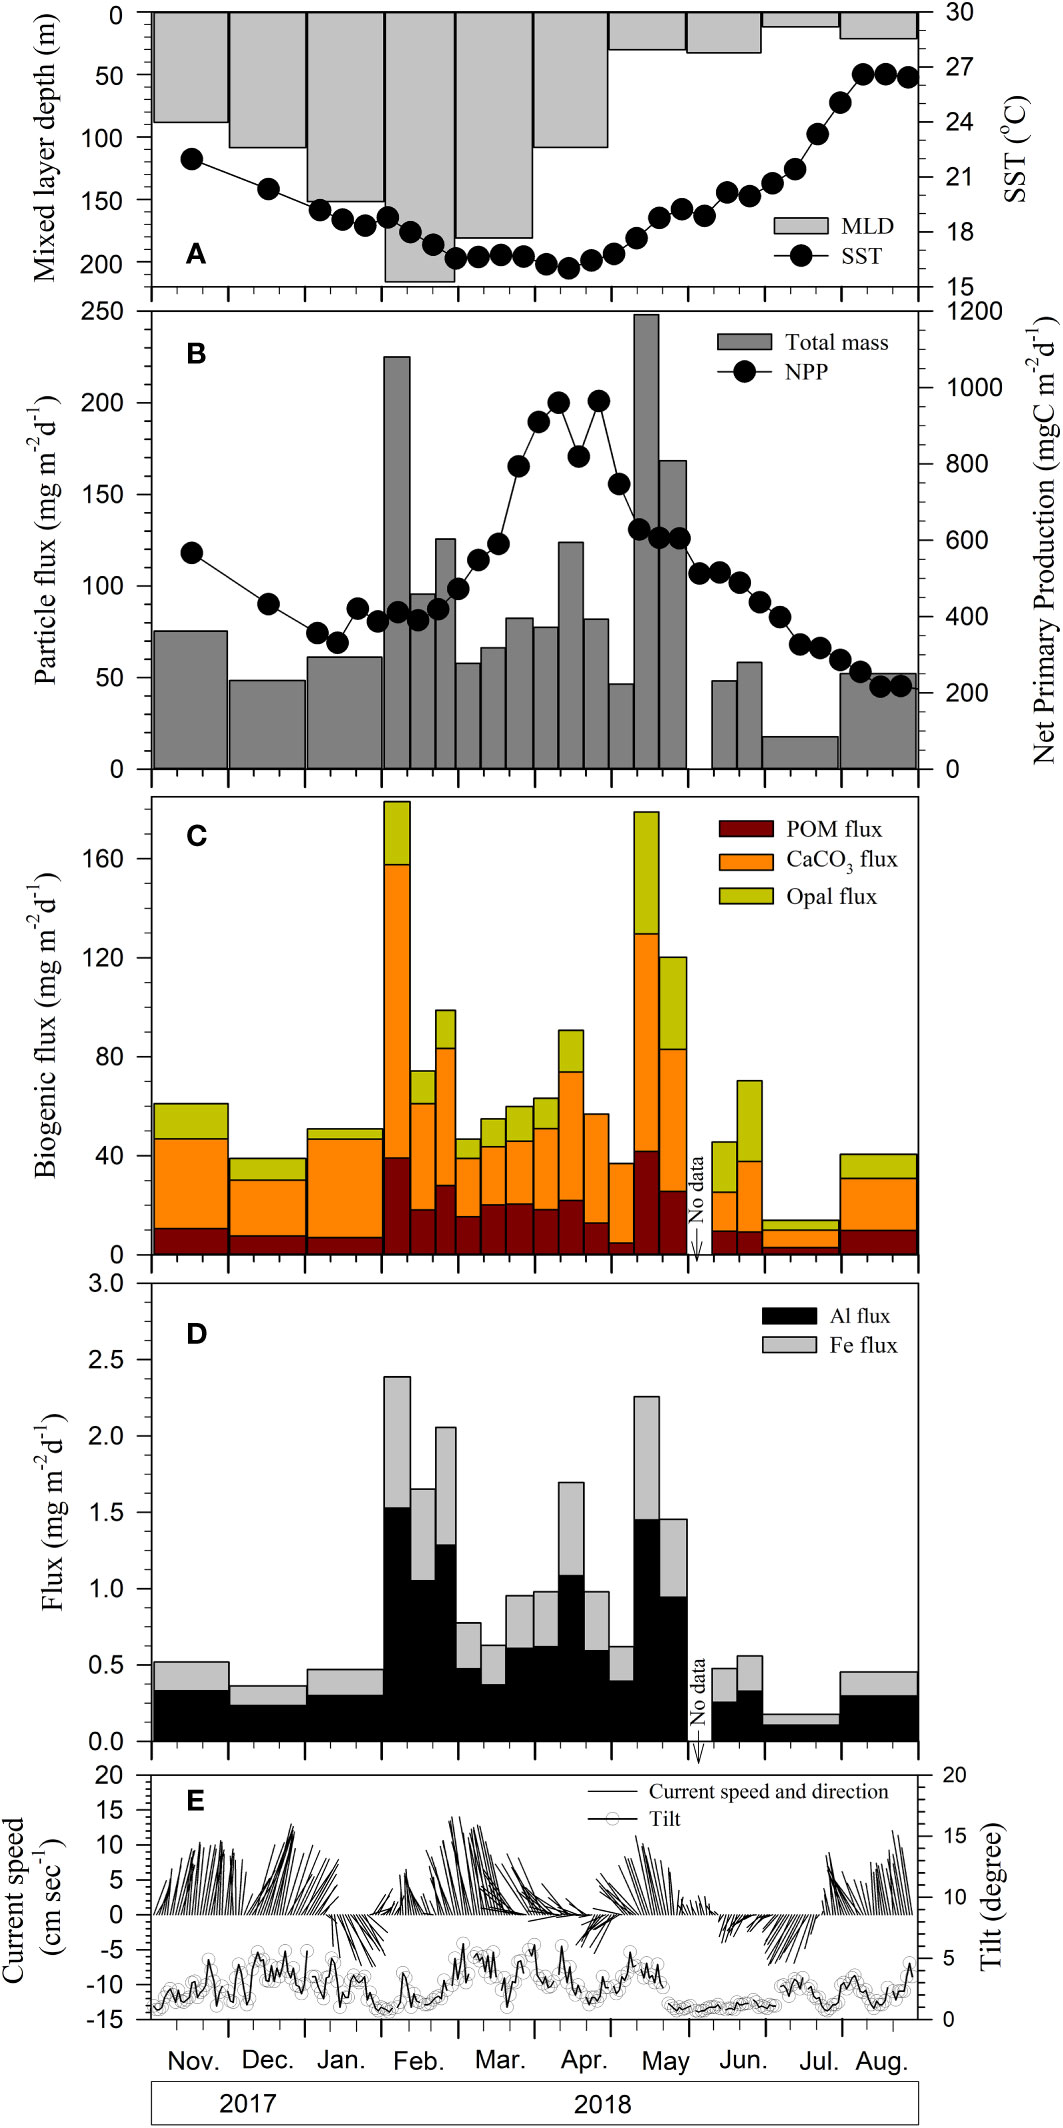
Figure 2 Temporal variations in (A) mixed layer depth (MLD) and sea surface temperature (SST), (B) net primary production (NPP) and total particle flux, (C) fluxes of POM, CaCO3, and opal, (D) fluxes of Al and Fe, and (E) daily-averaged current speed measured at 35 m below the sediment trap and in tilt recorded by sediment trap, all observed at Station KE08 from November 2017 to August 2018. Note that bars in (C, D) are stacked.
TPF values ranged between 0.5 and 248 mg m−2 d−1, with a duration-weighted average of 88 ± 63 mg m−2 d−1 (Figure 2B). Two prominent pulses in TPF were observed during the intervals 1–10 February and 11–31 May, 2018 (Figure 2B). With the exception of these two particle flux pulses, temporal variations in TPF were generally similar to those of NPP, both showing high values in April. The contribution of each biogenic component to the sinking particle flux was in the order of 45% ± 10% for CaCO3, 20% ± 12% for biogenic opal and 19% ± 5% for particulate organic matter (POM) (Figures 2, S2). POM content was calculated from POC content by multiplying a weight ratio of 1.88 (Lam et al., 2011). POM contents ranged from 18.5% to 30.4%. POM flux varied between 2.9 and 41.7 mg m−2 d−1 (Figure 2). POC contents ranged from 5.4% to 16.2%, with a mean of 9.8% ± 2.7%. POC flux varied from 1.6 to 22.2 mg m−2 d−1, with a duration-weighted average of 9.0 ± 5.8 mg m−2 d−1 (Figure 2C). The biogenic opal flux ranged from 3.9 to 49.2 mg m−2 d−1, with a duration-weighted average of 17.4 ± 12.2 mg m−2 d−1 (Figure 2C). The CaCO3 flux ranged from 7.1 to 119 mg m−2 d−1, with a duration-weighted average of 40.3 ± 26.4 mg m−2 d−1 (Figure 2C). Biogenic particle fluxes followed the temporal variations in TPF (Figures 2B, C): TPF and CaCO3 flux, POC flux, and biogenic opal flux were correlated, with R2 values of 0.87 (p < 0.0001), 0.89 (p < 0.0001), and 0.59 (p = 0.0003), respectively. POC flux was significantly correlated with the flux of CaCO3 (R2 = 0.72, p < 0.0001), opal (R2 = 0.44, p < 0.004), and lithogenic material (R2 = 0.84, p < 0.0001).
Aluminium accounted for 0.44%−1.1% of the sinking particulate matter, and Al flux ranged from 0.1 to 1.5 mg m−2 d−1, with a duration-weighted average of 0.7 ± 0.4 mg m−2 d−1 (Figure 2D). Iron made up 0.25%−0.63% of the total particulate matter, and Fe flux ranged from 0.1 to 0.9 mg m−2 d−1, with a duration-weighted average of 0.4 ± 0.2 mg m−2 d−1 (Figure 2D). The Fe flux was strongly correlated with the Al flux (R2 = 0.99, n = 19; not shown). The Fe flux was also strongly correlated with the flux of biogenic components (R2 = 0.84 with POC flux, R2 = 0.75 with CaCO3 flux). The flux of lithogenic material (Al × 12.15; Honjo et al., 2000) ranged from 1.3 to 18.6 mg m−2 d−1, with a duration-weighted average of 7.8 ± 5.4 mg m−2 d−1. The lithogenic material content ranged from 5% to 13%. During February 2018, lithogenic material contents showed a notable increase from 6% to 13.4%. Similarly, high lithogenic contents were observed in late April−early May, 2018 (Figure S2). The mean lithogenic content during February and late April−early May was 10% ± 2.3%.
Coccolith flux was low in November (1.9 × 10⁸ coccoliths m−2 d−1) and increased with time to high values in early and late February. The maximum coccolith flux observed in early February was 67 × 108 coccoliths m−2 d−1 (Figure 3A), and the flux gradually decreased until the end of March. Another peak occurred in May, and the flux was minimal in July−August. The dominant coccolithophore species was Emiliania huxleyi (E. huxleyi), and its flux varied in accordance with that of coccoliths, with the E. huxleyi flux ranging from 0.07 to 64 × 108 coccoliths m−2 d−1. The CaCO3 flux was strongly correlated with that of coccolith flux (R2 = 0.57, p < 0.001). The estimated coccolith-derived CaCO3 flux ranged from 0.03 to 27.7 mg m−2 d−1, with a duration-weighted average of 10.1 ± 9.2 mg m−2 d−1 (Figure 3A), thus accounting for ~25% of the CaCO3 flux.
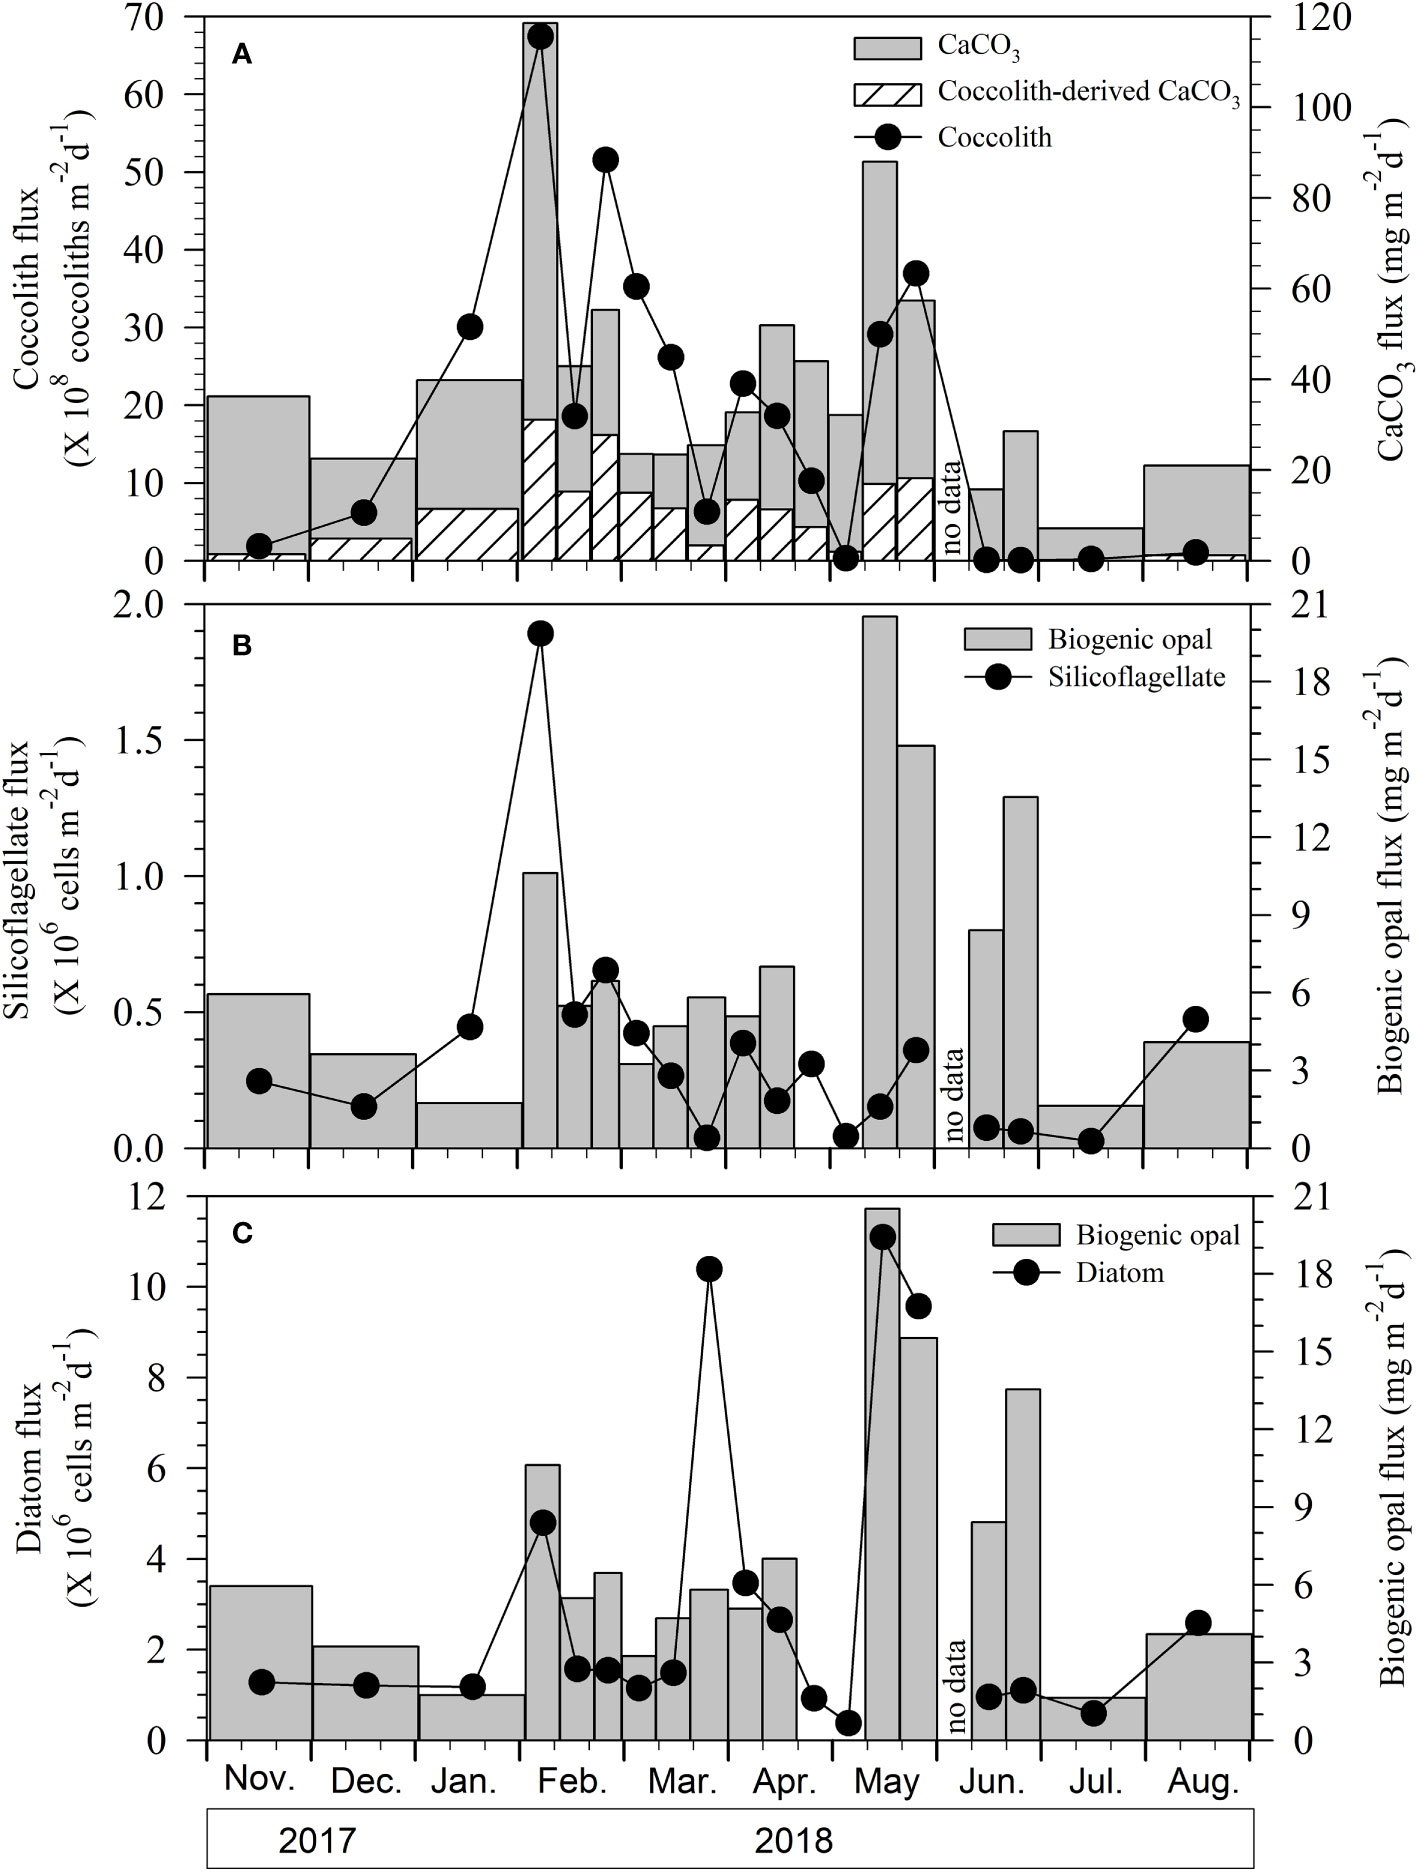
Figure 3 Fluxes of (A) coccoliths, CaCO3, and coccolith-derived CaCO3, (B) silicoflagellates and biogenic opal, and (C) diatom and biogenic opal at Station KE08 from November 2017 to August 2018.
The flux of silicoflagellates varied from 0.03 to 0.7 × 10⁶ cells m−2 d−1, except for the exceptionally high value in February (1.9 × 10⁶ cells m−2 d−1; Figure 3B). The silicoflagellate flux was lowest in June and July. The diatom flux ranged from 0.3 to 4.8 × 10⁶ cells m−2 d−1, when the high values in March (10.4 × 10⁶ cells m−2 d−1) and May (11.1 × 10⁶ cells m−2 d−1) are excluded (Figure 3C). On average, the diatom flux was nearly one order of magnitude higher than the silicoflagellate flux in terms of cell numbers. The diatom flux peaked in late March and mid- to late-May, unlike the fluxes of coccolithophores and silicoflagellates (Figure 3C), and ~54% of the annual diatom flux occurred during these periods. The biogenic opal flux was significantly correlated with the diatom flux (R2 = 0.44, p < 0.005; R2 = 0.67 when the abnormally high value in late March was excluded), and the diatom flux was less well correlated with the silicoflagellate flux (R2 = 0.01).
4 Discussion
4.1 Characteristics of particle flux and composition
During the study period, satellite-derived NPP values were highest in spring and lowest in summer, which is typical for mid-latitude, temperate oceans (e.g., Kuwahara et al., 2015; Honda et al., 2018). The satellite-derived NPP values were in a similar range to the 13C-based field NPP measurements at Station S1 (30°N and 145°E) in the northwest Pacific (~900 mg C m−2 d−1 in February and ~250 mg C m−2 d−1 in July 2011; Matsumoto et al., 2016; Honda, 2020). Assuming that the settling velocity of particles in the water column was 100−200 m d−1 (e.g., Honjo et al., 1995; Berelson, 2002; Brust et al., 2011), the observed temporal variations in particle flux should reflect temporal variations in biological productivity in the surface layer without a significant time lag (i.e., one sampling period, at most). The TPF time series generally reflected the temporal variations in NPP if the pulses in particle flux in February and May were excluded (R2 = 0.58, p < 0.005): biogenic particle fluxes were at their maximum in April, coinciding with high values in NPP. On average, only ~1% of NPP reaches 800 m depth as sinking POC, excluding the two periods of peak particle flux (Figure 4).
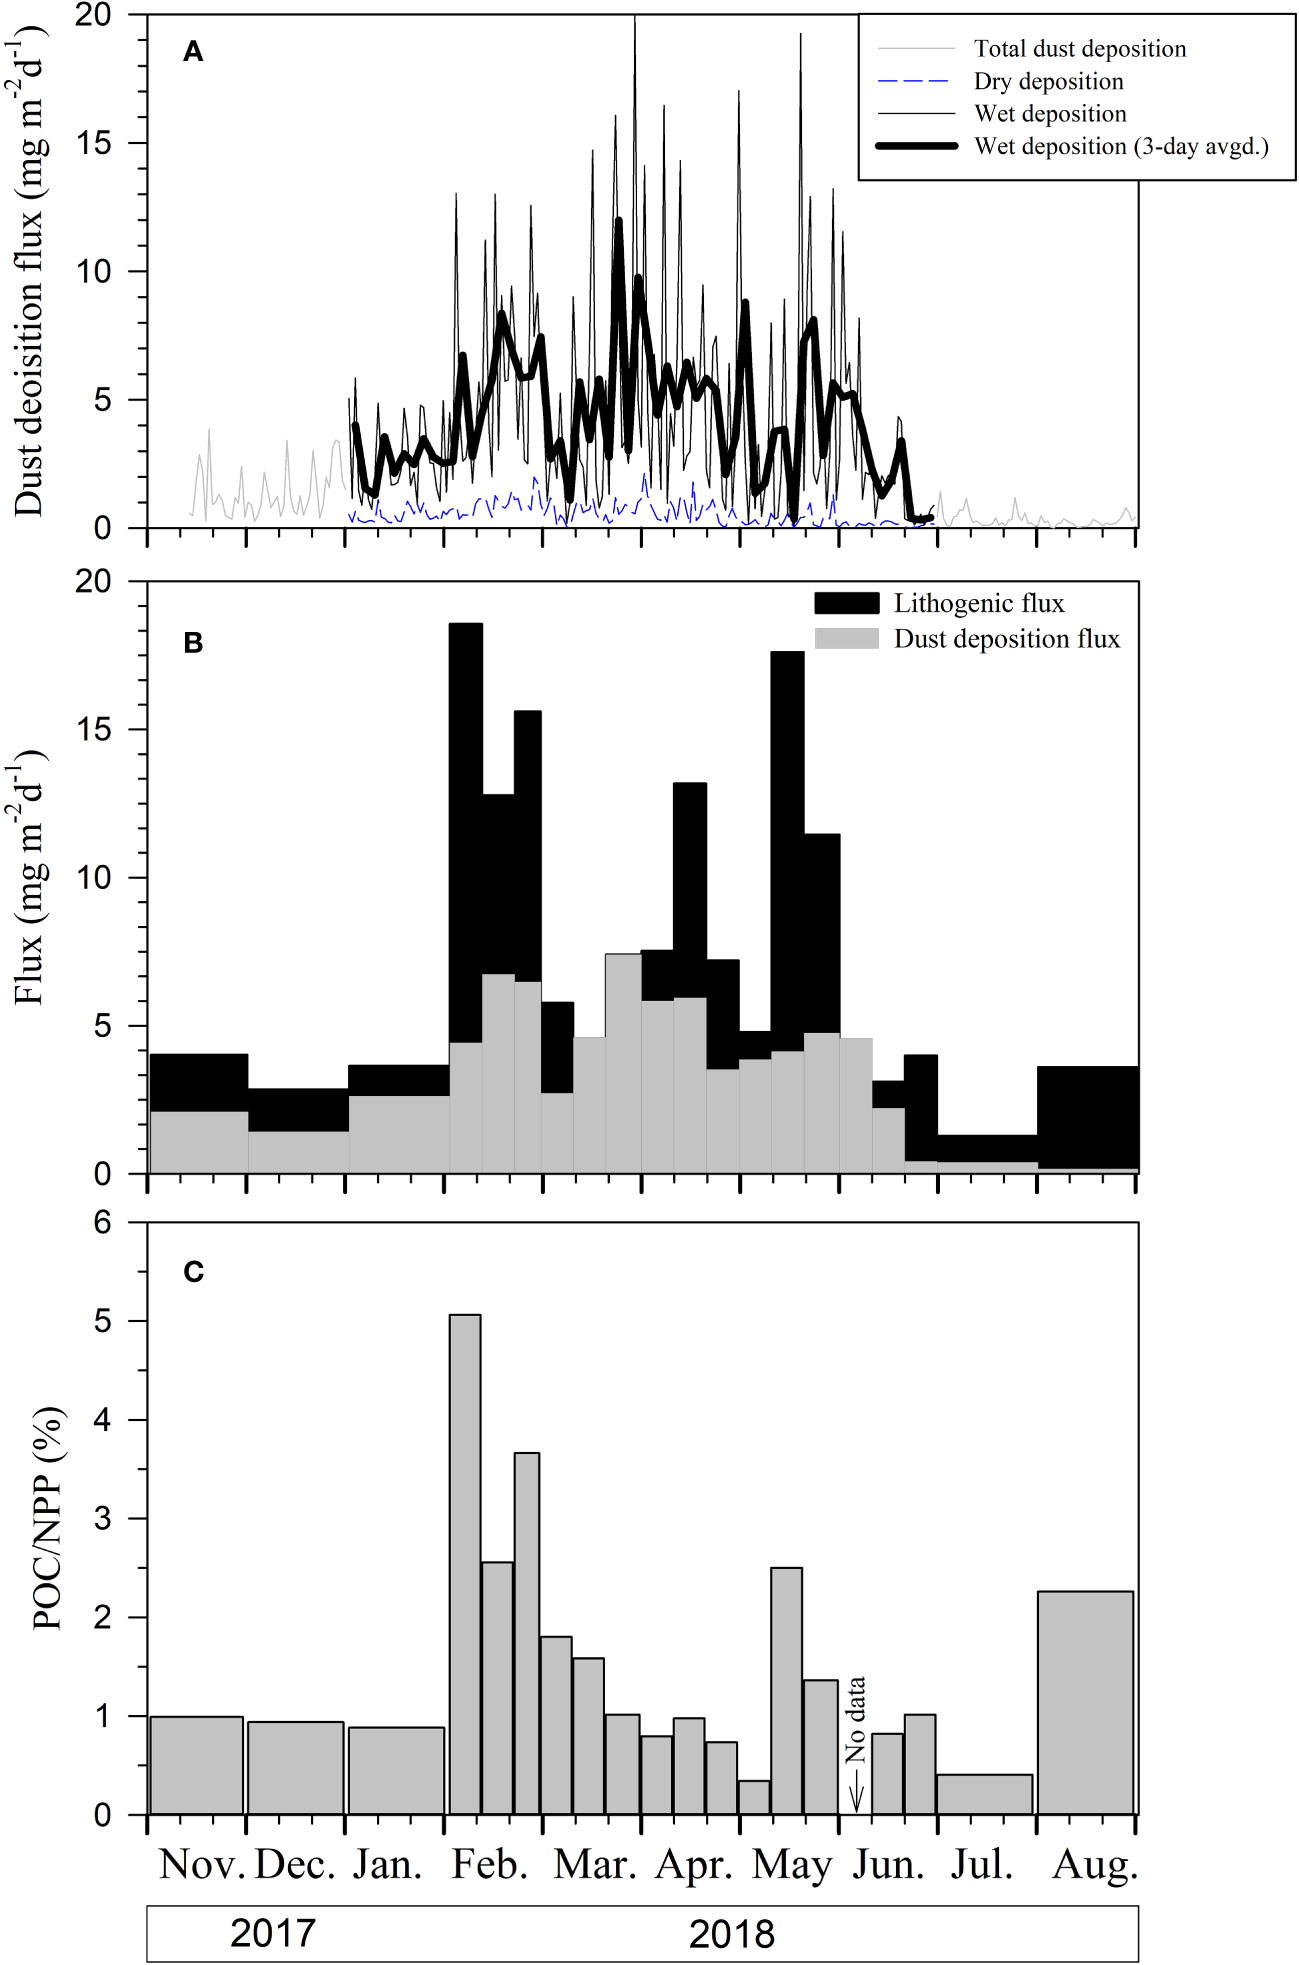
Figure 4 Temporal variations in (A) daily dry and wet deposition based on MERRA-2, (B) MERRA-2 model derived regional mean atmospheric dust deposition flux for the study area and lithogenic material flux at depth from trap, and (C) the ratio of the POC flux at 800 m depth to satellite-derived NPP.
There are two prominent particle flux peaks in our records: one in February, which lasted for one sampling period (i.e., 10 days), and the other in May, which encompassed two sampling periods (i.e., 20 days). The biogenic component (sum of CaCO3, biogenic opal, and organic matter) of the samples corresponding to these peaks accounted for 70%–90% of the sinking particulate mass, indicating a mostly biogenic origin. However, these particle flux peaks appear to be decoupled from NPP in that they occurred before and after the spring bloom signal in the NPP records.
Over the monitoring period, the current speed measured at 835 m was 9.1 ± 3.7 cm sec−1 (n = 280), which is below the critical value (12.5 cm sec-1) for affecting sediment trap efficiency (Figure 2E) (Baker et al., 1988; Honjo et al., 1995; Buesseler et al., 2007). The tilt sensor of the sediment trap indicated tilting between 0.6 and 6.0 degrees (2.5° ± 1.3° on average, n = 260) for the entire period. The tilt was small in the first third of February, the last third of May, and June 2018, coinciding with the major current direction change (Figure 2E). Although the particle flux peak in February coincided with the low current speed and tilt, the particle flux peak in May started mid-May and anteceded the low tilt in late-May. The correlation coefficient for the relationship between the particle flux and each of the current speed and trap tilt was very low (R2 = 0.14 for the former and 0.0 for the latter; Figure S3). In addition, the observed high particle fluxes at low tilt are the opposite of what Gardner (1985) observed: trap efficiency increased with tilt, although the experiment was done with a cylindrical trap instead of a conical trap. Thus, the possibility of sampling bias associated with the current speed and sediment trap tilt was likely low. However, Bishop et al. (2016) found an underestimation of particle flux by moored traps compared with an imaging optical sedimentation recorder attached to an autonomous Lagrangian Carbon Flux Explorer near the California coast. We are not certain at this point whether all samples except for the two particle flux peaks were affected by under-sampling. Another possibility is the lateral transport of particles from more productive northern region during the particle settling (Figure S5). However, the meridional gradient in chlorophyll was small in February. Thus, any single one of these potential factors alone cannot explain the particle flux peaks.
The peak particle fluxes in February and May 2018 (225 and 208 mg m−2 d−1, respectively) are nearly four times the average particle flux for the remainder of the study interval (64 ± 32 mg m−2 d−1). The particle compositions of the samples corresponding to the two pulse periods were different. The February peak was accompanied by a larger increase in CaCO3 flux compared with that of biogenic opal (Figures 3A, S6). It was also associated with a sharp increase in silicoflagellate flux, whereas diatom flux only doubled. In contrast, the May peak was associated with a sharper increase in biogenic opal flux than in the CaCO3 flux. Further, the diatom flux, dominated by N. bicapitata, increased markedly, whereas the silicoflagellate flux remained low, suggesting that the enhanced biogenic opal flux in May was caused mainly by diatom productivity (Figures 3C, S6).
4.2 Decoupling between NPP and particle flux pulses
The high particle fluxes seen in February and May 2018 did not correspond to peaks in satellite-derived NPP records. The study region is in the Kuroshio extension and thus is affected by the meandering of the Kuroshio and/or mesoscale eddies (e.g., Matsumoto et al., 2021). We examined mesoscale eddy activity from February and May 2018 based on the satellite-derived SST and chlorophyll fields (both 0.25 degree resolution). No notable features such as sudden inclusion into an eddy were observed during the period at our monitoring station (Figures S4, S5).
We consider three possible explanations for this decoupling between NPP and the two peaks in particle flux. One possibility is that the satellite observations did not effectively capture the subsurface phytoplankton production in February (e.g., Churnside and Marchbanks, 2015; Honda et al., 2018). The MLD became the greatest in February and thus supply of nutrients from the subsurface water may have been responsible at least partly for the POC flux peak. However, the satellite-derived NPP increased from March 2018. It is possible that a considerable increase in NPP actually occurred in February but was not captured by satellite observation. It is well-known that there is a prominent subsurface chlorophyll maximum (SCM) in the northwest Pacific (Furuya and Marumo, 1983). The enhanced CaCO3 flux in February 2018 was attributed to an increase in the flux of coccolithophores (e.g., E. huxleyi). Coccolithophores have relatively low chlorophyll-a contents and a whitish color and may not be represented properly by satellite-detected chlorophyll concentrations (Hopkins et al., 2015). Rapid grazing may be responsible for the low chlorophyll concentration during the high flux period in February. Bishop et al. (2016) observed high chlorophyll-a concentration before its rapid decrease and high particle export by grazing. In our study, any such increase in chlorophyll concentration was not observed ahead of the particle flux peak in February. However, the rapid increase in the coccolith flux in February may suggest rapid grazing of coccolithophores. In May 2018, NPP was relatively high, and the biogenic opal flux was supported mainly by N. bicapitata, which is small and less well-detected by satellites (Figure S6) (Leblanc et al., 2018).
Another possible explanation involves enhanced particle export efficiency by atmospheric dust deposition. The pulses in particle flux seen in February and May 2018 coincided with higher concentrations of lithogenic material and a higher lithogenic flux than those in the remainder of the study interval (Figure 2). Lithogenic material in the open ocean and especially in the upper layer is mainly supplied through atmospheric dust deposition (e.g., Li et al., 2004; Martino et al., 2014; Pabortsava et al., 2017; Kim et al., 2021). The Gobi Desert in East Asia represents one of the world’s largest dust source regions (Lee et al., 2015; Kim et al., 2021). EAD is transported to the North Pacific primarily in late winter and spring (e.g., Li et al., 2004; Kanatani et al., 2014; Lee et al., 2015). Atmospheric dust deposition flux data derived from the MERRA-2 model showed high fluxes in February−May 2018 (Figure 4). The wet deposition accounted for the dominant fraction (80-90%) of the total dust deposition (Figure 4A). We found significant positive relationships between the lithogenic material flux and the dust deposition flux averaged over each trap sampling period (Figure S7). The highest correlation coefficient was obtained when there was no time lag. Although their temporal variations were correlated, the magnitudes of the two fluxes were different (Figure 4). We do not know the cause of the discrepancy. A large uncertainty of the MERRA-2 should be noted: Yu et al. (2019) reported that satellite-based dust deposition estimates agreed with the in-situ based climatology within a factor of 2. Also, the organic matter may have scavenged suspended lithogenic particles to magnify the lithogenic flux.
We also considered the lateral transport of lithogenic particles from the continental margin sediments as a potential source. Lam et al. (2006) reported the Ti : Fe ratio of ~0.1 for EAD, which is different from that of the coastal particulate samples (~0.02) in the upper 100 m layer of the northeastern subarctic Pacific. The Ti : Fe ratio of the sinking particles at Station KE08 ranged between 0.1 and 0.2 (average = 0.15 ± 0.03, n=19), matching the value of EAD (Figure S8). The Ti : Al ratio of the sinking particles was ~0.052 ± 0.01, similar to the values of soil in East Asia (0.05; Gu et al., 2020). Also, Ti : Al ratio of the sediment in the western North Pacific is comparable to those of EAD (Maeda et al., 2002). Thus, Ti : Al ratio cannot be used as an unequivocal source indicator. Instead, these results may support the notion that the discrepancy between the EAD flux and lithogenic material flux was partly caused by the addition of laterally transported sediment to sinking particles.
Studies have found links between dust deposition and intervals of increased particle flux in the North Pacific (e.g., Bishop et al., 2002; Li et al., 2004; Kim et al., 2021). At Station SHIBT (29°30′N, 135°15′E) in the northwest Pacific, Li et al. (2004) reported that the particle flux exhibited distinct maxima in February and May 1999 and low values in July 1999, and they attributed the enhanced particle flux to EAD deposition. We compared the magnitude of dust deposition near Station PAPA for the year Bishop et al. (2002) observed the effect of dust deposition, to that observed at our site. The monthly MERRA-2 model-derived regional mean atmospheric dust deposition at around Station PAPA in April 2001, when the observation was carried out, was comparable in magnitude to those at Station KE08 (Figure S9).
Because the highest correlation coefficient between the dust deposition and the lithogenic flux was obtained with no time lag, we examined the backward trajectory analysis for the intervals 2–5 February and 3–7 May 2018 based on the NOAA HYSPLIT model (https://www.ready.noaa.gov). The results show that the dust originated mainly from northern China and Mongolia (Figure S10). We also examined the backward trajectory two weeks before each particle flux peaks, i.e, for the intervals 15–23 January and 10−23 April 2018, because a few studies found a 2-week time lag between EAD deposition and particle flux at depths or increased suspended POC concentration in the upper layer (Bishop et al., 2002; Kim et al., 2021), These results similarly showed that the dust particles originated from northern China and Mongolia (Figure S11). We investigate the influence of atmospheric dust deposition on POC export efficiency in the following section.
4.3 Role of dust deposition on sinking particle flux
We examined the role of EAD deposition on POC export efficiency to the sediment trap depth (i.e., biological pump efficiency) by comparing the POC flux at 800 m depth with NPP. The export efficiency included both the POC export from the mixed layer and transport to the sediment trap depth in this case. The ratios of POC flux (at 800 m depth) to NPP during the two peak intervals were 5.1% and 2.9%, compared with an average value of 1.2% ± 0.5% over the remainder of the study interval (Figure 4C). POC export efficiency was highest in February 2018, when small phytoplankton (e.g., coccolithophorids) were dominant. The EAD particles may play a significant role by providing ballast minerals for the aggregation and sinking of small particles of organic carbon.
Several studies have reported marked increases in biological pump efficiency associated with EAD deposition events in the NPSG (Buesseler et al., 2007; Kim et al., 2021). Dust particles with high density (2.6−2.8 g cm−3) may act as ballasting minerals (Armstrong et al., 2001; Pabortsava et al., 2017), and thus any aggregates that incorporate dense dust particles may result in more efficient POC transfer to the depth at our study site. Alternatively, nutrient supply by dust deposition may shift the plankton community toward more sinking-prone species, such as diatoms with large frustules and planktonic foraminifera. Buesseler et al. (2007) reported that at Station K2 in the northwest Pacific, a diatom-dominated ecosystem led to enhanced transport efficiency of POC through the twilight zone due to the formation of large and dense phytoplankton aggregates. At a station in the southeastern part of the NPSG, Kim et al. (2021) also found that EAD deposition during the March−May period drove diatom blooms and increased POC export efficiency to the deep sea. They reported that the ratio of the POC flux at 4,500 m depth to NPP during the interval of enhanced dust deposition was twice the background value (Kim et al., 2021).
We compared fluxes of POC and lithogenic material at several sites in the northwest Pacific between the western subarctic and subtropical Pacific (30°N−50°N, 140°E−180°E; Table 2). Specifically, we examined fluxes at stations WCT2 and WCT7 (Mohiuddin et al., 2004), S1 (Honda et al., 2016), 5A (Otosaka and Noriki, 2005), KNOT (Honda et al., 2002), K2 (Honda et al., 2002; Buesseler et al., 2007), 40N, and 50N (Honda et al., 2002). Similar to the decreasing trend seen in EAD deposition with distance from the source region (Duce and Tindale, 1991; Jickells et al., 2005; Hsu et al., 2009), the flux of lithogenic material also decreased with the distance between the dust source region and each site (Figure 5). The distance was calculated using a point source in the Gobi Desert of East Asia and measuring the distance to each sediment trap site in the northwest Pacific using the Google Earth program (e.g., Zhang et al., 2003; Hsu et al., 2009). We also found that annual mean POC flux decreased with distance from the source region (Figure 5). However, the relationship is not linear, with either the Station S1 value being too high or the Station WCT2 value being too low. There is a possibility that this relationship is either secondary or fortuitous, considering that NPP is usually higher near the continent than in the gyre because of the nutrient supply from the continent. It is also possible that the relation may be attributed to usually higher concentration of laterally transported lithogenic material in the water column closer to the continent. However, the fact that a relationship is found between the fluxes of POC and lithogenic material at several open ocean sites (Figure 6) supports the idea that atmospheric dust deposition affects POC flux, in addition to other physical controls of NPP. The correlation between sinking POC flux and lithogenic material flux at these sites implies that the link between the two is prevalent across the northwest Pacific. However, the possibility that this relation was caused by the tendency that biogenic and lithogenic materials are aggregated and sink together, still exists, and is open for further research to evaluate the causation.
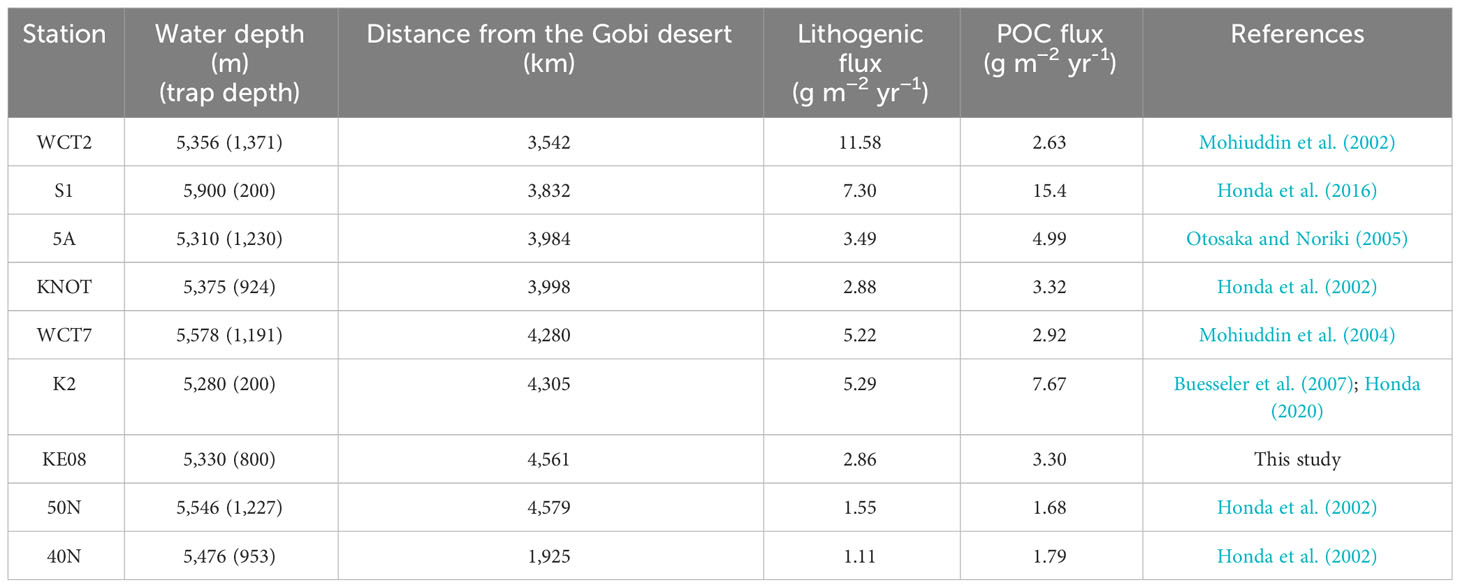
Table 2 Annual fluxes of lithogenic material and POC at various sediment trap sites in the northwest Pacific.
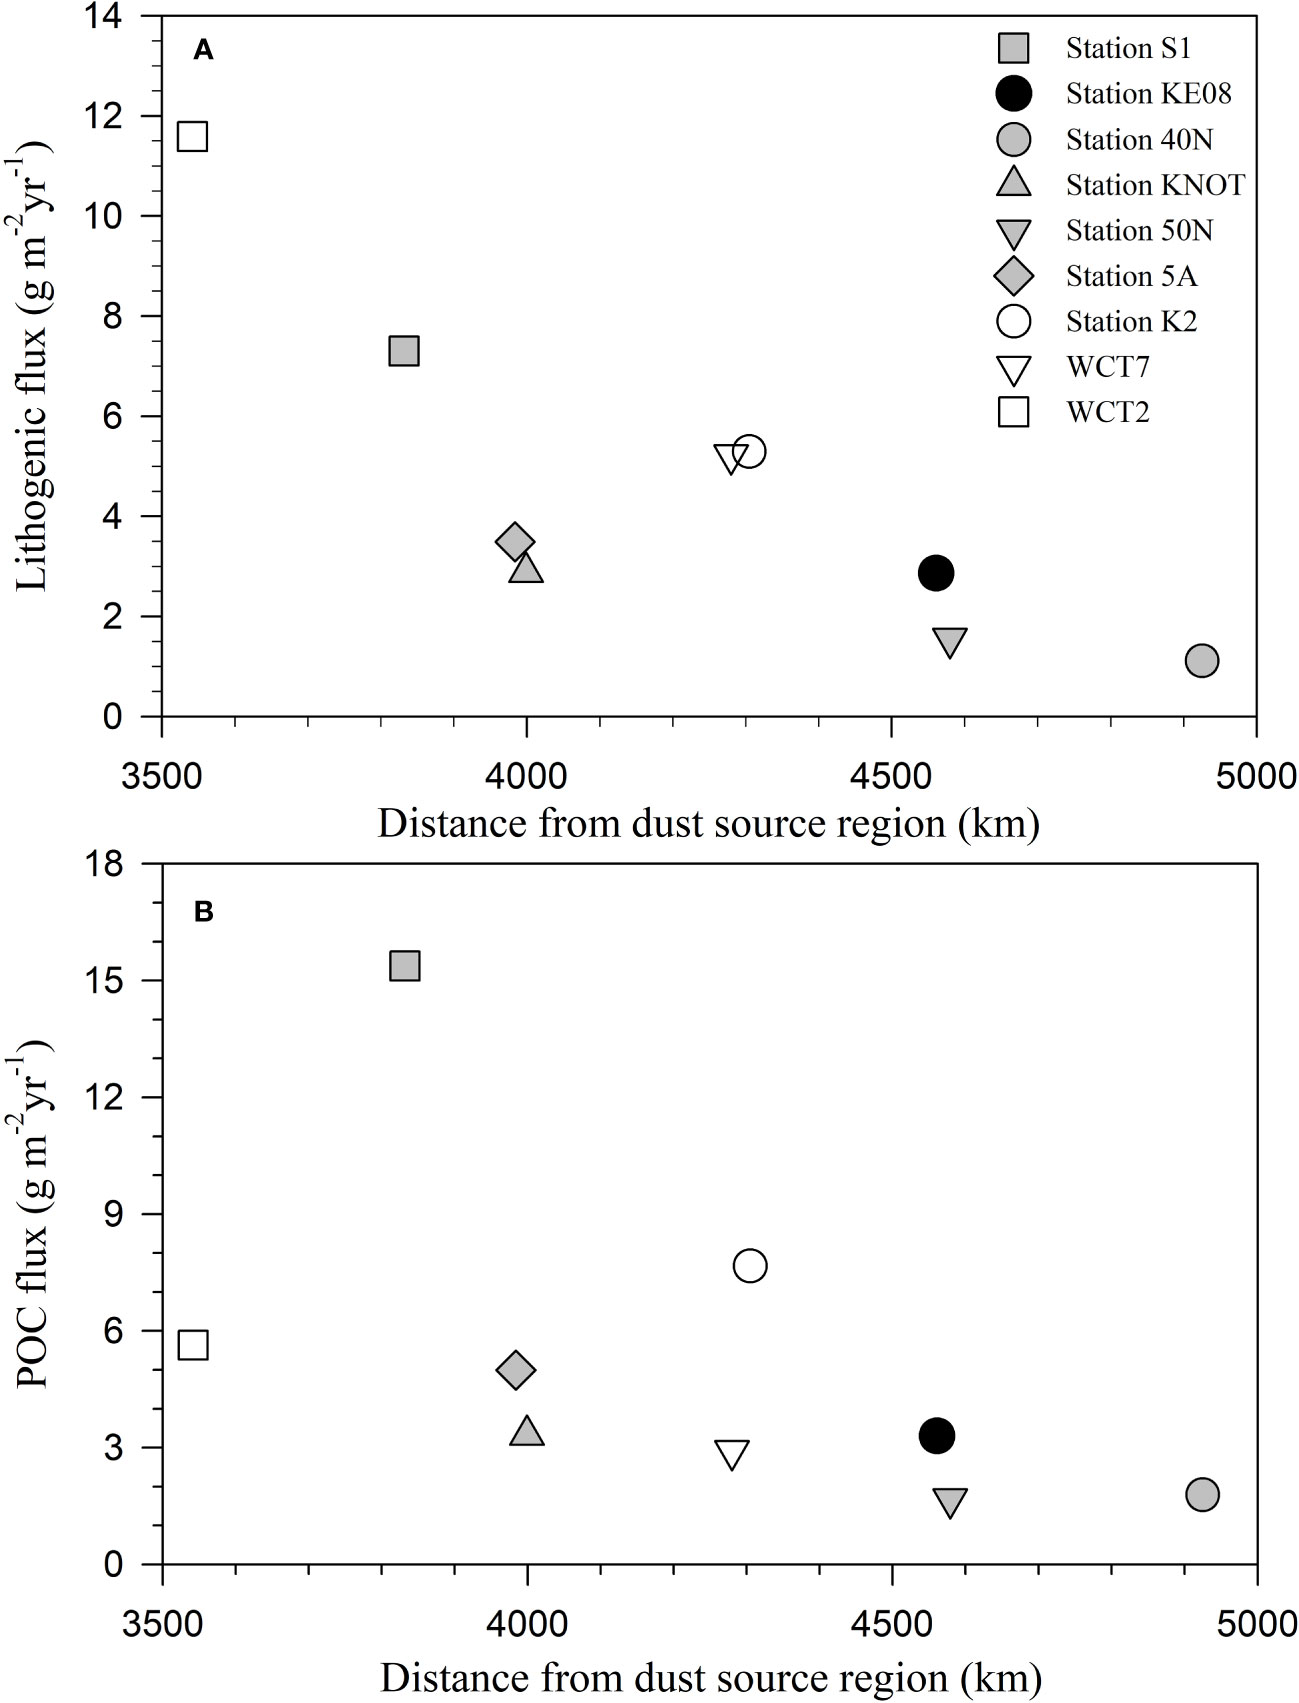
Figure 5 Variations in (A) lithogenic flux and (B) POC flux versus the distance between the dust source region (Gobi Desert; approximate location: 42°48′N and 105°02′E) to various sediment trap sites in the downwind region of the northwest Pacific.
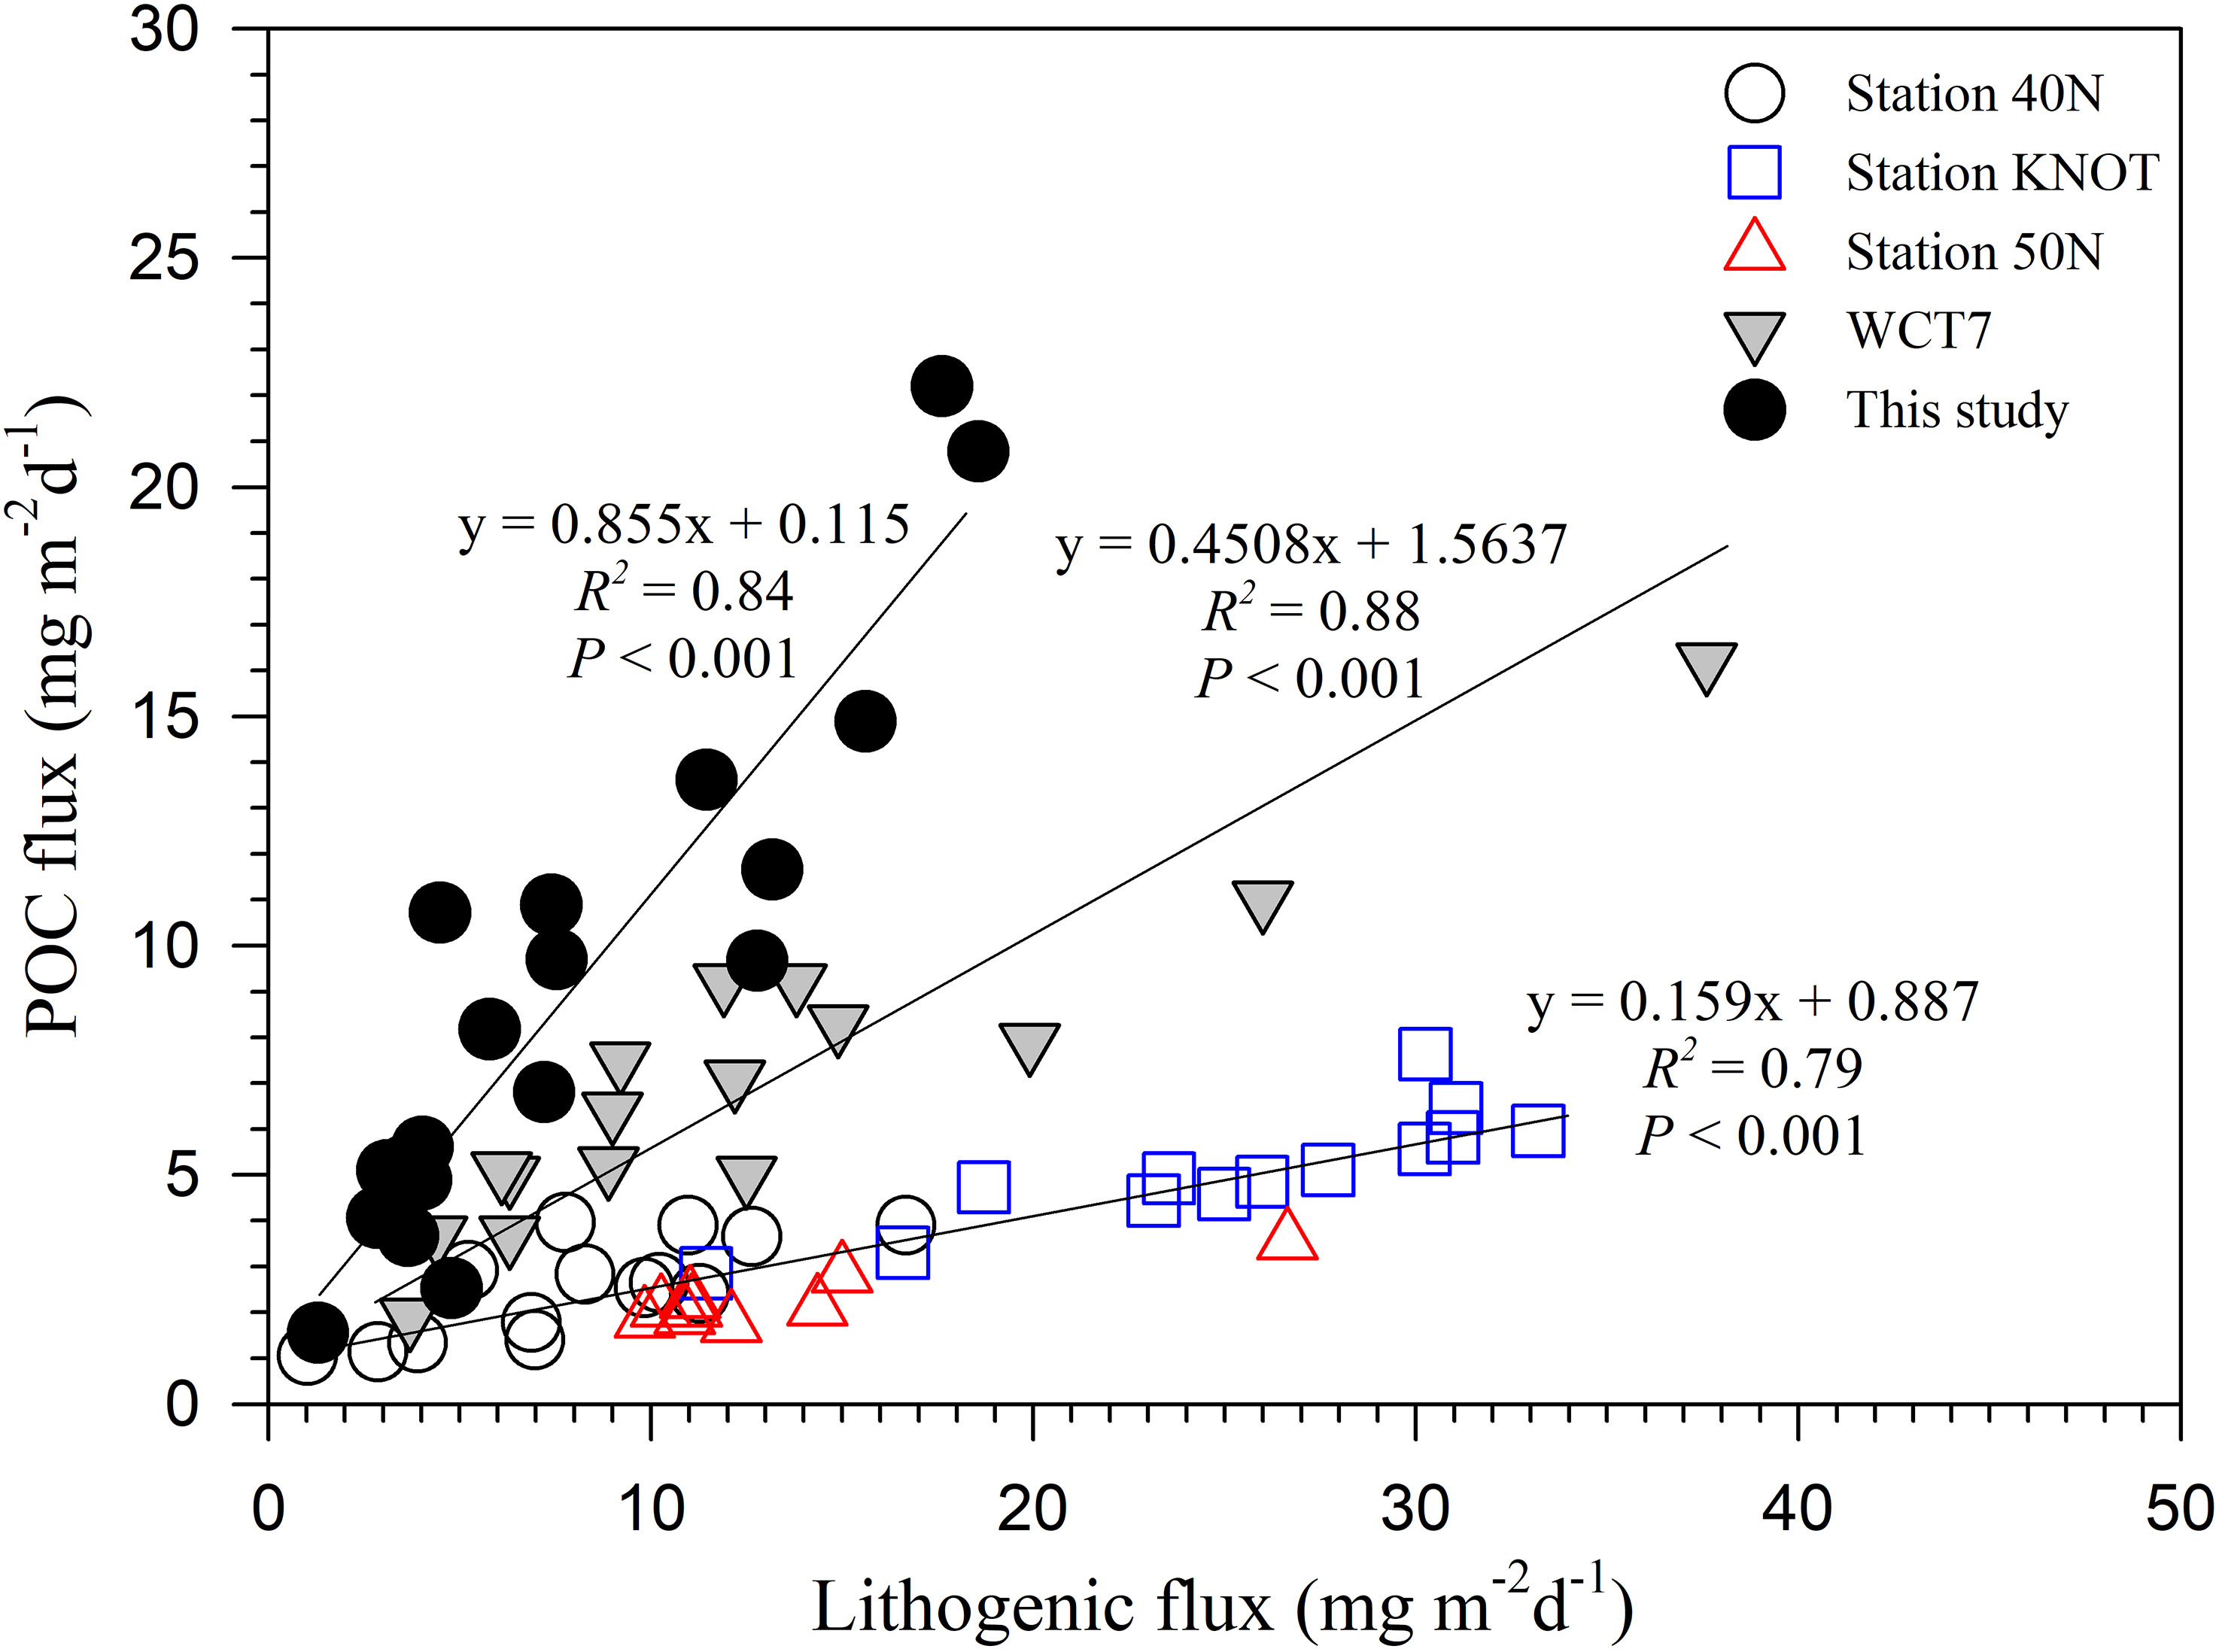
Figure 6 Cross plot of POC flux versus lithogenic material flux at five sediment trap sites in the northwest Pacific. The results of linear regression are provided for stations KE08 (this study), WCT7, and the other three sites (40N, 50N, and KNOT). Data from stations 40N, 50N, and KNOT were taken from Honda et al. (2002) and the Japan Agency for Marine-Earth Science and Technology (JAMSTEC) Ocean site sediment trap data (http://jamstec.go.jp/k2oceansites). Particle flux data from stations 40N, 50N, and KNOT were collected from December 1997 to July 1998 (Honda et al., 2002). Data from Station WCT7 were taken from Mohiuddin et al. (2004). Lithogenic material flux data from Station WCT7 were estimated as the difference between total particulate matter and the biogenic component.
5 Implications and conclusions
We investigated particle fluxes to a depth of 800 m in the northwest Pacific over a period of ~10 months and examined their relationship with NPP and the dust deposition flux. We observed strong coupling between EAD deposition and particle flux, suggesting that dust deposition plays a role in enhancing carbon export. Changes in the EAD flux will influence the efficiency of the biological pump and therefore, in turn, oceanic CO2 uptake in the northwest Pacific. However, considering that the enhanced POC flux was accompanied by increased CaCO3 flux, i.e., the enhanced counter pump (Salter et al., 2014), the role of EAD in atmospheric CO2 uptake into the surface layer should be investigated more carefully based on its influence on the plankton community and the ratio of POC to CaCO3 in sinking particles. The springtime dust aerosol emissions over East Asia and the North Pacific increased during the interval 1999–2009, followed by a decreasing trend due to increasing vegetation cover in the source regions (An et al., 2018; Wu et al., 2022). The recent downturn in spring EAD events may affect carbon export efficiency in the northwest Pacific. Thus, careful and continuous examination of EAD deposition and particle fluxes are necessary to understand the influence of dust deposition on carbon export efficiency in the northwest Pacific.
Data availability statement
The original contributions presented in the study are included in the article/Supplementary Material. Further inquiries can be directed to the corresponding author.
Author contributions
HK, DK, and JH designed experiment design and writing. Y-GP: project administration. K-YC: trace metal analysis, JP, SA, KK, JN: phytoplankton community analysis and data. J-YP: satellite data processing and data interpretation. All authors contributed to the article and approved the submitted version.
Funding
The authors declare financial support was received for the research, authorship, and/or publication of this article. This work was supported by the Korea Institute of Ocean Science and Technology (PE99963).
Conflict of interest
The authors declare that the research was conducted in the absence of any commercial or financial relationship that could be construed as a potential conflict interest.
Publisher’s note
All claims expressed in this article are solely those of the authors and do not necessarily represent those of their affiliated organizations, or those of the publisher, the editors and the reviewers. Any product that may be evaluated in this article, or claim that may be made by its manufacturer, is not guaranteed or endorsed by the publisher.
Supplementary material
The Supplementary Material for this article can be found online at: https://www.frontiersin.org/articles/10.3389/fmars.2023.1180480/full#supplementary-material
References
Acker J. G., Leptoukh G. (2007). Online analysis enhances use of NASA earth science data. Eos Trans. Am. Geophysical Union 88 (2), 14–17. doi: 10.1029/2007EO020003
An L., Che H., Xue M., Zhang T., Wang H., Wang Y., et al. (2018). Temporal and spatial variations in sand and dust storm events in East Asia from 2007 to 2016: Relationships with surface conditions and climate change. Sci. Total Environ. 633 (15), 452–462. doi: 10.1016/j.scitotenv.2018.03.068
Armstrong R. A., Lee C., Hedges J. I., Honjo S., Wakeham S. G. (2001). A new, mechanistics model for organic carbon fluxes in the ocean based on the quantitative association of POC with ballast minerals. Deep. Sea Res. Part II 49, 219−236. doi: 10.1016/S0967-0645(01)00101-1
Ayers J. M., Lozier M. S. (2012). Unraveling dynamical controls on the North Pacific carbon sink. J. Geophys. Res.: Oceans 117 (C1), C01017. doi: 10.1029/2011JC007368
Baker E. T., Milburn H. B., Tennant D. A. (1988). Field assessment of sediment trap efficiency under varying flow conditions. J. Mar. Res. 46 (3), 573–592. doi: 10.1357/002224088785113522
Behrenfeld M. J., Falkowski P. G. (1997). Photosynthetic rates derived from satellite-based chlorophyll concentration. Limnol. Oceanogr. 42 (1), 1−20. doi: 10.4319/lo.1997.42.1.0001
Behringer D. W., Xue Y. (2004). “Evaluation of the global ocean data siimilation system at NCEP: the Pacific Ocean,” in Eight Symposium on Integrated Observing and Assimilation Systems for Atmosphere, Oceans, and Land surface, AMS 84th annual meeting, Washington State convention and trade center, Seattle, Washington, 11−15.
Berelson W. (2002). Particle settling rates increase with depth in the ocean. Deep. Sea Res. Part II 49, 237−251. doi: 10.1016/s0967-0645(01)00102-3
Bishop J. K. B., Davis R. E., Sherman J. T. (2002). Robotic observations of dust storm enhancement of carbon biomass in the north pacific. Science 298 (5594), 817. doi: 10.1126/science.1074961
Bishop J. K. B., Fong M. B., Wood T. J. (2016). Robotic observations of high wintertime carbon export in California coastal waters. Biogeosciences 13, 3109−3129. doi: 10.5194/bg-13-3109-2016
Brust J., Schulz-Bull D. E., Leipe T., Chavagnac V., Waniek J. J. (2011). Descending particles: from the atmosphere to the deep ocean - a time series study in the subtropical NE Atlantic. Geophys. Res. Lett. 38, L06603. doi: 10.1029/2010GL045399
Buesseler K. O., Antia A. N., Chen M., Fowler S. W., Gardner W. D., Gustafsson O., et al. (2007). An assessment of the use of sediment traps for estimating upper ocean particle fluxes. J. Mar. Res. 65 (3), 345–416. doi: 10.1357/002224007781567621
Buesseler K. O., Boyd P. W., Black E. E., Siegel D. A. (2020). Metrics that matter for assessing the ocean biological carbon pump. Proc. Natl. Acad. Sci. 117 (18), 9679. doi: 10.1073/pnas.1918114117
Churnside J. H., Marchbanks R. D. (2015). Subsurface plankton layers in the Arctic Ocean. Geophys. Res. Lett. 42, 4896−4902. doi: 10.1002/2015GL064503
DeMaster D. J. (1981). The supply and accumulation of silica in the marine environment. Geochim. Cosmochim. Acta 45 (10), 1715–1732. doi: 10.1016/0016-7037(81)90006-5
Duce R. A., Tindale N. W. (1991). Atmospheric transport of iron and its deposition in the ocean. Limnol. Oceanogr. 36 (8), 1715−1726. doi: 10.4319/lo.1991.36.8.1715
Friedrich T., Oschlies A. (2009). Neural network-based estimates of North Atlantic surface pCO2 from satellite data: A methodological study. J. Geophys. Res.: Oceans 114, C03020. doi: 10.1029/2007JC004646
Furuya K., Marumo R. (1983). The structure of the phytoplankton community in the subsurface chlorophyll maxima in the western North Pacific Ocean. J. Plankton Res. 5 (3), 393−406. doi: 10.1093/plankt/5.3.393
Gardner W. D. (1985). The effect of tilt on sediment trap efficiency. Deep. Sea Res. 32 (3), 349–361. doi: 10.1016/0198-0149(85)90083-4
German C. R., Colley S., Palmer M. R., Khripounoff A., Klinkhammer G. P. (2002). Hydrothermal plume-particle fluxes at 13°N on the East Pacific Rise. Deep. Sea Res. Part I. 49 (1), 1921−1940. doi: 10.1016/s0967-0637(02)00086-9
Gomez-Letona M., Ramos A. G., Coca J., Aristegui J. (2017). Trends in primary production in the Canary Current upwelling system-A regional perspective comparing remote sensing models. Front. Mar. Sci. 4. doi: 10.3389/fmars.2017.00370
Gu F., Wu G., Zhang C., Yan N., Huang J. (2020). Geochemistry of surface soil in the Eastern Pamirs and its implications for Muztagata ice core dust provenance. Appl. Geochem. 121, 104724. doi: 10.1016/j.apgeochem.2020.104724
Honda M. C. (2020). Effective vertical transport of particulate organic carbon in the western North Pacific subarctic region. Front. Earth Sci. 8, 366. doi: 10.3389/feart.2020.00366
Honda M. C., Imai K., Nojiri Y., Hoshi F., Sugawara T., Kusakabe M. (2002). The biological pump in the northwestern North Pacific based on fluxes and major components of particulate matter obtained by sediment-trap experiments, (1997-2000). Deep. Sea Res. Part II 49, 5595−5625. doi: 10.1016/S0967-0645(02)00201-1
Honda M. C., Kawakami H., Matsumoto K., Wakita M., Fujiki T., Mino Y., et al. (2016). Comparison of sinking particles in the upper 200 m between subarctic station K2 and subtropical station S1 based on drifting sediment trap experiments. J. Oceanogr. 72, 373−386. doi: 10.1007/s10872-015-0280-x
Honda M. C., Sasai Y., Siswanto E., Kuwano-Yoshida A., Aiki H., Cronin M. (2018). Impact of cyclonic eddies and typhoons on biogeochemistry in the oligotrophic ocean based on biogeochemical/physical/meteorological time-series at station KEO. Prog. Earth Planet. Sci. 5, 42. doi: 10.1186/s40645-018-0196-3
Honjo S., Dymond J., Collier R., Manganini S. J. (1995). Export production of particles to the interior of the equatorial Pacific Ocean during the 1992 EqPac experiment. Deep. Sea Res. Part II 42, 831−870. doi: 10.1016/0967-0645(95)00034-N
Honjo S., Francois R., Manganini S., Dymond J., Collier R. (2000). Particle fluxes to the interior of the Southern Ocean in the western Pacific sector along 170°W. Deep. Sea Res. Part II 47 (15), 3521−3548. doi: 10.1016/s0967-0645(00)00077-1
Hopkins J., Henson S. A., Painter S. C., Tyrrell T., Poulton A. J. (2015). Phenological characteristics of global coccolithophore blooms. Global Biogeochem. Cycles 29, 239−253. doi: 10.1002/2014GB004919
Hsu S. C., Liu S. C., Arimoto R., Liu T. H., Huang Y. T., Tsai F., et al. (2009). Dust deposition to the East China Sea and its biogeochemical implications. J. Geophys. Res.: Atmos. 114 (D15), D15304. doi: 10.1029/2007JD009574
Ittekkot V., Haake B. (1990). The terrestrial link in the removal of organic carbon, in Facets of Modern Biogeochemistry. edited. Kempe S., Kaz’mierczak J., Ittekkot V., Michaelis W., Spitzy A. (Berlin: Springer), 319–325.
Jickells T. D., An Z. S., Andersen K. K., Baker A. R., Bergametti G., Brooks N., et al. (2005). Global iron connections between desert dust, ocean biogeochemistry, and climate. Science 308 (5718), 67−71. doi: 10.1126/science.1105959
Kanatani K. T., Okumura M., Tohno S., Adachi Y., Sato K., Nakayama T. (2014). Indoor particle counts during Asian dust events under everyday conditions at an apartment in Japan. Environ. Health Prev. Med. 19 (1), 81–88. doi: 10.1007/s12199-013-0356-4
Kim H. J., Kim D., Yoo C. M., Chi S.-B., Khim B. K., Shin H.-R., et al. (2011). Influence of ENSO variability on sinking-particle fluxes in the northeastern equatorial Pacific. Deep. Sea Res. Part I. 58 (8), 865–874. doi: 10.1016/j.dsr.2011.06.007
Kim H. J., Kim D., Yoo C. M., Park J. Y., Jeong H., Hwang J. (2021). Biological carbon pump efficiency enhanced by atmospheric dust deposition in the North Pacific Subtropical Gyre. J. Mar. Syst. 224, 103634. doi: 10.1016/j.jmarsys.2021.103634
Klaas C., Archer D. E. (2002). Association of sinking organic matter with various types of mineral ballast in the deep sea: Implications for the rain ratio. Global Biogeochem. Cycles 16 (4), 1116. doi: 10.1029/2001GB001765
Kuwahara V. S., Nozaki S., Nakano J., Toda T., Kikuchi T., Taguchi S. (2015). 18-year variability of ultraviolet radiation penetation in the mid-latitude coastal waters of the western boundary Pacific. Estuar. Coast. Shelf Sci. 160, 1−9. doi: 10.1016/j.ecss.2015.03.029
Lam P. J., Bishop J. K. B., Henning C. C., Marcus M. A., Waychunas G. A., Fung I. Y. (2006). Wintertime phytoplankton bloom in the subarctic Pacific supported by continental margin iron. Global Biogeochem. Cycles 20, GB1006. doi: 10.1029/2005GB002557
Lam P. J., Doney S. C., Bishop J. K. B. (2011). The dynamic ocean biological pump: Insights from a global compilation of particulate organic carbon, CaCO3, and opal concentration profiles from the mesopelagic. Global Biogeochem. Cycles 25, GB3009. doi: 10.1029/2010GB003868
Leblanc K., Queguiner B., Diaz F., Cornet V., Michel-Rodriguez M., de Madron X. D., et al. (2018). Nanoplanktonic diatims are globally overlooked but play a role in sping blooms and carbon export. Nat. Commun. 9, 953. doi: 10.1038/s41467-018-03376-9
Lee K. E., Bahk J. J., Narita H. (2003). Temporal variations in productivity and planktonic ecological structure in the East Sea (Japan Sea) since the last glaciation. Geo-Mar. Lett. 23, 125−129. doi: 10.1007/s00367-003-0132-3
Lee Y. G., Ho C.-H., Kim J.-H., Kim J. (2015). Quiescence of Asian dust events in South Korea and Japan during 2012 spring: Dust outbreaks and transports. Atmos. Environ. 114, 92–101. doi: 10.1016/j.atmosenv.2015.05.035
Li T., Masuzawa T., Kitagawa H. (2004). Seasonal variations in settling fluxes of major components in the oligotrophic Shikoku Basin, the western North Pacific: coincidence of high biogenic flux with Asian dust supply in spring. Mar. Chem. 91 (1), 187–210. doi: 10.1016/j.marchem.2004.06.010
Maeda L., Kawahata H., Nohara M. (2002). Fluctuation of biogenic and abiogenic sedimentation on the Shatsky Rise in the western North Pacific during the late Quaternary. Mar. Geol. 189, 197–214. doi: 10.1016/S0025-3227(02)00405-X
Mahowald N. (2011). Aerosol indirect effect on biogeochemical cycles and climate. Science 334, 794−796. doi: 10.1126/science.1207374
Martin J. H. (1990). Glacial-interglacial CO2 change: The iron hypothesis. Paleoceanography 5 (1), 1−13. doi: 10.1029/PA005i001p00001
Martino M., Hamilton D., Baker A. R., Jickells T. D., Bromlry T., Nojiri Y., et al. (2014). Western Pacific atmospheric nutrient deposition fluxes, their impact on surface ocean productivity. Global Biogeochem. Cycles 28 (7), 712−728. doi: 10.1002/2013GB004794
Matsumoto K., Abe O., Fujiki T., Sukigara C., Mino Y. (2016). Primary productivity at the time-series stations in the northwestern Pacific Ocean: is the subtropical station unproductive? J. Oceanogr. 72, 359−371. doi: 10.1007/s10872-016-0354-4
Matsumoto K., Sasai Y., Sasaoka K., Siswanto E., Honda M. C. (2021). The formation of subtropical phytoplankton blooms is dictated by water column stability during winter and spring in the oligotrophic Northwestern North Pacific. J. Geophys. Res. Oceans. 126, e2020JC016864. doi: 10.1029/2020JC016864
Mohiuddin M. M., Nishimura A., Tanaka Y., Shimamoto A. (2002). Regional and interannual productivity of biogenic components and planktonic foraminiferal fluxes in the northwestern Pacific basin. Mar. Micropaleontol. 45 (1), 57−82. doi: 10.1016/S0377-8398(01)00045-7
Mohiuddin M. M., Nishimura A., Tanaka Y., Shimamoto A. (2004). Seasonality of biogenic particle and planktonic foraminifera fluxes: response to hydrographic variability in the Kuroshio Extension, northwestern Pacific Ocean. Deep. Sea Res. Part I. 51 (11), 1659−1683. doi: 10.1016/j.dsr.2004.06.002
Moore T. C. (1973). Method of randomly distributing grains for microscopic examination. J. Sediment. Petrol. 43 (3), 904–906. doi: 10.1037/74D728BA-2B21-11D7-8648000102C1865D
Omand M. M., Govindarajan R., He J., Mahadevan A. (2020). Sinking flux of particulate organic matter in the oceans: Sensitivity to particle characteristics. Sci. Rep. 10 (1), 5582. doi: 10.1038/s41598-020-60424-5
Otosaka S., Noriki S. (2005). Relationship between composition of settling particles and organic carbon flux in the western North Pacific and the Japan Sea. J. Oceanogr. 61, 25−40. doi: 10.1007/s10872-005-0017-3
Pabortsava K., Lampitt R. S., Benson J., Crowe C., McLachlan R., Le Moigne F. A. C., et al. (2017). Carbon sequestration in the deep Atlantic enhanced by Saharan dust. Nat. Geosci. 10 (3), 189–194. doi: 10.1038/ngeo2899
Pennington J. T., Mahoney K. L., Kuwahata V. S., Kolber D. D., Calienes R., Chavez F. P. (2006). Primary production in the eastern tropical Pacific: A review. Prog. Oceanogr. 69, 285−317. doi: 10.1016/j.pocean.2006.03.012
Reynolds R. W., Rayner N. A., Smith T. M., Stokes D. C., Wang W. (2002). An improved in situ and satellite SST analysis for climate. J. Clim. 15, 1609−1625. doi: 10.1175/1520-0442(2002)015<1609:AIISAS>2.0.CO;2
Sabine C. L., Feely R. A., Gruber N., Key R. M., Lee K., Bullister J. L., et al. (2004). The oceanic sink for anthropogenic CO2. Science 305 (5682), 367. doi: 10.1126/science.1097403
Salter I., Schiebel R., Ziveri P., Movellan A., Lampitt R., Wolff G. A. (2014). Carbonate counter pump stimulated by natural iron fertilization in the Polar Frontal Zone. Nat. Geosci. 7, 885−889. doi: 10.1038/ngeo2285
Sancetta C., Calvert S. E. (1988). The annual cycle of sedimentation in Saanich inlet, British Columbia: implications for the interpretation of diatom fossil assemblages. Deep. Sea Res. Part A. 35 (1), 71–90. doi: 10.1016/0198-0149(88)90058-1
Simonsen R. (1974). The diatom plankton of the Indian Ocean Expedition of R/V Meteor 1964–5. “Meteor” Forschungsergebnisse Reihe D 19. Borntrager, GEOMAR. 1–107.
Takahashi T., Olafsson J., Goddard J. G., Chipman D. W., Sutherland S. C. (1993). Seasonal variation of CO2 and nutrients in the high-latitude surface oceans: A comparative study. Global Biogeochem. Cycles 7 (4), 843−878. doi: 10.1029/93GB02263
Takahashi T., Sutherland S. C., Sweeney C., Poisson A., Metzl N., Tilbrook B., et al. (2002). Global sea–air CO2 flux based on climatological surface ocean pCO2, and seasonal biological and temperature effects. Deep. Sea Res. Part II 49 (9), 1601–1622. doi: 10.1016/S0967-0645(02)00003-6
Takahashi T., Sutherland S. C., Wanninkhof R., Sweeney C., Feely R. A., Chipman D. W., et al. (2009). Climatological mean and decadal change in surface ocean pCO2, and net sea–air CO2 flux over the global oceans. Deep. Sea Res. Part II 56 (8), 554–577. doi: 10.1016/j.dsr2.2008.12.009
Tan S.-C., Yao X., Gao H.-W., Shi G.-Y., Yue X. (2013). Variability in the correlation between asian dust storms and chlorophyll a concentration from the North to Equatorial Pacific. PloS One 8 (2), e57656. doi: 10.1371/journal.pone.0057656
Tegen I., Lacis A. A., Fung I. (1996). The influence on climate forcing of mineral aerosols from disturbed soils. Nature 380, 419−422. doi: 10.1038/380419a0
Trapote M. C., Vegas-Vilarrúbia T., López P., Puche E., Gomà J., Buchaca T., et al. (2018). Modern sedimentary analogues and integrated monitoring to understand varve formation in the Mediterranean Lake Montcortès (Central Pyrenees, Spain). Palaeogeogr. Palaeoclimatol. Palaeoecol. 496, 292–304. doi: 10.1016/j.palaeo.2018.01.046
Uematsu M., Wang Z., Uno I. (2003). Atmospheric input of mineral dust to the western North Pacific region based on direct measurements and a regional chemical transport model. Geophys. Res. Lett. 30 (6), 1342. doi: 10.1029/2002GL016645
Wu C., Lin Z., Shao Y., Liu X., Li Y. (2022). Drivers of recent decline in dust activity over East Asia. Nat. Commun. 13, 7105. doi: 10.1038/s41467-022-34823-3
Yoon J.-E., Lim J.-H., Shim J.-M., Kwon J.-I., Kim I.-N. (2019). Spring 2018 asian dust events: sources, transportation, and potential biogeochemical implications. Atmosphere 10 (5), 276. doi: 10.3390/atmos10050276
Young J. R., Ziveri P. (2000). Calculation of coccolith volume and it use in calibration of carbonate flux estimates. Deep. Sea Res. Part II 47 (9), 1679−1700. doi: 10.1016/S0967-0645(00)00003-5
Young J. R., Ziveri P., van Hinte J. E. (1999). “Coccolithophore export production and accumulation rates,” in On determination of sediment accumulation rates. Trans tech publications, Switzerland, 41–56.
Yu H., Tan Q., Chin M., Remer L. A., Kahn R. A., Bian H., et al. (2019). Estimates of African dust deposition along the Trans-Atlantic transit using the decade-long record of aerosol measurements from CALIOP, MODIS, MISR, and IASI. J. Geophys. Res. Atmos. 124 (14), 7975–7996. doi: 10.1029/2019JD030574
Zhang X. Y., Gong S. L., Shen Z. X., Mei F. M., Xi X. X., Liu L. C., et al. (2003). Characterization of soil dust aerosol in China and its transport and distribution during 2001 ACE-Asia: 1. Network observations. J. Geophys. Res. 108, 4261. doi: 10.1029/2002JD002633
Keywords: sediment trap, particle flux, POC flux, dust deposition, biological pump, northwest Pacific
Citation: Kim HJ, Kim D, Park Y-G, Park J-Y, Choi K-Y, Park JS, An SM, Kwon K, Noh JH and Hwang J (2023) Influence of atmospheric dust deposition on sinking particle flux in the northwest Pacific. Front. Mar. Sci. 10:1180480. doi: 10.3389/fmars.2023.1180480
Received: 06 March 2023; Accepted: 04 September 2023;
Published: 19 September 2023.
Edited by:
Makio Honda, Japan Agency for Marine-Earth Science and Technology (JAMSTEC), JapanReviewed by:
James Bishop, University of California, Berkeley, United StatesShigeyoshi Otosaka, The University of Tokyo, Japan
Copyright © 2023 Kim, Kim, Park, Park, Choi, Park, An, Kwon, Noh and Hwang. This is an open-access article distributed under the terms of the Creative Commons Attribution License (CC BY). The use, distribution or reproduction in other forums is permitted, provided the original author(s) and the copyright owner(s) are credited and that the original publication in this journal is cited, in accordance with accepted academic practice. No use, distribution or reproduction is permitted which does not comply with these terms.
*Correspondence: Jeomshik Hwang, amVvbXNoaWtAc251LmFjLmty