
95% of researchers rate our articles as excellent or good
Learn more about the work of our research integrity team to safeguard the quality of each article we publish.
Find out more
ORIGINAL RESEARCH article
Front. Mar. Sci. , 16 June 2023
Sec. Deep-Sea Environments and Ecology
Volume 10 - 2023 | https://doi.org/10.3389/fmars.2023.1177106
 Sergi Taboada1,2,3,4*
 Connie Whiting3,5
 Shuangqiang Wang6
 Pilar Ríos7
 Andrew J. Davies8,9
 Furu Mienis10
 Ellen Kenchington6
 Paco Cárdenas11
 Alex Cranston3
 Vasiliki Koutsouveli3,12
 Javier Cristobo7
 Hans Tore Rapp13,14†
 Jim Drewery15
 Francisco Baldó16Christine Morrow17Bernard Picton18
 Joana R. Xavier13,19
 Maria Belén Arias3,20
 Carlos Leiva21
 Ana Riesgo1,3,4
Little is known about dispersal in deep-sea ecosystems, especially for sponges, which are abundant ecosystem engineers. Understanding patterns of gene flow in deep-sea sponges is essential, especially in areas where rising pressure from anthropogenic activities makes difficult to combine management and conservation. Here, we combined population genomics and oceanographic modelling to understand how Northeast Atlantic populations (Cantabrian Sea to Norway) of the deep-sea sponge Phakellia ventilabrum are connected. The analysis comprised ddRADseq derived SNP datasets of 166 individuals collected from 57 sampling stations from 17 different areas, including two Marine Protected Areas, one Special Area of Conservation and other areas with different levels of protection. The 4,017 neutral SNPs used indicated high connectivity and panmixis amongst the majority of areas (Ireland to Norway), spanning ca. 2,500-km at depths of 99–900 m. This was likely due to the presence of strong ocean currents allowing long-distance larval transport, as supported by our migration analysis and by 3D particle tracking modelling. On the contrary, the Cantabrian Sea and Roscoff (France) samples, the southernmost areas in our study, appeared disconnected from the remaining areas, probably due to prevailing current circulation patterns and topographic features, which might be acting as barriers for gene flow. Despite this major genetic break, our results suggest that all protected areas studied are well-connected with each other. Interestingly, analysis of SNPs under selection replicated results obtained for neutral SNPs. The relatively low genetic diversity observed along the study area, though, highlights the potential fragility of this species to changing climates, which might compromise resilience to future threats.
The deep-sea floor is the least studied ecosystem on the planet, although it is the largest and one of the most complex in terms of ecosystem service provisioning (Thurber et al., 2014). Understanding the scales at which dispersal and connectivity occur is central to design efficient protective areas, but the costs and challenges associated with performing biodiversity surveys in the deep sea derive in a lack of basic information for a wide variety of taxa (Baco et al., 2016; Zeng et al., 2019) that is critical to assess and conserve them. It is generally accepted that barriers to dispersal in the deep sea do not exist (or are limited in their strength) as compared to land, and therefore population isolation tends to occur over bathymetric ranges and it is rarely driven by distance (Taylor and Roterman, 2017). Populations of both vertebrates and invertebrates may be connected over hundreds or thousands of kilometres at similar depths (Taboada et al., 2018; Andrews et al., 2020), but vertical changes of few hundred metres can impede larval dispersal, due to the difficulties that larvae and/or adults may have in performing vertical migrations (Young et al., 1996; Gary et al., 2020) and may even lead to the emergence of cryptic species (Zardus et al., 2006; Schüller, 2011). Connectivity among deep-sea chemosynthetic habitats have attracted the strongest interest in the latest years (see Taylor and Roterman, 2017), but the peculiarities of these habitats (ephemerality and perpetual non-equilibrium) limit their relevance to other deep-sea ecosystems, like deep-sea coral reefs or sponge grounds, which are consitutively more stable and long-lived (Schröder-Ritzrau et al., 2005; Maldonado et al., 2017), and therefore face significantly different challenges upon anthropogenic threats. Deep-sea corals have been relatively well studied in areas such as the North Atlantic, with species such as Paramuricea biscaya and the reef-building Lophelia pertusa as the most prominent examples, showing isolation by distance when studied at large scales in the later and isolation by depth when studied at smaller scales in the former (le Goff-Vitry et al., 2004; Morrison et al., 2011; Galaska et al., 2021; Liu et al., 2021). However, far less is known about deep-water sponge grounds to that respect.
Deep-water sponge grounds have been recognised as Vulnerable Marine Ecosystems (VMEs) by the United Nations General Assembly (resolution 61/105) (UNGA, 2006). Whilst several protective legislations exist, which aim to reduce immediate threats such as destruction from fishing gear, their efficacy may be limited (Hogg et al., 2010). The importance of sponge grounds for ecosystem function and services derive from their capacity to increase the local biodiversity (Beazley et al., 2013; Kutti et al., 2013; Hawkes et al., 2019; Ramiro-Sánchez et al., 2019), including fish species that recruit and live in these habitats (Kenchington et al., 2013; Pham et al., 2015; Meyer et al., 2019), their contribution to drive the cycling of key nutrients (De Goeij et al., 2013; Rix et al., 2018; Maier et al., 2020), and their implication in transferring energy between benthic and pelagic zones (Maldonado et al., 2017). Indeed, sponges offer ecosystem services that even benefit humans (Buhl-Mortensen et al., 2010; Paoli et al., 2017; Pham et al., 2019).
Similar to other marine ecosystems, nowadays deep-sea sponge ground VMEs face a number of threats that challenge their current status. Many areas of the deep sea are targeted by the fishing industry, which have resulted in the depletion of several commercial fish stocks (Morato et al., 2006), and consequently, the largest threat that sponge grounds face is physical damage from bottom-contact fishing (Roberts, 2002; Pham et al., 2019). But impacts from oil prospecting and deep-sea mining are also on the rise, in the search of the discovery of rare elements essential to the low-carbon energy industry (Wedding et al., 2015), resulting in significant decreases in both diversity and abundance of megafauna including sponges (e.g. Jones et al., 2006; Jones et al., 2007). Climate change poses yet another serious threat to sponge grounds by altering water temperature, pH, salinity, and the ocean currents and stratification, with subsequent effects on their growth rate, distribution, and reproduction (Hughes and Narayanaswamy, 2013; Morato et al., 2020; Puerta et al., 2020). As for many other marine organisms, sponges rely on free-living larvae for dispersal, and changes in regime of ocean currents may influence the trajectories of larval dispersal, thus affecting population connectivity by reducing gene flow and/or isolating populations (Young et al., 2012; Fox et al., 2016). Importantly, the cumulative threats faced by sponges likely have a negative impact on the genetic diversity of the species that would lead to reduction in their resilience to environmental change, ultimately reducing the species adaptive evolutionary potential (Spielman et al., 2004; Botsford et al., 2009), and further increasing their vulnerability to ongoing anthropogenic threats (Zeng et al., 2019). To improve effective conservation and management plans, it is therefore crucial to understand the genetic diversity, molecular connectivity patterns and turnover at the population level of the species involved (Baco et al., 2016).
Whilst most sponges in shallow habitats have highly-structured populations and exhibit inbreeding even at small geographic ranges (Pérez-Portela and Riesgo, 2018), the patterns of molecular connectivity in deep-sea sponges are poorly known, although the few studies available point to conflicting patterns (Brown et al., 2017; Taboada et al., 2018; Busch et al., 2020; Taboada et al., 2022). In the shallow ocean, sponge population structure is often attributed to the lecithotrophic nature of larvae, as propagules cannot swim freely for extended periods of time (Maldonado, 2006). But in deep-sea sponges, where lecithotrophic larvae also presumably occur, some studies point to high connectivity (Brown et al., 2017; Taboada et al., 2018; Busch et al., 2020) while others find high population structure (Brown et al., 2017). Although the studies showing connectivity over large areas may suggest that larvae are able to travel further, almost nothing is known about the reproduction and dispersal behaviour in deep-sea sponges (Witte, 1996). Instead, there is growing evidence that suggests that larval duration is not the principal factor shaping connectivity in sponges and other marine invertebrates from the deep-sea, but hydrographic features such as ocean currents and topographic features (see Taylor and Roterman, 2017). In this sense, Lagrangian particle tracking models that use virtual advected particles on underlying numerical ocean models, are increasingly used to assess connectivity in the deep sea (Xu et al., 2018; Kenchington et al., 2019; Zeng et al., 2019) and in some cases have been integrated with genetic approaches to examine population structure (Kenchington et al., 2006; Miller and Gunasekera, 2017; Taboada et al., 2018; Bracco et al., 2019).
Here, we present the case of Phakellia ventilabrum (Linnaeus, 1767), a common deep-water demosponge that forms relatively dense aggregations on rock-sand habitats across the North Atlantic Ocean (up to more than 2,500 specimens/ha in the Cantabrian Sea; Sánchez et al., 2009) and also hosts diverse epifaunal communities (Klitgaard, 1995; Sánchez et al., 2009; Maldonado et al., 2017). This axinellid has a wide distribution range spanning the Barents Sea, the Norwegian Shelf towards the North West Approaches (including Faroe Shetland Channel, Wyville Thomson Ridge, and the Rockall Channel), and along the continental shelf towards Iceland and Newfoundland. Aggregations have been reported in the Western Mediterranean Sea (de Voogd et al., 2022), Brittany and the Cantabrian Sea (Maldonado et al., 2017). The bathymetric range of P. ventilabrum is also wide, occurring from shallow waters of 10 m to depths reaching 1,863 m (Prado et al., 2020). Phakellia ventilabrum is an oviparous and most certainly gonochoristic species, reproducing in May and September, with potentially a lecithotrophic larva or direct development, given the amount of nutrients accumulated in the egg during vitellogenesis (Koutsouveli et al., 2022). Our aim was to investigate the genetic diversity and molecular connectivity patterns of this species in the NE Atlantic from a wide geographic range (>3.000 km), including areas with different levels of protection to understand whether these areas are effectively helping to preserve the genetic diversity of P. ventilabrum. While the connectivity patterns of P. ventilabrum are unknown, a recent study by Taboada et al. (2022) detected panmixis and predominant northward migration in Phakellia robusta Bowerbank, 1866, despite the sampling locations being separated by ca. 2000 km. The inferred molecular connectivity in P. robusta was likely explained by the prevalent poleward ocean currents present in the study area spanning from Ireland to Norway. However, Taboada et al. (2022) used just few specimens collected from a small number of locations, thus limiting the breadth of the conclusions derived for their work. Complex interactions between biological and physical factors makes challenging the prediction of connectivity (Giles et al., 2015). This fact, combined with the paucity of available information regarding deep-sea sponge ecology, highlights the need to investigate species distributions and genetic diversity across multiple spatial scales. Here, we used ddRADseq-derived SNPs from 166 individuals of P. ventilabrum collected over a wide geographic area (>3.000 km), combined with oceanographic circulation models provided with the specific reproductive features of the species, to explain the connectivity patterns and distribution of the genetic diversity of the sponge. This is the first study to provide a comprehensive range-wide genetic survey in deep-sea sponges.
A total of 176 specimens of Phakellia ventilabrum were collected from 57 sampling sites within the NE Atlantic, which we grouped in 17 defined areas according to geomorphic and depth features (Figure 1 and Table 1). Samples from the Cantabrian Sea were collected during three cruises (July 2010, May 2011 and June 2017) using a rock dredge on board the French B/O Thalassa (IFREMER/IEO) and the Spanish B/O Vizconde de Eza and R/V Ángeles Alvariño, respectively. The sample from Roscoff was collected by scuba diving (March 2018). Samples from Kerry Head Reef were collected using an anchor dredge on board the R/V Celtic Voyager (August 2013). The sample from the Porcupine Bank was collected using a Baca-GAV bottom trawl on board the R/V Vizconde de Eza (September 2018). Samples from the Rockall Bank, Upper Hebridean Shelf South, Shetland Shelf South, Upper Hebridean Shelf North, Shetland Shelf North Shallow, Shetland Shelf North-Deep Wyville, Wyville Thomson Ridge Deep, Faroe Shetland Sponge Belt, and North of Shetland were collected by bottom trawl either on board the MFV Scotia (August 2018–February 2019) or onboard a chartered commercial vessel (April-May 2018). Samples from Sweden were collected in two different cruises using a rock dredge on board the R/V Skagerrak (February 2013) and with a remotely operated vehicle (ROV) on board the R/V Nereus (March 2019). Samples from Norway-Korsfjorden were collected using a triangular dredge on board the R/V Hans Brattstrøm (September 2016) and R/V Kristine Bonnevie (May 2017). The sample from Sula Reef was collected using the ROV ÆGIR 6000 on board the R/V G.O. Sars (July 2017). Samples from Trondheimsfjorden were collected using a triangular dredge on board the R/V Hans Brattstrøm (October 2010). Samples from Tromsøflaket were collected using the ROV ÆGIR 6000 on board the R/V G.O. Sars (August 2018).
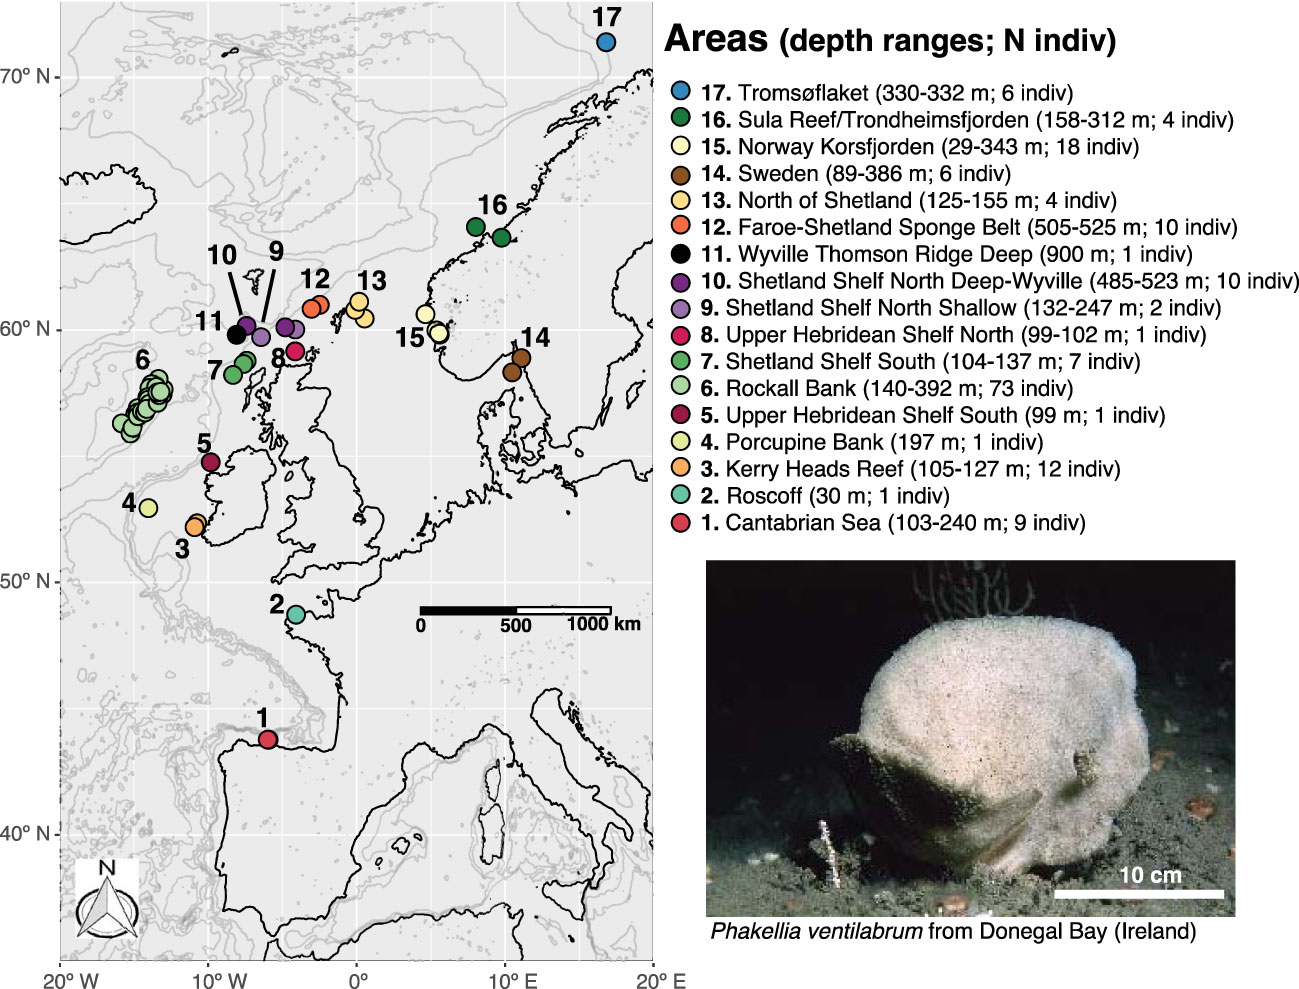
Figure 1 Map of the study area including the information on the areas and depth ranges and number of individuals (in brackets) where samples of Phakellia ventilabrum were collected. Living specimen of P. ventilabrum from Beltra Rock (Bob’s Pinnacle), Donegal Bay (Ireland; 54°34’26.4”N, 8°17’52.8” W). This area was not included in the study.
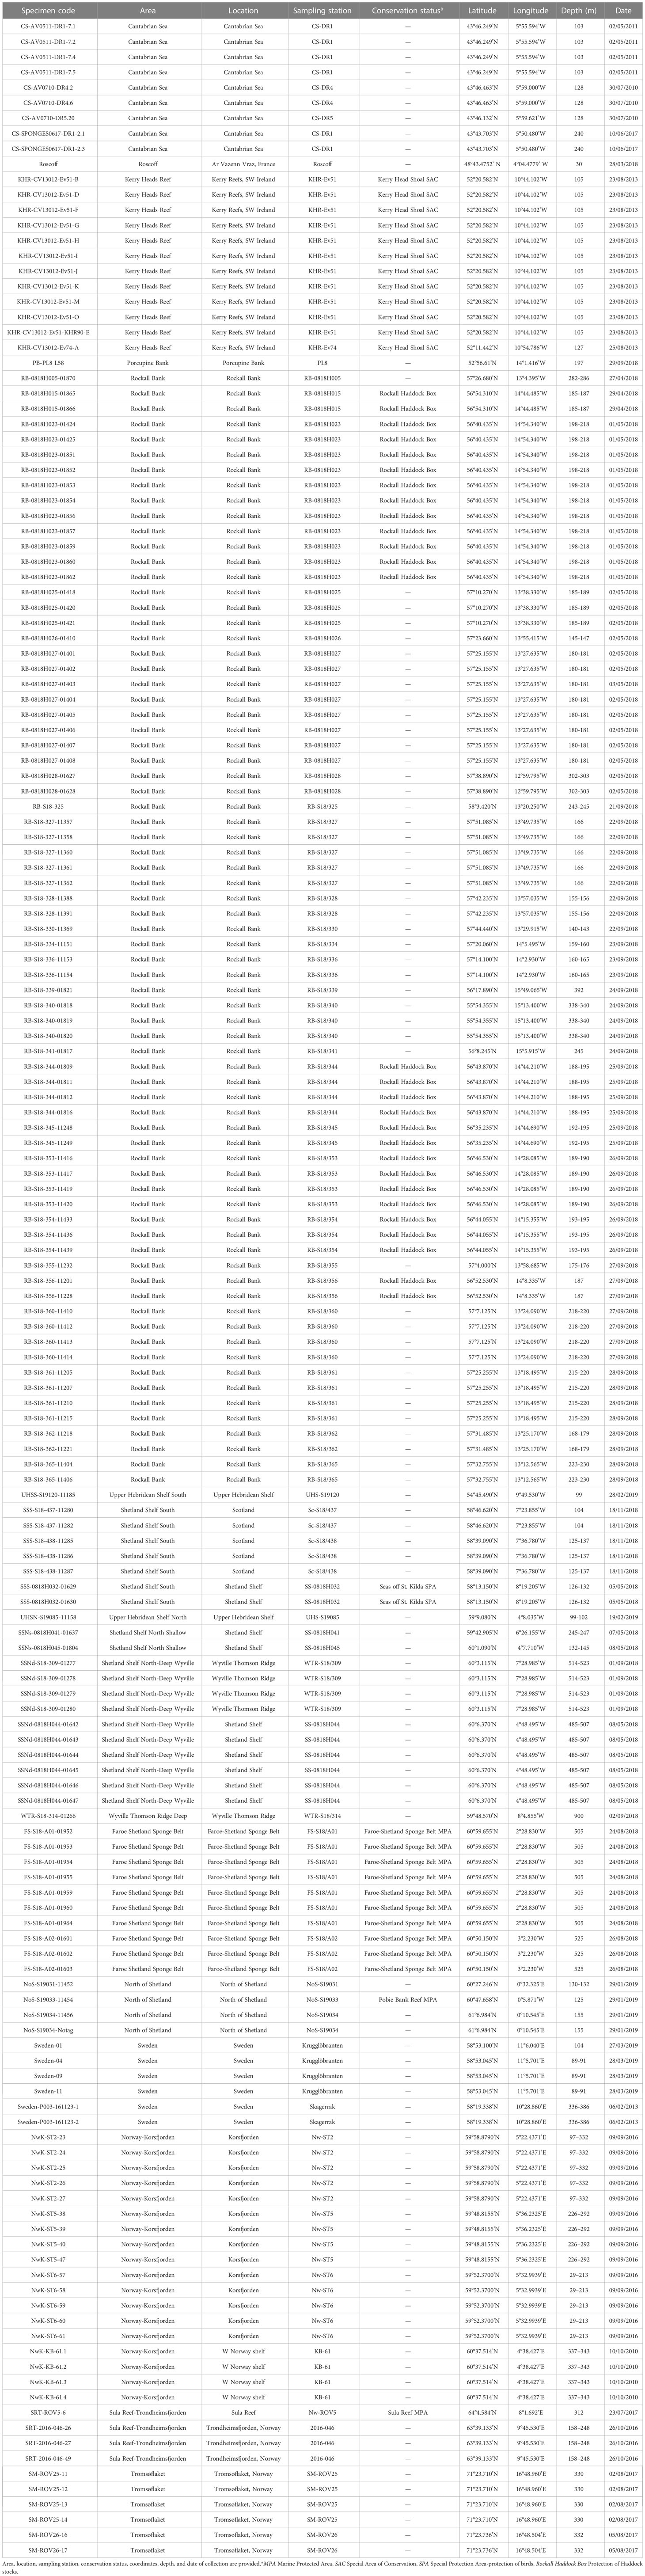
Table 1 List of Phakellia ventilabrum specimens used in the study.
Upon collection, all sponges were cleaned with fresh seawater to remove the mud and subsequently photographed. Sponge fragments (ranging 1–3 cm3) of each specimen were cut and preserved in 96% EtOH for molecular analysis (see below), and immediately stored at -20°C, except for the Swedish samples that were kept at room temperature; EtOH was replaced three times in daily intervals.
A small portion of all specimens was incubated in sodium hypochlorite and kept at room temperature overnight in order to digest organic matter and to study spicule composition. Samples were then washed three times, first with water, second with 50% EtOH and finally with 96% EtOH. A few drops of spicule solution were subsequently mounted on a slide and spicule composition and measurements were made on an Olympus BX43 compound microscope (Olympus Corporation, Japan) with an Olympus UC50 camera and cellSens Standard interface v.1.16 (Olympus Corporation, Japan). Spicule analysis was combined with barcoding information already available in Taboada et al. (2022) for a selection of 15 individuals across the entire sample range, including samples from the Cantabrian Sea, Rockall Bank and Norway, among others. This combined morphological and molecular approach unequivocally corroborated the identification of all individuals in this study to the species P. ventilabrum.
DNA was extracted from all samples (176 individuals) using the DNeasy Blood & Tissue kit (Qiagen, www.qiagen.com) following the manufacturer’s protocol, except for the cell lysis time which was conducted overnight and the final DNA elution step, performed twice using 75 μL of elution buffer. Double-stranded DNA was quantified with Qubit dsDNA HS assay (Life Technologies).
ddRADseq libraries were performed for all samples following (Peterson et al., 2012) with modifications following (Combosch et al., 2017). Double-stranded genomic DNA (500 ng) was digested using the high-fidelity restriction enzymes EcoRI and BfaI (New England Biolabs) for 6 h at 37°C. Resulting digested fragments were cleaned by manual pipetting using Agencourt AMPure beads (1.5x volume ratio; Beckham Coulter) and were subsequently quantified with a Qubit dsDNA HS assay (Life Technologies). Resulting fragments were ligated to custom-made P1 and P2 adapters containing sample-specific barcodes and primer annealing sites. Barcoded individuals were pooled into libraries, cleaned by manual pipetting using AMPure beads (1.5x volume ratio), and size-selected (range sizes 200–400 bp) using a Blue Pippin Prep (Sage Science). Each library was PCR-amplified with Phusion polymerase (Thermo Scientific) using a different set of PCR primers allowing for multiplexing libraries. The PCR program used was 98°C/30 s – (98°C/10 s – 65°C/30 s – 72°C/1.5 min) x 12 cycles – 72°C/10 min. Resulting PCR products were cleaned by manual pipetting using Agencourt AMPure beads (1.5x volume ratio), quantified with a Qubit dsDNA HS assay, and quality-checked on a Tapestation 2200 (Agilent Technologies). Libraries were pooled, normalizing their concentration and combined with RNA-seq libraries in the same flow cell. Libraries were pair-end sequenced (2 x 150 bp) on an Illumina NovaSeq 6000 at Novogene Europe (Cambridge, UK).
Quality filtering and locus assembly was conducted with the Stacks pipeline version 2.57 (Catchen et al., 2013). RAD-tags (DNA fragments with the two appropriate restriction enzyme cut sites that were selected, amplified, and sequenced) were processed using process_radtags, where raw reads were trimmed to remove low-quality reads, reads with uncalled bases, and reads without a complete barcode or restriction cut site. The process_radtags rescue feature (-r) was used to recover minimally diverged barcodes and RAD-tags (–barcode_dist = 3; –adapter_mm = 2). The process_radtags trimming feature (-t) was used to trim remaining reads to 140 bp, in order to increase confidence in SNP calling. After performing these filtering steps, we retained a total of 425,979,356 reads from the initial 432,748,650 raw reads (representing 98.4% of reads retained), with an average of 2,420,337 reads per sample (with values ranging from 187,516 to 8,453,808 reads retained).
We conducted optimization tests following (Jeffries et al., 2016) and (Paris et al., 2017) for the parameters m, M, and n in our dataset. Briefly, tests were carried out for five sets of three randomly chosen individuals and, for each test, all non-test parameters were kept as default. The Stacks populations module was run to filter data with r = 0.8 for each test, and the number of assembled loci, polymorphic loci, SNPs, and coverage was compared between the tests. Final parameter values were as follows: ustacks: M = 2, m = 3; cstacks: n = 1. The subsequent run of the Stacks pipeline (ustacks, cstacks, cstacks, sstacks, tsv2bam, and gstacks) using the 176 individuals recovered a mean locus coverage among all samples of 26.4 ± 18.1%, ranging from 4.0% to 97.4%.
The Stacks populations module was next used to retain SNPs present in at least 90% of individuals (r = 0.9), considering all individuals belonging to the same population, and the first SNP from each RAD-tag using –write_single_SNP, in order to reduce the linkage disequilibrium among loci. This restrictive filtering also allowed us to remove occasional non-sponge reads present due to the filtering activity of the sponges; sponges are currently known as efficient natural environmental DNA samplers (Mariani et al., 2019) and non-sponge DNA from other organisms occurring in the sponge habitat might be present in the DNA extraction. In order to diminish errors in the estimation of SNPs showing signatures of selection (Roesti et al., 2012), we only retained SNPs with a minimum allele frequency (–min_maf) > 0.05. Also, SNPs departing from Hardy-Weinberg equilibrium (p-value = 0.05) present in at least two areas and SNPs showing an excess of heterozygosity (Ho > 0.5) (Hohenlohe et al., 2011) were removed too. Given the known presence of symbiotic microbes in the tissue of P. ventilabrum, the resulting set of sequences containing variable SNPs obtained after running Stacks populations were filtered for bacteria and archaea hits. This was done using –blastn comparing the above-mentioned set of sequences against a nr database extracted from NCBI (accessioned on 21/10/2019), using a e-value of 1e-6 or lower. This filtering of microbes resulted in 2 archaea hits. Details of SNPs kept after each filtering step are shown in Supporting information Table 1.
Additional filtering was performed using the adegenet R package (Jombart, 2008; Jombart and Ahmed, 2011; R Team, 2017) to more accurately assess SNP distributions across individual samples and sampling stations, and to test different filtering thresholds to maximise the number of retained SNPs and minimise missing data. This approach provides significant insight for defining final thresholds in comparison with the Stacks populations module. This was combined with the visualization of the data using the Matrix Condenser interface (https://bmedeiros.shinyapps.io/matrix_condenser/; (de Medeiros and Farrell, 2018). The threshold exploration resulted in filtering 10 samples with percentages of missing data > 40%, thus retaining a total of 166 samples for downstream analyses (Table 1).
In order to assess genetic connectivity between populations, SNPs potentially under selection should be removed (Beaumont and Nichols, 1996; Luikart et al., 2003). To differentiate neutral SNPs from putative SNPs under selection in our filtered dataset we used two different programs: ARLEQUIN version 3.5 (Excoffier and Lischer, 2010) and BAYESCAN version 2.1 (Foll and Gaggiotti, 2008). ARLEQUIN uses coalescent simulations to create a null distribution of FST and then generates p-values for each locus based on its distribution and observed heterozygosity across all loci (Excoffier et al., 2009). We chose to set the ‘Allowed missing level per site’ to 0.05 and used the ‘Non-hierarchical island model’. We performed 100,000 simulations and 100 demes per group; p-values obtained were corrected using the p.adjust function in R with the fdr method, corresponding to the ‘BH’ in Benjamini and Hochberg (1995). For the BAYESCAN analysis we used the default parameters. This program uses a Bayesian approach to estimate population specific FST coefficients in contrast to a locus-specific FST coefficient shared by all populations. We considered outlier SNPs to be those with a q-value > 0.05, which is the FDR analogue of the p-value. Both ARLEQUIN and BAYESCAN detect outlier SNPs with high FST values, considered to be potentially under positive selection, and SNPs with FST values close to zero, considered to be candidates for balancing selection. We identified 146 SNPs under selection: 139 for the ARLEQUIN analysis and 8 for BAYESCAN, with only one of these SNPs being coincident. The final number of neutral SNPs retained was 4,017 (Supporting information Table 1). In order to discard possible clones in our samples we performed an analysis using the function mlg from the package poppr (Kamvar et al., 2015); this analysis resulted in no clones detected.
We calculated genetic diversity and demographic statistics grouping samples in four different groups: Cantabrian-Roscoff, Rockall Bank, British Islands excluding Rockall and Sweden-Norway. We used these four groups and not the initial 17 areas considered in the study due to the uneven and relatively low amount of samples collected in some of the areas (see Table 1), since genetic statistics can be affected by small samples sizes. Expected (He) and observed (Ho) heterozygosity were calculated per each group and globally using Stacks version 2.57.
We assessed the population structure using three different methods: STRUCTURE version 2.3 (Pritchard et al., 2000), the discriminant analysis of principal components (DAPC) as implemented in the adegenet R package (Jombart et al., 2010), and fineRADstructure (Malinsky et al., 2018). For these three methods we used two different datasets: the whole dataset (166 individuals grouped in 17 areas) and a reduced dataset consisting of all samples except those from the Cantabrian Sea and Roscoff (156 individuals grouped in 15 areas), which were the most divergent samples in our study. We ran STRUCTURE with 200,000 MCMC iterations using the admixture model, with a burn-in of 100,000 iterations, setting the putative K from 1 to 9, with 15 replicates for each run. We used STRUCTURE HARVESTER (Earl and vonHoldt, 2012) and CLUMPP version 1.1.2 (Jakobsson and Rosenberg, 2007) to determine the most likely number of clusters and to average each individual’s ancestry proportions across the K value replicates, respectively.
Population structure in DAPC was assessed by the function snapclust using the genetic clustering mode snapclust.choose.k. This was done using the Akaike Information Criterion (AIC) function using the k-means algorithm (pop.ini = “kmeans”), allowing a maximum k (number of clusters) of 16 (max = 16), and a maximum number of iterations of 100 (max.iter = 100). To identify the optimal number of clusters, k-means was run sequentially with increasing values of k, and different clustering solutions compared; the optimal clustering solution was the one that corresponded to the lowest AIC. After defining the optimal number of clusters, the number of retained principal components (PCs) axes and eigen values were chosen using the cross-validation xvalDapc function from the adegenet R package with 1,000 replicates (n.rep = 1000). xvalDapc provides an objective optimisation procedure for identifying the lowest number of PCs retaining the maximum variance, which is associated with the lowest mean squared error (MSE). The DAPC function assignplot was used to plot the probabilities of assignment of the different individuals to the different clusters, while the function scatter.plot was used to produce scatterplots of PCs with eigen values as inset. In order to investigate the molecular substructure in the reduced dataset (all samples except Cantabrian Sea and Roscoff), we assigned a cluster to each area and calculated the number of retained principal components (PCs) axes and eigen values using the cross-validation xvalDapc as described above. The function scatter.plot was also used to produce scatterplots of PCs with eigen values as inset.
fineRADstructure was used to assess the shared ancestry in P. ventilabrum and to provide further support to the STRUCTURE and DAPC analyses. This package uses ddRAD-haplotype linkage information and provides high-resolution co-ancestry outputs. We ran the analysis with the whole set of individuals using the SNPs obtained after running populations on 4,017 neutral SNPs deselecting the –write_single_SNP option. This allowed for the inclusion of linked SNPs in the different RAD-tags, resulting in a final dataset of 32,531 SNPs. fineRADstructure was run with the default values: -x 100,000, -y 100,000, -z 1,000 to assign individuals to populations, and -x 10,000 for the tree building. Graphic interpretation of the results was performed using Finestructure R Library and fineRADstructurePlot.R script, both provided in the fineRADstructure package.
In addition, a hierarchical analysis of molecular variance (AMOVA) was performed using ARLEQUIN version 3.5, to test the significance of the two following groupings: (i) samples from Cantabrian Sea and Roscoff were grouped and tested against the other sampling sites; and (ii) Cantabrian Sea and Roscoff were excluded and Rockall Bank was tested against the remaining locations. AMOVA analyses were carried out using the Standard AMOVA option with default parameters (0.05 allowed level of missing data) and 20,000 permutations, resulting in a total of 2,245 and 2,706 loci usable for distance computation for the two different groupings, respectively. Samples for this analysis were grouped by sampling station instead of by area in order to gain more statistical power for the comparisons.
Pairwise FST values were estimated to measure the differentiation between four different groupings (Cantabrian Sea-Roscoff, Rockall Bank, British Islands excluding Rockall Bank and Sweden-Norway). This was performed using ARLEQUIN version 3.5, with the default parameters (0.05 allowed level of missing data) and with 20,000 permutations.
For comparative purposes, DAPC analysis and pairwise FST values were also calculated as described above for the loci under selection (Vu et al., 2020).
In order to identify current gene flow patterns in the study area, we used the Nei’s GST method to estimate the relative contemporary migration between sampling stations, using the divMigrate function of the diveRsity R package (Keenan et al., 2013). This was done with the whole dataset grouping areas in four different groups: (i) samples from the Cantabrian Sea and Roscoff; (ii) samples from the Rockall Bank; (iii) samples from the British Islands; and (iv) samples from Sweden and Norway. We decided to group samples into these four groups and not into the original 17 areas in order to gain statistical power and to simplify the interpretation of the analysis. In addition, we performed a population assignment analysis calculating the likelihood ratio thresholds for just the reduced dataset (15 populations excluding Cantabrian Sea and Roscoff) based on the Monte Carlo Likelihood ratio test with zero frequencies replaced by 0.005, an α of 0.002 and 5,000 replicated datasets using Genodive vs 3.02 (Meirmans and Van Tienderen, 2004). This method assigns or excludes reference populations as possible origins of individuals on the basis of multilocus genotypes by calculating, for every population, the likelihood that the individual’s genotype is found in a population given the allele frequencies in the population. It also detects last-generation migrants across the different populations. Genetic assignment methods allow inferring where individuals originated, which is particularly useful when genetic differentiation at the population level is low (Meirmans and Van Tienderen, 2004).
The major currents of the NE Atlantic study area include the poleward North Atlantic Current (NAC) and the more saline Slope Current coming from the Bay of Biscay region (Huthnance, 1986; van Aken, 2000; New and Smythe-Wright, 2001). The equatorward flowing Iceland-Scotland Overflow Water (ISOW) and Wyville-Thomson Overflow Water (WTOW) form the deeper water masses (Figure 2 and Booth and Ellett, 1983; Holliday et al., 2015; Fox et al., 2016). Currents within the region become more complex closer to the shallow coasts and near topographic features like seamounts (e.g., Rockall Bank; (Houpert et al., 2020) and canyons (e.g., Aslam et al., 2018), which may influence dispersal patterns in some of the sampled areas.
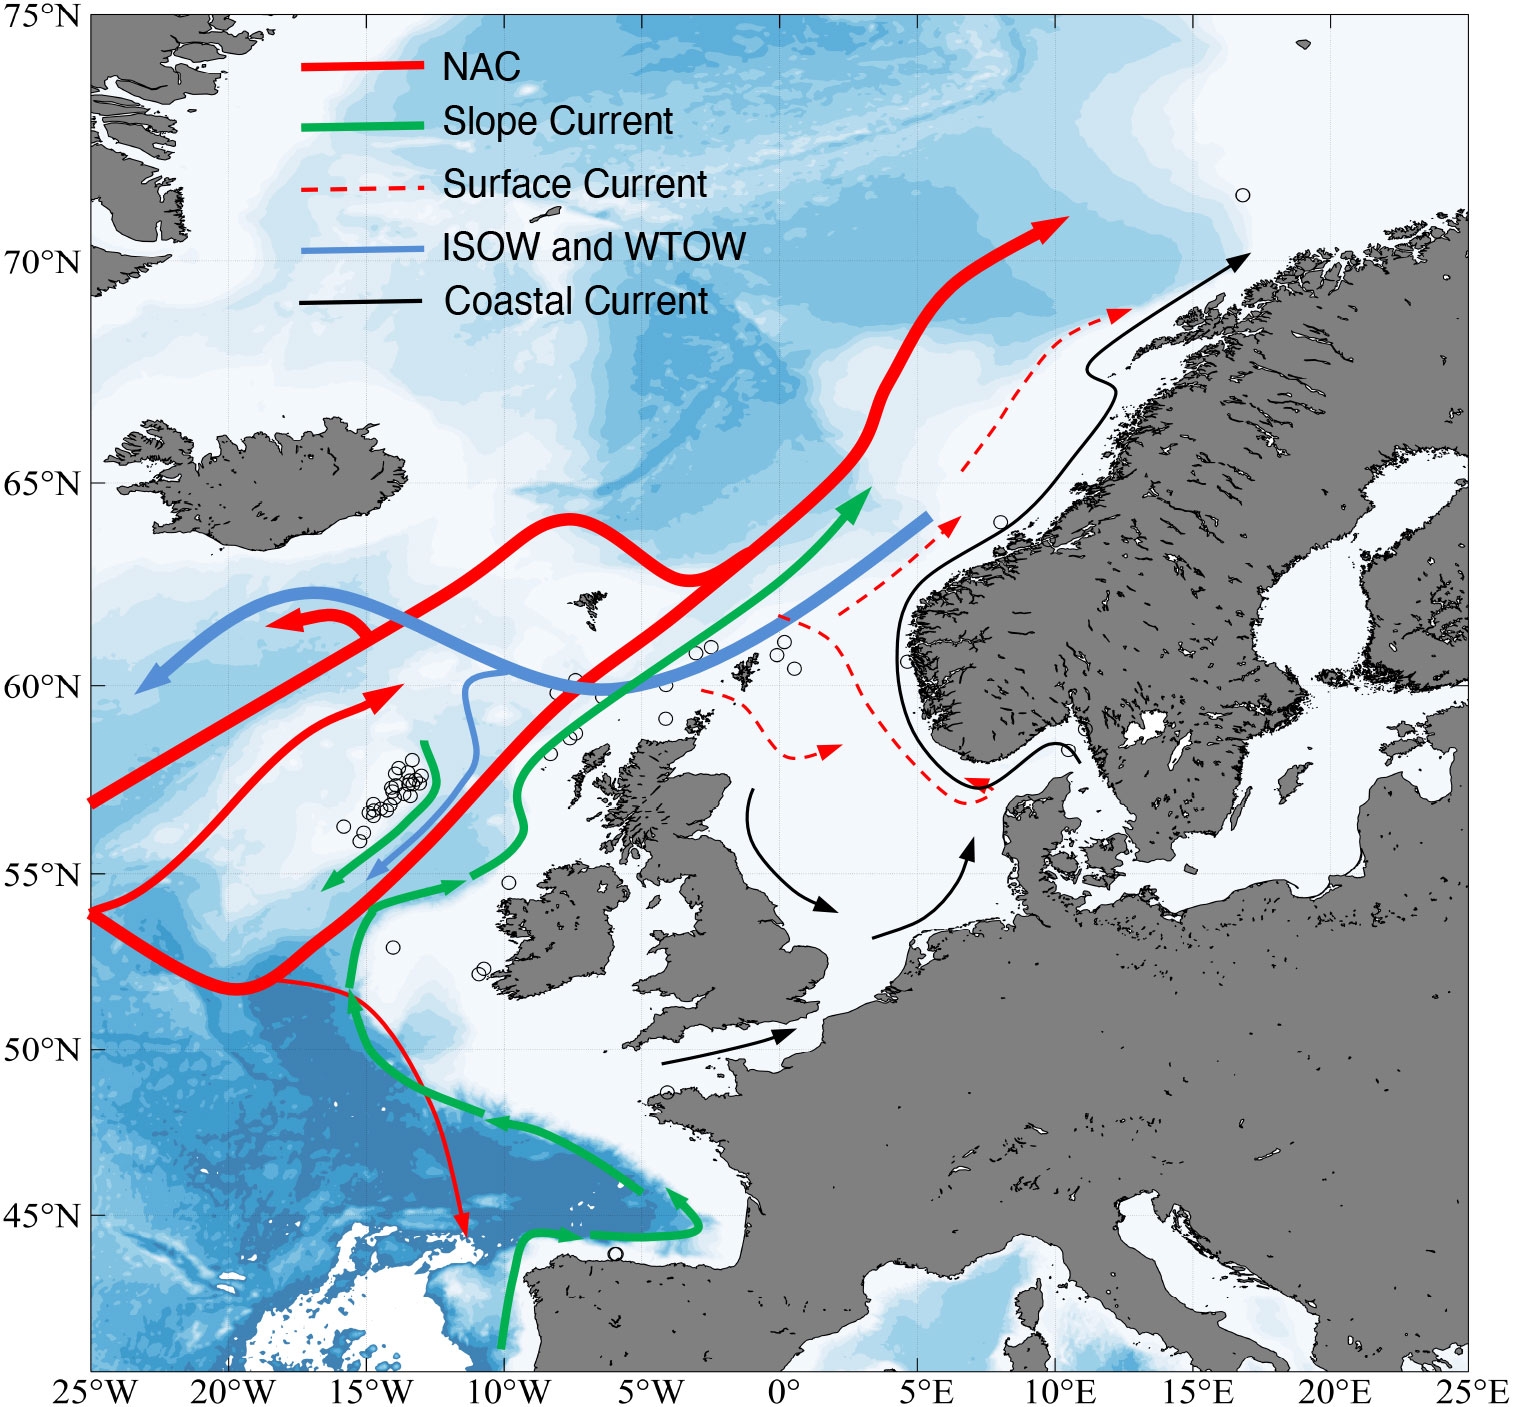
Figure 2 Predominant oceanic currents within the North Atlantic Ocean including the sampling sites in the present study. ISOW Iceland-Scotland Overflow Water, NAC North Atlantic Current, WTOW Wyville-Thomson Overflow Water.
Three-dimensional (3-D) passive particle tracking experiments were performed using the fully open source software Parcels version 2.1 (Lange and Van Sebille, 2017; Delandmeter and Van Sebille, 2019). The Lagrangian particle trajectories were computed using a fourth order Runge-Kutta scheme with a time step of 1 hour. Particles were advected by climatological monthly-mean currents over the period 1990–2015, extracted from the ocean model Bedford Institute of Oceanography North Atlantic Model (BNAM). Monthly-mean currents were selected for this study as this represents the general dispersal pattern over multiple years and were found to be strongly representative of connectivity patterns when compared with models that have higher temporal resolution (Wang et al., 2021). BNAM is based on NEMO 2.3 (Nucleus for European Modelling of the Ocean), with a nominal resolution of 1/12° for the North Atlantic Ocean (7°N-75°N and 100°W-25°E), and layered with a maximum of 50 levels in the vertical, with the level thickness ranging from 1 m at the surface to 200 m at a depth of 1,250 m, and a maximum level thickness of 460 m at the bottom of deep basins. The maximum depth was 5,730 m in this model.
Horizontal diffusion (random walk) was introduced to simulate small scale processes not captured in the BNAM ocean model with a constant diffusivity of 1 m2 s-1 (Fox et al., 2016; Gillibrand et al., 2016) in the horizontal direction. No swimming behaviour was utilized in the model as no parametrisation is available for this species, and particles were advected by the currents only. Particles were released from 0.1° x 0.1° cells centered on each sampling site and dissolved to create a release area for each of the 17 defined areas, which represents the geographic extent of sampling within each region. Within each area, particles were seeded uniformly inside this area on the seafloor with a spacing of 0.004°, with particles falling outside of the model domain omitted (total released per area are shown in Supporting information Table 2). To simulate spawning time, two simulations were conducted, firstly at the beginning of the month of April and secondly at the beginning of the month of October, with particles released at the seafloor within each area and with a larval duration of two weeks (Maldonado, 2006); we chose one month before and after the described spawning time of P. ventilabrum (May and September) in Norway (Koutsouveli et al., 2022) so that to ensure that the spawning of other populations from other latitudes was covered. In a third simulation, in order to evaluate whether some of the most distant areas were connected or not through oceanic currents, particles were also advected over a longer period, across the months of April to October (single release at the beginning of April and tracked until the end of October), this assumes that larvae could persist across the entire summer and early autumn period, and is designed to determine maximum connectivity potential to aid in the interpretation of the genetic analyses. Connectivity matrices were used to assess the connections between the 17 areas and were used to detect connections of even a single particle from source to receiving area.
Statistics for the population genetics of each of the four groups of samples of P. ventilabrum are summarized in Table 2. In general, the number of private alleles was quite uneven. The lowest number of private alleles was found for Sweden-Norway (142), while the highest number was found in the British Islands (431). The number of private alleles per individual was again the lowest for Sweden-Norway (4.2) and the highest for Cantabrian-Roscoff (28.7), despite this later group of samples having the lowest number of samples (10).
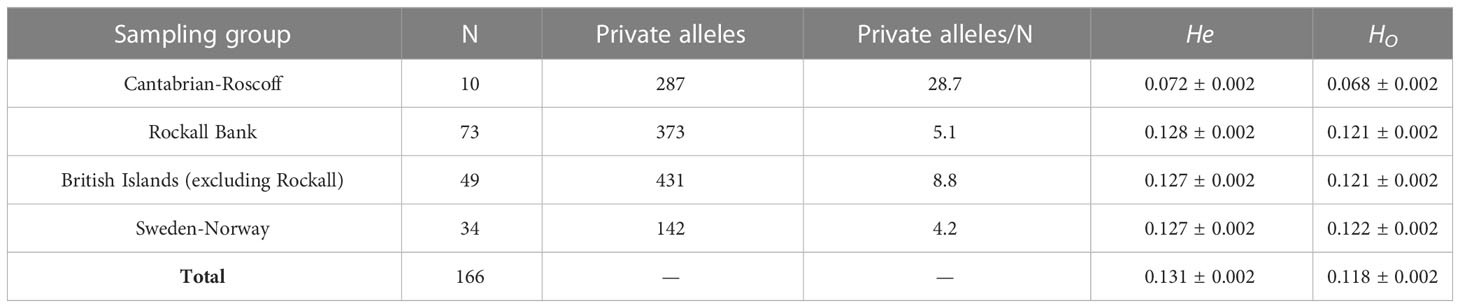
Table 2 Population genetics statistics for P. ventilabrum. Samples grouped by area. N number of samples, He expected heterozygosity (=genetic diveristy), Ho observed heterozygosity.
Overall expected heterozygosity (He), generally considered as a measure of genetic diversity, was relatively low (0.131 ± 0.002), with similar numbers for all the groups of samples (ranging from 0.127 ± 0.002 in the British Island and Sweden-Norway to 0.128 ± 0.002 in Rockall Bank), except for the Cantabrian-Roscoff, displaying the smallest He values (0.072 ± 0.002). Similar results were obtained for the observed heterozygosity (HO), with a relatively low overall value (0.118 ± 0.002), and with even values for groups (ranging from 0.121 ± 0.002 in Rockall Bank and British Islands to 0.122 ± 0.002 in Sweden-Norway) except for the Cantabrian-Roscoff, again showing a value of 0.068 ± 0.002, about half the value respect to the ones in the rest of groups of samples.
We detected a clear genetic structure for the complete dataset of P. ventilabrum both in the STRUCTURE and the DAPC analyses (Figure 3A; Supporting information Figure 1A). The optimal number of clusters detected by STRUCTURE was two (k =2) (Supporting information Figure 1B), revealing two major genetic clusters grouping samples from the Cantabrian Sea and Roscoff (purple cluster) and the rest of the samples (red cluster) (Figure 3A). Population assignment, though, varied across samples, with all samples from the Cantabrian Sea with >90% assignation to the purple cluster while the Roscoff sample showed an assignment of approx. 60% to the purple cluster. Similar results were obtained for snapclust and DAPC with samples being grouped in the same two major clusters (Supporting information Figures 1A, D). In contrast, when using the reduced dataset (after removing the Cantabrian Sea and Roscoff samples) the results of the STRUCTURE and adegenet analyses for molecular population assignment did not detect any genetic structure (Figure 3B and Supporting information Figures 1E, F), indicating that the reduced dataset should be regarded as a panmictic population, grouping samples that spanned a large geographic range of ca. 2,500 km (from Kerry Heads Reef in the south to Tromsøflaket in the north; Figure 1). Interestingly, the majority of individuals of Rockall Bank –except six specimens (RB-1: RB-0810-H026-01410; RB-2: RB-0810-H026-01404; RB-3: RB-0810-H026-01405; RB-4: RB-S18-340-01818; RB-5: RB-S18-344-01809; and RB-6: RB-S18-344-01811; Figure 3B)– presented some degree of molecular assignment to the green genetic cluster in the STRUCTURE analysis compared to the rest of individuals (Figure 3B). This indicated a subtle genetic differentiation of the majority of samples from the Rockall Bank with respect to the rest, corroborated by the DAPC analysis of the reduced dataset grouping samples per area (Figure 3C). This latter analysis not only separated the Rockall Bank samples but also suggested the rest of areas mainly followed a latitudinal ordination (Figure 3C). Within the six individuals from Rockall Bank showing differences from the rest of individuals in this area, two of them (RB-1 and RB-4) showed more affinities to the rest of samples in the remaining areas; the other four individuals (RB-2, RB-3, RB-5 and RB-6) clearly differed from the rest of samples in the analysis (Figure 3B).
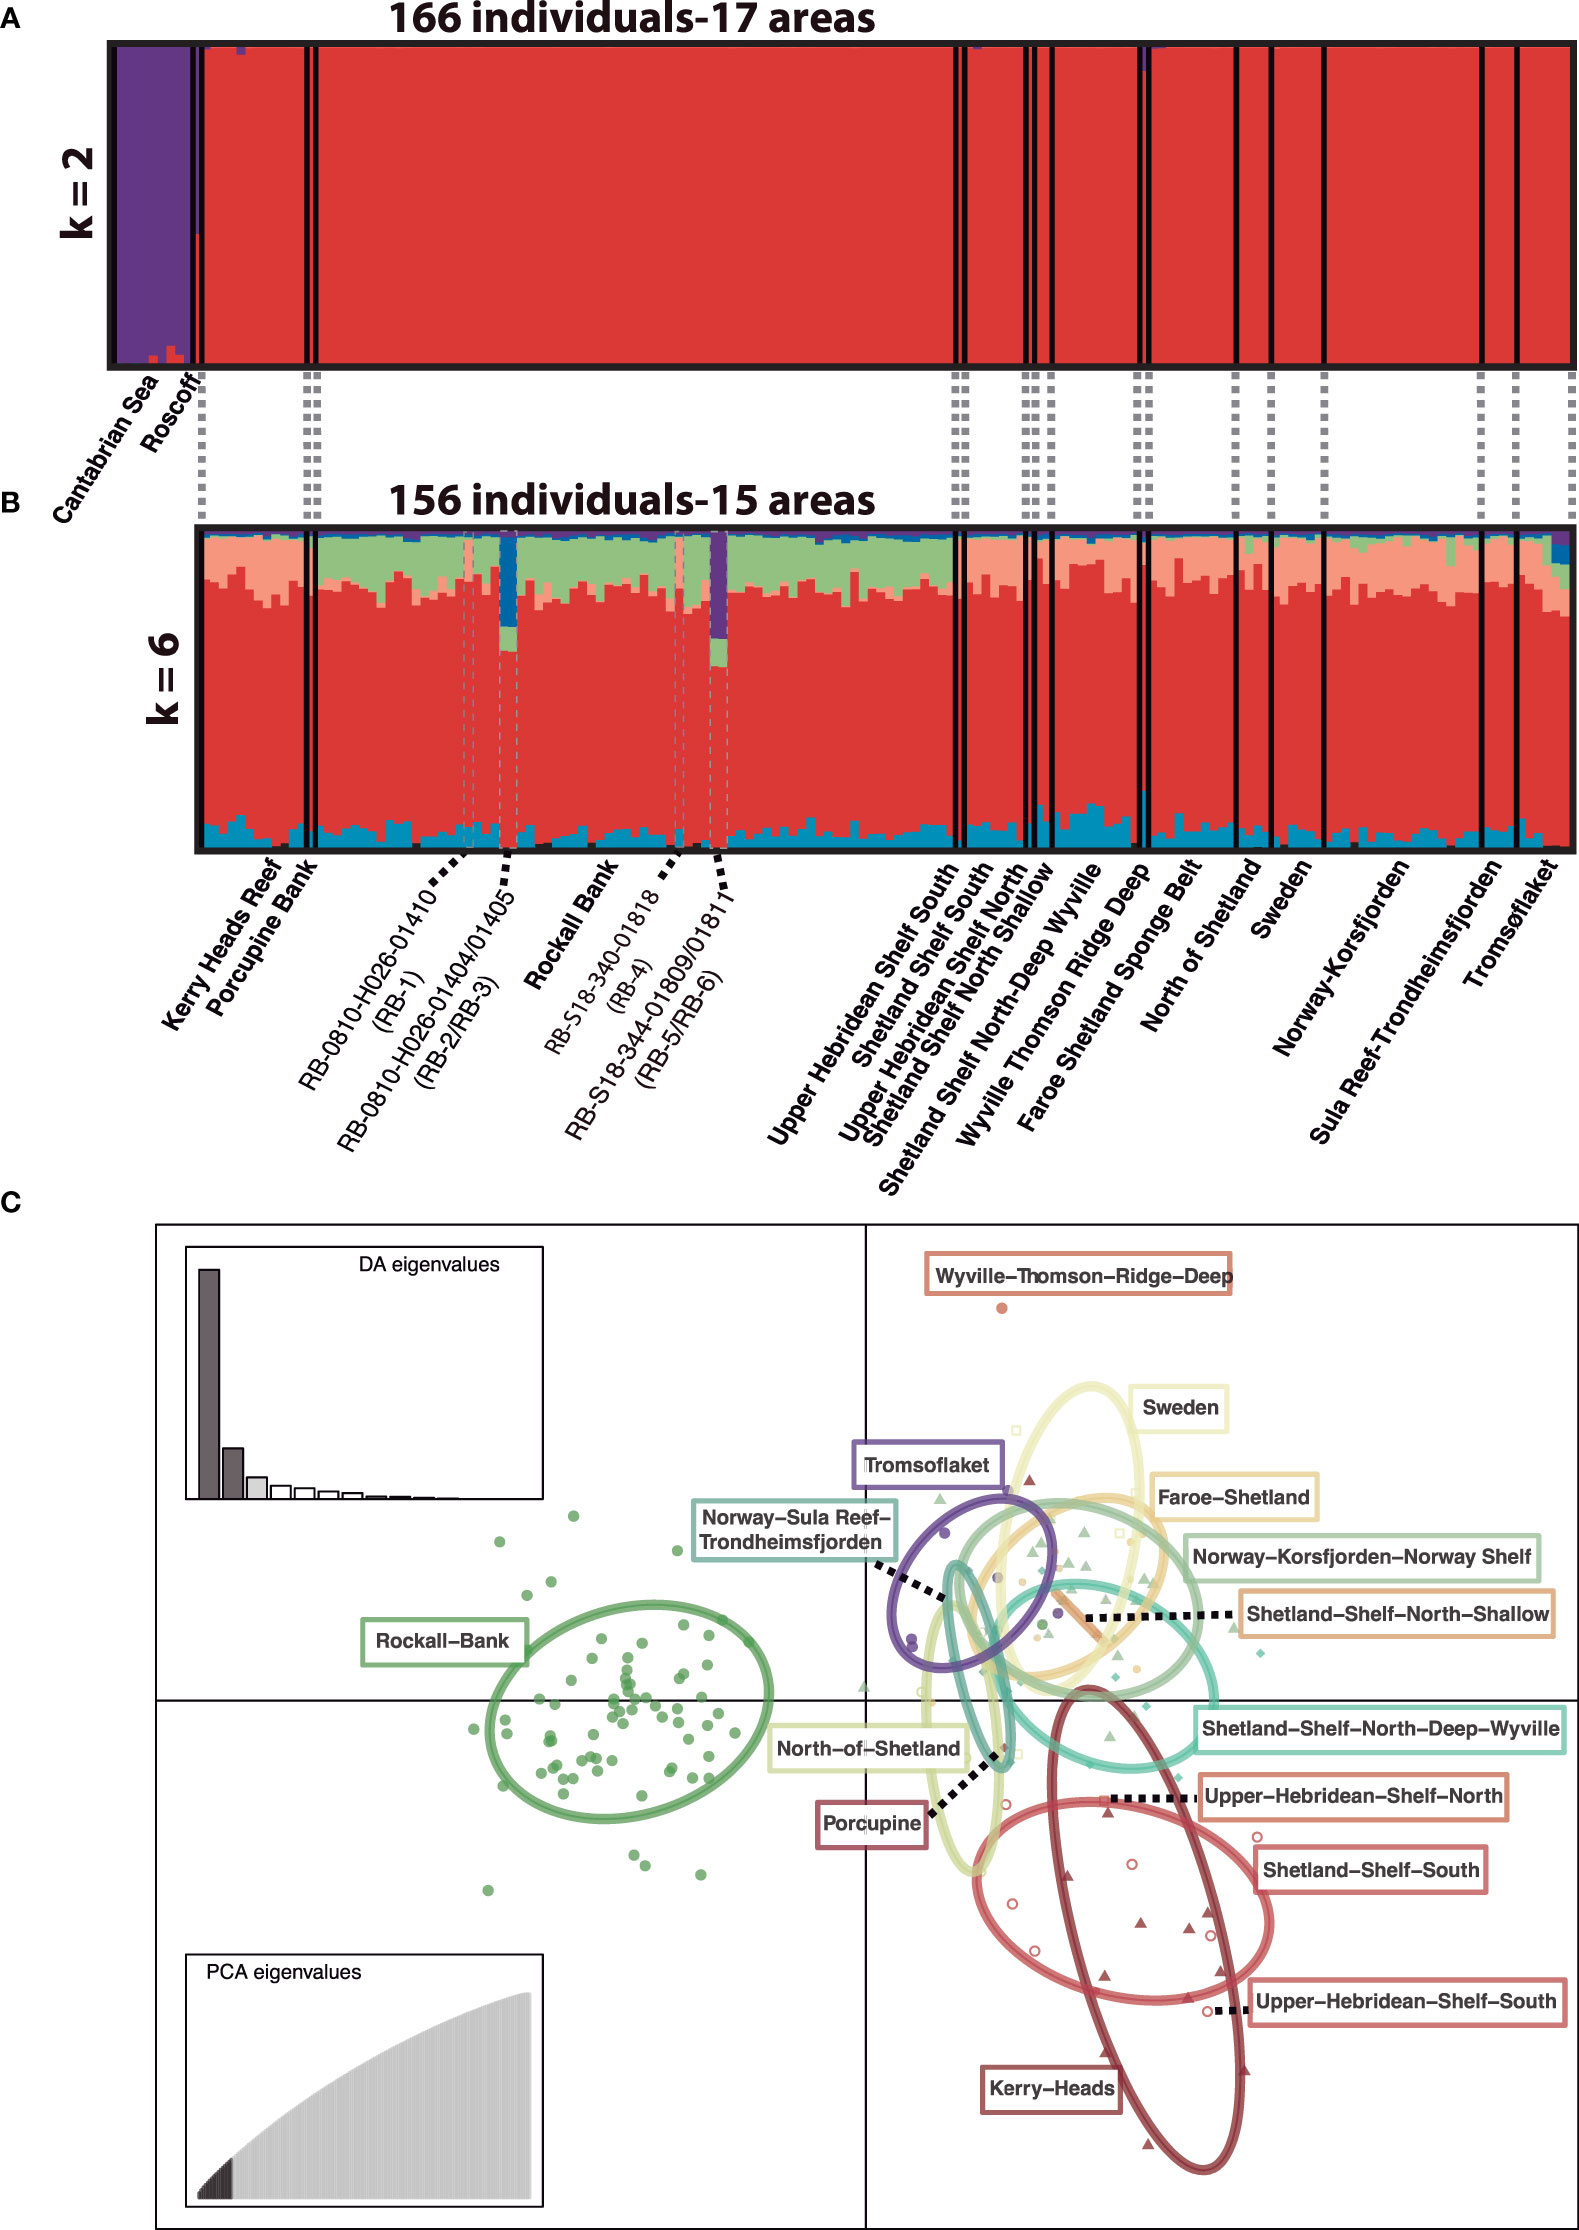
Figure 3 (A). Individual genotype assignment of P. ventilabrum to clusters (K) as inferred by STRUCTURE for the whole dataset (166 individuals and 17 areas) with k = 2. (B). Individual genotype assignment of P. ventilabrum to clusters (K) as inferred by STRUCTURE for the reduced dataset (156 individuals and 15 areas) with k = 6. Six individuals from Rockall Bank are highlighted: RB-1 (RB-0810-H026-01410), RB-2 (RB-0810-H026-01404), RB-3 (RB-0810-H026-01405), RB-4 (RB-S18-340-01818), RB-5 (RB-S18-344-01809), and RB-6 (RB-S18-344-01811), because their genotype assignment differ from the other specimens in the study area: while RB-1 and RB-4 show higher genotype assignment to the red cluster, the other four individuals clearly differ from the rest (see also Figure 4). (C). DAPC analysis of P. ventilabrum for the reduced dataset grouping samples per sampling area. Dashed lines indicate small groups of samples.
In a similar manner, the fineRADstructure analysis of the complete dataset recovered the Cantabrian Sea and Roscoff samples as the most divergent (purple cluster), but also detected two additional clusters (Figure 4): the Rockall Bank cluster in green (without the individuals RB-1 and RB-4, both appearing in the miscellaneous group); and a red cluster, that grouped the remaining samples (including the two above-mentioned samples from the Rockall Bank: RB-1 and RB-4). The four specimens from Rockall Bank with a distinct genotype pattern in the STRUCTURE analysis (RB-2, RB-3, RB-5 and RB-6; Figure 3B) appeared as a subcluster of samples within the Rockall Bank. Within this miscellaneous cluster (red cluster), the only geographic grouping of samples detected was a subcluster including most of the samples from Kerry Head Reef (11 out of 12) and a sample from the Shetland Shelf South (SSS-1: SSS-0818H032-01630). The remaining samples in the miscellaneous cluster appeared mixed despite spanning >2,000 km.
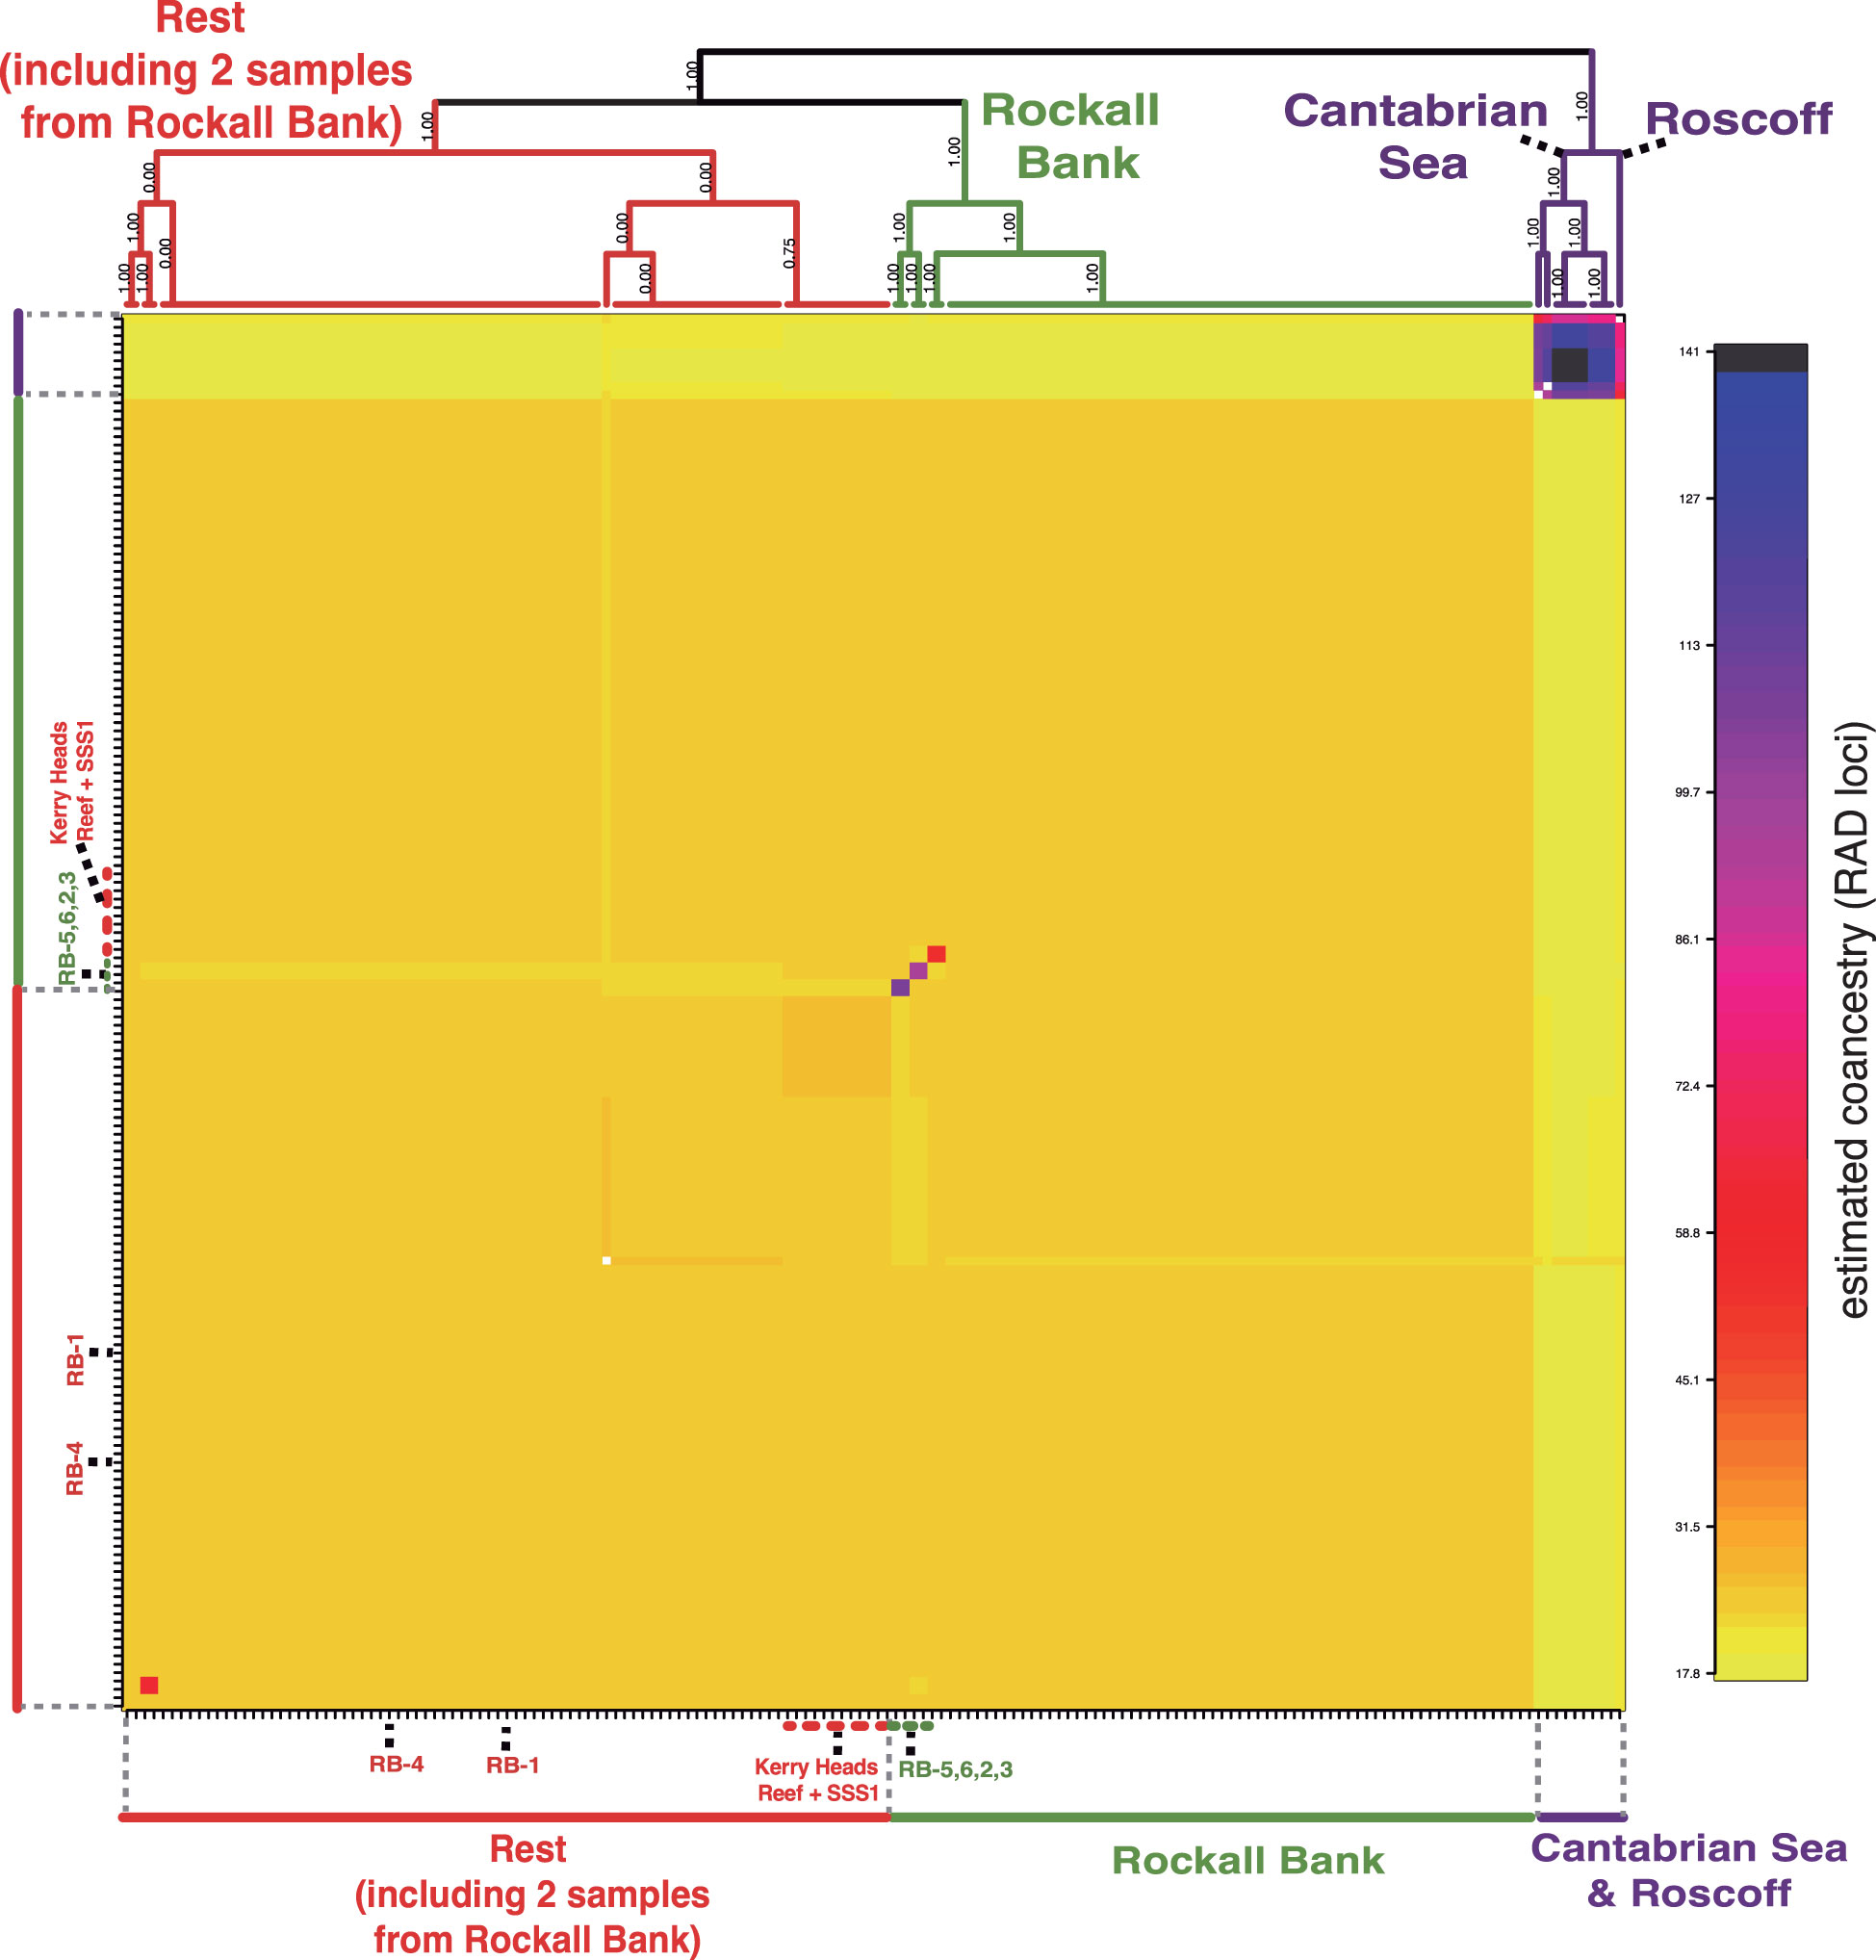
Figure 4 Simple co-ancestry matrix obtained from the fineRADstructure analysis. See more details about individuals RB-1–RB-6 in Figure 3B. Note that the Kerry Heads Reef aggrupation includes all specimens from this area except KHR-CV13012-Ev74-A and also includes a specimen from the Shetland Shelf South area, SSS-1 (SSS-0818H032-01630).
Pairwise FST comparisons between the four P. ventilabrum groupings were all significant and showed low to high values ranging from 0.005 to 0.253, the former for the comparison between Rockall Bank and Sweden-Norway (Table 3). The highest pairwise FST values were detected between the Cantabrian-Roscoff and the other groups (0.239–0.253).
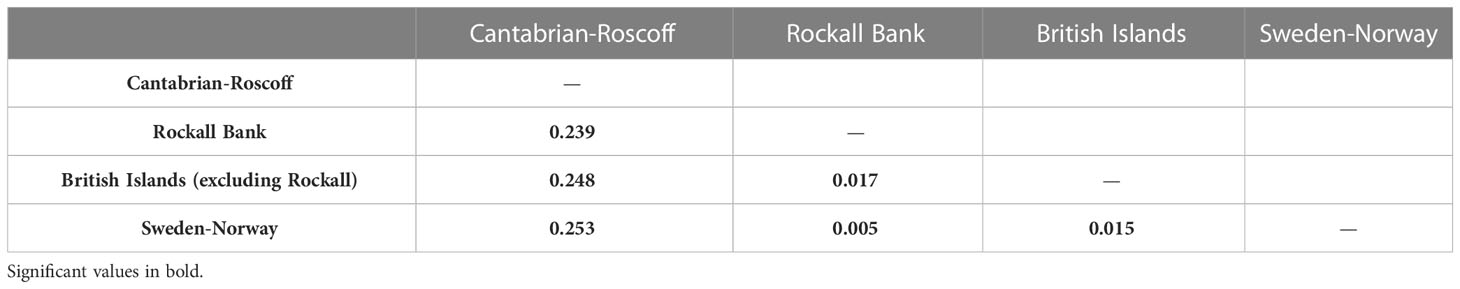
Table 3 Pairwise FST values for samples of P. ventilabrum grouped in four groups: Cantabric-Roscoff, Rockall Bank, British Islands (excluding Rockall Bank) and Sweden-Norway.
AMOVA results from grouping samples into two different groups (‘Cantabrian-Roscoff vs the rest’; and ‘Rockall Bank vs the rest’ –excluding Cantabrian-Roscoff), resulted in significant differences in the genetic structure among the different groups, and also for comparisons among areas within groups and within areas (Table 4). Despite the significant differences detected in the two groupings for the different levels of comparison, >90% of the total variance was explained by the differences within areas for the two comparisons. Thus, the percentage of the total variance explained by the comparison among groups was relatively low (Table 4).
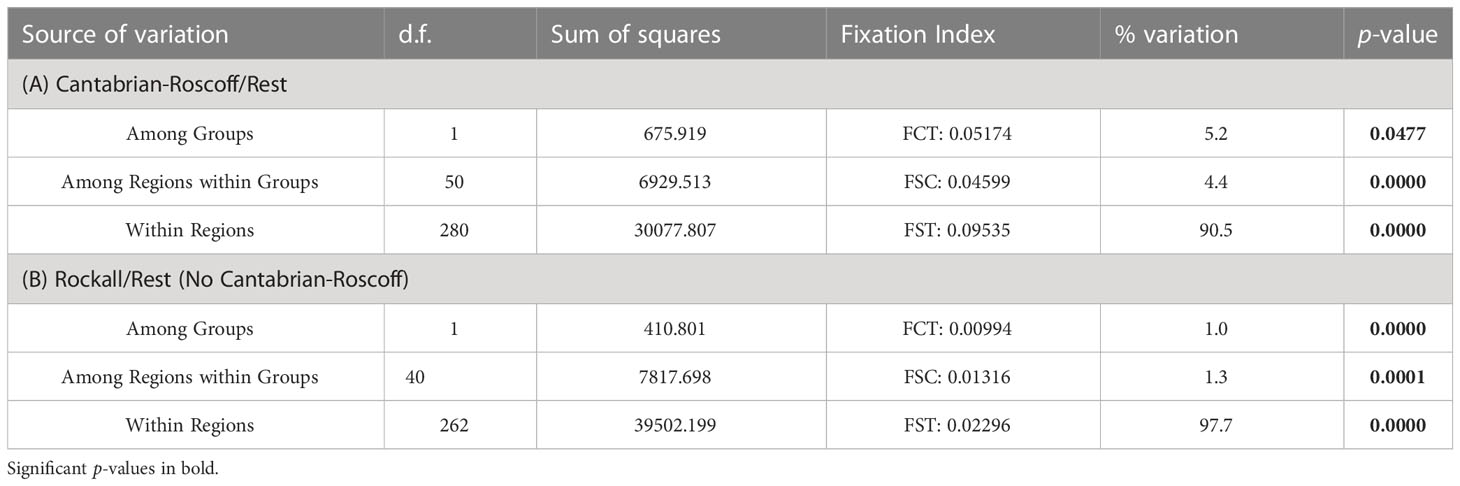
Table 4 Results of the AMOVA analysis for P. ventilabrum grouping samples in: (A) Cantabrian-Roscoff vs the Rest; and (B) Rockall Bank vs the Rest (excluding Cantabrian-Roscoff). d.f. degrees of freedom.
Our migration analysis on the whole dataset using four different groupings (‘Cantabrian Sea-Roscoff’, ‘Rockall Bank’, ‘British Islands’, and Sweden-Norway’) did not detect any contemporary migration between ‘Cantabrian Sea-Roscoff’ and the other groupings (Figure 5A). In contrast, we detected bidirectional migration among all other groupings, with the highest migration rates detected from ‘Rockall Bank’ to the ‘British Islands’ (Figure 5A). Finally, the population assignment analysis for the reduced dataset inferred that Rockall Bank was the source population for the vast majority of the samples, being the major contributor in all cases except for Shetland Shelf North Shallow, Sweden and the Sula Reef-Trondheimsfjorden areas. For these areas, half of sampled individuals had an origin in Rockall Bank and the other half in the Norway-Korsfjorden area (Figure 5B). We also detected population assignment derived from the Norway-Korsfjorden area for other areas but always with a contribution <25%, except for Faroe-Shetland and Norway-Korsfjorden (Figure 5B). The other two source populations detected in our analysis were Kerry Heads Reef and Tromsøflaket, which were observed within their respective areas (Figure 5B).
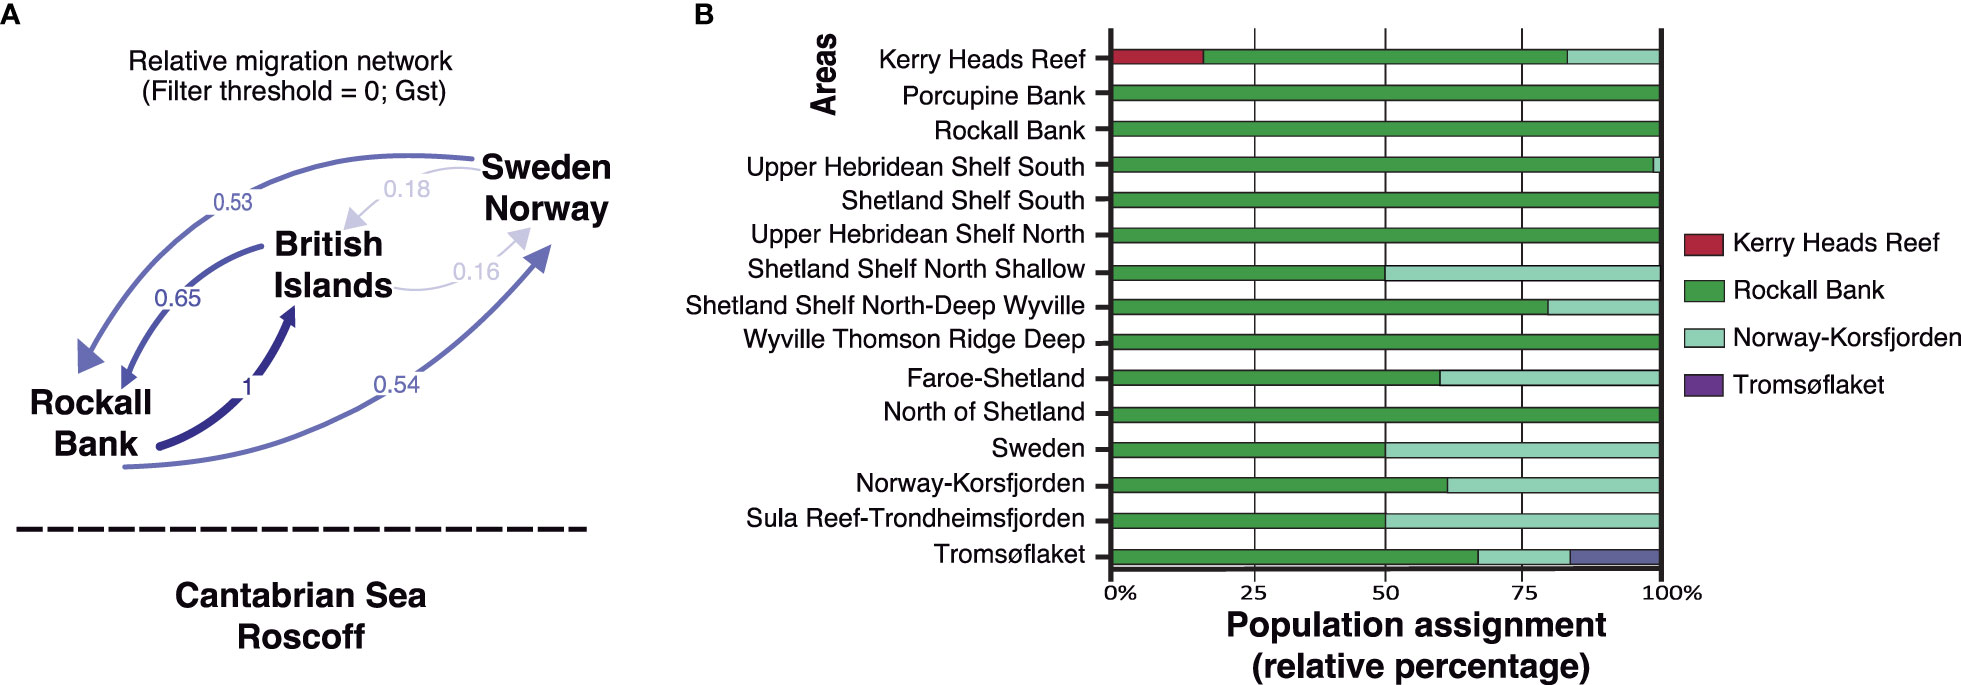
Figure 5 (A) Contemporary migration observed for P. ventilabrum between four different groupings (‘Cantabrian Sea-Roscoff’, ‘Rockall Bank’, ‘British Islands’, and ‘Sweden-Norway’) using the divMigrate function of the diveRsity R package. Nei’s GST method no bootstrapping and filter threshold. (B) Population assignment of individuals of P. ventilabrum for the reduced dataset. The proportion of individuals assigned to each area is given for all areas.
Particle trajectories from modelled releases in April and October with a duration of two weeks showed no differences in dispersal distance or overall location (Figures 6A, B, respectively; Supporting information Figure 2). As shown in the connectivity matrices, only one connection was made between the areas Shetland Shelf North-Deep Wyville and Faroe Shetland Sponge Belt in October (Supporting information Figures 3A, B), two areas that are geographically close. However, the trajectories during the multi-month simulation that spanned the months April to October detected 22 potential connections from source to receiving areas in the connectivity matrix (Supporting information Figure 3C).
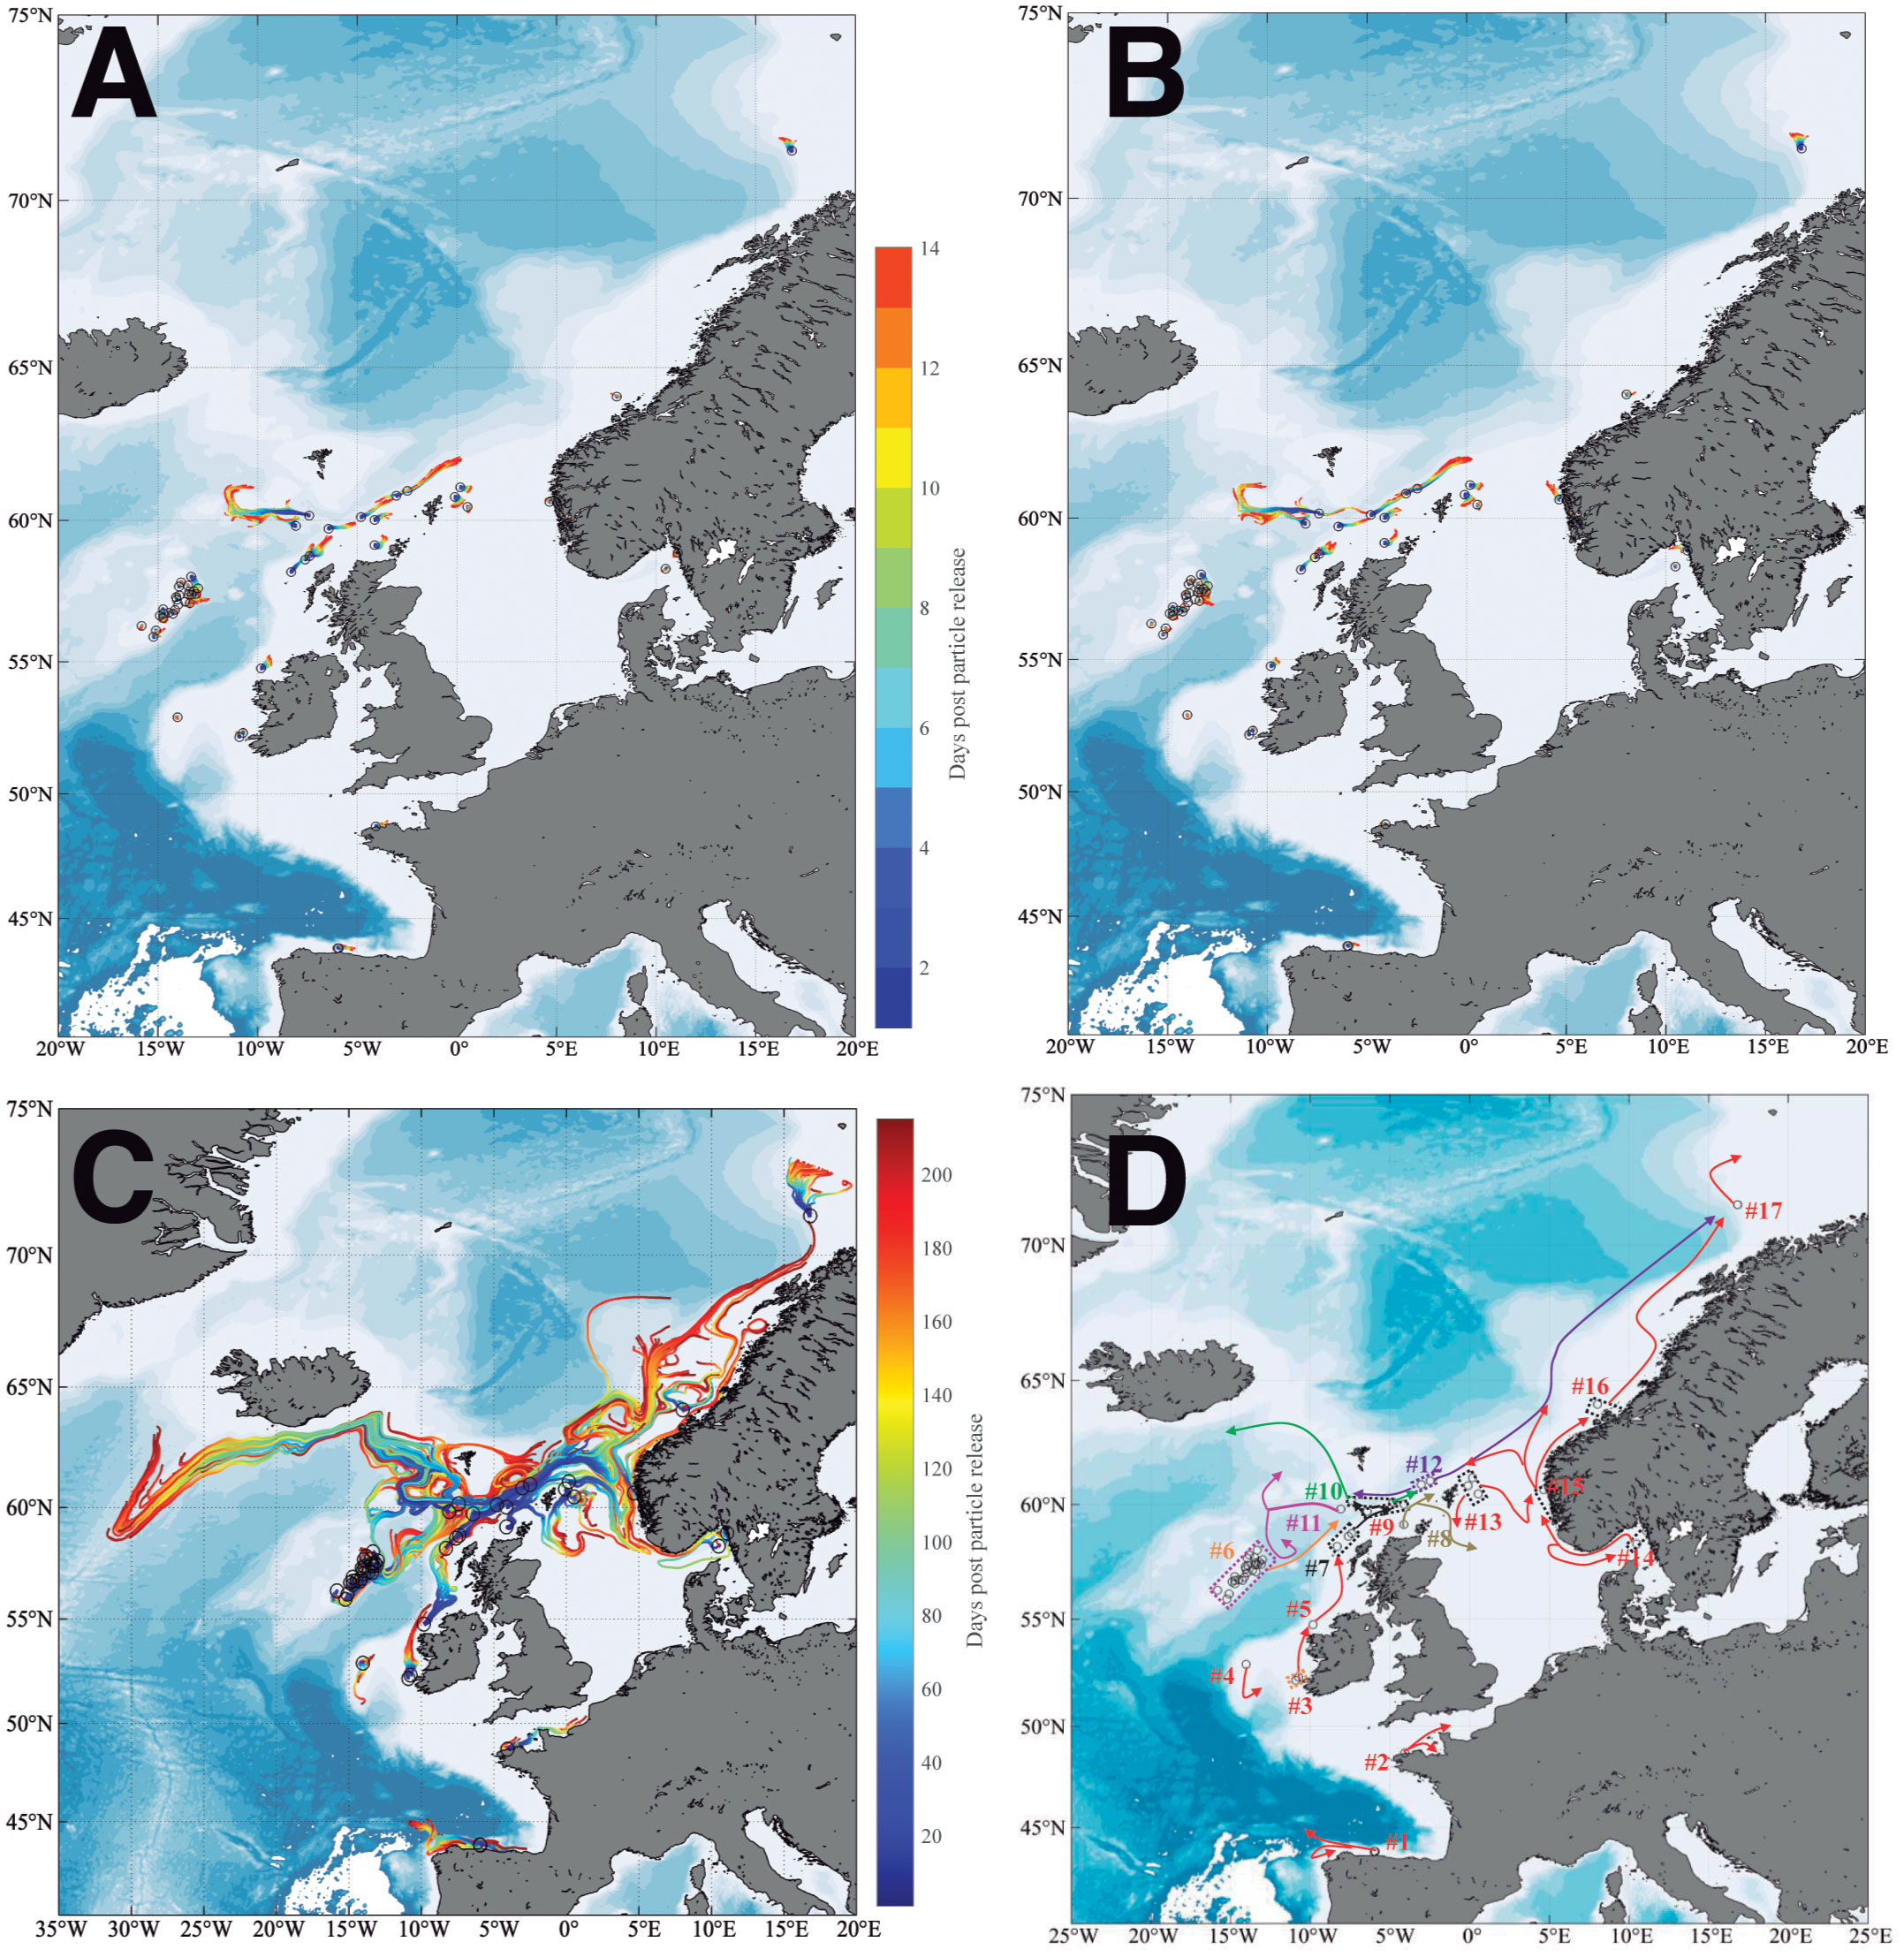
Figure 6 Particle trajectories released at each sampled region from: (A) April for a two-week duration. (B) October for a two-week duration. (C) Release in April until October. (D) Simplified particle trajectory diagram from the April to October simulation.
Overall trajectories from April to October are shown in Figure 6C and summarized in simplified form in Figure 6D and indicate the potential pathways for gene flow between the 17 release areas. We observed that specimens from shallower-water areas experienced a predominant northwards migration, and there was potential for the regions Shetland Shelf North-Deep Wyville and Wyville Thomson Ridge Deep to move northwest towards Iceland. Particles from the Kerry Head Reef tended to move towards Upper Hebridean Shelf South, while Porcupine Bank particles initially experienced southward movements before turning to the northeast. There were also potential connections between Upper Hebridean Shelf South and Shetland Shelf South. Rockall Bank was connected to Wyville Thomson Ridge Deep, Shetland Shelf North-Deep Wyville and Faroe Shetland Sponge Belt. Upper Hebridean Shelf North particles approached Shetland Shelf North Shallow and kept moving northwards, with a branch entering the North Sea. Particles from Shetland Shelf North Shallow moved in two directions with one towards the northwest passing Shetland Shelf North-Deep Wyville, another to the northeast passing Faroe Shetland Sponge Belt. One branch of Shetland Shelf North-Deep Wyville moved northwest until reaching Iceland where it turned south along the Icelandic coast with another branch moving northeast to Faroe Shetland Sponge Belt. Particles from Wyville Thomson Ridge Deep moved westwards at first and then were divided into two branches, with one moving towards Iceland and the other southwards. Faroe Shetland Sponge Belt particles connected with Shetland Shelf North-Deep Wyville, and also flowed northwards towards Tromsøflaket after a very long dispersal duration. There was a potential connection between North of Shetland with Sweden and Norway-Korsfjorden after particles entered the North Sea. Sweden particles connected with Norway-Korsfjorden along the coast or looped back to their origin. Particles from Norway-Korsfjorden could likely flow into Sula Reef-Trondheimsfjorden, Tromsøflaket and Faroe Shetland Sponge Belt through three different routes. Finally, Sula Reef-Trondheimsfjorden flowed northward to Tromsøflaket, with particles from both sites generally advected northward (Figure 6D).
Similar to what we observed from the neutral loci, snapclust and DAPC grouped samples in three major clusters (Supporting information Figures 4A–C): (i) four samples from the Cantabrian Sea and Roscoff, (ii) another four samples from the Cantabrian Sea, and (iii) the rest of samples. Pairwise FST comparisons between P. ventilabrum areas for the loci under selection also showed the highest pairwise FST values between the Cantabrian Sea and Roscoff with all the other areas (0.476–0.928, with most of the comparisons being significant). Low to moderate pairwise FST values (0.000–0.605) were detected for comparisons between the other areas (Supporting information Table 3).
The molecular connectivity patterns in deep-sea sponges have rarely been investigated, contrasting with those of shallow-water sponges which are relatively well-studied (Pérez-Portela and Riesgo, 2018). Our results revealed prominent genetic structuring and high connectivity among aggregations of P. ventilabrum, implying the presence of both strong inhibitors and promoters to gene flow.
The presence of complex hydrographic features across the North Atlantic Ocean, including ocean currents and regional mesoscale features occurring near topographic features like seamounts (Figure 2), are likely responsible for the broad-scale connectivity and isolation detected among the populations of P. ventilabrum, as already suggested in a recent study modelling functional and structural connectivity in VMEs from the North West Atlantic (Kenchington et al., 2019). A prevalent finding in our study was the strong differentiation of samples from the Cantabrian Sea and Roscoff, as indicated by the clear genetic structure detected in our clustering analyses (Figures 3A, 4, Supporting information Figure 1A, D), the high pairwise FST values observed between these two areas (Cantabrian-Roscoff) and the other investigated (Table 3), and the AMOVA results (Table 4). The oceanographic modelling supported the results of the genetic analyses, with no evidence of any physical oceanographic connection between the Cantabrian Sea-Roscoff and the other areas even when run over long durations of several months (Figure 6C, D), following results from the migration analysis (Figure 5A). Particles released from the Cantabrian Sea area moved westward in the first few months and then returned back to their origin. Water masses found in this area originate from the North Atlantic and interact with water from the Mediterranean Sea (Lavin et al., 2006). Residual flow in this region is very weak and flow patterns change seasonally (Pingree and Le Cann, 1990), as indicated by flow pathways in opposite directions in summer and winter (Porter et al., 2016). During the summer upwelling season, which relates to the months of the model run, water flow is weakest and directed to the south and a subsurface front develops for the coast of Cape Finisterre (Varela et al., 2005). This results in seasonally changing trajectories and an overall low connectivity with other areas. In the Bay of Biscay, the interaction of bottom topographies with the continental margin current creates frequent cyclonic and anticyclonic eddies (Koutsikopoulos and Le Cann, 1996) that can also limit the dispersal of larvae, entraining them locally. For instance, Ayata et al. (2010) reported that hypothetical dispersal in marine invertebrates from the Bay of Biscay across the English Channel could only occur under certain hydroclimatic conditions (i.e., during periods with high river run-off and strong south westerly winds) and would be restricted to species with long planktonic larval duration (four weeks). As the larvae of P. ventilabrum are not expected to be able to swim freely for extended periods of time, it is unlikely that dispersal across this boundary would occur even under optimal conditions. Furthermore, the complex frontal system at the southern limit of the Celtic Sea creates discontinuity between the English Channel and the Bay of Biscay (Le Boyer et al., 2009) and the resulting transition zone may reduce larval transport (Jolly et al., 2005).
It is important to note that the differentiation between Roscoff and other sites was not as strong as the one between the Cantabrian Sea and others (Figure 3A), despite the lack of significant observed migration (Figure 5A). This suggests that the barriers preventing dispersal from Roscoff are not as pronounced and some northward larval transport may occur, including the possibility of transport through the English Channel to the North Sea (Figure 6C, D). Particles from Roscoff were transported along the northwest of France into the North Sea, which is likely steered by wind driven currents on the Armorican slope and the dispersal capacity appeared limited due to the relatively weak coastal currents (Pingree and Le Cann, 1989). However, it is not possible to reach a reliable conclusion about connectivity patterns from this location as only one individual was sampled and no further samples were collected along the Celtic margin.
The main genetic structure detected in our study for the neutral loci was similar to the one detected for the loci under selection (Supporting information Figure 4B). This might be indicative of local adaptation to the different environmental features present, as it has been suggested in other studies (Xuereb et al., 2018; Vu et al., 2020). Alternatively, the divergence of Cantabrian Sea and Roscoff samples from those at more northern latitudes may also be a signature of historical processes affecting populations differently. The extensive ice sheets that covered much of northern Europe during the last glacial maximum (LGM) ca. 21,000 years ago (Pflaumann et al., 2003), had a profound effect on shallow-water and deep marine species, causing frequent strong bottlenecks and range shifts, which left behind genetic signatures on the populations (Maggs et al., 2008), and even resulted in vicariant speciation events (Pérez-Portela et al., 2013; Taboada and Pérez-Portela, 2016). Species may have survived in glacial refugia at southern latitudes, such as the Iberian Peninsula and Brittany (Gómez et al., 2007; Hoarau et al., 2007) as well as in several isolated, ice-free areas in the north (Maggs et al., 2008). Populations surviving in glacial refugia, would have a strong genetic differentiation due to historical isolation preventing gene flow, high genetic diversity and high number of private alleles would be expected (Provan and Bennett, 2008). Especially interesting are the samples from the Cantabrian Sea, since they showed both the highest number of private alleles, and the lowest levels of genetic diversity (Table 2), which may be an indication of genetic drift for this area (Hellberg et al., 2002). In any case, we need to bear in mind that we did not survey the entire distribution of P. ventilabrum (amphi-Atlantic and Arctic species also occurring in the Mediterranean (de Voogd et al., 2022), and also importantly, that this species has quite a wide bathymetric range (from few meters to ca. 2000 m depth; Prado et al., 2020), which might have allowed it to retreat to deep-water refugia after the sea level drops during the LGM that reached approx. -130 m (Lambeck et al., 2002). In order to test this hypothesis about glacial refugia, further analyses should be conducted, including for instance coalescence methods (Liu and Fu, 2020). This approach, though, is currently unaffordable for sponges until reliable mutation rates are available for this group of organisms.
Bathymetric features can also affect connectivity and hamper gene flow, which may explain the subtle differentiation of individuals from Rockall Bank (Figures 3B, C, 4). Features such as seamounts, ocean ridges, canyons and continental margins strongly influence ocean circulation, resulting in regional and local hydrodynamics (Huthnance, 1986; van Aken, 2000; New and Smythe-Wright, 2001; Lavelle and Mohn, 2010; Howatt and Allen, 2013). For example, Taylor column formation was observed on the Rockall Bank (White et al., 2005), generating closed circulation patterns and promoting particle retention on the summit (see Figure 2), which could result in some degree of larvae being retained opposed to drifting freely, as suggested for demersal fish species (Knutsen et al., 2009). A specific characteristic of the upper-ocean waters on the Rockall and Porcupine Bank is the deep winter mixing up to a 1,000 m water depth (Penny Holliday et al., 2000). This suggests that the influence of oceanographic patterns is dominant over the influence of bathymetric features, thus allowing the gene flow between Rockall Bank and areas to the north, which agrees with our results detected for P. ventilabrum for this area (Figures 3, 4, Table 4). Similar patterns were observed for the deep-sea coral Desmophyllum dianthus, whose populations from different Antarctic seamounts appeared to be connected probably thanks to predominant currents. This contrasted to that observed for the sympatric Solenosmilia variabilis, which showed isolation of their populations probably due to the important role that asexual reproduction plays for this species (Miller and Gunasekera, 2017).
Upon excluding Cantabrian Sea and Roscoff samples from the analysis, the remainder of the areas displayed high connectivity across the entire sampling range. Sites appeared as one panmictic population as no genetic structuring was detected between Kerry Head Reef and Tromsøflaket (Figure 3B), spanning over 2,500 km (Figure 1). Pairwise FST comparisons were moderate among groups of samples (Table 3), an indicative of a shared common ancestry (Figure 4). Genetic structuring tends to be a prominent feature of shallow-water sponge populations (Pérez-Portela and Riesgo, 2018), although with some exceptions (Dailianis et al., 2011; Chaves-Fonnegra et al., 2015; Giles et al., 2015). When genetic connectivity across large geographic ranges has been detected, oceanic currents have been suggested as strong contributors, as they can facilitate larval transport (White et al., 2010). Such is the case of the abyssal sponge Plenaster craigi and the shallow-water Antarctic sponge Dendrilla antarctica (Taboada et al., 2018; Leiva et al., 2019) or also two deep-water Southern Ocean shrimps, whose genetic connectivity is mainly explained by the Antarctic Circumpolar Current (Raupach et al., 2010). In this sense, the genetic connectivity and gene flow detected in P. ventilabrum at higher latitudes is likely promoted by the northern route of the North Atlantic Current and its interaction with the Norwegian Atlantic Current and the Norwegian Coastal Current, and their associated deeper currents (Hansen and Østerhus, 2000) (Figure 2). The migration pattern detected in our analyses also followed this path, occurring preferentially from Rockall Bank to the British Islands and with most of the individuals having an origin in the Rockall Bank area (Figure 5). In any case, the high connectivity detected between the different areas may be achieved in a ‘stepping-stone’ fashion (Breusing et al., 2015), given the relatively short larval duration in P. ventilabrum. Lecithotrophic larvae or direct development are dominant in demersal deep-sea organisms (Pearse, 1994), where food conditions are poor and development is low, allowing them to persist longer in the seawater column. That could therefore potentially translate into longer larval duration periods. However, evidence is not conclusive about this, and although there are some indications that lecithotrophic larvae have a more restricted dispersal ability (Baco et al., 2016), this does not seem to apply to P. ventilabrum or other organisms. Indeed, the dispersal capacity of gametes (which could be the primarily dispersing elements in P. ventilabrum) is completely unknown in most invertebrates, but deserves further study to understand the patterns observed in species mostly relying on them for dispersal. In any case, the results we observed for P. ventilabrum between the Kerry Head Reef and Tromsøflaket contrast to those reported, for instance, for the reef-building L. pertusa from a similar region in the North East Atlantic. Using microsatellites and traditional markers le Goff-Vitry et al. (2004) reported the occurrence of distinct offshore and fjord genetic populations, which showed limited gene flow between sites probably due to the age of these coral communities, the high levels of inbreeding caused by self-recruitment, and the prevalence of asexual reproduction. This highlights the importance of using species with different biological strategies in population connectivity studies despite they might be sympatric (Jenkins and Stevens, 2018).
Importantly, we observed no effect of bathymetry on samples of P. ventilabrum. Whilst depth is a prominent driver of differentiation in several marine species (Taylor and Roterman, 2017), including a recent remarkable example for the gorgonian Paramuricea biscaya showing depth segregation for samples separated only tens of kilometres (Galaska et al., 2021), the groupings inferred with the clustering analyses for P. ventilabrum showed no bathymetric segregation (Figures 3B, C, 4). This was corroborated by our oceanographic modelling, showing that particles released from regions with different depths were capable of developing genetic connections. The hydrodynamic models in this study used monthly mean flow fields from a long time-series and were designed to meaningfully produce estimates of the broad-scale connectivity of P. ventilabrum samples collected over different years. Such an approach is designed to support accurate estimates of connectivity that arise from genetic information and represents a computationally efficient approach, but will poorly describe transient features such as fronts, eddies and other time-varying features of the circulation such as up- and downwelling that may contribute to genetic connectivity (Sardà et al., 2010; Marra et al., 2015). Alternatively, the lack of differentiation in our samples may be an artefact of the narrow bathymetric sampling range, as was suggested by Zeng et al. (2019), who failed to detect differentiation among sponge samples collected at depths over 1,300 m apart. In order to test hypotheses about the lack of genetic structure for P. ventilabrum when comparing samples from different depths, further studies should include samples from a broader bathymetric range.
The expansion of anthropogenic threats into the deep sea demonstrates the increasing need to establish new protected areas. Genetic data is central to the planning of effective conservation schemes as it enables the detection of diversity hotspots, provides estimates for the spatial scales at which connective networks exist, and allows for the inference of the genetic resilience of a species (Baco et al., 2016; Zeng et al., 2019). Identifying the direction of gene flow and which populations act as reservoirs for genetic diversity is a key component for the success of management approaches, as populations may rely on recruitment from areas that do not have any protection (Baco et al., 2016; Kenchington et al., 2019).
Here we studied several areas with different degrees of protection across the North East Atlantic Ocean (Table 1). Our results suggest that all protected areas studied are well-connected with each other, since they all fell within the panmictic population detected between Ireland and Norway. The connection along these areas, though, is not bidirectional but mainly northwards (Figure 5), which implies that limiting the genetic flow from source populations located to the south might compromise the recovery of areas to the north.
As already suggested, the establishment of MPAs is unlikely to mitigate the effects of ongoing global threats such as climate-induced changes (Morato et al., 2020; Puerta et al., 2020). These changes are leading to a decrease in genetic diversity in wild populations and a decreased resilience to environmental stressors and hence a reduced adaptive evolutionary potential of species (Spielman et al., 2004). In P. ventilabrum, He (=genetic diversity) was considerably lower (He=0.131; Table 2) than in other studies using SNPs including a shallow-water Antarctic sponge (He=0.3; Leiva et al., 2019), the deep-water glass sponge Aphrocallistes vastus from the NE Pacific (He=0.162; Brown et al., 2017), and three deep-water species from the NW Atlantic, with two recently investigated Phakellia species (He=0.369–0.400; Busch et al., 2020; He=0.177; Taboada et al., 2022). Similarly, the genetic diversity in P. ventilabrum was also low when compared to that in studies using microsatellites in sponges, where estimates ranged from 0.4 to 0.8 (Pérez-Portela and Riesgo, 2018). Thus, our genetic diversity values for P. ventilabrum suggest that this species, at least for the locations investigated here, may have a reduced adaptation capacity and high vulnerability, potentially compromising the future resilience of this species under global change. In any case, a recent study by Teixeira and Huber (2021) indicates that the direct relationship between genetic diversity and the risk of species extinction should no longer be generalized, and proposes that understanding the properties of functional genetic diversity, demographic history, and ecological relationships are also necessary for implementing effective conservation strategies.
Our study represents an important development in the assessment of deep-sea connectivity and population genetics, building upon existing evidence that suggests that larval dispersal ability is not the principal factor in determining connectivity (Lester et al., 2007; Weersing and Toonen, 2009). The prominent genetic structuring alongside the panmixis exhibited by P. ventilabrum exemplifies how oceanic currents can both promote and inhibit larval dispersal, thus governing molecular connectivity and genetic differentiation. Furthermore, the discrepancy with the wealth of studies showing bathymetry to be a strong driver of differentiation (Taylor and Roterman, 2017) and the contrast with several shallow-water sponges that exhibit strong structuring at small spatial scales (Pérez-Portela and Riesgo, 2018), further suggests that connectivity does not correlate entirely with geographic distance and bathymetry, and that environmental variability may be the principal isolating factor. The expansion of anthropogenic threats into deeper waters demonstrates that an enhanced understanding of spatial scales at which connectivity exists is critical for effective conservation, and studies as the one here presented that elucidate mechanisms of connectivity are therefore of paramount importance.
RAD-seq data for each individual sample are deposited in the NCBI SRA database, BioProject PRJNA813183. All other data generated or analyzed during this study are included in this published article and in the article/Supplementary Material.
ST and AR designed the research. ST, PR, PC, VK, JC, HR, JX, JD, BP, FB, CL and AR conducted fieldwork, collecting samples and environmental data. ST, CW, VK, MBA and AR conducted the lab work. ST, CW, AC, MA, CL and AR performed the population genomic analyses. SW, AD, FM and EK performed the oceanographic modelling and current interpretation. ST, CW, AC, MA and AR undertook connectivity analyses and interpretation. ST, CW and AR wrote the paper. All authors contributed to the article and approved the submitted version.
The work leading to this publication has received funding from the European Union’s Horizon 2020 research and innovation programme through the SponGES project (grant agreement no. 679849). ST received funding from the grant PID2020-117115GA-100 funded by MCIN/AEI/10.13039/501100011033 and by the Ramón y Cajal grant RYC2021-03152-I, funded by the MCIN/AEI/10.13039/501100011033 and the European Union «NextGenerationEU»/PRTR». JX is further supported by national funds through FCT Foundation for Science and Technology within the scope of UIDB/04423/2020, UIDP/04423/2020, and CEECIND/00577/2018. PR is further supported by the EU-funded Nature + LIFE INDEMARES (07/NAT/E/ 000732) and INTEMARES (LIFE15 IPE ES 012) projects; the Fundación Biodiversidad (Spanish Ministry of Agriculture, Food and Environment) was responsable for the coordination of this project, involving different scientific institutions and NGOs.
We would like to dedicate this article to the memory of Prof. Hans Tore Rapp, who was a wonderful scientist and person and an esteemed member of the sponge community. We thank the crew of all the vessels that were involved in sample collection. We thank two reviewers that greatly improved an early version of the manuscript. We also thank all the members of the Riesgo Lab, Martín Taboada, Teo Taboada and Otilia Moreno, for all the help they provided during the sample processing and writing of the manuscript.
The authors declare that the research was conducted in the absence of any commercial or financial relationships that could be construed as a potential conflict of interest.
All claims expressed in this article are solely those of the authors and do not necessarily represent those of their affiliated organizations, or those of the publisher, the editors and the reviewers. Any product that may be evaluated in this article, or claim that may be made by its manufacturer, is not guaranteed or endorsed by the publisher.
This document reflects only the authors’ view and the Executive Agency for Small and Medium-sized Enterprises (EASME) is not responsible for any use that may be made of the information it contains.
The Supplementary Material for this article can be found online at: https://www.frontiersin.org/articles/10.3389/fmars.2023.1177106/full#supplementary-material
Supplementary Figure 1 | Analyses based on the set of neutral SNPs. (A) DAPC analysis for the whole dataset of P. ventilabrum with k=2. (B) Delta-K plot (STRUCTURE analysis) for the whole dataset of P. ventilabrum. (C) Akaike Information Criterion (AIC) values (snapclust analysis) for the whole dataset of P. ventilabrum. (D) Assign plot (k=2) indicating the assignation of individuals to the different clusters for the whole dataset of P. ventilabrum. (E) Delta-K plot (STRUCTURE analysis) for the reduced dataset of P. ventilabrum. (F) Akaike Information Criterion (AIC) values (snapclust analysis) for the reduced dataset of P. ventilabrum.
Supplementary Figure 2 | Trajectories of particles released from each region for a duration of April to October. (A) Cantabrian Sea. (B) Roscoff. (C) Kerry Heads Reef. (D) Porcupine Bank. (E) Upper Hebridean Shelf South. (F) Rockall Bank. (G) Shetland Shelf South. (H) Upper Hebridean Shelf North. (I).Shetland Shelf North Shallow. (J) Shetland Shelf North-Deep Wyville. (K) Wyville Thomson Ridge Deep. (L) Faroe Shetland Sponge Belt. (M) North of Shetland. (N) Sweden. (O) Norway-Korsfjorden. (P) Sula Reef-Trondheimsfjorden. (Q) Tromsøflaket.
Supplementary Figure 3 | Connectivity matrices show that the proportion of modelled particles released from each of the 17 areas including particles that crossed, terminated or were retained in the receiving area. Particles were released from (A) (April), (B) (October) with two-week duration. (C) Particles were advected with seven-month duration from April to October.
Supplementary Figure 4 | Analyses based on the set of SNPs under selection. (A) Akaike Information Criterion (AIC) values (snapclust analysis) for the whole dataset of P. ventilabrum. (B) DAPC analysis for the whole dataset of P. ventilabrum with k=3. (C) Assign plot (k=3) indicating the assignation of individuals to the different clusters for the whole dataset of P. ventilabrum.
Andrews K. R., Copus J. M., Wilcox C., Williams A. J., Newman S. J., Wakefield C. B., et al. (2020). Range-wide population structure of 3 deepwater eteline snappers across the indo-pacific basin. J. Heredity 111, 471–485. doi: 10.1093/jhered/esaa029
Aslam T., Hall R. A., Dye S. R. (2018). Internal tides in a dendritic submarine canyon. Prog. Oceanogr 169, 20–32. doi: 10.1016/J.POCEAN.2017.10.005
Ayata S. D., Lazure P., Thiébaut É. (2010). How does the connectivity between populations mediate range limits of marine invertebrates? a case study of larval dispersal between the bay of Biscay and the English channel (North-East Atlantic). Prog. Oceanogr 87, 18–36. doi: 10.1016/j.pocean.2010.09.022
Baco A. R., Etter R. J., Ribeiro P. A., von der Heyden S., Beerli P., Kinlan B. P. (2016). A synthesis of genetic connectivity in deep-sea fauna and implications for marine reserve design. Mol. Ecol. 25, 3276–3298. doi: 10.1111/mec.13689
Beaumont M. A., Nichols R. A. (1996). Evaluating loci for use in the genetic analysis of population structure. Proc. Biol. Sci. / R. Soc. 263, 1619–1626. doi: 10.1098/rspb.1996.0237
Beazley L. I., Kenchington E. L., Murillo F. J., del Sacau M. M. (2013). Deep-sea sponge grounds enhance diversity and abundance of epibenthic megafauna in the Northwest Atlantic. ICES J. Mar. Sci. 70, 1471–1490. doi: 10.1093/icesjms/fst124
Benjamini Y., Hochberg Y. (1995). Controlling the false discovery rate: a practical and powerful approach to multiple testing. J. R. Stat. Society: Ser. B (Methodological) 57, 289–300. doi: 10.1111/j.2517-6161.1995.tb02031.x
Booth D. A., Ellett D. J. (1983). The Scottish continental slope current. Cont Shelf Res. 2, 127–146. doi: 10.1016/0278-4343(83)90012-2
Botsford L. W., White J. W., Coffroth M. A., Paris C. B., Planes S., Shearer T. L., et al. (2009). Connectivity and resilience of coral reef metapopulations in marine protected areas: matching empirical efforts to predictive needs. Coral Reefs 28, 327–337. doi: 10.1007/s00338-009-0466-z
Bracco A., Liu G., Galaska M. P., Quattrini A. M., Herrera S. (2019). Integrating physical circulation models and genetic approaches to investigate population connectivity in deep-sea corals. J. Mar. Syst. 198, 103189. doi: 10.1016/j.jmarsys.2019.103189
Breusing C., Johnson S. B., Tunnicliffe V., Vrijenhoek R. C. (2015). Population structure and connectivity in indo-pacific deep-sea mussels of the Bathymodiolus septemdierum complex. Conserv. Genet. 16, 1415–1430. doi: 10.1007/s10592-015-0750-0
Brown R. R., Davis C. S., Leys S. P. (2017). Clones or clans: the genetic structure of a deep-sea sponge, Aphrocallistes vastus, in unique sponge reefs of British Columbia, Canada. Mol. Ecol. 26, 1045–1059. doi: 10.1111/mec.13982
Buhl-Mortensen L., Vanreusel A., Gooday A. J., Levin L. A., Priede I. G., Buhl-Mortensen P., et al. (2010). Biological structures as a source of habitat heterogeneity and biodiversity on the deep ocean margins. Mar. Ecol. 31, 21–50. doi: 10.1111/j.1439-0485.2010.00359.x
Busch K., Taboada S., Riesgo A., Koutsouveli V., Ríos P., Cristobo J., et al. (2020). Population connectivity of fan-shaped sponge holobionts in the deep cantabrian Sea. Deep Sea Res. Part I: Oceanographic Res. Papers 167, 103427. doi: 10.1016/j.dsr.2020.103427
Catchen J., Hohenlohe P. A., Bassham S., Amores A., Cresko W. A. (2013). Stacks: an analysis tool set for population genomics. Mol. Ecol. 22, 3124–3140. doi: 10.1111/mec.12354
Chaves-Fonnegra A., Feldheim K. A., Secord J., Lopez J. V. (2015). Population structure and dispersal of the coral-excavating sponge Cliona delitrix. Mol. Ecol. 24, 1447–1466. doi: 10.1111/mec.13134
Combosch D. J., Lemer S., Ward P. D., Landman N. H., Giribet G. (2017). Genomic signatures of evolution in Nautilus —an endangered living fossil. Mol. Ecol. 26, 5923–5938. doi: 10.1111/mec.14344
Dailianis T., Tsigenopoulos C. S., Dounas C., Voultsiadou E. (2011). Genetic diversity of the imperilled bath sponge Spongia officinalis Linnaeus 1759 across the Mediterranean Sea: patterns of population differentiation and implications for taxonomy and conservation. Mol. Ecol. 20, 3757–3772. doi: 10.1111/j.1365-294X.2011.05222.x
De Goeij J. M., Van Oevelen D., Vermeij M. J. A., Osinga R., Middelburg J. J., De Goeij A. F. P. M., et al. (2013). Surviving in a marine desert: the sponge loop retains resources within coral reefs. Sci. (1979) 342, 108–110. doi: 10.1126/science.1241981
Delandmeter P., Van Sebille E. (2019). The parcels v2.0 Lagrangian framework: new field interpolation schemes. Geosci Model. Dev. 12, 3571–3584. doi: 10.5194/gmd-12-3571-2019
de Medeiros B. A. S., Farrell B. D. (2018). Whole-genome amplification in doubledigest RADseq results in adequate libraries but fewer sequenced loci. PeerJ 6, e5089. doi: 10.7717/peerj.5089
de Voogd N. J., Alvarez B., Boury-Esnault N., Carballo J. L., Cárdenas P., Díaz M.-C., et al. (2022) World Porifera database. Available at: https://www.marinespecies.org/poriferaon2022-02-16.
Earl D. A., vonHoldt B. M. (2012). STRUCTURE HARVESTER: a website and program for visualizing STRUCTURE output and implementing the evanno method. Conserv. Genet. Resour 4, 359–361. doi: 10.1007/s12686-011-9548-7
Excoffier L., Hofer T., Foll M. (2009). Detecting population. Heredity (Edinb) 103, 285–298. doi: 10.1038/hdy.2009.74
Excoffier L., Lischer H. E. L. (2010). Arlequin suite ver 3.5: a new series of programs to perform population genetics analyses under Linux and windows. Mol. Ecol. Resour 10, 564–567. doi: 10.1111/j.1755-0998.2010.02847.x
Foll M., Gaggiotti O. (2008). A genome-scan method to identify selected loci appropriate for both dominant and codominant markers: a Bayesian perspective. Genetics 180, 977–993. doi: 10.1534/genetics.108.092221
Fox A. D., Henry L. A., Corne D. W., Roberts J. M. (2016). Sensitivity of marine protected area network connectivity to atmospheric variability. R Soc. Open Sci. 3 (11), 160494. doi: 10.1098/rsos.160494
Galaska M. P., Liu G., West D., Erickson K., Quattrini A. M., Bracco A., et al. (2021). Seascape genomics reveals metapopulation connectivity network of Paramuricea biscaya in the northern gulf of Mexico. Front. Mar. Sci. 8. doi: 10.3389/fmars.2021.790929
Gary S. F., Fox A. D., Biastoch A., Roberts J. M., Cunningham S. A. (2020). Larval behaviour, dispersal and population connectivity in the deep sea. Sci. Rep. 10, 1–12. doi: 10.1038/s41598-020-67503-7
Giles E. C., Saenz-Agudelo P., Hussey N. E., Ravasi T., Berumen M. L. (2015). Exploring seascape genetics and kinship in the reef sponge Stylissa carteri in the red Sea. Ecol. Evol. 5, 2487–2502. doi: 10.1002/ece3.1511
Gillibrand P. A., Siemering B., Miller P. I., Davidson K. (2016). Individual-based modelling of the development and transport of a Karenia mikimotoi bloom on the north-west European continental shelf. Harmful Algae 53, 118–134. doi: 10.1016/j.hal.2015.11.011
Gómez A., Hughes R. N., Wright P. J., Carvalho G. R., Lunt D. H. (2007). Mitochondrial DNA phylogeography and mating compatibility reveal marked genetic structuring and speciation in the NE Atlantic bryozoan Celleporella hyalina. Mol. Ecol. 16, 2173–2188. doi: 10.1111/j.1365-294X.2007.03308.x
Hansen B., Østerhus S. (2000). North Atlantic-Nordic seas exchanges. Prog. Oceanogr 45, 109–208. doi: 10.1016/S0079-6611(99)00052-X
Hawkes N., Korabik M., Beazley L., Rapp H. T., Xavier J. R., Kenchington E. (2019). Glass sponge grounds on the scotian shelf and their associated biodiversity. Mar. Ecol. Prog. Ser. 614, 91–109. doi: 10.3354/meps12903
Hellberg M. E., Burton R. S., Neigel J. E., Palumbi S. R. (2002). Genetic assessment of connectivity among marine populations. Bull. Mar. Sci. 70, 273–290.
Hoarau G., Coyer J. A., Veldsink J. H., Stam W. T., Olsen J. L. (2007). Glacial refugia and recolonization pathways in the brown seaweed Fucus serratus. Mol. Ecol. 16, 3606–3616. doi: 10.1111/j.1365-294X.2007.03408.x
Hogg M. M., Tendal O. S., Conway K. W., Pomponi S. A., van Soest R. W. M., Gutt J., et al. (2010). Deep-sea sponge grounds regional seas: reservoirs of biodiversity. UNEP-WCMC biodiversity series no. 32 (Cambridge, UK: UNEP-WCMC).
Hohenlohe P. A., Amish S. J., Catchen J. M., Allendorf F. W., Luikart G. (2011). Next-generation RAD sequencing identifies thousands of SNPs for assessing hybridization between rainbow and westslope cutthroat trout. Mol. Ecol. Resour 11, 117–122. doi: 10.1111/j.1755-0998.2010.02967.x
Holliday N., Cunninham S., Johnson C., Gary S., Griffiths C., Read J., et al. (2015). Multidecadal variability of potential temperature, salinity,and transport in the eastern subpolar north Atlantic. J. Geophys Res. Oceans 120, 5945–5967. doi: 10.1002/2015JC011107.Received
Houpert L., Cunningham S., Fraser N., Johnson C., Holliday N. P., Jones S., et al. (2020). Observed variability of the north Atlantic current in the rockall trough from 4years of mooring measurements. J. Geophys Res. Oceans 125, e2020JC016403. doi: 10.1029/2020JC016403
Howatt T. M., Allen S. E. (2013). Impact of the continental shelf slope on upwelling through submarine canyons. J. Geophys Res. Oceans 118, 5814–5828. doi: 10.1002/jgrc.20401
Hughes D. J., Narayanaswamy B. E. (2013). Impacts of climate change on deep-sea habitats. MCCIP Sci. Rev. 2013, 204–210. doi: 10.14465/2013.arc21.204-210
Huthnance J. M. (1986). The rockall slope current and shelf-edge processes. Proc. R. Soc. Edinburgh Section B: Biol. Sci. 88, 83–101. doi: 10.1017/S0269727000004486
Jakobsson M., Rosenberg N. A. (2007). CLUMPP: a cluster matching and permutation program for dealing with label switching and multimodality in analysis of population structure. Bioinformatics 23, 1801–1806. doi: 10.1093/bioinformatics/btm233
Jeffries D. L., Copp G. H., Handley L. L., Håkan Olsén K., Sayer C. D., Hänfling B. (2016). Comparing RADseq and microsatellites to infer complex phylogeographic patterns, an empirical perspective in the crucian carp, Carassius carassius, l. Mol. Ecol. 25, 2997–3018. doi: 10.1111/mec.13613
Jenkins T. L., Stevens J. R. (2018). Assessing connectivity between MPAs: selecting taxa and translating genetic data to inform policy. Mar. Policy 94, 165–173. doi: 10.1016/j.marpol.2018.04.022
Jolly M. T., Jollivet D., Gentil F., Thiébaut E., Viard F. (2005). Sharp genetic break between Atlantic and English channel populations of the polychaete Pectinaria koreni, along the north coast of France. Heredity (Edinb) 94, 23–32. doi: 10.1038/sj.hdy.6800543
Jombart T. (2008). Adegenet: a r package for the multivariate analysis of genetic markers. Bioinformatics 24, 1403–1405. doi: 10.1093/bioinformatics/btn129
Jombart T., Ahmed I. (2011). Adegenet 1.3-1: new tools for the analysis of genome-wide SNP data. Bioinformatics 27, 3070–3071. doi: 10.1093/bioinformatics/btr521
Jombart T., Devillard S., Balloux F. (2010). Discriminant analysis of principal components: a new method for the analysis of genetically structured populations. BMC Genet. 11, 94. doi: 10.1186/1471-2156-11-94
Jones D. O. B., Hudson I. R., Bett B. J. (2006). Effects of physical disturbance on the cold-water megafaunal communities of the faroe-Shetland channel. Mar. Ecol. Prog. Ser. 319, 43–54. doi: 10.3354/meps319043
Jones D. O. B., Wigham B. D., Hudson I. R., Bett B. J. (2007). Anthropogenic disturbance of deep-sea megabenthic assemblages: a study with remotely operated vehicles in the faroe-Shetland channel, NE Atlantic. Mar. Biol. 151, 1731–1741. doi: 10.1007/s00227-007-0606-3
Kamvar Z. N., Brooks J. C., Grünwald N. J. (2015). Novel r tools for analysis of genome-wide population genetic data with emphasis on clonality. Front. Genet. 6. doi: 10.3389/fgene.2015.00208
Keenan K., McGinnity P., Cross T. F., Crozier W. W., Prodöhl P. A. (2013). diveRsity: an r package for the estimation and exploration of population genetics parameters and their associated errors. Methods Ecol. Evol. 4, 782–788. doi: 10.1111/2041-210X.12067@10.1111/(ISSN)2041-210X.ECOLOGYANDEVOLUTIONIRELAND
Kenchington E. L., Patwary M. U., Zouros E., Bird C. J. (2006). Genetic differentiation in relation to marine landscape in a broadcast-spawning bivalve mollusc (Placopecten magellanicus). Mol. Ecol. 15, 1781–1796. doi: 10.1111/j.1365-294X.2006.02915.x
Kenchington E., Power D., Koen-Alonso M. (2013). Associations of demersal fish with sponge grounds on the continental slopes of the northwest Atlantic. Mar. Ecol. Prog. Ser. 477, 217–230. doi: 10.3354/meps10127
Kenchington E., Wang Z., Lirette C., Murillo F. J., Guijarro J., Yashayaev I., et al. (2019). Connectivity modelling of areas closed to protect vulnerable marine ecosystems in the northwest Atlantic. Deep Sea Res. 1 Oceanogr Res. Pap 143, 85–103. doi: 10.1016/j.dsr.2018.11.007
Klitgaard A. B. (1995). The fauna associated with outer shelf and upper slope sponges (porifera, demospongiae) at the faroe islands, northeastern Atlantic. Sarsia 80, 1–22. doi: 10.1080/00364827.1995.10413574
Knutsen H., Jorde P. E., SannÆs H., Rus Hoelzel A., Bergstad O. A., Stefanni S., et al. (2009). Bathymetric barriers promoting genetic structure in the deepwater demersal fish tusk (Brosme brosme). Mol. Ecol. 18, 3151–3162. doi: 10.1111/j.1365-294X.2009.04253.x
Koutsikopoulos C., Le Cann B. (1996). Physical processes and hydrological structures related to the bay of Biscay anchovy. Sci. Mar. 60, 9–19.
Koutsouveli V., Balgoma D., Checa A., Hedeland M., Riesgo A., Cárdenas P. (2022). Oogenesis and lipid metabolism in the deep-sea sponge Phakellia ventilabrum: an histological, lipidomic and transcriptomic approach. Sci. Rep. 12, 6317. doi: 10.1038/s41598-022-10058-6
Kutti T., Bannister R. J., Fosså J. H. (2013). Community structure and ecological function of deep-water sponge grounds in the traenadypet MPA-northern Norwegian continental shelf. Cont Shelf Res. 69, 21–30. doi: 10.1016/j.csr.2013.09.011
Lambeck K., Esat T. M., Potter E. K. (2002). Links between climate and sea levels for the past three million years. Nature 419, 199–206. doi: 10.1038/nature01089
Lange M., Van Sebille E. (2017). Parcels v0.9: prototyping a Lagrangian ocean analysis framework for the petascale age. Geosci Model. Dev. 10, 4175–4186. doi: 10.5194/gmd-10-4175-2017
Lavelle W., Mohn C. (2010). Motion, commotion, and biophysical connections at deep ocean seamounts. Oceanography 23, 90–103.
Lavin L., Valdes L., Sanchez F., Abaunza P., Forest A., Boucher J., et al. (2006). “The bay of Biscay: the encountering of the ocean and the shelf,” in The Sea, ideas and observations on progress in the study of the seas: the global coastal ocean, interdisciplinary regional studies and syntheses. the coasts of Africa, Europe, middle East, Oceania and polar regions, vol. 935 . Eds. Robinson A., Brink K. (USA: Harvard University Press).
Le Boyer A., Cambon G., Daniault N., Herbette S., Le Cann B., Marié L., et al. (2009). Observations of the ushant tidal front in September 2007. Cont Shelf Res. 29, 1026–1037. doi: 10.1016/J.CSR.2008.12.020
le Goff-Vitry M. C., Pybus O. G., Rogers A. D. (2004). Genetic structure of the deep-sea coral Lophelia pertusa in the northeast Atlantic revealed by microsatellites and internal transcribed spacer sequences. Mol. Ecol. 13, 537–549. doi: 10.1046/j.1365-294X.2004.2079.x
Leiva C., Taboada S., Kenny N. J., Combosch D., Giribet G., Jombart T., et al. (2019). Population substructure and signals of divergent adaptive selection despite admixture in the sponge dendrilla antarctica from shallow waters surrounding the Antarctic peninsula. Mol. Ecol. 28, 3151–3170. doi: 10.1111/mec.15135
Lester S. E., Ruttenberg B. I., Gaines S. D., Kinlan B. P. (2007). The relationship between dispersal ability and geographic range size. Ecol. Lett. 10, 745–758. doi: 10.1111/j.1461-0248.2007.01070.x
Liu G., Bracco A., Quattrini A. M., Herrera S. (2021). Kilometer-scale larval dispersal processes predict metapopulation connectivity pathways for Paramuricea biscaya in the northern gulf of Mexico. Front. Mar. Sci. 8. doi: 10.3389/fmars.2021.790927
Liu X., Fu Y. X. (2020). Stairway plot 2: demographic history inference with folded SNP frequency spectra. Genome Biol. 21, 1–9. doi: 10.1186/s13059-020-02196-9
Luikart G., England P. R., Tallmon D., Jordan S., Taberlet P. (2003). The power and promise of population genomics: from genotyping to genome typing. Nat. Rev. Genet. 4, 981–994. doi: 10.1038/nrg1226
Maggs C. A., Castilho R., Foltz D., Henzler C., Jolly M. T., Kelly J., et al. (2008). Evaluating signatures of glacial refugia for north Atlantic benthic marine taxa. Ecology 89, 108–122. doi: 10.1890/08-0257.1
Maier S. R., Kutti T., Bannister R. J., Fang J. K. H., van Breugel P., van Rijswijk P., et al. (2020). Recycling pathways in cold-water coral reefs: use of dissolved organic matter and bacteria by key suspension feeding taxa. Sci. Rep. 10, 1–13. doi: 10.1038/s41598-020-66463-2
Maldonado M. (2006). The ecology of the sponge larva. Can. J. Zool 84, 175–194. doi: 10.1139/z05-177
Maldonado M., Aguilar R., Bannister R. J., James J., Conway K. W., Dayton P. K., et al. (2017). “Sponge grounds as key marine habitats: a synthetic review of types, structure, functional roles, and conservation concerns,” in Marine animal forests: the ecology of benthic biodiversity hotspots Rossi S. Eds. (Switzerland: Springer International Publishing), 145–183. doi: 10.1007/978-3-319-21012-4
Malinsky M., Trucchi E., Lawson D. J., Falush D. (2018). RADpainter and fineRADstructure: population inference from RADseq data. Mol. Biol. Evol. 35, 1284–1290. doi: 10.1093/molbev/msy023
Mariani S., Baillie C., Colosimo G., Riesgo A. (2019). Sponges as natural environmental DNA samplers. Curr. Biol. 29, R401–R402. doi: 10.1016/j.cub.2019.04.031
Marra A., Mona S., Sà R. M., ‘Onghia G. D., Maiorano P. (2015). Population genetic history of Aristeus antennatus (Crustacea: decapoda) in the western and central Mediterranean sea. PloS One 10, 1–16. doi: 10.1371/journal.pone.0117272
Meirmans P. G., Van Tienderen P. H. (2004). GENOTYPE and GENODIVE: two programs for the analysis of genetic diversity of asexual organisms. Mol. Ecol. Notes 4, 792–794. doi: 10.1111/j.1471-8286.2004.00770.x
Meyer H. K., Roberts E. M., Rapp H. T., Davies A. J. (2019). Spatial patterns of arctic sponge ground fauna and demersal fish are detectable in autonomous underwater vehicle (AUV) imagery. Deep Sea Res. 1 Oceanogr Res. Pap 153, 103137. doi: 10.1016/j.dsr.2019.103137
Miller K. J., Gunasekera R. M. (2017). A comparison of genetic connectivity in two deep sea corals to examine whether seamounts are isolated islands or stepping stones for dispersal. Sci. Rep. 7, 1–14. doi: 10.1038/srep46103
Morato T., González-Irusta J. M., Dominguez-Carrió C., Wei C. L., Davies A., Sweetman A. K., et al. (2020). Climate-induced changes in the suitable habitat of cold-water corals and commercially important deep-sea fishes in the north Atlantic. Glob Chang Biol. 26, 2181–2202. doi: 10.1111/gcb.14996
Morato T., Watson R., Pitcher T. J., Pauly D. (2006). Fishing down the deep. Fish Fisheries 7, 24–34. doi: 10.1111/j.1467-2979.2006.00205.x
Morrison C. L., Ross S. W., Nizinski M. S., Brooke S., Järnegren J., Waller R. G., et al. (2011). Genetic discontinuity among regional populations of lophelia pertusa in the north Atlantic ocean. Conserv. Genet. 12, 713–729. doi: 10.1007/s10592-010-0178-5
New A. L., Smythe-Wright D. (2001). Aspects of the circulation in the rockall trough. Cont Shelf Res. 21, 777–810. doi: 10.1016/S0278-4343(00)00113-8
Paoli C., Montefalcone M., Morri C., Vassallo P., Nike Bianchi C. (2017). “Ecosystem functions and services of the marine animal forests,” in Marine animal forests: the ecology of benthic biodiversity hotspots Rossi S. Ed. (Switzerland: Springer International Publishing), 1271–1312. doi: 10.1007/978-3-319-21012-4
Paris J. R., Stevens J. R., Catchen J. M. (2017). Lost in parameter space: a road map for stacks. Methods Ecol. Evol. 8, 1360–1373. doi: 10.1111/2041-210X.12775
Pearse J. S. (1994). “Cold-water echinoderms break thorson’s rule,” in Reproduction, larval biology and recruitment in the deep-sea benthos. Eds. Young C. M., Eckelbarger K. J. (New York: Columbia University), 27–43.
Penny Holliday N., Pollard R. T., Read J. F., Leach H. (2000). Water mass properties and fluxes in the rockall trough 1975–1998. Deep Sea Res. Part I: Oceanographic Res. Papers 47, 1303–1332. doi: 10.1016/S0967-0637(99)00109-0
Pérez-Portela R., Almada V., Turon X. (2013). Cryptic speciation and genetic structure of widely distributed brittle stars (Ophiuroidea) in Europe. Zool Scr 42, 151–169. doi: 10.1111/j.1463-6409.2012.00573.x
Pérez-Portela R., Riesgo A. (2018). Population genomics of early-splitting lineages of metazoans Oleksiak M. F., Rajora O. P. Eds. (Switzerland: Springer International Publishing),. 1–35. doi: 10.1007/13836_2018_13
Peterson B. K., Weber J. N., Kay E. H., Fisher H. S., Hoekstra H. E. (2012). Double digest RADseq: an inexpensive method for de novo SNP discovery and genotyping in model and non-model species. PloS One 7, e37135. doi: 10.1371/journal.pone.0037135
Pflaumann U., Sarnthein M., Chapman M., d’Abreu L., Funnell B., Huels M., et al. (2003). Glacial north Atlantic: Sea-surface conditions reconstructed by GLAMAP 2000. Paleoceanography 18, 3. doi: 10.1029/2002pa000774
Pham C. K., Murillo F. J., Lirette C., Maldonado M., Colaço A., Ottaviani D., et al. (2019). Removal of deep-sea sponges by bottom trawling in the Flemish cap area: conservation, ecology and economic assessment. Sci. Rep. 9, 1–13. doi: 10.1038/s41598-019-52250-1
Pham C. K., Vandeperre F., Menezes G., Porteiro F., Isidro E., Morato T. (2015). The importance of deep-sea vulnerable marine ecosystems for demersal fish in the Azores. Deep Sea Res. Part I: Oceanographic Res. Papers 96, 80–88. doi: 10.1016/J.DSR.2014.11.004
Pingree R. D., Le Cann B. (1989). Celtic and armorican slope and shelf residual currents. Prog. Oceanogr 23, 303–338. doi: 10.1016/0079-6611(89)90003-7
Pingree R. D., Le Cann B. (1990). Structure, strength and seasonality of the slope currents in the bay of Biscay region. J. Mar. Biol. Assoc. United Kingdom 70, 857–885. doi: 10.1017/S0025315400059117
Porter M., Inall M. E., Green J. A. M., Simpson J. H., Dale A. C., Miller P. I. (2016). Drifter observations in the summer time bay of Biscay slope current. J. Mar. Syst. 157, 65–74. doi: 10.1016/J.JMARSYS.2016.01.002
Prado E., Rodríguez-Basalo A., Cobo A., Ríos P., Sánchez F. (2020). 3D fine-scale terrain variables from underwater photogrammetry: a new approach to benthic microhabitat modeling in a circalittoral rocky shelf. Remote Sens (Basel) 12 (15), 2466. doi: 10.3390/RS12152466
Pritchard J. K., Stephens M., Donnelly P. (2000). Inference of population structure using multilocus genotype data. Genetics 155, 954–959. doi: 10.1093/genetics/155.2.945
Provan J., Bennett K. D. (2008). Phylogeographic insights into cryptic glacial refugia. Trends Ecol. Evol. 23, 564–571. doi: 10.1016/j.tree.2008.06.010
Puerta P., Johnson C., Carreiro-Silva M., Henry L. A., Kenchington E., Morato T., et al. (2020). Influence of water masses on the biodiversity and biogeography of deep-sea benthic ecosystems in the north Atlantic. Front. Mar. Sci. 7. doi: 10.3389/fmars.2020.00239
Ramiro-Sánchez B., González-Irusta J. M., Henry L.-A., Cleland J., Yeo I., Xavier J. R., et al. (2019). Characterization and mapping of a deep-sea sponge ground on the tropic seamount (Northeast tropical atlantic): implications for spatial management in the high seas. Front. Mar. Sci. 6. doi: 10.3389/fmars.2019.00278
Raupach M. J., Thatje S., Dambach J., Rehm P., Misof B., Leese F. (2010). Genetic homogeneity and circum-Antarctic distribution of two benthic shrimp species of the southern ocean, chorismus antarcticus and nematocarcinus lanceopes. Mar. Biol. 157, 1783–1797. doi: 10.1007/s00227-010-1451-3
Rix L., De Goeij J. M., Van Oevelen D., Struck U., Al-Horani F. A., Wild C., et al. (2018). Reef sponges facilitate the transfer of coral-derived organic matter to their associated fauna via the sponge loop. Mar. Ecol. Prog. Ser. 589, 85–96. doi: 10.3354/meps12443
Roberts C. M. (2002). Deep impact: the rising toll of fishing in the deep sea. Trends Ecol. Evol. 17, 242–245. doi: 10.1016/S0169-5347(02)02492-8
Roesti M., Salzburger W., Berner D. (2012). Uninformative polymorphisms bias genome scans for signatures of selection. BMC Evol. Biol. 12, 1–7. doi: 10.1186/1471-2148-12-94
R Team (2017). A language and environment for statistical computing (Vienna, Austria: R Foundation for Statistical Computing). Available at: https://www.R-project.org/.
Sánchez F., Serrano A., Ballesteros M. G. (2009). Photogrammetric quantitative study of habitat and benthic communities of deep cantabrian Sea hard grounds. Cont Shelf Res. 29, 1174–1188. doi: 10.1016/j.csr.2009.01.004
Sardà F., Roldán M. I., Heras S., Maltagliati F. (2010). Influence of the genetic structure of the red and blue shrimp, Aristeus antennatus (Risso 1816), on the sustainability of a deep-sea population along a depth gradient in the Western Mediterranean. Sci. Mar. 74, 569–575. doi: 10.3989/scimar.2010.74n3569
Schröder-Ritzrau A., Freiwald A., Mangini A. (2005). “U/Th-dating of deep-water corals from the eastern north Atlantic and the western Mediterranean Sea,” in Cold-water corals and ecosystems (Berlin, Heidelberg: Springer), 157–172. doi: 10.1007/3-540-27673-4_8
Schüller M. (2011). Evidence for a role of bathymetry and emergence in speciation in the genus Glycera (Glyceridae, polychaeta) from the deep Eastern weddell Sea. Polar Biol. 34, 549–564. doi: 10.1007/s00300-010-0913-x
Spielman D., Brook B. W., Frankham R. (2004). Most species are not driven to extinction before genetic factors impact them. Proc. Natl. Acad. Sci. U.S.A. 101, 15261–15264. doi: 10.1073/pnas.0403809101
Taboada S., Pérez-Portela R. (2016). Contrasted phylogeographic patterns on mitochondrial DNA of shallow and deep brittle stars across the Atlantic-Mediterranean area. Sci. Rep. 6, 1–13. doi: 10.1038/srep32425
Taboada S., Riesgo A., Wiklund H., Paterson G. L. J., Koutsouveli V., Santodomingo N., et al. (2018). Implications of population connectivity studies for the design of marine protected areas in the deep sea: an example of a demosponge from the clarion-clipperton zone. Mol. Ecol. 27, 4657–4679. doi: 10.1111/mec.14888
Taboada S., Ríos P., Mitchell A., Cranston A., Busch K., Tonzo V., et al. (2022). Genetic diversity, gene flow and hybridization in fan-shaped sponges (Phakellia spp.) in the north-East Atlantic deep sea. Deep Sea Res. Part I: Oceanographic Res. Papers 181, 103685. doi: 10.1016/j.dsr.2021.103685
Taylor M. L., Roterman C. N. (2017). Invertebrate population genetics across earth’s largest habitat: the deep-sea floor. Mol. Ecol. 26, 4872–4896. doi: 10.1111/mec.14237
Teixeira J. C., Huber C. D. (2021). The inflated significance of neutral genetic diversity in conservation genetics. Proc. Natl. Acad. Sci. 118, e2015096118. doi: 10.1073/pnas.2015096118
Thurber A. R., Sweetman A. K., Narayanaswamy B. E., Jones D. O. B., Ingels J., Hansman R. L. (2014). Ecosystem function and services provided by the deep sea. Biogeosciences 11, 3941–3963. doi: 10.5194/bg-11-3941-2014
van Aken H. M. (2000). The hydrography of the mid-latitude northeast Atlantic ocean: II: the intermediate water masses. Deep Sea Res. Part I: Oceanographic Res. Papers 47, 789–824. doi: 10.1016/S0967-0637(99)00112-0
Varela R. A., Rosón G., Herrera J. L., Torres-López S., Fernández-Romero A. (2005). A general view of the hydrographic and dynamical patterns of the rías baixas adjacent sea area. J. Mar. Syst. 54, 97–113. doi: 10.1016/J.JMARSYS.2004.07.006
Vu N., Zenger K., Guppy J., Sellars M., Kjeldsen S., Silva C., et al. (2020). Revised population structure and evidence for local adaptation in Australian giant black tiger shrimp (Penaeus monodon) using SNP analysis. BMC Genomics 21, 669. doi: 10.1186/s12864-021-07794-w
Wang S., Kenchington E., Wang Z., Davies A. J. (2021). Life in the fast lane: modeling the fate of glass sponge larvae in the gulf stream. Front. Mar. Sci., 1372. doi: 10.3389/fmars.2021.701218
Wedding L. M., Reiter S. M., Smith C. R., Gjerde K. M., Kittinger J. N., Friedlander A. M., et al. (2015). Managing mining of the deep seabed. Sci. (1979) 349, 144–145. doi: 10.1126/science.aac6647
Weersing K., Toonen R. J. (2009). Population genetics, larval dispersal, and connectivity in marine systems. Mar. Ecol. Prog. Ser. 393, 1–12. doi: 10.3354/meps08287
White M., Mohn C., de Stigter H., Mottram G. (2005). “Deep-water coral development as a function of hydrodynamics and surface productivity around the submarine banks of the rockall trough, NE Atlantic,” in Cold-water corals and ecosystems. Eds. Freiwald A., Roberts J. M. (Berlin, Heidelberg: Springer), 503–514. doi: 10.1007/3-540-27673-4_25
White C., Selkoe K. A., Watson J., Siegel D. A., Zacherl D. C., Toonen R. J. (2010). Ocean currents help explain population genetic structure. Proc. R. Soc. B: Biol. Sci. 277, 1685–1694. doi: 10.1098/rspb.2009.2214
Witte U. (1996). Seasonal reproduction in deep-sea sponges - triggered by vertical particle flux? Mar. Biol. 124, 571–581. doi: 10.1007/BF00351038
Xu G., McGillicuddy D. J., Mills S. W., Mullineaux L. S. (2018). Dispersal of hydrothermal vent larvae at East pacific rise 9–10°N segment. J. Geophys Res. Oceans 123, 7877–7895. doi: 10.1029/2018JC014290
Xuereb A., Kimber C. M., Curtis J. M. R., Bernatchez L., Fortin M. J. (2018). Putatively adaptive genetic variation in the giant California sea cucumber (Parastichopus californicus) as revealed by environmental association analysis of restriction-site associated DNA sequencing data. Mol. Ecol. 27, 5035–5048. doi: 10.1111/mec.14942
Young C. M., Devin M. G., Jaeckle W. B., Ekaratne S., George S. B. (1996). The potential for ontogenetic vertical migration by larvae of bathyal echinoderms. Oceanologica Acta 19, 263–271.
Young C. M., He R., Emlet R. B., Li Y., Qian H., Arellano S. M., et al. (2012). Dispersal of deep-sea larvae from the intra-American seas: simulations of trajectories using ocean models. Integr. Comp. Biol. 52, 483–496. doi: 10.1093/icb/ics090
Zardus J. D., Etter R. J., Chase M. R., Rex M. A., Boyle E. E. (2006). Bathymetric and geographic population structure in the pan-Atlantic deep-sea bivalve Deminucula atacellana (Schenck 1939). Mol. Ecol. 15, 639–651. doi: 10.1111/j.1365-294X.2005.02832.x
Keywords: ddRADSeq, panmixis, oceanographic modelling, genetic differentiation, reproductive cycle, SNPs
Citation: Taboada S, Whiting C, Wang S, Ríos P, Davies AJ, Mienis F, Kenchington E, Cárdenas P, Cranston A, Koutsouveli V, Cristobo J, Rapp HT, Drewery J, Baldó F, Morrow C, Picton B, Xavier JR, Arias MB, Leiva C and Riesgo A (2023) Long distance dispersal and oceanographic fronts shape the connectivity of the keystone sponge Phakellia ventilabrum in the deep northeast Atlantic. Front. Mar. Sci. 10:1177106. doi: 10.3389/fmars.2023.1177106
Received: 01 March 2023; Accepted: 15 May 2023;
Published: 16 June 2023.
Edited by:
Chiara Romano, University of Gastronomic Sciences, ItalyReviewed by:
Xavier Turon, Spanish National Research Council (CSIC), SpainCopyright © 2023 Taboada, Whiting, Wang, Ríos, Davies, Mienis, Kenchington, Cárdenas, Cranston, Koutsouveli, Cristobo, Rapp, Drewery, Baldó, Morrow, Picton, Xavier, Arias, Leiva and Riesgo. This is an open-access article distributed under the terms of the Creative Commons Attribution License (CC BY). The use, distribution or reproduction in other forums is permitted, provided the original author(s) and the copyright owner(s) are credited and that the original publication in this journal is cited, in accordance with accepted academic practice. No use, distribution or reproduction is permitted which does not comply with these terms.
*Correspondence: Sergi Taboada, c2VyZ2lvdGFiQGdtYWlsLmNvbQ==
†Deceased
Disclaimer: All claims expressed in this article are solely those of the authors and do not necessarily represent those of their affiliated organizations, or those of the publisher, the editors and the reviewers. Any product that may be evaluated in this article or claim that may be made by its manufacturer is not guaranteed or endorsed by the publisher.
Research integrity at Frontiers
Learn more about the work of our research integrity team to safeguard the quality of each article we publish.