 Misa Jeon
 José Luis Iriarte3*
 Eun Jin Yang
 Jisoo Park
 Catharina Alves-de-Souza
94% of researchers rate our articles as excellent or good
Learn more about the work of our research integrity team to safeguard the quality of each article we publish.
Find out more
ORIGINAL RESEARCH article
Front. Mar. Sci. , 29 August 2023
Sec. Marine Biology
Volume 10 - 2023 | https://doi.org/10.3389/fmars.2023.1174722
The biogeochemical dynamics of fjords around Antarctica are strongly influenced by cryospheric, climatic, and oceanographic processes that occur on a seasonal scale. Furthermore, as global climate change continues, there is a growing awareness of the impact of ocean warming on glacier melting, which is expected to affect the composition of phytoplankton community structure in West Antarctica’s nearshore marine areas. In this study, we describe the role of hydrographic forcing on the short-term summer variability of the phytoplankton community in Marian Cove, an Antarctic glacial fjord (62°S). Phytoplankton and hydrographic variables were measured at five stations along the Marian Cove during summer 2019 (January–February). The highest concentrations of microphytoplankton biomass were found in the outer area of the fjord, whereas nanophytoplankton biomass displayed continued dominance during most of the summer period in Marian Cove. Hydrographic assessment showed that freshwater inputs from the glacier influenced the surface layer of the fjord, modulating phytoplankton biomass, which was dominated by nanodiatoms (Minidiscus sp., Thalassiosira spp.) and nanophytoflagellates (Cryptomonas spp., Phaeocystis sp.). Concurrent measurement of phytoplankton biomass and environmental conditions during December 2018–January 2019 indicated that a period of weak southeastern winds generated vertical stability, which led to the development of a major peak of microphytoplankton biomass in the outer cove, driven by warm, allochthonous, oceanic, nutrient-rich waters. High carbon biomass dominated by nanodiatoms and nanophytoflagellates was observed in cold, fresh, and low-light subsurface waters of the cove. Our results highlight the effects of a warming ocean, which may favor the summer resurgence of nanodiatom and nanophytoflagellate communities in Antarctic fjords due to increased glacial meltwater inputs.
The Southern Ocean (SO, south of 30°S) plays an important role in regulating climate by absorbing significant amounts of anthropogenic carbon dioxide (CO2, 40%) from the atmosphere (Khatiwala et al., 2013). One of the regions where the effects of rapid warming over the last five decades has been observed is the West Antarctic Peninsula (WAP) with an increase of ~ 0.5°C/decade (Turner et al., 2014). In WAP the interaction between both ocean-atmosphere anomalies have triggered diverse environmental perturbations such as increase in sea surface temperature, mass loss from melting glaciers and increased snowfall (Arrigo et al., 2017), which may have effects on the dynamics of coastal phytoplankton communities.
Assuming global climate change will cause further glacial retreat and freshening of adjacent coastal waters, elucidating the impacts of glacial meltwater processes on phytoplankton dynamics in Antarctic glacier-fjord systems is an important research goal. Seasonal ice-melting events alter the physicochemical and optical properties of the water column, increasing the stratification and turbidity of coastal and oceanic Antarctic waters (Dierssen et al., 2002; Stammerjohn et al., 2008). Under these conditions, suspended material decreases light availability for phytoplankton growth, causing a nonlinear response of primary production (Hopwood et al., 2020) and potential feedback in the inorganic carbon cycle. In addition, melting glacial ice creates low-temperature and low-salinity surface water, generating large vertical and horizontal gradients in density. An increase in glacial meltwater may affect spatial variation in benthic communities (Bae et al., 2021), enhance bacterial production (Min et al., 2022), and cause ecological shifts between planktonic groups (Lange et al., 2014; Garcia et al., 2019). Fjord-glacier systems have diverse characteristics and dynamics, affected by factors including the hydrographic characteristics of the watershed, glacial dynamics, wind-induced mixing, and light penetration, which may be critical to elucidating the response of Antarctic fjords to climate forcing. These features are important to understand how they influence the taxonomic composition of phytoplankton communities inhabiting sea/glacial ice, benthic substrates, and planktonic habitats in shallow marine areas around the West Antarctic Peninsula (WAP). Phytoplankton communities, which include diverse life forms and niches, are key players in producing high carbon biomass and primary production during the spring–summer season, and thus their temporal variability will have significant impact on Antarctic nearshore zones.
Phytoplankton size structure and taxonomic composition are critical community properties that determine the efficiency of the biological pump that exports carbon to the deep ocean (Hewes et al., 2009). Although chain-forming diatoms are the main group contributing to phytoplankton biomass during summer in coastal regions of the Southern Ocean, blooms of haptophytes and cryptophytes have frequently been observed in coastal and oceanic regions in recent years (Costa et al., 2021). Specifically, the classic phytoplanktonic trophic web dominated by large chain-forming diatom blooms has been modified in its taxonomic composition and cell size, with nano- and picophytoplankton groups becoming dominant along the WAP (Moline et al., 2004; Lee et al., 2015; Schofield et al., 2017; Mendes et al., 2018; Mascioni et al., 2019). Recent studies have shown that physical processes around the Antarctic Peninsula are the dominant drivers of the shift in phytoplankton structure (from diatoms to cryptophytes) during summer (Montes-Hugo et al., 2009; Lee et al., 2015; Kim et al., 2018) and that primary production may have decreased significantly (12%) along the WAP (Montes-Hugo et al., 2009). Specifically, major nanoflagellate groups such as cryptophytes, haptophytes and chlorophytes have been found to contribute significantly to total biomass (> 80%) in low-salinity waters (< 34) of marginal ice zones (Kang and Lee, 1995; Moline and Prezelin, 2000) and Antarctic fjords during summer, when glacial meltwater input increases (Kang et al., 1997; Kang et al., 2001). As glacial meltwater inputs continue to alter phytoplankton taxonomic composition in nearshore areas, this shift may have significant implications for carbon flux through the biological carbon pump and for energy transfer to higher trophic levels.
In this study, the main objective was to examine summer phytoplankton community structure and the influence of glacial meltwater on the upper surface layer in Marian Cove. We specifically present the summer hydrography and phytoplankton size biomass and taxonomic composition in the Marian Cove glacial fjord from January to February 2019.
King George Island, Antarctica, is strongly influenced by a massive permanent snowfield and glaciers that cover more than 90% of the island (Simoes et al., 1999; Lee et al., 2008; Rückamp et al., 2011). Marian Cove, with a length of 4.5 km, a width of 1.5 km, and a maximum depth of 110 m, is one of the largest gorges in Maxwell Bay, King George Island (Figure 1). The glacial wall is located at the eastern end of the bay, and has a rapid retreat rate of approximately 1.7 km along the flow line over the past 50 years (Park et al., 1998; Lee et al., 2008; Rückamp et al., 2011). Over recent decades (1956/1957–2020/2021), the glacial retreat rate in Marian Cove has been approximately 27.2 m y–1 (Kim et al., 2022). As a consequence of glacial retreat and increased freshwater influence, the marine environment has become relatively stable in terms of physical and chemical condition, providing favorable habitats for benthic assemblages (Bae et al., 2021). In summer, glacial meltwater from the glacial wall collects on the surface layer, and the wind occasionally introduces floating ice into the bay (Kang et al., 2002; Llanillo et al., 2019). Freshwater discharge also occurs from land and submerged glaciers during summer (Chang et al., 1990).
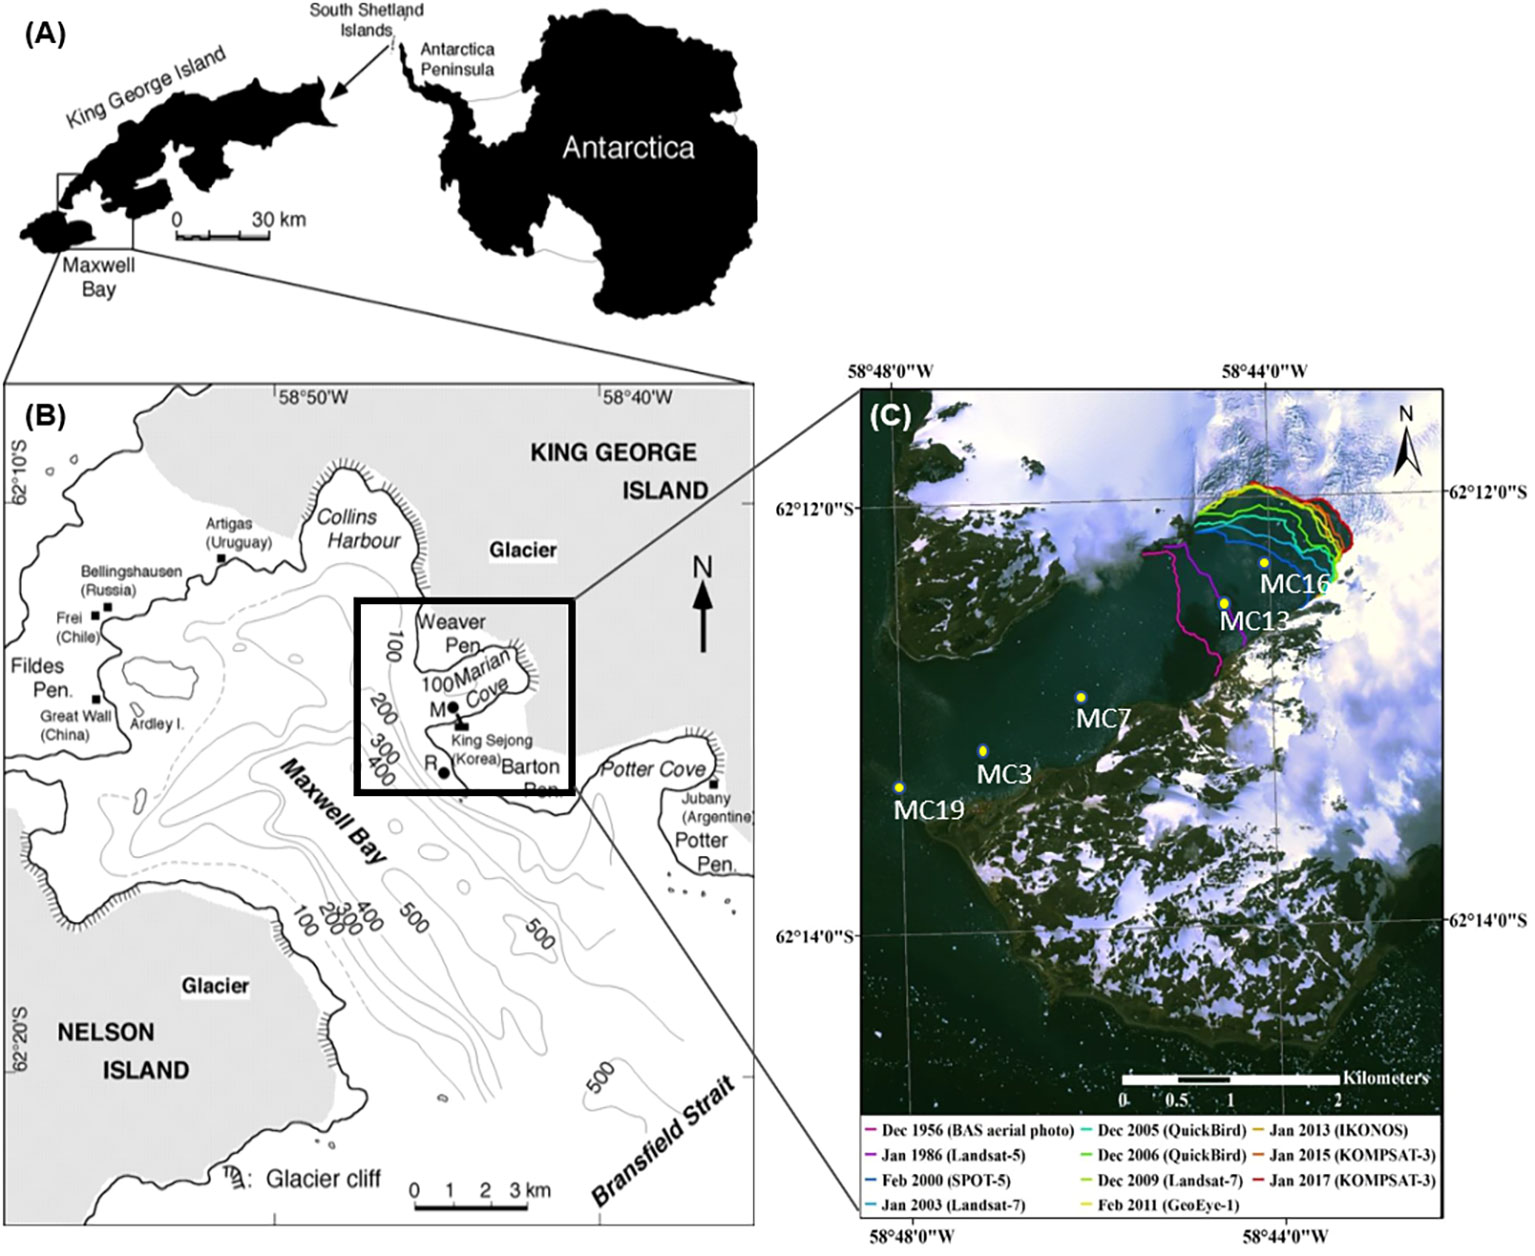
Figure 1 Map of the King George Island in Southern Shetland Islands (A), showing Maxwell Bay, (B) showing Marian Cove, and (C) Marian Cove (Kim et al., 2022).
For this study, samples were collected four times during the summer months of 2019 (January 14, January 31, February 8, and February 25) at five stations along a transect (MC3, MC7, MC13, MC16, MC19) in Marian Cove to elucidate the spatial dynamics of phytoplankton. Station MC 19 is located at the entrance to the cove (outer), adjacent to Maxwell Bay, and station MC 16 is located near the tidewater glacier (inner). The water temperature and salinity throughout the water column at each station were measured using a conductivity-temperature-depth (CTD) profiler (SBE 10 plus). The meteorological data (wind) used in this study were obtained from the automatic weather system (AMOS-3) at King Sejong Station. The anemoscope, thermometer, and rain gauge were located 10, 2, and 1.5 m above the ground, respectively (Park et al., 2013).
All water samples were collected using a rosette sampler equipped with 5-L Niskin bottles. Samples for inorganic nutrient analysis were stored in polyethylene bottles after filtration through GF/F filters (0.7 µm pore size, 47 mm diameter, glass fiber, Whatman) and frozen at –65°C until analysis. Orthophoshate (PO4), Nitrate (NO3), and Silicic acid (SiO2) were analyzed in two replicates using an automated nutritional analyzer (QuAAtro, SEAL Analytical, Southampton, United Kingdom) following Parsons et al. (1984). The transparency of the water column at each sampling site and time was determined using a Secchi disk, and the euphotic layer depth and extinction coefficient were estimated from Secchi disk measurements (Kim et al., 2021).
In the study area, seawater was filtered using GF/F filters (0.7 µm pore size, 47 mm diameter, glass fiber, Whatman) to analyze the concentration of chlorophyll-a (Chl-a). The sample was passed through a 20-µm pore-size filter (Nucleopore), a 2-µm pore-size filter (Nucleopore), and a GF/F filter (0.7 µm) to analyze size-fractionated Chl-a concentrations. Additionally, we analyzed Chl-a concentration at the monitoring station in Marian Cove from December 2018 to February 2019 (Jeon et al., 2021). Filters were analyzed using a fluorometer (Trilogy) after the addition of 90% acetone and extraction for 12 h at 4°C in a dark room.
Slides were prepared to analyze phytoplankton communities according to the N-(2-hydroxypropyl) methacrylamide (HPMA) method (Crumpto, 1987; Kang et al., 1993; Kang et al., 2002). At least 10 fields or at least 300 cells were counted using and optical microscope equipped with epifluorescence (Zeiss Axiophot). Micro phytoplankton were counted at 200× and 400×, and nano- and pico-phytoplankton were counted at 1000×. Samples were collected and processed according to the method of Simonsen (1974) with the modification described by Hasle and Fryxell (1970). Diatoms were identified at the species or genus level, while flagellates around 20 µm in size were classified into the taxonomic groups Haptophyceae, Prasinophyceae, and Cryptophyceae.
The carbon biomass of phytoplankton was estimated by measuring cell dimensions for each taxon (at least 20 cells per taxon) using an optical microscope (Axiophot, Zeiss). The mean cell biovolume was calculated using appropriate geometric shapes. The carbon biomass of algae was estimated from cell volume using the modified Strathmann equation (equations 7 and 8 in Smayda, 1978): for diatoms, log10 C = 0.76 (log10 cell volume)–0.352; and for autotrophic nanoflagellates and dinoflagellates, log10 C = 0.94 (log10 cell volume)–0.60. The following conversion factor was used for the picophytoplankton group to transform the cell volume into carbon biomass: 220 fg C μm–3 (Borsheim and Bratbak, 1987).
Principal Component analysis (PCA) was used to identify environmental gradients of temperature, salinity, NO3, PO4, SiO2, total Chl-a, and the three Chl-a fractions (i.e., pico-, nano-, and microphytoplankton) (N = 60). All variables were centered and scaled through subtraction of the mean and division by the standard deviation prior to analysis, and PCA was performed using the rda function in the ‘vegan’ package (Oksanen et al., 2007) for R Software (https://cran.r-project.org/). Differences in these variables between the two areas (inner glacial and outer glacial) and three depths of the water column (surface, middle, bottom) were assessed using the Kruskal-Wallis test based on log-transformed data using the kruskal.test function in the ‘stats’ package of R followed by the post hoc Dunn test conducted using the dunnTest function in the ‘FSA’ package (Ogle et al., 2017).
A preliminary Detrended Correspondence Analysis (DCA) was performed using CANOCO 5.0 software (N = 59), based on the abundance of the main phytoplankton species (i.e., the ones occurring in at least 30% of the samples), previously transformed to improve normality [log (x + 1)]. This analysis resulted in a gradient length of 1.4 standard deviations (SD), indicating that a linear method is more appropriate for the analysis of this dataset (ter Braak and Šmilauer, 2012). Thus, a Redundancy Analysis (RDA) was performed to assess the relevance of the environmental variables (i.e., temperature, salinity, NO3, PO4, and SiO2) to the spatio-temporal distribution of the main phytoplankton species using CANOCO 5.0 software (N = 59). Chl-a data was not included as it is a phytoplankton feature and therefore should be considered as a response variable. Monte Carlo permutation testing (999 permutations; CANOCO 5.0) was used to determine the significance of the variables and the first two ordination axes. Interactive forward selection was used to assess the individual contribution of the different environmental species for the ordination of the species based on Monte Carlo permutation testing (999 permutations; CANOCO 5.0).
The hydrography of Marian Cove is modulated mainly by the summer input of freshwater as glacial meltwater, which occurs at the head of the fjord (Sta. 13, 16), leading to relatively low salinities at the surface on the sampling dates (Figure 2). The contribution of freshwater from meltwater discharge is found near the surface from the head to the mouth of the fjord, and had a stronger influence on January 31 and February 8 than earlier dates. We divided the fjord area into two main zones: inner (Sta. 13, 16) and outer (Sta. 19, 3, 7), based on the effects of glacial melting on haline conditions (Figure 2). In the inner zone, the 0–15 m surface layer showed relatively low salinity, between 33.5 and 34.1, compared to the outer stations, where it ranged from 34.0 to 34.2. On January 31 and February 8, a plume of salinity below 34.1 was evident along the fjord within the top 20 m. The influence of oceanic water (from Maxwell Bay) was evident in the range of temperatures observed in the upper 60 m in the middle and outer portions of the fjord (median = 1–1.3°C; Sta 19, 3, 7) compared to inner stations (median = 0.4–0.9°C; Sta. 13, 16). With the exception of January 14, no water temperatures > 1.0°C were registered along the system. The water column showed strong temperature variation along the system on all sampling dates, with a decrease of 0.5–0.75°C from the surface to the deep layer (Figure 2). Stratification was much shallower at stations 13–16 and nearly disappeared in the outer section, coincident with a more significant influence of oceanic water (salinity > 34.1) and lower influence of freshwater.
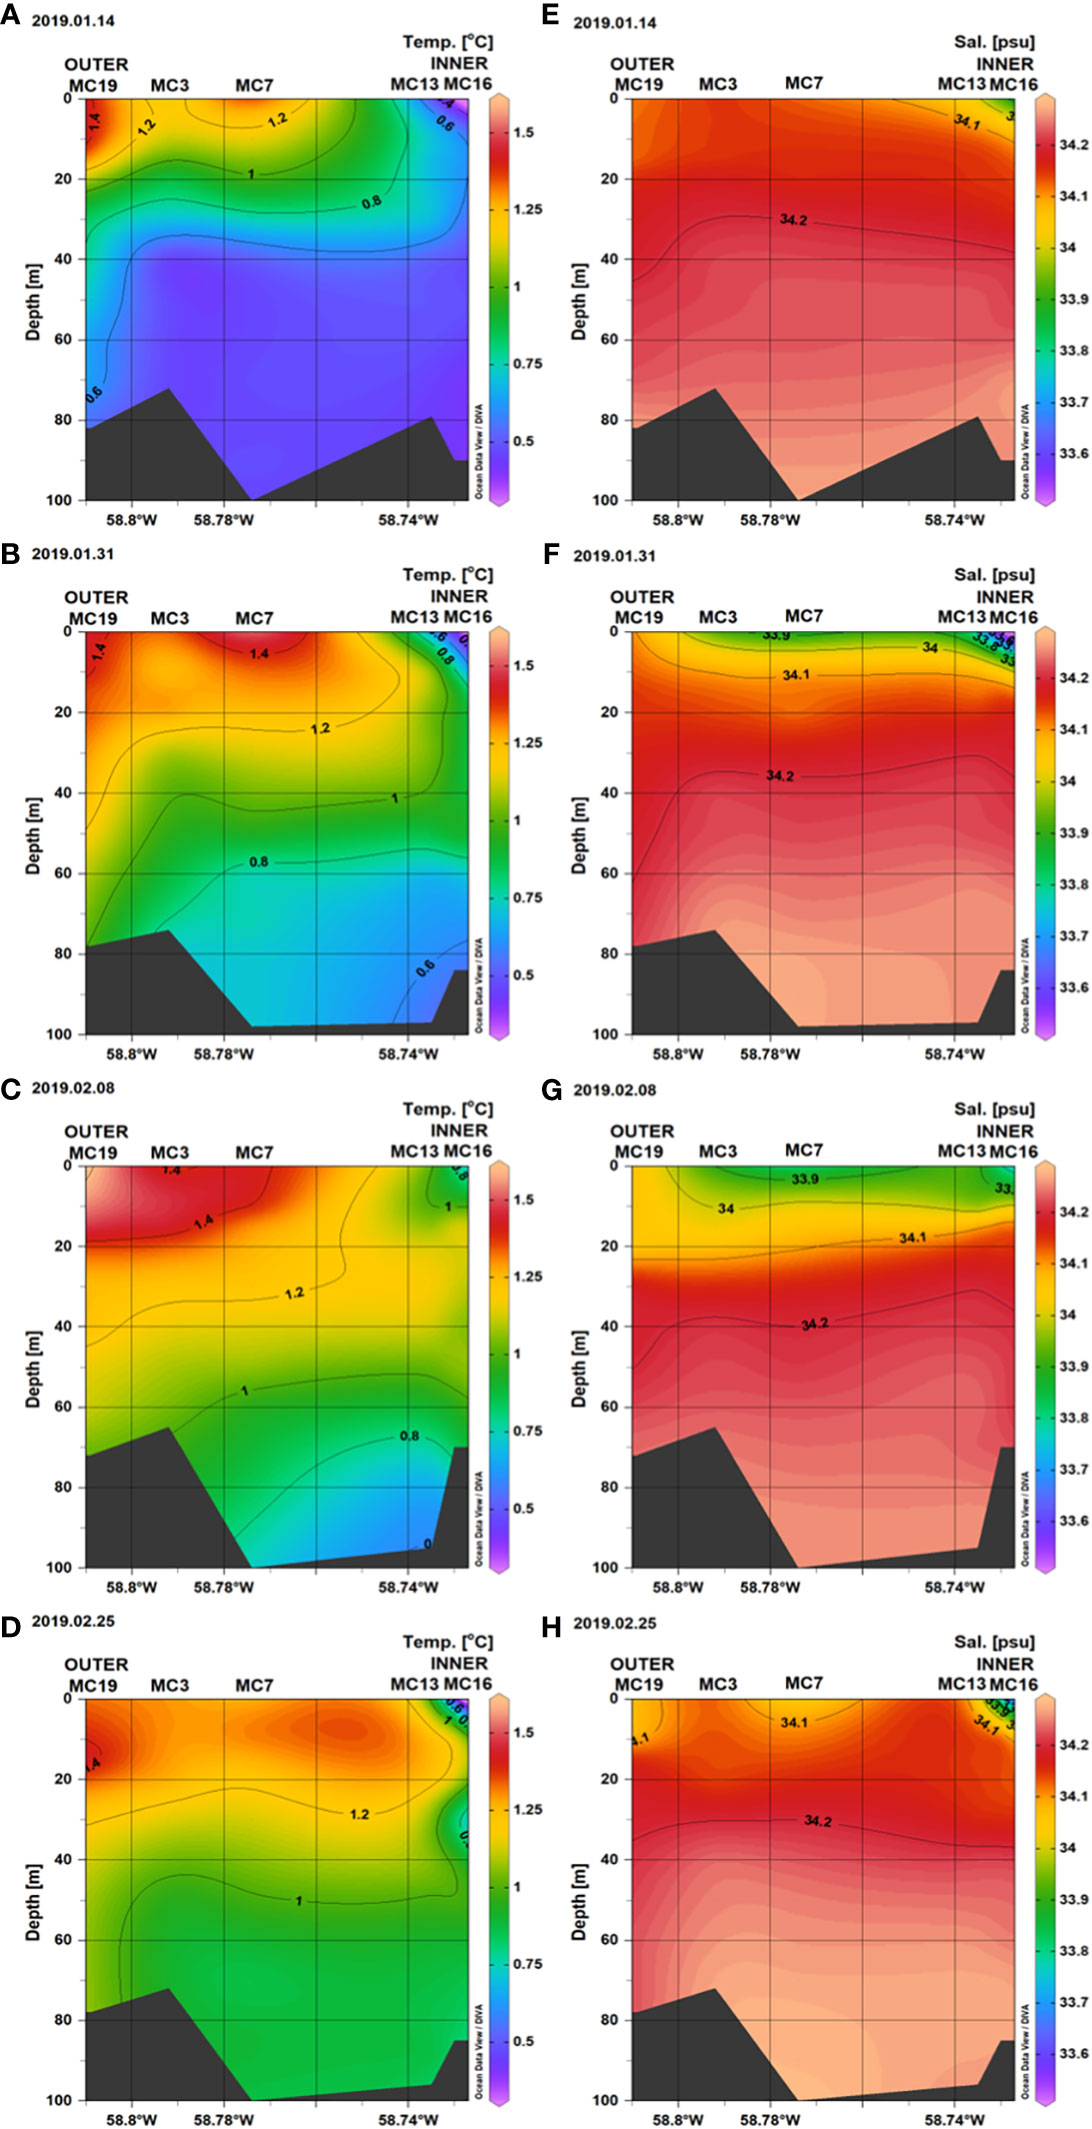
Figure 2 Vertical distribution of water column Temperature (A–D) and Salinity (E–H), along the Marian Cove transect during summer 2019.
Inorganic nutrient concentrations (ie., PO4, NO3, and SiO2), had clear spatial variability from the inner to the outer portions of Marian Cove (Figure 3). During the study period, the water column mean concentration of nitrate (NO3) was 22.3 (SD = ± 1.3 μM) in the inner stations (Sta. 13, 16) and 20.3 (SD = ± 0.5 μM) in the outer stations (Sta. 19, 3, 7). Surface Nitrate had high concentrations (> 20 μM) all along the system, with higher concentrations at the inner stations than outer stations, and a major drawdown on January 14 at the inner area (median = 14 μM). Silicic acid (SiO2) concentrations ranged from 72.2 (SD = ± 2.8 μM) in the inner stations (Sta. 13, 16) to 68.1 (SD = ± 8.9 μM) in the outer stations (Sta. 19, 3, 7). During the study period, SiO2 concentrations were greater than 65 μM throughout the water column. On February 8, SiO2 decreased to 37 μM, and this reduction was greatest in the outer section (Sta. 19, 3) of the fjord (Figure 4). Low spatial variability was observed along the system in Orthophospahte (PO4) concentration ranged from 1.8 μM (SD = ± 0.2 μM) in the inner stations (Sta. 13, 16) to 1.6 μM (SD = ± 0.5 μM) in the outer stations (Sta. 19, 3, 7). PO4 concentrations were more homogeneously distributed throughout the water column and ranged from 1 to 2 μM, with relatively high concentrations in the inner section (Figure 4). The PCA identified two major components that together explained 63.5% of the total variability and depicted a gradient between the inner and outer areas (Figure 5), indicating that total Chl-a was positively correlated with temperature and negatively correlated with nutrients. The first component (PC1) was negatively correlated with nutrients and positively correlated with water temperature and Chl-a (total, nano- and microphytoplankton). The second component (PC2) was negatively correlated with salinity. Pairwise comparisons showed some spatial differences in the environmental variables of temperature and salinity, as well as Chl-a (Kruskal-Wallis test; p < 0.05). Outer stations showed slightly higher temperatures than inner stations in the upper 15 m (post hoc Dunn test; p < 0.05). Inner stations were characterized by significantly lower levels of surface salinity compared to both outer stations and deep waters (post hoc Dunn test; p < 0.05). The spatial variability of temperature was consistent with the gradient of Chl-a observed at outer stations and associated with relatively high surface salinities (> 34.1).
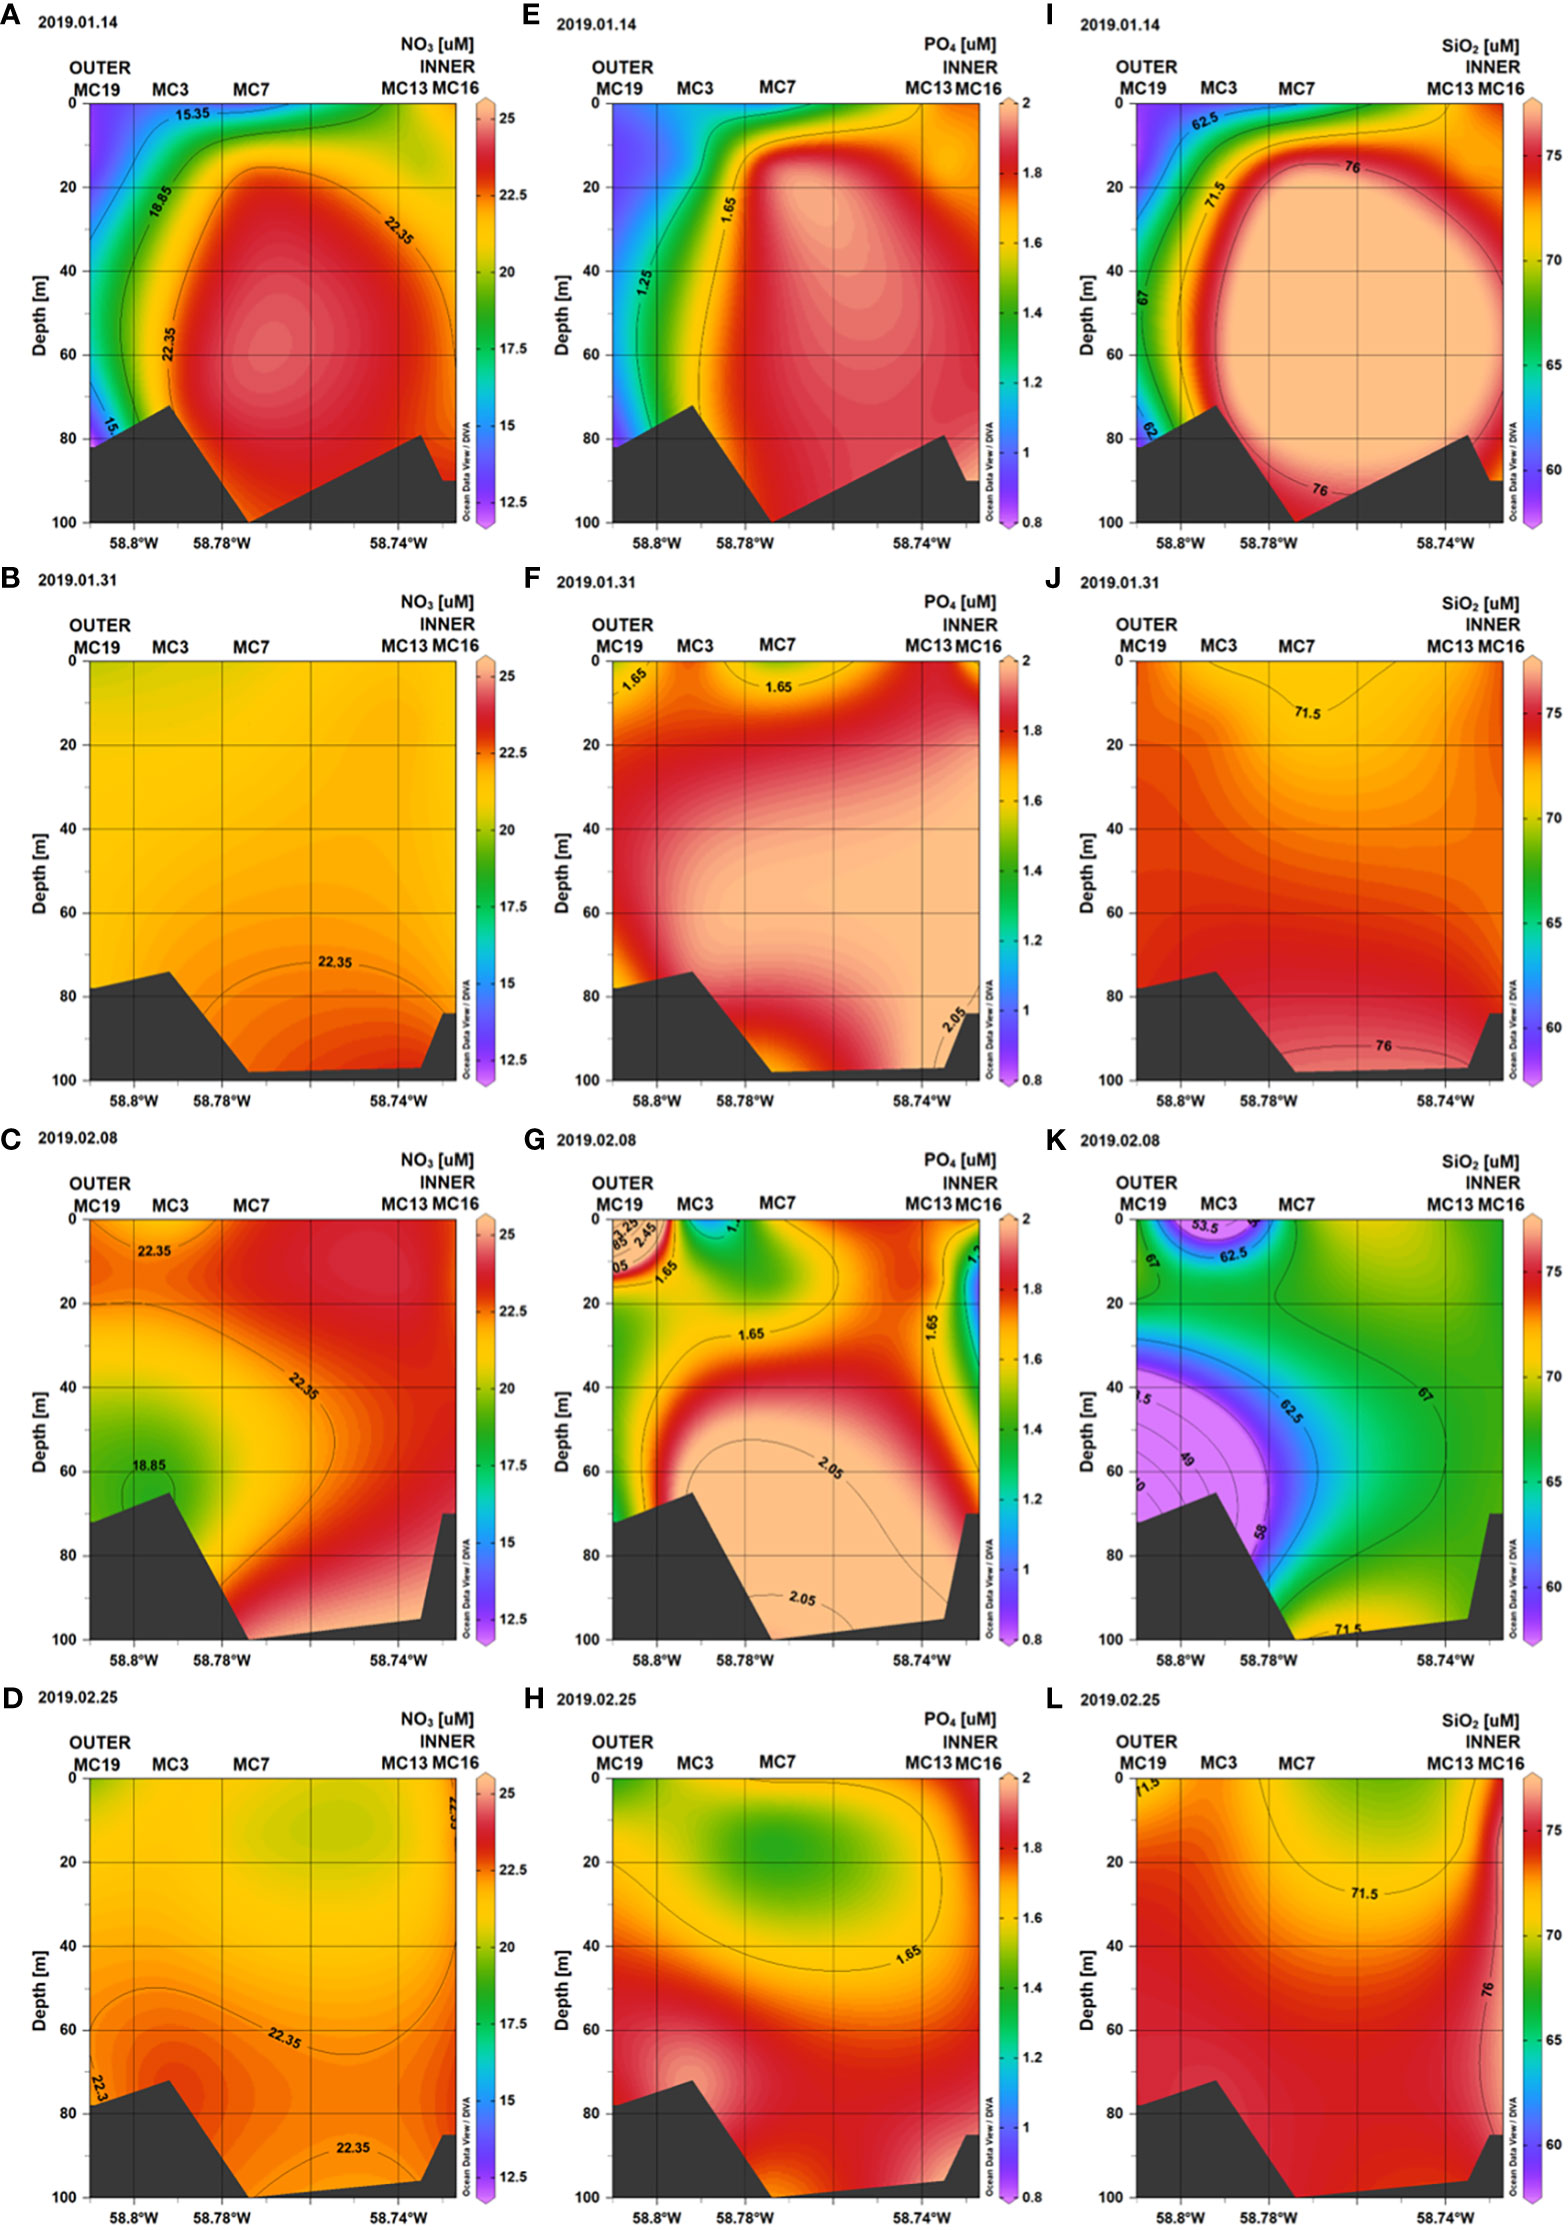
Figure 3 Vertical distribution of Nitrate (A–D), Orthophosphate (E–H), and Silicic acid (I–L), along the Marian Cove transect during summer 2019.
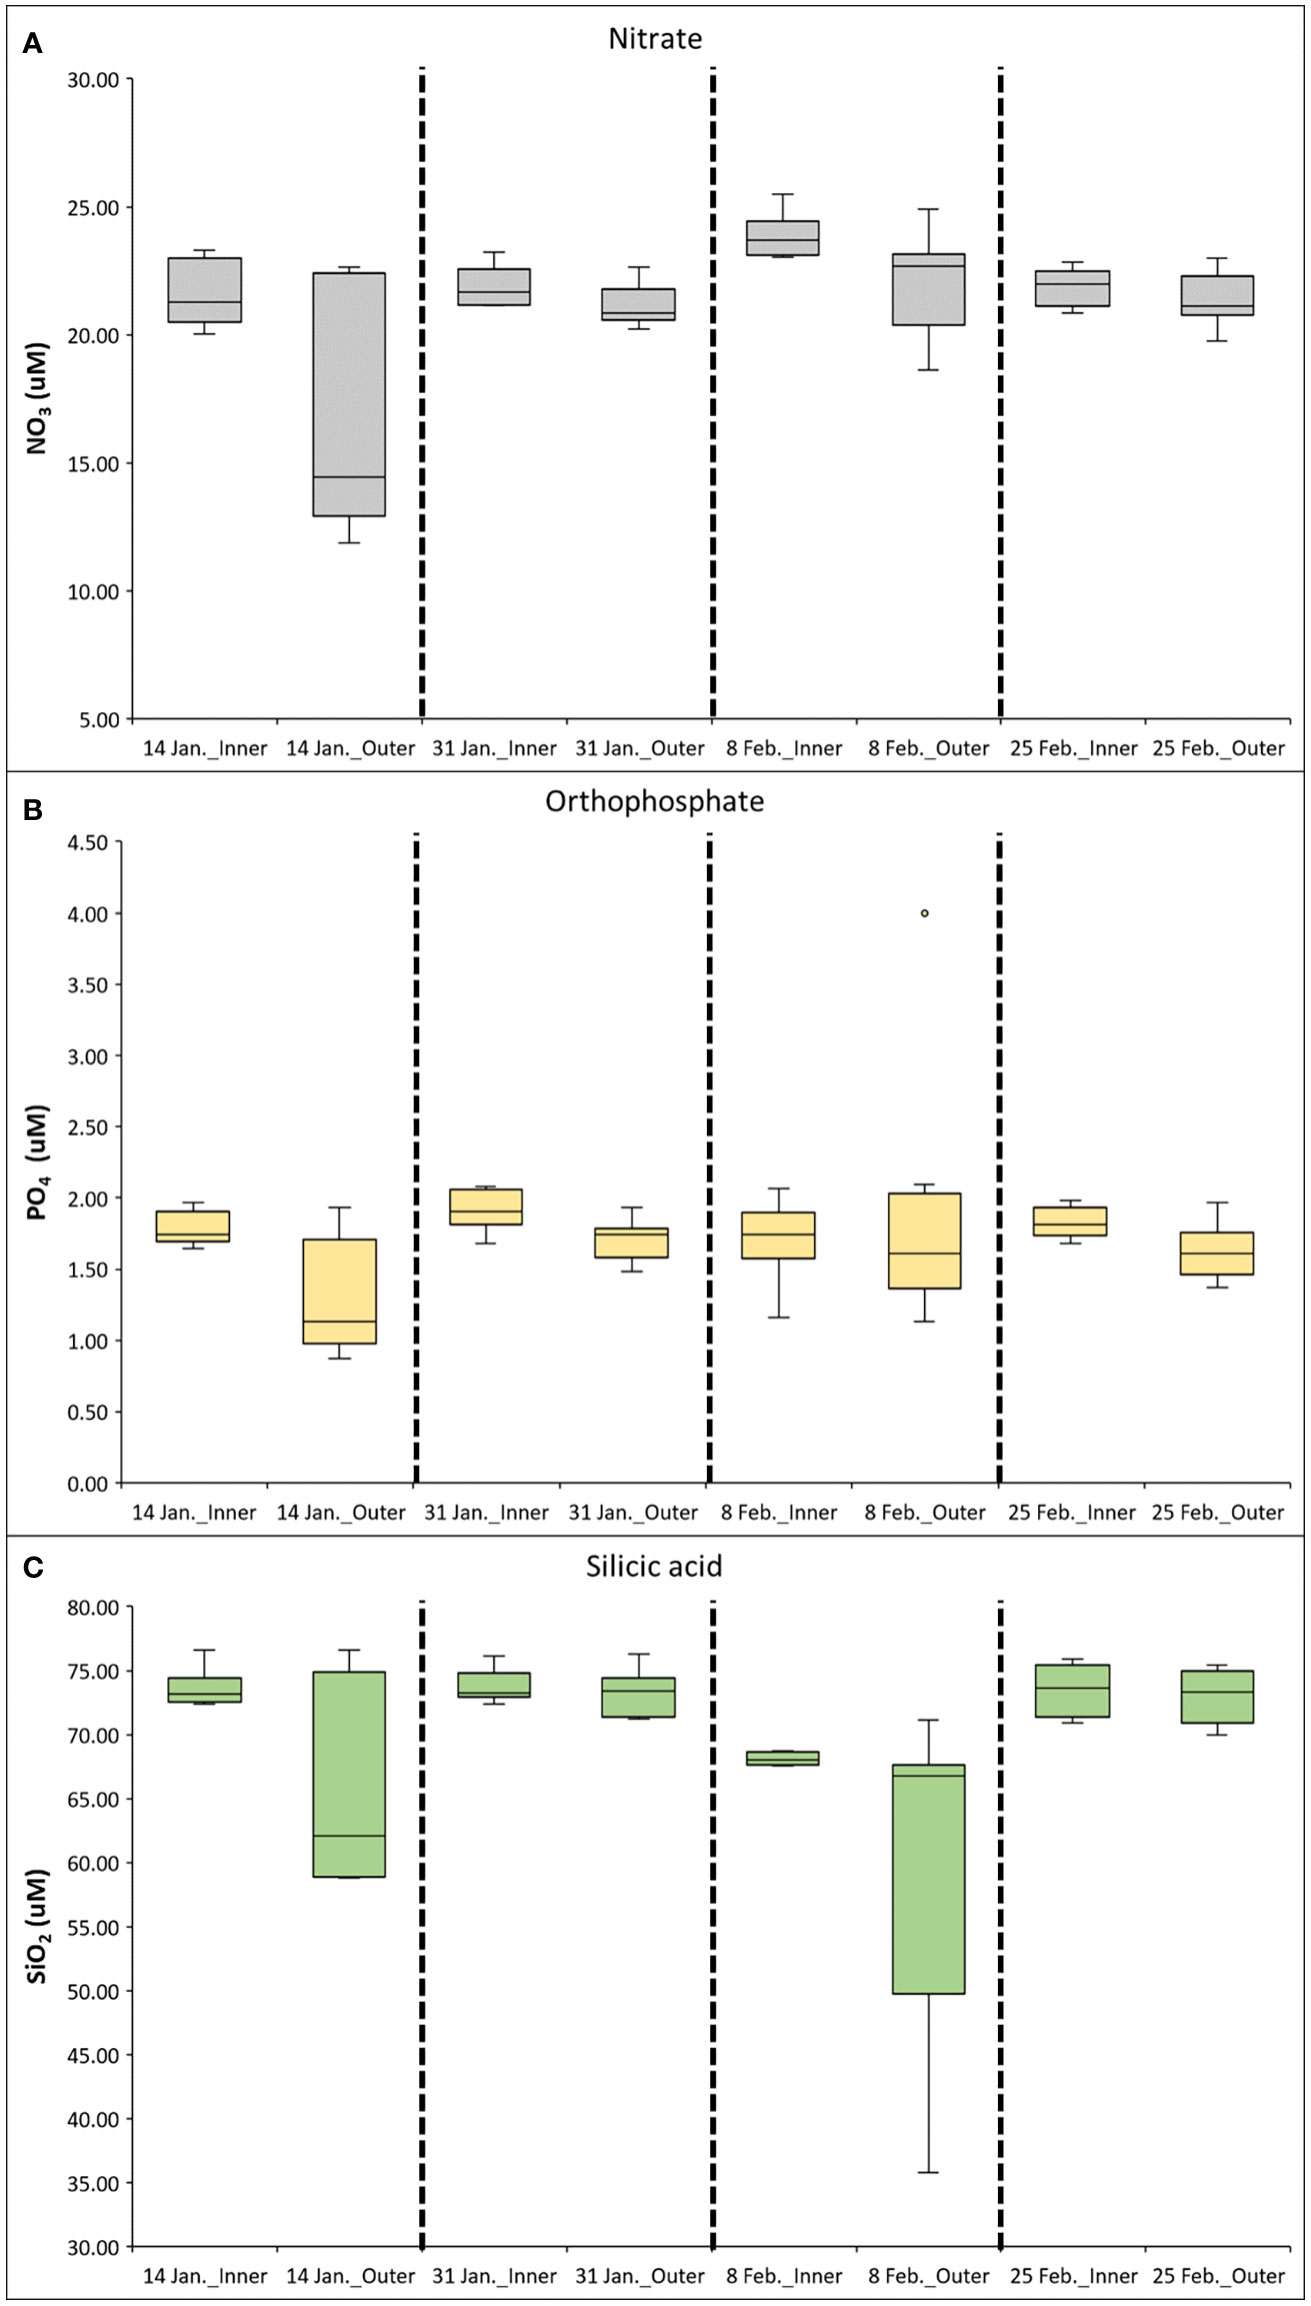
Figure 4 Median concentrations of nitrate (A), orthophosphate (B), and silicic acid (C) along the Marian Cove during summer 2019. Box-plots show the 25th–75th quartiles of the data at each section; the lines show the maximum and minimum values; the red cross shows outlier values.
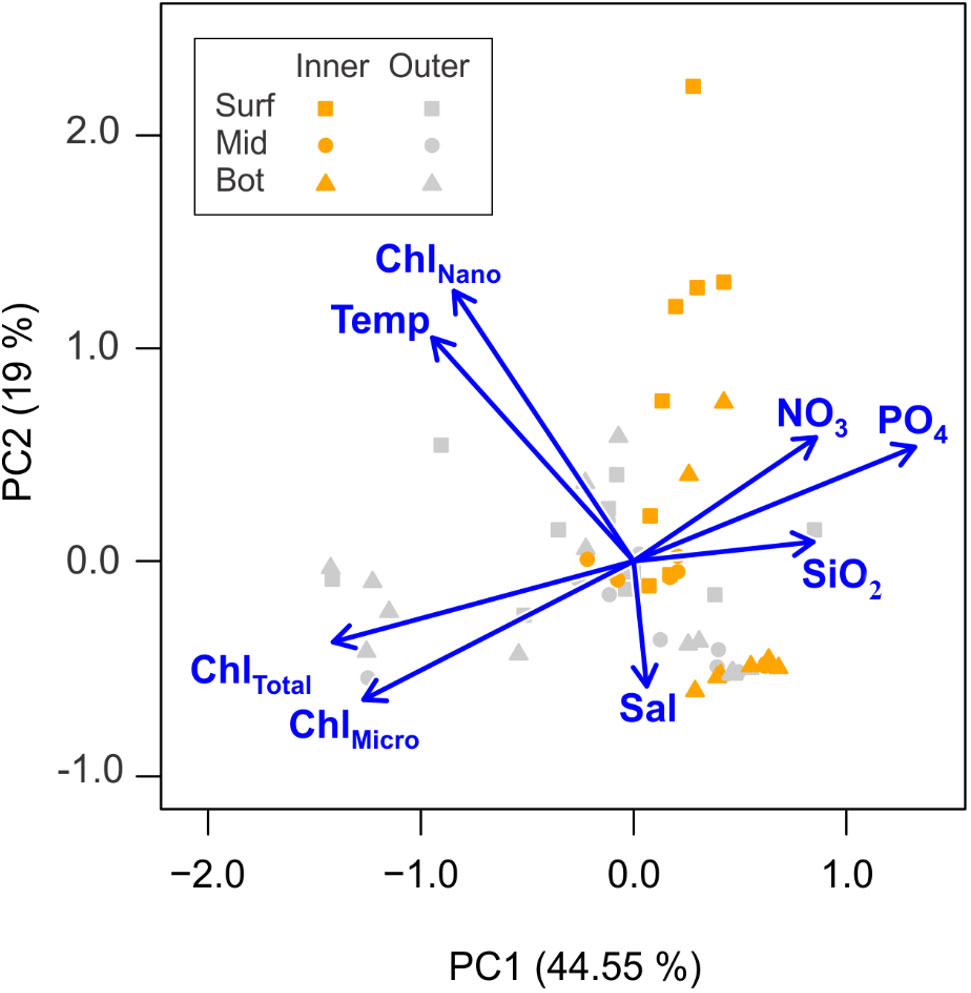
Figure 5 Principal Component Analysis (PCA) plot showing the distribution of the samples in the multivariate ordination space. Vectors indicate the direction and contribution of the different descriptors to the first two PCA axes: Chlorophyll-a Total (ChlTotal; μg L-1), Chlorophyll-a Nano (ChlNano; μg L-1), Chlorophyll-a Micro (ChlMicro; μg L-1), sea surface temperature (Temp; °C), salinity (Sal), nitrate (NO3), silicic acid (SiO2), and orthophosphate (PO4). All data were previously centered and scaled by subtracting the mean and dividing by the standard deviation. Colors of symbols indicate groups of sampling stations: Inner and Outer; and depths: Surface (surf = triangle), Middle (mid = square), Bottom (bot = circle).
Euphotic zone depth decreased from January 14 to February 25 at both inner and outer stations in Marian Cove (Table 1). Extinction coefficients throughout the water column were higher at inner stations (Kd′ = 0.4–1.7 m–1) than at outer stations (Kd′= 0.2–0.4 m-1), and this pattern was related to high turbidity in surface waters near the glacier (Kim et al., 2021). Meteorological data for the period of December 2018 to February 2019 (Figure 6) showed dominant winds from the west with velocities from 6 to 12 m s–1 during most of December 2018, which decreased (2–6 m s–1) and changed direction to the southeast in January 2019.
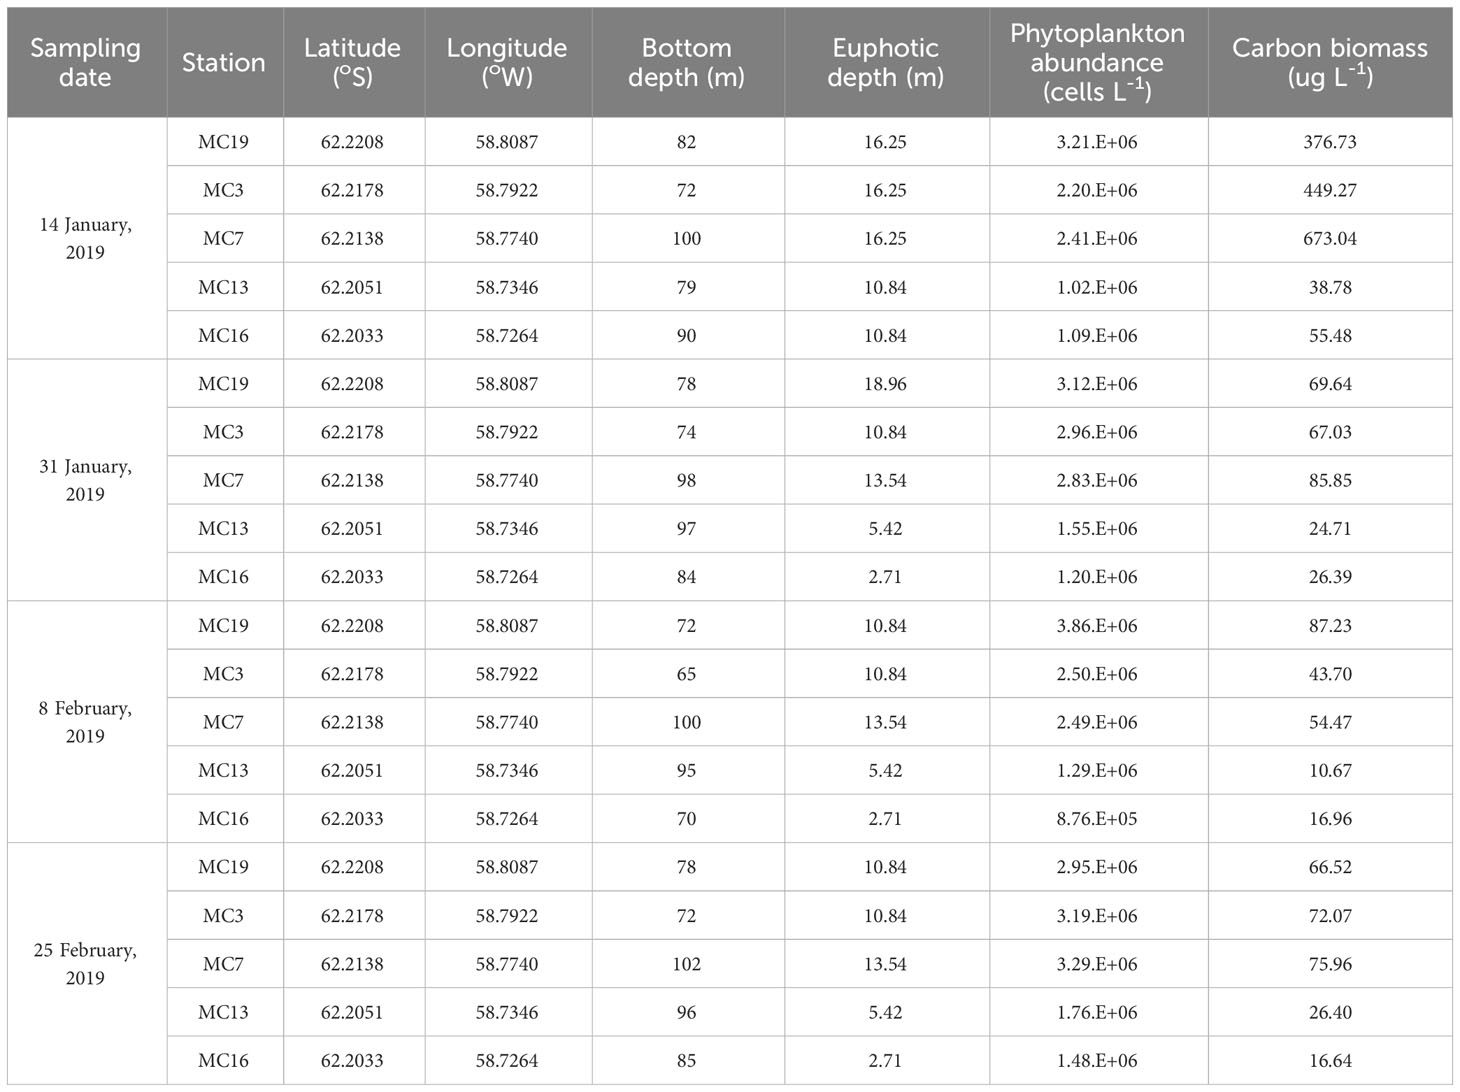
Table 1 Physical parameters (bottom depth, Euphotic depth) and total phytoplankton abundance and cell carbon biomass at inner and outer stations through the water column (surface, 15 m, bottom) at Marian Cove during summer 2019.
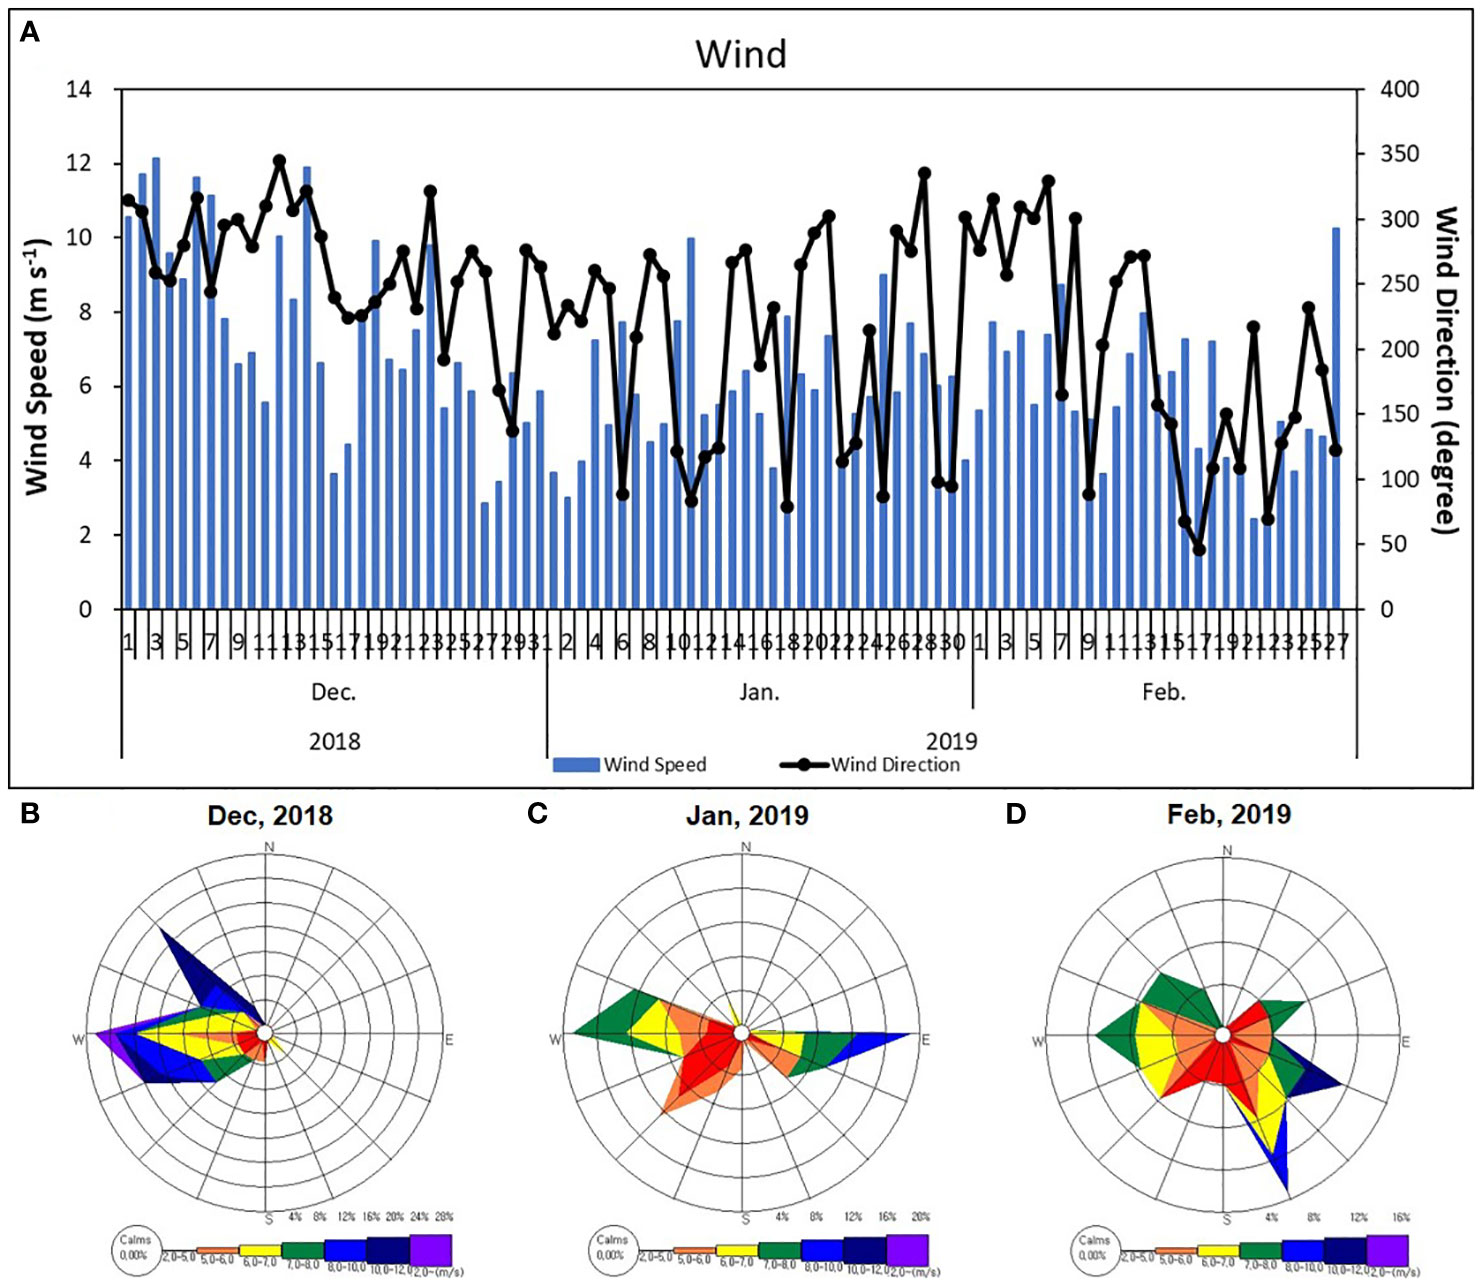
Figure 6 Temporal distribution of wind velocity and direction (A) and wind rose scheme (B–D) at meteorological the King Sejong station in Marian Cove, during December 2018 to February 2019.
From December 2018 to February 2019, the main peak of Chl-a at monitoring station in the Marian Cove was observed during the first weeks of January (Figure 7), with Chl-a concentrations remaining low and constant over the rest of the period. High surface Chl-a was observed on January 14 in the outer section of the fjord, with values up to 5 mg m–3, whereas Chl-a concentrations around 1.0 mg m–3 (mean = 0.5 mg m–3) were found in the inner section (Figure 8). The high Chl-a was associated with relatively low inorganic nutrient concentration at the outer stations (PO4: 1.0 μM; NO3: 15 μM; SiO2: 60 μM). During the main Chl-a peak in January, the mean contribution of microphytoplankton to total Chl-a was 82%, whereas the nanophytoplankton (including the picophytoplankton fraction) contributed from 35 to 85% during the rest of the summer. The nanophytoplankton was the main size fraction contributing 45% (± 22.9%) of the total Chl-a during the complete sampling period (Figure 7).
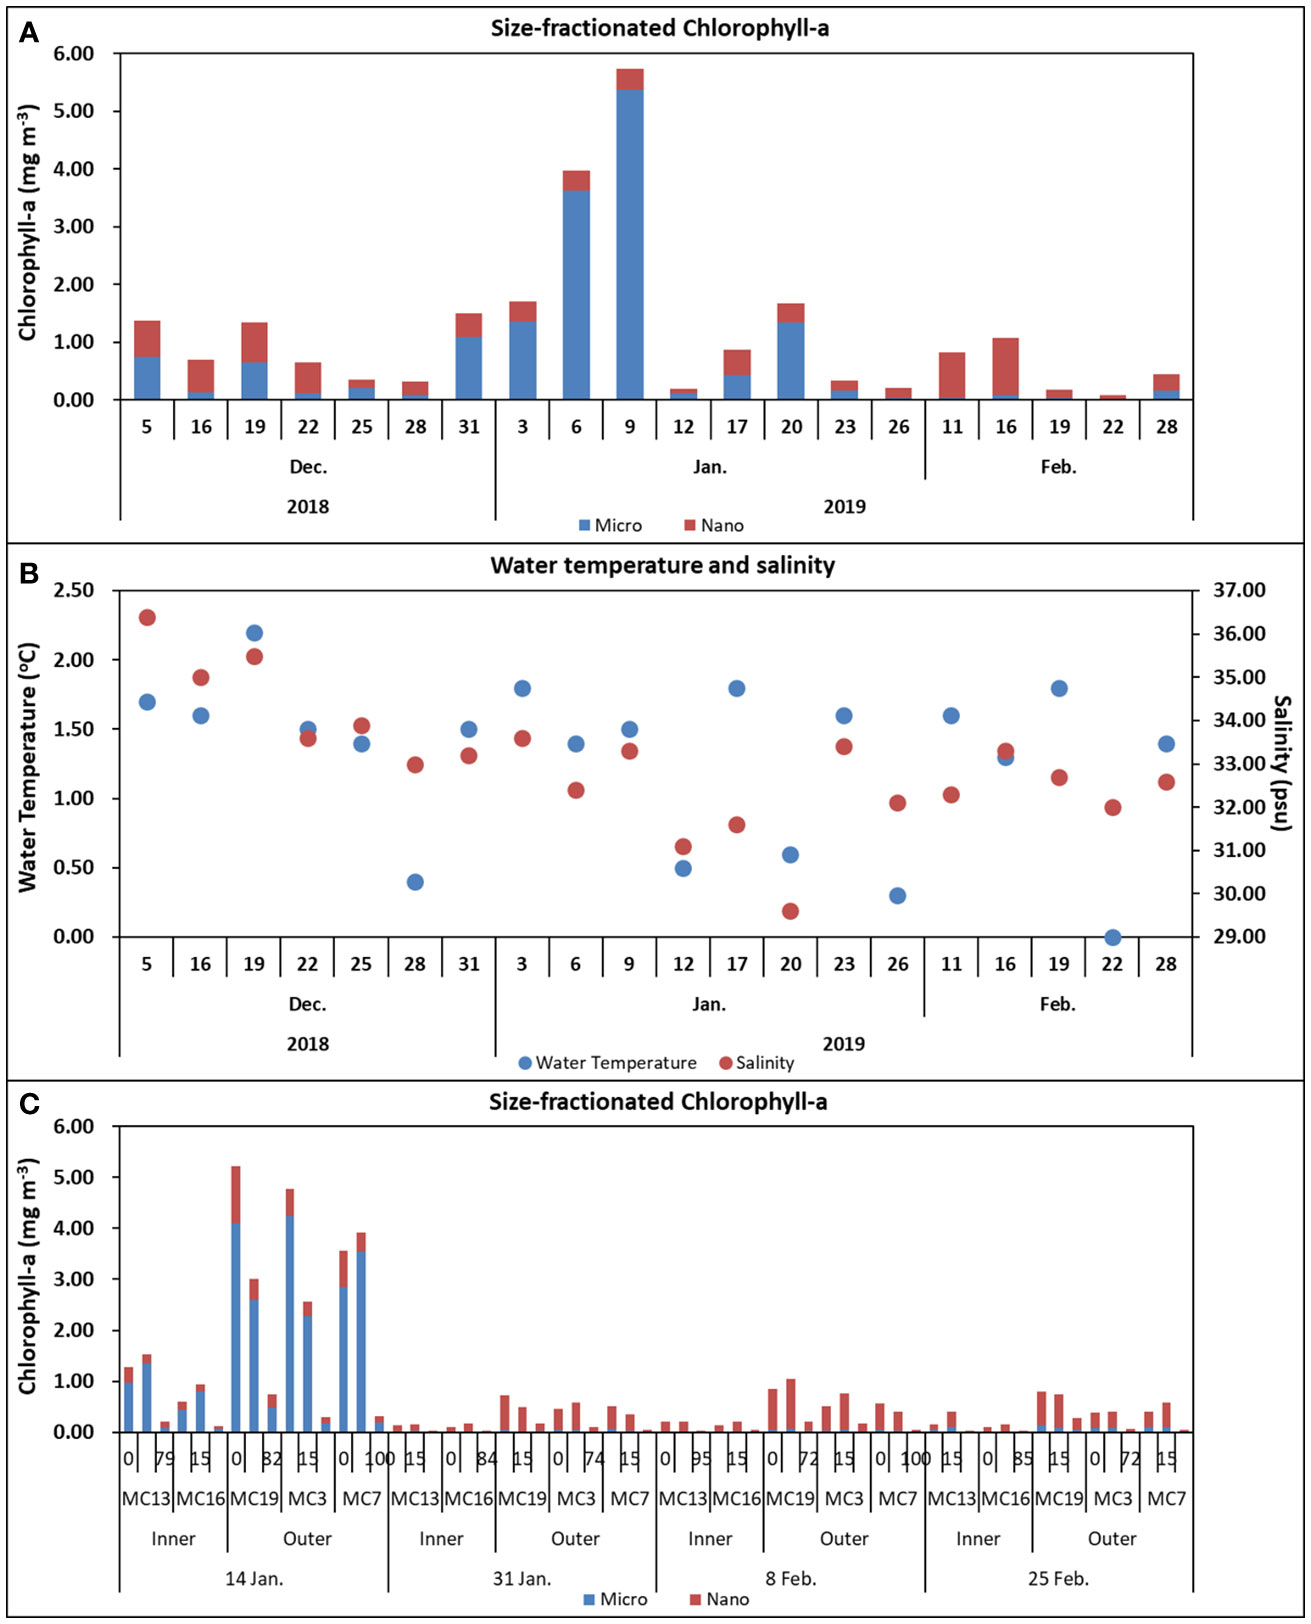
Figure 7 Temporal distribution of size-fractionated Chlorophyll-a (surface) at the King Sejong monitoring station from December 2018 to February 2019 (A), Water temperature and salinity (surface) at the King Sejong monitoring station from December 2018 to February 2019 (B), and size-fractionated Chlorophyll-a at three different depths at the inner and outer stations along the Marian Cove transect during summer 2019 (C). The contribution of microphytoplankton (blue bars) and nanophytoplankton (red bars) to total Chlorophyll-a during summer along the Marian Cove.
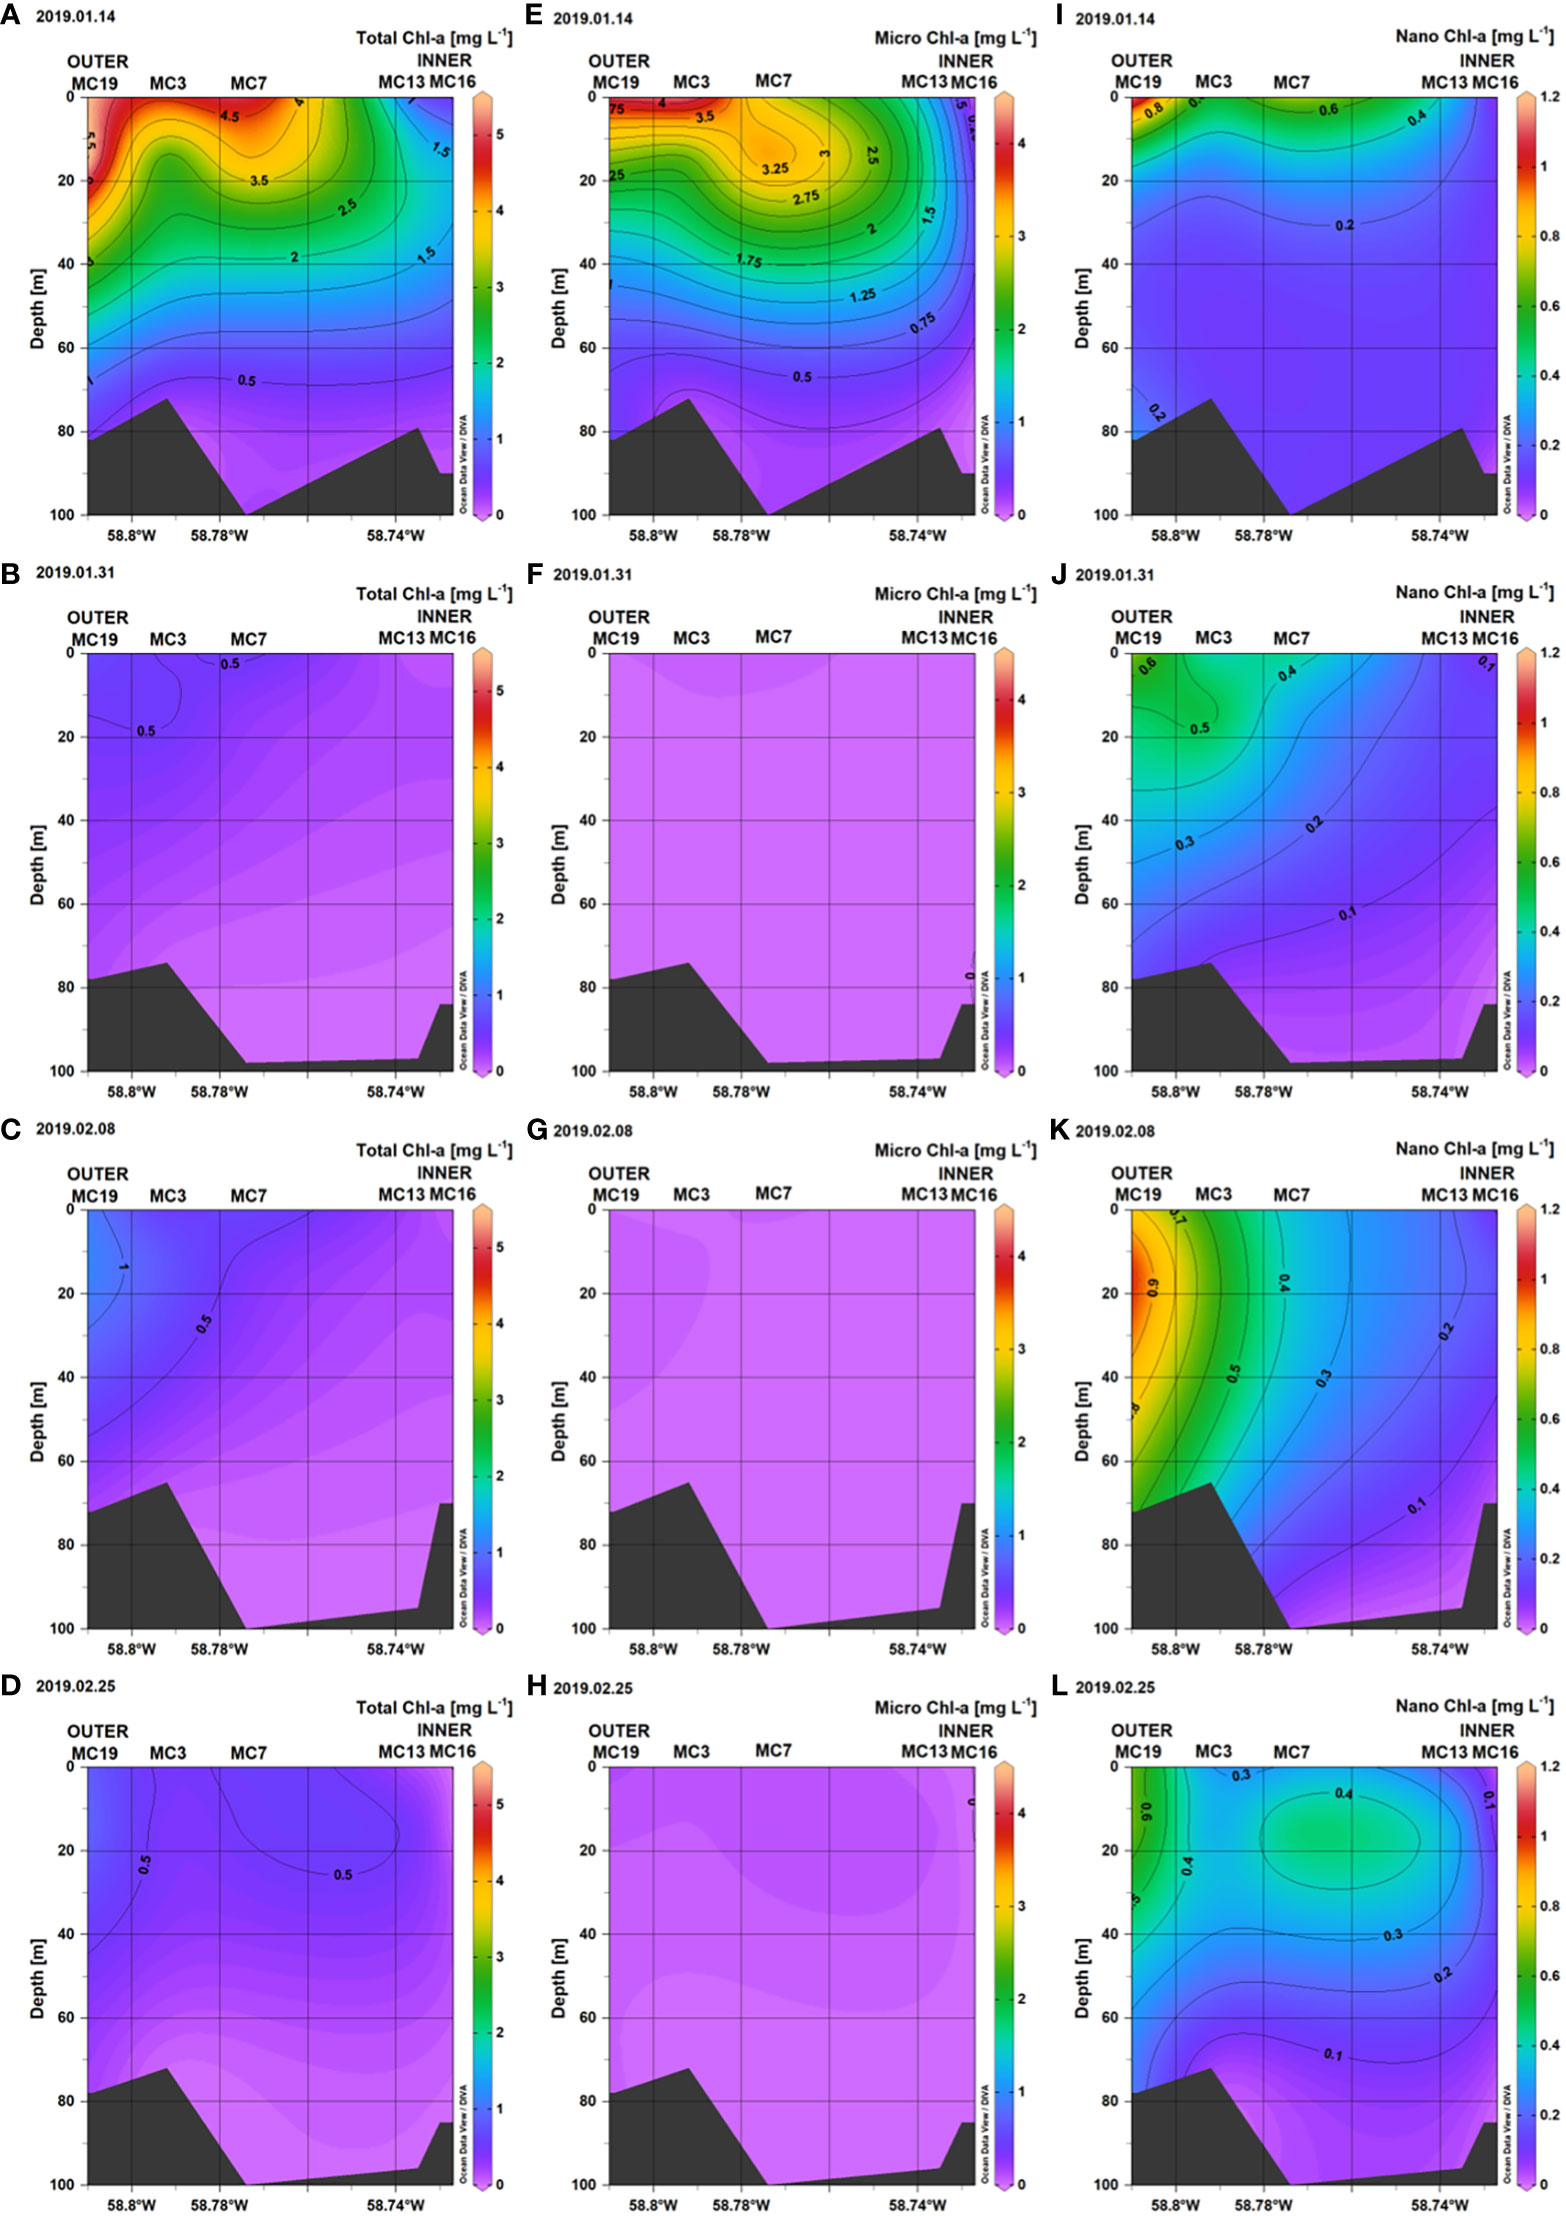
Figure 8 Vertical distribution of Total Chl-a (A–D), Microphytoplankton Chl-a (E–H), and Nanophytoplankton Chl-a (I–L), along the Marian Cove transect during summer 2019.
Overall, 71 phytoplankton taxa were identified in this study, among which 65 (91%) were diatoms. Subsurface water at the outer stations of Marian Cove showed higher diatom carbon biomass than inner stations. The main taxa contributing to the total carbon biomass were Thalassiosira spp., Pseudo-nitzschia lineola, Pseudo-nitzschia heimii, and Minidiscus sp. Large-celled diatoms were frequently observed at all stations and were dominated by Corethron inerme, Corethron pennatum, and Plagiotropis gaussi. While assessing the complete seasonal variability of phytoplankton assemblages is important, particularly in coastal areas, most of these species were observed in the second stage (January–February) of spring–summer phytoplankton succession in Marian Cove (Kang et al., 2002). The nanoflagellate taxa Phaeocystis sp. and Cryptomonas spp., as well as dinoflagellates such as Gymnodinium spp., were also major contributors to total carbon biomass during the study period. All taxa observed during summer had actively growing populations that could successfully inhabit areas with high nutrient concentrations and low levels of near-surface light.
Nanodiatoms and nanophytoflagellates (chlorophytes, cryptophytes, haptophytes) were ubiquitous, and the most abundant (105–106 cells L–1) nanophytoplankton groups made large contributions to the total abundance on all sampling dates. The most abundant group during the study period was picophytoplankton (52.8%, SD = ± 19.2%), followed by nanophytoflagellates (24.8%, SD = ± 18.1%), nanodiatoms (20%, SD = ± 12.6%), and microdiatoms (1.9%, SD = ± 1.8%). The highest abundance (105 cells L–1) and cell carbon biomass of microdiatoms (299–630 µg C L–1) were observed on January 14 at the outer stations (sta. 19, 3, 7), whereas high carbon biomasses of nanophytoflagellates (12–56 µg C L–1) and nanodiatoms (21–147 µg C L–1) were observed during the rest of the summer period (Figure 9). During summer months (January–February), phytoplankton cell abundances varied from 5.5 × 10⁵ cells L-1 to 5.6 × 10⁶ cells L-1, whereas carbon biomass ranged from 42 to 609 ug C L-1, of similar magnitude to previous studies (Lee et al., 2015; Jeon et al., 2021). During the main phytoplankton bloom (January 14), the centric chain-forming diatom Thalassiosira spp. (> 20 µm) and pennate diatoms Pseudo-nitzschia lineola, Pseudo-nitzschia heimii, Pseudogomphonema sp., Pseudo-nitzschia prolongatoides, Actinocyclus divisus and Fragilariopsis spp. (20–40 µm) dominated the upper 15 m layer, while nanodiatoms such as Minidiscus sp. (5–10 µm), Thalassiosira spp. (10–20 µm), Fragilariopsis spp. (< 10 µm) and Fragilariopsis cylindrus were the dominant taxa in the subsurface (15 m) at both outer and inner stations (Table 2; Figure 10). During the subsequent sampling periods, Cocconeis costata, Licmophora gracilis, Synedropsis fragilis, Fragilariopsis rhombica, Gyrosigma fasciola, and Navicula glaciei were also important components of the phytoplankton community.
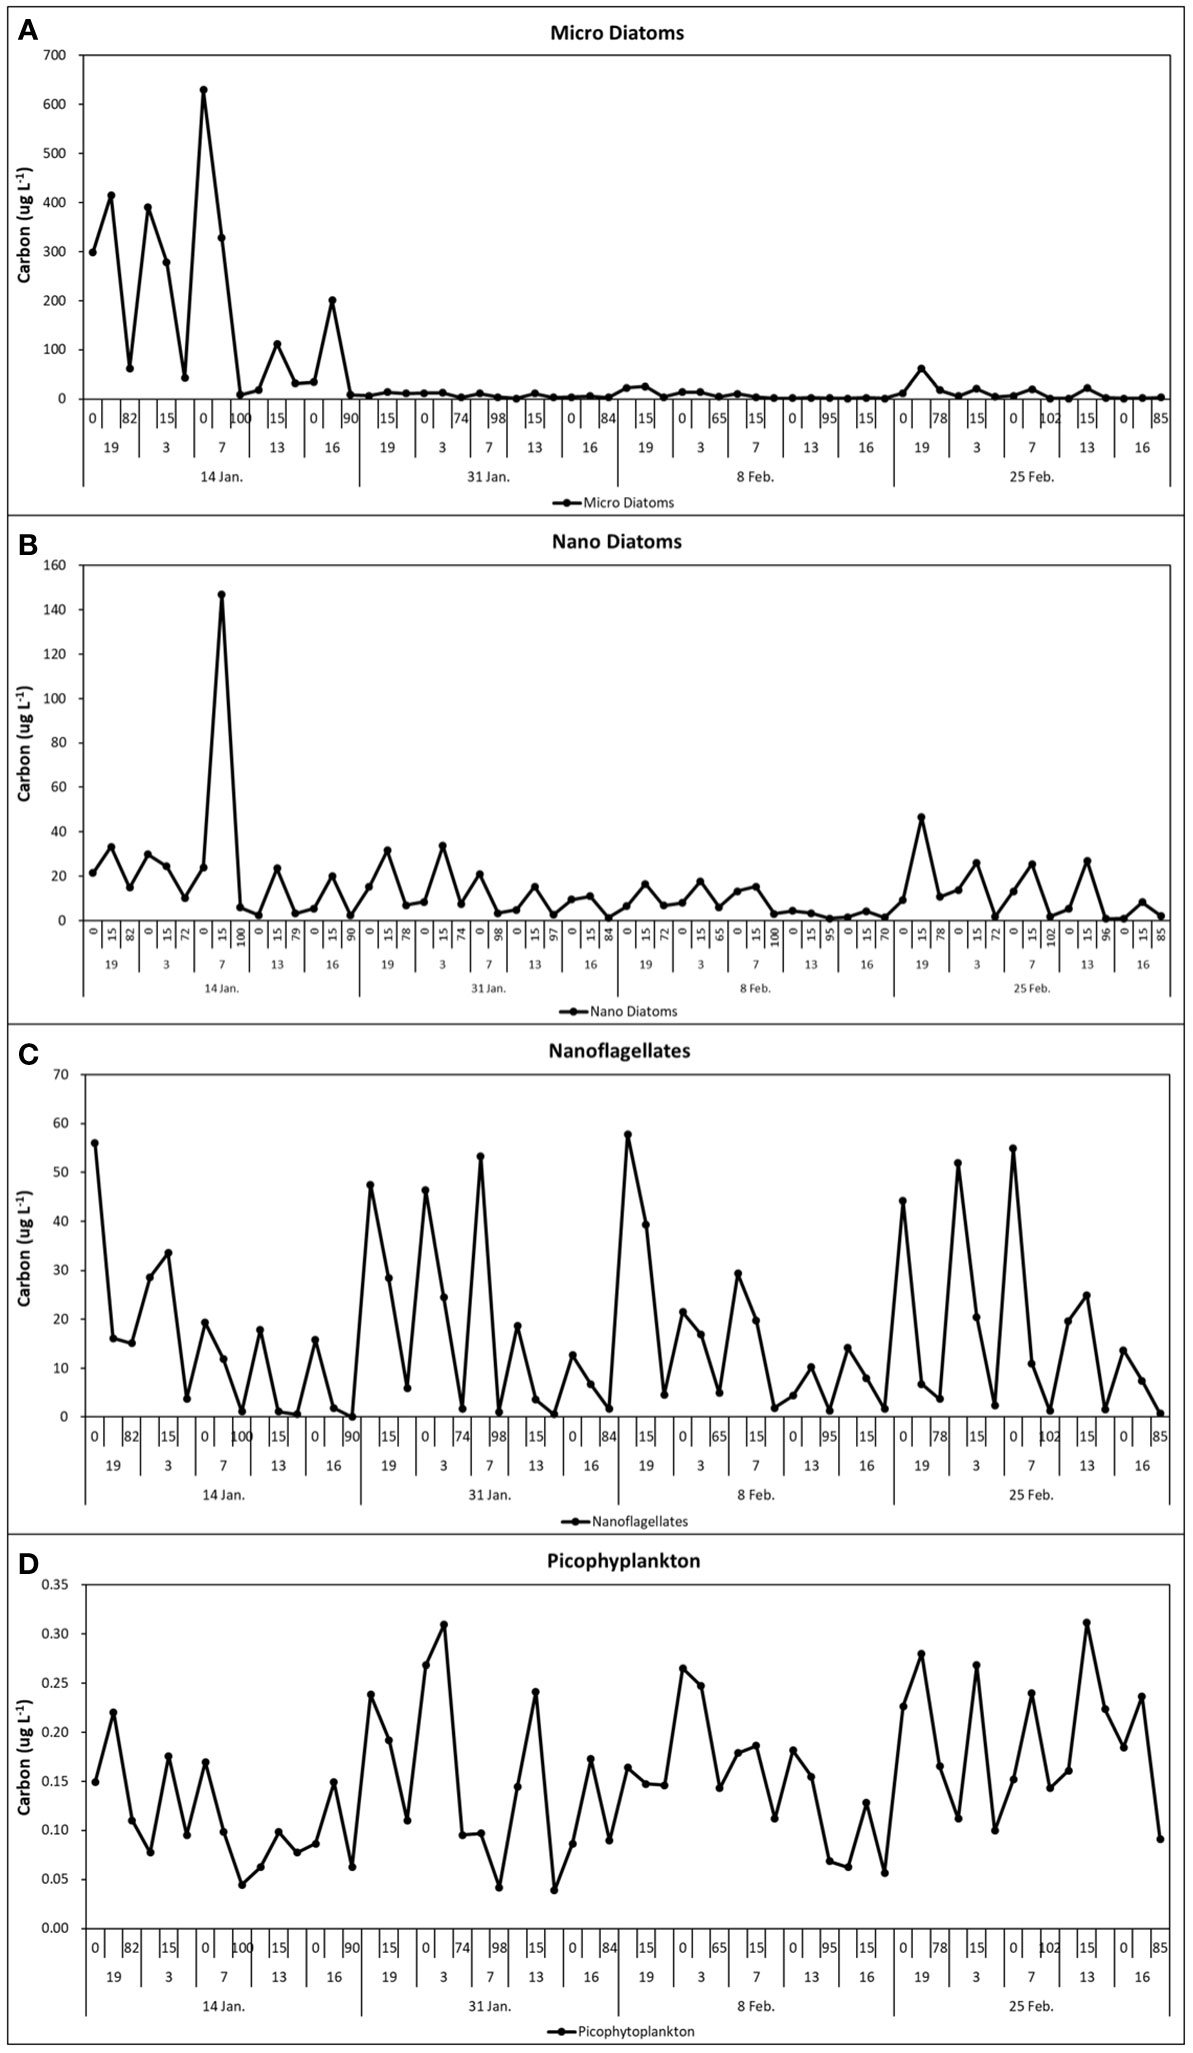
Figure 9 Temporal distribution of cell size carbon biomass of Micro Diatoms (A), Nano Diatoms (B), Nanoflagellates (C), and Picophytoplankton (D) along the Marian Cove transect, during summer 2019.
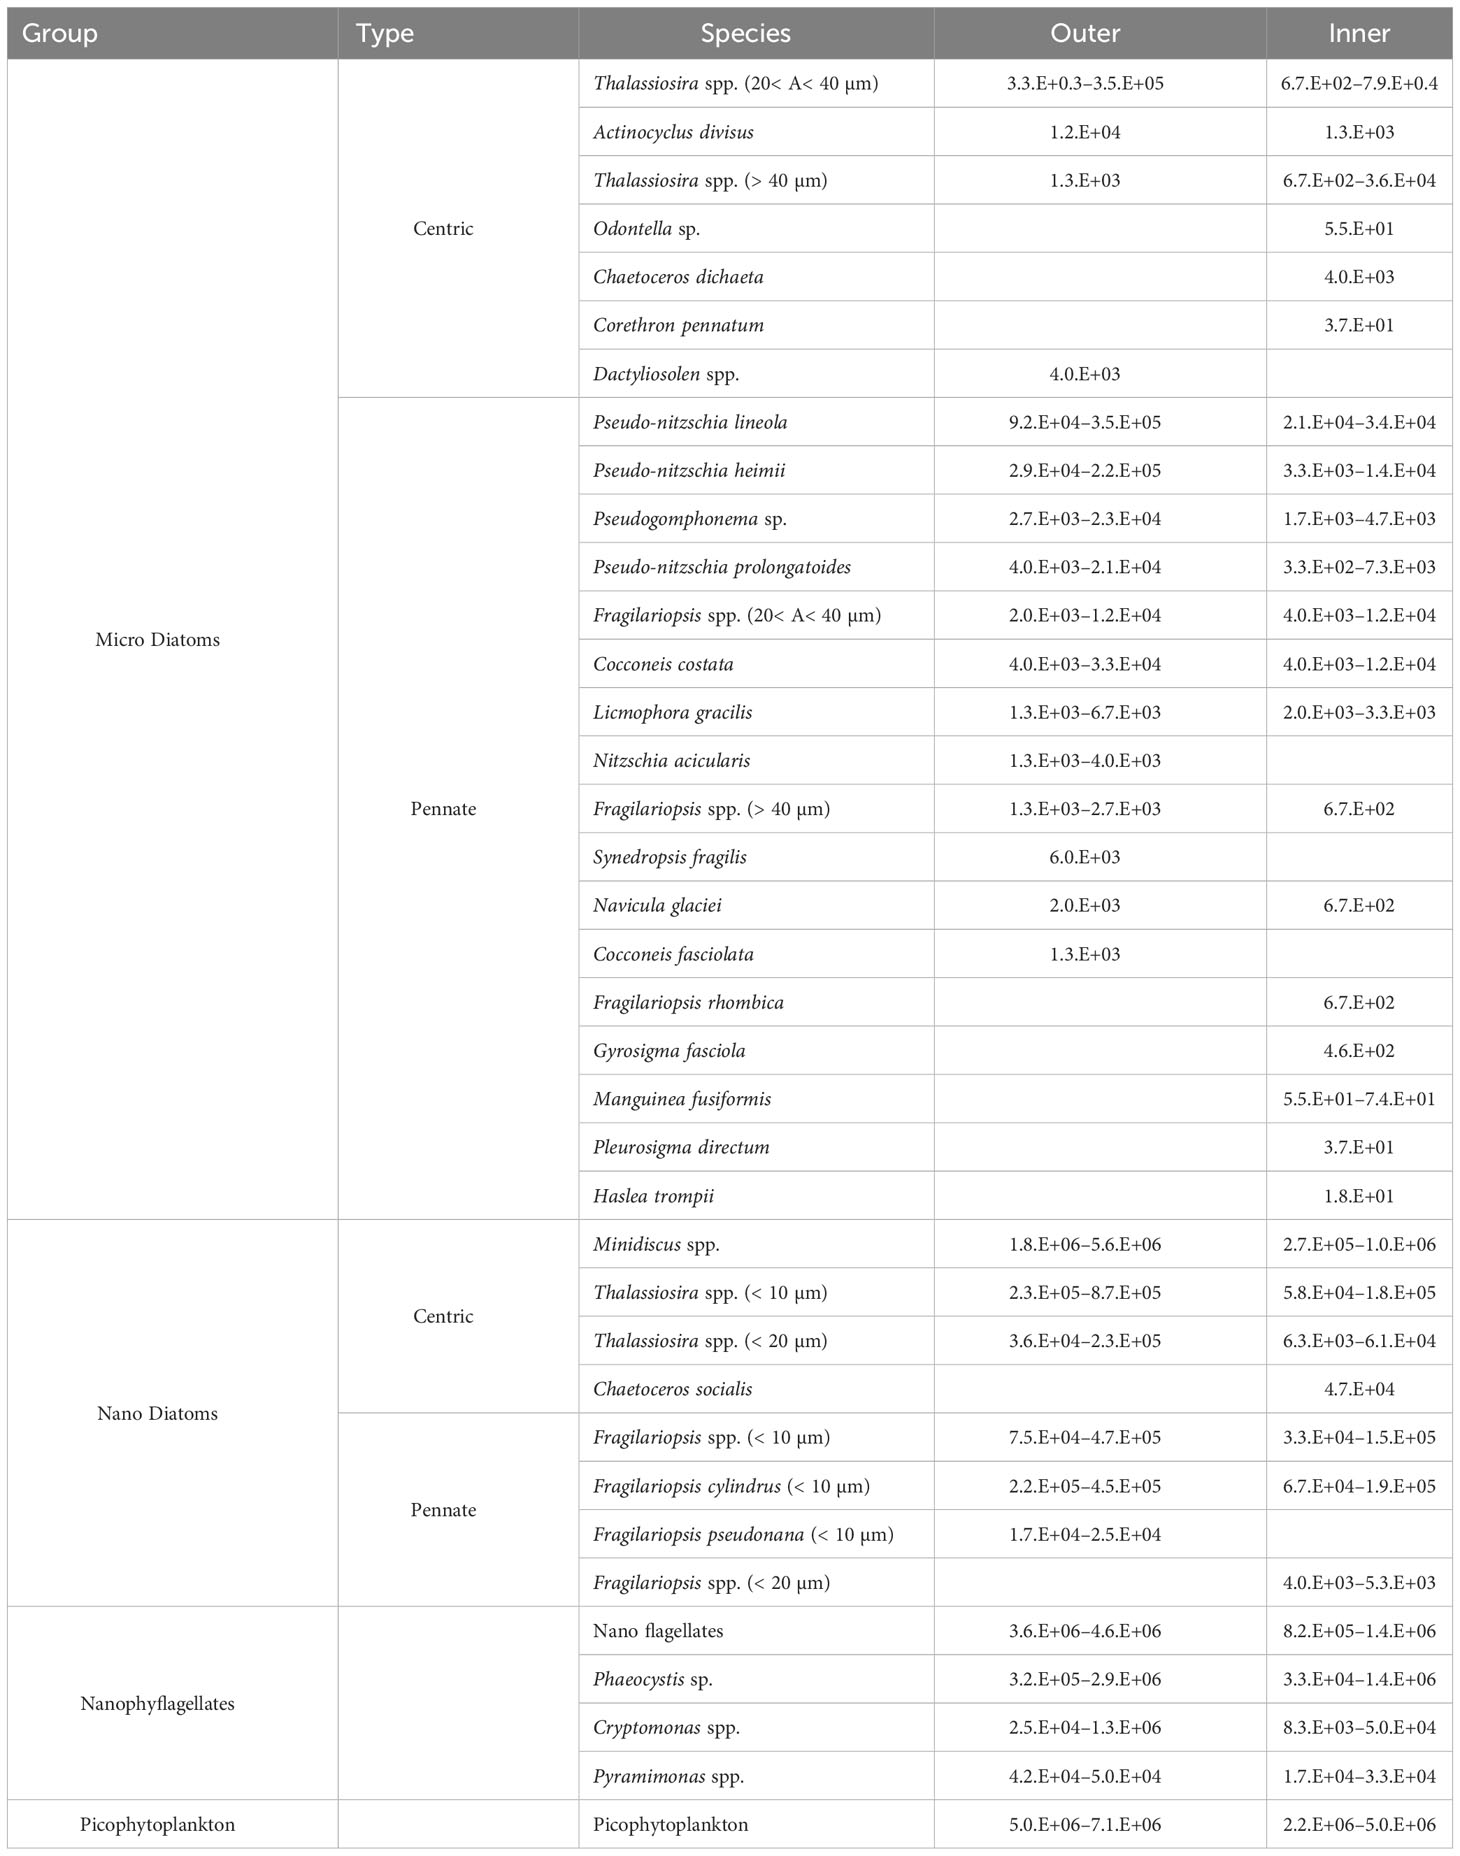
Table 2 Broad ranking of most abundant (> 90% of total cells abundance) and most recurrent (> 50% total samples) phytoplankton taxa at the sites (5 stations, 3 depths) of Marian Cove, Maxwell Bay during January–February 2019.
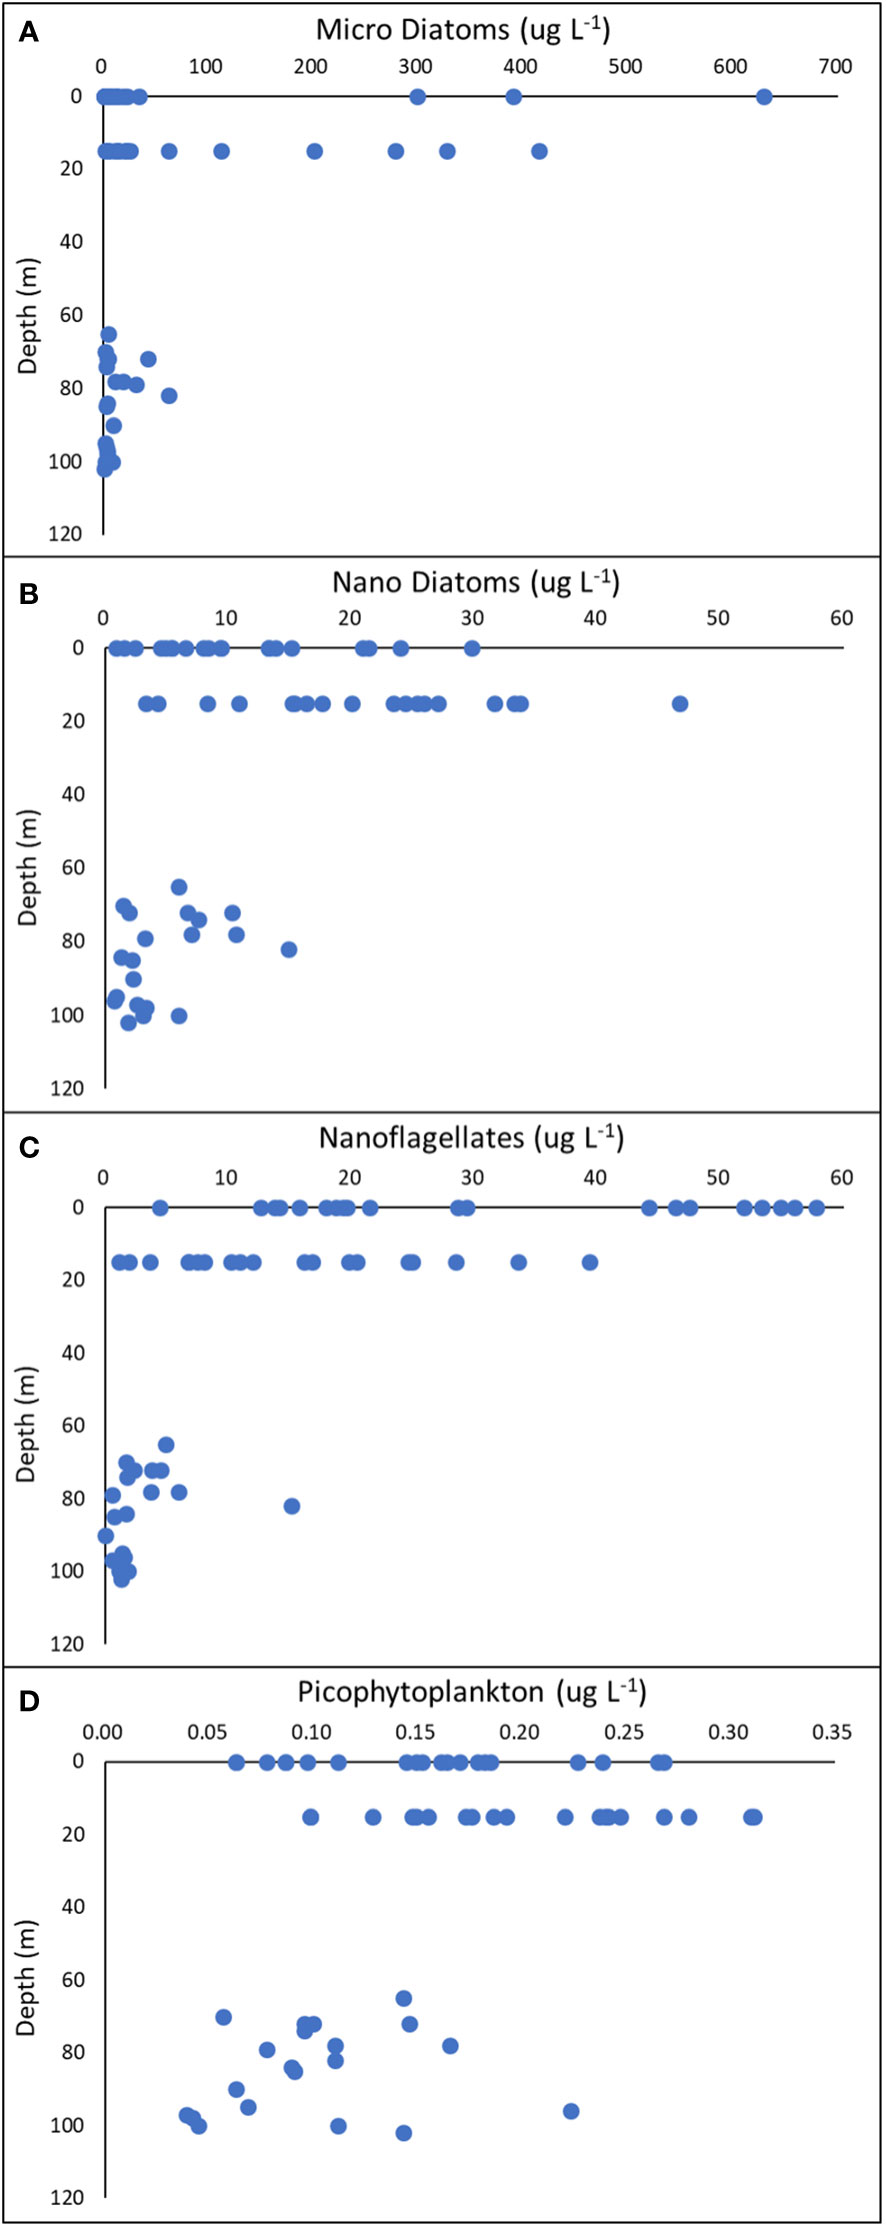
Figure 10 Vertical distribution of cell carbon biomass of Micro Diatoms, Nano Diatoms, Nanoflagellates and Picophytoplankton (A–D) along the Marian Cove transect, during summer 2019.
With the exception of January 14, the carbon biomass of nanophytoflagellate dominated the size structure of phytoplankton throughout the summer period. Cryptomonas spp., Pyramimonas spp., Phaeocystis sp. and unidentified nanoflagellates were mainly distributed at the surface of outer stations of Marian Cove during the summer period. Picophytoplankton contributed little biomass to the phytoplankton community at all stations along the fjord.
The eigenvalues of the two first RDA axes (0.12 and 0.056, respectively) explained 21.77% of the total variability. The species and environmental variables showed correlation values of 0.86 and 0.66 on canonical axes 1 and 2, respectively. The RDA axis 1 was negatively correlated to temperature whereas the RDA axis 2 was negatively related to salinity (Figure 11). Both axes were statistically significant (Monte Carlo testing, p < 0.05). The forward step selection indicated temperature (14% of explained variability) as the main variable accounting for the phytoplankton species composition, followed by PO4, salinity, and SiO2 (6.3%, 3.6%, and 2.7% of explained variability; Monte Carlo testing, p < 0.05), while NO3 was not statistically significant (Monte Carlo testing, p = 0.24).
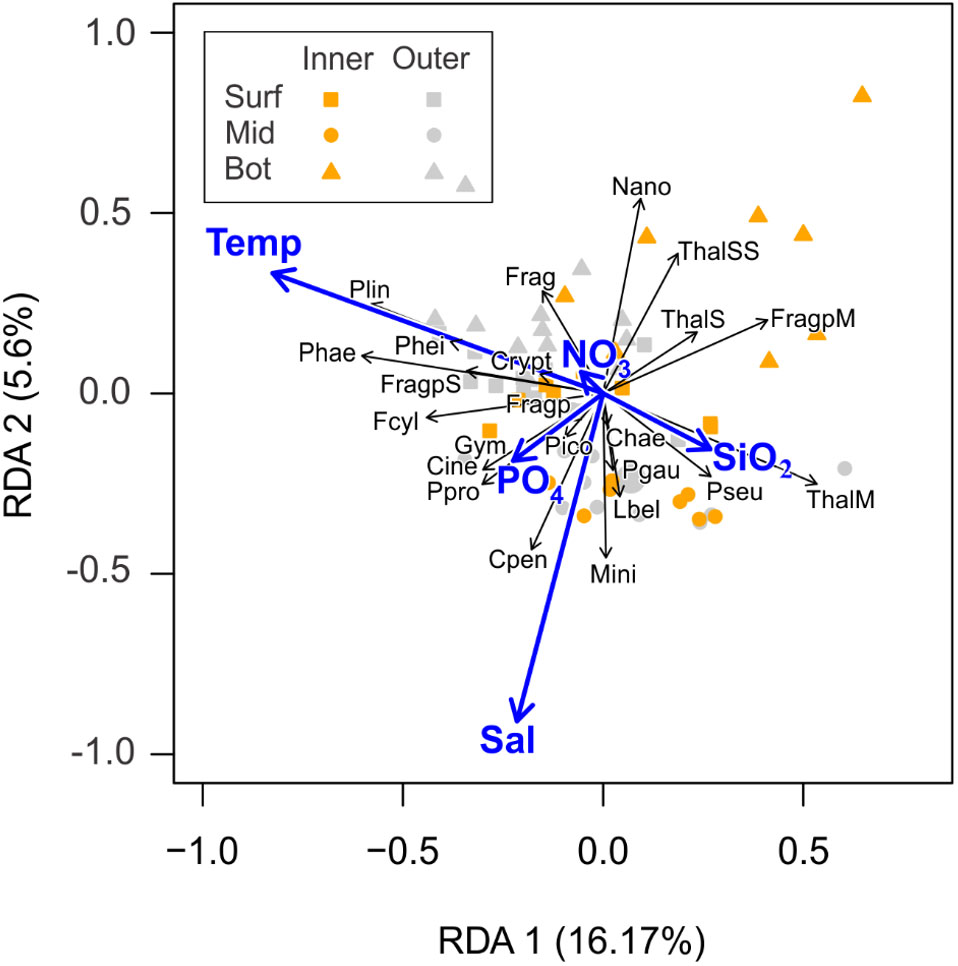
Figure 11 Redundancy Analysis (RDA) plot showing the distribution of the samples and main phytoplankton species (i.e., occurring in at least 30% of the samples) in the multivariate ordination space. Vectors indicate the direction and contribution of the different descriptors to the first two PCA axes: temperature (Temp; °C), salinity (Sal), nitrate (NO3), silicic acid (SiO2), and orthophosphate (PO4). Environmental variables were previously centered and scaled by subtracting the mean and dividing by the standard deviation whereas species abundances were previously transformed to improve normality [log (x + 1)]. Colors of symbols indicate groups of sampling stations: Inner and Outer; and depths: Surface (surf = triangle), Middle (mid = square), Bottom (bot = circle). Chaetoceros spp. (Chae); Corethron inerme (Cine); Corethron pennatum (Cpen); Cryptomonas spp. (Crypt); Fragilariopsis cylindrus (< 10 µm) (Fcyl); Fragilariopsis spp. (< 10 µm) (Frag); Fragilariopsis spp. (Fragp); Fragilariopsis spp. (< 20 µm) (FragpS); Fragilariopsis spp. (20< A< 40 µm) (FragpM); Gymnodinium spp.(< 20 µm) (Gym); Licmophora belgicae (Lbel); Minidiscus spp. (Mini); Nanoplankton (2–20 µm) (Nano); Phaeocystis sp. (Phae); picoplankton (2–0.2 µm) (Pico); Plagiotropis gaussi (Pgau); Pseudogomphonema spp. (Pseu): Pseudo-nitzschia heimii (Phei); Pseudo-nitzschia lineola (Plin); Pseudo-nitzschia prolongatoides (Ppro); Thalassiosira spp. (< 10 µm) (ThalSS); Thalassiosira spp. (< 20 µm) (ThalSS); Thalassiosira spp. (20< A< 40 µm) (ThalM).
Significant changes in phytoplankton biomass have occurred along the WAP in response to a reduction in sea ice extent and changes in upper-ocean conditions since the 1970s associated with remote climatic signals (Arrigo et al., 2008; Montes-Hugo et al., 2009; Henley et al., 2019; Costa et al., 2021). In accordance with these results, a shift from diatoms to cryptophytes in response to long-term changes in hydrographic structure has been suggested, associated with stronger stratification of surface waters as melting of sea ice and glaciers increases (Prézelin et al., 2000; Moline et al., 2004; Montes-Hugo et al., 2008; Wasilowska et al., 2015; Biggs et al., 2019; Mascioni et al., 2019; Ferreira et al., 2020). In this study, low Chl-a (< 1 mg m–3) and dominance of nanodiatoms, nanoflagellates, and picoplankton cells were generally observed in surface waters of Marian Cove, providing further evidence of this trend in the summer season. Aside from the first 2 weeks of January 2019, when a chain-forming diatom and nanodiatom bloom occurred in the outer portion of Marian Cove, nanophytoflagellates made large contributions to total biomass (40–90%; carbon and Chl-a) in low-salinity waters (< 34.1) during the summer period. The occurrence of nanophytoflagellates is consistent with previous results reported during the summer in several Antarctic coastal areas, including Admiralty Bay (Vanzan et al., 2015; Wasilowska et al., 2015), Ryder Bay (van Leeuwe et al., 2018), the western coast of the Antarctic Peninsula (Mascioni et al., 2019), and Andvord Bay (Pan et al., 2020). Furthermore, the observed long-term trend of a large contribution of nanophytoplankton to total Chl-a in the study area during spring–summer in some decades (Lee et al., 2015; Ruiz Barlett et al., 2021) could be associated with changes in the water column, particularly the presence of warm, stratified waters, low salinity, and low light availability. In Marian Cove, based on an annual study, Kang et al. (1997) showed a negative relationship between salinity and nanoflagellates at a monitoring station. These factors have been considered main factors shaping the phytoplankton community in the northern sector of the Antarctic Peninsula, where an important increase in small flagellates over diatoms has been reported (Lange et al., 2018; Mendes et al., 2018; Ferreira et al., 2020). As glacial meltwater input continues, the shift toward species of smaller size during the phytoplankton bloom periods will have an impact, as such species make less significant contributions to carbon export than larger species in nearshore areas of the WAP.
Starting summer, a bloom of chain-forming diatoms of Thalassiosira sp. was observed with high Chl-a and cell carbon biomass, which are typical of diatom blooms in Antarctic coastal areas (Biggs et al., 2019). In January 2019, intermittent and weak southeastern winds (2–6 m s–1) resulted in a period of stability in the water column that was long enough (1 week) to facilitate the development of diatom blooms, which may be fueled by allochthonous diatoms and nutrient-rich warm waters entering the Marian Cove from Maxwell Bay. Although inorganic nutrients were detected during all periods, no microdiatom bloom was observed in the inner portion of the fjord. Thus, microphytoplankton biomass in Marian Cove was unlikely to be affected by nutrient availability (a non-limiting factor) given the high concentrations detected throughout the fjord during the summer season. The high Chl-a and carbon biomass coincided with high phytoplankton carbon uptake over a large area, and high primary productivity estimates in the vicinity of Maxwell Bay (up to 5.0 g C m–2 d–1; unpublished data) as well as Marian Cove (Kim et al., 2021) were reported in January 2019. Phytoplankton community composition during this sporadic summer bloom indicated that the micro- and nanophytoplankton fractions (diatoms) made a significant contribution (> 80%) to total biomass and primary productivity. During this short bloom, microscopic results showed that the diatom assemblages were dominated by a mixture of benthic (Licmophora gracilis, Cocconeis costata, Pseudogomphonema sp., Actinocyclus divisus, Fragilariopsis spp., Nitzschia acicularis, Fragilariopsis cylindrus) and planktonic (Thalassiosira spp., Pseudo-nitzschia heimii, Pseudo-nitzschia lineola, Pseudo-nitzschia prolongatoides) diatoms in Marian Cove (Table 2). The cooccurrence of benthic and planktonic diatom taxa with different physiological statuses was notable, suggesting some adaptation to the conditions of low light and wind-driven water mixing in the study area, as observed previously (Ahn et al., 1997; Jeon et al., 2021). Specifically, the diatom taxa associated with habitats released from glacial ice and benthic substrates may exhibit differences in their buoyancy and sinking adaptations. Benthic and glacial-ice diatoms are heavily silicified, in contrast to the weakly silicified planktonic diatoms that frequently occur in adjacent coastal waters of Maxwell Bay. During December 2018, strong (6–12 m s–1) western winds prevailed, likely inducing vertical strong mixing of shallow waters (< 100 m) in Marian Cove, and these conditions may have triggered resuspension of sediment, including benthic diatoms, thereby altering phytoplankton communities during the bloom period.
Sea-ice dynamics are regarded as a critical environmental process that modulate phytoplankton production, biomass, and community structure, particularly from the winter to spring (Montes-Hugo et al., 2009; Sabu et al., 2014; Moreau et al., 2015; Mangoni et al., 2017). Specifically, previous studies have shown that surface waters of Marian Cove freezes for 2-3 months in winter, but showing a large interannual variability (Ha et al., 2019). In the same fjord, it was suggested that the spring-summer melting process (sea-ice/glacial-ice) associated with previous winters of long/short sea-ice cover periods may play a more important role than large-scale atmospheric dynamics in shaping phytoplankton structure (Jeon et al., 2021). Recent studies have suggested that an increase in meltwater discharge due to the recent melting of the Antarctic ice-sheet/shelf may induce important chemical and physical changes, such as acidification, decreased nitrate, and increased iron in surface waters (Bronselaer et al., 2020; Oh et al., 2022). Long-term monitoring programs in small nearshore marine areas are providing strong scientific evidence of major shifts in phytoplankton biomass and their drivers (physical and climatic), which can be extrapolated to larger Antarctic coastal and oceanic regions (Kim et al., 2018; Ruiz Barlett et al., 2021). Marian Cove contains a glacier at the head of the fjord that is undergoing rapid glacial retreat, impacting the physical and chemical properties of the local marine system due to meltwater discharge. In our study, freshwater inputs from melting glacial ice caused low near-surface salinities (< 34), particularly at the stations nearest to the glacier, creating stratified conditions in the upper water column during summer. Furthermore, the buoyant meltwater plume can enrich waters all along the fjord with nutrients (including iron), providing additional support for phytoplankton growth. Although water column stability is generally associated with dominance of microdiatoms in coastal bays (Biggs et al., 2019; Höfer et al., 2019), this condition likely allowed high abundances of nanoflagellates and nanodiatoms to remain in the upper layer of the water column in Marian Cove. We note that low light transparency (high k′ coefficient) and high turbidity appeared to be the main factors limiting the growth of large diatoms (> 20 µm) during the sampling period, but favor nanophytoplanktonic cells, which are better adapted to low salinity and light (Garcia et al., 2019). A previous study in Marian Cove that focused on the same period reported that low primary productivity was related to dim light and high turbidity throughout the euphotic layer in waters near Marian Cove glacier (Kim et al., 2021). The mean euphotic layer depth of 10 m observed along Marian Cove suggests that light is a limiting factor for the development of periodic summer microphytoplankton blooms in surface waters influenced by glacial freshwater.
Meltwater inputs significantly modified the light availability and physicochemical features at the head of the fjord, thereby influencing the spatial (vertical and horizontal) distribution of phytoplankton structure. At stations adjacent to the glacier, higher abundances of nanodiatoms and nanophytoflagellates were observed, likely due to better adaptation to surface haline stratification and low-light conditions than microdiatoms. In one major bloom episode, the phytoplankton community was dominated by chain-forming diatom species in the outer portion of the fjord, associated with a relatively high euphotic layer and weak southeast winds. We hypothesize that decreased salinity and increased turbidity due to ocean warming would allow nanoplanktonic species to take advantage of this new habitat and become more common in Antarctic coastal waters during future summers in association with increased glacial meltwater inputs.
The original contributions presented in the study are included in the article/Supplementary Material. Further inquiries can be directed to the corresponding authors.
MJ, JI, and EY wrote the manuscript. MJ, JI, EY, JP, and SP participated in discussions about the manuscript. MJ, JI, EY, CS and JP analyzed the data sets. All authors contributed to the article and approved the submitted version.
This study was supported by the Korea Polar Research Institute grant (KOPRI, PE23110). JI was partially supported by program FONDAP-IDEAL 15150003.
The authors declare that the research was conducted in the absence of any commercial or financial relationships that could be construed as a potential conflict of interest.
All claims expressed in this article are solely those of the authors and do not necessarily represent those of their affiliated organizations, or those of the publisher, the editors and the reviewers. Any product that may be evaluated in this article, or claim that may be made by its manufacturer, is not guaranteed or endorsed by the publisher.
Ahn I.-Y., Chung H., Kang J.-S., Kang S.-H. (1997). Diatom composition and biomass variability in nearshore waters of maxwell bay, Antarctica, during the 1992/1993 austral summer. Polar. Biol. 17, 123–130. doi: 10.1007/s003000050114
Arrigo K. R., van Dijken G. L., Alderkamp A. C., Erickson Z. K., Lewis K. M., Lowry K. E., et al. (2017). Early spring phytoplankton dynamics in the Western Antarctic Peninsula. J. Geophys. Res. Oceans. 122 (12), 9350–9369. doi: 10.1002/2017JC013281
Arrigo K. R., van Dijken G. L., Bushinsky S. (2008). Primary production in the Southern Ocean 1997–2006. J. Geophys. Res. Oceans. 113, C08004. doi: 10.1029/2007JC004551
Bae H., Ahn I.-Y., Park J., Song S. J., Noh J., Kim H., et al. (2021). Shift in polar benthic community structure in a fast retreating glacial area of Marian Cove, West Antarctica. Sci. Rep. 11, 241. doi: 10.1038/s41598-020-80636-z
Biggs T. E. G., Alvarez-Fernandez S., Evans C., Mojica K. D. A., Rozema P. D., Venables H. J., et al. (2019). Antarctic phytoplankton community composition and size structure: importance of ice type and temperature as regulatory factors. Polar Biol. 42, 1997–2015. doi: 10.1007/s00300-019-02576-3
Borsheim K. Y., Bratbak G. (1987). Cell volume to cell carbon conversion factors for a bacterivorous Monas sp. enriched from seawater. Mar. Ecol. Prog. Ser. 36, 171–175. doi: 10.3354/meps036171
Bronselaer B., Russell J., Winton M., Williams N., Key R., Dunne J., et al. (2020). Importance of wind and meltwater for observed chemical and physical changes in the Southern Ocean. Nat. Geosci. 13, 35–42. doi: 10.1038/s41561-019-0502-8
Chang K. I., Jun H. K., Park G. T., Eo Y. S. (1990). Oceanographic conditions of Maxwell Bay, King George Island, Antarctica (austral summer 1989). KOREAN J. Polar Res. 1, 27–46.
Costa R. R., Mendes C. R., Ferrira A., Tavano M., Dotto T. S., Secchi E. R. (2021). Large diatom bloom off the Antarctic Peninsula during cool conditions associated with the 2015/2016 El Niño. Commun. Earth Environ. 2, 252. doi: 10.1038/s43247-021-00322-4
Crumpto W. G. (1987). A simple and reliable method for making permanent mounts of phytoplankton for light and fluorescence microscopy. Limnol Oceanogr. 32, 1154–1159. doi: 10.4319/lo.1987.32.5.1154
Dierssen H. M., Smith R. C., Vernet M. (2002). Glacial meltwater dynamics in coastal waters West of the Antarctic Peninsula. Proc. Natl. Acad. Sci. U.S.A. 99, 1790–1795. doi: 10.1073/pnas.032206999
Ferreira A., Costa R. R., Dotto T. S., Kerr R., Tavano V. M., Brito A. C., et al. (2020). Changes in phytoplankton communities along the Northern Antarctic Peninsula: causes, impacts and research priorities. Front. Mar. Sci. 7. doi: 10.3389/fmars.2020.576254
Garcia M. D., Severini M. D. F., Spetter C., Abbate M. C. L., Tartara M. N., Nahuelhual E. G., et al. (2019). Effects of glacier melting on the planktonic communities of two Antarctic coastal areas (Potter Cove and Hope Bay) in summer. Reg. Stud. Mar. Sci. 30, 100731. doi: 10.1016/j.rsma.2019.100731
Ha S.-Y., Ahn I.-Y., Moon H.-W., Choi B., Shin K.-H. (2019). Tight trophic association between benthic diatom blooms and shallow-water megabenthic communities in a rapidly deglaciated Antarctic fjord. Estuar. Coast. Shelf Sci. 218, 258–267. doi: 10.1016/j.ecss.2018.12.020
Hasle G. R., Fryxell G. A. (1970). Diatoms: cleaning and mounting for light and electron microscopy. Trans. Am. Microsc Soc 89, 469–474. doi: 10.2307/3224555
Henley S. F., Schofield O. M., Hendry K. R., Schloss I. R., Steinberg D. K., Moffat C., et al. (2019). Variability and change in the west Antarctic Peninsula marine system: research priorities and opportunities. Prog. Oceanogr. 173, 208–237. doi: 10.1016/j.pocean.2019.03.003
Hewes C., Reiss C., Holm-Hansen O. (2009). A quantitative analysis of sources for summertime phytoplankton variability over 18 years in the South Shetland Islands (Antarctica) region. Deep Sea Res. Part I Oceanogr. Res. Pap. 56, 1230–1241. doi: 10.1016/j.dsr.2009.01.010
Höfer J., Giesecke R., Hopwood M. J., Carrera V., Alarcón E., González H. E. (2019). The role of water column stability and wind mixing in the production/export dynamics of two bays in the Western Antarctic Peninsula. Prog. Oceanogr. 174, 105–116. doi: 10.1016/j.pocean.2019.01.005
Hopwood M. J., Carroll D., Dunse T., Hodson A., Holding J. M., Iriarte J. L., et al. (2020). How does glacier discharge affect marine biogeochemistry and primary production in the Arctic? Cryosphere Discuss. 14, 1347–1383. doi: 10.5194/tc-14-1347-2020
Jeon M., Iriarte J. L., Yang E. J., Kang S.-H., Lee Y., Joo H. M., et al. (2021). Phytoplankton succession during a massive coastal diatom bloom at Marian Cove, King George Island, Antarctica. Polar Biol. 44, 1993–2010. doi: 10.1007/s00300-021-02933-1
Kang S.-H., Kang J.-S., Chung K.-H., Lee M.-Y., Lee B.-Y., Chung H., et al. (1997). Seasonal variation of nearshore antarctic microalgae and environmental factors in Marian Cove, King George Island 1996. KOREAN J. Polar Res. 8, 9–27.
Kang S.-H., Kang J.-S., Lee S., Chung K. H., Kim D., Park M. G. (2001). Antarctic phytoplankton assemblages in the marginal ice zone of the northwestern weddell sea. J. Plankton Res. 23, 333–352. doi: 10.1093/plankt/23.4.333
Kang J.-S., Kang S.-H., Lee J. H., Lee S. (2002). Seasonal variation of microalgal assemblages at a fixed station in King George Island, Antarctica 1996. Mar. Ecol. Prog. Ser. 229, 19–32. doi: 10.3354/meps229019
Kang S.-H., Lee S. (1995). Antarctic phytoplankton assemblage in the western Bransfield Strait region, February 1993 composition, biomass, and mesoscale distributions. Mar. Ecol. Prog. Ser. 129, 253–267. doi: 10.3354/meps129253
Kang S.-H., Suk M. S., Chung S. C., Nam S. Y., Kang C. Y. (1993). Phytoplankton populations in the western bransfield strait and the southern drake passage, Antarctica. KOREAN J. Polar Res. 4, 29–43.
Khatiwala S., Tanhua T., Mikaloff Fletcher S., Gerber M., Doney S. C., Graven H. D., et al. (2013). Global ocean storage of anthropogenic carbon. Biogeosciences 10 (4), 2169–2191. doi: 10.5194/bg-10-2169-2013
Kim H., Ducklow H. W., Abele D., Barlett E. M., Buma A. G. J., Meredith M. P., et al. (2018). Inter-decadal variability of phytoplankton biomass along the coastal West Antarctic. Peninsula. Phil. Trans. R. Soc A. 376, 20170174. doi: 10.1098/rsta.2017.0174
Kim B. K., Jeon M., Joo H. J., Kim T.-W., Park S.-H., Park J., et al. (2021). Impact of freshwater discharge on the carbon uptake rate of phytoplankton during summer (January–february 2019) in Marian Cove, king george island, Antarctica. Front. Mar. Sci. 8. doi: 10.3389/fmars.2021.725173
Kim B. K., Jeon M., Park S.-J., Kim H.-C., Min J.-O., Park J., et al. (2022). Variability in the carbon and nitrogen uptake rates of phytoplankton associated with wind speed and direction in the Marian Cove, Antarctica. Front. Mar. Sci. 9. doi: 10.3389/fmars.2022.887909
Lange P. K., Ligowski R., Tenenbaum D. R. (2018). Phytoplankton in the embayments of King George Island (Antarctic Peninsula): a review with emphasis on diatoms. Polar Rec. 54, 158–175. doi: 10.1017/S0032247418000232
Lange P. K., Tenenbaum D. R., Tavano V. M., Paranhos R., Campos L. S. (2014). Shifts in microphytoplankton species and cell size at Admiralty Bay, Antarctica. Antarctic Sci. 27, 225–239. doi: 10.1017/S0954102014000571
Lee J., Jin Y. K., Hong J. K., Yoo H. J., Shon H. (2008). Simulation of a tidewater glacier evolution in Marian Cove, King George Island, Antarctica. Geosci. J. 12, 33–39. doi: 10.1007/s12303-008-0005-x
Lee S. H., Joo H. M., Joo H., Kim B. K., Song H. J., Jeon M., et al. (2015). Large contribution of small phytoplankton at Marian Cove, King George Island, Antarctica, based on long-term monitoring from 1996 to 2008. Polar Biol. 38, 207–220. doi: 10.1007/s00300-014-1579-6
Llanillo P. J., Aiken C. M., Cordero R. R., Damiani A., Sepúlveda E., Fernández-Gómez B. (2019). Oceanographic Variability induced by Tides, the Intraseasonal Cycle and Warm Subsurface Water intrusions in Maxwell Bay, King George Island (West-Antarctica). Sci. Rep. 9, 18571. doi: 10.1038/s41598-019-54875-8
Mangoni O., Saggiomo V., Bolinesi F., Margiotta F., Budillon G., Cotroneo Y., et al. (2017). Phytoplankton blooms during austral summer in the Ross Sea, Antarctica: driving factors and trophic implications. PloS One 12, e0176033. doi: 10.1371/journal.pone.0176033
Mascioni M., Almandoz G. O., Cefarelli A. O., Cusick A., Ferrario M. E. (2019). Phytoplankton composition and bloom formation in unexplored nearshore waters of the Western Antarctic Peninsula. Polar Biol. 42, 1859–1872. doi: 10.1007/s00300-019-02564-7
Mendes C. R. B., Tavano V. M., Dotto T. D., Kerr R., Souza M. S., Garcia C. A. E., et al. (2018). New insights on the dominance of cryptophytes in Antarctic coastal waters: a case study in Gerlache Strait. Deep Sea Res. Part II Top. Stud. Oceanogr. 149, 161–170. doi: 10.1016/j.dsr2.2017.02.010
Min J.-O., Kim S.-H., Jung J., Jung U.-J., Yang E., Lee S., et al. (2022). Glacial ice melting stimulates heterotrophic prokaryotes production on the getz ice shelf in the Amundsen Sea, Antarctica. Geophys. Res. Lett. 49, L097627. doi: 10.1029/2021GL097627
Moline M. A., Claustre H., Frazer T. K., Schofield O., Vernet M. (2004). Alteration of the food web along the Antarctic Peninsula in response to a regional warming trend. Glob. Change Biol. 10, 1973–1980. doi: 10.1111/j.1365-2486.2004.00825.x
Moline M. A., Prezelin B. B. (2000). Optical fractionation of chlorophyll and primary production for coastal waters of the Southern Ocean. Polar Biol. 23, 129–136. doi: 10.1007/s003000050018.pdf?pdf
Montes-Hugo M., Doney S. C., Ducklow H. W., Fraser W., Martinson D., Stammerjohn S. E., et al. (2009). Recent changes in phytoplankton communities associated with rapid regional climate change along the western Antarctic Peninsula. Science 323, 1470–1473. doi: 10.1126/science.1164533
Montes-Hugo M. A., Vernet M., Smith R., Carder K. (2008). Phytoplankton size-structure on the western shelf of the Antarctic Peninsula: a remote-sensing approach. Int. J. Remote Sens. 29, 801–829. doi: 10.1080/01431160701297615
Moreau S., Mostajir B., Belanger S., Schloss I. R., Vancoppenolle M., Demers S., et al. (2015). Climate change enhances primary production in the western Antarctic Peninsula. Glob. Change Biol. 21, 2191–2205. doi: 10.1111/gcb.12878
Ogle D. H., Wheeler P., Dinno A. (2017) FSA: Simple Fisheries Stock Assessment Methods v. R package version. Available at: https://cran.rproject.org/web/packages/FSA/FSA.pdf (Accessed Access date: 29 September 2019).
Oh J.-H., Noh K. M., Lim H.-G., Jin E. K., Jun S. Y., Kug J.-S. (2022). Antarctic meltwater-induced dynamical changes in phytoplankton in the Southern Ocean. Environ. Res. Lett. 17, 024022. doi: 10.1088/1748-9326/ac444e
Oksanen J., Kindt R., Legendre P., O’Hara B., Simpson G. L., Solymos P., et al. (2007). The vegan package. Commun. Ecol. Package. 10, 631–637.
Pan B. J., Vernet M., Manck L., Forsch K., Ekern L., Mascioni M., et al. (2020). Environmental drivers of phytoplankton taxonomic composition in an Antarctic fjord. Prog. Oceanogr. 183, 102295. doi: 10.1016/j.pocean.2020.102295
Park B.-K., Chang S.-K., Yoon H. I., Chung H. (1998). Recent retreat of ice cliffs, King George Island, South Shetland Islands, Antarctic Peninsula. Ann. Glaciol. 27, 633–635. doi: 10.3189/1998AoG27-1-633-635
Park S.-J., Choi T.-J., Kim S.-J. (2013). Heat flux variations over sea ice observed at the coastal area of the Sejong Station, Antarctica. Asia-Pacific J. Atmos. Sci. 49, 443–450. doi: 10.1007/s13143-013-0040-z
Parsons T. R., Maita Y., Lalli C. M. (1984). A manual of chemical and biological methods for seawater analysis (New York: Pergamon Press, Oxford), 173.
Prézelin B. B., Hofmann E. E., Mengelt C., Klinck J. M. (2000). The linkage between Upper Circumpolar Deep Water (UCDW) and phytoplankton assemblages on the west Antarctic Peninsula continental shelf. J. Mar. Res. 58, 165–202. doi: 10.1357/002224000321511133
Rückamp M., Braun M., Suckro S., Blindow N. (2011). Observed glacial changes on the King George Island ice cap, Antarctica, in the last decade. Glob. Planet. Change. 79, 99–109. doi: 10.1016/j.gloplacha.2011.06.009
Ruiz Barlett E. M., Sierra M. E., Costa A. J., Tpspnotto G. V. (2021). Interannual variability of hydrographic properties in Potter Cove during summers between 2010 and 2017. Antarctic Sci. 33, 281–300. doi: 10.1017/S0954102020000668
Sabu P., Anilkumar N., George J. V., Chacko R., Tripathy S. C., Achuthankutty C. T. (2014). The influence of air-sea-ice interactions on an anomalous phytoplankton bloom in the Indian Ocean sector of the Antarctic Zone of the Southern Ocean during the austral summer 2011. Pol. Sci. 8, 370–384. doi: 10.1016/j.polar.2014.08.001
Schofield O., Saba G., Coleman K., Carvalho F., Couto N., Ducklow H., et al. (2017). Decadal variability in coastal phytoplankton community composition in a changing West Antarctic Peninsula. Deep Sea Res. Part I. Part I Oceanogr. Res. Pap. 124, 42–54. doi: 10.1016/j.dsr.2017.04.014
Simoes J. C., Bremer U. F., Aquino F. E., Ferron F. A. (1999). Morphology and variations of glacial drainage basins in the King George Island ice field, Antarctica. Ann. Glaciol. 29, 220–224. doi: 10.3189/172756499781821085
Simonsen R. (1974). The diatom plankton of the Indian Ocean Expedition R/V “Meteor” 1964–1965. Forschungsergebnisse. Reihe D: Biologie. 19, 1–107.
Smayda T. J. (1978). “From phytoplankton to biomass,” in Phytoplankton manual, monographs on oceanographic 6. Ed. Sournia A. (Paris: UNESCO), 273–279.
Stammerjohn S. E., Martinson D. G., Smith R. C., Yuan X., Rind D. (2008). Trends in Antarctic annual sea ice retreat and advance and their relation to El Niño-Southern Oscillation and Southern Annular Mode variability. J. Geophys. Res. Oceans. 113, C3. doi: 10.1029/2007JC004269
ter Braak C. J. F., Šmilauer P. (2012). Canoco reference manual and user’s guide: software for ordination (version 5.0) (Ithaca, NY: Microcomputer Power). doi: 10.1007/s00334-022-00879
Turner J., Barrand N. E., Bracegirdle T. J., Convey P., Hodgson D. A., Jarvis M., et al. (2014). Antarctic climate change and the environment: an update. Polar Rec. 50, 237–259. doi: 10.1017/S0032247413000296
van Leeuwe M. A., Tedesco L., Arrigo K. R., Assmy P., Campbell K., Meiners K. M., et al. (2018). Microalgal community structure and primary production in Arctic and Antarctic sea ice: a synthesis. Elementa. Sci. Anthrop. 6, 4. doi: 10.1525/elementa.267
Vanzan M., Barrera-Alba J. J., Tenório M. M. B., Tenenbaum D. R. (2015). Picoplankton and nanoplankton variability in an Antarctic shallow coastal zone (Admiralty Bay) during the austral summer of 2010/2011. Polar Biol. 38, 1267–1284. doi: 10.1007/s00300-015-1692-1
Keywords: glacial freshwater, cell carbon biomass, Antarctic shallow fjords, diatoms, nanophytoflagellates, phytoplankton size fractions
Citation: Jeon M, Iriarte JL, Yang EJ, Park J, Alves-de-Souza C and Park SJ (2023) Importance of nanophytoplankton biomass during summer 2019 in a retreating marine-terminating glacier-fjord system, Marian Cove, West Antarctica (62°S). Front. Mar. Sci. 10:1174722. doi: 10.3389/fmars.2023.1174722
Received: 27 February 2023; Accepted: 10 August 2023;
Published: 29 August 2023.
Edited by:
Yunyan Deng, Chinese Academy of Sciences (CAS), ChinaReviewed by:
Shramik Patil, National Centre for Polar and Ocean Research (NCPOR), IndiaCopyright © 2023 Jeon, Iriarte, Yang, Park, Alves-de-Souza and Park. This is an open-access article distributed under the terms of the Creative Commons Attribution License (CC BY). The use, distribution or reproduction in other forums is permitted, provided the original author(s) and the copyright owner(s) are credited and that the original publication in this journal is cited, in accordance with accepted academic practice. No use, distribution or reproduction is permitted which does not comply with these terms.
*Correspondence: Eun Jin Yang, ZWp5YW5nQGtvcHJpLnJlLmty; José Luis Iriarte, amx1aXNpcmlhcnRlQGdtYWlsLmNvbQ==
Disclaimer: All claims expressed in this article are solely those of the authors and do not necessarily represent those of their affiliated organizations, or those of the publisher, the editors and the reviewers. Any product that may be evaluated in this article or claim that may be made by its manufacturer is not guaranteed or endorsed by the publisher.
Research integrity at Frontiers
Learn more about the work of our research integrity team to safeguard the quality of each article we publish.