 Li-Bin He
 Hui-Yu Luo
- Disease Control Center, Fisheries Research Institute of Fujian, Xiamen, China
Since the release of the movie Finding Nemo, clownfish have been known and loved by many people. Clownfish have a very vivid skin color and extreme ornamental value. However, there are few species of clownfish, which greatly limits the breeding of new varieties. In this study, the Atmosphere and room temperature plasma (ARTP) method was used to treat clownfish-fertilized eggs and successfully screened out mutants that exhibited a skin color change from black to red in their offspring. To elucidate the molecular mechanism underlying this color mutation, more than 17,000 methylated peaks were obtained via m6A-specific methylated RNA immunoprecipitation with next-generation sequencing (MeRIP-seq). These modification sites were mainly distributed around stop codons, and the number of corresponding genes exceeded 10,000. Further RNA sequencing (RNA-seq) of clownfish before and after the mutation was performed identified 883 genes that exhibited significant differences between the two samples, among which 152 interaction genes showed significant differences in the m6A methylated level and gene expression level. The results of a functional analysis showed that the phosphatidylinositol-3-kinase (PI3K)-serine/threoninekinase (Akt) pathway and its related signal pathways may play an important role in skin color change. In particular, genes such as mitogen activated protein kinase kinase 1 (MAP2K1), insulin―like growth factor―l (IGF1), and fibroblast growth factor 1 (FGF1) may play key roles in the accumulation of melanin in clownfish, and the homeobox-protein-encoding empty spiracles homeobox 2 (EMX2) and mesenchyme homeobox (MEOX2) genes may be important for determining the regions of accumulation of this skin pigment. Our results provide a new reference for the genetic breeding of clownfish and lay a foundation for further understanding the molecular mechanism underlying body color changes in clownfish.
1 Introduction
The clownfish, especially the Amphiprion ocellaris is a well-known ornamental fish that was made popular by the Pixar film Finding Nemo and is also called anemonefish because of its mutualistic symbiotic relationship with tropical sea anemones (Elliott et al., 1999). There are approximately 30 anemonefish species in the subfamily Amphiprioninae (as well as a few naturally occurring hybrids) (Elliott et al., 1999; Hu et al., 2016; Feeney and Brooker, 2017). They are popular aquarium species because of their bright colors, adaptability to captivity, and fascinating behavior. Clownfish have a high ornamental value and are an ideal material for studying the symbiotic behavior and co-evolution between clownfish and tropical sea anemones. To date, the limited number of studies of clownfish have mainly focused on traditional taxonomy, molecular phylogeny, and evolution (Santini and Polacco, 2006; Timm et al., 2008; James Cooper et al., 2009; Li et al., 2015; Hu et al., 2016; Ye et al., 2016; He et al., 2020). The current lack of species diversity remains a barrier in clownfish breeding. Mutagenesis is a very effective tool in order to create more genetic resources.
Mutations are the basis of genetic variation, and successful breeding strategies basically depend on the mutations present in the base population. Artificial induction is a common method for creating mutant individuals. Chemical mutagens and physical mutagens, such as ethyl methane sulfonate (EMS), N-ethyl-N-nitrosourea (ENU), and X-ray and UV irradiation, play important roles in mutation induction (Kodym and Afza, 2003). Artificial induction can also be used to change the body color, for example, in frogs found internal pigment cells can respond to external UV radiation (Franco-Belussi et al., 2016). Recently, a new powerful mutagenesis tool, i.e., atmosphere and room temperature plasma (ARTP), has been successfully used for mutagenesis breeding in several species, such as microbes (Ottenheim et al., 2018), plants (Luo et al., 2016; Zhao et al., 2019), human cell lines (Zhao et al., 2013), and fish (Ji-Lun et al., 2019). Some studies showed that ARTP can cause stronger DNA damage, thereby resulting in a higher mutation rate compared with the UV and chemical mutagens (Zhang et al., 2014). Based on the existing reports, ARTP is a more efficient method for mutagenizing clownfish and resulting in more genetic resources.
The body color of clownfish not only controlled by genes, but also tends to change with the surrounding environment. Chemical modifications of RNA provide a direct and rapid way to modulate the existing transcriptome, allowing cells to adapt rapidly to changing environments (Malla et al., 2019). N6-methyladenosine (m6A) is the most prevalent and abundant RNA modification, especially within eukaryotic mRNAs. Moreover, it has been extensively researched in yeast, plants, flies, humans, and other mammals (Lence et al., 2017; Zhao et al., 2017; Yue et al., 2019). Several studies have shown that m6A governs mRNA splicing (Bartosovic et al., 2017), translation (Barbieri et al., 2017), stability (Vu et al., 2017), structure, and export and decay (Zhao et al., 2017). These studies have identified m6A as a dynamically regulated gene-expression modulator during development (Roundtree et al., 2017; Frye et al., 2018), stem cell proliferation and differentiation (Klungland et al., 2016), the DNA damage response (Bartosovic et al., 2017), stress response (Zhou et al., 2015), etc. In particular, m6A has attracted much attention because of its demonstrated importance in the regulation of gene expression and in cell-fate decision in recent years (Wang et al., 2015; Roundtree and He, 2016; Zhu et al., 2020).
Recently, the sequencing of the clownfish genome provided a more favorable and convenient setting for the molecular and genomic research of this fish (Tan et al., 2018). As clownfish have various color patterns, the survey of genome-wide m6A modification sites will provide a molecular understanding of the regulatory mechanism between methylation modifications and clownfish color patterns.
In order to obtain more resources of body color-related mutants, we first used the ARTP method to create and screen mutants. To clarify the molecular mechanism of body color mutation, we investigate the relationship between m6A modification and color patterns in clownfish, as a basis for studying the level of expression of genes that are regulated by m6A modification. We find m6A methylated may through PI3K-Akt pathway regulated skin color of clownfish. Our results provide a reference for obtaining additional mutants and for elucidating the molecular mechanism underlying body color changes in clownfish.
2 Materials and methods
2.1 Fertilized fish egg collection and mutation by ARTP
Clownfish with the original black skin color (provided by a marine ornamental fish breeding base) were housed in recirculating aquaria at 26°C–28°C at the Fisheries Research Institute of Fujian. Healthy and active clownfish were selected as the parents and fertilized eggs from the same parent were collected 1 hour after the fish had spawned. Subsequently, the fertilized eggs were treated with a pure helium-based ARTP mutation machine (ARTP-A, TMAXTREE Biotechnology Co., Ltd., Luoyang, China). The fertilized eggs at the metaphase of the first mitosis were placed on a glass Petri dish containing 1 mL of sea water. The dish was then exposed to the plasma, and the ARTP mutation system was operated using the following parameters: a radio-frequency (RF) power input of 240 W, a helium gas flow rate of 10 L/min, a treatment distance of 2 mm, and a treatment time of 10 min. After the ARTP mutation treatment, the eggs were transferred to a 26°C–28°C water bath until hatching. Ninety days later, three ARTP- treated and -untreated individuals were selected, respectively. The skins of these 6 fishes were cut and mixed, then immediately frozen in liquid nitrogen and stored at –80°C.
2.2 Species identification and phylogenetic analyses
The fins of the clownfish were clipped and stored in 96% ethanol immediately. DNA was then extracted and purified for PCR amplifications. The mitochondrial cytochrome c oxidase subunit I (COI) gene is a candidate gene for studying the evolution of species, the primers (5′–TCAACCAACCACAAAGACATTGGCAC–3′ and 5′–TAGACTTCTGGGTGGCCAAAGAATCA–3′) were used to amplify this gene (Li et al., 2015; He et al., 2020). The PCR products were sequenced and the resulting nucleotide sequences were aligned with the COI gene sequences of Amphiprion akallopisos, A. frenatus, A. latifasciatus, A. ephippium, A. akindynos, A. clarkia, A. sebae, A. perideraion, A. bicinctus, A. barberi, A. chrysopterus, A. polymnus, A. sandaracinos, and A. percula, which were downloaded from National Center for Biotechnology Information (NCBI) using the MEGA v7 software (Kumar et al., 2016). The results of the alignment were analyzed using Maximum Likelihood algorithms based on the Tamura–Nei model using the MEGA 7 software (Kumar et al., 2016). The statistical confidence was evaluated using 1000 non-parametric bootstrap replicates (Felsenstein, 1985).
2.3 RNA extraction, library construction, and sequencing
Total RNA was extracted using the TRIzol reagent kit (Invitrogen, Carlsbad, CA, USA) according to the manufacturer’s protocol. RNA quality was assessed on an Agilent 2100 Bioanalyzer (Agilent Technologies, Palo Alto, CA, USA) and checked using RNAse-free agarose gel electrophoresis.
For m6A-specific methylated RNA immunoprecipitation with next-generation sequencing (MeRIP-seq), fragmented RNA was incubated with an anti-m6A polyclonal antibody (Synaptic Systems, 202003) in IPP buffer (150 mM NaCl, 0.1% NP-40, 10 mM Tris-HCl, pH 7.4) for 2 h at 4°C. The mixture was then immunoprecipitated via incubation with protein-A beads (Thermo Fisher) at 4°C for an additional 2 h. Subsequently, bound RNA was eluted from the beads with N6-methyladenosine (Berry & Associates, PR3732) in IPP buffer, and then extracted using the TRIzol reagent (Thermo Fisher) according to the manufacturer’s instructions. Both the input sample without immunoprecipitation and the m6A immunoprecipitation (IP) samples were used to construct libraries via the same method with RNA-seq.
For RNA-seq, the rRNA was extracted using a Ribo-ZeroTM Magnetic Kit (Epicentre, Madison, WI, USA). Second-strand cDNA was synthesized using DNA polymerase I, RNase H, dNTP, and buffer. Next, the cDNA fragments were purified with a QiaQuick PCR extraction kit (Qiagen, Venlo, The Netherlands) and ligated to Illumina sequencing adapters. The ligation products were size selected by agarose gel electrophoresis, PCR amplified, and sequenced using an Illumina HiSeq2500 platform by Gene Denovo Biotechnology Co. (Guangzhou, China). Three biological replicates were performed for each treatment.
2.4 Raw data analysis
Before assembly, raw reads were filtered by fastp (Chen et al., 2018). Next, the short read alignment tool implemented in Bowtie2 was used to map reads to an rRNA database (Langmead and Salzberg, 2012). All rRNA mapped reads were then removed. The remaining clean reads were further used in assembly and gene abundance calculation.
The A. ocellaris reference genome and associated annotation files were downloaded from NCBI (accession no. PRJNA407816, https://www.ncbi.nlm.nih.gov/bioproject/407816) (Tan et al., 2018). An index of the reference genome was built, and paired-end clean reads were mapped to the reference genome using HISAT2. 2.4 with “-rna-strandness RF” and other parameters set as a default (Kim et al., 2015). The reconstruction of transcripts was carried out using Stringtie (version 1.3.1) and HISAT2 (Kim et al., 2015; Pertea et al., 2016).
2.5 Gene expression and functional enrichment analysis
For each transcription region, a fragment per kilobase of transcripts per million mapped reads value was calculated, to quantify the gene expression abundance and variations using Stringtie (Pertea et al., 2016). Differentially expressed genes (DEGs) between different samples were then identified using DESeq2 (Love et al., 2014).
Methylated sites on RNAs (peaks) were identified using the exomePeak2 R package with P-value <0.05 (Meng et al., 2014). The enrichment score on different gene functional elements of peaks was calculated with reference to a previous report (Luo et al., 2014). m6A enrichment sequence motifs were analyzed using the MEME Suite (http://meme-suite.org/) (Bailey et al., 2009).
The significance threshold of the P-value was adjusted using the false discovery rate (FDR), to correct for multiple testing. The genes or peaks with a minimal two-fold (|log2 Ratio| ≥ 1) and FDR ≤0.05 in a comparison were regarded as significant differential genes or peaks.
2.6 Statistical analysis of related data in RNA-seq and MeRIP-seq
We extracted the expression levels of the genes related to peaks, sorted them according to expression levels, and divided them into 20 equal groups. The number of peaks in the 5′UTR, start codon, CDS, stop codon, and 3′UTR of each gene was counted and their percentage among the total number of peaks was assessed.
2.7 Functional enrichment analysis
Candidate genes were mapped to GO terms in the Gene Ontology (GO) database (http://www.geneontology.org/), and a Kyoto Encyclopedia of Genes and Genomes (KEGG) enrichment analysis was used for predicting the functions of candidate genes (Ashburner et al., 2000; Kanehisa and Goto, 2000; Boyle et al., 2004).
2.8 Validation of gene expression patterns
Seven genes were selected for validation by quantitative realtime reverse transcription PCR (qRT-PCR). First-strand cDNA was synthesized using a HiScript II Q RT SuperMix for qPCR Kit (Vazyme, China). Gene-specific primers for qPCR were designed based on the corresponding sequence using Primer3 (https://primer3.ut.ee). GAPDH2 (AMPOCE_00031857) was used as an internal control. qRT-PCR was performed using the ChamQ SYBR qPCR Master Mix (Vazyme, China) on an ABI StepOnePlus™ instrument (ABI, America) according to the manufacturer’s instructions. Three technical replicates were performed for each gene. A regression analysis was performed using the qRT-PCR and RNA sequencing results; this analysis included all genes from both genotypes at all three time points of the waterlogging treatment. Relative gene expression (calculated using the 2−△△Ct method) was visualized graphically (Rao et al., 2013).
3 Results
3.1 Phenotype and data statistics of MeRIP-seq of clownfish
In this study, fertilized eggs of clownfish were selected and mutated using ARTP. After hatching, the skin color of the clownfish was observed and only a few individuals changed from the original black to red, which were selected out for further study (Figure 1A). We cloned and sequenced the COI gene of the mutated clownfish, and a molecular evolutionary analysis showed that the COI gene sequence was consistent and clustered with the COI gene of Amphiprion ocellaris, which revealed that the variety of the mutated clownfish was Amphiprion ocellaris (Figure 1B). To elucidate the molecular mechanism underlying the clownfish body color change, we performed RNA-seq and MeRIP-seq on clownfish skin before and after mutagenesis, respectively.
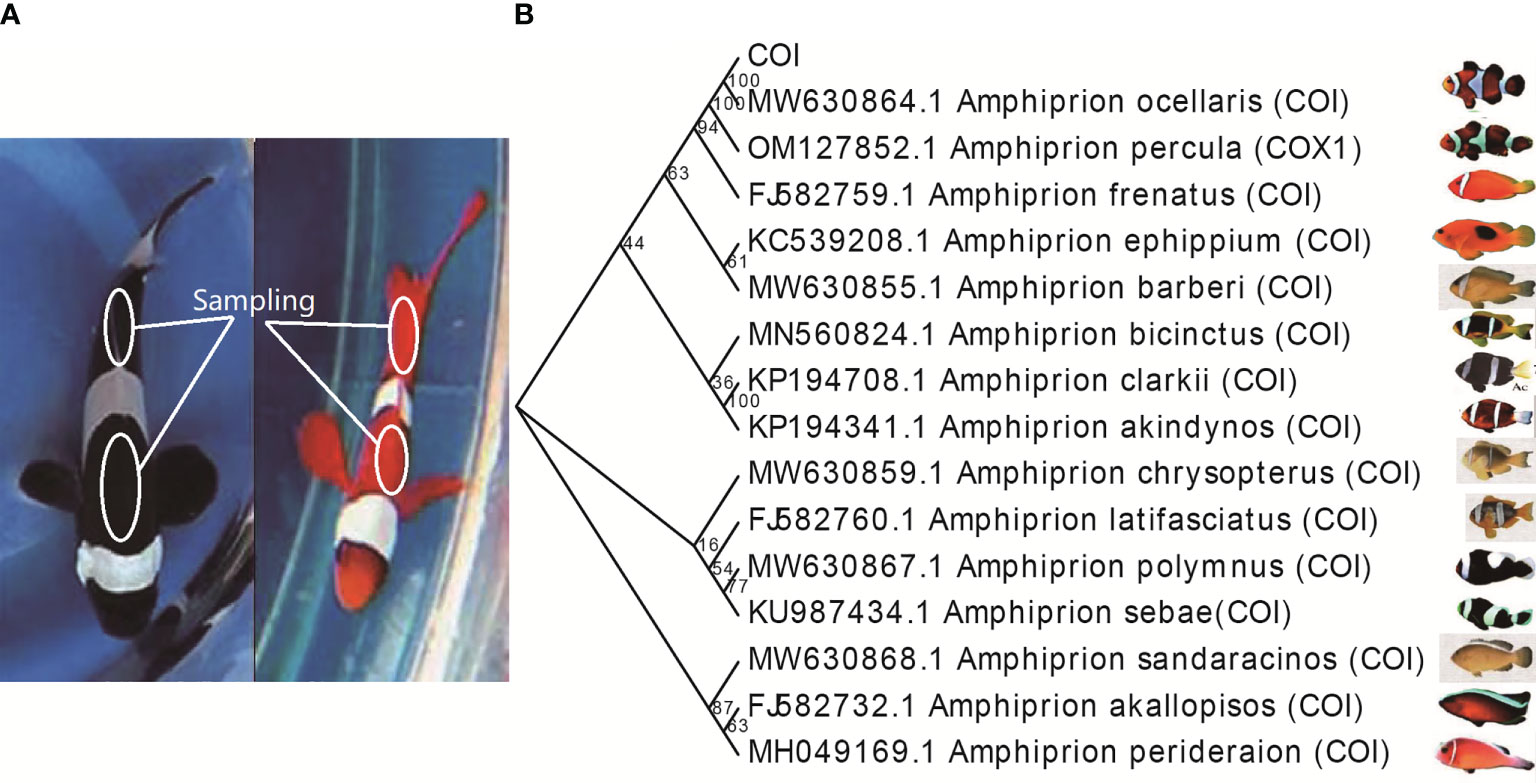
Figure 1 Phenotypic and variety identification of clownfish (Amphiprion ocellaris) that hatched from ARTP-treated eggs. (A) Phenotype of wile type (WT) and mutated clownfish. White circle indicates the sampling location. (B) Molecular evolutionary analysis of the mitochondrial cytochrome c oxidase subunit I (COI) gene of mutated clownfish. The NCBI accession numbers used in this study are MW630864.1 (Amphiprion ocellaris), OM127852.1 (Amphiprion percula), FJ582759.1 (Amphiprion frenatus), MW630855.1 (Amphiprion barberi), KC539208.1 (Amphiprion ephippium), MN560824.1 (Amphiprion bicinctus), KP194708.1 (Amphiprion clarkii), KP194341.1 (Amphiprion akindynos), MW630859.1 (Amphiprion chrysopterus), FJ582760.1 (Amphiprion lat ifasciatus), KU987434.1 (Amphiprion sebae), MW630868.1 (Amphiprion sandaracinos), FJ582732.1 (Amphiprion akallopisos), MH049169.1 (Amphiprion perideraion).
For MeRIP-seq, the wild-type clownfish skin of the test and control groups in immunoprecipitation were named MW-IP and MW-input henceforth, and the mutant clownfish skin of the test and control groups in immunoprecipitation were named MM-T and MM-C, respectively. After removing low-quality reads and rRNA mapped reads, more than 223 million clean reads were generated in all libraries (Table S1), and the mapping rate of clean reads against the clownfish reference genome ranged from 67% to 92.71% (Table S2). The control group of both samples had a 22%–25% higher mapping ratio than did the test group.
3.2 Profiles of m6A modification in wild-type and ARTP-treated mutant clownfish
The total reads from MW and MM samples were 1976912 and 1590251, respectively. To obtain the complete transcriptome-wide m6A map of the clownfish, we identified 15873 and 17611 M6A peaks in MW and MM, respectively (Tables S3, S4). Among them, 5761 special peaks were detected in the MW sample, 7499 special peaks were detected in the MM sample, and 10112 common peaks were detected in both the MW and MM samples (Figure 2A). To further understand the preferential locations of the reads on transcripts, we investigated their distributions. In the two samples, we found that most reads were highly enriched around the start codon, the coding region, and the stop codon. However, the enrichment was more frequent at the start codon region in input samples and at the stop codon region in IP samples (Figures 2B, C). Interestingly, the enrichment around the start codon region in MM-input samples was stronger than that observed in MW-input samples (Figures 2B, C). Thus, we investigated the metagene profiles of m6A peaks further. In the MW sample, we found that most m6A peaks were highly enriched around the coding regions (40.35%), stop codon (31.95%), and 3′UTRs (14.58%), followed by the start codon (11.54%) and 5′UTRs (1.57%) (Figure 2D). In the MM sample, we found that most m6A peaks were highly enriched around the coding regions (41.17%), stop codon (31.57%), and 3′UTRs (13.3%), followed by the start codon (12.24%) and 5′UTRs (1.61%) (Figure 2E). The proportion of enrichment around the coding regions, the start codon, and the 5′UTRs was slightly greater in MM vs. MW (Figures 2D, E).
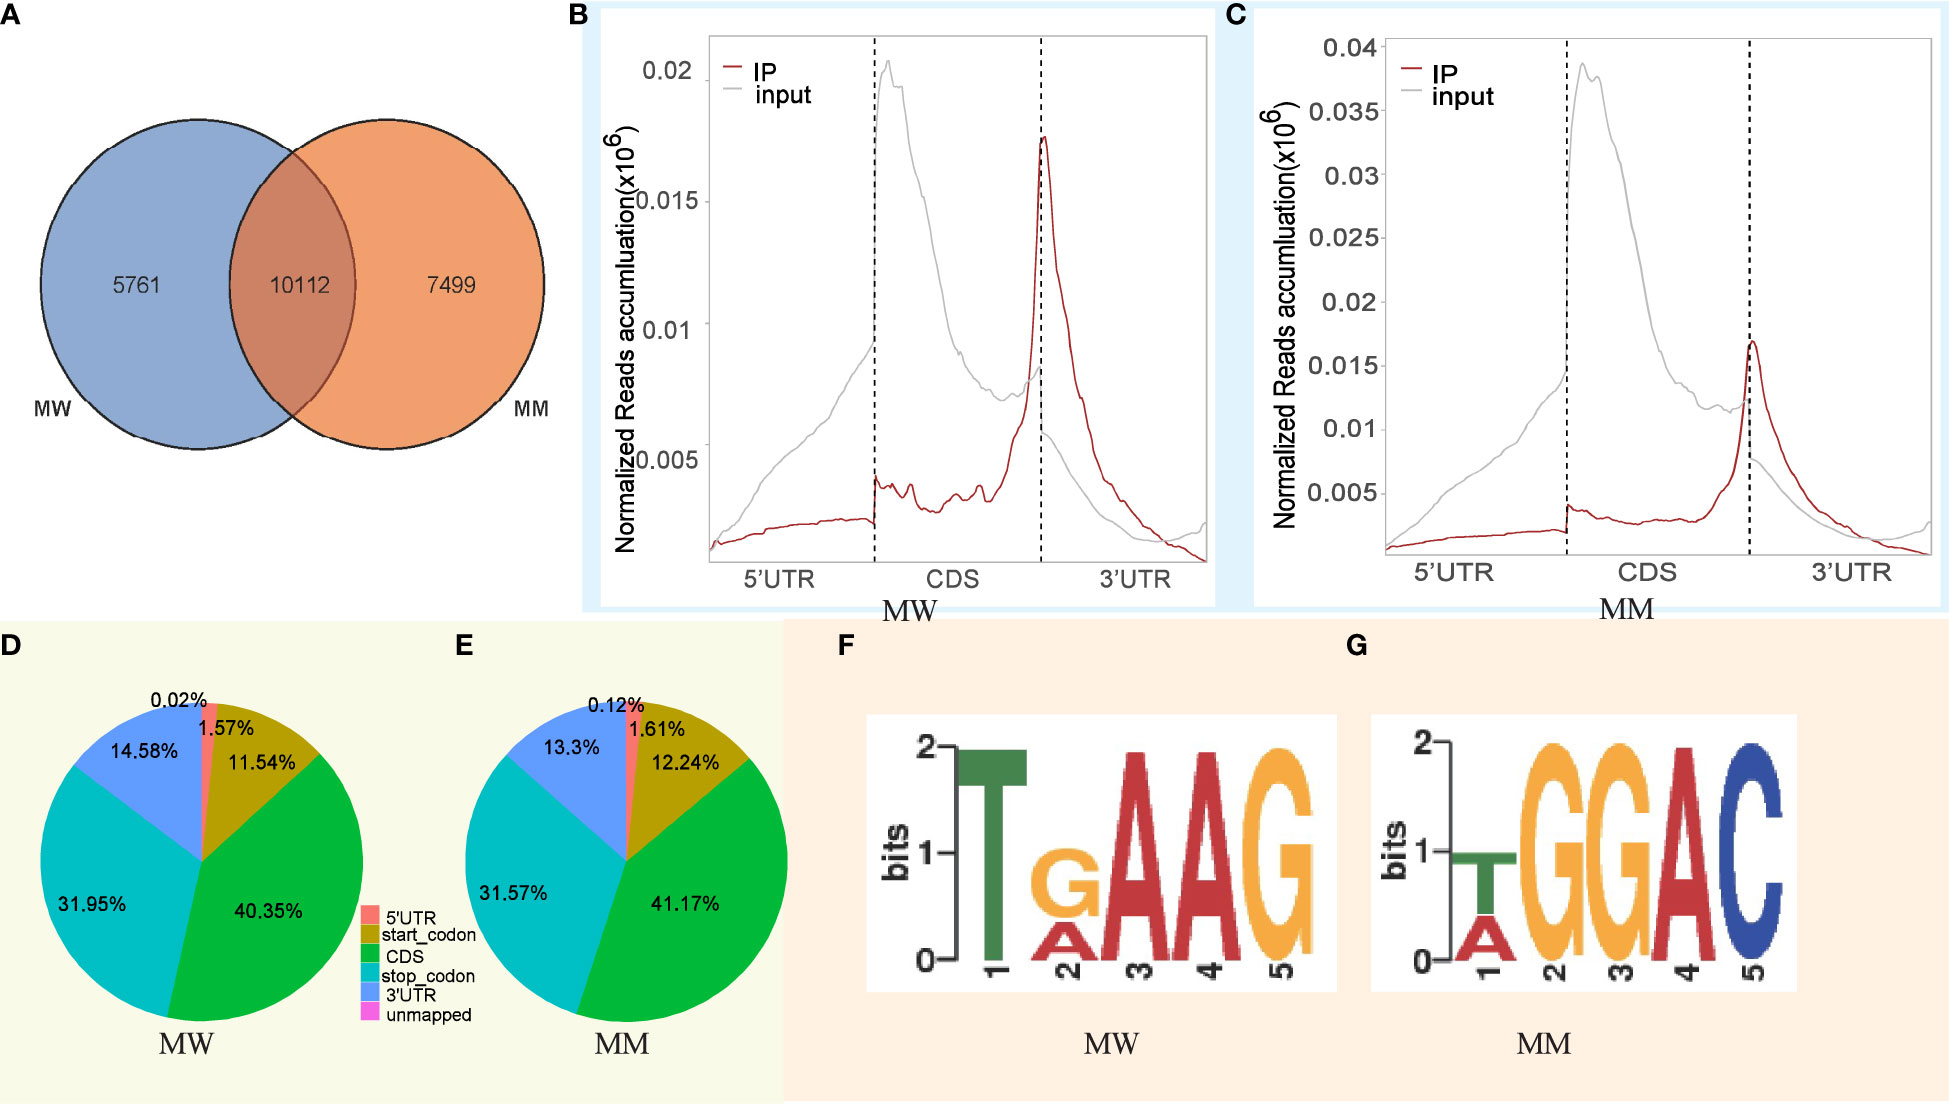
Figure 2 Overview of the m6A methylome in clownfish. (A) Venn diagram of peaks; (B) peak relative transcript location distribution in MW; (C) peak relative transcript location distribution in MM; (D) distribution of peaks on different gene functional elements in MW; (E) distribution of peaks on different gene functional elements in MM; (F) conserved sequence motif for m6A-containning peak regions in MW, as assessed by the DREME software; and (G) conserved sequence motif for m6A-containning peak regions in MM, as assessed by the DREME software.
To determine whether the identified m6A peaks contained the RRm6ACH (R = A/G and H = A/C/U) conserved sequence motif, we implemented a search for motifs that were enriched in the 50-bp area around the m6A peak using the DREME software. It has been reported that m6A modification preferentially appears after G in the conserved motif RRm6ACH. Our results showed that the MW and MM enrichment sequence motifs exhibited a similar character in clownfish mRNA (Figures 2F, G; Table S5).
3.3 Relationship between m6A modification peaks and gene function
We further surveyed the m6A modification peaks relationship with gene function. The results showed that 10202 and 11193 genes were related to the m6A modification peaks in MW and MM reported above, respectively (Tables S6). Among them, the two samples had 6620 common m6A modification peaks related to genes, 3582 specific m6A modification peaks related to genes in MW samples, and 4573 specific m6A modification peaks related to genes in MM samples (Figure 3A; Table S7). To further explore the effect of ARTP treatment on m6A modification in clownfish mRNA and the molecular mechanism underlying the skin color change in mutated clownfish, we focused on the 4573 MM-specific peak-related genes. The GO enrichment analysis revealed the significant enrichment of GO terms such as gene expression (GO:0010467), chromatin modification (GO:0016568), nucleic acid binding (GO:0003676), lysine N-methyltransferase activity (GO:0016278), and transferase complex (GO:1990234) (Figure 3B; Table S8). The KEGG enrichment analysis showed that the significantly enriched pathways included Glycosaminoglycan biosynthesis—chondroitin sulfate/dermatan sulfate (ko00532), RNA transport (ko03013), extracellular matrix (ECM)–receptor interaction (ko04512), Focal adhesion (ko04510), Regulation of actin cytoskeleton (ko04810), etc. (Figure 3C; Table S8).
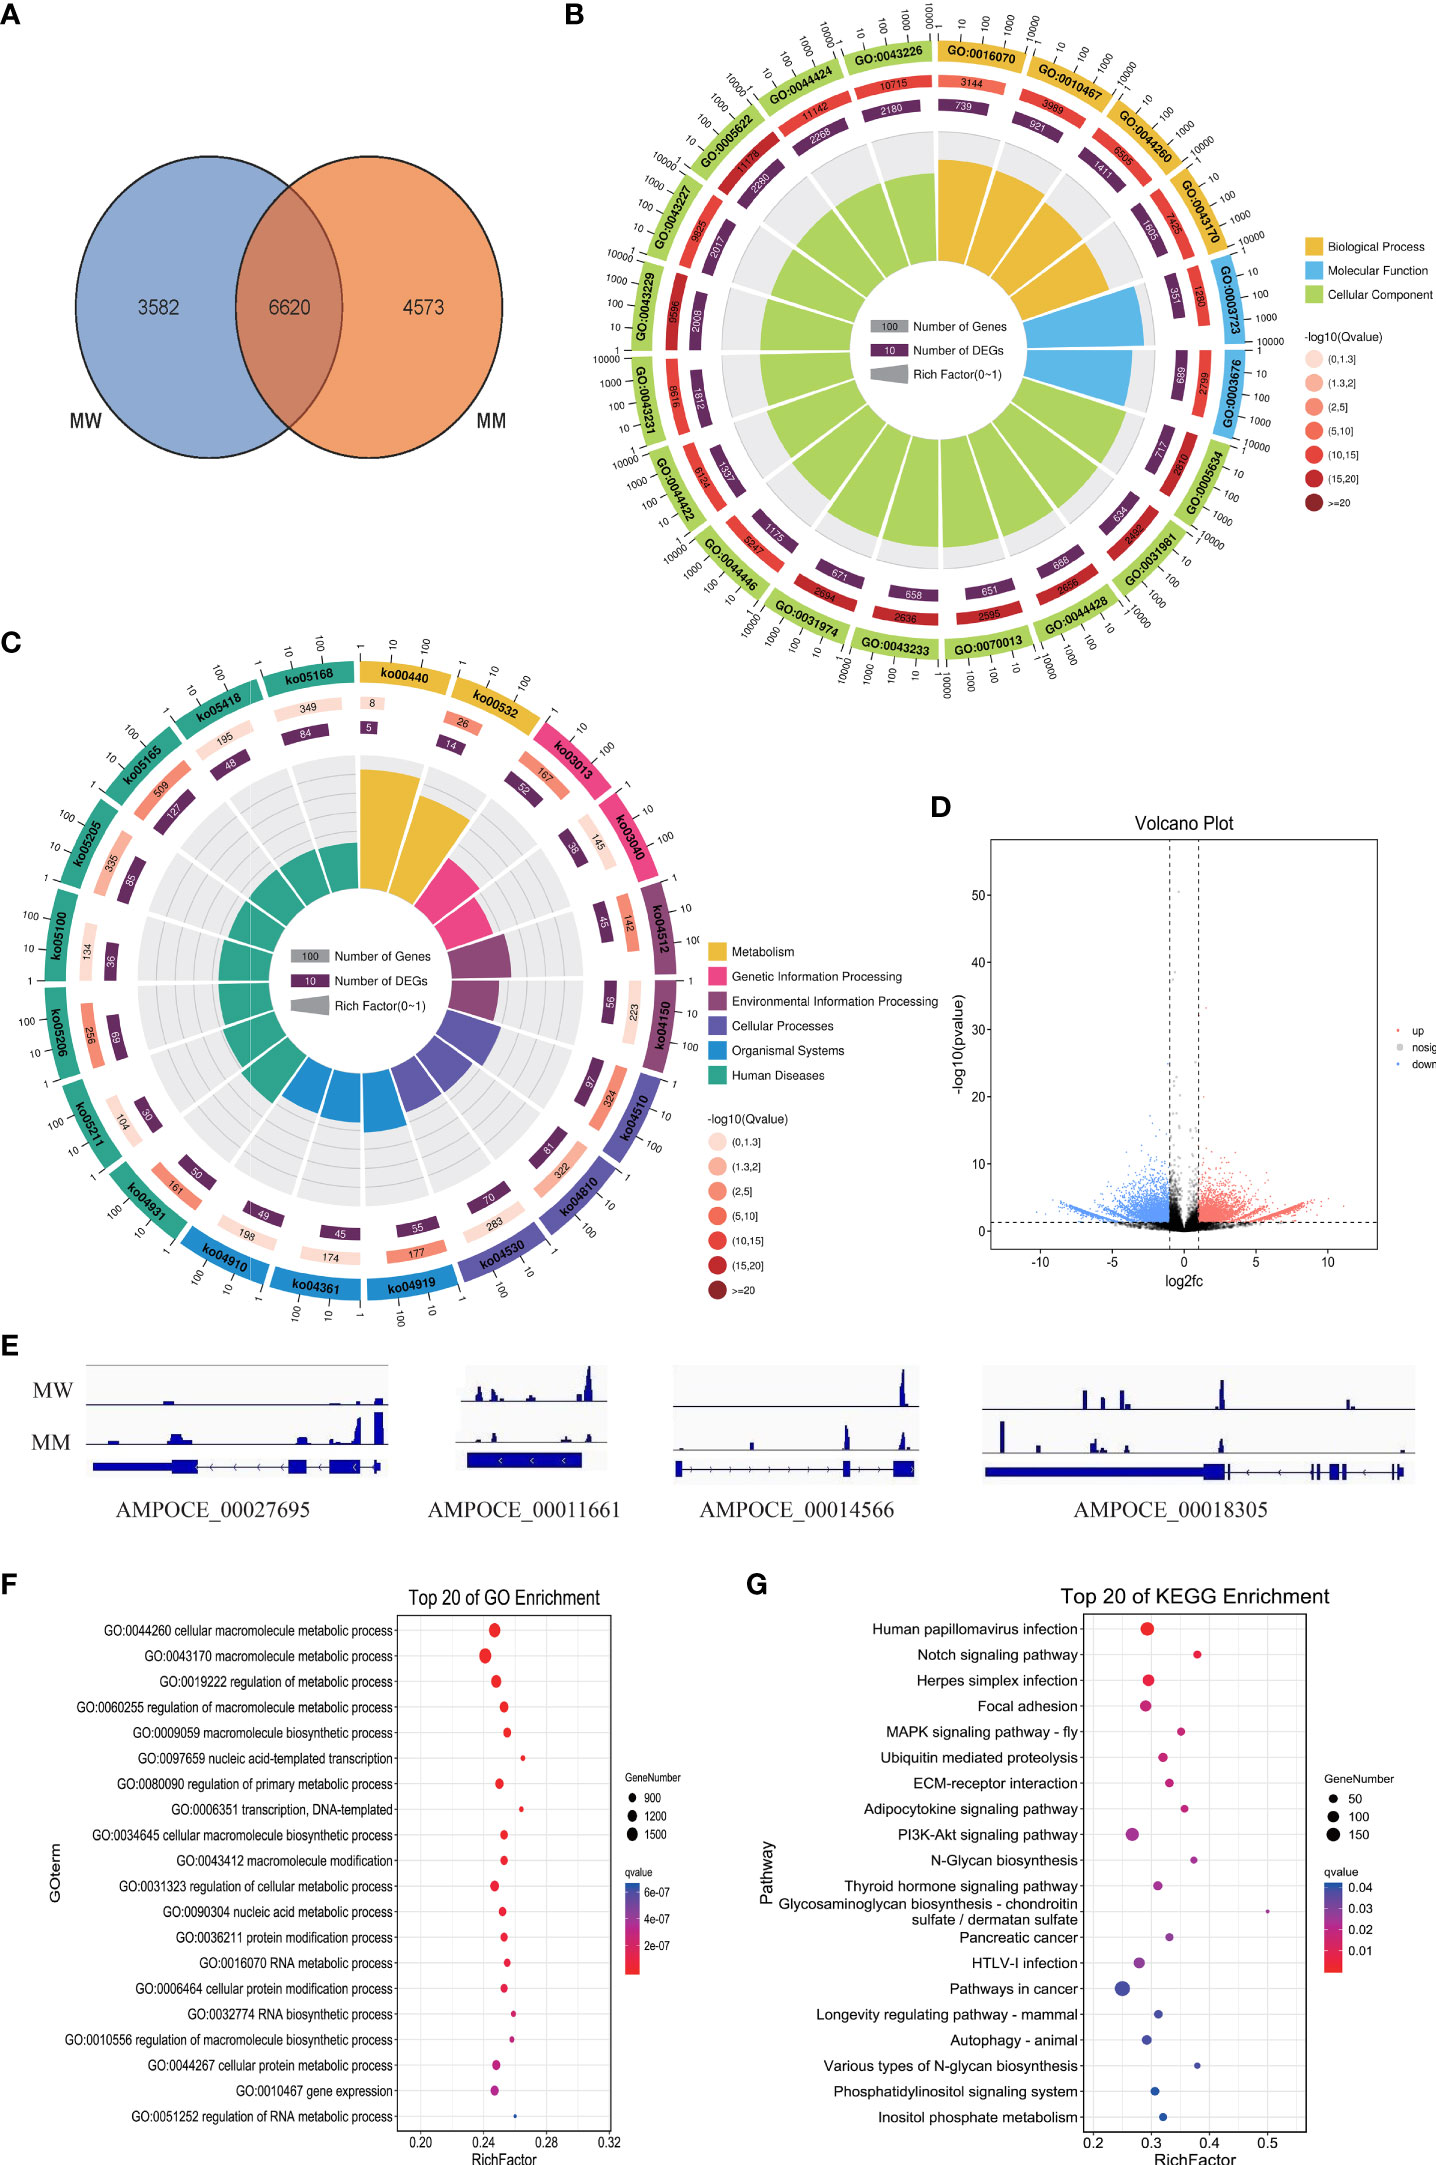
Figure 3 Peak-related gene functional annotation. (A) Venn diagram of peak-related genes. (B) GO enrichment of specific methylation genes in MM. (C) KEGG enrichment of specific methylation genes in MM. (D) Genes with differential methylation levels in MM and MW. (E) Four examples of genes with m6A peaks in clownfish. (F) GO enrichment of differentially expressed m6A-modified genes. (G) KEGG enrichment of differentially expressed m6A-methylated genes.
Furthermore, the m6A modification level also caused different expression levels of genes. The comparison of the m6A modification level between MW and MM samples identified 3517 upregulated and 3728 downregulated m6A modification sites (Figure 3D; Table S9). As demonstrated by the four randomly selected genes, the AMPOCE_00027695 and AMPOCE_00014566 genes had a higher m6A modification level in MM vs. MW, whereas the AMPOCE_00011661 and AMPOCE_00018305 genes had a lower m6A modification level in MM vs. MW (Figure 3E).
The GO enrichment analysis of differentially expressed m6A-modified genes showed that the significantly enriched GO term in the biological process included cellular macromolecule metabolic process (GO:0044260), nucleic acid-templated transcription (GO:0097659), protein modification process (GO:0036211), gene expression (GO:0010467), chromatin modification (GO:0016568), etc. (Figure 3F; Table S10).
The enrichment pathways of differentially expressed m6A-modified genes, as assessed by KEGG analysis, indicated that 23 pathways were significantly enriched, such as Notch signaling pathway, Focal adhesion, mitogen-activated protein kinase (MAPK) signaling pathway, Ubiquitin-mediated proteolysis, ECM–receptor interaction, Adipocytokine signaling pathway, PI3K-Akt signaling pathway, N-glycan biosynthesis, Glycosaminoglycan biosynthesis-chondroitin sulfate/dermatan sulfate, Autophagy—animal, Various types of N-glycan biosynthesis, FoxO signaling pathway, etc. (Figure 3G; Table S10).
3.4 Data statistics of RNA-seq of clownfish
To assess whether m6A modification is involved in the regulation of the expression level of genes, we further examined the expression profiles of the wild-type and ARTP-treated mutant clownfish by RNA-seq. For RNA-seq, the wild-type and ARTP-treated mutant clownfish skins were named RW and RM henceforth, respectively. In total, after removing low-quality reads and rRNA mapped reads, more than 230 million clean reads were generated in all libraries (Table S11); the mapping rate of clean reads against the clownfish reference genome ranged from 91.24% to 94.12% (Table S12). About 80% of the reads were mapped to exonic regions, whereas about 20% of the reads were mapped to intronic and intergenic regions (Table S11).
3.5 Differentially expressed genes between wild-type and ARTP-treated mutant clownfish
The comparison of gene expression levels between ARTP-treated mutant clownfish and wild-type clownfish revealed 883 differentially expressed genes (DEGs), including 254 upregulated genes and 629 downregulated genes (Figure 4A). A GO analysis showed that these DEGs were mainly enriched in C-C chemokine receptor activity (GO:0016493), chemokine binding (GO:0019956), chemokine receptor activity (GO:0004950), G-protein-coupled chemoattractant receptor activity (GO:0001637), cytokine receptor activity (GO:0004896), G-protein-coupled peptide receptor activity (GO:0008528), peptide receptor activity (GO:0001653), G-protein-coupled receptor activity (GO:0004930), transmembrane signaling receptor activity (GO:0004888), transmembrane receptor activity (GO:0099600), signaling receptor activity (GO:0038023), receptor activity (GO:0004872), signal transducer activity (GO:0004871), extracellular region part (GO:0044421), fibrillar collagen trimer (GO:0005583), banded collagen fibril (GO:0098643), complex of collagen trimers (GO:0098644), proteinaceous extracellular matrix (GO:0005578), etc. (Figure 4B; Table S13). The KEGG annotation results of the DEGs revealed the significant enrichment of several pathways, such as Cytokine–cytokine receptor interaction, Cell adhesion molecules (CAMs), Th17 cell differentiation, Protein digestion and absorption, Chemokine signaling pathway, ECM–receptor interaction, Fat digestion and absorption, Th1 and Th2 cell differentiation, Janus kinase (Jak)- signal transducer and activator of transcription (STAT) signaling pathway, Arachidonic acid metabolism, PI3K-Akt signaling pathway, Phagosome, etc. (Figure 4C; Table S13).
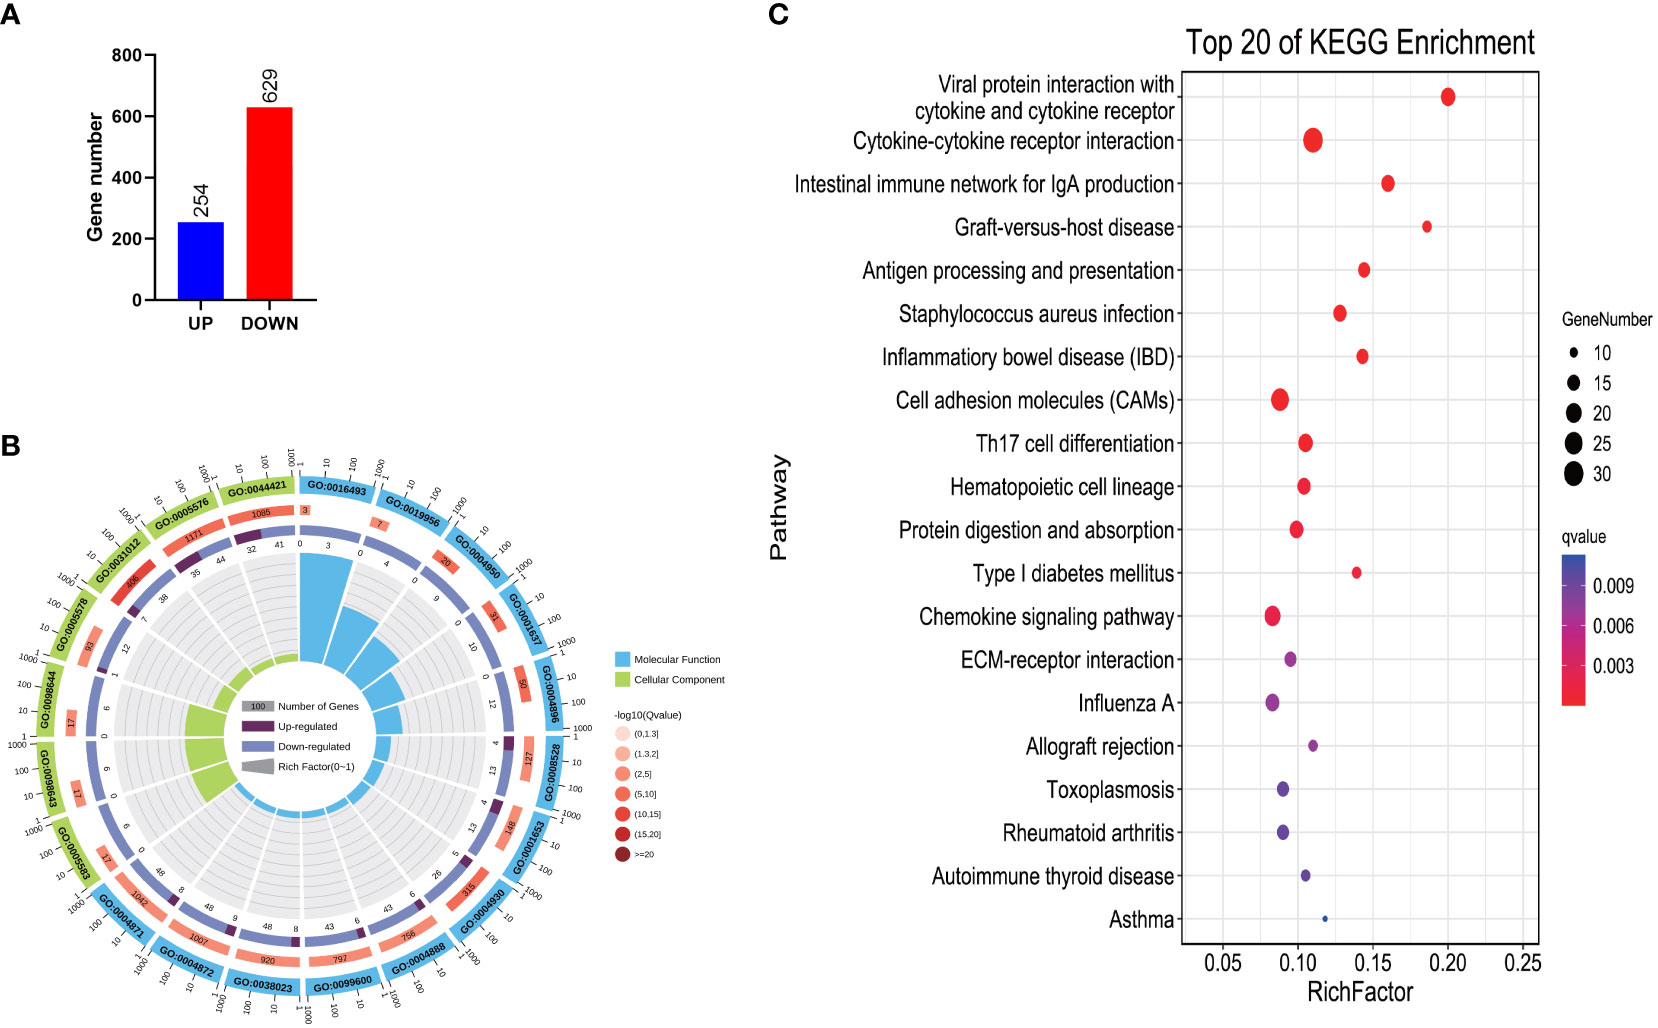
Figure 4 Number and functional annotation of DEGs between RW and RM. (A) Number of DEGs. (B) GO enrichment of DEGs. (C) KEGG enrichment of DEGs.
3.6 Analysis of the differentially expressed m6A-modified sites related to DEGs
To confirm whether these DEGs are regulated by m6A modification, we further analyzed the significantly different m6A modification peaks related with DEGs. The results showed that 7245 methylation modification peaks were changed and corresponded to 5233 genes in MeRIP-seq; 883 genes were significantly different in the RNA-seq data and intersected only 152 genes (Figures 5A, B). Based on their level of m6A modification and differential expression, we classified these genes into nine categories, as follows: type 1, containing 82 genes with 28 significantly different genes (downregulation in m6A modification, upregulation in RNA-seq); type 3, containing 96 genes, with 26 significantly different genes (upregulation in m6A modification, upregulation in RNA-seq); type 7, containing 174 genes, with 75 significantly different genes (downregulation in M6A modification, downregulation in RNA-seq); and type 9, with 152 genes, with 73 significantly different genes (upregulation in m6A modification, downregulation in RNA-seq) (Figure 5C). These four types involved a total of 202 significantly different m6A modification peaks and 152 related DEGs, suggesting that the expression of these genes was integratively regulated by multiple m6A modification peaks (both up- and downregulation) (Figure 5D; Table S14).
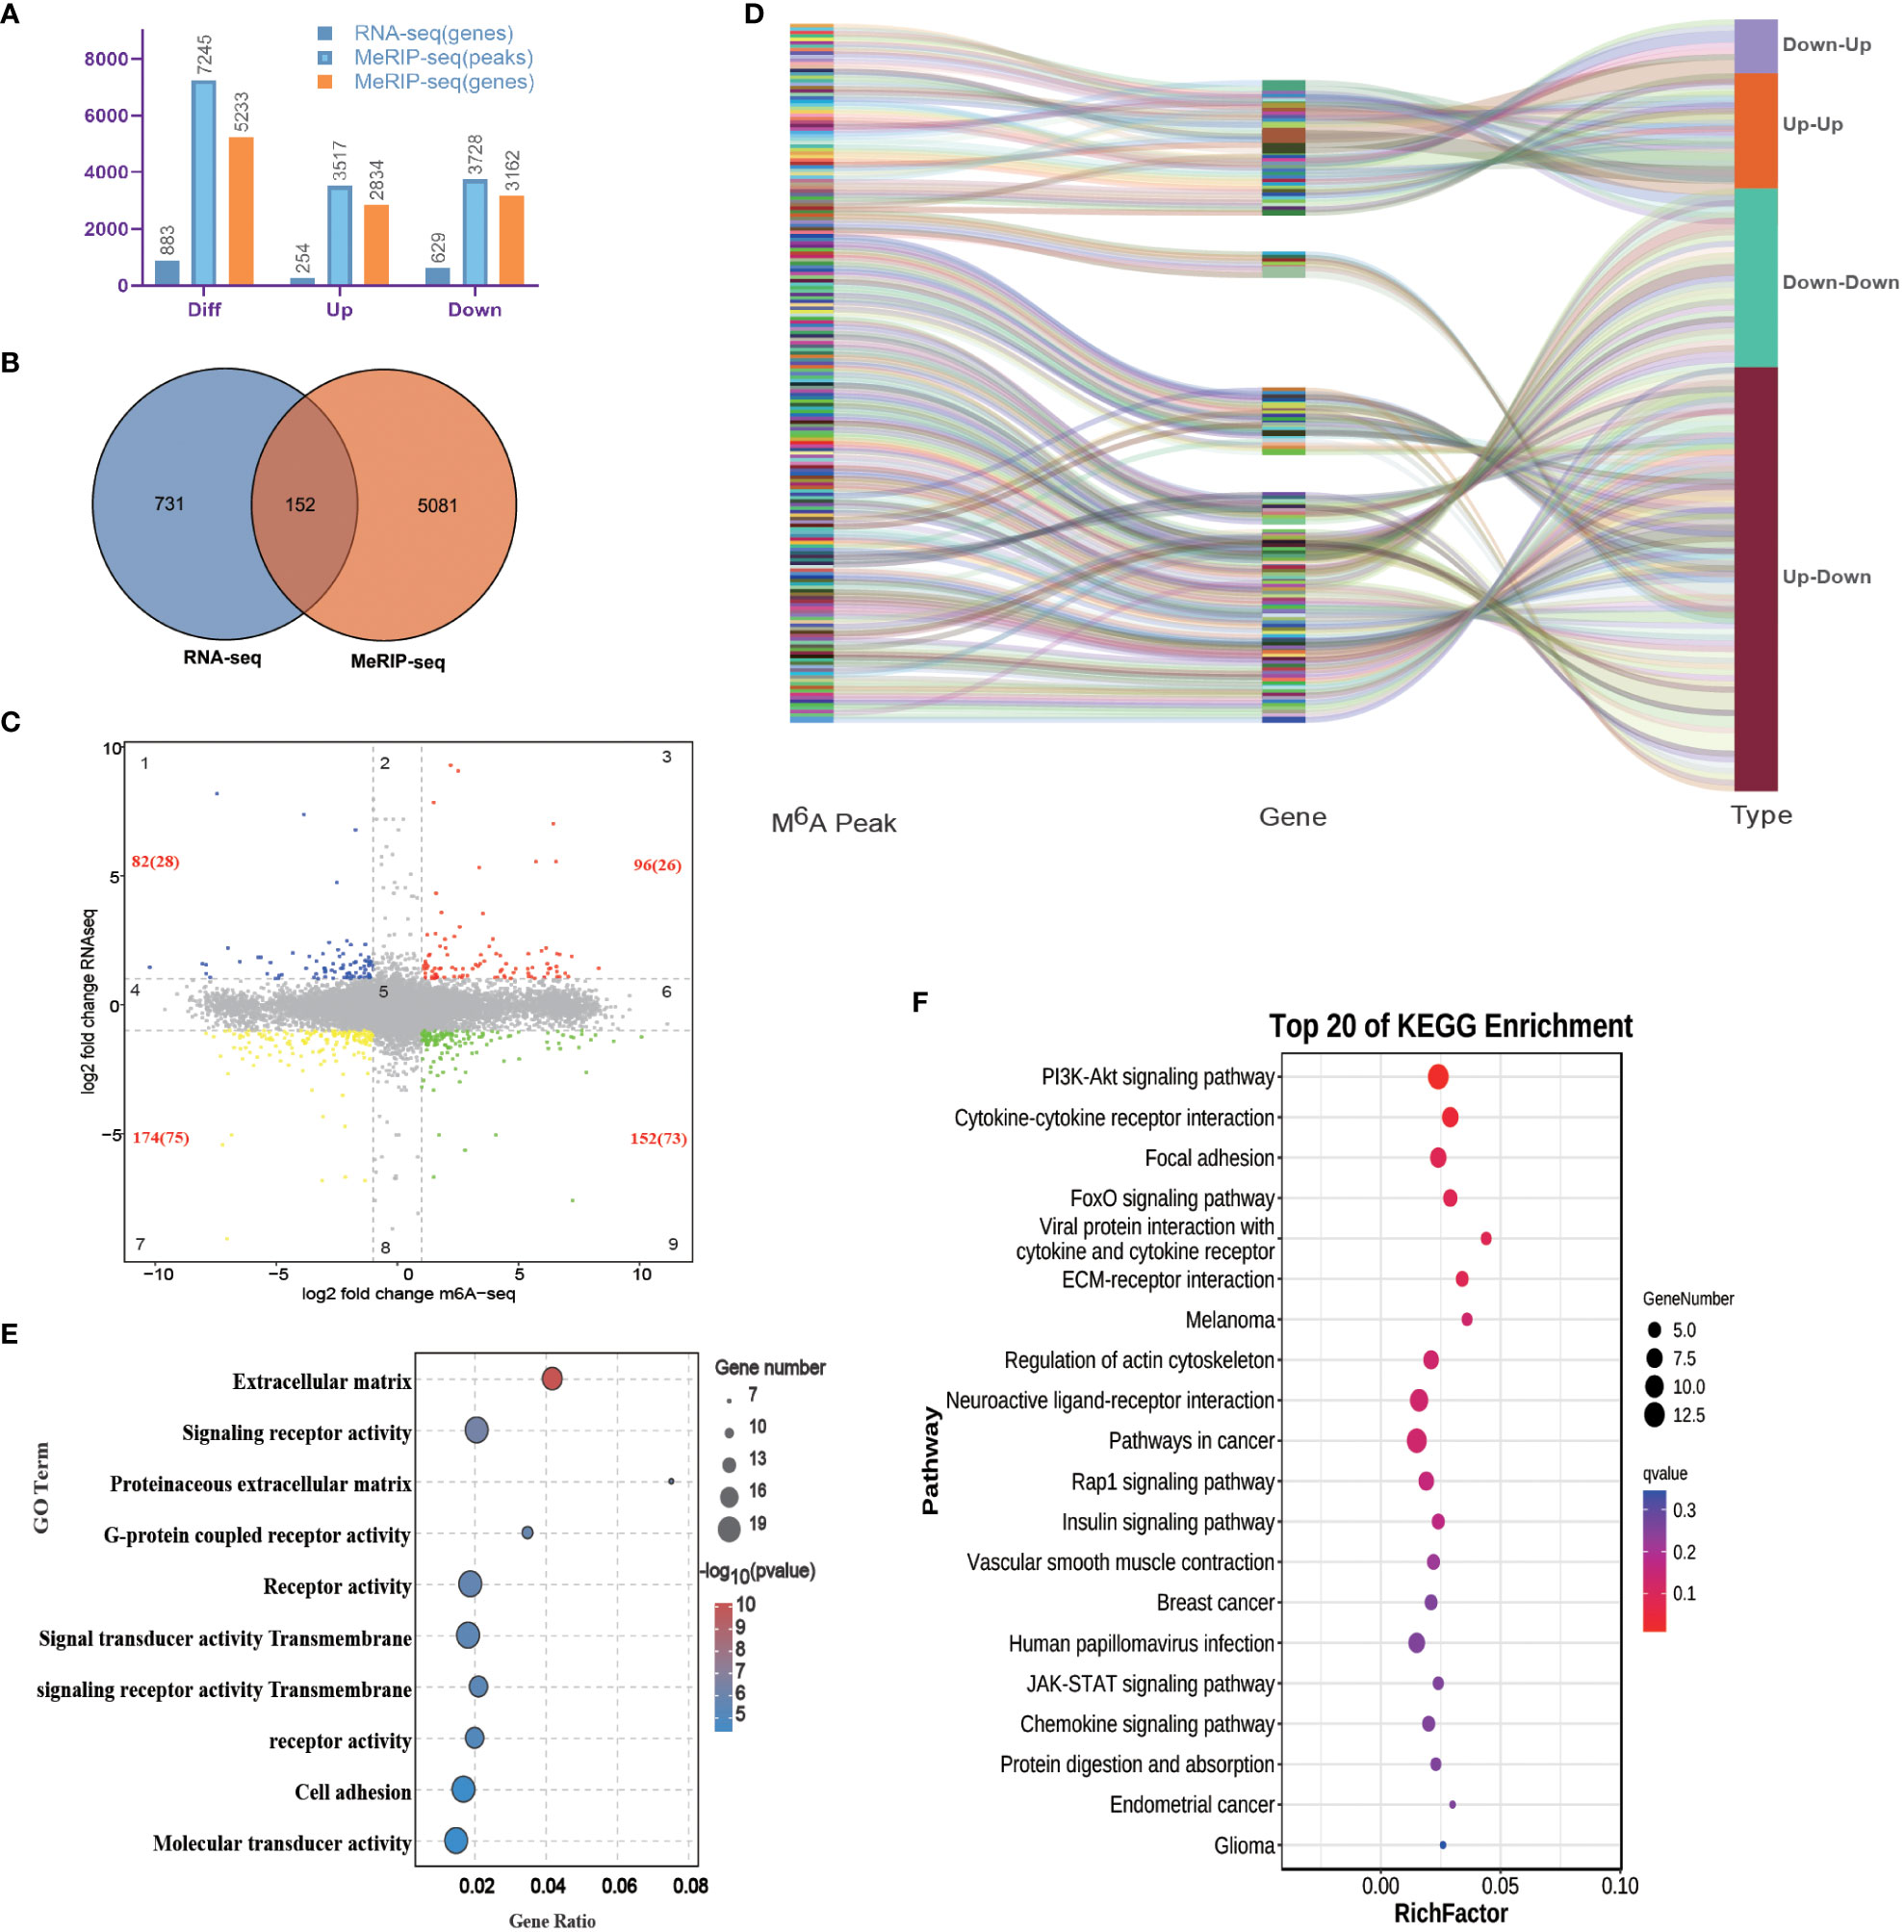
Figure 5 Analysis of differentially expressed M6A modification site-related DEGs. (A) Number of differentially expressed M6A modification sites and DEGs. (B) Venn diagram of differentially expressed M6A modification site-related genes and DEGs. (C) Nine quadrants diagram of differentially expressed M6A modification site-related genes and DEGs. The numbers in red indicate an interaction of differentially expressed M6A modification site-related genes and DEGs, and the numbers in parentheses indicate statistically significant differences. (D) Sankey diagram showing the relationship between differentially expressed M6A modification site-related genes and DEGs. (E) GO functional enrichment analysis of the interaction genes. (F) KEGG functional enrichment analysis of the interaction genes.
The GO enrichment analysis showed that the main GO terms that were enriched for the four types of DEGs included extracellular matrix, signaling receptor activity, proteinaceous extracellular matrix, G-protein-coupled receptor activity, signal transducer activity, etc. (Figure 5E). Based on the KEGG enrichment analysis, considerable enrichment was observed in several key pathways, including PI3K-Akt signaling pathway, Cytokine–cytokine receptor interaction, Focal adhesion, FoxO signaling pathway, Viral protein interaction with cytokine and cytokine receptor, ECM–receptor interaction, Melanoma, Regulation of actin cytoskeleton, Neuroactive ligand–receptor interaction, Rap1 signaling pathway, etc. (Figure 5F).
3.7 RNA-seq expression pattern and validation by qRT-PCR
To confirm the reliability of the RNA-seq data, seven genes were tested by qRT-PCR (Table S15). The results showed that the expression patterns of all genes were consistent with the RNA-seq data (Figure 6A). Among these genes, AMPOCE_00001902 and AMPOCE_00010931 are tyrosinase-related protein 1 (tyrp1) homology genes, which are regulated by DNA methylation and are involved in melanogenesis and pigment accumulation. Both genes exhibited lower M6A modification levels in MM vs. MW (Figures 6B, C).
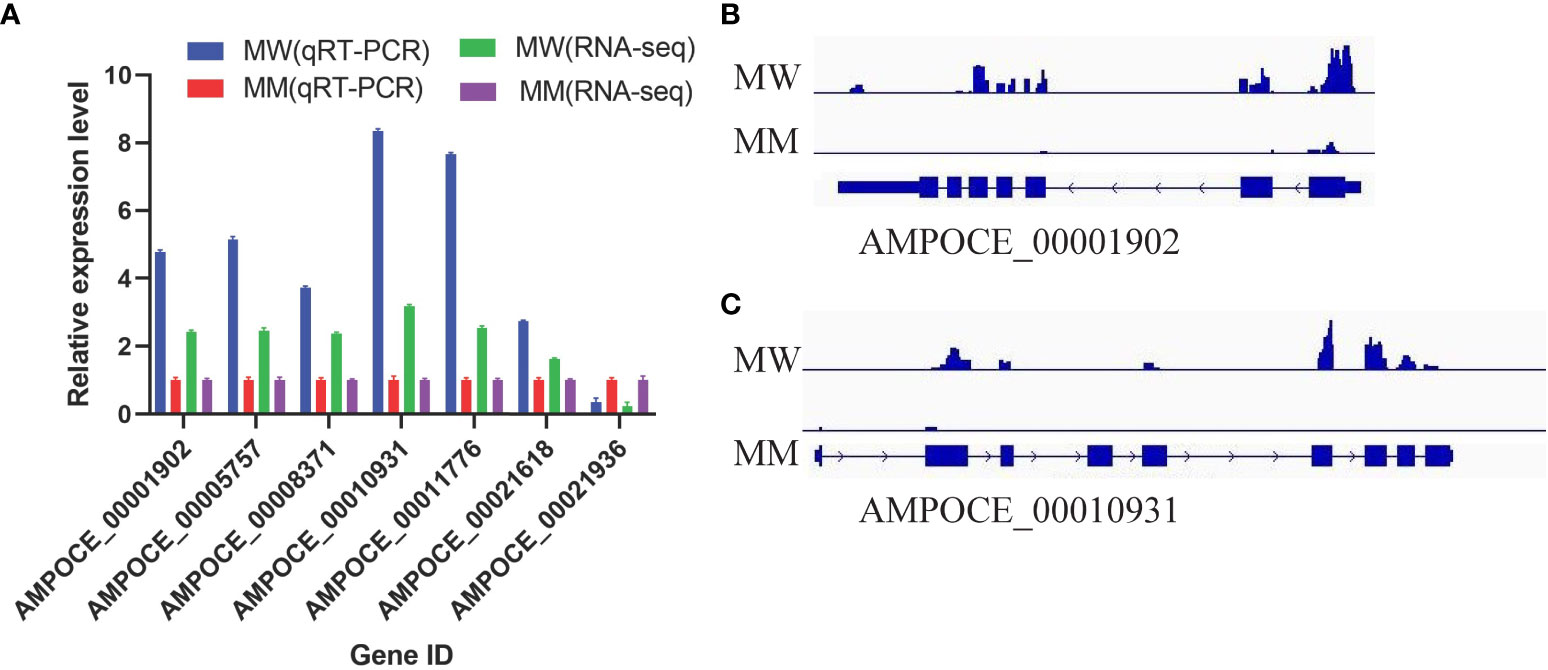
Figure 6 Validation of the RNA sequencing and qRT-PCR results in target genes. (A) Gene expression profile detected by RNA-seq and qRT-PCR. Three replicates were used for each gene, and the error bars represent the mean ± SE. (B) Schematic diagram of the m6A modification peaks of AMPOCE_00001902 in clownfish. (C) Schematic diagram of the m6A modification peaks of AMPOCE_00010931 in clownfish.
4 Discussion
Clownfish, or anemonefish, are a group of tropical reef fishes found in the warm waters of the Indian Ocean, Red Sea, and western Pacific Ocean. The most well-known species of clownfish is the ocellaris clownfish. Clownfish are commercially important because of their bright color, ornamental properties, and fast growth. To obtain additional mutants, black clownfish were treated by ARTP in this study, and red clownfish were identified among the offspring. A molecular evolutionary analysis of the COI gene further demonstrated that the mutated clownfish was clustered with ocellaris clownfish, which proves that the mutated clownfish is most likely derived from the ocellaris clownfish. Although the successful use of ARTP in Japanese flounder has been reported (Ji-Lun et al., 2019), our results further demonstrated the feasibility of using ARTP for mutagenic breeding in fish. In addition, the results of this study revealed that ARTP mutagenesis may lead to alterations in m6A methylation levels.
m6A methylation is a reversible dynamic modification that occurs in various species (Yue et al., 2019; Zhu et al., 2020; Oerum et al., 2021). Previous research has shown that m6A modifications affect mRNA transcription and regulate gene expression; our study further proved that m6A modification may related to skin color and the regulation of pigment accumulation in clownfish. In humans and mice, the m6A modification was mainly enriched around 3′ UTRs and stop codons (Dominissini et al., 2012; Meyer et al., 2012). Our study yielded similar results, especially around stop codons, which indicates that stop codons may also play a role as substrates for adenosine methylation and the epigenetic regulation of the clownfish mRNA. In addition, we found that, although the accumulation of reads was changed mainly around CDS and stop codons, both in MW and MM, the input control samples exhibited higher read accumulation levels in MM vs. MW (Figures 2B, C). This finding suggests that the genome-wide m6A modification level may increase in clownfish after ARTP mutagenesis. As it was previously reported that the m6A modification sites could be altered by environmental actors, our study suggests that ARTP may also play a role as an environmental factor that changes m6A modification sites.
In this study, we obtained abundant information about the changes of m6A modification sites, as well as about the functional distribution of genes associated with these sites, which is a complex issue. The major enriched pathways included the Notch signaling pathway, Focal adhesion, PI3K-Akt signaling pathway, etc. However, it remains difficult to conclude whether these m6A modification sites cause changes in gene expression levels and traits in clownfish. Interestingly, we screened for mutant material that exhibited skin color changes after ARTP treatment. To further determine the effect of these m6A modification sites on gene expression levels, we also performed high-throughput transcriptome sequencing of clownfish skin. We detected only 883 significant DEGs, whereas there were 5233 significant DEGs related to genes, indicating that some m6A modification sites may not regulate gene expression.
Interestingly, we identified 152 intersection genes between significant DEGs and significant m6A modification site-related genes. Among these genes, we found that the trend of m6A methylation modification was positively and/or negatively correlated with the expression trend of related genes. The trend of the final expression level of the gene may be the result of the combined effect of multiple m6A modification sites; whether some of these sites play a major role in regulating the gene expression level warrants further investigation.
In particular, the functional analysis of these DEGs showed that the significantly enriched pathways were mainly focused on the core PI3K-AKT signaling pathway and related pathways, such as upstream pathways, including Cytokine–cytokine receptor interaction, focal adhesion, ECM–receptor interaction, JAK-STAT signaling pathway; and downstream pathways, including the FoxO signaling pathway, Rap1 signaling pathway, etc. In the present study, we found that the mutated clownfish skin displayed color changes, which may be related to the accumulation of pigments. As reported previously, the PI3K-Akt signaling pathway is a complex and vast intracellular signaling pathway that regulates fundamental cellular functions, such as transcription, translation, proliferation, growth, and survival, in response to extracellular signals (Liu et al., 2015; Reilly et al., 2017; Yang et al., 2018). In turn, the PI3K-Akt signaling pathway is closely related to the accumulation of pigments. In humans, PI3K/AKT/mTOR signaling induces melanin degradation in human epidermal keratinocytes (Yang et al., 2018) and is involved in the regulation of the proliferation of retinal pigment epithelial cells (Cai et al., 2012; Li et al., 2021). In Oreolalax rhodostigmatus, the expression level of PI3K-Akt pathway-related genes increases according to the duration of light exposure and may facilitate rapid skin darkening (Zhu et al., 2018).
We found that the melanoma pathway appeared among the results of the KEGG enrichment analysis, which coincided with the mutation of skin color from black to red in clownfish. In this pathway, four genes, i.e., AMPOCE_00004523 (MAP2K1), AMPOCE_00015652 (GADD45A), AMPOCE_00029025 (IGF1), and AMPOCE_00033147 (FGF1), exhibited significant changes in methylation levels and expression levels; with the exception of AMPOCE_00015652 (GADD45A), the remaining three genes were also enriched in the PI3K-Akt signaling pathway, which suggests that the change of black skin may be regulated by the PI3K-Akt signaling pathway. In generally, the change in body color of clownfish from black to red may involve the accumulation of pigments in red and yellow pigment cells. However, we have not found any relevant information to prove this speculation at this time.
Interestingly, we found that the skin color changes observed in clownfish were not overall or irregular; rather, they exhibited regular changes in specific regions, which may be related to the expression of homeobox genes. Among the DEGs identified here, we also found two homeobox-protein-encoding genes, EMX2 (AMPOCE_00003845) and MEOX2 (AMPOCE_00020016). EMX2 may participate in pattern formation by specifying positional information in the adult newt limb (Beauchemin et al., 1998), whereas MEOX2 can suppress epithelial cell proliferation and endothelial cell activation and regulate smooth muscle cell migration and integrin expression (Witzenbichler et al., 1999; Gorski and Leal, 2003; Liu et al., 2015). Whether EMX2 and MEOX2 are involved in determining skin color at specific regions of clownfish warrants further investigation.
Finally, this type of study is challenging because clownfish exhibit various color patterns according to age, sex, and the environment.
5 Conclusion
In this study, we used ARTP treatment to obtain mutated individuals exhibiting a skin color change from black to red. Moreover, using whole-genome sequencing of the m6A methylation modification in these mutants, we obtained the fingerprint map of whole-genome m6A methylation modification. To prove that m6A methylation modifies clownfish skin color through the regulation of the expression of genes, we further analyzed gene expression profiles by RNA-seq; the results showed that the accumulation of melanin in clownfish skin may be regulated by the PI3K-Akt signal transduction pathway. In summary, the findings of this study lay a foundation for further analysis of the molecular mechanisms associated with m6A methylation and skin color, and provide targets for molecular breeding in clownfish.
Data availability statement
The datasets presented in this study can be found in online repositories. The names of the repository/repositories and accession number(s) can be found in the article/Supplementary Material.
Ethics statement
The animal study was reviewed and approved by Animal Ethical and Welfare Committee of Aquatic disease control center of Fujian.
Author contributions
L-BH conceived and designed the study. L-BH and H-YL collected the data. L-BH and H-YL performed the RNA-Seq and m6A methylome analysis. L-BH and L-YZ wrote the manuscript. All authors read, edited, and approved the final manuscript for submission.
Funding
This work was supported by the Special Fund for Marine and Fishery Structural Adjustement from Finance Department of Fujian Province (2019HYJG11) and the Science and Technology Plan Special Funding of Fujian Province (2021R1013001).
Acknowledgments
The authors are grateful to Dr. Minshan Sun and Henan Assist Research Biotechnology Co., Ltd (Zhengzhou, China) for assisting in bioinformatics analysis and the English language editing of this manuscript.
Conflict of interest
The authors declare that the research was conducted in the absence of any commercial or financial relationships that could be construed as a potential conflict of interest.
Publisher’s note
All claims expressed in this article are solely those of the authors and do not necessarily represent those of their affiliated organizations, or those of the publisher, the editors and the reviewers. Any product that may be evaluated in this article, or claim that may be made by its manufacturer, is not guaranteed or endorsed by the publisher.
Supplementary material
The Supplementary Material for this article can be found online at: https://www.frontiersin.org/articles/10.3389/fmars.2023.1173215/full#supplementary-material
Supplementary Table 1 | Mapping of rRNA in MeRIP-seq.
Supplementary Table 2 | MeRIP-seq data statistics.
Supplementary Table 3 | Statistical analysis of peak number. FRiP: Fraction of reads in peaks.
Supplementary Table 4 | The information of m6A peaks in MW and MM.
Supplementary Table 5 | The conserved motif search using the DREME ankinasd MEME software.
Supplementary Table 6 | The annotation of m6A peaks relation genes in MW and MM.
Supplementary Table 7 | The list of m6A peaks only detected in MM.
Supplementary Table 8 | The GO and KEGG enrichment of m6A peaks only detected in MM relate genes.
Supplementary Table 9 | The list of different m6A modification sites and related genes between MW and MM.
Supplementary Table 10 | The GO and KEGG enrichment of different m6A modification sites related genes between MW and MM.
Supplementary Table 11 | RNA-seq data mapping of rRNA statistics.
Supplementary Table 12 | RNA-seq data statistics.
Supplementary Table 13 | The GO and KEGG enrichment of DEGs between RW and RM.
Supplementary Table 14 | The intersection gene list of DEGs and different m6A modification site related genes.
Supplementary Table 15 | The primers list.
References
Ashburner M., Ball C. A., Blake J. A., Botstein D., Butler H., Cherry J. M., et al. (2000). Gene ontology: tool for the unification of biology. the gene ontology consortium. Nat. Genet. 25, 25–29. doi: 10.1038/75556
Bailey T. L., Boden M., Buske F. A., Frith M., Grant C. E., Clementi L., et al. (2009). MEME SUITE: tools for motif discovery and searching. Nucleic Acids Res. 37, W202–W208. doi: 10.1093/nar/gkp335
Barbieri I., Tzelepis K., Pandolfini L., Shi J., Millan-Zambrano G., Robson S. C., et al. (2017). Promoter-bound METTL3 maintains myeloid leukaemia by m(6)A-dependent translation control. Nature 552, 126–131. doi: 10.1038/nature24678
Bartosovic M., Molares H. C., Gregorova P., Hrossova D., Kudla G., Vanacova S. (2017). N6-methyladenosine demethylase FTO targets pre-mRNAs and regulates alternative splicing and 3'-end processing. Nucleic Acids Res. 45, 11356–11370. doi: 10.1093/nar/gkx778
Beauchemin M., Del Rio-Tsonis K., Tsonis P. A., Tremblay M., Savard P. (1998). Graded expression of emx-2 in the adult newt limb and its corresponding regeneration blastema. J. Mol. Biol. 279, 501–511. doi: 10.1006/jmbi.1998.1782
Boyle E. I., Weng S., Gollub J., Jin H., Botstein D., Cherry J. M., et al. (2004). GO::TermFinder–open source software for accessing gene ontology information and finding significantly enriched gene ontology terms associated with a list of genes. Bioinformatics 20, 3710–3715. doi: 10.1093/bioinformatics/bth456
Cai N., Dai S. D., Liu N. N., Liu L. M., Zhao N., Chen L. (2012). PI3K/AKT/mTOR signaling pathway inhibitors in proliferation of retinal pigment epithelial cells. Int. J. Ophthalmol. 5, 675–680. doi: 10.3980/j.issn.2222-3959.2012.06.05
Chen S., Zhou Y., Chen Y., Gu J. (2018). Fastp: an ultra-fast all-in-one FASTQ preprocessor. Bioinformatics 34, i884–i890. doi: 10.1093/bioinformatics/bty560
Dominissini D., Moshitch-Moshkovitz S., Schwartz S., Salmon-Divon M., Ungar L., Osenberg S., et al. (2012). Topology of the human and mouse m6A RNA methylomes revealed by m6A-seq. Nature 485, 201–206. doi: 10.1038/nature11112
Elliott J. K., Lougheed S. C., Bateman B., Mcphee L. K., Boag P. T. (1999). Molecular phylogenetic evidence for the evolution of specialization in anemonefishes. Proc. Biol. Sci. 266, 677–685. doi: 10.1098/rspb.1999.0689
Feeney W. E., Brooker R. M. (2017). Anemonefishes. Curr. Biol. 27, R6–R8. doi: 10.1016/j.cub.2016.07.046
Felsenstein J. (1985). CONFIDENCE LIMITS ON PHYLOGENIES: AN APPROACH USING THE BOOTSTRAP. Evolution 39, No. doi: 10.2307/2408678
Franco-Belussi L., Nilsson Sköld H., De Oliveira C. (2016). Internal pigment cells respond to external UV radiation in frogs. J. Exp. Biol. 219, 1378–1383. doi: 10.1242/jeb.134973
Frye M., Harada B. T., Behm M., He C. (2018). RNA Modifications modulate gene expression during development. Science 361, 1346–1349. doi: 10.1126/science.aau1646
Gorski D. H., Leal A. J. (2003). Inhibition of endothelial cell activation by the homeobox gene gax. J. Surg. Res. 111, 91–99. doi: 10.1016/S0022-4804(03)00042-8
He L. B., Wu S. Q., Luo H. Y., Zheng L. Y. (2020). The complete mitochondrial genome of the Picasso clownfish: genomic comparisons and phylogenetic inference among amphiprioninae. Mitochondrial DNA B Resour 5, 2990–2991. doi: 10.1080/23802359.2020.1797554
Hu X., Li J., Liu M. (2016). Complete mitochondrial genome of the pink clownfish amphiprion perideraion (Pisces: perciformes, pomacentridae). Mitochondrial DNA A DNA Mapp Seq Anal. 27, 1135–1136. doi: 10.3109/19401736.2014.933336
James Cooper W., Smith L. L., Westneat M. W. (2009). Exploring the radiation of a diverse reef fish family: phylogenetics of the damselfishes (Pomacentridae), with new classifications based on molecular analyses of all genera. Mol. Phylogenet Evol. 52, 1–16. doi: 10.1016/j.ympev.2008.12.010
Ji-Lun H., Xiao-Yan Z., Gui-Xing W., Zhao-Hui S., Wei D., Ya-Xian Z., et al. (2019). Novel breeding approach for Japanese flounder using atmosphere and room temperature plasma mutagenesis tool. BMC Genomics 20, 323. doi: 10.1186/s12864-019-5681-6
Kanehisa M., Goto S. (2000). KEGG: kyoto encyclopedia of genes and genomes. Nucleic Acids Res. 28, 27–30. doi: 10.1093/nar/28.1.27
Kim D., Langmead B., Salzberg S. L. (2015). HISAT: a fast spliced aligner with low memory requirements. Nat. Methods 12, 357–360. doi: 10.1038/nmeth.3317
Klungland A., Dahl J. A., Greggains G., Fedorcsak P., Filipczyk A. (2016). Reversible RNA modifications in meiosis and pluripotency. Nat. Methods 14, 18–22. doi: 10.1038/nmeth.4111
Kodym A., Afza R. (2003). Physical and chemical mutagenesis. Methods Mol. Biol. 236, 189–204. doi: 10.1385/1-59259-413-1:189
Kumar S., Stecher G., Tamura K. (2016). MEGA7: molecular evolutionary genetics analysis version 7.0 for bigger datasets. Mol. Biol. Evol. 33, 1870–1874. doi: 10.1093/molbev/msw054
Langmead B., Salzberg S. L. (2012). Fast gapped-read alignment with bowtie 2. Nat. Methods 9, 357–359. doi: 10.1038/nmeth.1923
Lence T., Soller M., Roignant J. Y. (2017). A fly view on the roles and mechanisms of the m(6)A mRNA modification and its players. RNA Biol. 14, 1232–1240. doi: 10.1080/15476286.2017.1307484
Li J., Chen X., Kang B., Liu M. (2015). Mitochondrial DNA genomes organization and phylogenetic relationships analysis of eight anemonefishes (pomacentridae: amphiprioninae). PLoS One 10, e0123894. doi: 10.1371/journal.pone.0123894
Li Y., Jiang J., Yang J., Xiao L., Hua Q., Zou Y. (2021). PI3K/AKT/mTOR signaling participates in insulin-mediated regulation of pathological myopia-related factors in retinal pigment epithelial cells. BMC Ophthalmol. 21, 218. doi: 10.1186/s12886-021-01946-y
Liu P., Kong F., Wang J., Lu Q., Xu H., Qi T., et al. (2015). Involvement of IGF-1 and MEOX2 in PI3K/Akt1/2 and ERK1/2 pathways mediated proliferation and differentiation of perivascular adipocytes. Exp. Cell Res. 331, 82–96. doi: 10.1016/j.yexcr.2014.09.011
Love M. I., Huber W., Anders S. (2014). Moderated estimation of fold change and dispersion for RNA-seq data with DESeq2. Genome Biol. 15, 550. doi: 10.1186/s13059-014-0550-8
Luo G. Z., Macqueen A., Zheng G., Duan H., Dore L. C., Lu Z., et al. (2014). Unique features of the m6A methylome in arabidopsis thaliana. Nat. Commun. 5, 5630. doi: 10.1038/ncomms6630
Luo M. J., Zhao Y. X., Song W., Zhao J. R. (2016). Effects on maize seed and pollen germination by atmospheric and room temperature plasma. Mol. Plant Breed. 14, 1262–1267.
Malla S., Melguizo-Sanchis D., Aguilo F. (2019). Steering pluripotency and differentiation with N(6)-methyladenosine RNA modification. Biochim. Biophys. Acta Gene Regul. Mech. 1862, 394–402. doi: 10.1016/j.bbagrm.2018.10.013
Meng J., Lu Z., Liu H., Zhang L., Zhang S., Chen Y., et al. (2014). A protocol for RNA methylation differential analysis with MeRIP-seq data and exomePeak R/Bioconductor package. Methods 69, 274–281. doi: 10.1016/j.ymeth.2014.06.008
Meyer K. D., Saletore Y., Zumbo P., Elemento O., Mason C. E., Jaffrey S. R. (2012). Comprehensive analysis of mRNA methylation reveals enrichment in 3' UTRs and near stop codons. Cell 149, 1635–1646. doi: 10.1016/j.cell.2012.05.003
Oerum S., Meynier V., Catala M., Tisne C. (2021). A comprehensive review of m6A/m6Am RNA methyltransferase structures. Nucleic Acids Res. 49, 7239–7255. doi: 10.1093/nar/gkab378
Ottenheim C., Nawrath M., Wu J. C. (2018). Microbial mutagenesis by atmospheric and room-temperature plasma (ARTP): the latest development. Bioresources Bioprocessing 5, 12. doi: 10.1186/s40643-018-0200-1
Pertea M., Kim D., Pertea G. M., Leek J. T., Salzberg S. L. (2016). Transcript-level expression analysis of RNA-seq experiments with HISAT, StringTie and ballgown. Nat. Protoc. 11, 1650–1667. doi: 10.1038/nprot.2016.095
Rao X., Huang X., Zhou Z., Lin X. (2013). An improvement of the 2^(-delta delta CT) method for quantitative real-time polymerase chain reaction data analysis. Biostat Bioinforma Biomath 3, 71–85.
Reilly R., Mroz M. S., Dempsey E., Wynne K., Keely S. J., Mckone E. F., et al. (2017). Targeting the PI3K/Akt/mTOR signalling pathway in cystic fibrosis. Sci. Rep. 7, 7642. doi: 10.1038/s41598-017-06588-z
Roundtree I. A., Evans M. E., Pan T., He C. (2017). Dynamic RNA modifications in gene expression regulation. Cell 169, 1187–1200. doi: 10.1016/j.cell.2017.05.045
Roundtree I. A., He C. (2016). Nuclear m(6)A reader YTHDC1 regulates mRNA splicing. Trends Genet. 32, 320–321. doi: 10.1016/j.tig.2016.03.006
Santini S., Polacco G. (2006). Finding nemo: molecular phylogeny and evolution of the unusual life style of anemonefish. Gene 385, 19–27. doi: 10.1016/j.gene.2006.03.028
Tan M. H., Austin C. M., Hammer M. P., Lee Y. P., Croft L. J., Gan H. M. (2018). Finding nemo: hybrid assembly with Oxford nanopore and illumina reads greatly improves the clownfish (Amphiprion ocellaris) genome assembly. Gigascience 7, 1–6. doi: 10.1093/gigascience/gix137
Timm J., Figiel M., Kochzius M. (2008). Contrasting patterns in species boundaries and evolution of anemonefishes (Amphiprioninae, pomacentridae) in the centre of marine biodiversity. Mol. Phylogenet Evol. 49, 268–276. doi: 10.1016/j.ympev.2008.04.024
Vu L. P., Pickering B. F., Cheng Y., Zaccara S., Nguyen D., Minuesa G., et al. (2017). The N(6)-methyladenosine (m(6)A)-forming enzyme METTL3 controls myeloid differentiation of normal hematopoietic and leukemia cells. Nat. Med. 23, 1369–1376. doi: 10.1038/nm.4416
Wang X., Zhao B. S., Roundtree I. A., Lu Z., Han D., Ma H., et al. (2015). N(6)-methyladenosine modulates messenger RNA translation efficiency. Cell 161, 1388–1399. doi: 10.1016/j.cell.2015.05.014
Witzenbichler B., Kureishi Y., Luo Z., Le Roux A., Branellec D., Walsh K. (1999). Regulation of smooth muscle cell migration and integrin expression by the gax transcription factor. J. Clin. Invest. 104, 1469–1480. doi: 10.1172/JCI7251
Yang Z., Zeng B., Pan Y., Huang P., Wang C. (2018). Autophagy participates in isoliquiritigenin-induced melanin degradation in human epidermal keratinocytes through PI3K/AKT/mTOR signaling. BioMed. Pharmacother. 97, 248–254. doi: 10.1016/j.biopha.2017.10.070
Ye L., Hu J., Wu K., Wang Y., Li J. (2016). Mitochondrial genome of the tomato clownfish amphiprion frenatus (Pomacentridae, amphiprioninae). Mitochondrial DNA A DNA Mapp Seq Anal. 27, 1131–1132. doi: 10.3109/19401736.2014.933334
Yue H., Nie X., Yan Z., Weining S. (2019). N6-methyladenosine regulatory machinery in plants: composition, function and evolution. Plant Biotechnol. J. 17, 1194–1208. doi: 10.1111/pbi.13149
Zhang X., Zhang X. F., Li H. P., Wang L. Y., Zhang C., Xing X. H., et al. (2014). Atmospheric and room temperature plasma (ARTP) as a new powerful mutagenesis tool. Appl. Microbiol. Biotechnol. 98, 5387–5396. doi: 10.1007/s00253-014-5755-y
Zhao B. S., Roundtree I. A., He C. (2017). Post-transcriptional gene regulation by mRNA modifications. Nat. Rev. Mol. Cell Biol. 18, 31–42. doi: 10.1038/nrm.2016.132
Zhao S., Xiong Z., Mao X., Meng D., Lei Q., Li Y., et al. (2013). Atmospheric pressure room temperature plasma jets facilitate oxidative and nitrative stress and lead to endoplasmic reticulum stress dependent apoptosis in HepG2 cells. PLoS One 8, e73665. doi: 10.1371/journal.pone.0073665
Zhao X. T., Xu Y., Lyu M., Pu T. F., Wang L. Y., Li M. J. (2019). Biological effect of ARTP irradiation on mutagenesis of coreopsis tinctoria nutt. J. Henan Normal Univ. (Natural Sci. Edition) 47, 99–104.
Zhou J., Wan J., Gao X., Zhang X., Jaffrey S. R., Qian S. B. (2015). Dynamic m(6)A mRNA methylation directs translational control of heat shock response. Nature 526, 591–594. doi: 10.1038/nature15377
Zhu Z. M., Huo F. C., Pei D. S. (2020). Function and evolution of RNA N6-methyladenosine modification. Int. J. Biol. Sci. 16, 1929–1940. doi: 10.7150/ijbs.45231
Zhu W., Liu L., Wang X., Gao X., Jiang J., Wang B. (2018). Transcriptomics reveals the molecular processes of light-induced rapid darkening of the non-obligate cave dweller oreolalax rhodostigmatus (Megophryidae, anura) and their genetic basis of pigmentation strategy. BMC Genomics 19, 422. doi: 10.1186/s12864-018-4790-y
Keywords: atmosphere and room temperature plasma, m6A, MeRIP-seq, mutagenesis, skin color, breeding, clownfish
Citation: He L-B, Luo H-Y and Zheng L-Y (2023) Atmosphere and room temperature plasma alters the m6A methylome profiles and regulates gene expression associated with color mutation in clownfish (Amphiprion ocellaris). Front. Mar. Sci. 10:1173215. doi: 10.3389/fmars.2023.1173215
Received: 24 February 2023; Accepted: 31 May 2023;
Published: 09 June 2023.
Edited by:
Kai Zhang, Chinese Academy of Fishery Sciences, ChinaCopyright © 2023 He, Luo and Zheng. This is an open-access article distributed under the terms of the Creative Commons Attribution License (CC BY). The use, distribution or reproduction in other forums is permitted, provided the original author(s) and the copyright owner(s) are credited and that the original publication in this journal is cited, in accordance with accepted academic practice. No use, distribution or reproduction is permitted which does not comply with these terms.
*Correspondence: Li-Bin He, NjcwMTcwNDQyQHFxLmNvbQ==