 Lucy S. Vlietstra
 Kayla R. Hinrichs2
 Alexandra Darden
 Matthew Martino
95% of researchers rate our articles as excellent or good
Learn more about the work of our research integrity team to safeguard the quality of each article we publish.
Find out more
ORIGINAL RESEARCH article
Front. Mar. Sci. , 29 June 2023
Sec. Ocean Observation
Volume 10 - 2023 | https://doi.org/10.3389/fmars.2023.1171958
This article is part of the Research Topic The State of Knowledge from Operational Ice Service Perspectives: Previous and Future Mandates View all 12 articles
Surface atmospheric temperatures over the Arctic Ocean are rising faster than the global average, and sea-ice coverage has declined, making some areas newly accessible to ocean-going ships. Even so, Arctic waters remain hazardous to ships, in part, because of the highly variable nature of sea-ice formation and drift in some areas. In this study, we investigated interannual variability in polar class (PC) ship accessibility in the northern Bering Sea and seas north of the Bering Strait (East Siberian, Chukchi, Beaufort) from February 2012 to February 2022. We used sea-ice charts from the U.S. National Ice Center and calculations of the Risk Index Outcome (RIO) for PC3, PC5, and PC7 ships to characterize spatiotemporal trends in PC ship accessibility during the months of February, June, September, and November over the last 10 to 11 years. We also characterized shipping activity on select days in 2021. Overall, PC ship accessibility during the months of February and June increased over the last decade, especially for PC7 ships. However, areas that became more accessible over time did not support heavy ship traffic, possibly because they were not located on preferred transit routes or because they were surrounded by unnavigable ice, which made them inaccessible in practice. Ship accessibility was highly variable in the northernmost, offshore regions of the study site. During June, PC7 ship accessibility was interannually variable in waters south of the Bering Strait, and ships were active in those regions (most were fishing vessels), indicating potentially hazardous conditions during this time of year. Accessibility was considerably less variable over space and time (months, years) for PC5 (ice capable) ships and for PC3 ships (heavy icebreakers). Information from this study can be used by PC ship operators planning safe and successful shipping routes and by coastal states preparing emergency services to protect the maritime community. As governments and the private sector build out fleets of ice-capable ships, knowledge of interannual variability in ship accessibility will also help planners match PC ship capabilities to mission requirements.
Surface atmospheric temperatures over the Arctic Ocean are rising 2−8 times faster than average global temperatures, driving pronounced declines in sea-ice coverage in recent decades (Meier, 2017; Stroeve and Notz, 2018; Årthun et al., 2021; Isaksen et al., 2022). Sea-ice declines are making some areas of the Arctic Ocean more accessible to ocean-going vessels, and ship traffic in the region has increased (Aksenov et al., 2017; PAME, 2020; Gunnarsson, 2021; Gunnarsson and Moe, 2021; PAME, 2021; Min et al., 2021). From 2013 to 2019, for example, the number of ships operating in the Arctic Ocean as defined by the International Code for Ships Operating in Polar Waters [Polar Code, International Maritime Organization (2017)] increased by 25%, and the distance sailed increased by 75% (PAME, 2020).
Expanding Arctic maritime traffic has prompted growing concern over risks to maritime transportation systems and mariner safety as shipping in the region remains dangerous, even for ice-strengthened ships (Marchenko et al., 2018; Vanhatalo et al., 2021). Among the hazards is the highly variable nature of sea-ice development and drift (Stephenson et al., 2013). Not only are changes occurring in the amount of sea-ice coverage over the Arctic Ocean as a whole, but smaller-scale processes, such as sea-ice formation and advection by surface currents, promote significant variability in ice concentration and thickness over local and regional spatial scales (Eicken, 2013; Meier, 2017).
Challenges that variable sea-ice conditions pose to vessel operators in the modern day are underscored by recent incidents of ships becoming beset in sea ice during Arctic operations (Kubat et al., 2013; Kubat et al., 2015). For example, more than 58 besetting incidents took place on the Northern Sea Route between 2013 and 2017 (Vanhatalo et al., 2021). In 2021, at least 18 ships were beset on the Northern Sea Route during the month of November alone. Some were frozen for weeks and required icebreaker support before they could resume their voyage (Bennetts, 2021).
Most ships have specific design limitations that restrict safe operation to open, ice-free water or, in the case of polar class (PC) ships, to ice of a certain concentration and thickness. Understanding where sea-ice conditions permit navigation for certain ships and the extent to which ice conditions are consistent (predictable) from month-to-month and year-to-year is critical for safe and efficient maritime transportation and operational planning, especially route planning for multi-day voyages or transits. Such awareness is also important for fleet managers, who need to understand operational conditions if they are to ensure sufficient ship design and capability requirements for newly built ships.
In this study, we characterize interannual variability in ship accessibility relating to sea-ice conditions in a 3.6 million km2 region of the Arctic Ocean encompassing the northern Bering Sea, Chukchi Sea, western Beaufort Sea, and East Siberian Sea (Figure 1). The region includes the Bering Sea north of the Pribilof Islands and the Bering Strait, which serves as a chokepoint for vessel entry into the Arctic region. The region also supports a growing volume of commercial maritime traffic, a trend that is projected to continue with the ongoing decline in sea-ice coverage (U.S. Committee on the Marine Transportation System, 2019). Specifically, we address the following questions:
(1) How has the area accessible to PC ships within the study site changed over the last decade?
(2) When and where is interannual variability in PC ship accessibility the greatest?
(3) To what extent do ships (PC and other vessels) currently operate in newly accessible areas or areas with high interannual variability in ship accessibility?
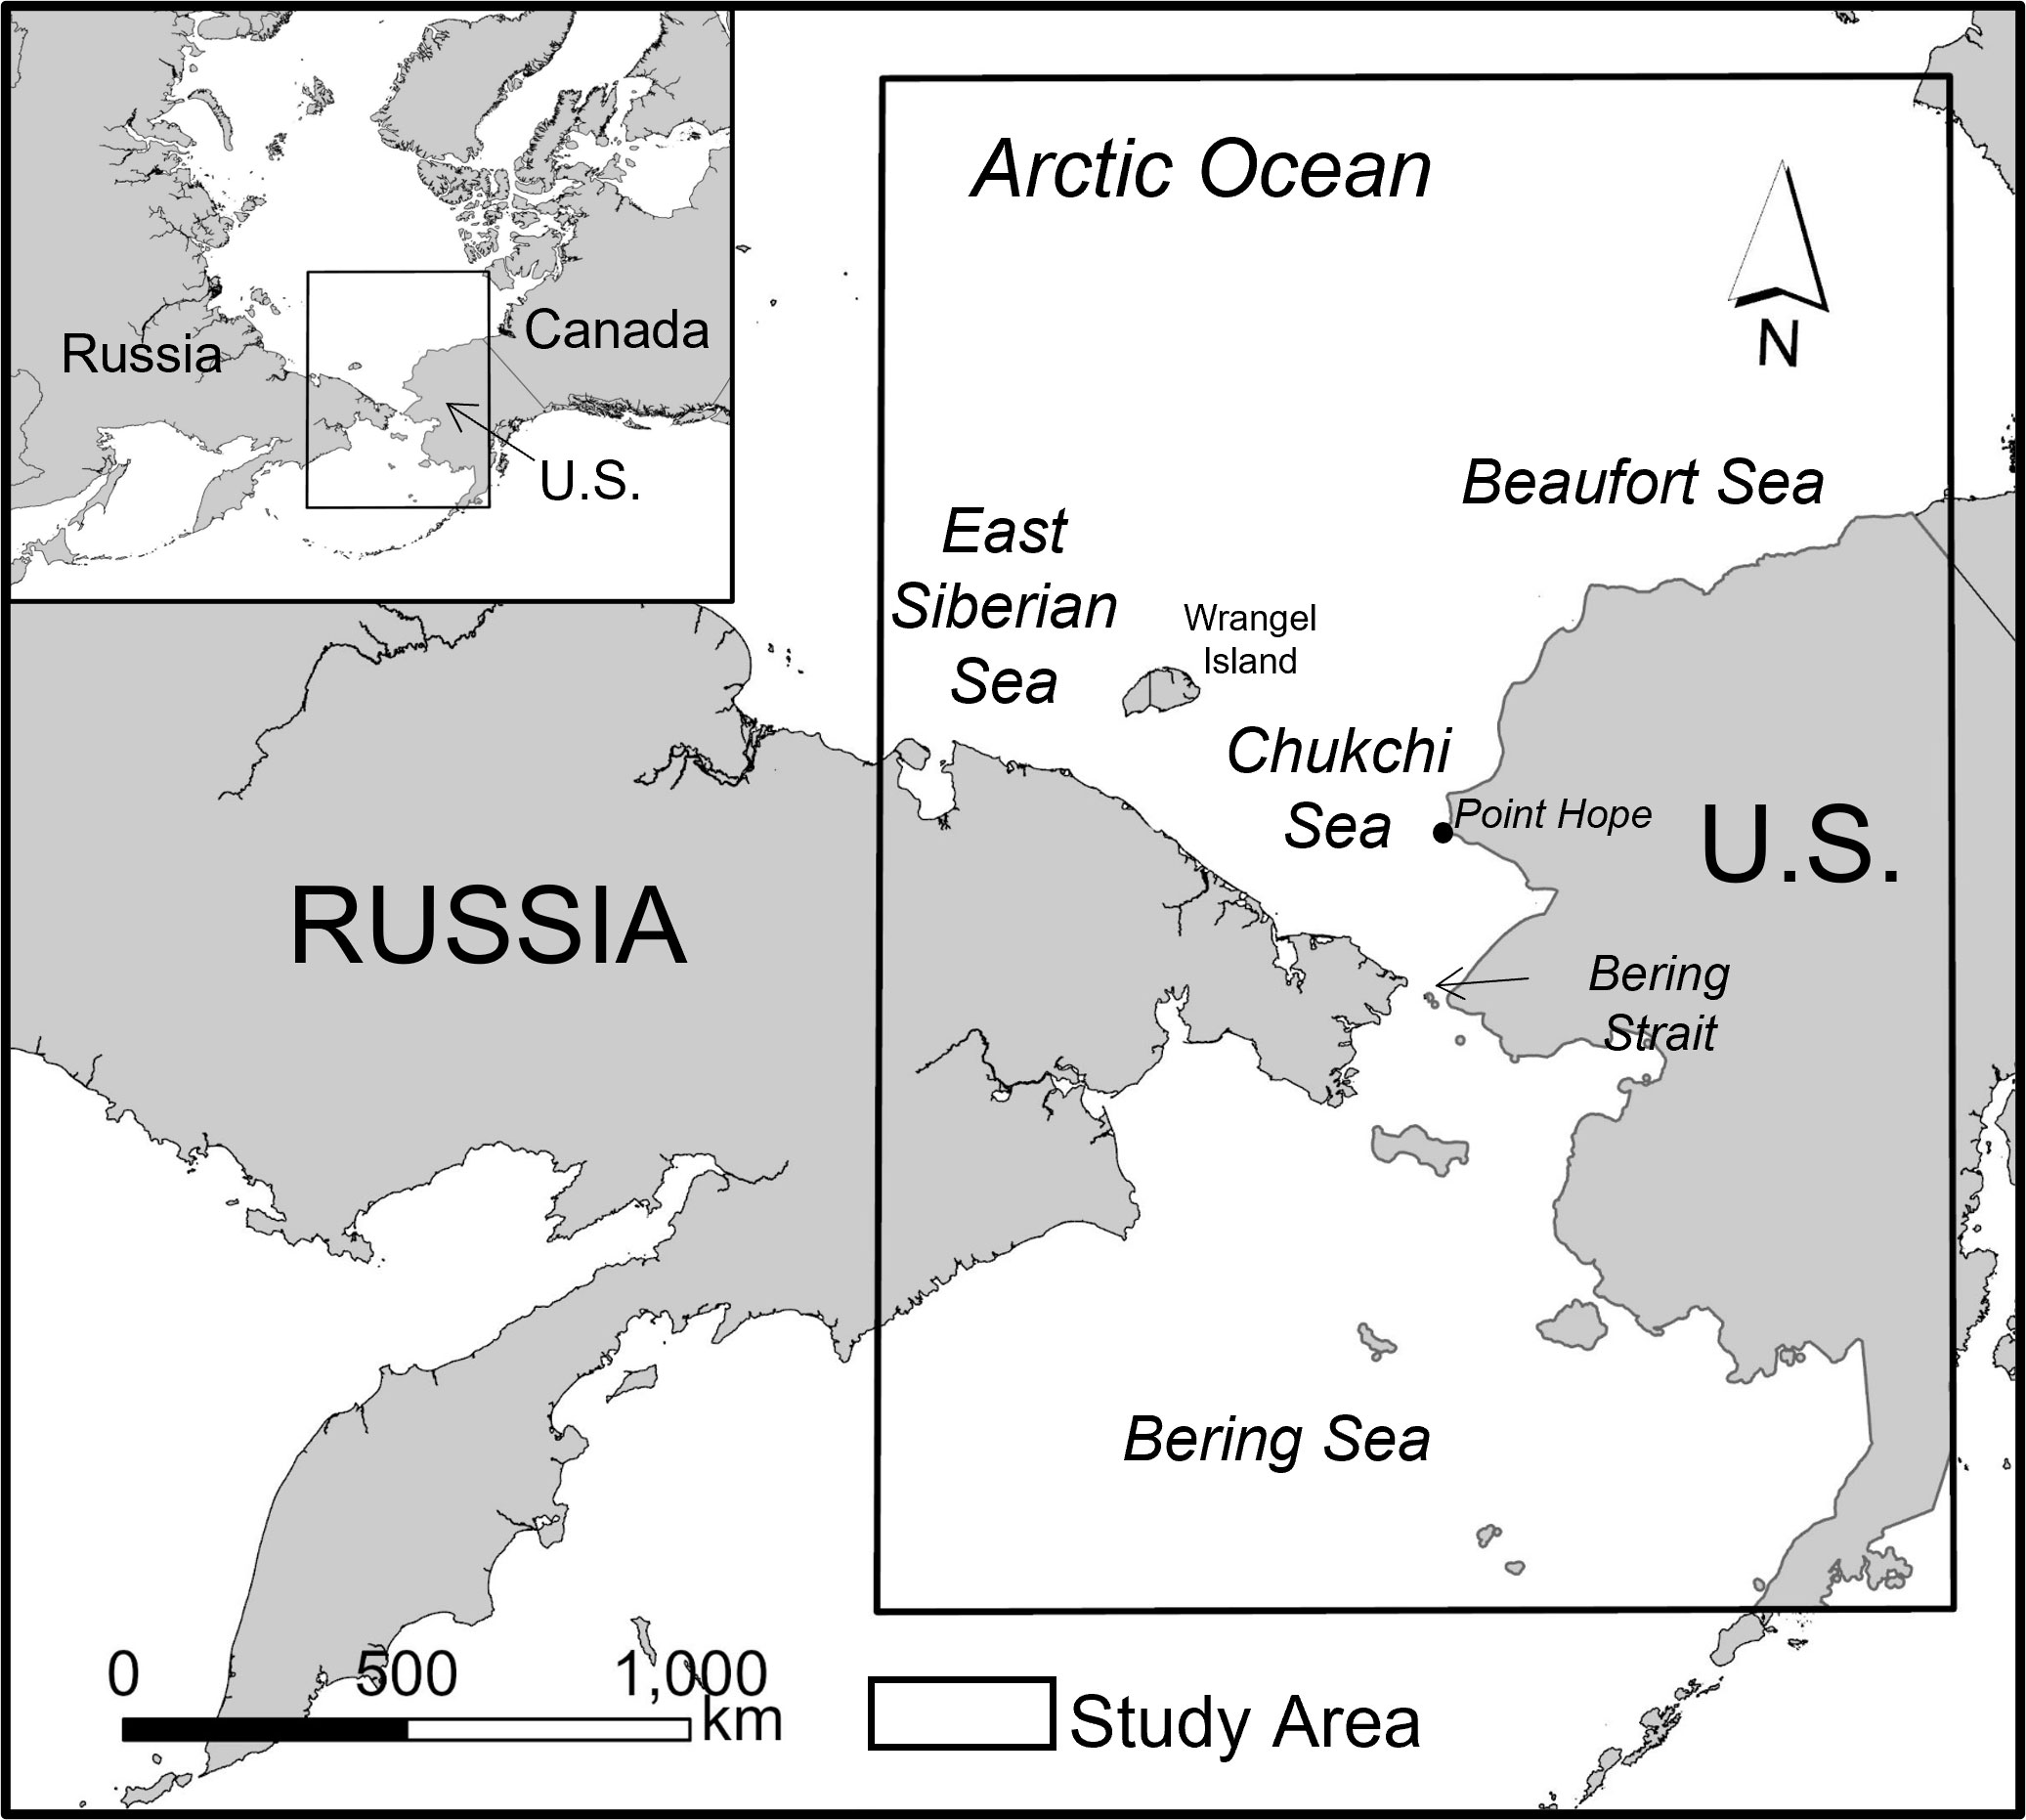
Figure 1 Study site, including the northern Bering Sea, Chukchi Sea, Beaufort Sea, and East Siberian Sea (Esri, 2022a).
We chose to focus on accessibility for PC ships during the months of February, June, September, and November over the last 10 years. Ships with a PC rating are built to safely navigate a defined range of ice conditions, which determines their assigned rating (PC1−PC7) within the Unified Requirements for PC Ships (International Association of Classification Societies, 2016). Not all ships built for ice operations have ratings defined by the PC system; some regions of the world use other classification systems, and the PC rules do not apply to ship built prior to July 2007. However, the polar classes serve as an effective proxy for most ice-strengthened ships (PC6−PC7), ice-capable ships (PC4−PC5), and icebreakers (PC1−PC3).
The four months used in this analysis were chosen because they represent the time of year when Arctic sea ice is near the annual maximum extent and ships are active in the region (Feb), when the Arctic shipping season typically begins (Jun), when sea ice reaches the annual minimum extent (Sep), and when the shipping season typically ends (Nov; Eguíluz et al., 2016). An analysis of ship accessibility during these months should provide operators and planners with key insights into ship capabilities required for desired operational ranges during the most restrictive and the most permissive ice conditions in the study area.
We recognize that risk posed to vessels by interannual fluctuations in ice conditions is a function of not only sea-ice conditions but also of ship activity in those regions. If ships do not operate in areas where ice conditions are highly variable, then risk posed by those conditions is likely minimal. To evaluate this possibility for the most recent calendar year, we overlaid shipping activity on select days during February, June, September, and November 2021 onto maps of interannual variability in ship accessibility developed in the first part of the study.
We conducted this study with sea-ice information from the U.S. National Ice Center and a model developed in Python (IceMaps.py). The model converts sea-ice conditions into measures of ship accessibility for a range of PC ships. The conversion is based on design characteristics of PC ships known to affect a vessel’s ability to operate in ice. Characteristics are defined by the International Association of Classification Society’s Unified Requirements for Polar Class Ships, which establishes seven categories of PC ships: PC1, PC2, PC3, PC4, PC5, PC6, and PC7 (Table 1). The PC system is not based on a ship’s functional role (e.g., breaking ice, escorting other ships) but rather on its design specifications and whether the ship can safely operate in a particular ice environment. We limited the analysis to PC3 (heavy icebreakers), PC5 (light icebreakers), and PC7 (ice-capable) ships because they represent the range of ice-strengthened vessels for which movements are most likely restricted by ice conditions in the Arctic Ocean. We did not consider PC2 and PC1 ships because they are capable of navigating most ice conditions.
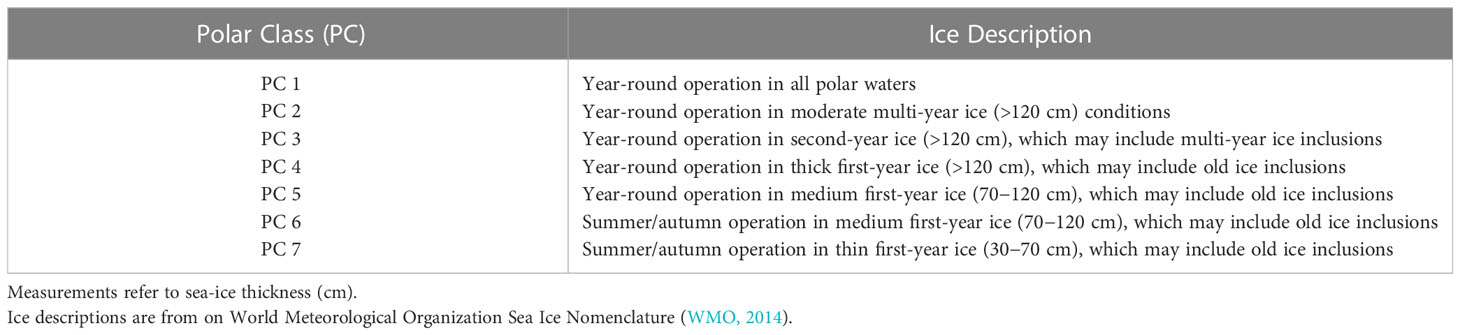
Table 1 Description of sea ice navigable by ships in each polar class.
Sea-ice information was obtained from ice charts produced by the U.S. National Ice Center. These charts are based on ice observations made from synthetic aperture radar satellite imagery, optical imagery, and other ancillary data. To produce the charts, trained ice analysts use a standardized methodology to classify imagery according to observed ice concentration (in a range of tenths) and stage of ice development. Stage of development relates to new ice, young ice, thin first-year ice, first-year medium ice, first-year thick ice, old (multi-year) ice, and glacial ice. On November 1, 2021, analysts replaced the categories for first-year ice (thin, medium, thick) with a single category, first-year ice. This update affects PC5 and PC7 calculations in November 2021 and February 2022, but the impact on our results appeared minimal and did not affect key findings.
Each sea-ice chart contains multiple polygons identifying various sea-ice characteristics, including sea-ice concentration and stage of development. This work was performed for the entire Arctic Ocean on a weekly basis before November 1, 2021, and on a bi-weekly basis thereafter. The results are shared as shapefiles and other geospatial products on the U.S. National Ice Center website.1
We obtained sea-ice charts for the first available dates in the months of interest for each year between February 1, 2012, and February 3, 2022 (Table 2; Figure 2). By stratifying the analysis by the first week of each month, we sought to minimize variability due to within-season trends in ice cover. To produce PC ship-accessibility maps from the ice charts, we ran the IceMaps.py model with the ice charts as inputs. The model used an established algorithm for calculating the Risk Index Outcome (RIO) from sea-ice concentration and stage of development (i. e., ice type):
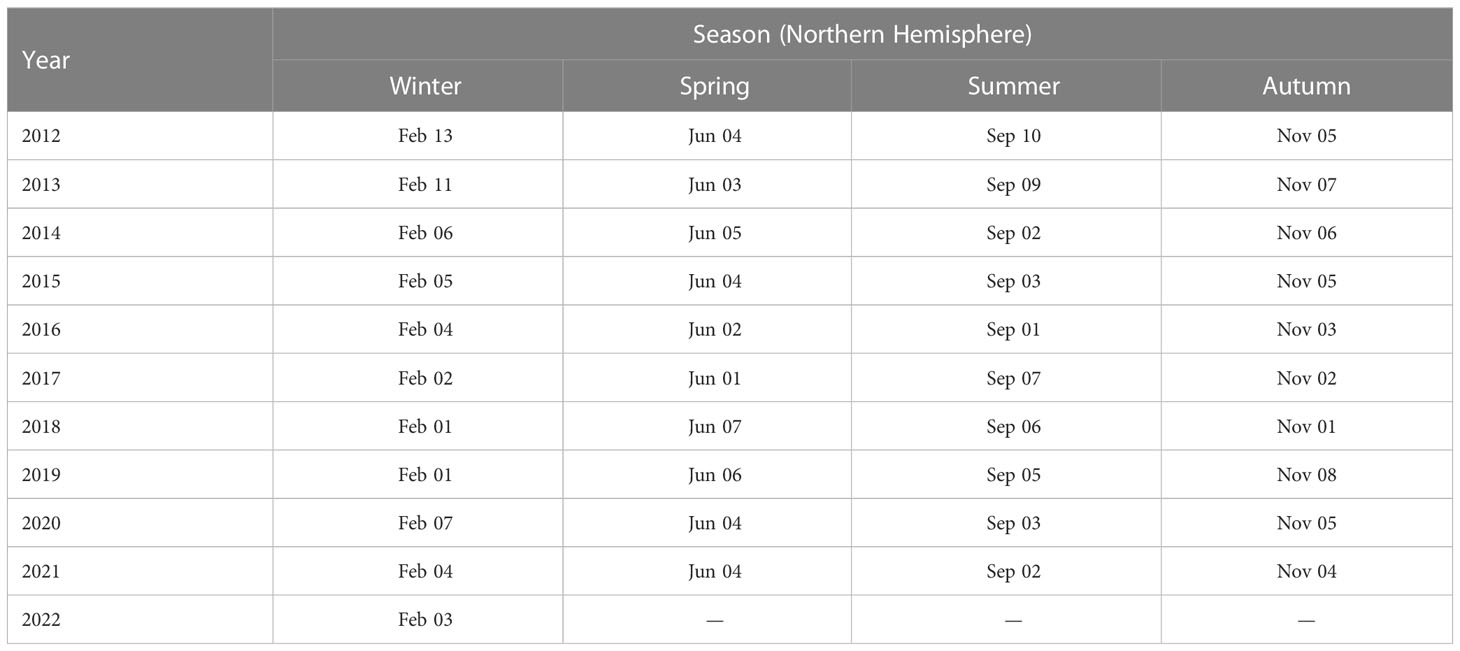
Table 2 Dates of weekly sea-ice shapefiles used in this study.
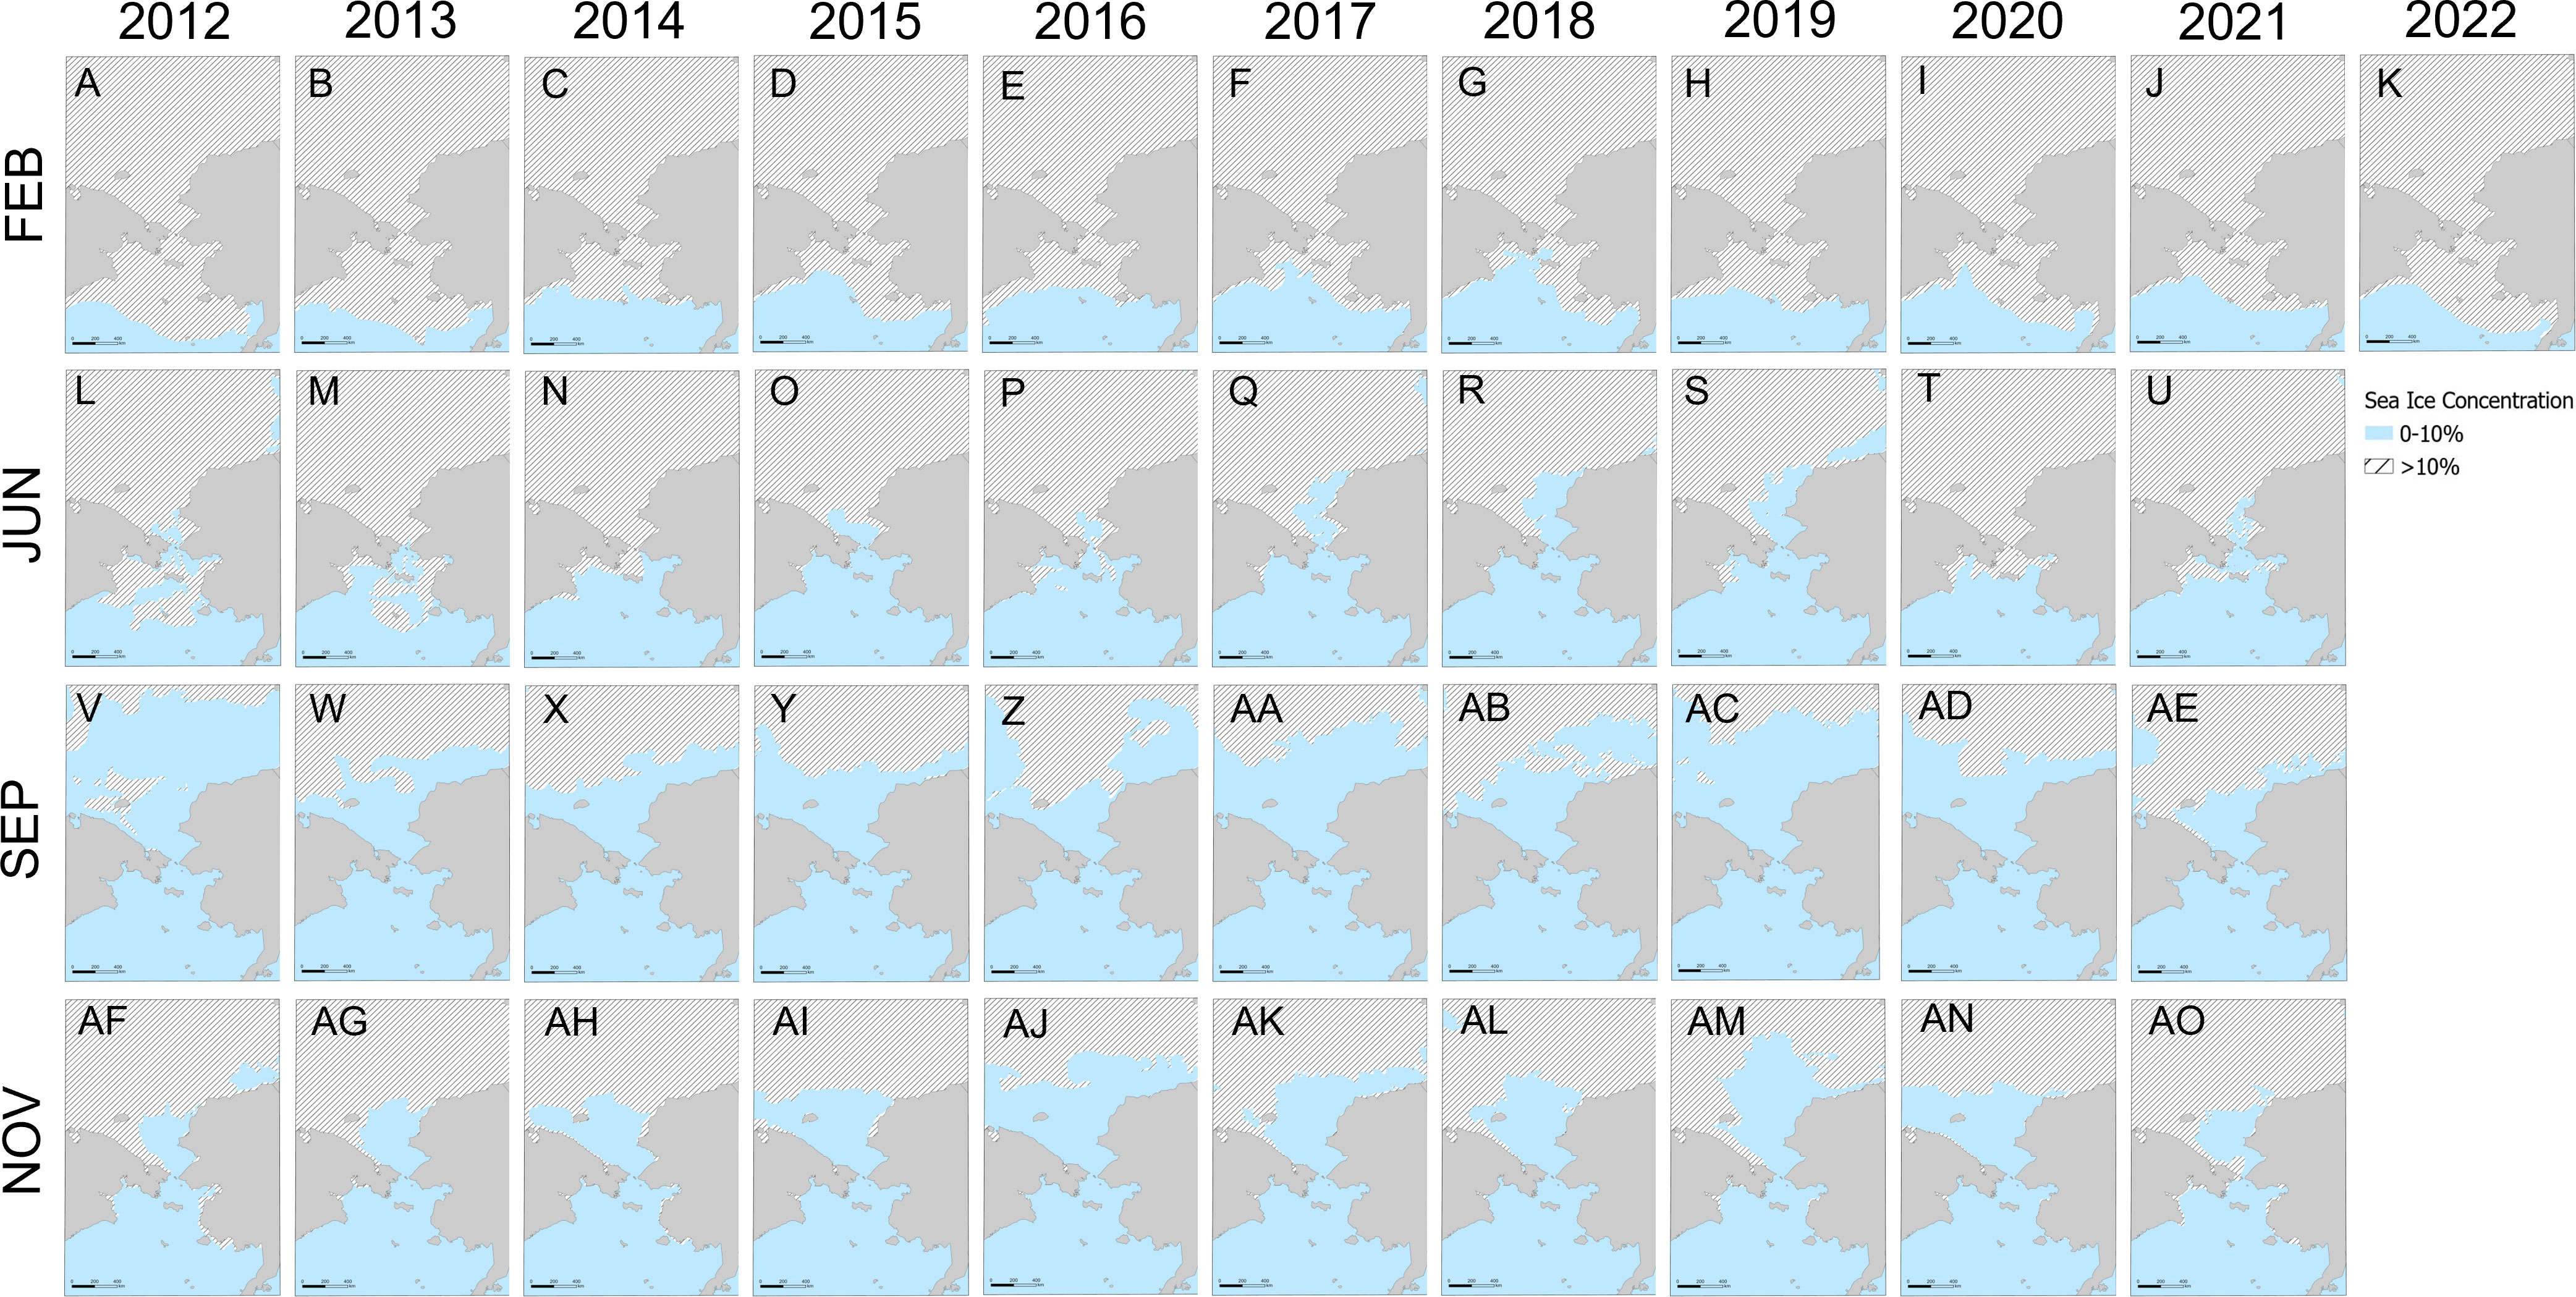
Figure 2 Sea-ice maps for select dates in February (A−K), June (L−U), September (V−AE), and November (AF−AO). Table 2 lists dates for which sea-ice coverage is depicted in each map. Hatched regions show areas where ice concentration is >10%.
where
Ci = concentration (in tenths) of ice type i within an ice regime, and
RVi = risk value for a given ship’s PC designation for ice type i.
The RIO is a single value representing operational risk for a PC ship traveling through an area with a given ice regime, or combination of ice types within a region of interest. The metric was originally developed as an ice numeral (IN) for the Transport Canada Arctic Ice Regime Shipping System (AIRSS) (Transport Canada, 1998). The AIRSS system was later updated to align with the Polar Operational Limitations Assessment Risk Indexing System (POLARIS), which reflects capabilities of the PC classification system. Like the IN in AIRSS, the RIO in POLARIS considers characteristics of all ice types in the regime and known capabilities of a ship to safely navigate those conditions (Stoddard et al., 2016).
In POLARIS, PC ship capabilities for ice operations are reflected in the risk value (RV) parameter. The RV is a known value ranging from -3 to +3 for PC1−7 ships, indexed to a ship’s structural characteristics determining its ability to navigate ice of a certain developmental stage. Positive risk values are used when a ship is structurally capable of navigating a particular ice type. Negative values are used when a ship is not structurally capable. Values of Ci range from 1 to 10 and represent the concentration (in tenths) of ice type i and the portion (in tenths) of sea surface that is ice-free. In this study, “ice-free” refers to water where ice concentrations are < 10% (i.e., up to 1/10 surface coverage). This terminology follows ice classification protocols used by the U.S. National Ice Center.2 Because a given ice regime may contain several ice types, the products of C and RV are summed across all ice types in the regime, including the area occupied by ice-free water, to derive a single RIO value ranging from -30 to +30. If RIO ≥ 0, the regime as a whole is considered accessible. If RIO< 0, the regime is considered inaccessible.
In this study, we used risk values prescribed by the International Maritime Organization’s Polar Code Advisory (American Bureau of Shipping, 2016), with one exception: RV = -1 was applied to PC3 ships encountering both light and heavy multi-year ice, because the original sea-ice files did not distinguish between categories of multi-year ice. Ship-accessibility maps produced in this study consisted of multiple polygons, each representing the associated RIO calculated for a PC ship of interest. An example of ship-accessibility maps produced for a single date in 2021 is shown in Figure 3.
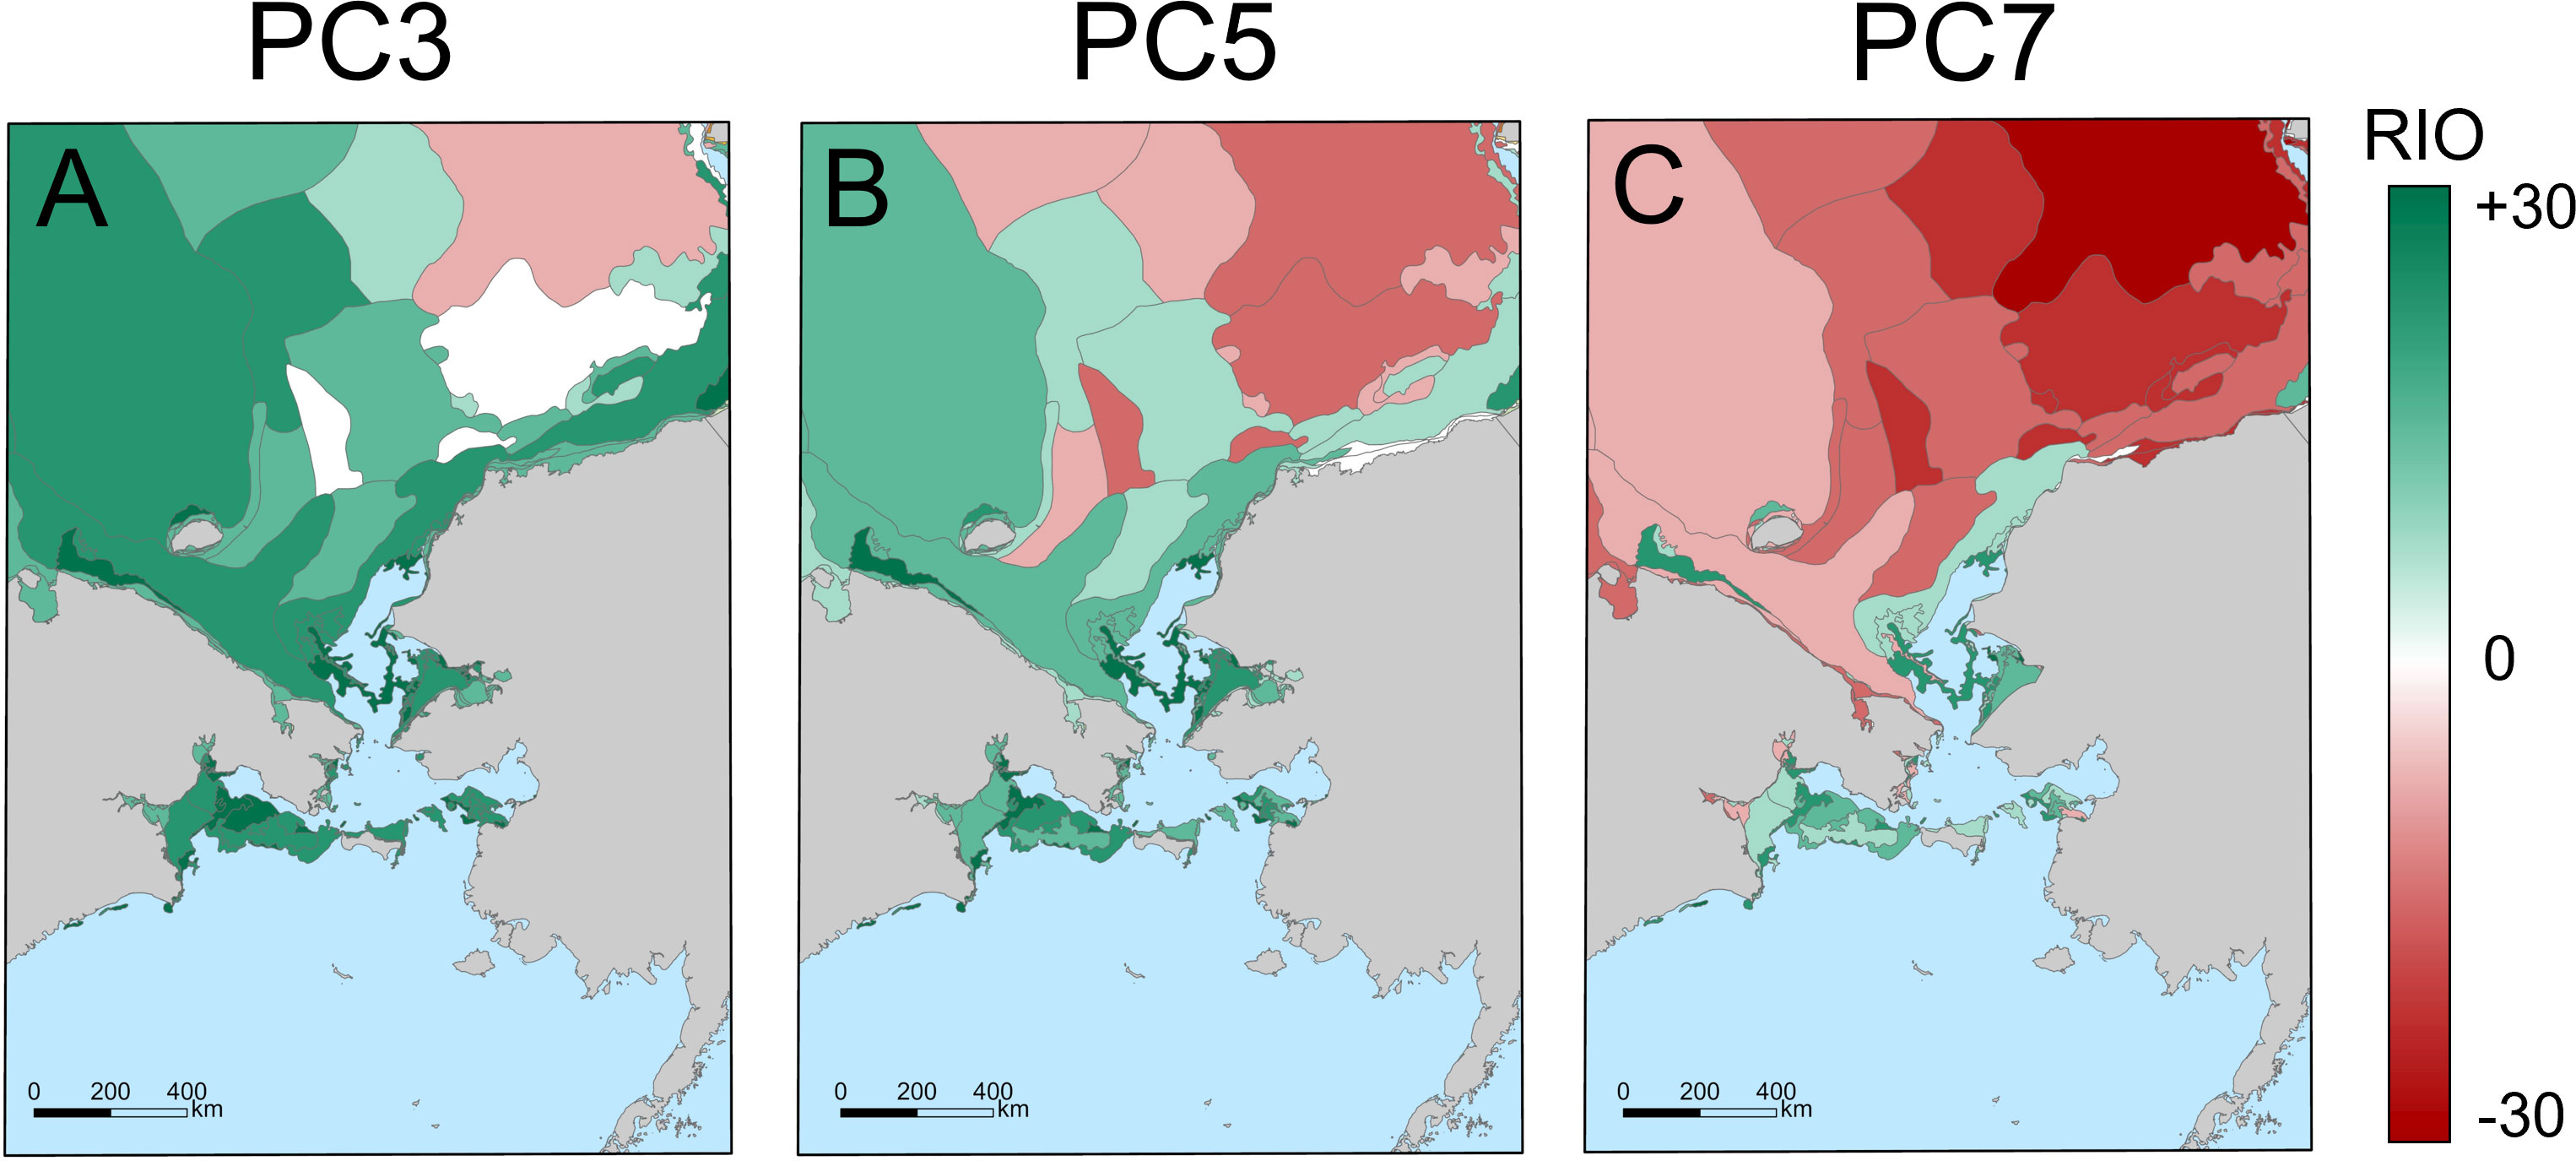
Figure 3 Ship-accessibility maps for PC3 (A), PC5 (B), and PC7 (C) ships on June 4, 2021. Polygons depict RIOrange values on a scale ranging from -30 to +30. Ice-free water is shown in light blue.
Spatio-temporal patterns in ship accessibility were visualized in ArcGIS Pro 2.9.3 (Esri, 2022b), where we uploaded ship-accessibility maps clipped to the study site. For each PC ship type, we summed the total area encompassed by polygons classified as ice-free water (RIO = 30), accessible ice cover (0 ≤ RIO < 30), and inaccessible ice cover (RIO< 0). Outside of ArcGIS, we used analysis of variance (ANOVA) to compare the monthly mean area of the study site accessible to PC3, PC5, and PC7 ships over the 10-11 years of the study. We used a Student’s t-test for two-sample comparisons when ANOVA results indicated significant differences in accessibility among months.
We then overlaid a 10-km2 mesh grid (51,164 cells) onto the study site and used the spatial join geoprocessing tool ArcGIS to associate the RIO value calculated for each polar class with each grid cell. This was done separately for each month, February, June, September, and November. We used a non-parametric Mann-Kendall trend test in MATLAB (The MathWorks Inc., 2021) to identify cells with significantly increasing or decreasing RIO values over the 10-11 years of the study. Results were visualized in ArcGIS for each month x PC ship type combination. All statistical tests were performed with α = 0.05.
Interannual variability in ship accessibility was also calculated from ship-accessibility maps. In ArcGIS, we used the same 10-km2 mesh grid to calculate the range of RIO values (RIOrange) in each cell (j), for each month (k), and each PC ship type (l) across all years of the study:
where
RIOmax,jkl = maximum RIO value in cell j during month k for PC l, and
RIOmin,jkl = minimum RIO value in cell j during month k for PC l.
Spatial patterns in interannual variability in PC ship accessibility were visualized by mapping RIOrange in each 10-km2 cell across the study site for each k × l combination.
We used satellite-based Automatic Identification System (AIS) data provided by the U.S. Coast Guard Navigation Center to assess the extent to which ships operated in areas of high interannual variability or consistent gain/loss in ship accessibility. The AIS is a broadcast system in which certain ships carry Class A very high frequency (VHF) transceiver-receptors that transmit the ship’s position (latitude−longitude) and other information to satellites and coastal ground stations at regular time intervals while the ship is underway (Fournier et al., 2018; U.S. Coast Guard, 2022). The International Maritime Organization mandates that certain ships (e.g., ≥ 300 GT on international voyage) utilize Class A AIS transceivers. Class B transceivers are carried by other vessels on a voluntary basis. For this study, we obtained position reports produced by all ships, both PC and non-ice-strengthened, with Class A and Class B transceivers that were present in the study area on February 3–5, 2021, June 3–5, 2021, September 1–3, 2021, and November 3–5, 2021. These dates coincide with the date (± 24 hr) when 2021 ice charts were available from the U.S. National Ice Center. We focused on shipping activity in 2021 because it was the most recent calendar year for which AIS data were available in all four months.
Automatic Identification System datasets were pre-processed to remove duplicate reports as well as reports from non-ship platforms (e.g., buoys, beacons) and ships with <10 position reports during the month of interest. We uploaded the position reports into ArcGIS and overlaid them on maps of significant gain/loss of PC7 ship accessibility and interannual variability (RIOrange). Maps for PC7 ships were used for this comparison because their capabilities for ice navigation most closely resemble those of commercial ships, which are not ice-strengthened but compose the majority of ships in the study area. We used the spatial join geoprocessing tool to identify the RIOrange coincident with each position report to quantify extent of overlap with interannual variability.
We defined areas of “high” interannual variability as those with RIOrange > 30. These values signified areas that shifted between accessible and inaccessible to a PC7 ship between two or more years during the study. To evaluate whether ships operated in these areas, we used the spatial join processing tool in ArcGIS to calculate the number and proportion of all vessels present where RIOrange > 30.
Hereafter, we use the term “accessible” to refer to areas of either ice-free water or water that was ice-covered but navigable for a particular PC ship. Ice-free water was accessible to all ships, but access to ice-covered water varied among the polar classes. This led to differences in the total area (km2) accessible to PC3, PC5, and PC7 ships when all four months were combined (F2,122 = 30.34, P< 0.001, Figure 4).
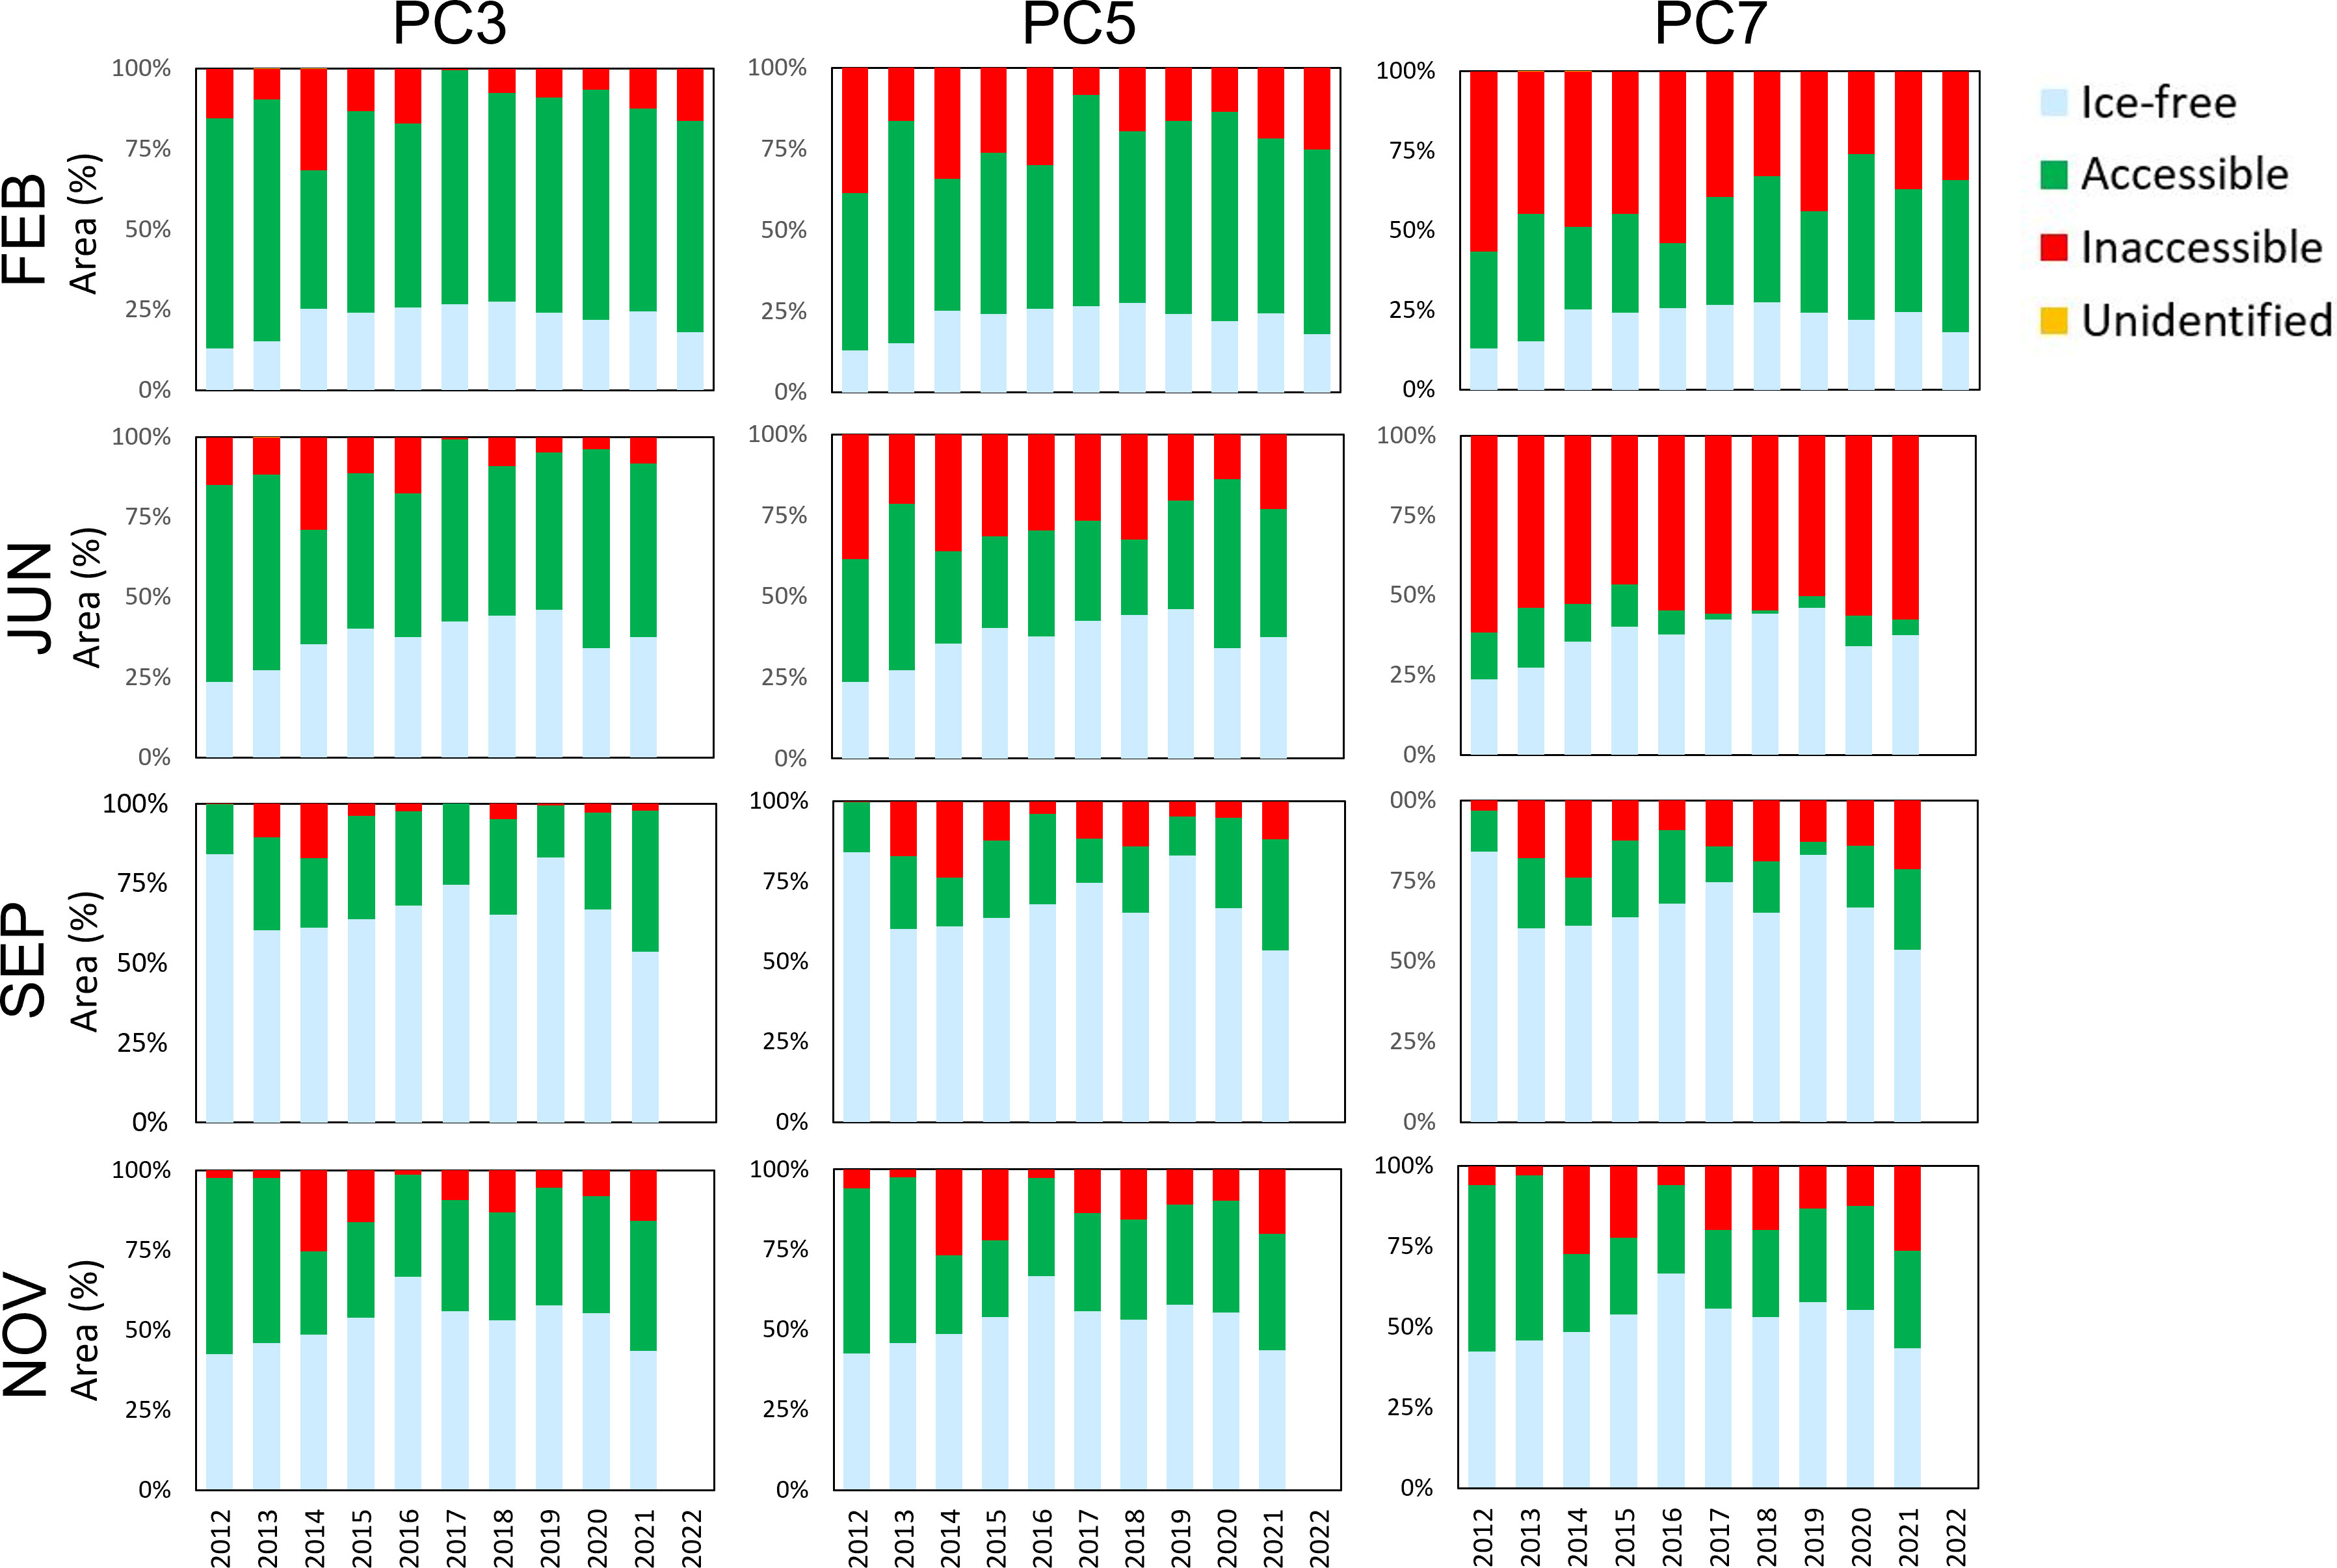
Figure 4 Percentage of the study site that was ice-free (RIO = 30), ice-covered but accessible (0≤ RIO < 30), and inaccessible (RIO < 0) due to ice conditions in February, June, September, and November. Small portions of the study site (< 0.04%) lacked information on ice stage of development in February 2013, June 2013, and June 2014. We report ship accessibility in those areas as “unidentified.”
On average, more area within the study site was accessible to PC3 ships (3.26 × 10⁶ km2) than to PC5 ships (2.94 x 10⁶ km2; t80 = 4.38, P< 0.001), and more area was accessible to PC5 ships than to PC7 ships (2.46 x 10⁶ km2; t80 = 4.05, P< 0.001). This pattern was driven mainly by seasonal (monthly) differences in accessibility , with less area accessible to PC5 and PC7 ships in February and June than in September and November (PC7, F3,40 = 71.57, P< 0.001; PC5, F3, 40 = 9.73, P< 0.001). June was especially restrictive to PC7 ships (Figure 5). In contrast, the area accessible to PC3 ships was relatively uniform across the four months (F3, 40 = 2.37, P = 0.086). The area accessible to ships in all three polar classes was similar in November (F2, 29 = 0.80, P = 0.460, Figure 5).
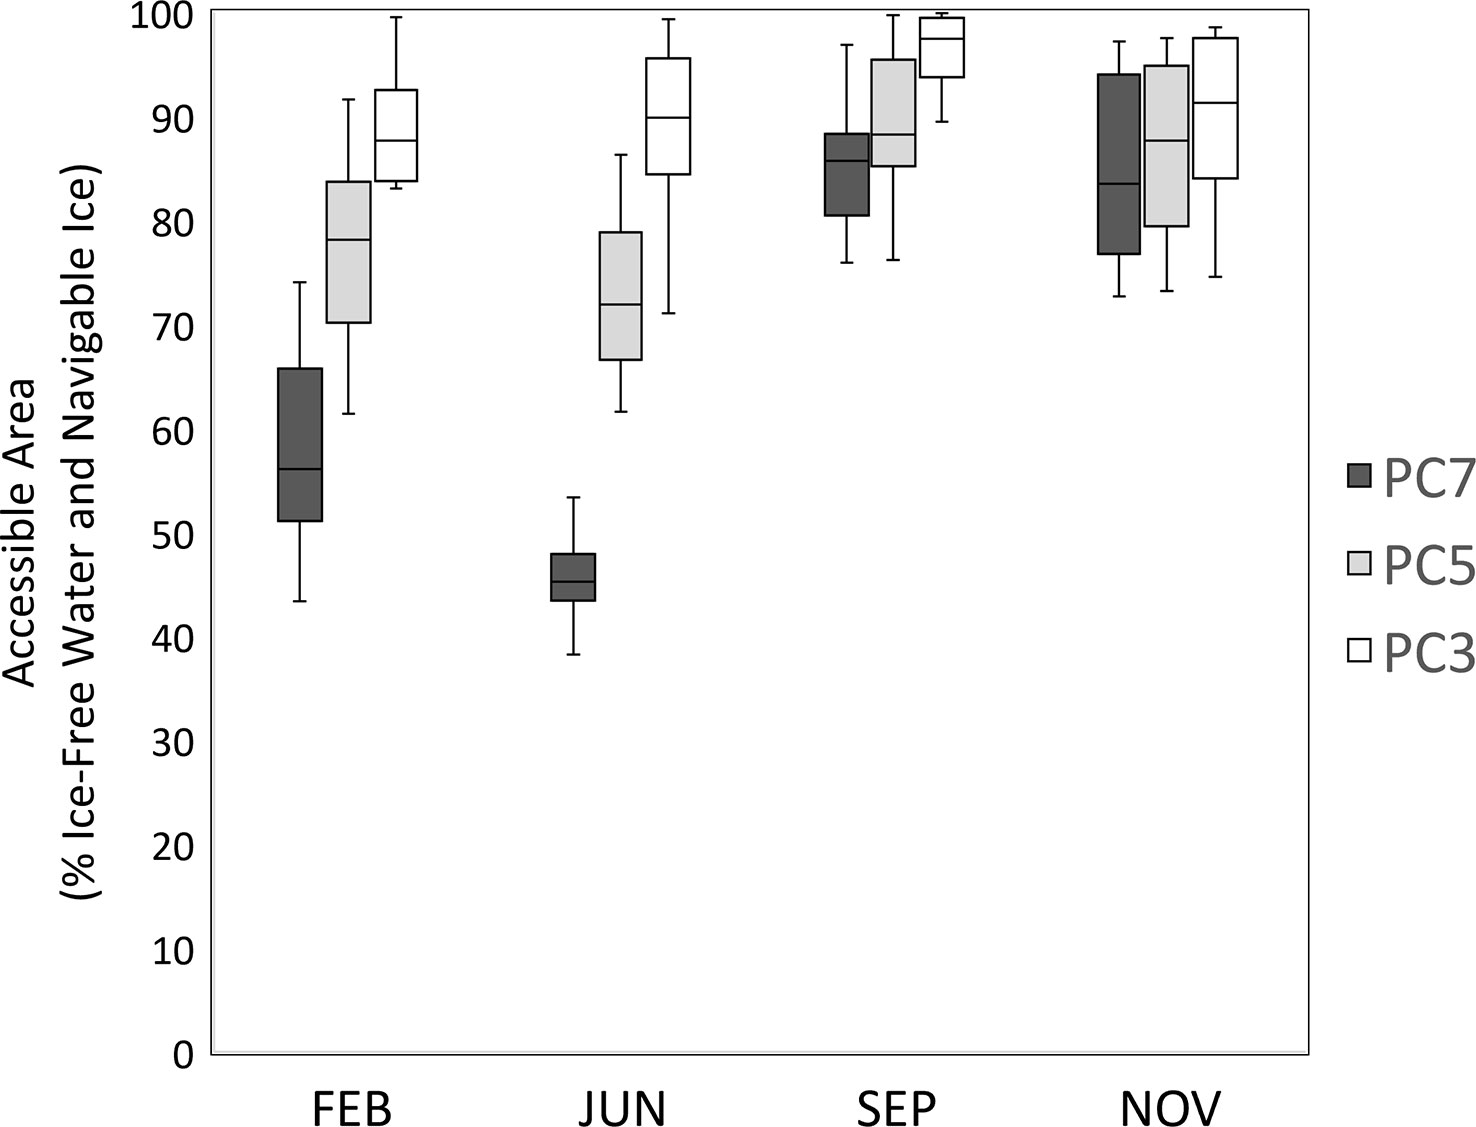
Figure 5 Box plot of the percentage of the study site that was accessible (ice-free or ice-covered but navigable) to PC3, PC5, and PC7 ships. Within each box, the horizontal line denotes the median value. Boxes extend from the 25th to the 75th percentile of each group’s distribution of values. Bars denote the minimum and maximum values. FEB = February, JUN = June, SEP = September, NOV = November.
We found a weak but increasing linear trend in the area of the study site accessible to PC3, PC5, and PC7 ships during February and June over the 10−11-year study period and to PC3 and PC5 ships in September. The rate of increase was greatest for PC7 ships in February (76,998 km2/yr, Figure 6A; Table 3) and is equivalent to PC7 ships gaining access to an additional 21% of the study site over a period of 10 years. Positive trends were also substantial in June (PC3: +59,117 km2/yr; PC5: +57,145 km2/yr, Figure 6B; Table 3). Temporal trends were only slightly positive or moderately negative in September. Accessibility declined in November for all three polar classes, with the greatest rate of decline evident for PC7 ships (Figures 6C, D; Table 3).
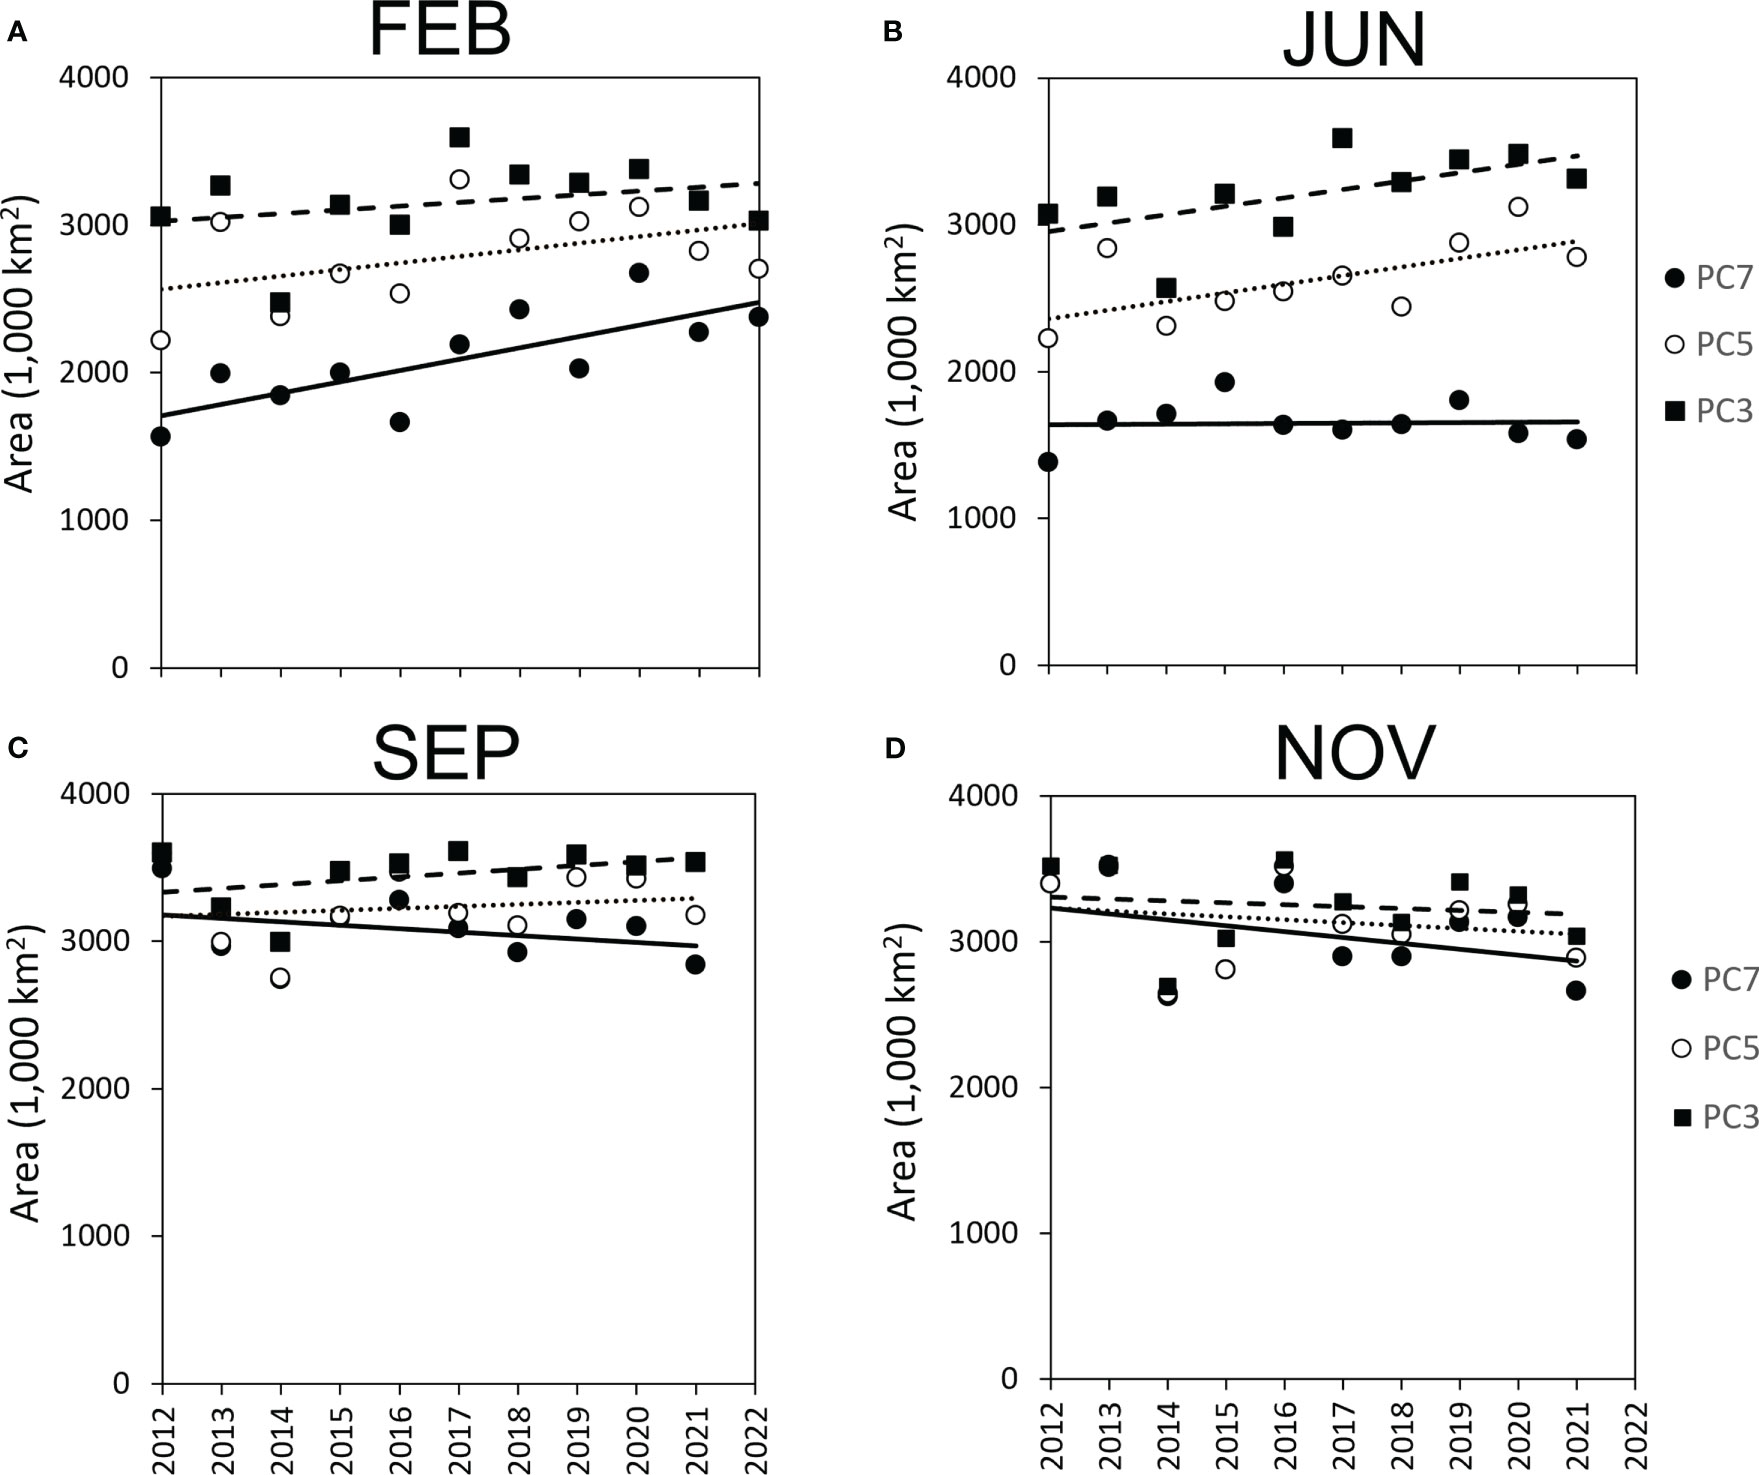
Figure 6 Area of the study site accessible (ice-free or ice covered but accessible) to PC3, PC5, and PC7 ships in the months of (A) February, (B) June, (C) September, and (D) November.
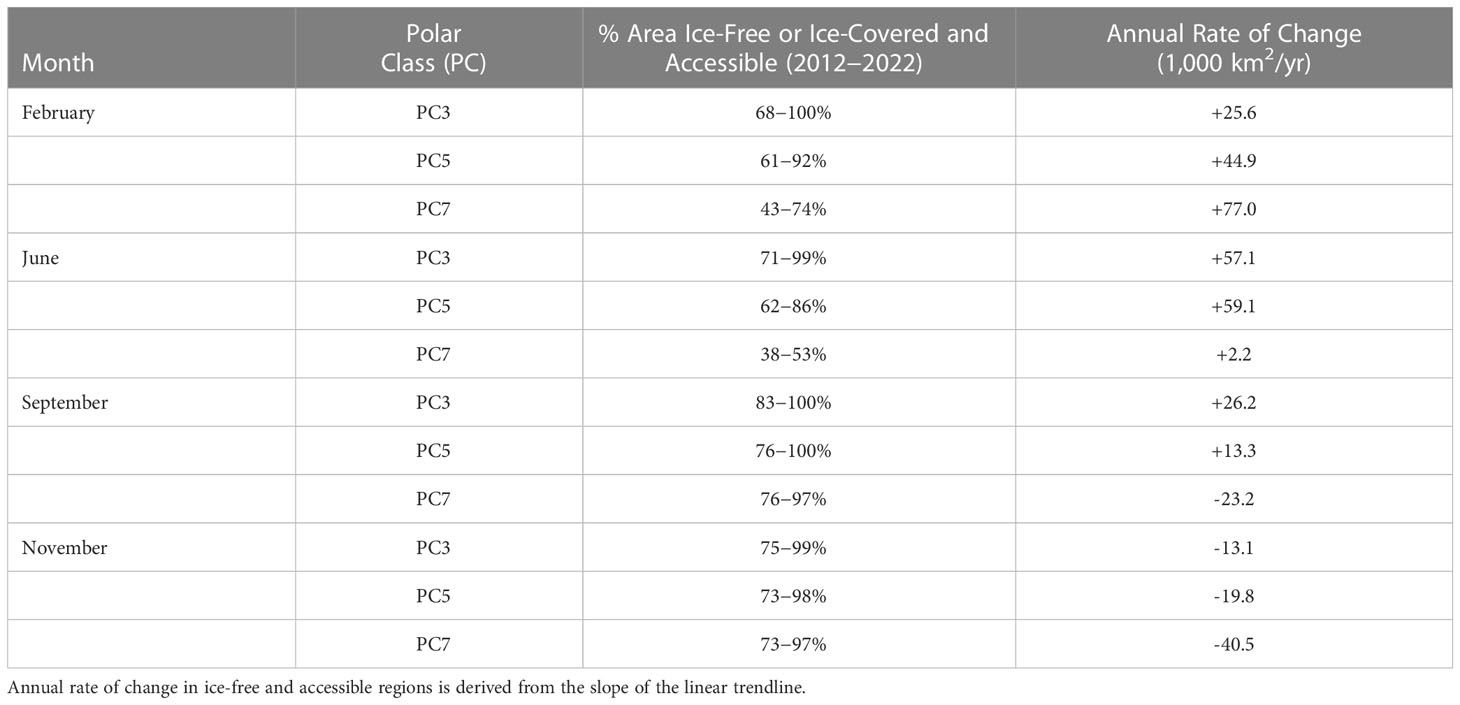
Table 3 Area (%, 1,000 km2) of the study site that was ice-free or ice-covered but accessible to PC3, PC5, and PC7 ships.
Consistent with increasing trends in ship accessibility at the spatial scale of the study site, we detected significant (P< 0.05) positive and negative trends in RIO values at smaller (10-km2) spatial scales within the study site. These areas are shown in Figure 7, in dark green and red, respectively. Areas that were always accessible to a given PC ship are shown in light green. Areas that were always inaccessible are shown in dark gray.
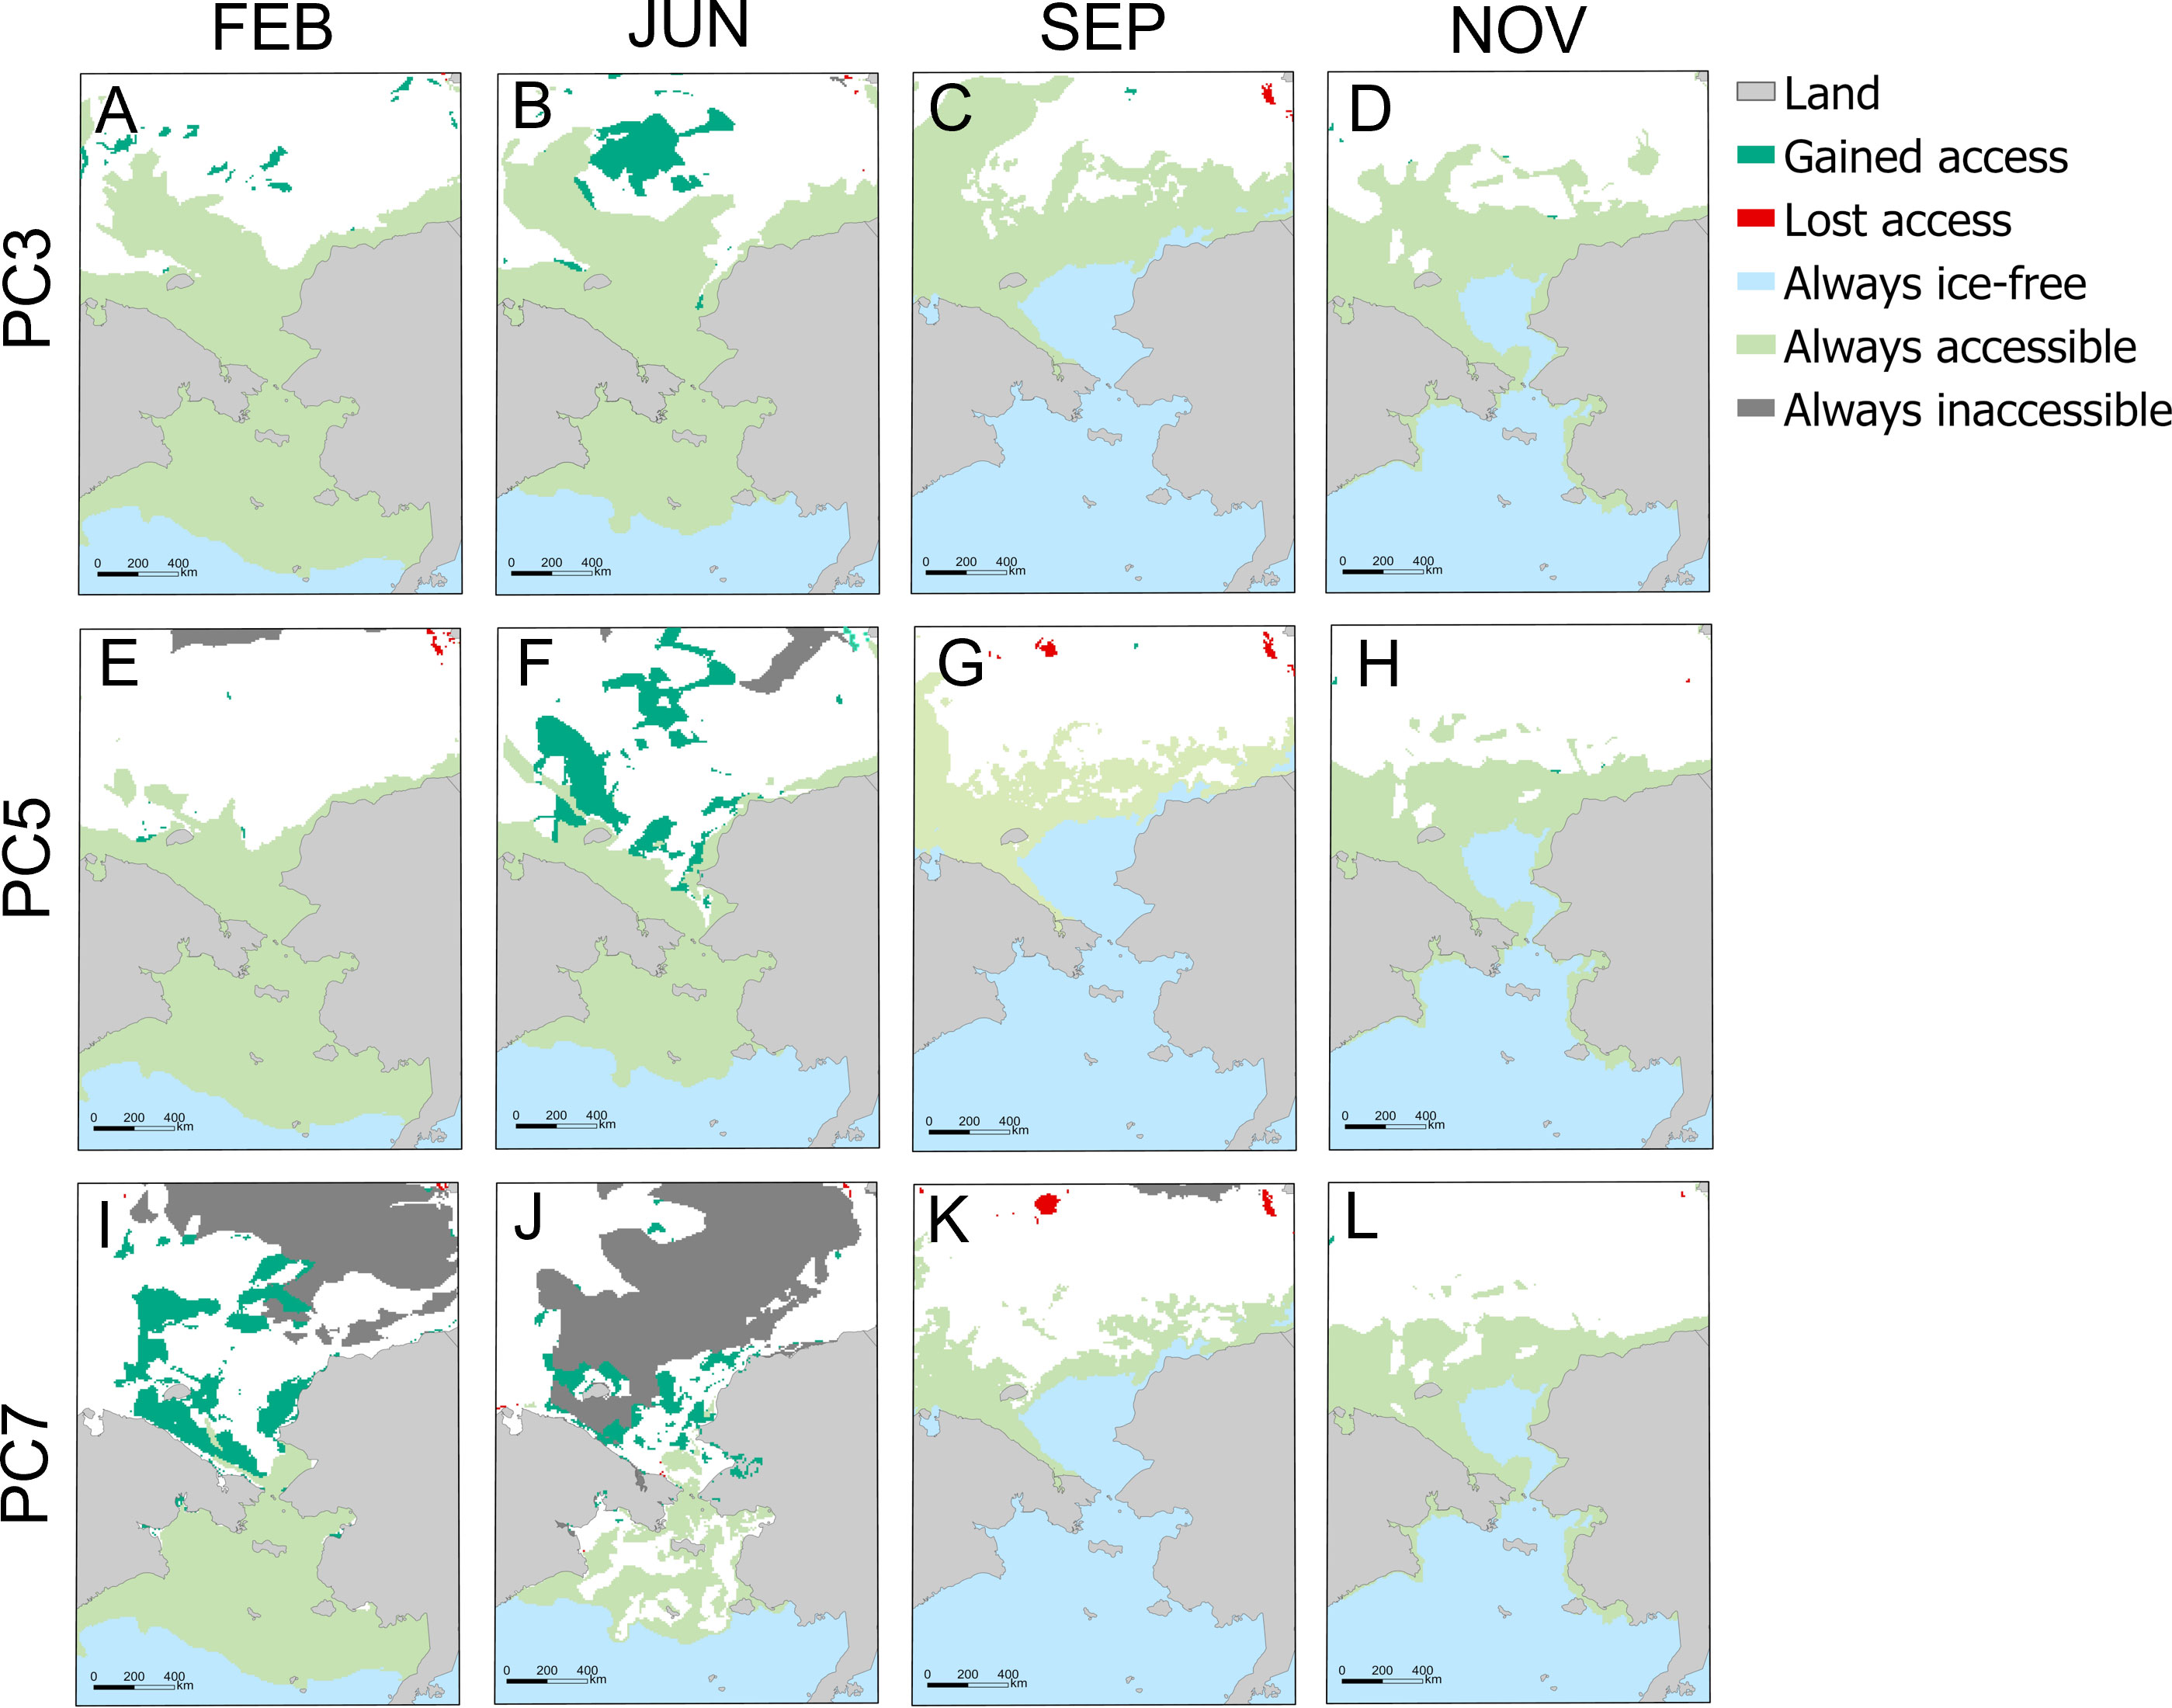
Figure 7 Significant trends in Risk Index Outcome (RIO) calculated for PC3 (A−D), PC5 (E−H), and PC7 (I−L) ships in the months of February (n = 11 yr), June (n = 10 yr), September (n = 10 yr), and November (n = 10 yr). Dark green indicates positive accessibility trends (from inaccessible to accessible), and red indicates negative accessibility trends (from accessible to inaccessible) (Mann-Kendall Trend test: P< 0.05).
The total areal extent of the study site in which ship accessibility trended from inaccessible to accessible far exceeded those which shifted from accessible to inaccessible. When the four months were combined, the ratio of area gained to area lost (gain:loss) was 32:1 for PC3 ships, 16:1 for PC5 ships, and 25:1 for PC7 ships (Figure 8). Significant trends in accessibility were only seen north of the Bering Strait. The areal extent of positive RIO trends was greatest for PC7 ships, especially in February. These areas include waters off the coast of the Russian Far East, including those south and northwest of Wrangel Island, as well as Chukchi Sea waters north of Point Hope, Alaska (Figure 7I). In June, areas where PC7 ships gained access included the Chukchi Sea region immediately adjacent to a large region of inaccessible sea ice (Figure 7J). Gains for PC5 and PC3 ships were greatest in June and included some areas that were inaccessible to PC7 ships in every year throughout the study period (Figures 7B, F).
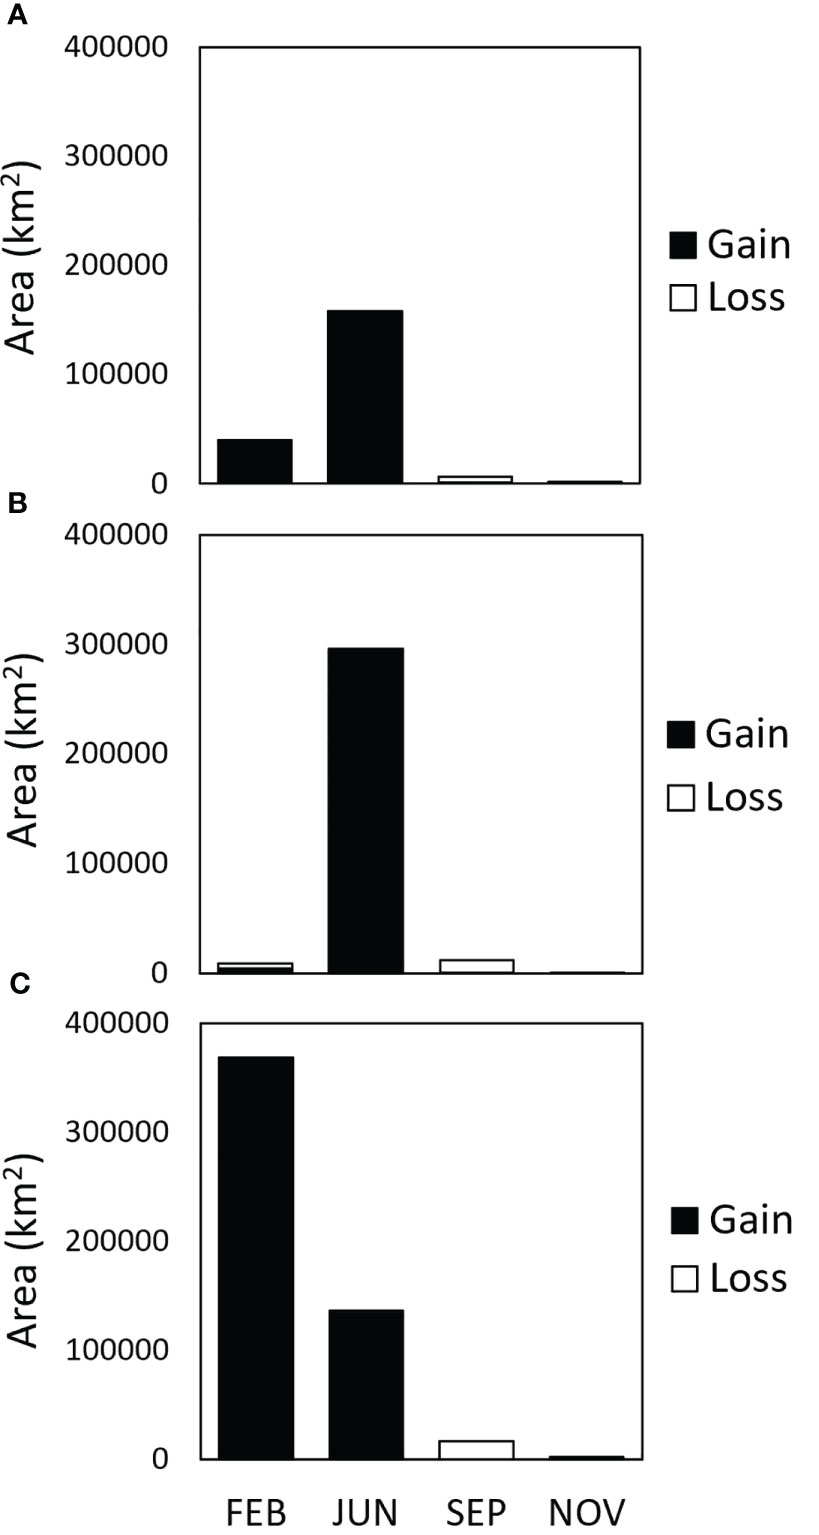
Figure 8 Area (km2) of the study site where PC3 (A), PC5 (B), and PC7 (C) ships gained access and lost access due to changing sea-ice conditions from February 2012 to February 2022.
In September and November, areas with significant change were considerably smaller than those in February or June, and areas where accessibility increased over time were roughly similar in size to areas where accessibility decreased (Figure 8). In addition, cells that gradually shifted from accessible to inaccessible, i.e., negative RIO trends, were located only in the northernmost reaches of the study site (Figure 7).
Figure 9 shows the distribution and magnitude of interannual variability in PC3, PC5, and PC7 ship accessibility in the months of February, June, September, and November. Areas that were ice-free every year of the study are shown in light blue. Areas that were always accessible, i.e., either open water or navigable ice cover (RIO = 0−30) every year, are shown in light green. Dark grey areas were always inaccessible, i.e., unnavigable ice cover (RIO < 0) every year. Areas in graduated shades of orange fluctuated between accessible (RIO ≥ 0) and inaccessible (RIO < 0) at least once during the study period. Darker shades of orange indicate cells with higher values of RIOrange, with the maximum RIOrange being 60.
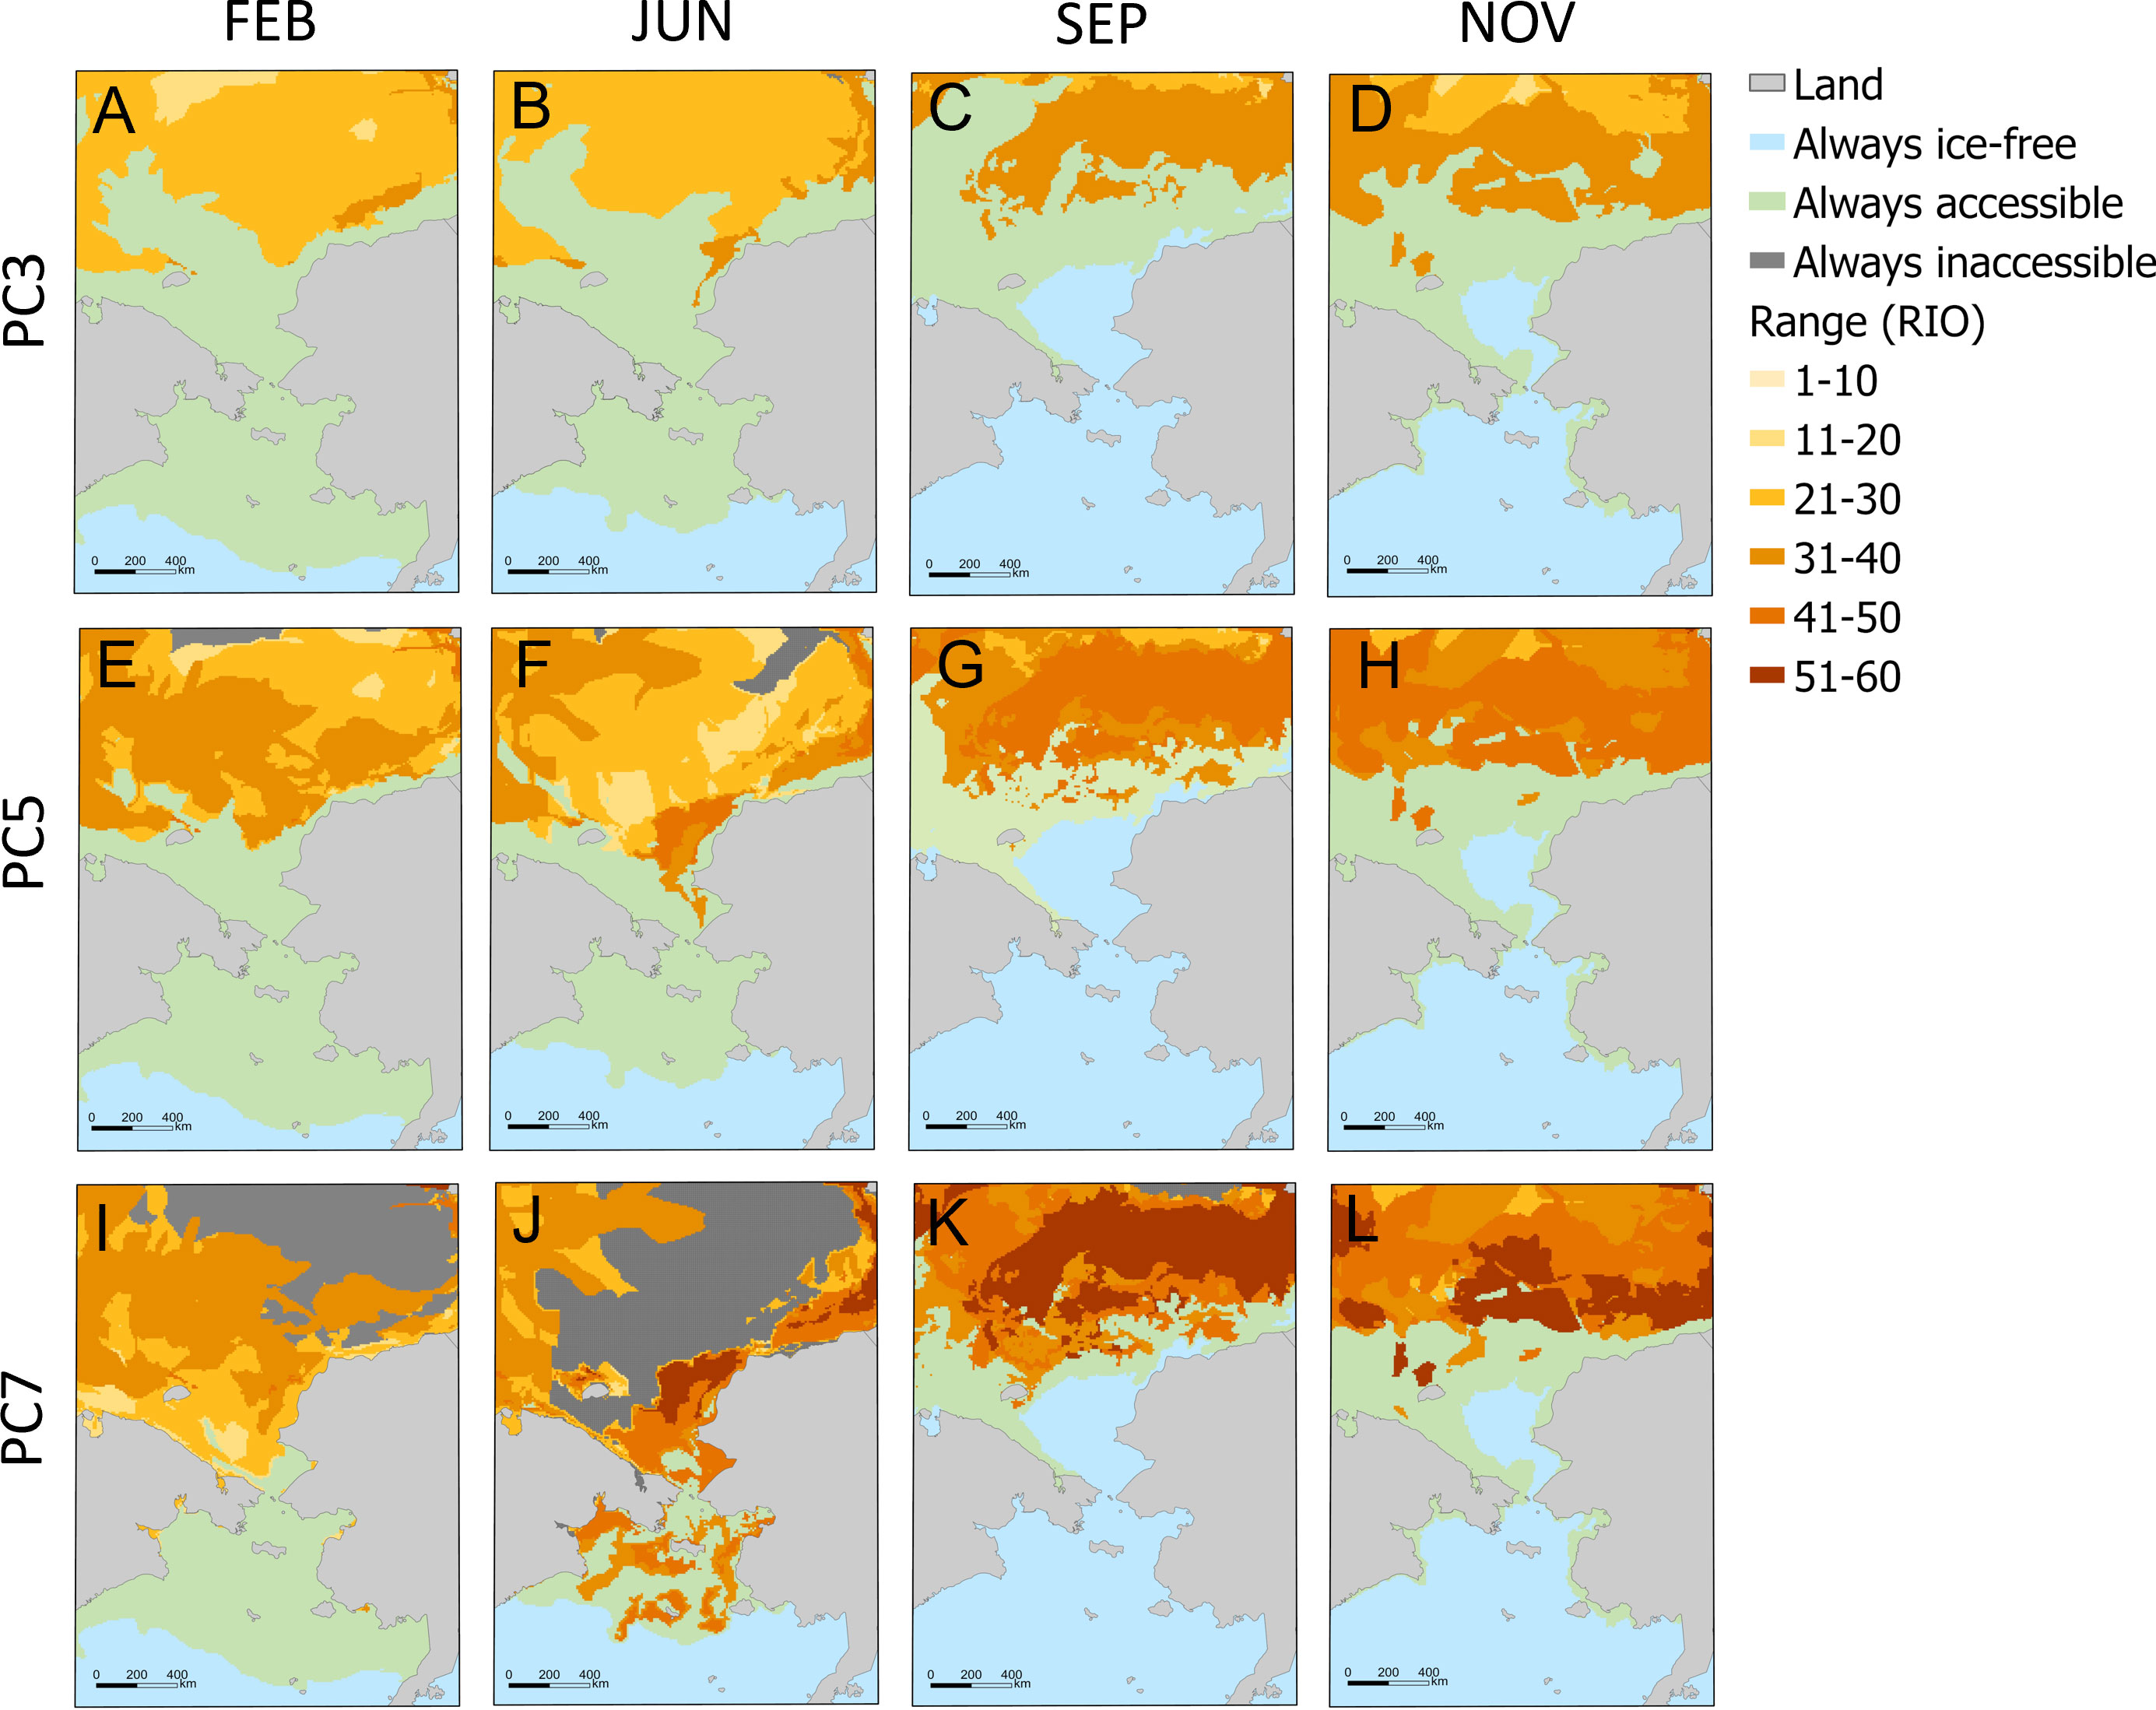
Figure 9 Range of Risk Index Outcomes (RIOrange) calculated for PC3 (A−D), PC5 (E−H), and PC7 (I−L) ships in the months of February, June, September, and November during the study period.
Overall, interannual variability in ship accessibility was greatest for PC7 ships, with RIOrange values routinely exceeding 40 (Figures 9I–L). For ships in all three polar classes, the month of February was least variable (Figures 9A, E, I). In June, interannual variability for PC7 ships was high (RIOrange > 30) in the southern portion of the study site, south of the Bering Strait. These areas were located immediately adjacent to consistently ice-free water. A large region north of the Bering Strait was always inaccessible to PC7 ships during the month of June, which included the region adjacent to the coastline of the Russian Far East and water surrounding Wrangel Island (Figure 9J). Also in June, PC7 ship accessibility was highly variable from year to year in the Chukchi Sea, north of Alaska, with RIOrange > 50 (Figure 9J).
In September, much of the water in the northern Bering Sea (south of the Bering Strait) and southern Chukchi Sea was always ice-free over the last decade (Figures 9C, G, K). However, the majority of ocean surface north of the Chukchi Sea, from the East Siberian Sea to the Beaufort Sea, showed a high degree of interannual variability, especially for PC7 ships (Figure 9K). Most of the region was characterized by RIOrange > 30. A similar pattern occurred in November, with one important difference being the presence of small regions of the Beaufort Sea, offshore northern Alaska, with the maximum observed RIOrange (Figure 9L). This value signifies a region where, over the last ten years, PC7 ships would have encountered at least one year of maximum inaccessibility due to ice conditions (RIO = -30) and at least one year of maximum accessibility in ice-covered water and/or ice-free water (RIO = 30). Also notable about November was the relatively large portion of the Chukchi Sea that was always either ice-free or ice-covered yet still accessible to PC7 ships (Figure 9L).
Interannual variability in ship accessibility for PC3 and PC5 ships was similar to that for PC7 ships in terms of spatial and seasonal patterns; however, the RIOrange was comparatively lower for PC3 and PC5 ships (Figure 9). For example, Figure 9 shows large areas that were always accessible to PC5 and PC3 ships (i.e., light green areas) but inaccessible to, or highly variable for, PC7 ships (Figures 9I, L). In general, RIOrange values were often roughly 10 units lower for PC5 ships than for PC7 ships. In all months, RIOrange values in the northernmost regions of the study site were often roughly 10 units lower for PC3 ships (Figures 9A, D) than for PC5 ships (Figures 9E, H).
Ships were present both north and south of the Bering Strait during the three-day periods examined in February, June, September, and November 2021 (Figure 10). The vast majority of position reports (>99.6% of 3,159,888 reports) were produced by ships with Class A transceivers. The greatest number of vessels in the study site occurred on the three days of interest in September (n = 348 ships), followed by June (n = 255 ships), November (n = 161 ships), and February (n = 151 ships, Figure 10).
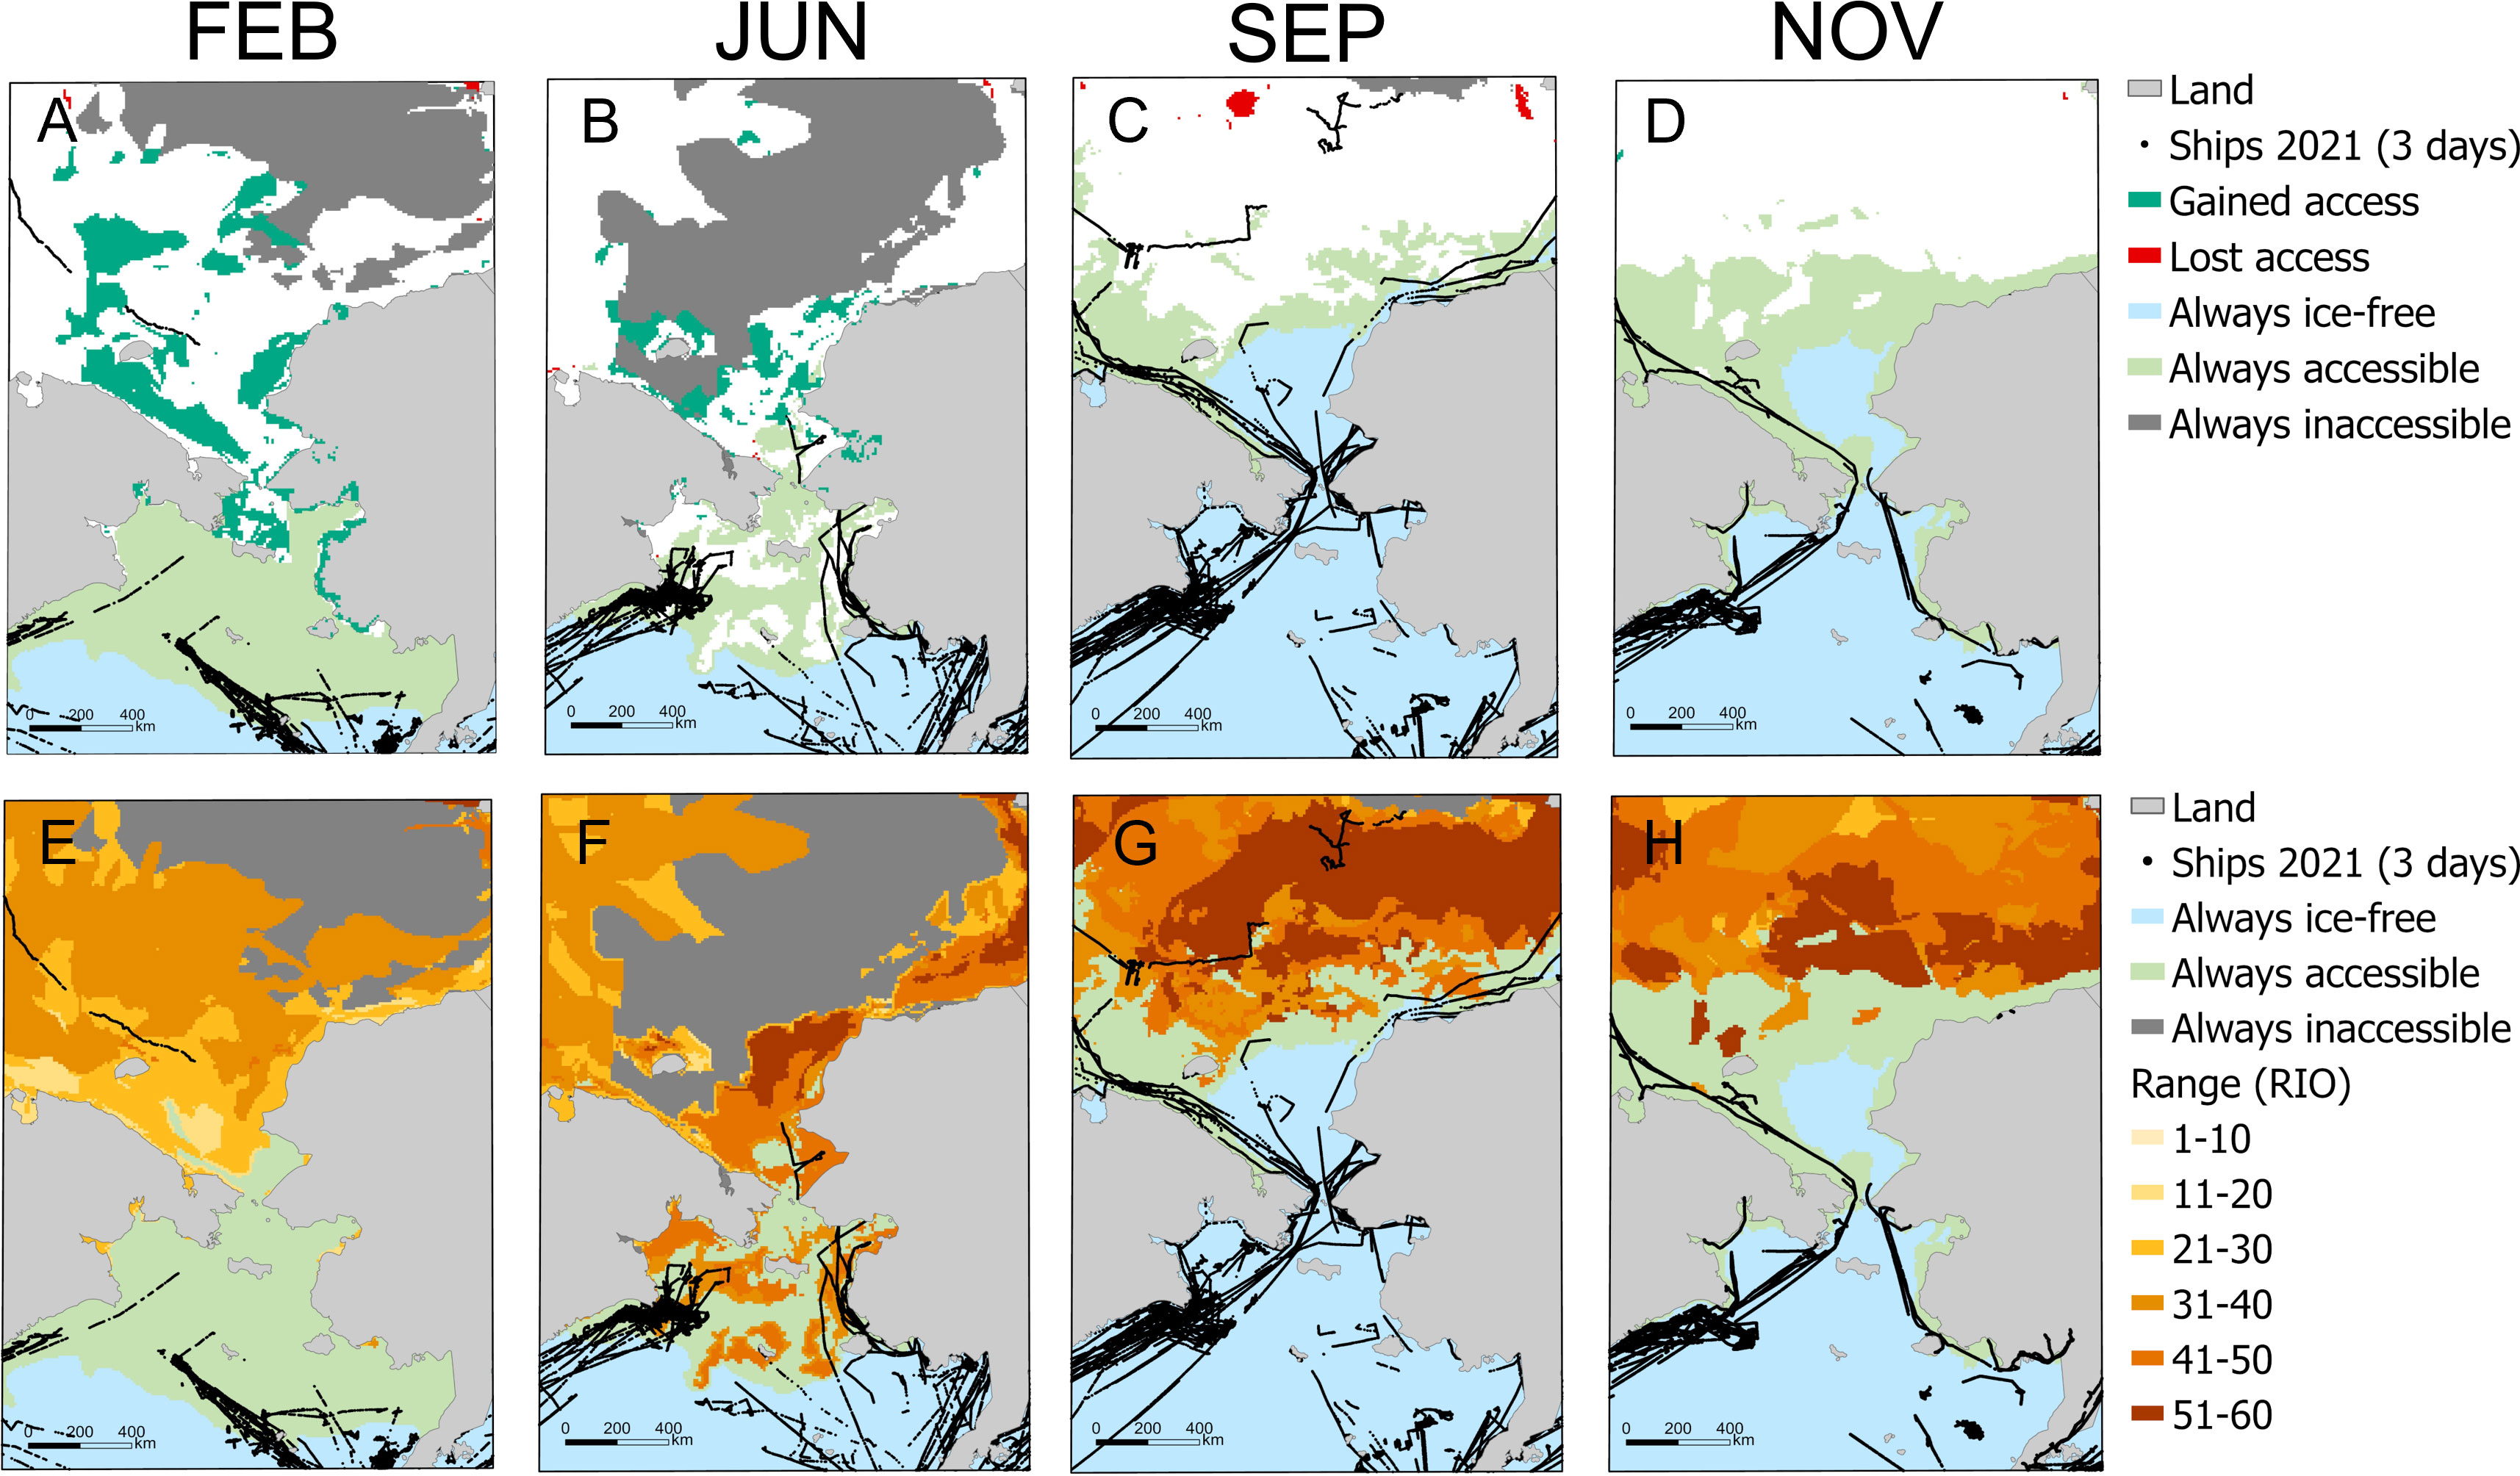
Figure 10 Automatic Identification System (AIS) position reports generated by vessels in the study site on February 3-5, 2021 (A, E), June 3-5, 2021 (B, F), September 1-3, 2021 (C, G), and November 3-5, 2021 (D, H). Position reports are overlaid on maps of Gain/Loss (A–D) and RIOrange (E, F) for PC7 ships.
Most ship traffic in this analysis took place south of the Bering Strait (Figure 10). This region was usually ice-free or covered in ice accessible to PC7 ships but not to non-ice-strengthened vessels, such as most commercial ships. All ships present south of the Bering Strait on February 3−5, 2021, operated in areas of open water or water that was ice-covered but still accessible to PC7 ships. The same is true of most ships (95% of 348 ships) present during September 1−3, 2021 (Figures 10C, G) and November 3−5, 2021 (94% of 161 ships; Figures 10D, H). In contrast, over one-third (35% of 255 ships) of ships present during June 3−5, 2021, operated where interannual variability in PC7 ship accessibility was high (Figure 10F). Of those, over two-thirds (68% of 90 vessels) were commercial fishing vessels, which are usually not ice-strengthened (Table 4).
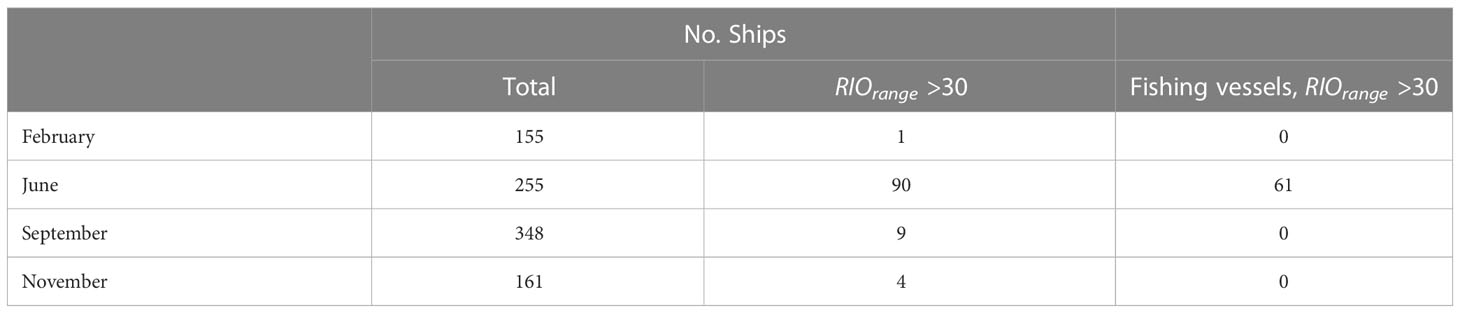
Table 4 Number of ships in the study site on February 3−5, 2021, June 3−5, 2021, September 1−3, 2021, and November 3−5, 2021, including the number of ships in areas where RIOrange > 30 and, of those, the number that were commercial fishing vessels.
Relatively few ships were active north of the Bering Strait in February and June. In February, one ship travelled in the East Siberian Sea, where interannual variability in PC7 ship accessibility was low, passing through an area where accessibility had significantly increased since 2012. In June, one ship was underway on the Chukchi Sea, and two ships operated within 20 km of the northern coast of Alaska. September and November had heavier maritime traffic north of the Bering Strait (Figures 10C, D, G, H), when multiple vessels travelled within 200 km of the northern coastline of Russia and the United States (Alaska). None of these areas showed significant increasing or decreasing trends in accessibility over time (Figures 10C, D). In September, four ships were underway > 500 km offshore mainland Russia in the East Siberian Sea and central Arctic Ocean, where PC7 ship accessibility was highly variable from year to year (Figure 10G).
This study takes a practical approach to understanding interannual variability in PC ship accessibility in a region of the Arctic Ocean known to support a growing volume of maritime traffic (U.S. Committee on the Marine Transportation System, 2019). Although we do not directly address accessibility for ships that are not ice-strengthened, and there are many operating in the region, our results do have applications for maritime planning in general, since PC ships represent the upper limit of operational capabilities for any vessel underway in the Arctic. Specifically, we identify overall trends in PC ship accessibility related to ice conditions encountered by ships in the northern Bering Sea, Chukchi Sea, East Siberian Sea, and Beaufort Sea over the last 10-11 years. We also identify ocean areas where PC ship accessibility has been most unpredictable from year to year and areas where it has been most predictable. We also identify areas that have become more accessible and those that have become less accessible to PC ships over time. We do not, however, provide prescriptive recommendations or a formal risk evaluation for a given ship class. Rather, we offer comprehensive information on ship accessibility relative to spatiotemporal trends in sea-ice coverage to enable situational awareness of the operational environment in ice-prone waters. This information could be incorporated into future analyses of maritime risk.
Seasonal patterns in PC7 ship accessibility were generally consistent with well-documented seasonal patterns in sea-ice coverage across the Arctic Ocean as a whole, namely, sea-ice development in the autumn and winter and sea-ice melt in the spring and summer. In general, PC7 ships are built to operate in thin, first-year ice, and we found they had access to a relatively small portion of the study site in the winter and spring months of February and June compared to later months. This is around the time when sea-ice extent in the Arctic Ocean reaches an annual maximum (February–March). In the spring (May−June), seasonal ice thaws, breaking up near the ice edge. During the months of both February and June over the last 10 to 11 years, we found a positive linear trend in PC ship accessibility, with RIO values increasing fastest for PC7 ships. The trend suggests a long-term decline in ice concentration and thickness in the region during winter and spring months, which aligns with patterns in winter sea-ice extent across the greater Arctic Ocean. The National Snow and Ice Data Center reports that winter sea-ice extent has declined at a rate of 2.6−2.8% per decade since 1979 (Stroeve and Notz, 2018; NSIDC, 2022a). Some of the areas within the study site that became more accessible to PC7 ships over the last 10 to 11 years include offshore locations in the East Siberian Sea, Chukchi Sea, and Beaufort Sea. Represented in dark green color in Figure 7, these regions occur up to 900 km offshore and are most widespread during February and June. They represent grid cells in which RIO values gradually shifted from mostly negative values to mostly positive values, indicating a progressive decline in sea-ice concentration or a trend away from older (thicker) ice and toward younger (thinner) ice.
Areas where PC5 and PC3 ship accessibility progressively increased also occurred in the northernmost regions of the study site but were smaller than areas of increase in PC7 ship accessibility. They were also more prominent in June than in February, which is different from the PC7 pattern. Some of the regions becoming more accessible to PC5 and PC3 ships in June remained inaccessible to PC7 ships, reinforcing the idea that at least some gains in PC5 and PC3 ship accessibility in the Arctic Ocean were due to reductions in sea-ice concentration and stage of development (i.e., thickness) as opposed to the total loss of sea-ice coverage in those regions. This is important because it shows that changes over time in PC ship accessibility to the Arctic may not be detected in charts of sea-ice extent alone.
During September and November, a larger portion of the study site was accessible to all three PC ship types compared to conditions in February and June. During September, warmer atmospheric and sea surface temperatures drive sea ice to its annual minimum spatial extent. In October and November, temperatures drop, and sea ice re-freezes at the seaward edge of multi-year ice. Reductions in sea-ice extent during the month of September over recent decades are well documented, with total extent declining at a rate of 12.6% per decade since 1979 (NASA, 2022). In contrast to this trend, PC7 ship accessibility in this study failed to show a long-term increase as it did in February and June. Instead, PC7 ship accessibility declined in September and remained relatively constant in November. This observation may be due, at least in part, to the historically low sea-ice extent recorded in September 2012, which was the first year in our time series. Minimum sea-ice extent that year was the lowest seen across the Arctic Ocean in 44 years (1979−2022), dropping to 3.6 × 10⁶ km2 in total extent, compared to the typical (interdecile) range of 5.1−7.2 × 10⁶ km2 in previous and subsequent years (Parkinson and DiGirolamo, 2021; NSIDC, 2022b). This made September 2012 an unusually low reference point against which we compared September ship accessibility in later years.
It is also possible, however, that physical processes acting over the spatial scale of the study site as opposed to over the Arctic Ocean as a whole caused ice concentration and/or ice thickness to increase locally in some areas, leading to a genuine decline in PC7 ship accessibility within the study site over the last decade. For example, the Beaufort Gyre is known to move multi-year ice from seas north of Greenland into the Beaufort Sea, which lies within the study site. Moore et al. (2022) reported an anomalous increase in multi-year ice transported into the Beaufort Sea by the Beaufort Gyre in the summers of 2020 and 2021, resulting in older, thicker ice present in the Beaufort Sea in those years and in the Chukchi Sea in 2021. This would have made conditions less permissible to ships, especially those with little ice strengthening, such as PC7 vessels. Babb et al. (2022) also reports that the amount of multi-year sea ice transported by the gyre appears to have been increasing over the last 20 years; however, a substantial portion (up to one third) of it now melts while in the Beaufort Sea, so the role of the Beaufort Gyre in the decline in accessibility we observed remains unclear.
With respect to accessibility for the more capable PC3 and PC5 ships, our results suggest that these ships are considerably less sensitive to seasonal variability in the sea-ice landscape than are PC7 ships. Not only was PC3 ship accessibility similar from month to month despite seasonal fluctuations in sea-ice extent, concentration, and stage of development, but PC5 and PC3 accessibility increased at a slower rate in February and June than it did for PC7 ships. Moreover, relatively few areas within the study site shifted from inaccessible to accessible (or vice versa) to these ships over the last decade, suggesting that greater changes in the ice environment are needed to influence areas where PC5 and PC3 ships can navigate compared to environmental changes affecting accessibility for PC7 ships.
While accessibility differences among the polar classes in February and June were expected given that the PC system is based on structural capabilities related to ice operations, the absence of such differences during the month of November was initially surprising. However, inspection of the ship-accessibility maps in Figure 9 shows that the similarities during November may simply reflect the relatively large portion of the study area covered by ice-free water during this month. As sea ice melts, the ice edge moves north during the summer, making the study site accessible to a wider range of ice-strengthened ships than in previous months. Even the sea ice present is largely accessible to the three polar classes, as much of it is thin, first-year ice, which, during October and November, usually forms on the southern seaward edge of thicker, multi-year ice to the north during autumn freeze-up (Wadhams, 2003; Stroeve and Notz, 2018).
Ice formation during autumn can have serious implications for PC ship accessibility in the future given ongoing climate change. Based on a 40-year time series analysis of satellite-based sea-ice data, Zheng et al. (2021) noted a strong correlation between the timing of autumn freeze-up in the Laptev Sea, East Siberian Sea, Chukchi Sea, and Beaufort Sea and total sea-ice extent during the previous June. Specifically, early summers with little ice coverage were followed by autumns with delayed seasonal ice formation. If continued summer sea-ice loss in the Arctic region continues in upcoming years, then ice formation in November may routinely occur later in the year than it has in the past. Unusually slow autumn freeze events in the Arctic Ocean documented during 2016 and 2020 are consistent with this potential future trend (NSIDC, 2022a). In a scenario where autumn refreeze is delayed, ship accessibility in November, which is already similar among the PC3, PC5, and PC7 ships, may become even less reliant upon the need for ice-strengthened ships. Should vessels without ice-hardening expand northern operations under this assumption, years with an unusually early refreeze event could present dangerous conditions for ship operators and their crew.
Seasonal differences in accessibility among the polar classes, or lack thereof, may also have implications for maritime planners forecasting needs for shipping operations in a rapidly changing Arctic Ocean. Heavy icebreakers (i.e., PC2, PC3 ships) are considerably more costly to build and operate than ships with lower PC ratings, which are, in turn, more costly to build and operate than non-ice-strengthened ships. For example, Solakivi et al. (2018) estimated that PC ships could be up to 3 times more costly to build than non-ice-strengthened ships and approximately 1.5 times more costly to operate due to higher fuel costs.
The shipping industry might avoid these costs by hiring an icebreaker to provide escort service for a non-ice-strengthened ship, but such services can be costly and the availability of icebreakers is limited (Lindborg and Andersson, 2020). Managers therefore have a financial incentive to optimize ship design or to plan shipping operations that avoid the need for ice-capable ships when possible. Our results suggest that knowledge of seasonal differences in PC ship accessibility to a region of interest, such as during February and June, or the absence of such differences, such as during September and November, could help managers make decisions about how to balance the need for minimum ship capabilities with operational costs. This is especially relevant to ships operating on established routes (e.g., from Russia’s Yamal Peninsula to greater Asia), where knowledge of the likelihood of a route remaining accessible during a voyage can inform decisions about the need to acquire PC ships and how to minimize operational costs while prioritizing safety of navigation. If ice conditions observed over the last 10-11 years are indicative of future conditions, PC ship accessibility to established trade routes through Arctic seas north of the Bering Strait may not be too different for PC3 and PC5 ships. In this case, commercial operators may benefit from prioritizing new construction of PC5 ships over that of PC3 icebreakers.
Polar maritime safety is in many ways reliant upon ship operators selecting routes that minimize the likelihood of encountering ice conditions that exceed a ship’s physical capabilities for safe navigation. Ideally, routes are planned for areas where ice conditions are predictable and do not exceed the range for which the ship was built. Nonetheless, ships may encounter unexpected ice conditions in locations and during times of year when sea-ice coverage exhibits a high degree of seasonal or interannual variability. At best, these encounters require the ship to take an alternate route and incur additional costs and time delays. At worst, encounters damage structural elements of the ship and threaten mariner safety (Kujala and Arughadhoss, 2012; Kubat et al., 2015). Numerous recent incidents in which ships have become beset in sea ice on major Arctic shipping routes underscore the importance of situational awareness with respect to spatiotemporal variability in ice conditions (Kubat et al., 2013; Bennetts, 2021; Vanhatalo et al., 2021).
In this study, February was the least variable month in terms of PC ship accessibility. June, September, and November showed considerable interannual variability. Interannual variability in ship accessibility during June differed from other months in that high variability in PC7 accessibility was observed as far south as the northern Bering Sea. While sea ice in February also extended as far south as it did in June, it did so in the form of thin, first-year ice and was consistently navigable by PC7 ships. On the other hand, in June, ice thaws and ice sheets break up into separate segments or floes that are more susceptible than pack ice to movement by surface winds and currents (Hwang et al., 2017).
Polar class ship accessibility in June was also relatively variable on an interannual basis in waters north of the Bering Strait, especially in coastal regions adjacent to mainland Russia and the United States (Alaska). Waters in the western Beaufort Sea, encompass the westernmost portion of the Northwest Passage, which has hosted more shipping activity in recent years from commercial traffic, e.g., bulk carriers and general cargo ships, and from passenger vessels, e.g., cruise ships and pleasure craft (Boylan and Elsberry, 2019; Gunnarsson, 2021; PAME, 2021). These vessel types typically lack ice strengthening, and passenger vessels in particular plan voyages well in advance of getting underway, making this maritime sector potentially more prone than others to unexpected and unsafe encounters with ice hazards.
In contrast, large areas of the East Siberian Sea were consistently ice covered in June, making the region always inaccessible to PC7 ships. This region includes the eastern portion of the Northern Sea Route. Knowledge among ship operators that conditions are always unfavorable for PC7 ships in this region during June could inform route planning and real-time decisions to avoid the area, mitigating potential risk. In contrast, the region was always accessible to PC5 and PC3 ships in the four months that we examined. In September and November, vast regions of the study site north of the Bering Strait exhibited high interannual variability for all three polar classes, but especially for PC7 ships. Maximum RIOrange values calculated for PC7 ships were observed off northern Alaska during November. While climate-driven declines in sea-ice coverage in the Arctic Ocean may create opportunities for polar maritime traffic in general, our results show that the Arctic environment remains highly unpredictable on smaller (regional and local) spatial scales. Real possibilities exist for planning miscalculations. Shipping industry leaders have said that Arctic shipping routes will remain undesirable for commercial maritime traffic (Lasserre, 2018) due, in part, to the high degree of variability in transit time caused by shifting ice conditions and unpredictable weather. This could be especially problematic for maritime sectors driven by a just-in-time supply model, which is less accommodating of time delays caused by ships using alternate routes to avoid unexpected and unfavorable ice conditions (as cited in Roscoe et al., 2014). Consider November 2021, when the media reported that at least 20 commercial ships, including 18 cargo vessels and two oil tankers without ice strengthening, were beset in sea ice while transiting the Northern Sea Route. The incidents occurred when ships were underway north of Russia in early November, and the annual autumn freeze-up occurred earlier and faster than in previous years (Bennetts, 2021). If Arctic shipping continues to expand, regardless of whether ships are ice-strengthened, planners may consider the need for greater ice breaker support capabilities and emergency response assets in key areas to improve maritime safety where and when ice conditions are most unpredictable.
Most ship operators concerned with balancing safety risks with economic factors may already practice due caution in ice-prone regions of the Arctic Ocean and avoid areas where ice conditions are unpredictable from year to year. If so, unpredictable ice conditions may pose less of a risk to mariners than otherwise thought. To determine the extent to which ships have been recently operating in newly accessible areas or highly variable areas, we superimposed shipping activity over three-day periods in February, June, September, and November 2021 onto PC7 ship-accessibility maps. Because most commercial ships are not ice-strengthened, ship-accessibility maps for PC7 vessels were likely most representative of conditions encountered by the maritime community as a whole.
In general, ships were active mainly in ice-free water south of the Bering Strait. This result was expected given that most ships are commercial vessels that are not ice-strengthened. Some ships operated in water that was accessible to PC7 ships in some years but inaccessible in others; however, RIOrange was relatively low (<30) in these areas during the study. With the exception of June, few ships occurred where interannual variability was high (RIOrange > 30). However, during June, nearly half of all ships south of the Bering Strait in June operated in highly variable areas. Of those, 68% were commercial fishing vessels. Already one of the world’s most dangerous industries, fishing vessels accidents are among the most frequent reasons for emergency response calls in the U.S. Bering Sea region (U.S. Coast Guard, 2008). We suggest that fishing vessel exposure to ice hazards in this region is not likely to decline in the future as fishing vessels often operate near the ice edge to gain early access to newly exposed fishing grounds in the spring (Rampal et al., 2009).
Moreover, several authors have documented poleward shifts in the distribution of important commercial groundfish species, such as walleye pollock (Gadus chalcogrammus) and Pacific cod (G. macrocephalus), which make up the bulk of targeted commercial fish in the Bering Sea (Stevenson and Lauth, 2019; Rooper et al., 2021). Similar poleward range shifts have been seen in small pelagic fishes of commercial interest, including juvenile sockeye salmon (Oncorhynchus nerka; Yasumiishi et al., 2020). If our results from June 2021 reflect commercial fishing vessel distribution typical for the month, climate change may provide incentive for ships to follow fish populations further north into regions with highly variable ice conditions from year to year. If so, maritime authorities may consider prioritizing emergency response capabilities for the northern Bering Sea region during June and other early-summer months.
North of the Bering Strait, ships were uncommon during February and June, and few operated in areas of gradually increasing accessibility or high interannual variability. Only two ships were present in areas where accessibility significantly increased over time, but they only passed through these areas as opposed to exhibiting a preference for them. Areas opening up to ship traffic in northern Arctic seas may be undesirable to ship operators if they occur in regions off the beaten path where there is no cost or time incentive to travel. Newly accessible areas may also be unavailable to ships in a practical sense if they are surrounded by ice that is inaccessible. This was the case for most areas in the Chukchi Sea and East Siberian Sea that had become more accessible to PC3, PC5, and PC7 ships over the last 10-11 years. This finding highlights the need for future projections about Arctic shipping based on sea-ice declines to incorporate a spatially explicit, network-based approach to evaluating whether ships can access seas becoming navigable for the first time under the new climate regime as well as the costs and benefits of travelling there. Related to this observation is that most shipping activity north of the Bering Strait in September and November occurred in the southernmost regions of the Arctic, along coastlines and in open water or thin first-year ice even though waters to the north were accessible. In September 2021, only four vessels (of 348 ships total) were active in the study site’s highest latitudes, where PC7 ship accessibility was highly variable or where PC7 could not safely access. Presumably, those ships had PC ratings higher than PC7.
In conclusion, global climate change continues to promote rapid change in the Arctic marine landscape, driving sea-ice declines that allow for shipping activity at the world’s highest northern latitudes. Our study shows that ice coverage affecting access by PC ships has been variable, sometimes highly so, over seasonal and interannual temporal scales. How long these conditions will persist into the future as climate change continues to drive sea-ice loss in the Arctic Ocean remains to be seen. Long-term predictions for ship accessibility in the Arctic Ocean vary among climate models (Stephenson et al., 2013), but spatiotemporal variability is a common feature of most projections (e.g., Stephenson and Smith, 2015). Even so, shelf areas of the Arctic Ocean are forecast to be ice-free during summer within the next 25−30 years (Årthun et al., 2021), and the Arctic Ocean as a whole is expected to be ice-free in summer months by 2100 (Boé et al., 2009). In the winter months, some areas, such as the Barents Sea, may be ice-free by the turn of the century (Årthun et al., 2021). If so, spatiotemporal variability in ship accessibility described in this study could represent a transitional state in a long-term progression toward an ice-free Arctic. If projections are correct and commercial ship traffic continues to expand poleward (Stephenson et al., 2013; Huntington et al., 2015; Aksenov et al., 2017; U.S. Committee on the Marine Transportation System, 2019; Min et al., 2021), a similar analysis of ship accessibility trends should be conducted for non-ice-strengthened ships and for other regions of the Arctic Ocean.
Sea-ice shapefiles are publicly available on the U.S. National Ice Center website. Inquiries regarding the availability of the model used to generate ship-accessibility maps can be directed to the U.S. National Ice Center.
LV: Data curation, Formal analysis, Writing -original draft, Writing – review and editing. KH: Conceptualization, Writing -original draft, EB: Conceptualization, Writing – review and editing. AD, MM: Data curation, Formal analysis, Writing – review and editing. All authors contributed to the article and approved the submitted version.
This research was supported by an appointment to the Visiting Faculty Scientist Program at the National Geospatial-Intelligence Agency (NGA), administered by the Oak Ridge Institute for Science and Education through an interagency agreement between the United States Department of Energy and NGA.
We are grateful for contributions from M. Ortiz, B. McDonald, D. Holland, and G. Pavur, who assisted in developing the analytical tools and data products used in this study. We also thank the two reviewers for their constructive feedback on the original manuscript.
The authors declare that the research was conducted in the absence of any commercial or financial relationships that could be construed as a potential conflict of interest.
All claims expressed in this article are solely those of the authors and do not necessarily represent those of their affiliated organizations, or those of the publisher, the editors and the reviewers. Any product that may be evaluated in this article, or claim that may be made by its manufacturer, is not guaranteed or endorsed by the publisher.
Aksenov Y., Popova E. E., Yool A., Nurser A. J. G., Williams T. D., Bertino L., et al. (2017). On the future navigability of Arctic sea routes: high resolution projections of the Arctic ocean and sea ice. Mar. Policy 75, 300317. doi: 10.1016/j.marpol.2015.12.027
American Bureau of Shipping (2016). IMO Polar code advisory (Houston, TX: American Bureau of Shipping), 68.
Årthun M., Onarheim I. H., Dörr J., Eldevik T. (2021). The seasonal and regional transition to an ice-free Arctic. Geophys. Res. Lett. 48, e2020GL090825. doi: 10.1029/2020GL090825
Babb D. G., Galley R. J., Howell S. E. L., Landy J. C., Stroeve J. C., Barber D. G. (2022). Increasing multi-year sea ice loss in the Beaufort Sea: a new export pathway for the diminishing multiyear ice cover of the Arctic ocean. Geophys. Res. Lett. 49, e2021GL097595. doi: 10.1029/2021GL097595
Bennetts M. (2021) Early Arctic sea freeze traps Arctic ships in ice near Russia (The Times). Available at: http://www.thetimes.co.uk/article/early-arctic-sea-freeze-traps-18-ships-in-ice-near-russia-c93lz7fkx (Accessed February 1, 2023).
Boé J., Hall A., Qu X. (2009). September Sea-ice cover in the Arctic ocean projected to vanish by 2100. Nat. Geosci. 2, 341343. doi: 10.1038/NGEO467
Boylan B. M., Elsberry D. T. (2019). Increased maritime traffic in the Arctic: implications for international cooperation and security (Fairbanks, USA: Center for Arctic Policy Studies, University of Alaska).
Eguíluz V. M., Fernández-Gracia J., Irigoien X., Duarte C. M. (2016). A quantitative assessment of Arctic shipping in 2010−2014. Nat. Sci. Rep. 6, 30682. doi: 10.1038/srep30682
Esri (2022a). World countries (Generalized) [shapefile]. Available at: https://hub.arcgis.com/datasets/esri::world-countries-generalized/about (Accessed May 22, 2023).
Fournier M., Hilliard R. C., Rezaee S., Pelot R. (2018). Past, present, and future of the satellite-based automatic identification system: areas of applications, (2004−2016). WMU J. Maritime Affairs 17, 311345. doi: 10.1007/s13437-018-0151-6
Gunnarsson B. (2021). Recent ship traffic and developing shipping trends on the northern Sea route – policy implications for future Arctic shipping. Mar. Policy 124, 104369. doi: 10.1016/j.marpol.2020.104369
Gunnarsson B., Moe A. (2021). Ten years of international shipping on the northern Sea route: trends and challenges. Arctic Rev. Law Politics 12, 430. doi: 10.23865/arctic.v12.2614
Huntington H. P., Daniel R., Hartsig A., Harun K., Heiman M., Meehan R., et al. (2015). Vessels, risks, and rules: planning for safe shipping in Bering strait. Mar. Policy 51, 119127. doi: 10.1016/j.marpol.2014.07.027
Hwang B., Wilkinson J., Maksym T., Graber H. C., Schweiger A., Horvat C., et al. (2017). Winter-to-summer transition of Arctic sea ice breakup and floe size distribution in the Beaufort Sea. Elementa: Sci. Anthropocene 5, 40. doi: 10.1525/elementa.232
International Association of Classification Societies (2016) IACS unified requirements for PC ships. IACS requirements 2011. Available at: https://iacs.org.uk/publications/unified-requirements/ur-i/ (Accessed May 1, 2023).
International Maritime Organization. (2017). International code for ship operating in polar waters (POLAR CODE). (MEPC 68/21) Geneva, Switzerland.
Isaksen K., Nordli Ø., Ivanov B., Køltzow M. A. Ø., Aaboe S., Gjelten H. M., et al. (2022). Exceptional warming over the barents area. Sci. Rep. 12, 9371. doi: 10.1038/s41598-022-13568-5
Kubat I., Fowler D., Sayed M. (2015). “Chapter 18: floating ice and ice-pressure challenge to ships,” in Snow and ice-related hazards, risks, and disasters. Eds. Chroder J. F., Haeberli W., Whiteman C. (Waltham, MA, USA: Elsevier, Inc.), 641–669.
Kubat I., Sayed M., Babaei M. H. (2013). “Analysis of besetting incidents in Frobisher bay during 2012 shipping season,” in Proceedings of the 22nd International Conference on Port and Ocean Engineering under Arctic Conditions, Espoo, Finland.
Kujala P., Arughadhoss S. (2012). Statistical analysis of ice-crushing pressures on a ship’s hull during hull-ice interaction. Cold Regions Sci. Technol. 70, 111. doi: 10.1016/j.coldregions.2011.09.009
Lasserre F. (2018). “Chapter 20: Arctic shipping: more ships will come but not for transit,” in From science to policy in the Eastern Canadian artic: an integrated regional impact study (IRIS) of climate change and modernization. Eds. Bell T., Brown T. M. (Quebec City: ArcticNet), 509521.
Lindborg E., Andersson P. (2020). The costs of icebreaking services: an estimation based on Swedish data. WMU J. Maritime Affairs 19, 125142. doi: 10.1007/s13437-019-00191-x
Marchenko N., Andreassen N., Borch O. J., Kuznetsova S. Y., Ingimundarson V., Jakobsen U. (2018). Arctic Shipping and risks: emergency categories and response capacities. TransNav 12, 1. doi: 10.12716/1001.12.01.12
Meier W. N. (2017). “Losing Arctic sea ice: observations of the recent decline and the long-term context,” in Sea Ice, 3rd ed. Ed. Thomas D. N. (West Sussex, U.K: John Wiley & Sons), 290303.
Min C., Yang Q., Chen D., Yang Y., Zhou X., Shu Q., et al. (2021). The emerging Arctic shipping corridors. Geophys. Res. Lett. 49, e2022GL099157. doi: 10.1029/2022GL0991574
Moore G. W. K., Steele M., Schweiger A. J., Zhang J., Laidre K. L. (2022). Thick and old sea ice in the Beaufort Sea during summer 2020/21 was associated with enhanced transport. Commun. Earth Environ. 3, 198. doi: 10.1038/s43247-022-00530-6
National Aeronautical and Space Agency (NASA) (2022) Arctic Sea Ice minimum extent. Available at: https://climate.nasa.gov/vital-signs/arctic-sea-ice/ (Accessed February 1, 2023).
NSIDC (National Snow and Ice Data Center) (2022a) Arctic Sea ice maximum at tenth lowest record in satellite history. Available at: http://nsidc.org/arcticseaicenews/2022/03/ (Accessed February 1, 2023).
NSIDC (National Snow and Ice Data Center) (2022b) Charctic interactive sea ice graph. Available at: https://nsidc.org/arcticseaicenews/charctic-interactive-sea-ice-graph/ (Accessed February 1, 2023).
PAME (Protection of the Arctic Marine Environment) (2020) The increase in Arctic shipping 20132019. Arctic shipping status report (ASSR) 1. Available at: https://www.pame.is/projects-new/arctic-shipping/pame-shipping-highlights/411-arctic-shipping-status-reports (Accessed February 1, 2023).
PAME (Protection of the Arctic Marine Environment) (2021) Shipping in the Northwest passage. Arctic shipping status report (ASSR) 3. Available at: https://www.pame.is/projects-new/arctic-shipping/pame-shipping-highlights/411-arctic-shipping-status-reports (Accessed February 1, 2023).
Parkinson C. L., DiGirolamo N. E. (2021). Sea Ice extents continue to set new records: Arctic, Antarctic, and global results. Remote Sens. Environ 267, 112753. doi: 10.1016/j.rse.2021.112753
Rampal P., Weiss J., Marsan D. (2009). Positive trend in the mean speed and deformation rate of Arctic sea ice 1979−2007. J. Geophys. Res. 114, C05013. doi: 10.1029/2008JC005066
Rooper C. N., Ortiz I., Hermann A. J., Lamean N., Chang W., Kearney K., et al. (2021). Predicted shifts of groundfish distribution in the Eastern Bering Sea under climate change, with implications for fish populations and fisheries management. ICES J. Mar. Sci. 78 (1), 220234. doi: 10.1093/icesjms/fsaa215
Roscoe H. C., Campagna P. F., McNulty D. (2014). Improving arctic safety in the U.S. Arctic. Joint Force Q. 72, 82–87.
Solakivi T., Kiiski T., Ojala L. (2018). The impact of ice class on the economics of wet and dry bulk shipping in the arctic waters. Maritime Policy Manage. 45 (4), 530542. doi: 10.1080/03088839.2018.1443226
Stephenson S. R., Smith L. C. (2015). Influence of climate model variability on projected Arctic shipping futures. Earth Future 3, 331343. doi: 10.1002/2015EF000317
Stephenson S. R., Smith L. C., Brigham L. W., Agnew J. A. (2013). Projected 21st-century changes to Arctic marine access. Climatic Change 118, 885899. doi: 10.1007/s10584-012-0685-0
Stevenson D. E., Lauth R. R. (2019). Bottom trawl surveys in the northern Bering Sea indicate recent shifts in the distribution of marine species. Polar Biol. 42, 407421. doi: 10.1007/s00300-018-2431-1
Stoddard M. A., Etienne L., Fournier M., Pelot R., Beveridge L. (2016). “Making sense of Arctic maritime traffic using the polar operational limits assessment Risk indexing system (POLARIS),” in IOP Conference Series, Earth and Environmental Science. 012034. doi: 10.1088/17551315/34/1/012034
Stroeve J., Notz D. (2018). Changing state of sea ice across all seasons. Environ. Res. Lett. 13 (10), 103001. doi: 10.1088/1748-9326/ade56
Transport Canada (1998) Arctic Ice regime shipping system (AIRSS) standards (Ottawa: Transport Canada). Available at: https://tc.canada.ca/en/marine-transportation/marine-safety/arctic-ice-regime-shipping-system-airss (Accessed February 1, 2023).
The MathWorks Inc. (2021). MATLAB version: 9.10.0 (R2021a), Natick, Massachusetts: The MathWorks Inc.
U.S. Coast Guard (2008). Analysis of fishing vessel casualties: a review of lost fishing vessels and crew fatalities 19932007 (U.S. Coast Guard, Washington, D.C: Compliance Analysis Division).
U.S. Coast Guard (2022) Types of automatic identification systems (per ITU-r M.1371 and IEC standards). Available at: https://navcen.uscg.gov/types-of-ais (Accessed February 1, 2023).
U.S. Committee on the Marine Transportation System (2019). A ten-year projection of maritime activity in the U.S. Arctic region 2020–2030 (Washington, D.C.), 118.
Vanhatalo J., Huuhtanen J., Bargström M., Helle I., Mäkinen J., Kujala P. (2021). Probability of a ship becoming beset in ice along the northern Sea route – a Bayesian analysis of real-life data. Cold Regions Sci. Technol. 184, 103238. doi: 10.1016/j.coldregions.2021.103238
Wadhams P. (2003) How does Arctic sea ice form and decay? Available at: https://www.pmel.noaa.gov/arctic-zone/essay_wadhams.html (Accessed February 1, 2023).
World Meteorological Organization (WMO) (2014) Sea Ice nomenclature (WMO). Available at: https://library.wmo.int/index.php?lvl=notice_display&id=6772#.ZF5xi3bMKUk (Accessed May 12, 2012). 5th Session of the JCOMM Expert Team on Sea Ice.
Yasumiishi E. M., Cieciel K., Andrews A. G., Murphy J., Dimond J. A. (2020). Climate-related changes in the biomass and distribution of small pelagic fishes in the eastern Bering Sea during late summer 2002−2018. Deep Sea Res. Part II Trop. Stud. I Oceanogr. 104907, 181182. doi: 10.1016/j.dsr2.2020.104907
Keywords: Arctic, icebreakers, climate change, sea ice, Polar Code
Citation: Vlietstra LS, Hinrichs KR, Bernstein ER, Darden A and Martino M (2023) Polar class ship accessibility to Arctic seas north of the Bering Strait in a decade of variable sea-ice conditions. Front. Mar. Sci. 10:1171958. doi: 10.3389/fmars.2023.1171958
Received: 22 February 2023; Accepted: 17 May 2023;
Published: 29 June 2023.
Edited by:
John Falkingham, International Ice Charting Working Group, CanadaReviewed by:
Jan L. Lieser, Bureau of Meteorology, AustraliaCopyright © 2023 Vlietstra, Hinrichs, Bernstein, Darden and Martino. This is an open-access article distributed under the terms of the Creative Commons Attribution License (CC BY). The use, distribution or reproduction in other forums is permitted, provided the original author(s) and the copyright owner(s) are credited and that the original publication in this journal is cited, in accordance with accepted academic practice. No use, distribution or reproduction is permitted which does not comply with these terms.
*Correspondence: Lucy S. Vlietstra, THVjeS5TLlZsaWV0c3RyYUB1c2NnYS5lZHU=
†Present address: Alexandra Darden, Data and Digital Innovation, National Geospatial-Intelligence Agency, Springfield, VA, United States
Disclaimer: All claims expressed in this article are solely those of the authors and do not necessarily represent those of their affiliated organizations, or those of the publisher, the editors and the reviewers. Any product that may be evaluated in this article or claim that may be made by its manufacturer is not guaranteed or endorsed by the publisher.
Research integrity at Frontiers
Learn more about the work of our research integrity team to safeguard the quality of each article we publish.