 Daniel Marrable1*
 Sawitchaya Tippaya1
 Kathryn Barker1
 Euan Harvey2
 Stacy L. Bierwagen3
 Mathew Wyatt4
 Scott Bainbridge3
 Marcus Stowar3
- 1Curtin Institute for Computation, Curtin University, Perth, WA, Australia
- 2Curtin University, School of Molecular and Life Sciences, Perth, WA, Australia
- 3Australian Institute of Marine Science, Townsville, QLD, Australia
- 4Australian Institute of Marine Science, Indian Ocean Marine Research Centre, The University of Western Australia, Perth, WA, Australia
Assessing the health of fish populations relies on determining the length of fish in sample species subsets, in conjunction with other key ecosystem markers; thereby, inferring overall health of communities. Despite attempts to use artificial intelligence (AI) to measure fish, most measurement remains a manual process, often necessitating fish being removed from the water. Overcoming this limitation and potentially harmful intervention by measuring fish without disturbance in their natural habitat would greatly enhance and expedite the process. Stereo baited remote underwater video systems (stereo-BRUVS) are widely used as a non-invasive, stressless method for manually counting and measuring fish in aquaculture, fisheries and conservation management. However, the application of deep learning (DL) to stereo-BRUVS image processing is showing encouraging progress towards replacing the manual and labour-intensive task of precisely locating the heads and tails of fish with computer-vision-based algorithms. Here, we present a generalised, semi-automated method for measuring the length of fish using DL with near-human accuracy for numerous species of fish. Additionally, we combine the DL method with a highly precise stereo-BRUVS calibration method, which uses calibration cubes to ensure precision within a few millimetres in calculated lengths. In a human versus DL comparison of accuracy, we show that, although DL commonly slightly over-estimates or under-estimates length, with enough repeated measurements, the two values average and converge to the same length, demonstrated by a Pearson correlation coefficient (r) of 0.99 for n=3954 measurement in ‘out-of-sample’ test data. We demonstrate, through the inclusion of visual examples of stereo-BRUVS scenes, the accuracy of this approach. The head-to-tail measurement method presented here builds on, and advances, previously published object detection for stereo-BRUVS. Furthermore, by replacing the manual process of four careful mouse clicks on the screen to precisely locate the head and tail of a fish in two images, with two fast clicks anywhere on that fish in those two images, a significant reduction in image processing and analysis time is expected. By reducing analysis times, more images can be processed; thereby, increasing the amount of data available for environmental reporting and decision making.
1 Introduction
It is estimated that one third of global fish stocks are overfished (Duarte et al., 2020) which impacts the ecosystem services provided by fish (Steneck and Pauly, 2019). Numerous management actions at local, national and international scales will be required to rebuild fish stocks by improving governance, including lowering fishing pressure; implementing harvest controls which limit the types of gear used and the size and number of fish caught; and the use of closed-area management or sanctuaries (MacNeil et al., 2020; Melnychuk et al., 2021). Fishery-dependent information from traps, hook and line, trawls and nets has provided much of the data for monitoring the status of fish populations. With the implementation of closed areas and sanctuaries, there has been an increase in the interest of fishery-independent sampling techniques, as many of the conventional sampling techniques are not permissible. Fishery-independent techniques have largely been based on underwater visual census (UVC) (Brock, 1954). Baited remote underwater video systems (BRUVS) (Ellis and DeMartini, 1995; Cappo et al., 2001; Cappo et al., 2003) can collect a relative abundance of data on a range of fish species from numerous habitats and depths (Harvey et al. 2021). While estimates of abundance are an important metric, accurate and reliable information on the length and size of fish within wild populations is more useful (Jennings and Polunin, 1997; Jennings and Kaiser, 1998). This is because it has been shown that fishing and other impacts decrease the mean length, length frequency and biomass of fish populations (Roberts, 1995; McClanahan et al., 1999). For UVC, biomass is calculated from fish length based on visual estimates by SCUBA divers (Wilson et al., 2018) with the standing biomass of fish thought to be a good metric for expressing the health of fish populations (Friedlander and DeMartini, 2002; Seguin et al., 2022). But these estimates have been demonstrated to be neither accurate nor precise, which can affect biomass estimates (Harvey et al., 2002). Stereo video systems are a more accurate and precise technique for non-destructively estimating the lengths of fish (Harvey and Shortis, 1995; Harvey et al., 2001a; Harvey et al., 2010) and have been modified for use by SCUBA divers (Goetze et al., 2019), remotely operated vehicles (ROVs) (Schramm et al., 2020; Jessop et al., 2022; Hellmrich et al., 2023) and BRUVS (Harvey et al., 2007; Langlois et al., 2020; Harvey et al. 2021).
Determining the size and quantity of fish populations in a specific area is crucial to understanding and assessing the health of fish stocks so that informed decisions can be made about sustainable fishing and management practices (Pauly et al., 2002). Fish measurement provides important information in the context of stock assessment by monitoring changes in the size of fish, which gives insight into the impacts of fishing and other factors on the overall health of fish communities and ecosystems.
Automation has the potential to improve the accuracy, efficiency and consistency of fish measurement (e.g. Shortis, 2015; Marrable et al., 2022) to reliably increase the accuracy of stock assessment information that can then be used to support and design improvements to sustainable fishing practices which protect fish populations and ecosystems. Some benefits of using automation include: 1) improved accuracy – automated systems can measure fish more precisely than manual methods, reducing the potential for human error; 2) increased efficiency – automated systems can process large numbers of fish much more quickly than manual methods, reducing the time and effort required for stock assessments; 3) consistent data – automated systems can provide consistent and standardised measurements, reducing the potential for variation due to differences in the way measurements are taken; 4) reduced labour – automated systems can reduce the need for manual labour, freeing up resources for other tasks and potentially reducing costs.
1.1 Traditional approaches to measuring fish
Existing methods that enhance manual measurement by using automation and computer vision have the potential to support fishing operations and ecosystem monitoring; however, these remain inaccessible to most small-scale fisheries due to their associated high cost (Andrialovanirina et al., 2020). Even systems that use remote surveillance monitoring to measure, process and count discarded fish via video record once the vessel has returned to port have shown that the analytical processing time required is equally as labour intensive (Needle et al., 2015; French et al., 2019). Such examples provide further justification for the need of computer vision tools to increase the efficiency monitoring for managing vessel operations. Similar challenges are faced by those conducting research in aquaculture and fish ecology. There is a seemingly exponential trend in the availability of automated fish detection tools for researchers, yet their documented use is still minimal, with researchers also requiring ways to measure and track fish (Bradley et al., 2019; Lopez-Marcano et al., 2021).
Assessing the health of fish populations depends on determining the average length of fish in sample population subsets and inferring health in conjunction with other key ecosystem markers. Methods applying the length-based measurement of fish for assessing the health of fisheries have been around for decades (Pauly and Morgan, 1987) with few technological advancements until recently. Manual measurement remains the principal tool in collecting essential management information on board fishing vessels. However, this method is documented as highly time consuming and involves considerable, and potentially harmful, handling of fish to gain accurate measurements (Upton and Riley, 2013). Traditionally, evaluating stock levels has relied on manually measuring fish length, as it is frequently the only possibility where monitoring is limited and collecting length measurements is easier than quantifying a total catch (Rudd and Thorson, 2018). However, this method does not consider the fluctuations in fish recruitment and death rates over time, which is crucial for comprehending the indirect impacts of fishing on predator–prey dynamics and for identifying the factors that influence the structure of fish communities on a larger scale (Jennings and Polunin, 1997). Average length is also considered an operational indicator of fishing impact; whereas indices on the composition of species assemblage are difficult to interpret, average length is well understood and reference points can be set (Rochet and Trenkel, 2003). As well as causing impacts on targeted species, commercial fishing affects bycatch, including by-product and discarded/released species; and sometimes habitats, when fishing gear (e.g. demersal trawling) interacts with the sea floor or benthic zones (Little and Hill, 2021). An increasing range of mechanisms and technical tools is being used to reduce interactions with seabirds, marine mammals, reptiles and other vulnerable species. Such bycatch-reduction measures include tori lines, sprayers, and seal and turtle excluder devices (Cresswell et al., 2022). In Australia, as around the world, guidelines and rules on fish measurement methodology and length quotas are enacted and overseen by governments1.
1.2 The move toward automation
Monitoring devices and advances in data processing and analysis techniques can, and should, form part of an effective monitoring approach. However, data or capacity limitation is widespread in global fisheries resulting in ineffective or non-existent management as a result of this lack of data and/or an inability to generate statistical estimates of stock status. Significant improvements in management outcomes, leading to conservation and livelihood benefits, could be achieved through cost-effective analytical approaches; these exist, but are hampered by a range of challenges, including data availability and requirements; resources for processing and analysis; and a lack of understanding of costs and advantages (Dowling et al., 2016; Cresswell et al., 2022). Deep learning (DL) can address these challenges by replacing the manual, labour-intensive task of precisely locating the heads and tails of fish with computer-vision-based algorithms (e.g. Marrable et al., 2022). White et al. (2006) were the first to test this method with computer vision on a fishing vessel. Measurement using digital imagery is a growing field and has been successfully implemented with both single image (e.g. Lezama-Cervantes et al., 2017; Monkman et al., 2019; Andrialovanirina et al., 2020; Wibisono et al., 2022), and stereo image (e.g. Johansson et al., 2008; Shafait et al., 2017; Suo et al., 2020; Connolly et al., 2021; Lopez-Marcano et al., 2021; Marrable et al., 2022). Datasets now also exist to explicitly support the development of DL algorithms; for instance, segmentation, classification and size estimation (e.g. DeepFish, Garcia-d’Urso et al., 2022).
Automated fish detection has been demonstrated using a range of computer vision methods of measurement targeting single species for aquaculture (Atienza-Vanacloig et al., 2016; Shi et al., 2020; Yang et al., 2021). Some invasive methods of measurement involve channelling fish past stationary cameras (Miranda and Romero, 2017; Shafait et al., 2017), or methods which use active sources of light, such as sonar (Uranga et al., 2017), which are potentially stressful to the fish. Furthermore, removing fish from the water (White et al., 2006) or measurement on board trawlers (Monkman et al., 2019) adds to fish mortality. These challenges highlight the importance of developing automated methods for non-invasive means of measurement, such as BRUVS.
Although there have been advances in using DL for image analysis, video imagery presents additional complexities and requirements, particularly with regard to curated and structured data (e.g. Marrable et al., 2022).
Recent reviews of machine learning in aquaculture found that there is a need for DL and neural networks to optimise current approaches but have also identified certain pitfalls in the process, including noise, occlusions and dynamic viewing spaces (Yang et al., 2021; Zhao et al., 2021).
Stereo baited remote underwater video systems (stereo-BRUVS) are widely, and increasingly, used as a non-invasive, stressless method for counting and measuring fish in aquaculture, fisheries and conservation management (Harvey and Shortis, 1995; Harvey et al., 2021). Recently, Marrable et al. (2022) demonstrated the application of DL to stereo-BRUVS imagery for the semi-automation of fish identification and early success with species identification. Extending the application of DL to automate fish length measurement would greatly enhance and advance marine environment monitoring, speeding up data collation on localised fish populations and increasing the amount of data that can be processed and used for environmental reporting and decision making. The current limitation of BRUVS is that the data processing is a highly time-consuming manual exercise, prone to human error and is costly, delaying the production of length data and limiting how much BRUVS imagery can be processed (Connolly et al., 2021; Marrable et al., 2022). However, as with species identification, mean length data is highly valuable for determining frequency distributions of fish populations and the spatial and temporal changes required for environmental assessment and reporting. In addition to cost and processing time, BRUVS is limited by the MaxN ecological abundance metric (Whitmarsh et al., 2017), creating an opportunity for a much larger use of the data held within a video, such as including fishery-independent assessments of fishing pressure. Recent use of open-source image processing software to measure fisheries catch has also been successful for a wide range of fish sizes (Andrialovanirina et al., 2020).
1.3 A semi-automated and generalised method of length measurement
Here we present a semi-automated and generalised method of measuring the length of fish using DL with near-human accuracy for numerous species of fish across a wide range of habitats. Speed of analysis is therefore much increased, and demonstrates progress towards the use of stereo-BRUVS for length measurement in fisheries, aquaculture and marine ecology research applications.
2 Method
In this section, we describe the DL method used for locating the heads and tails of fish, combined with a highly precise stereo-BRUVS calibration method method (Shortis, 2015), which makes use of calibration cubes to ensure precision in calculated lengths to the nearest millimetre. Once trained and deployed, this semi-automated approach solves the problem of finding the same fish in both images; that is, the ‘fish correspondence challenge’, with ecologists only having to select the same fish in the left and right images by clicking anywhere on the body, eliminating the need for four very precise clicks on the head and tail in both images. The method is illustrated in Figure 1 and examples of the results in Figure 2.
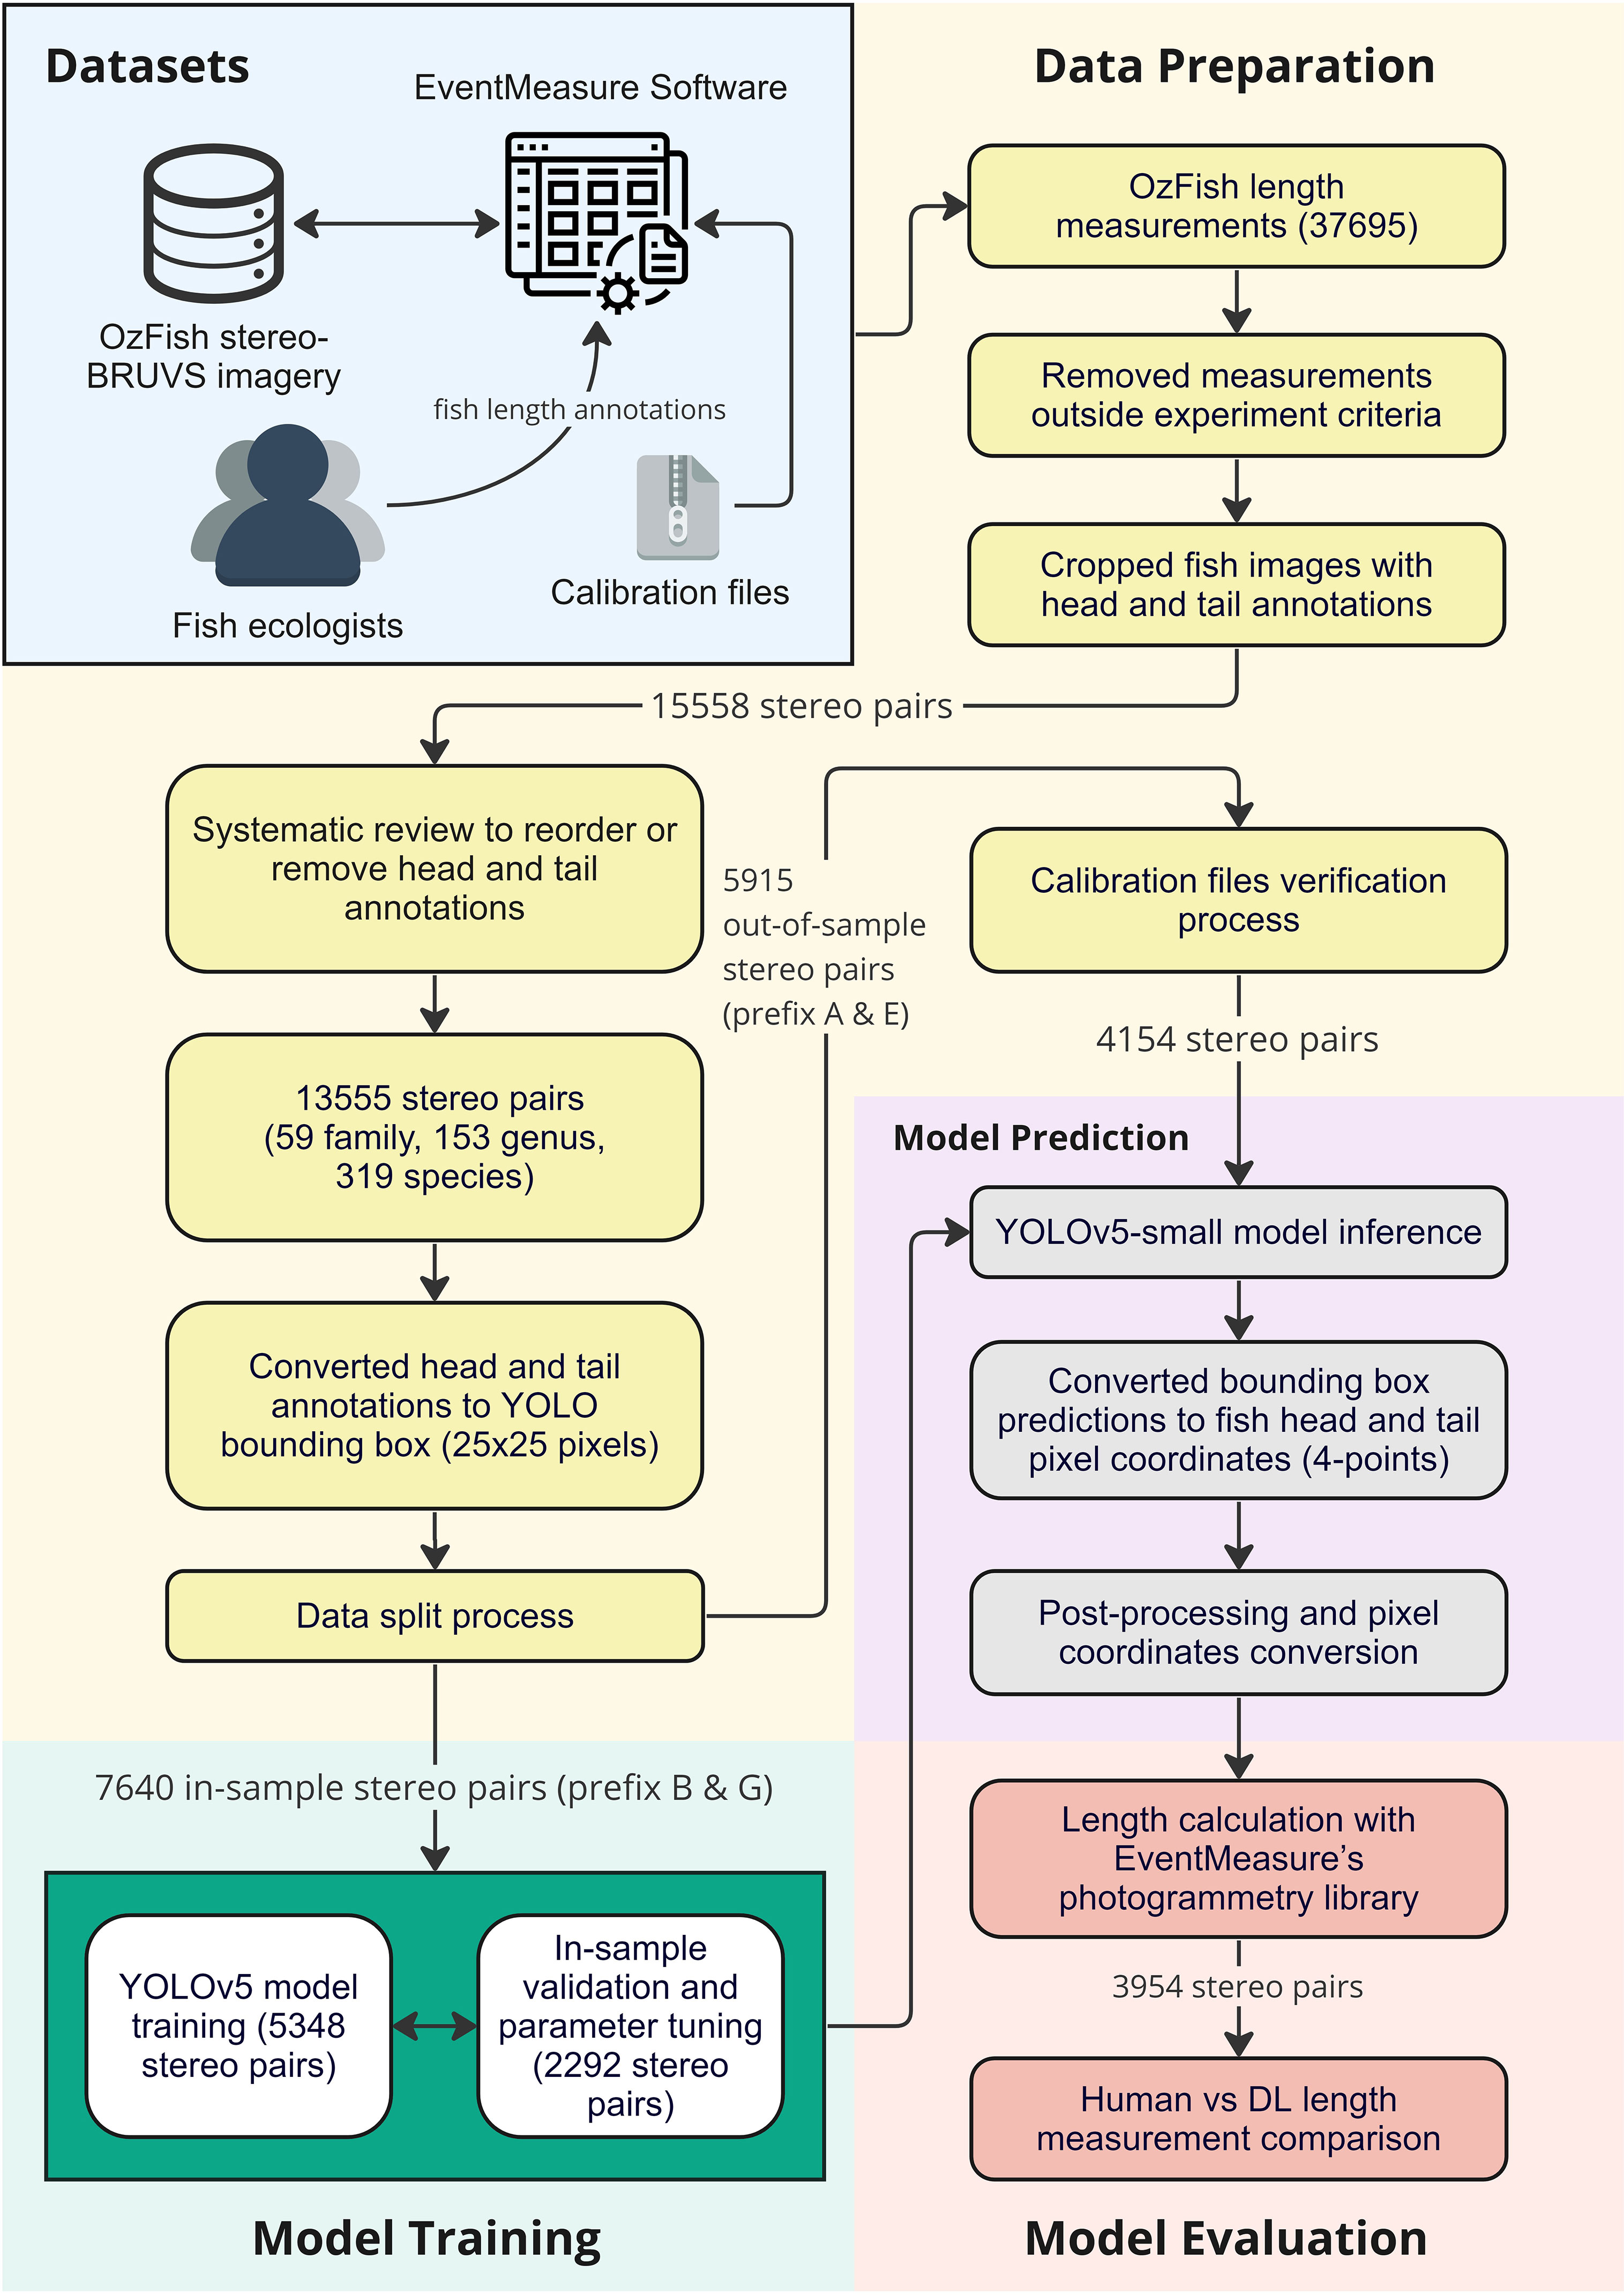
Figure 1 Illustrates the workflow for data preparation, model training and model evaluation.
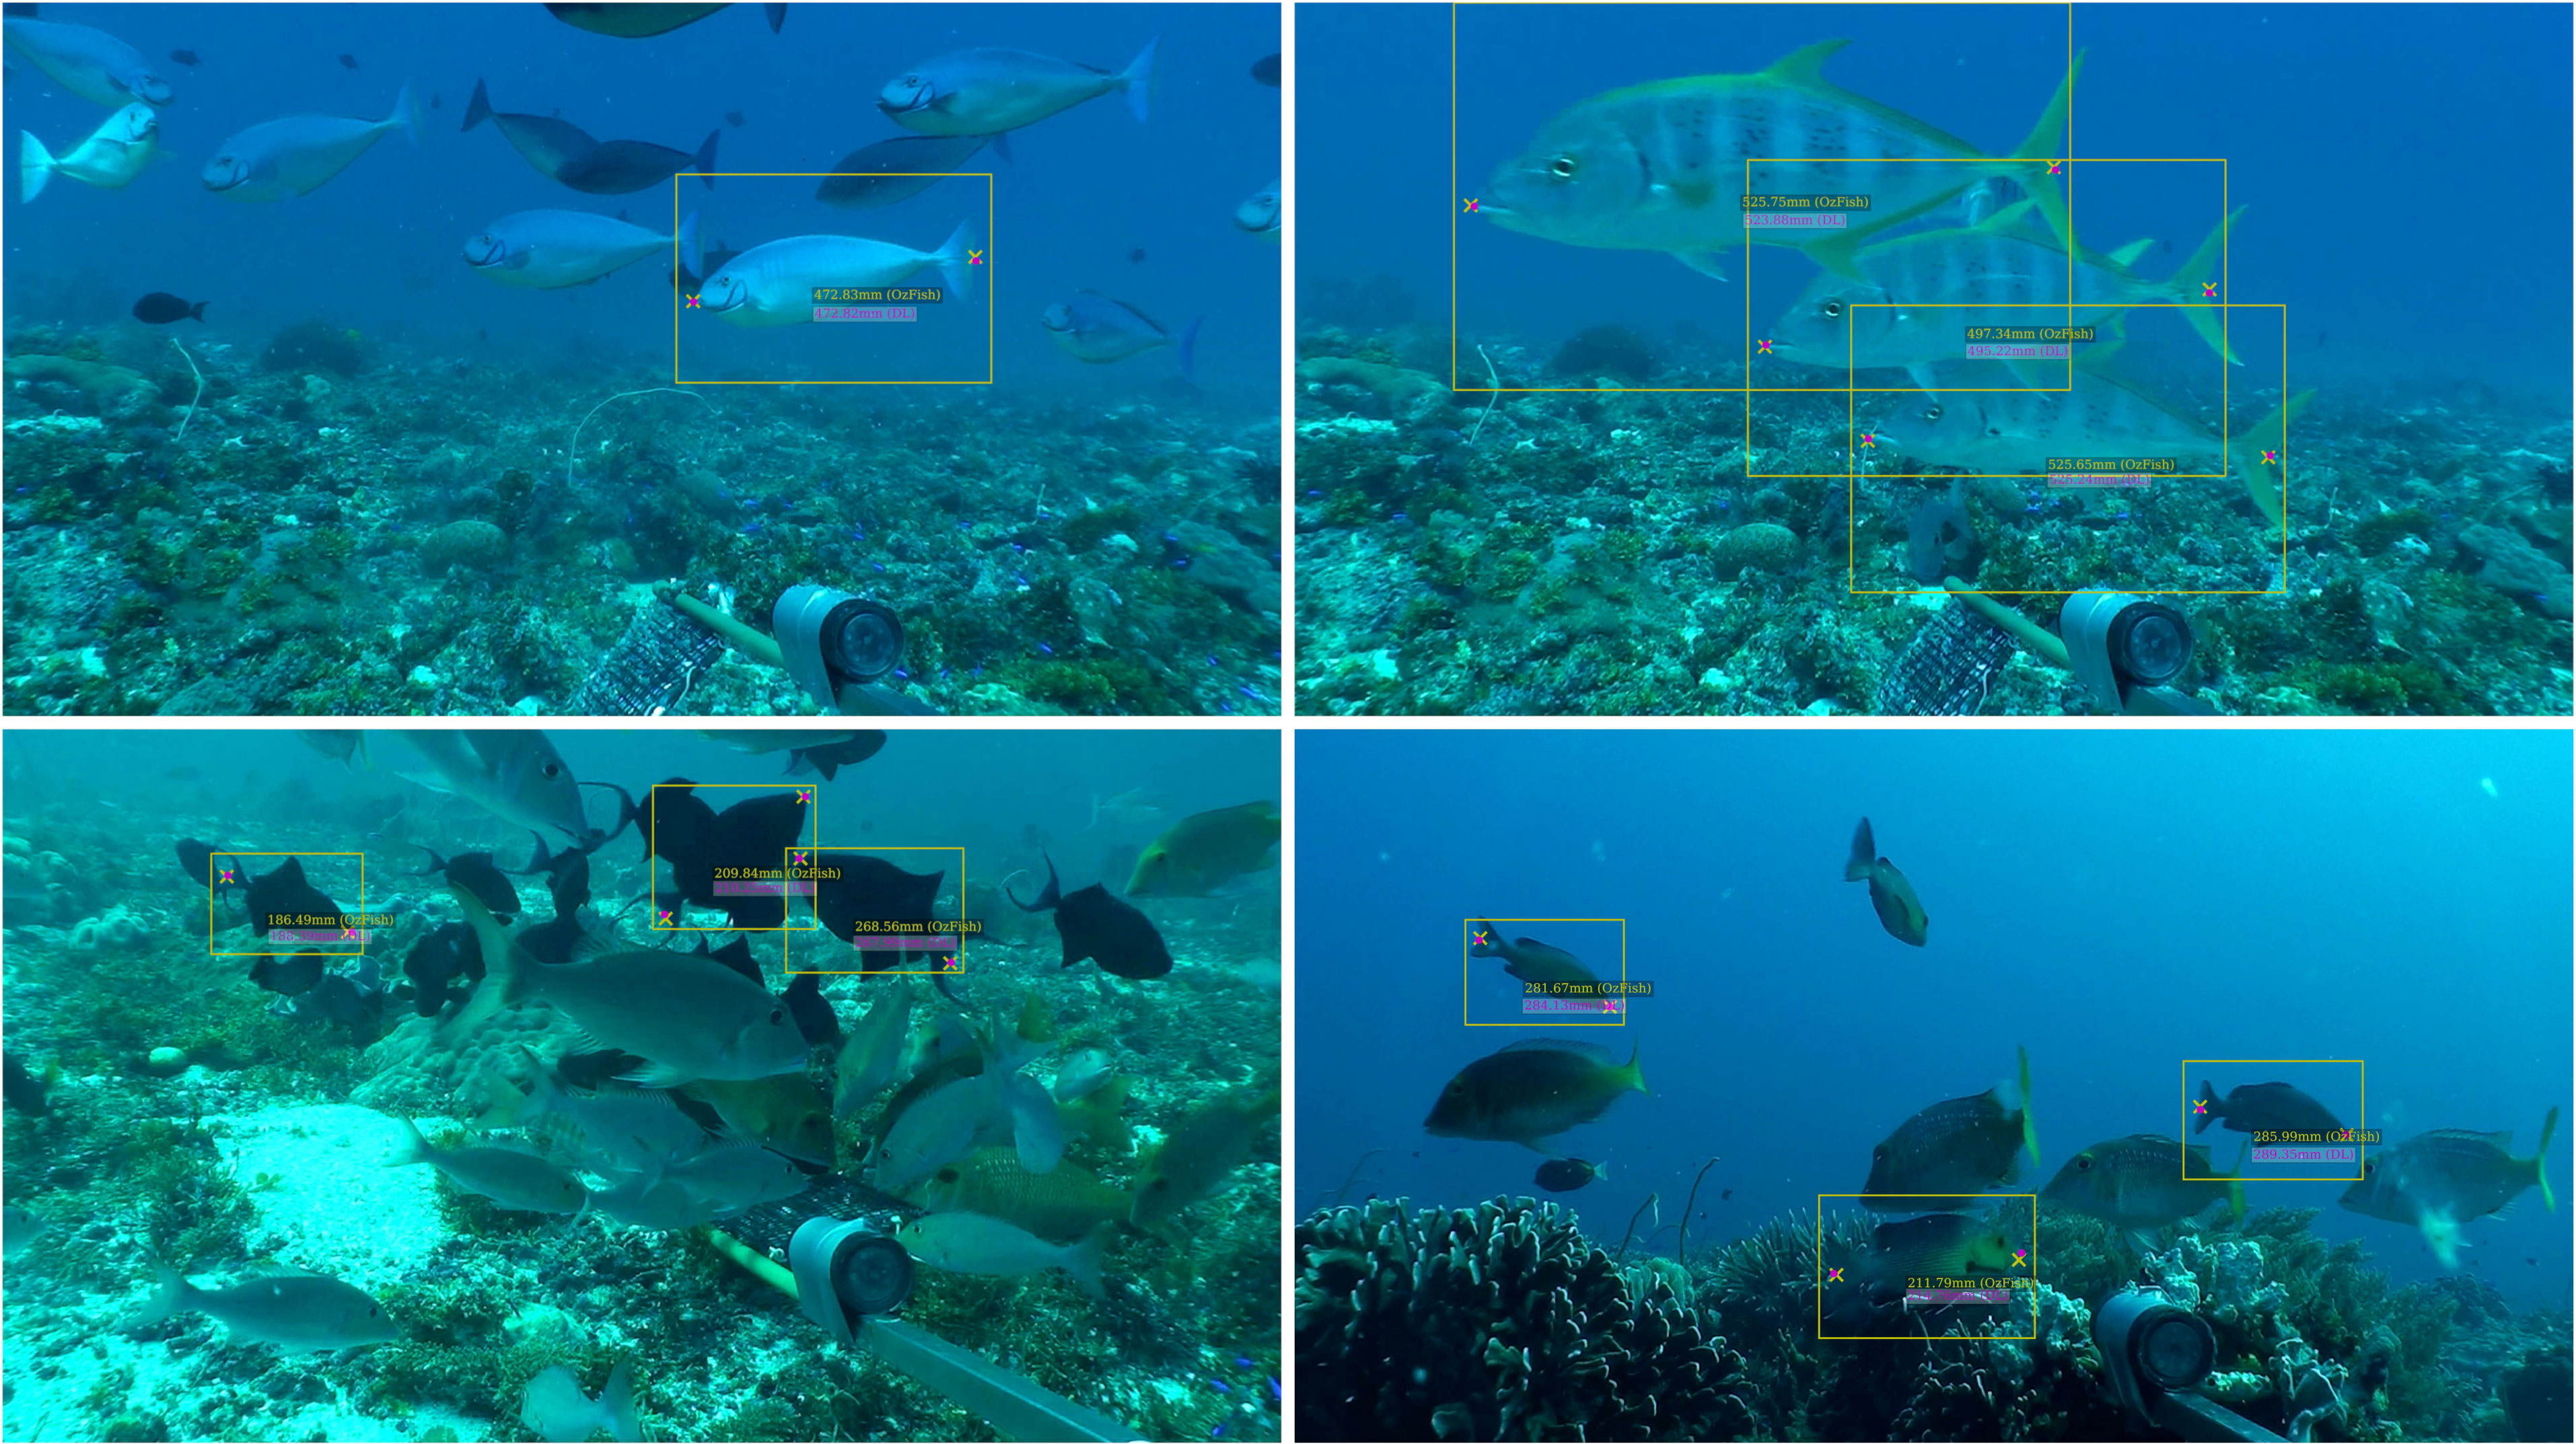
Figure 2 Presents four out-of-sample examples of automated fish length measurements using the method described in this study. The example presents fish of different sizes, habitat and distance from the camera.
2.1 Datasets
The fish length measurement data made available for this study study (Australian Institute Of Marine Science, 2020) was taken from OzFish stereo-BRUVS imagery along with annotations conducted by fish ecologists using EventMeasure. In order to develop a training dataset for the DL model, the head and tail annotations, which were initially made manually by the ecologists, were extracted by exporting the frame number and pixel location of each annotation in the frame from the data files.
The original OzFish dataset has 37695 measurements inside unique bounding boxes which indicate the location and extent of a fish and include markers which identify its head and tail. Crops from pairs of stereo images were taken from the full images to create head and tail stereo pairs. Small fish, or ones far away in the background, were excluded by filtering out any fish objects smaller than 200 pixels in either height or length. Another filter was applied to exclude fish that had been measured with a root mean square (RMS) value >20 mm. The RMS value is calculated by the photogrammetry library in EventMeasure and is an indicator of how close two corresponding points in each image are to the epipolar line calculated by the opposite point. An RMS value greater than 20 mm is considered by SeaGIS (outlined in the EventMeasure software manual) as an imprecise measurement or error in calibration and, therefore, was discarded in this study. This reduced the number of images for training to 15558 stereo pairs of cropped fish images.
2.2 Data preparation
The annotated data in OzFish did not include head or tail labels and does not store the annotations in any particular order. There was no consistent order to which the heads and tails were labelled. Head and tail labels are required to train the DL model to classify them. Therefore, a systematic review of the images was conducted to reorder many of the annotations, resulting in a dataset in which two labels, ‘head’ and ‘tail’ in consistent order, were reliably applied to all of the points for training the DL model.
The final step, before training and testing the system, was to split the data between ‘in-sample’ and ‘out-of-sample’ datasets. The videos in OzFish have had the metadata removed before publishing, although the data were given prefix letters in their filenames to indicate they were taken from different deployments and at different locations. Calibration files required for photogrammetry were only published for the images with the prefix A and E. As these calibration files are needed to do a human versus machine comparison, they were withheld from any training or validation and made up the out-of-sample data used for testing algorithm performance. Images with prefix B and G were not published with calibration files; however, these files were not needed for training the head and tail detection model and made up the in-sample training data.
After filtering the data, a total of 13555 stereo pairs of cropped fish images remained with correct head and tail labels. The available data for training and testing amounted to 59 unique family, 153 unique genus and 319 different species. The in-sample data were split 70% (5348 stereo pairs) for training, and 30% (2292 stereo pairs) for validation and hyperparameter tuning. In this study, the calibration file verification process, taken to ensure that the ground-truth length in OzFish dataset and calculated length using photogrammetry was consistent, resulted in approximately 30% of the out-of-sample data (1761 stereo pairs) being removed. The remaining out-of-sample data comprised 4154 stereo pairs.
2.3 Model training
This study used You Only Look Once (YOLO; Redmon et al., 2016) a type of DL model used in object-detection algorithms. Specifically, the YOLOv5 model, which has been pre-trained on the Common Objects in Context2 (COCO) dataset, was chosen for its ability to handle various sizes, numbers of classes, and computational requirements. The variant used in this study was the ‘YOLOv5 small’ model. To adapt the model for head and tail detection, transfer learning was employed, which built on knowledge gained from the pre-trained model while reducing the amount of training data and time needed. A subset of the in-sample dataset was used to retrain the model according to the standard procedure outlined on the YOLOv5 website3.
The YOLOv5 model needs to be trained by defining the extent of an object of interest (heads and tails in this case) by defining a bounding box. Therefore, the head and tail points in the training data were converted to bounding boxes by defining a box of 25 × 25 pixels around the head and tail points, respectively. Finally, the in-sample training and validation fish crop images with head and tail labels were used to train the YOLOv5 small model. The early-stopping method was also implemented in this study to avoid overfitting the model.
2.4 Model prediction
The head and tail predictions from the object-detection model were converted to overall fish length by first taking the bounding box predictions from the trained DL model and converting them to points by using the centre location of the box in stereo image pairs. On occasions when the DL model failed to find one or two of either a head or a tail in both images, the location of the missing feature was estimated by taking the reflection of one the classifier feature locations in the bounding box of the fish. On occasions when the model returned more than one candidate for a head or tail, the one with the highest confidence score was chosen. On the occasions when predicted head and tail points were inconsistent in both left and right cropped fish images; for example, if head or tail points were swapped, the predicted result was discarded as an incorrect measurement. Once the four required points were returned by the model, the camera calibration files were used along with EventMeasure’s photogrammetry library to calculate the length of the fish.
2.5 Model evaluation
The out-of-sample dataset was used for evaluating the performance of the model and gives an indication of model generalisability and performance in different domains. Inference for both heads and tails was performed on the 4154 out-of-sample data (stereo pairs of cropped fish images), and heads and tails pixel coordinates were converted to the original scale of stereo-BRUVS imagery. EventMeasure’s stereophotogrammetry tool was used to calculate the length of a fish from the four predicted points of head and tail pairs. Two hundred predictions were removed by the post-processing steps described in the previous section, and the remaining 3954 automated measurements were then compared to the manual measurements made by the fish ecologists. Results are presented in Figures 3, 4.
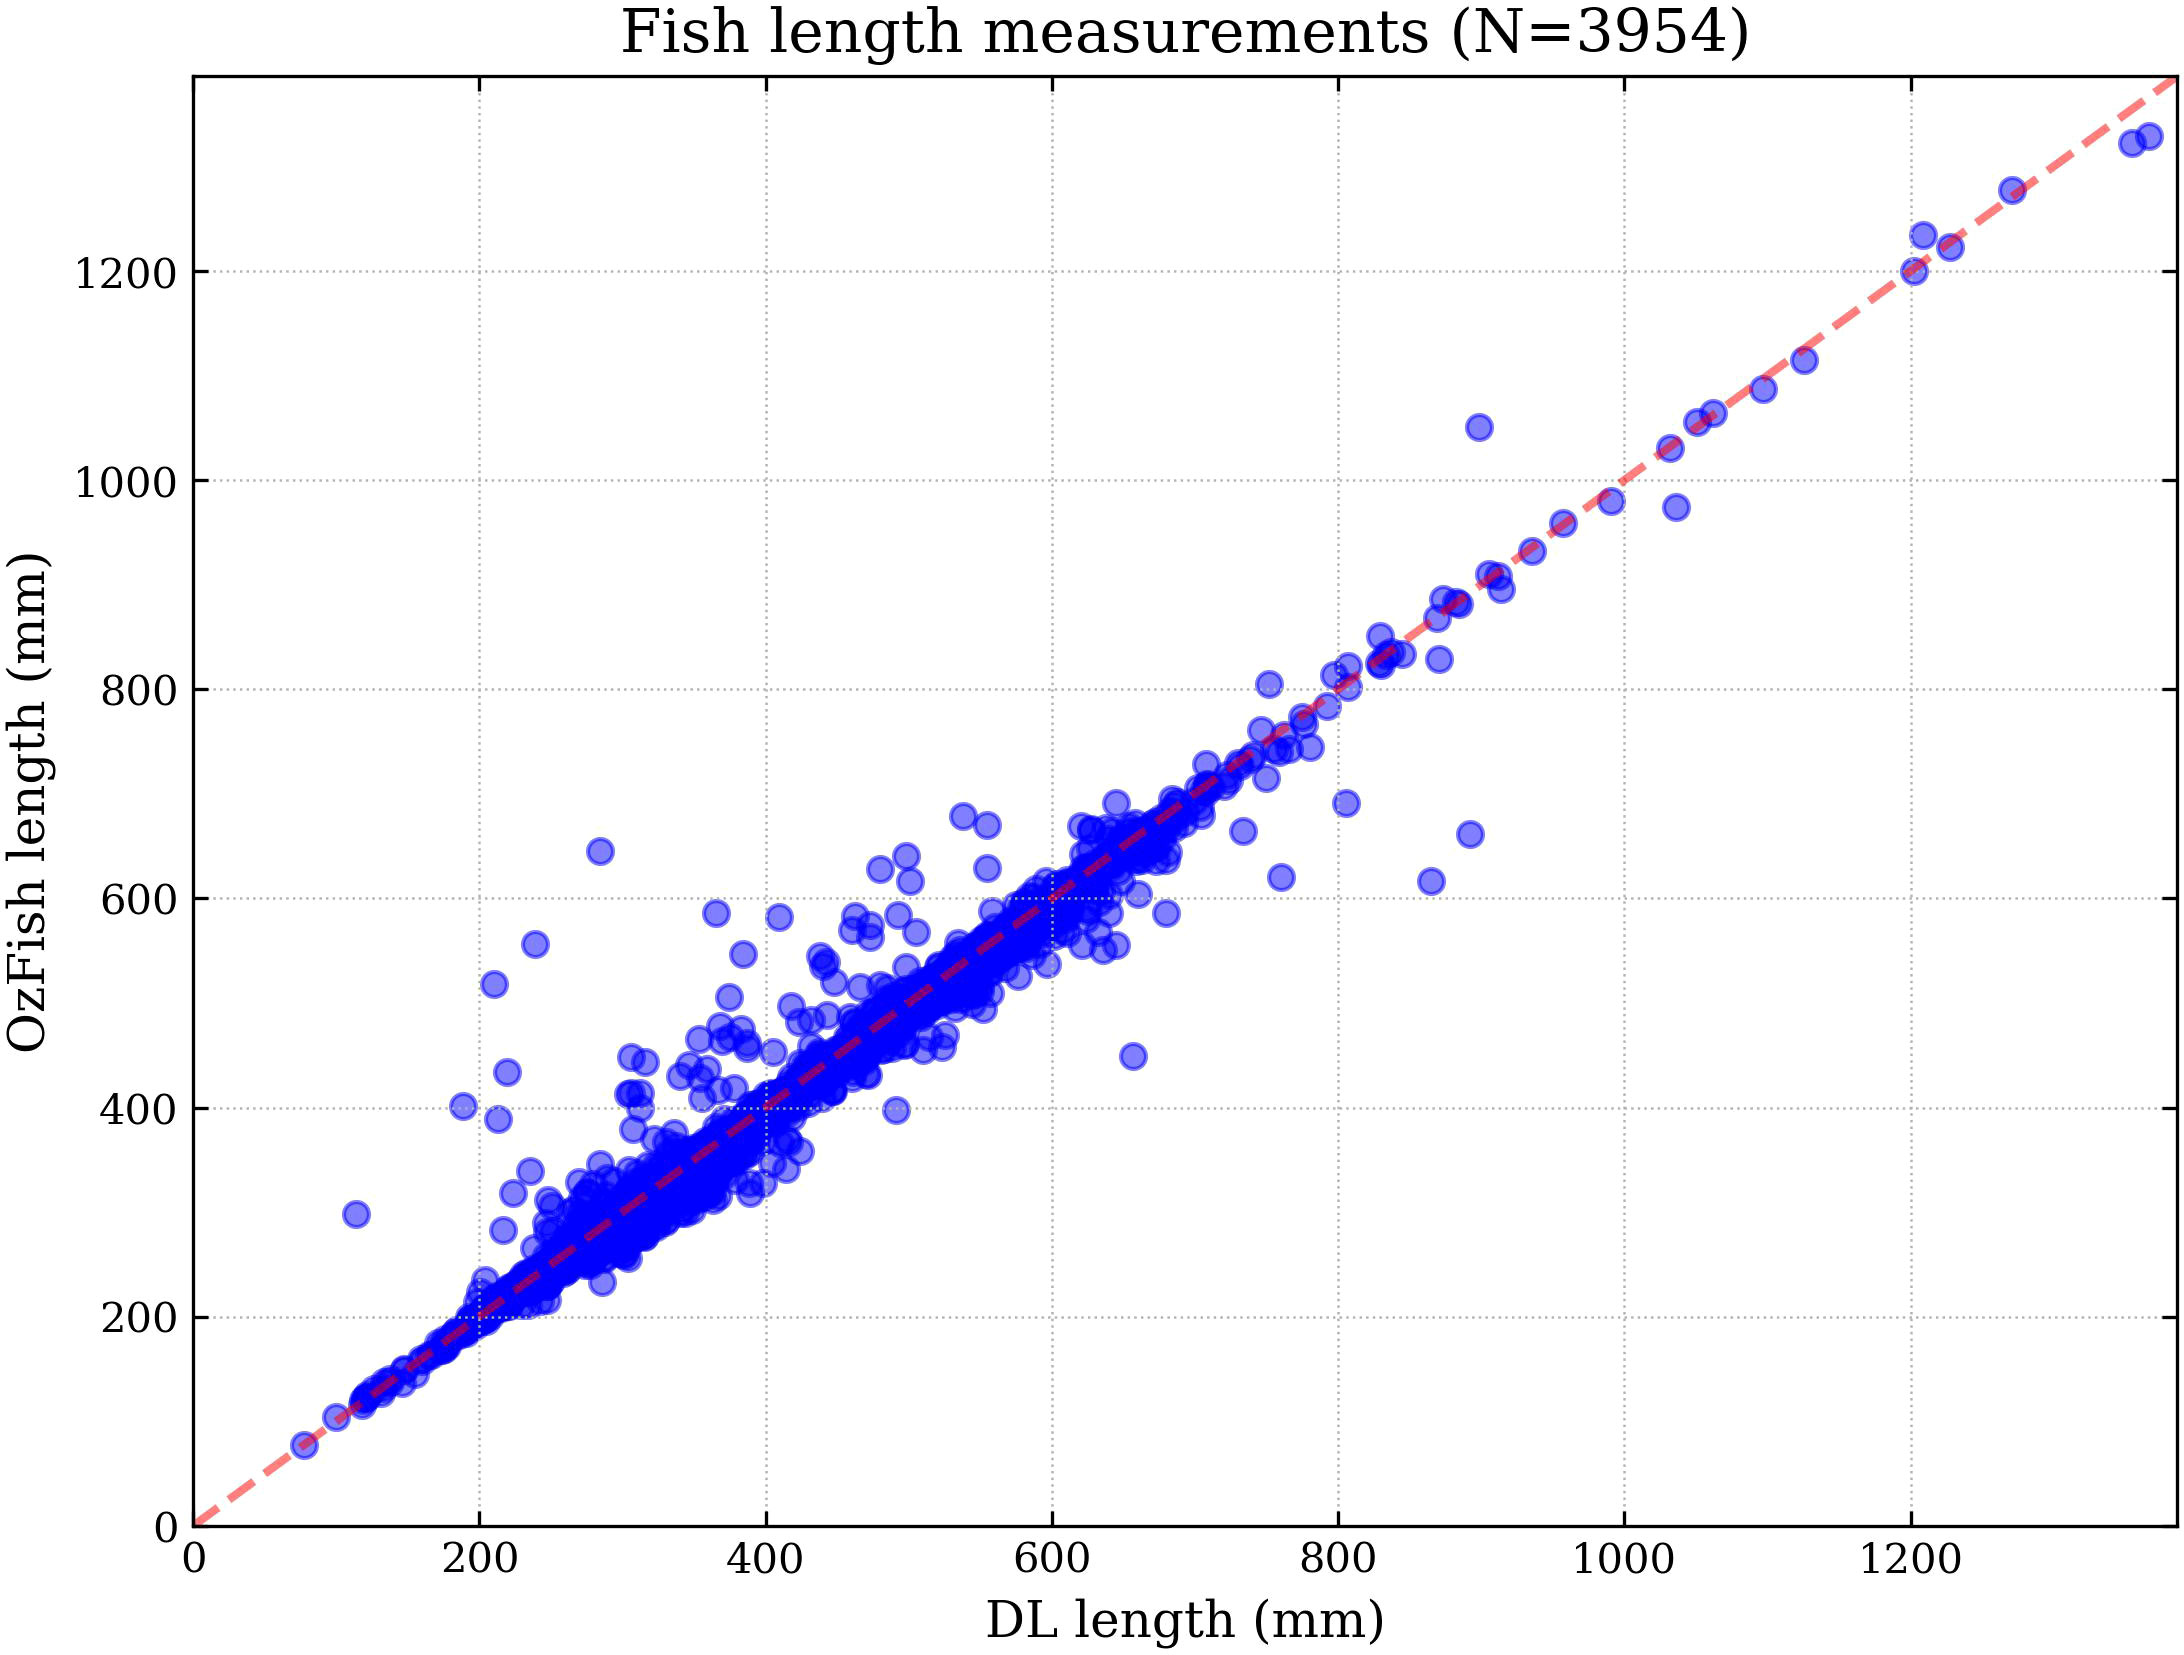
Figure 3 Human versus DL comparison showing how DL and photogrammetry-derived length compares with human and photogrammetry-derived length for the same fish. The Pearson correlation coefficient is 0.99 indicating that even though DL sometimes overestimates or underestimates the length compared with a manual measurement by an ecologist; with repeat measurements, the total length estimates average to be very similar.
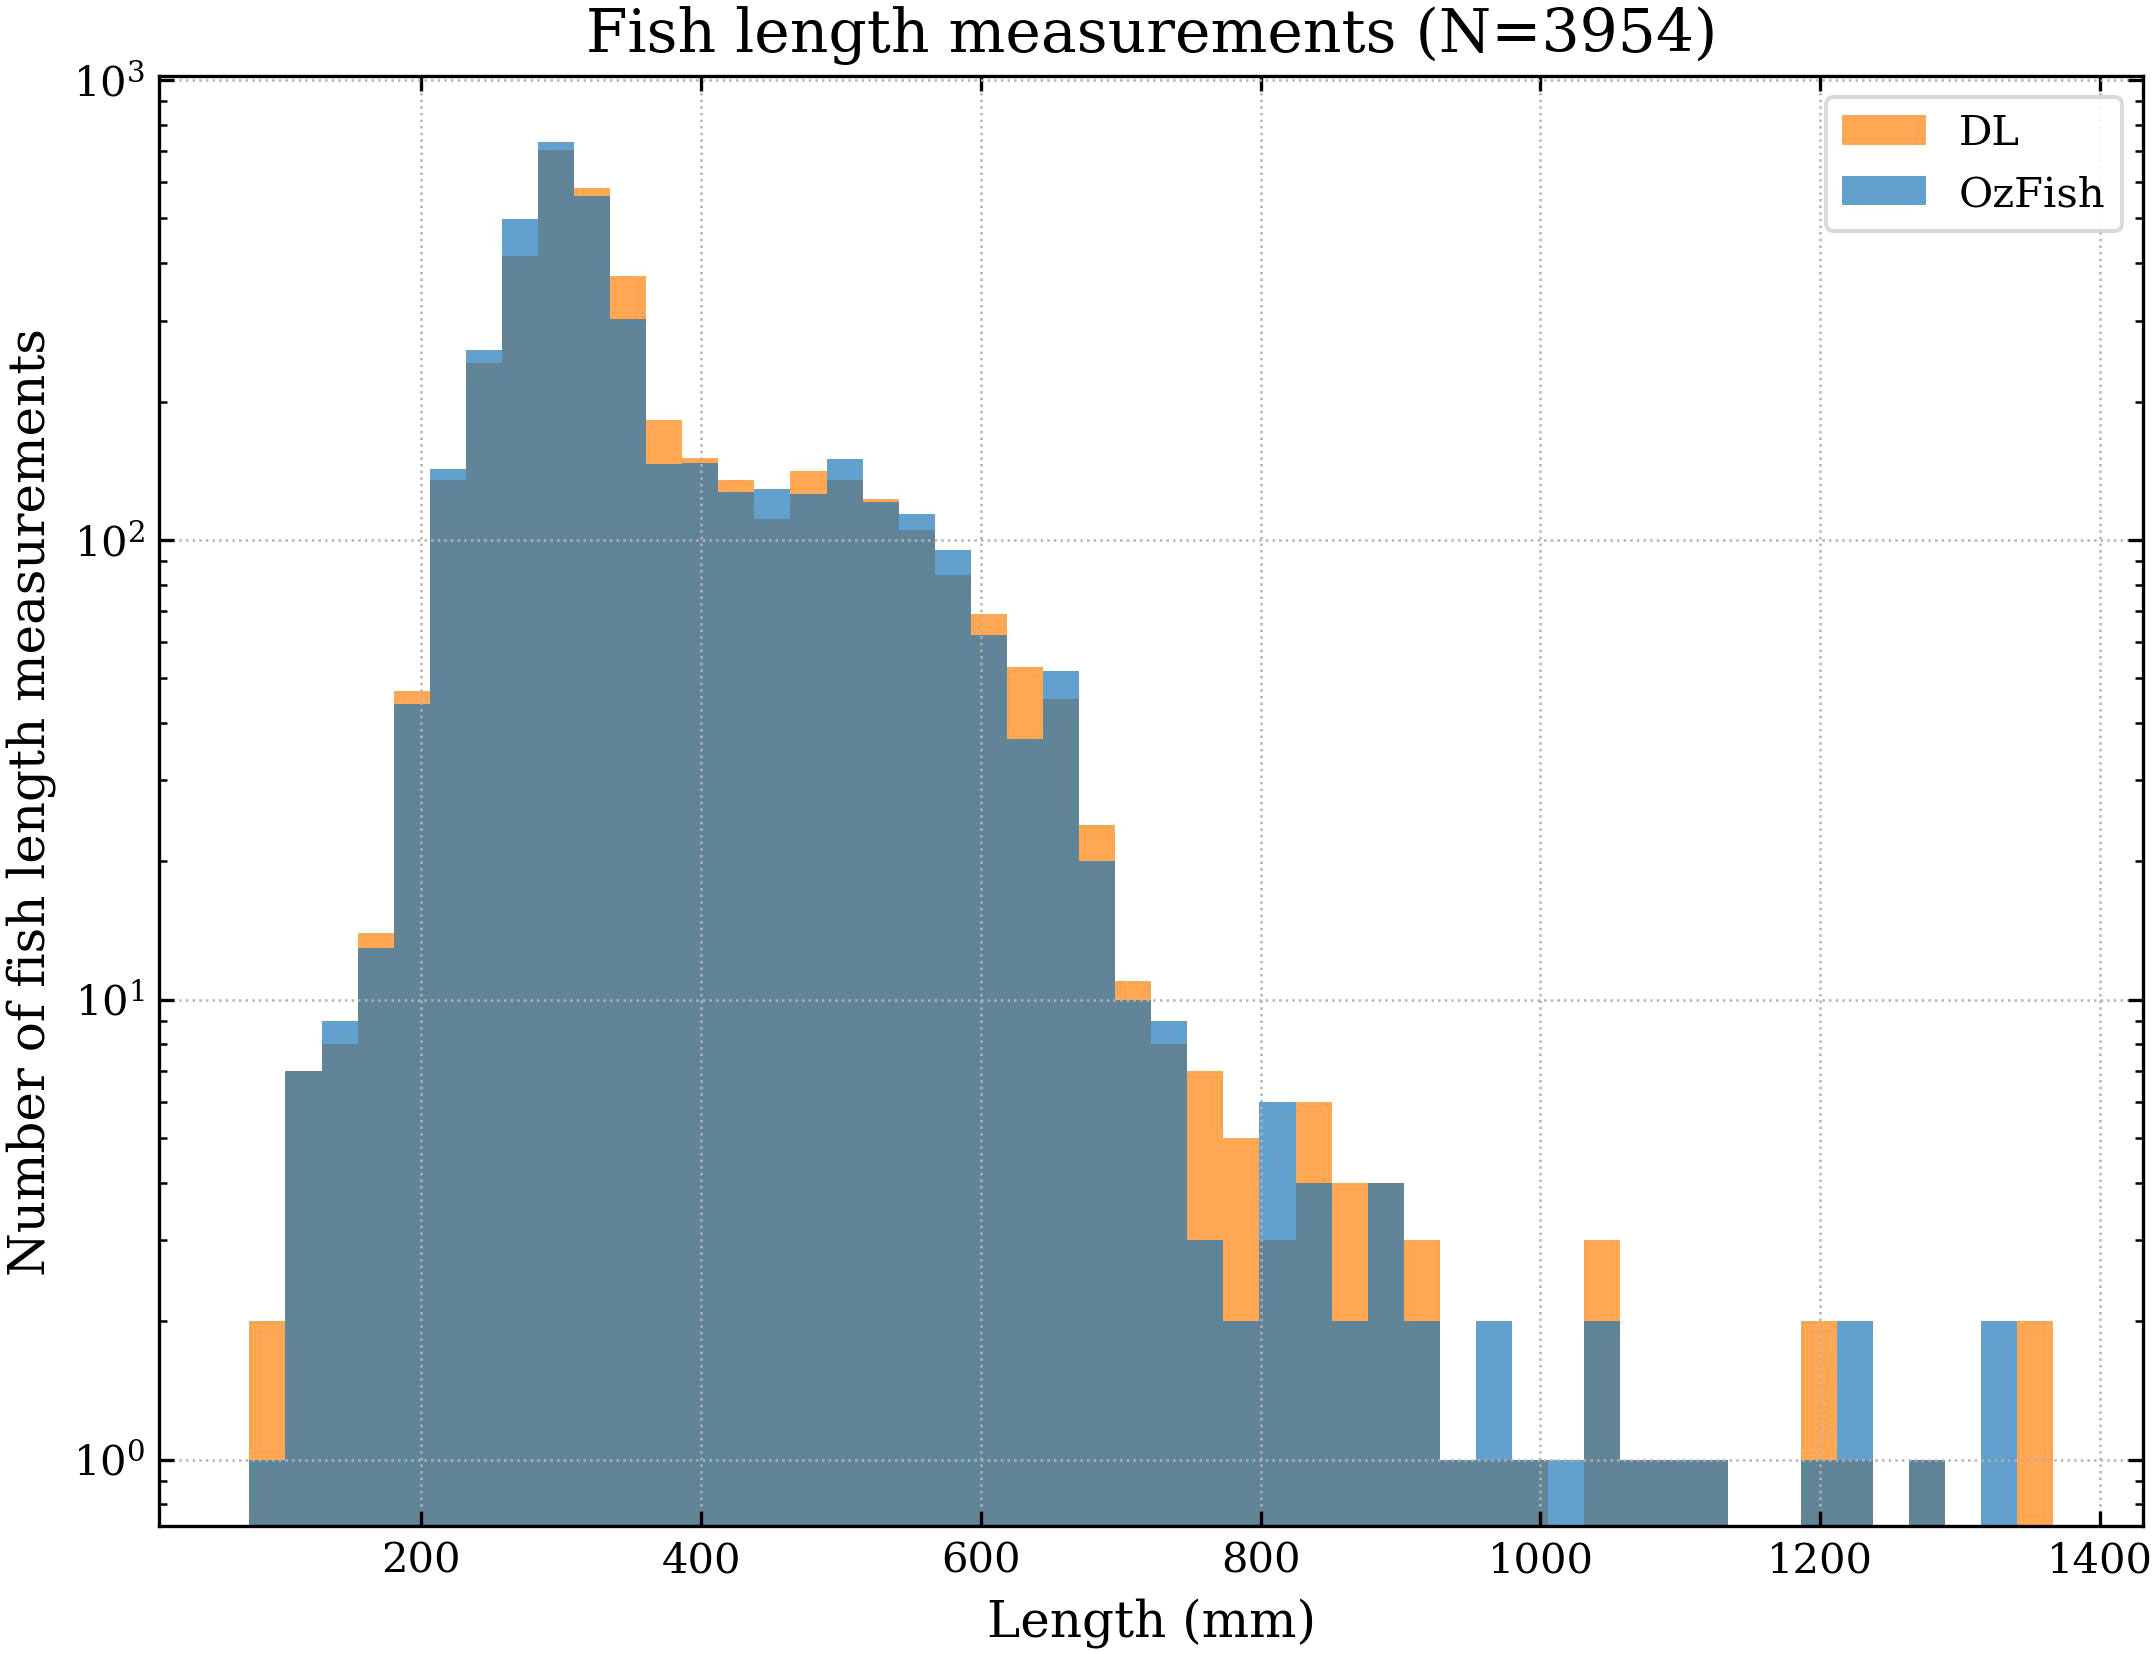
Figure 4 Histogram of the human versus DL comparison demonstrating the density of the number of length measurements. A higher density of points indicates the total number of measurements aggregate to close agreement.
2.5.1 Recall, Precision and F1 Score
Simplifying model performance for fish head and tail detection into a single metric can be beneficial. One such metric is the F1 score, which is a combination of recall and precision. Recall is the likelihood of detecting all actual positive instances, while precision is the proportion of true positive (TP) predictions out of all positive predictions. False negative (FN) represent the number of predictions the model missed and false positive (FP) predictions are incorrectly predicted results. The F1 score is calculated by taking the harmonic mean of recall and precision.
The recall, precision and F1 score for fish head and tail detection are presented in Table 1.
Table 1 Deep learning precision (P), recall (R) and F1 for classification.
2.5.2 Human–machine comparison
The Pearson correlation coefficient used for the human–machine comparison was calculated by:
Where:
1. x are the individual DL inference length results
2. is the average DL length
3. yi are the individual human annotated length results
4. is the average human annotated length
3 Results
The following section presents the results of the human–machine comparison by comparing the machine learning and photogrammetry-derived length measurements with the ecologists’ manual measurements (Figure 3) and the density of those measurements and compared in Figure 4. The results presented here are calculated from the out-of-sample data. Table 1 shows the DL precision (P), recall (R) and F1 for heads, tails and the combination of both.
4 Discussion
The semi-automated method presented in this paper demonstrates the potential to rapidly increase analysis time and decrease reporting time for assessing fish biomass. Challenges remain for a completely autonomous solution, some of which are discussed below.
4.1 Semi-automation of length measurement
The challenge of applying this model in real-world scenarios is that the model cannot currently match the fish in the corresponding left and right images. This was not a problem when building and testing the model, as the data were already analysed by experienced ecologists who had matched the stereo image pairs. To address this challenge, the DL model was adapted to communicate with Event Measure; wherein, the DL model requires an ecologist to click anywhere on the body of the fish in both images. Inference on the length is conducted after the ecologist has solved the image correspondence problem by identifying the same fish in each of the left and right images. The fish is then precisely cropped from the stereo-BRUVS image using the DL method described in Marrable et al. (2022), which places a bounding box over the fish, then parsed by the head and tail DL model. Without isolating the fish first, the model returns all of the heads and tails of all the fish it finds with no correspondence data to match them. The head and tail locations are returned to EventMeasure which automatically calculates the length of the fish using its photogrammetry library. This reduces the number of mouse clicks on the screen, from four precise clicks (i.e. left head, left tail, right head, right tail) to two. Additionally, placing clicks anywhere on the body is significantly faster and requires much less precision. This semi-automated method of length measurement has the potential to significantly increase analysis speed.
Furthermore, by requiring ecologists to choose the corresponding fish individuals, users can draw on their contextual knowledge to wait for a moment when a fish is the best pose for measurement and not occluded by other fish, seagrass, the BRUVS bait bag or other objects. This reduces false positive detection. Context is something that is not currently possible by using computer vision alone.
4.2 Sources of error
The DL model cannot correspond the head and tail of a given fish and, therefore, the largest source of error is incorrect correspondence; that is, when a head and tail pair are matched to two different fish. This is because the model searches within the bounding box for features that look like heads and tails and returns the match with the highest confidence. This works well when there is only one matching pair; however, there are occasions when there are heads and tails belonging to many fish. The model has no knowledge of correspondence and so matches them based on the highest confidence level, and sometimes pairs them incorrectly. An example of this is seen in Figure 5. This results in either the incorrect length being calculated from the photogrammetry, or the RMS value returned from EventMeasure being >20, so no length is reported.
Figure 5A shows an example where two fish tails fall within the bounding box and the model identifies the wrong tail. This false positive is seen most commonly where fish are schooling and swimming between 30° and 45° to the plane of the camera. Angles within this span produce a large bounding box with more likelihood that tails from other fish will be captured. One way to reduce this effect is to automate a rotation of the bounding box, Figure 5B, or the image in sympathy with the orientation of the fish to reduce the empty space in the bounding box. Automating this process remains a challenge, as even establishing that a false positive detection has occurred would require logic and processing beyond the capability of the current model. There are published detection models that use rotated labels (Li et al., 2018) for ship identification in satellite images; but, as yet, YOLOv5 does not have the ability to train using rotated bounding boxes. Addressing these false positive cases remains the subject of ongoing research.
Figure 5 Example of a false positive detection of a tail leading to an incorrect length measurement; (A) two fish tails fall withinthe bounding box and the model identifies the wrong tail. (B) the yellow box demonstrates that rotating theobject-detection bounding box, would eliminate the second tail from the area and correct the false tail label.
4.3 Stereo calibration
Harvey and Shortis (1998) highlight the importance of precise measurement systems for accurate length. This was also the objective of this approach by using the OzFish dataset for model training and validation. The OzFish data were calibrated using the calibration cube method (Shortis, 2015) which is more accurate and precise than using 2D calibration patterns as reported by Boutros et al. (2015) in their comparison study.
4.4 Model generalisability
Previous published models capable of automating the length measurement of fish have either used a single camera out of water (Monkman et al., 2019); been limited to a single species (White et al., 2006); or used less accurate stereophotogrammetry calibration methods (Tonachella et al., 2022). The model presented in this study was trained and tested on 319 unique species of fish, making it much more generalisable than any other previously published model. The data used to train this model was restricted to the species in the OzFish dataset, which includes those mostly found along the coast of Western Australian. However, the species richness and diversity shows evidence that the model generalises across different species with varying colour, texture and morphometrics. An effort to separate in-sample and out-of-sample data was made to give some indication of model generalisability by training and testing to data collected at different dates and locations. How well the model works with species outside the OzFish data will be the focus of future work. For applications in marine environments with species not included in the OzFish data, the method described in this study should be repeated with a new training corpus that includes species in which users wish to measure.
4.5 Challenges with data quality
One reason for choosing the OzFish dataset for DL training was because the data were annotated by expert fish ecologists. However, when auditing the DL data there were still errors in the labelling. Some errors included head and tail points that seemed to be systematically shifted a few pixels away from the head and tail of the fish, which may have been caused by incorrect synchronisation of the stereo-BRUVS. There were also some instances where labels were randomly out of place, such as labels placed on a rock.
One issue that continues to be a challenge for computer-vision-based DL is that it is so far incapable of using context in the way fish ecologists do to help them label fish. For example, in the OzFish dataset, where a fish was partially occluded by an object, labels were placed where heads or tails would logically be expected, estimated by ecologists from experience and numerous previous observations of similar fish. When such an example is viewed by a computer-vision algorithm which, unlike an ecologist, cannot extrapolate from the context, the algorithm may see a label on a rock and interpret that rock as a fish head or tail. In such cases, those data must be removed as they would incorrectly train the DL model to detect some rocks as fish heads and tails. Additionally, there were many instances of seemingly very small fish labelled with heads and tails which were very hard to distinguish between in static images. However, upon viewing the moving video, swimming behaviours clearly indicated the direction fish were swimming in, which made head and tail identification easy to the human eye. Although there are published DL tracking algorithms (Bertinetto et al., 2016; Hu et al., 2022), YOLO-based methods only consider static images for training or inference. Combining tracking with head and tail detection will be the focus of future work so that numerous length measurements of the same fish can be made to calculate the average size, a method that is shown to be more statistically robust and less prone to measurement error (Harvey et al., 2001b). Validation experiments of measurements from stereo-BRUVS (Harvey and Shortis, 1995; Harvey et al., 2003; Harvey et al., 2010) have been conducted using three or more repeat measurements of fish. However, this is seldom done when conducting field surveys due to the extra labour required.
4.6 Combining optical and acoustic sampling methods
In recent years, size-spectrum models derived from acoustic surveys have emerged as essential tools for fish stock assessment and ecosystem-based fisheries management. Acoustic surveys possess the advantage of rapidly and efficiently covering vast spatial scales. However, stationary video platforms, such as stereo-BRUVS, are constrained by a limited field of view and can only monitor a small area around the camera. Acoustic surveys also face challenges, including difficulties in discriminating between fish species and detecting fish close to the seabed or within dense schools.
Size and shape information of fish targets is extracted from echo data by adjusting model parameters, such as growth rates, mortality rates, and species-specific traits, to match observed data (Edwards et al., 2017; Froese et al., 2019). Calibration and validation of these models often necessitate biological samples, which are invasive due to the physical capture and potential harm to fish during the process.
Assessing fishery resources in reef ecosystems, where obtaining biological samples is sometimes prohibited, remains challenging. To address these limitations, optic-acoustic methods combine video footage and acoustic measurements (Ryan and Kloser, 2016; Demer et al., 2020). Underwater cameras or video systems, either mounted on a research vessel, towed platform, or remotely operated vehicle (ROV), capture images or footage of fish, providing high-resolution information on size, shape, colour, and behaviour, which aids in species identification and refining size distribution estimates without the need for biological samples.
The automated length measurement of fish in stereo-videos using the method described in this study could be integrated with the optic-acoustic approach to capitalise on the strengths of both methods. Combining acoustic surveys with stereo-BRUVS, such as the preliminary work by Landero-Figueroa et al. (2016), or other sampling techniques can help overcome the limitations of each method and provide more accurate and comprehensive information on fish populations for stock assessment and ecosystem-based fisheries management. This non-invasive approach enables continuous monitoring of fish populations without harming the organisms or their habitats, offering a promising alternative for sustainable fishery management.
5 Conclusion
The semi-automated length measurement method presented here builds on and advances previously published DL-based fish detection from stereo-BRUVS imagery (Marrable et al., 2022). This new method combines that fish detection approach to isolate and crop individual fish from a busy scene with a new DL model for detecting the head and tail and applying photogrammetry to determine fish length measurements.
Although not completely autonomous, the machine-assisted, semi-automated labelling approach solves both the object correspondence challenge and allows for expert contextual knowledge to choose which fish (and in which pose) are sent for analysis using DL. This is expected to significantly reduce labour and analysis time by speeding up the manual process of precisely locating the head and tail of the fish in both images by carefully placing four mouse clicks on the screen, to two fast clicks anywhere on a fish while still using expert knowledge to truth and validate the result. By accelerating stereo-BRUVS analysis, more imagery can be processed; thereby, increasing the amount of data available for environmental reporting and decision making.
Data availability statement
Publicly available datasets were analyzed in this study. This data can be found here: https://github.com/open-AIMS/ozfish.
Author contributions
DM, MW, ST, and SB contributed to the development of the study design. DM, KB, ST, EH, MW, MS, and SLB contributed to the writing of the manuscript. All authors contributed to the article and approved the submitted version.
Conflict of interest
The authors declare that the research was conducted in the absence of any commercial or financial relationships that could be construed as a potential conflict of interest.
Publisher’s note
All claims expressed in this article are solely those of the authors and do not necessarily represent those of their affiliated organizations, or those of the publisher, the editors and the reviewers. Any product that may be evaluated in this article, or claim that may be made by its manufacturer, is not guaranteed or endorsed by the publisher.
Footnotes
- ^ https://www.daf.qld.gov.au/business-priorities/fisheries/recreational/recreational-fishing-rules/measuring.
- ^ https://cocodataset.org.
- ^ https://github.com/ultralytics/yolov5 Access Date (Nov 22, 2022).
References
Andrialovanirina N., Ponton D., Behivoke F., Mahafina J., Léopold M. (2020). A powerful method for measuring fish size of small-scale fishery catches using image. J.Fish. Res. 223, 105425. doi: 10.1016/j.fishres.2019.105425
Atienza-Vanacloig V., Andreu-García G., López-García F., Valiente-González J. M., Puig-Pons V. (2016). Vision-based discrimination of tuna individuals in grow-out cages through a fish bending model. Comput. Electron. Agric. 130, 142–150. doi: 10.1016/j.compag.2016.10.009
Australian Institute Of Marine Science (2020). Ozfish dataset - machine learning dataset for baited remote underwater video stations. doi: 10.25845/5E28F062C5097
Bertinetto L., Valmadre J., Henriques J. F., Vedaldi A., Torr P. H. S. (2016). “Fully-convolutional siamese networks for object tracking,” in Computer vision – ECCV 2016 workshops (Amsterdam, The Netherlands: Springer International Publishing), 850–865.
Boutros N., Shortis M. R., Harvey E. S. (2015). A comparison of calibration methods and system configurations of underwater stereo-video systems for applications in marine ecology. Limnol. Oceanogr. Methods 13, 224–236. doi: 10.1002/lom3.10020
Bradley D., Merrifield M., Miller K. M., Lomonico S., Wilson J. R., Gleason M. G. (2019). Opportunities to improve fisheries management through innovative technology and advanced data systems. Fish Fish 20, 564–583. doi: 10.1111/faf.12361
Brock V. E. (1954). A preliminary report on a method of estimating reef fish populations. J. Wildl. Manage. 18, 297–308. doi: 10.2307/3797016
Cappo M. A., Harvey E., Malcolm H., Speare P. (2003). Potential of video techniques to monitor diversity, abundance and size of fish in studies of marine protected areas. Aquat. Protected Areas-what works Best how do we know 1, 455–464.
Cappo M., Speare P., Wassenberg T., Harvey E., Rees M., Heyward A., et al. (2001). Direct sensing of the size frequency and abundance of targt and non-target fauna in Australian fisheries-a national workshop. Pages 63–71.
Connolly R. M., Fairclough D. V., Jinks E. L., Ditria E. M., Jackson G., Lopez-Marcano S., et al. (2021). Improved accuracy for automated counting of a fish in baited underwater videos for stock assessment. Front. Mar. Sci. 8. doi: 10.3389/fmars.2021.658135
Cresswell I., Janke T., Johnston E. (2022). Australia State of the environment 2021: overview (Australia: Department of Agriculture, Water and the Environment).
Demer D., Michaels W., Cambronero Solano S., Paramo J., Roa C. (2020). Integrated optic-acoustic studies of reef fish: report of the 2018 GCFI field study and workshop. NOAA Technical Memorandum NMFS-F/SPO-209 (Washington, DC: National Oceanic and Atmospheric Administration).
Dowling N. A., Wilson J. R., Rudd M. B., Babcock E. A., Caillaux M., Cope J., et al. (2016). FishPath: a decision support system for assessing and managing data- and capacity- limited fisheries Dowling2016-ww. doi: 10.4027/amdlfs.2016.03
Duarte C. M., Agusti S., Barbier E., Britten G. L., Castilla J. C., Gattuso J.-P., et al. (2020). Rebuilding marine life. Nature 580, 39–51. doi: 10.1038/s41586-020-2146-7
Edwards A. M., Robinson J. P. W., Plank M. J., Baum J. K., Blanchard J. L. (2017). Testing and recommending methods for fitting size spectra to data. Methods Ecol. Evol. 8, 57–67. doi: 10.1111/2041-210X.12641
Ellis D. M., DeMartini E. E. (1995). Evaluation of a video camera technique for indexing abundances of juvenile pink snapper, pristipomoides filamentosus, and other hawaiian insular shelf fishes. Oceanographic Literature Rev. 9, 786.
French G., Mackiewicz M., Fisher M., Holah H., Kilburn R., Campbell N., et al. (2019). Deep neural networks for analysis of fisheries surveillance video and automated monitoring of fish discards. ICES J. Mar. Sci. 77, 1340–1353. doi: 10.1093/icesjms/fsz149
Friedlander A. M., DeMartini E. E. (2002). Contrasts in density, size, and biomass of reef fishes between the northwestern and the main hawaiian islands: the effects of fishing down apex predators. Mar. Ecol. Prog. Ser. 230, 253–264. doi: 10.3354/meps230253
Froese R., Winker H., Coro G., Demirel N., Tsikliras A. C., Dimarchopoulou D., et al. (2019). On the pile-up effect and priors for linf and M/K: response to a comment by hordyk et al. on “a new approach for estimating stock status from length frequency data”. ICES J. Mar. Sci. 76, 461–465. doi: 10.1093/icesjms/fsy199
Garcia-d’Urso N., Galan-Cuenca A., Pérez-Sánchez P., Climent-Pérez P., Fuster-?Guillo A., Azorin-Lopez J., et al. (2022). The DeepFish computer vision dataset for fish instance segmentation, classification, and size estimation. Sci. Data 9, 1–7. doi: 10.1038/s41597-022-01416-0
Goetze J. S., Bond T., McLean D. L., Saunders B. J., Langlois T. J., Lindfield S., et al. (2019). A field and video analysis guide for diver operated stereo-video. Methods Ecol. Evol. 10 (7), 1083–1090. doi: 10.1111/2041-210X.13189
Harvey E. S., Cappo M., Butler J. J., Hall N., Kendrick G. A. (2007). Bait attraction affects the performance of remote underwater video stations in assessment of demersal fish community structure. Mar. Ecol. Prog. Ser. 350, 245–254. doi: 10.3354/meps07192
Harvey E., Cappo M., Shortis M., Robson S., Buchanan J., Speare P. (2003). The accuracy and precision of underwater measurements of length and maximum body depth of southern bluefin tuna (thunnus maccoyii) with a stereo–video camera system. Fish. Res. 63 (3), 315–326 doi: 10.1016/S0165-7836(03)00080-8
Harvey E., Fletcher D., Shortis M. (2001a). A comparison of the precision and accuracy of estimates of reef-fish lengths determined visually by divers with estimates produced by a stereo-video system. Fish. Bull. 99, 63.
Harvey E., Fletcher D., Shortis M. (2001b). Improving the statistical power of length estimates of reef fish: a comparison of estimates determined visually by divers with estimates produced by a stereo-video system. Fishery bulletin-national oceanic atmospheric administration 99, 72–80.
Harvey E., Fletcher D., Shortis M. (2002). Estimation of reef fish length by divers and by stereo-video. a first comparison of the accuracy and precision in the field on living fish under operational conditions. Fish. Res. 57, 255–265. doi: 10.1016/S0165-7836(01)00356-3
Harvey E., Goetze J., McLaren B., Langlois T., Shortis M. (2010). Influence of range, angle of view, image resolution and image compression on underwater stereo-video measurements: high-definition and broadcast-resolution video cameras compared. Mar. Technol. Soc J. 44, 75–85. doi: 10.4031/MTSJ.44.1.3
Harvey E. S., McLean D. L., Goetze J. S., Saunders B. J., Langlois T. J., Monk J., et al. (2021). The BRUVs workshop – an australia-wide synthesis of baited remote underwater video data to answer broad-scale ecological questions about fish, sharks and rays. Mar. Policy 127, 104430. doi: 10.1016/j.marpol.2021.104430
Harvey E., Shortis M. (1995). A system for stereo-video measurement of sub-tidal organisms. Mar. Technol. Soc J. 29, 10–22.
Harvey E. S., Shortis M. R. (1998). Calibration stability of an underwater stereo video system: implications for measurement accuracy and precision. Mar. Technol. Soc. J. 32 (2), 3–17.
Hellmrich L. S., Saunders B. J., Parker J. R. C., Goetze J. S., Harvey E. S. (2023). Stereo-ROV surveys of tropical reef fishes are comparable to stereo-DOVs with reduced behavioural biases. Estuar. Coast. Shelf Sci. 281, 108210. doi: 10.1016/j.ecss.2022.108210
Hu W., Wang Q., Zhang L., Bertinetto L., Torr P. H. S. (2022). SiamMask: a?framework for fast online object tracking and segmentation. IEEE Transactions on Pattern Analysis and Machine Intelligence 45 (3), 3072–3089. doi: 10.1109/TPAMI.2022.3172932
Jennings S., Kaiser M. J. (1998). “The effects of fishing on marine ecosystems,” in Advances in marine biology, vol. 34 . Eds. Blaxter J. H. S., Southward A. J., Tyler P. A. (Academic Press), 201–352.
Jennings S., Polunin N. V. C. (1997). Impacts of predator depletion by fishing on the biomass and diversity of non-target reef fish communities. Coral Reefs 16, 71–82. doi: 10.1007/s003380050061
Jessop S. A., Saunders B. J., Goetze J. S., Harvey E. S. (2022). A comparison of underwater visual census, baited, diver operated and remotely operated stereo-video for sampling shallow water reef fishes. Estuar. Coast. Shelf Sci. 276, 108017. doi: 10.1016/j.ecss.2022.108017
Johansson C., Stowar M., Cappo M. (2008). The use of stereo BRUVS for measuring fish size. Marine and Tropical Sciences Research Facility Report Series; (Cape Cleveland, Australia: Australian Institute of Marine Science).
Landero-Figueroa M. M., Parnum I., Saunders B. J., Parsons M. (2016). Integrating echo-sounder and underwater video data for demersal fish assessment (Brisbane, Australia: Acoustics).
Langlois T., Goetze J., Bond T., Monk J., Abesamis R. A., Asher J., et al. (2020). A field and video annotation guide for baited remote underwater stereo-video surveys of demersal fish assemblages. Methods Ecol. Evol. 11, 1401–1409. doi: 10.1111/2041-210X.13470
Lezama-Cervantes C., Godínez-Domínguez E., Gómez-Morales H., Ornelas-Luna R., Morales-Blake A. R., Patiño-Barragán M., et al. (2017). A suitable ichthyometer for systemic application. Lat. Am. J. Aquat. Res. 45, 870–878. doi: 10.3856/vol45-issue5-fulltext-1
Li S., Zhang Z., Li B., Li C. (2018). Multiscale rotated bounding box-based deep learning method for detecting ship targets in remote sensing images. Sensors 18. doi: 10.3390/s18082702
Little R., Hill N. (2021). 2021 state of the environment report marine chapter – expert assessment – management effectiveness – commercial fishing. doi: 10.26198/WWR3-4D52
Lopez-Marcano S., Jinks E. L., Buelow C. A., Brown C. J., Wang D., Kusy B., et al. (2021). Automatic detection of fish and tracking of movement for ecology. Ecol. Evol. 11, 8254–8263. doi: 10.1002/ece3.7656
MacNeil M. A., Chapman D. D., Heupel M., Simpfendorfer C. A., Heithaus M., Meekan M., et al. (2020). Global status and conservation potential of reef sharks. Nature 583, 801–806. doi: 10.1038/s41586-020-2519-y
Marrable D., Barker K., Tippaya S., Wyatt M., Bainbridge S., Stowar M., et al. (2022). Accelerating species recognition and labelling of fish from underwater video with machine-assisted deep learning. Front. Mar. Sci. 9. doi: 10.3389/fmars.2022.944582Marrable2022
McClanahan T. R., Muthiga N. A., Kamukuru A. T., Machano H., Kiambo R. W. (1999). The effects of marine parks and fishing on coral reefs of northern tanzania. Biol. Conserv. 89, 161–182. doi: 10.1016/S0006-3207(98)00123-2
Melnychuk M. C., Kurota H., Mace P. M., Pons M., Minto C., Osio G. C., et al. (2021). Identifying management actions that promote sustainable fisheries. Nat. Sustainability 4, 440–449. doi: 10.1038/s41893-020-00668-1
Miranda J. M., Romero M. (2017). A prototype to measure rainbow trout’s length using image processing. Aquacult. Eng. 76, 41–49. doi: 10.1016/j.aquaeng.2017.01.003
Monkman G. G., Hyder K., Kaiser M. J., Vidal F. P. (2019). Using machine vision to estimate fish length from images using regional convolutional neural networks. Methods Ecol. Evol. 10, 2045–2056. doi: 10.1111/2041-210X.13282
Needle C. L., Dinsdale R., Buch T. B., Catarino R. M., Drewery J., Butler N., et al. (2015). Scottish Science applications of remote electronic monitoring. ICES J. Mar. Sci. 72 (4), 1214–1229. doi: 10.1093/icesjms/fsu225
Pauly D., Christensen V., Guénette S., Pitcher T. J., Sumaila U. R., Walters C. J., et al. (2002). Towards sustainability in world fisheries. Nature 418, 689–695. doi: 10.1038/nature01017
Redmon J., Divvala S., Girshick R., Farhadi A. (2016). “You only look once: unified, real-time object detection,” in Proceedings of the IEEE conference on computer vision and pattern recognition. 779–788.
Roberts C. M. (1995). Rapid build-up of fish biomass in a caribbean marine reserve. Conserv. Biol. 9, 815–826. doi: 10.1046/j.1523-1739.1995.09040815.x
Rochet M.-J., Trenkel V. M. (2003). Which community indicators can measure the impact of fishing? a review and proposals. Can. J. Fish. Aquat. Sci. 60, 86–99. doi: 10.1139/f02-164
Rudd M. B., Thorson J. T. (2018). Accounting for variable recruitment and fishing mortality in length-based stock assessments for data-limited fisheries. Can. J. Fish. Aquat. Sci. 75, 1019–1035. doi: 10.1139/cjfas-2017-0143
Ryan T. E., Kloser R. J. (2016). Improved estimates of orange roughy biomass using an acoustic-optical system in commercial trawlnets. ICES J. Mar. Sci. 73, 2112–2124. doi: 10.1093/icesjms/fsw009
Schramm K. D., Marnane M. J., Elsdon T. S., Jones C., Saunders B. J., Goetze J. S., et al. (2020). A comparison of stereo-BRUVs and stereo-ROV techniques for sampling shallow water fish communities on and off pipelines. Mar. Environ. Res. 162, 105198. doi: 10.1016/j.marenvres.2020.105198
Seguin R., Mouillot D., Cinner J. E., Stuart Smith R. D., Maire E., Graham N. A. J., et al. (2022). Towards process-oriented management of tropical reefs in the anthropocene. Nat. Sustain. 6 (2), 148–157. doi: 10.1038/s41893-022-00981-x
Shafait F., Harvey E. S., Shortis M. R., Mian A., et al. (2017). Towards automating underwater measurement of fish length: a comparison of semi-automatic and manual stereo–video measurements. ICES J. Mar. Sci. 74 (6), 1690–1701. doi: 10.1093/icesjms/fsx007
Shi C., Wang Q., He X., Zhang X., Li D. (2020). An automatic method of fish length estimation using underwater stereo system based on LabVIEW. Comput. Electron. Agric. 173, 105419. doi: 10.1016/j.compag.2020.105419
Shortis M. (2015). Calibration techniques for accurate measurements by underwater camera systems. Sensors 15, 30810–30826. doi: 10.3390/s151229831
Steneck R. S., Pauly D. (2019). Fishing through the anthropocene. Curr. Biol. 29, R987–R992. doi: 10.1016/j.cub.2019.07.081
Suo F., Huang K., Ling G., Li Y., Xiang J. (2020). “Fish keypoints detection for ecology monitoring based on underwater visual intelligence,” in 2020 16th International Conference on Control, Automation, Robotics and Vision (ICARCV). 542–547. doi: 10.1109/ICARCV50220.2020.9305424
Tonachella N., Martini A., Martinoli M., Pulcini D., Romano A., Capoccioni F. (2022). An affordable and easy-to-use tool for automatic fish length and weight estimation in mariculture. Sci. Rep. 12, 15642. doi: 10.1038/s41598-022-19932-9
Upton K. R., Riley L. G. (2013). Acute stress inhibits food intake and alters ghrelin signaling in the brain of tilapia (oreochromis mossambicus). Domest. Anim. Endocrinol. 44, 157–164. doi: 10.1016/j.domaniend.2012.10.001
Uranga J., Arrizabalaga H., Boyra G., Hernandez M. C., Goñi N., Arregui I., et al. (2017). Detecting the presence-absence of bluefin tuna by automated analysis of medium-range sonars on fishing vessels. PloS One 12, e0171382. doi: 10.1371/journal.pone.0171382
White D. J., Svellingen C., Strachan N. J. C. (2006). Automated measurement of species and length of fish by computer vision. Fish. Res. 80, 203–210. doi: 10.1016/j.fishres.2006.04.009
Whitmarsh S. K., Fairweather P. G., Huveneers C. (2017). What is big BRUVver up to? methods and uses of baited underwater video. Rev. Fish Biol. Fish. 27, 53–73. doi: 10.1007/s11160-016-9450-1
Wibisono E., Mous P., Firmana E., Humphries A. (2022). A crew-operated data recording system for length-based stock assessment of indonesia’s deep demersal fisheries. PloS One 17, e0263646. doi: 10.1371/journal.pone.0263646
Wilson S. K., Graham N. A. J., Holmes T. H., MacNeil M. A., Ryan N. M. (2018). Visual versus video methods for estimating reef fish biomass. Ecol. Indic. 85, 146–152. doi: 10.1016/j.ecolind.2017.10.038
Yang L., Liu Y., Yu H., Fang X., Song L., Li D., et al. (2021). Computer vision models in intelligent aquaculture with emphasis on fish detection and behavior analysis: a review. Arch. Comput. Methods Eng. 28, 2785–2816. doi: 10.1007/s11831-020-09486-2
Keywords: stereo-BRUVS, deep learning, automated fish length, photogrammetry, machine learning, cameras
Citation: Marrable D, Tippaya S, Barker K, Harvey E, Bierwagen SL, Wyatt M, Bainbridge S and Stowar M (2023) Generalised deep learning model for semi-automated length measurement of fish in stereo-BRUVS. Front. Mar. Sci. 10:1171625. doi: 10.3389/fmars.2023.1171625
Received: 22 February 2023; Accepted: 16 May 2023;
Published: 02 June 2023.
Edited by:
Xuemin Cheng, Tsinghua University, ChinaReviewed by:
Jorge Paramo, University of Magdalena, ColombiaKai Wang, Shanghai Ocean University, China
Copyright © 2023 Marrable, Tippaya, Barker, Harvey, Bierwagen, Wyatt, Bainbridge and Stowar. This is an open-access article distributed under the terms of the Creative Commons Attribution License (CC BY). The use, distribution or reproduction in other forums is permitted, provided the original author(s) and the copyright owner(s) are credited and that the original publication in this journal is cited, in accordance with accepted academic practice. No use, distribution or reproduction is permitted which does not comply with these terms.
*Correspondence: Daniel Marrable, bWFycmFibGRAZ21haWwuY29t