 Agneta Andersson1,2*
 Evelina Grinienė1,3
 Åsa M. M. Berglund1
 Sonia Brugel1,2
 Elena Gorokhova4Daniela Figueroa1,2
 Christine Gallampois5Matyas Ripszam5†
 Mats Tysklind5
- 1Department of Ecology and Environmental Science, Umeå University, Umeå, Sweden
- 2Umeå Marine Sciences Centre, Umeå University, Hörnefors, Sweden
- 3Marine Research Institute, Klaipėda University, Klaipėda, Lithuania
- 4Department of Environmental Science, Stockholm University, Stockholm, Sweden
- 5Department of Chemistry, Umeå University, Umeå, Sweden
Climate change has been projected to cause increased temperature and amplified inflows of terrestrial organic matter to coastal areas in northern Europe. Consequently, changes at the base of the food web favoring heterotrophic bacteria over phytoplankton are expected, affecting the food web structure. We tested this hypothesis using an outdoor shallow mesocosm system in the northern Baltic Sea in early summer, where the effects of increased temperature (+ 3°C) and terrestrial matter inputs were studied following the system dynamics and conducting grazing experiments. Juvenile perch constituted the highest trophic level in the system, which exerted strong predation on the zooplankton community. Perch subsequently released the microbial food web from heavy grazing by mesozooplankton. Addition of terrestrial matter had a stronger effect on the microbial food web than the temperature increase, because terrestrial organic matter and accompanying nutrients promoted both heterotrophic bacterial production and phytoplankton primary production. Moreover, due to the shallow water column in the experiment, terrestrial matter addition did not reduce the light below the photosynthesis saturation level, and in these conditions, the net-autotrophy was strengthened by terrestrial matter enrichment. In combination with elevated temperature, the terrestrial matter addition effects were intensified, further shifting the size distribution of the microbial food web base from picoplankton to microphytoplankton. These changes up the food web led to increase in the biomass and proportion of large-sized ciliates (>60 µm) and rotifers. Despite the shifts in the microbial food web size structure, grazing experiments suggested that the pathway from picoplankton to nano- and microzooplankton constituted the major energy flow in all treatments. The study implies that the microbial food web compartments in shallow coastal waters will adjust to climate induced increased inputs of terrestrial matter and elevated temperature, and that the major energy path will flow from picoplankton to large-sized ciliates during the summer period.
Introduction
Autotrophic and heterotrophic microorganisms are important components at the base of aquatic food webs. The microbes are involved in a continuum of trophic pathways depending on the physicochemical environment. The trophic structure stretches from herbivorous food webs, dominated by autotrophic microplankton grazed by mesozooplankton to microbial loops dominated by heterotrophic bacteria grazed by small protozoa, nanoflagellates (Azam et al., 1983, Legendre and Rassoulzadegan, 1995). Climate change affects the physicochemical environment in aquatic systems, thus likely altering the microbial community structure and function.
Severe temperature alterations, precipitation and extreme weather events have been attributed to climate change, affecting all Earth environments (Pörtner et al., 2022). In northern Europe, and especially the northern Baltic Sea areas, both elevated temperature and increased precipitation are projected, which will lead to higher river inflows of terrestrial matter and nutrients to the coast (Meier et al., 2012; Andersson et al., 2015; Meier et al., 2022). However, how those combined changes will affect the trophic pathways and food web functions is unclear.
Warming will induce several food web changes, including a decrease in size of organisms like bacteria, phytoplankton, protozoa and mesozooplankton (Andersson et al., 1986; Andersson et al., 1994; Suikkanen et al., 2013). This decrease would be due to the combined effects of nutrient limitation and temperature (Mousing et al., 2014). Increased temperature will lead to faster assimilation of nutrients by osmotrophic organisms (heterotrophic bacteria and phytoplankton), and nutrient depletion will promote small-sized organisms due to their large surface-to-volume ratio (Samuelsson et al., 2002). In turn, small-sized phytoplankton and bacteria may, facilitate feeding of smaller micro- and mesozooplankton grazers, as the food chain is size-structured (Fenchel, 1987). As a result, new niches in the food web can appear, including intermediate trophic levels. Furthermore, higher temperatures may disfavor autotrophy and promote heterotrophic processes (Hoppe et al., 2002; Müren et al., 2005), i.e., heterotrophic bacterial production and grazing by heterotrophic protists (Hoppe et al., 2002; Rose et al., 2009).
In coastal areas receiving terrestrial matter the microbial food web often dominates, where heterotrophic bacterial production is enhanced, and phytoplankton primary production is hampered due to darkening (browning) of the water (e.g. Figueroa et al., 2016; Andersson et al., 2018). However, if terrestrial matter inflows are accompanied by large amounts of nutrients, phytoplankton growth can be promoted, supporting microphytoplankton rather than picoplankton in microbial loops (Legendre and Rassoulzadegan, 1995; Paczkowska et al., 2019).
Inflows of terrestrial matter to coastal waters have been shown to promote protozoa, such as heterotrophic and mixotrophic nanoflagellates (2-20 μm) and ciliates (30-100 μm) (Vähätalo et al., 2002; Paczkowska et al., 2019). The large size range of ciliate communities reflects co-existence of different functional groups with varying food preferences. The present paradigm states that, in terrestrial matter rich waters, ciliates constitute an important link from the microbial food web to mesozooplankton, which in turn are food for planktivorous fish (Vähätalo et al., 2002; Andersson et al., 2015; Paczkowska et al., 2019). However, in-depth knowledge of how terrestrial matter inputs drive the ciliate functional ecology and community structure is lacking.
To approach these questions, we performed a mesocosm study to elucidate how warming and increased terrestrial matter inputs affect the energy flows in the microbial food web in a shallow coastal system, consistent with a climate change scenario. The experimental system consisted of a natural plankton community and larval planktivorous fish from the coastal northern Baltic Sea. Effects on the energy flow in the microbial food web and ecosystem functions were assessed by compiling changes in production and biomass of different functional groups. We expected that increased temperature would favor small-sized plankton organisms, such as picoplankton and heterotrophic microbes, driving the system towards net-heterotrophy. Also, we expected that terrestrial matter addition would promote the heterotrophic microbial food web, thus further enhancing net-heterotrophy. Therefore, when temperature elevation was combined with terrestrial matter addition, the strongest net-heterotrophy stimulation was expected.
Materials and methods
Mesocosm experiment
A 35-day mesocosm experiment was performed at Umeå Marine Sciences Center (Sweden), May-July 2013, using seawater from the northern coastal Baltic Sea (63°56’N, 19°54’E). The experiment had 4 treatments (3 replicates each) representing systems with and without inputs of terrestrial matter (tM) (5.2 and 7 mg C l-1, respectively) at two temperatures (15°C as “present day” and 18°C as “climate altered” conditions). +3°C was chosen as the surface water temperature is projected to increase by 2-4°C in the Baltic Sea (HELCOM, 2013a; HELCOM, 2013b). Treatments were named 15, 18, tM15 and tM18, to indicate temperature and tM enrichment.
In total, 12 polypropylene tanks (Allembalage AB, Jordbo, Sweden), with a height of 1 m and volume of 1000 l were immersed in four large pools. All tanks were simultaneously filled with seawater collected 1 km offshore in the northern Bothnian Sea (63° 34’N, 19°54’E) using a Flygt 3152.181 pump (Xylem Sundbyberg Sweden). The salinity was 3‰, which is normal for the sea area Andersson et al. (2018). The water was filtered (1 mm slit filter, Bernoulli System Lund, Sweden) to remove fish and allow natural communities of bacteria, phytoplankton, protozoa and mesozooplankton to populate the mesocosms. A computer-controlled cooling/heating system kept the temperature constant in the pools. Each pool contained three mesocosms and treatment allocation was randomized, with at least one treatment represented in each appropriate block. Ambient air was gently bubbled at the bottom of each mesocosm to create a well-mixed water column, and a semi-transparent polyethylene-phthalate roof covered the mesocosms.
Terrestrial matter was extracted from natural humic soils in a nearby mesic mixed forest, dominated by Picea abies and Betula pubescens (co-dominant). The field layer was of Vaccinium myrtillus type. The soil was extracted as described in Ripszam et al. (2015), and filtered through a 90 μm mesh. The carbon concentration of the soil extract was ~2.1 g C l-1, and the C: N: P molar ratio was approximately 2985:33:1, calculated based on the ratio of DOC: TDN: TDP. Terrestrial matter addition started directly after filling the mesocosms with seawater, by gradual addition to each of the 6 mesocosms (tM treatment) reaching a total addition of 2 mg l-1 of DOC at the end of the experiment. This corresponds to a 40% increase, which is approximately what is forecasted over the next 100 years due to climate change (Hägg et al., 2010). 25% of this amount (0.5 mg.l-1) were added on the first day of the experiment, to boost the system, and after that 6.8% were added three times a week (0.14 mg C l-1 per 3 days).
In addition to carbon, the soil extract also contained dissolved nitrogen and phosphorus. Previous studies have shown that the bioavailable portion of dissolved nitrogen and phosphorus in riverine and coastal waters is ~20-30% and 75%, respectively (Stepanauskas et al., 2002; Lignell et al., 2008). Therefore, to target the effects of increased carbon, we added equal amounts of dissolved inorganic nitrogen (DIN) and dissolved inorganic phosphorus (DIP) to the non-enriched mesocosms to match the nutrient concentrations in the tM treatments and balance their bioavailability. Nutrient addition started directly after filling the mesocosms with seawater.
As the top consumer, we used larval perch (Perca fluviatilis), hatched from egg strands collected from a coastal spawning bay. 10 individuals (6.26 ± 0.25 mm, mean ± 1 SD) were added to each tank on the 5th of June and collected on the 26th of June. Results of fish responses to the experimental treatments are presented elsewhere (Åsa Berglund submitted).
Sampling and analyses of physicochemical and biological variables
Samples were taken 3-6 times during the experiment to measure physicochemical and biological variables. In general, the samples were collected in the middle of the mesocosms.
Light, nutrients and chlorophyll a
Photosynthetically active radiation (PAR) was measured around noon (11 am-1 pm) three times during the experiment (start, mid and end), using a PAR Licor sensor (LICOR -193SA). The measurements were performed at midday at five positions: in the four corners and the middle at three different depths: 0, 0.45 and 0.90 m; the average PAR value per mesocosm was calculated from the 15 data points.
Concentrations of dissolved organic carbon (DOC) were analyzed using a high-temperature carbon analyzer (Shimadzu TOC-L) and total N, total P, dissolved inorganic nitrogen (DIN) and dissolved inorganic phosphorus (DIP) were analysed using a Seal Analytical QUAATRO auto analyzer.
To measure chlorophyll a (Chl a), 100 ml samples were filtered onto 25 mm GF/F filters under low vacuum and stored at -80°C. The pigments were extracted in 95% ethanol in the dark at 4°C overnight, and measured with a Perkin Elmer LS 30 fluorometer (433/674 nm excitation/emission wavelengths) (HELCOM, 2013b).
Heterotrophic bacterial production and phytoplankton primary production
Heterotrophic bacterial production and primary production samples were collected in the middle of each mesocosm. Heterotrophic bacterial production (BP) was measured using the [3H-methyl]-thymidine technique (Fuhrman and Azam, 1982). 1 ml of mesocosm water was added to three Eppendorf tubes, one control and technical duplicates for the test samples. Bacteria in the control were pre-killed by adding 100 µl ice-cold 50% TCA and incubation at -20°C for 5 minutes. 2 µl [3H]-thymidine (84 Ci mmol l-1; Perkin Elmer, Massachusetts, USA) were added to each tube to a final concentration of 24 nM. The incorporated thymidine was converted to cell production using the conversion factor of 1.4 x10¹⁸ cells mol-1 (Wikner and Hagström, 1999). To calculate carbon biomass production, a bacterial carbon content of 20 fg C cell -1 was assumed (Lee and Fuhrman, 1987), which has been shown to be representative for the coastal area (data not shown). Daily production rates were calculated assuming stable uptake rates over the day.
Primary production (PP) was measured using the 14C technique. 5 ml seawater were added to three 20 ml transparent glass vials with one dark tube as a control. 7.2 µl 14C were added to each vial (14C Centralen Denmark, activity 100 µCi/ml) and incubated at 80-cm depth for ~3 hours. The samples were analysed in a Beckman 6500 scintillation counter. Daily primary production was calculated as described in Andersson et al. (1996).
Picoplankton: heterotrophic bacteria and picophytoplankton
Samples for analysis of picophytoplankton and heterotrophic bacteria were collected in the middle of the mesocosms, preserved in 0.1% glutaraldehyde (final concentration) and frozen at −80°C (Marie et al., 2005) for later counts using a BD FACSVerse™ flow cytometer (BD Biosciences) equipped with a 488 nm laser (20 mW output) and a 640 mn laser (output 40 mW). The frozen samples were quickly thawed in a 30°C water bath and pre-filtered through a 50 µm mesh. Picophytoplankton samples were run with 3 µm microspheres (Fluoresbrite R plain YG, Polysciences) as internal standard. Picophytoplankton abundance was converted to biomass using carbon conversion factors 120 fgC cell−1 for picocyanobacteria and 829 fgC cell−1 for picoeukaryotic phytoplankton, based on microscopic measurements of cell sizes (see below).
Heterotrophic bacteria samples were diluted with 0.2-µm filtered seawater, stained with SYBR Green I (Invitrogen) (1:10000, final concentration) and kept in the dark at room temperature for 10 min. 1 µm microspheres (Fluoresbrite R plain YG, Polysciences) were added to each sample as internal standard and analyses were run at a low flow rate of 30 µl min−1 with an acquisition time of 2 min. Heterotrophic bacteria abundance was converted to biomass using carbon conversion factor 20 fgC cell−1 (Lee and Fuhrman, 1987).
Nano- and microphytoplankton
Samples were collected in the middle of the mesocosms, fixed with 2% acidic Lugol’s solution and stored in darkness at 4°C until analysis. To analyse nano- and microphytoplankton and heterotrophic nanoflagellates, 10-50 ml were settled for 12-48 hours in sedimentation chambers and cells were counted with an inverted microscope (Nikon Eclipse Ti) at 100-400x magnification using phase contrast settings (Utermöhl, 1958). Cells were grouped into three functional groups (AU: autotrophs, HT: heterotrophs, MX: mixotrophs), based on the feeding mode (Olenina et al., 2006), and two size classes (nanophytoplankton: 2–20 µm, microphytoplankton: >20 µm), based on the measurements of the longest cell axis. Filamentous cyanobacteria were assigned to the microphytoplankton category based on the size of the tightly clustered amalgamations of cells. Nutritional characteristics of plankton were identified based on their trophy (Tikkanen and Willen, 1992; Hällfors, 2004; Olenina et al., 2006). As Lugol’s solution stains Chl a brown, the color of the smallest cells was used to support the trophy classification.
Biomass of pico, nano and microphytoplankton
Phytoplankton and heterotrophic nanoflagellates biomass was calculated from the geometric shape of cells following Olenina et al. (2006), and cell carbon content was calculated according to Menden-Deuer and Lessard (2000). Total phytoplankton biomass (TB) was the sum of autotrophs carbon biomass, including pico-, nano- and microplankton and mixotrophs (for example Mesodinium rubrum). The relative contribution of different size classes and functional groups to the total biomass was calculated.
Ciliates
For the analysis of ciliates, 25–50 ml were settled for at least 24-48 h in Utermöhl’s chambers and counted with an inverted microscope at 200× magnification. The entire content of each Utermöhl’s chamber was surveyed, and an additional subsample was counted if the total number of organisms was <150. Ciliate biovolume was calculated by their geometric shape using measurements of the cell length and width of at least 20 cells of each species/taxa per sample. Cell carbon biomass of aloricated ciliates was calculated according to Menden-Deuer and Lessard (2000), and carbon biomass of tintinnids was estimated using the experimentally derived factor of 0.053 pg C pm-3 lorica volume (Verity and Lagdon, 1984). Different functional groups of ciliates were classified according to Mironova et al. (2013): pico-filterers (bacterivorous), nano-filterers (algivorous), pico/nano- filterers (bacterio/algivorous), omnivores (heterotrophic flagellates, algae and ciliates) and predators (ciliates). Further, the ciliates were grouped into the following size classes: <20 µm, 20-30 µm, 30-60 µm and >60 µm.
Zooplankton
Once per week, zooplankton was sampled using a 25 µm nylon net (mouth diameter 0.14 m). Three vertical tows per sampling were performed, comprising a total volume of 40 liters. The samples were preserved with RNAlater and stored at 4°C until analysis. The entire sample content was counted using a counting chamber and an inverted microscope (Leitz fluovert FS, Leica) at 80× magnification. Copepods were classified according to species, developmental stage (nauplii, copepodites CI–III, CIV–V and adults), and sex, whereas cladocerans were classified according to species, maturity (adults and juveniles) and sex. Biomass was calculated using abundance data and species- and stage-specific weights (Hernroth, 1985).
Photosynthetic efficiency, heterotrophic bacterial growth rate and ecosystem trophy
Phytoplankton photosynthetic efficiency was calculated by dividing primary production rate by the Chl a concentration according to Andersson et al. (2018). Heterotrophic bacterial specific growth rate was calculated by dividing the bacterial production by the bacterial biomass according to Andersson et al. (2018). Ecosystem trophy, defined as net-heterotrophy or net-autotrophy, was calculated as a difference between primary production and heterotrophic bacterial production, with positive and negative values indicating ecosystem net-autotrophy and net-heterotrophy, respectively.
Statistical analyses
In mesocosm experiments, it usually takes a few weeks to stabilize physicochemical and biological parameters in the system (e.g. Paczkowska et al., 2020). We were mainly interested in treatment effects of the stabilized systems. For example, in our experiment the primary production was relatively high in the beginning of the experiment, but after three weeks of incubation it stabilized at a lower level (Supplementary Figure 1). Heterotrophic bacterial production also showed decreasing values during the first weeks of the experiment, but during the three last weeks the values stabilized (Supplementary Figure 1). Therefore, data from the last two-three weeks of the experiment (week 3 – 5) were used, translating into 2-3 data points per mesocosm. The differences between the treatments were evaluated using Kruskal-Wallis test for each abiotic and biotic variable. The non-parametric approach was chosen because the homogeneity assumption was violated for most variables, as shown by the Levene test. Arcsine transformation was used for percentage data. Multiple comparisons of mean ranks for all variables were used, with p<0.05 indicating significant differences between the groups. Statistical tests were performed using STASTISTICA 7.0 (StatSoft Ltd.).
Grazing experiment
Towards the end of the experiment (weeks 4-5), dilution experiments were conducted to estimate nano- and microzooplankton (2-200 µm) grazing on heterotrophic bacteria and phytoplankton (size fractions <3 and 3-50 µm) in randomly chosen mesocosms from different treatments (15, 18, tM15 and tM18). For these experiments, 20 l water from each mesocosm were taken; half of the volume was used to prepare the particle-free water (FW) and the rest was used as whole water (WW). FW was prepared by pre-filtering through 50-µm plankton mesh to remove larger particles and then through 0.2-µm Millipore filter under a slight vacuum. The filtration process took about one hour. WW was gently poured through a 200 µm mesh to remove mesozooplankton. For the 15 and tM15 mesocosms, the WW was diluted by FW to four target dilutions in ratios of 1:0, 3:1, 1:1, 1:3 (dilution factor or decimal fraction of WW: 1; 0.75; 0.5; 0.25 respectively). For the 18 and tM18 mesocosms, a fifth treatment was added, where WW was diluted by FW in ratio of 1:9 (dilution factor 0.1). The exposure was carried out in duplicates, in 1 l transparent glass sterile bottles that were incubated at the same temperature and light conditions as in the mesocosm tanks for 24-48 h. To ensure that nutrients are available to phytoplankton at all dilution levels, nitrate (10 µg N l-1) and phosphate (1 µg P l-1) were added in excess to each bottle (Landry and Hassett, 1982). For bacteria, a carbon source (mixed glucose, galactose, mannitol and sodium acetate) was added to a final concentration of 140 µmol l-1 (Stepanauskas et al., 2002).
At the start and the end of experiment, 300 ml of each dilution mixture were sampled for heterotrophic bacteria, <3 and 3-50 µm phytoplankton fractions. For nutrient analysis (nitrate, nitrite, ammonium, phosphate and silicate) and microzooplankton counts, samples were taken only from 1:0 treatment (WW only) at the beginning and the end of the experiment.
The data analysis was performed according to Landry and Hassett (1982). The prey apparent growth rate (AGR, d-1) was estimated as:
Where Pt and Po are final and initial concentrations of prey (heterotrophic bacteria, phytoplankton <3 and 3-50 µm size fractions), and t is incubation time (d). Heterotrophic bacteria and phytoplankton were analyzed using flow cytometry, as described above.
The rates of prey growth and grazing mortality were calculated using the linear regression of AGR versus dilution factor. The regression slope is the microzooplankton grazing rate (g, d-1), and the intercept is the growth rate of prey in the absence of grazing (µ, d-1). A significant negative slope (one-tailed t-test, p<0.05) was used as evidence for measurable grazing. When statistically non-significant regression or positive slope were observed, the grazing rates were not determined.
Grazing of the potential production of heterotrophic bacteria and different size fractions of phytoplankton (< 3 µm, 3-50 µm) were calculated (Pp,% d-1):
Where µ is growth rate of prey and g is grazing rate of microzooplankton (James and Hall, 1998) calculated as described above.
Results
Temporal variation
Temporal dynamics of bottom up and top-down factors
Temperature, nutrients (DOC, TN, DIN TP and DIP) and light (PAR) constituted bottom-up factors for microbial food web responses. The temperature was successfully maintained at 15°C and 18°C with a variation of <0.5%. The DOC concentrations were stable over time in the non-enriched mesocosms, averaging 5.2 mg C l-1, while in the tM enriched systems, the concentrations increased steadily during the experiment to reach 7 mgC l-1 at the end of the experiment (Figure 1).
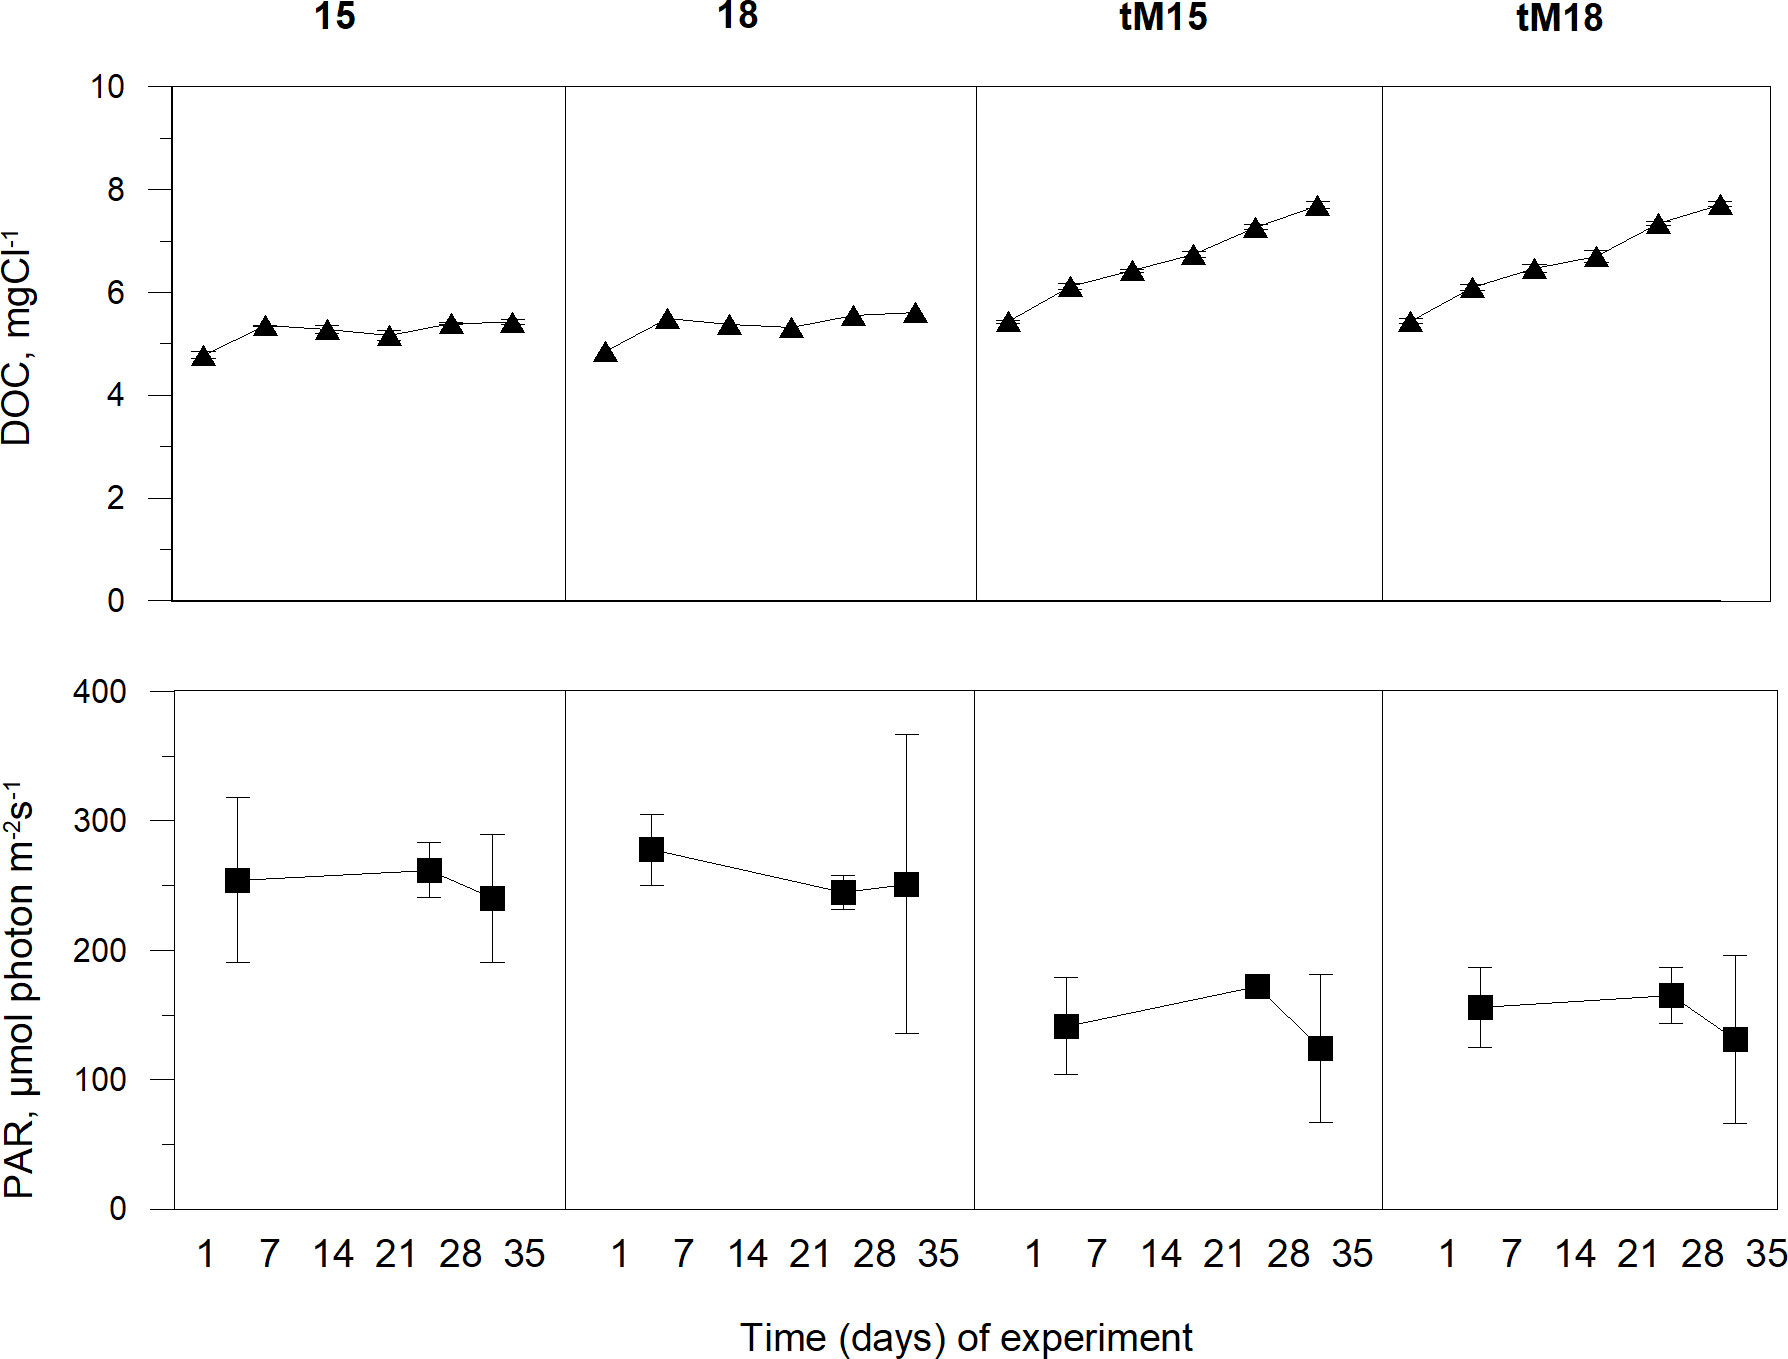
Figure 1 Dissolved organic carbon (DOC) and photosynthetically active radiation (PAR) during the experiment in different treatments: 15, 18, tM15 and tM18. Error bars denote standard deviation.
Total organic nitrogen and phosphorus showed similar temporal patterns as DOC (Supplementary Figure 2). In the non-enriched mesocosms, the dissolved inorganic nitrogen and phosphorus decreased, except for the high temperature 18°C that showed more varying values (Supplementary Figure 2). In the tM enriched mesocosms the DIP showed high values at the start, decreased in the middle and increased again towards the end of the experiment (Supplementary Figure 2). Light (PAR) showed low temporal variation within treatment (coefficient of variation <10%), but the values were ca. 40% lower in the tM-enriched mesocosms (Figure 1).
The mesozooplankton community consisted of cladocerans, rotifers and copepods (Supplementary Figure 3). The mesozooplankton biomass decreased over time in all treatments (Figure 2), and the mean size declined significantly, mostly in the tM18 treatment, where the fraction of small-bodied zooplankton (mostly rotifers) increased from ~30 to 45% during the latter part of the experiment (Supplementary Figure 4).
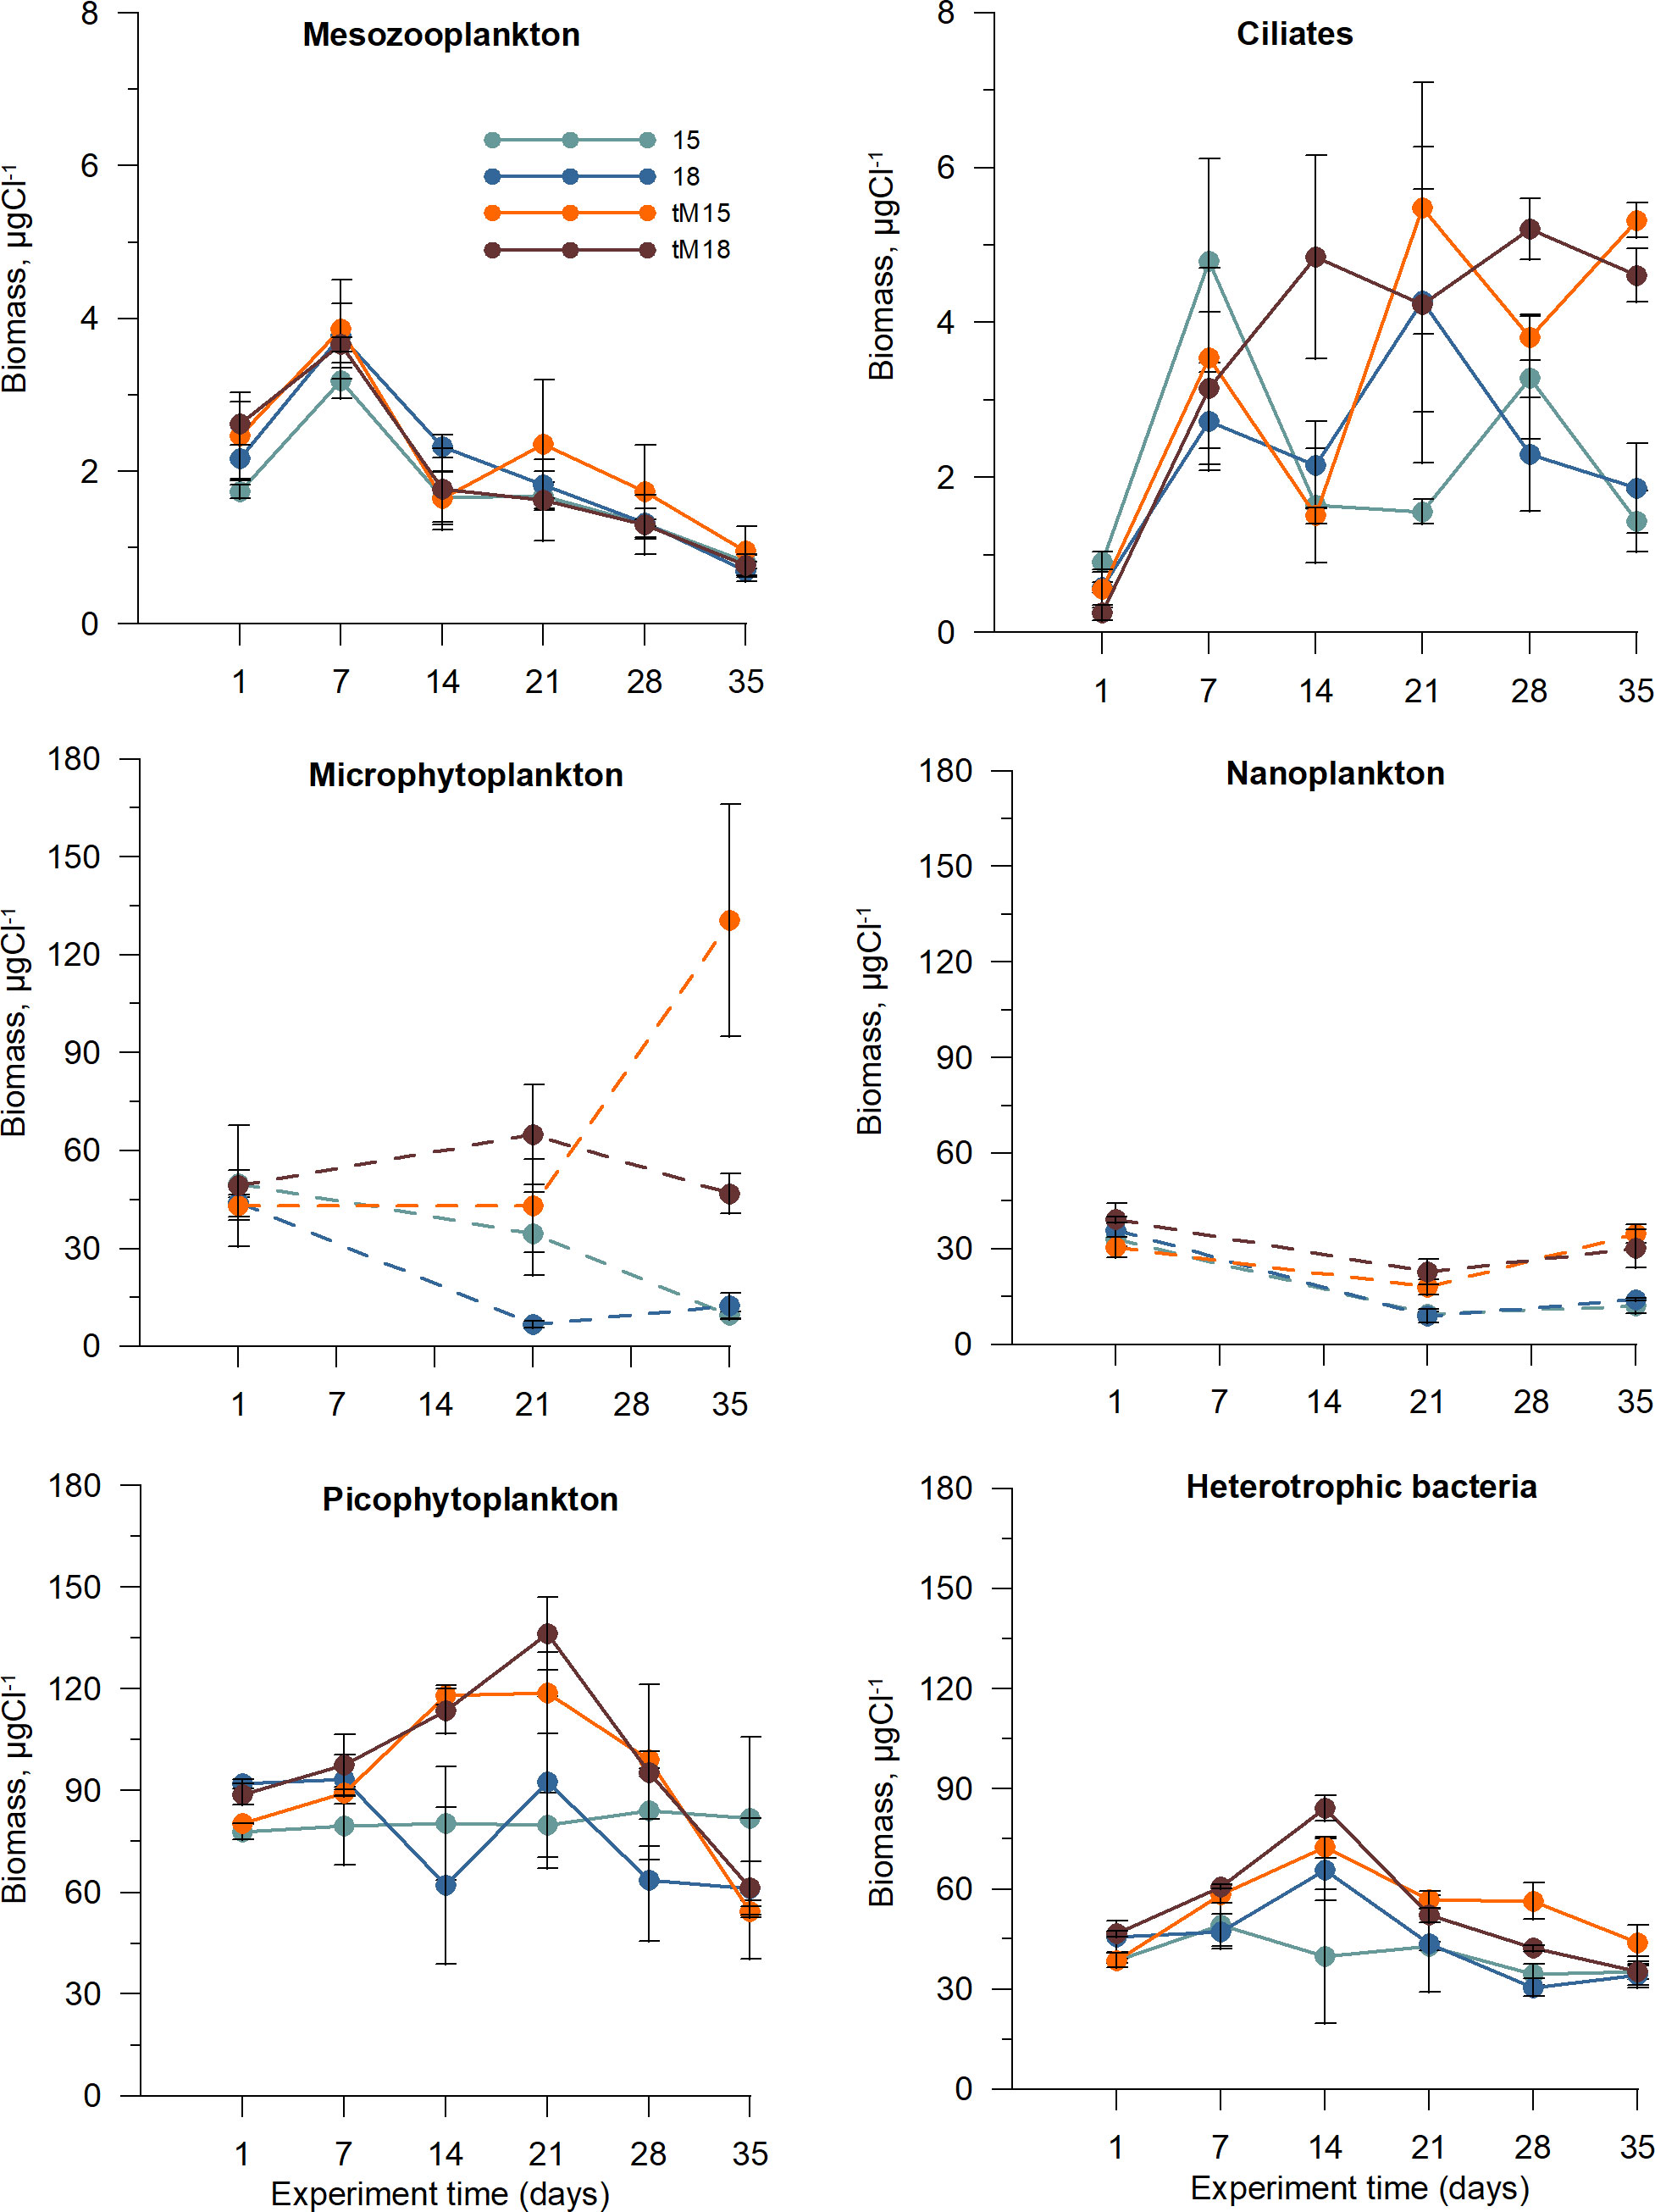
Figure 2 Temporal variation of mesozooplankton, ciliates, microphytoplankton (autotrophic (AU) and mixotrophic (MX)), nanoplankton (heterotrophic (H), MX and AU), picophytoplankton (picocyanobacteria + picophytoeukarytotes, AU) and heterotrophic bacteria (HT) in different treatments. Error bars denote standard error. Dashed lines indicate few sampling points.
Temporal variation of microbial food web components
Ciliates represented the highest trophic level of the microbial food web. The ciliate community showed high versatility, with five feeding types: pico-filterers, pico-nano-filterers, nano-filterers, omnivores and predators (Table 1). Pico-filterers were mostly dominated by oligotrichids (Lohmanniella spp. and Strombidium spp.), whereas pico-nano-filterers were represented by peritrichids (Vorticella spp. and Epystilis spp.), and scuticociliates (Uronema spp. and Cyclidium spp.). The dominant omnivorous ciliate was the hypotrichid Stylonychia sp. (Supplementary Figure 5). Within the predator group, haptorids Monodinium sp., Didinium sp. and Lacrymaria sp. were common (Table 1). The total ciliate biomass increased in all treatments during the first week, and after that further increases were observed in the tM-enriched mesocosms (Figure 2). The ciliate biomass plateaued/stabilized during the last two weeks of the experiment in all treatments (Figure 2). Omnivorous and predatory ciliates increased over time in the tM-enriched mesocosms (Supplementary Figure 6), while other groups showed a more fluctuating pattern. No clear temporal trend was observed in the non-enriched mesocosms (Supplementary Figure 6).
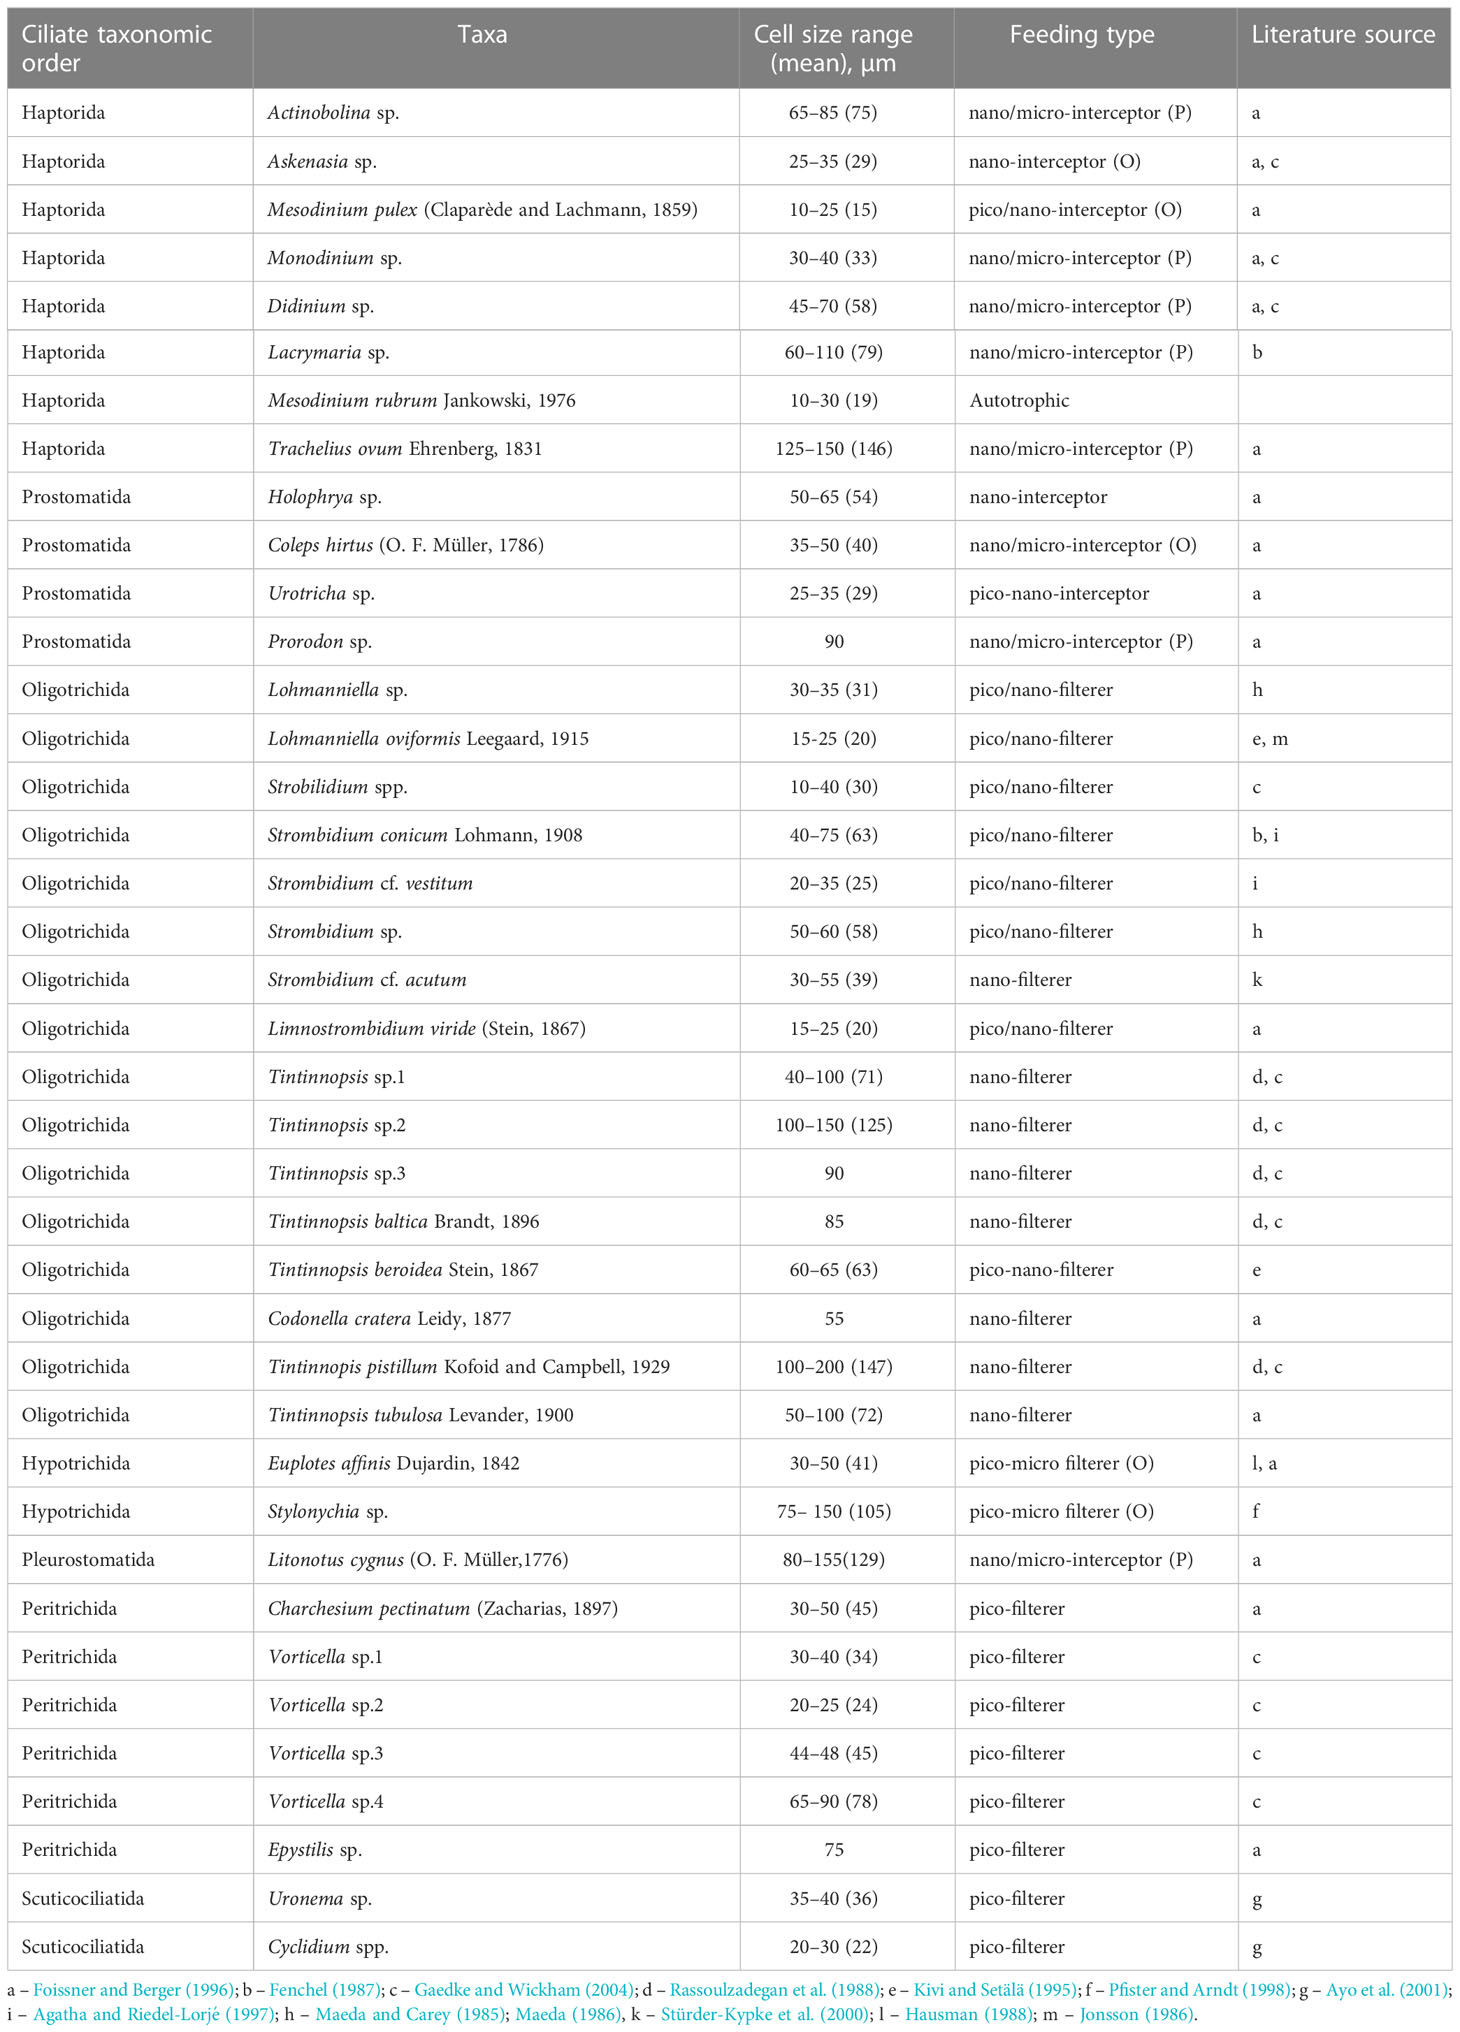
Table 1 Cell size range (min-max and mean in brackets) and feeding type of ciliate taxa in the mesocosm experiment: O, omnivorous; P, predator.
Micro-, nano- and picoplankton constituted the base of the microbial food web. Microphytoplankton was dominated by autotrophic diatoms in all mesocosms, while heterotrophic, mixotrophic and autotrophic taxa constituted nanoplankton; many of those were flagellates. In the tM-enriched mesocosms, the micro and nanoplankton remained relatively constant (except for one outlier, microphytoplankton tM15, day 35), while their biomass decreased over time in the non-enriched treatments. Picophytoplankton consisted of pigmented eukaryotic cells and picocyanobacteria. In the tM-enriched mesocosms, picophytoplankton increased during the first weeks of the experiment and decreased after that (Figure 2). However, in the non-enriched mesocosms, their biomass was relatively constant throughout the experiment. Heterotrophic bacteria showed a similar temporal pattern as picophytoplankton (Figure 2).
Stabilized treatment effects
Bottom-up factors
Regardless of the incubation temperature (15 and 18°C), the DOC concentrations were significantly higher (ca 40%) in the tM-enriched than in the non-enriched mesocosms (Figure 3, Supplementary Table 1). The added terrestrial matter was colored, causing a decrease in the average photosynthetically active radiation (PAR) from ~250 to 150 µmol photon m-2 s-1 (Figure 3, Supplementary Table 1). The terrestrial matter also contained nitrogen and phosphorus, causing an approximate doubling of the total (TN and TP) and inorganic nitrogen and phosphorus (DIN and DIP) concentrations compared to the non-enriched mesocosms (Figure 3, Supplementary Table 1).
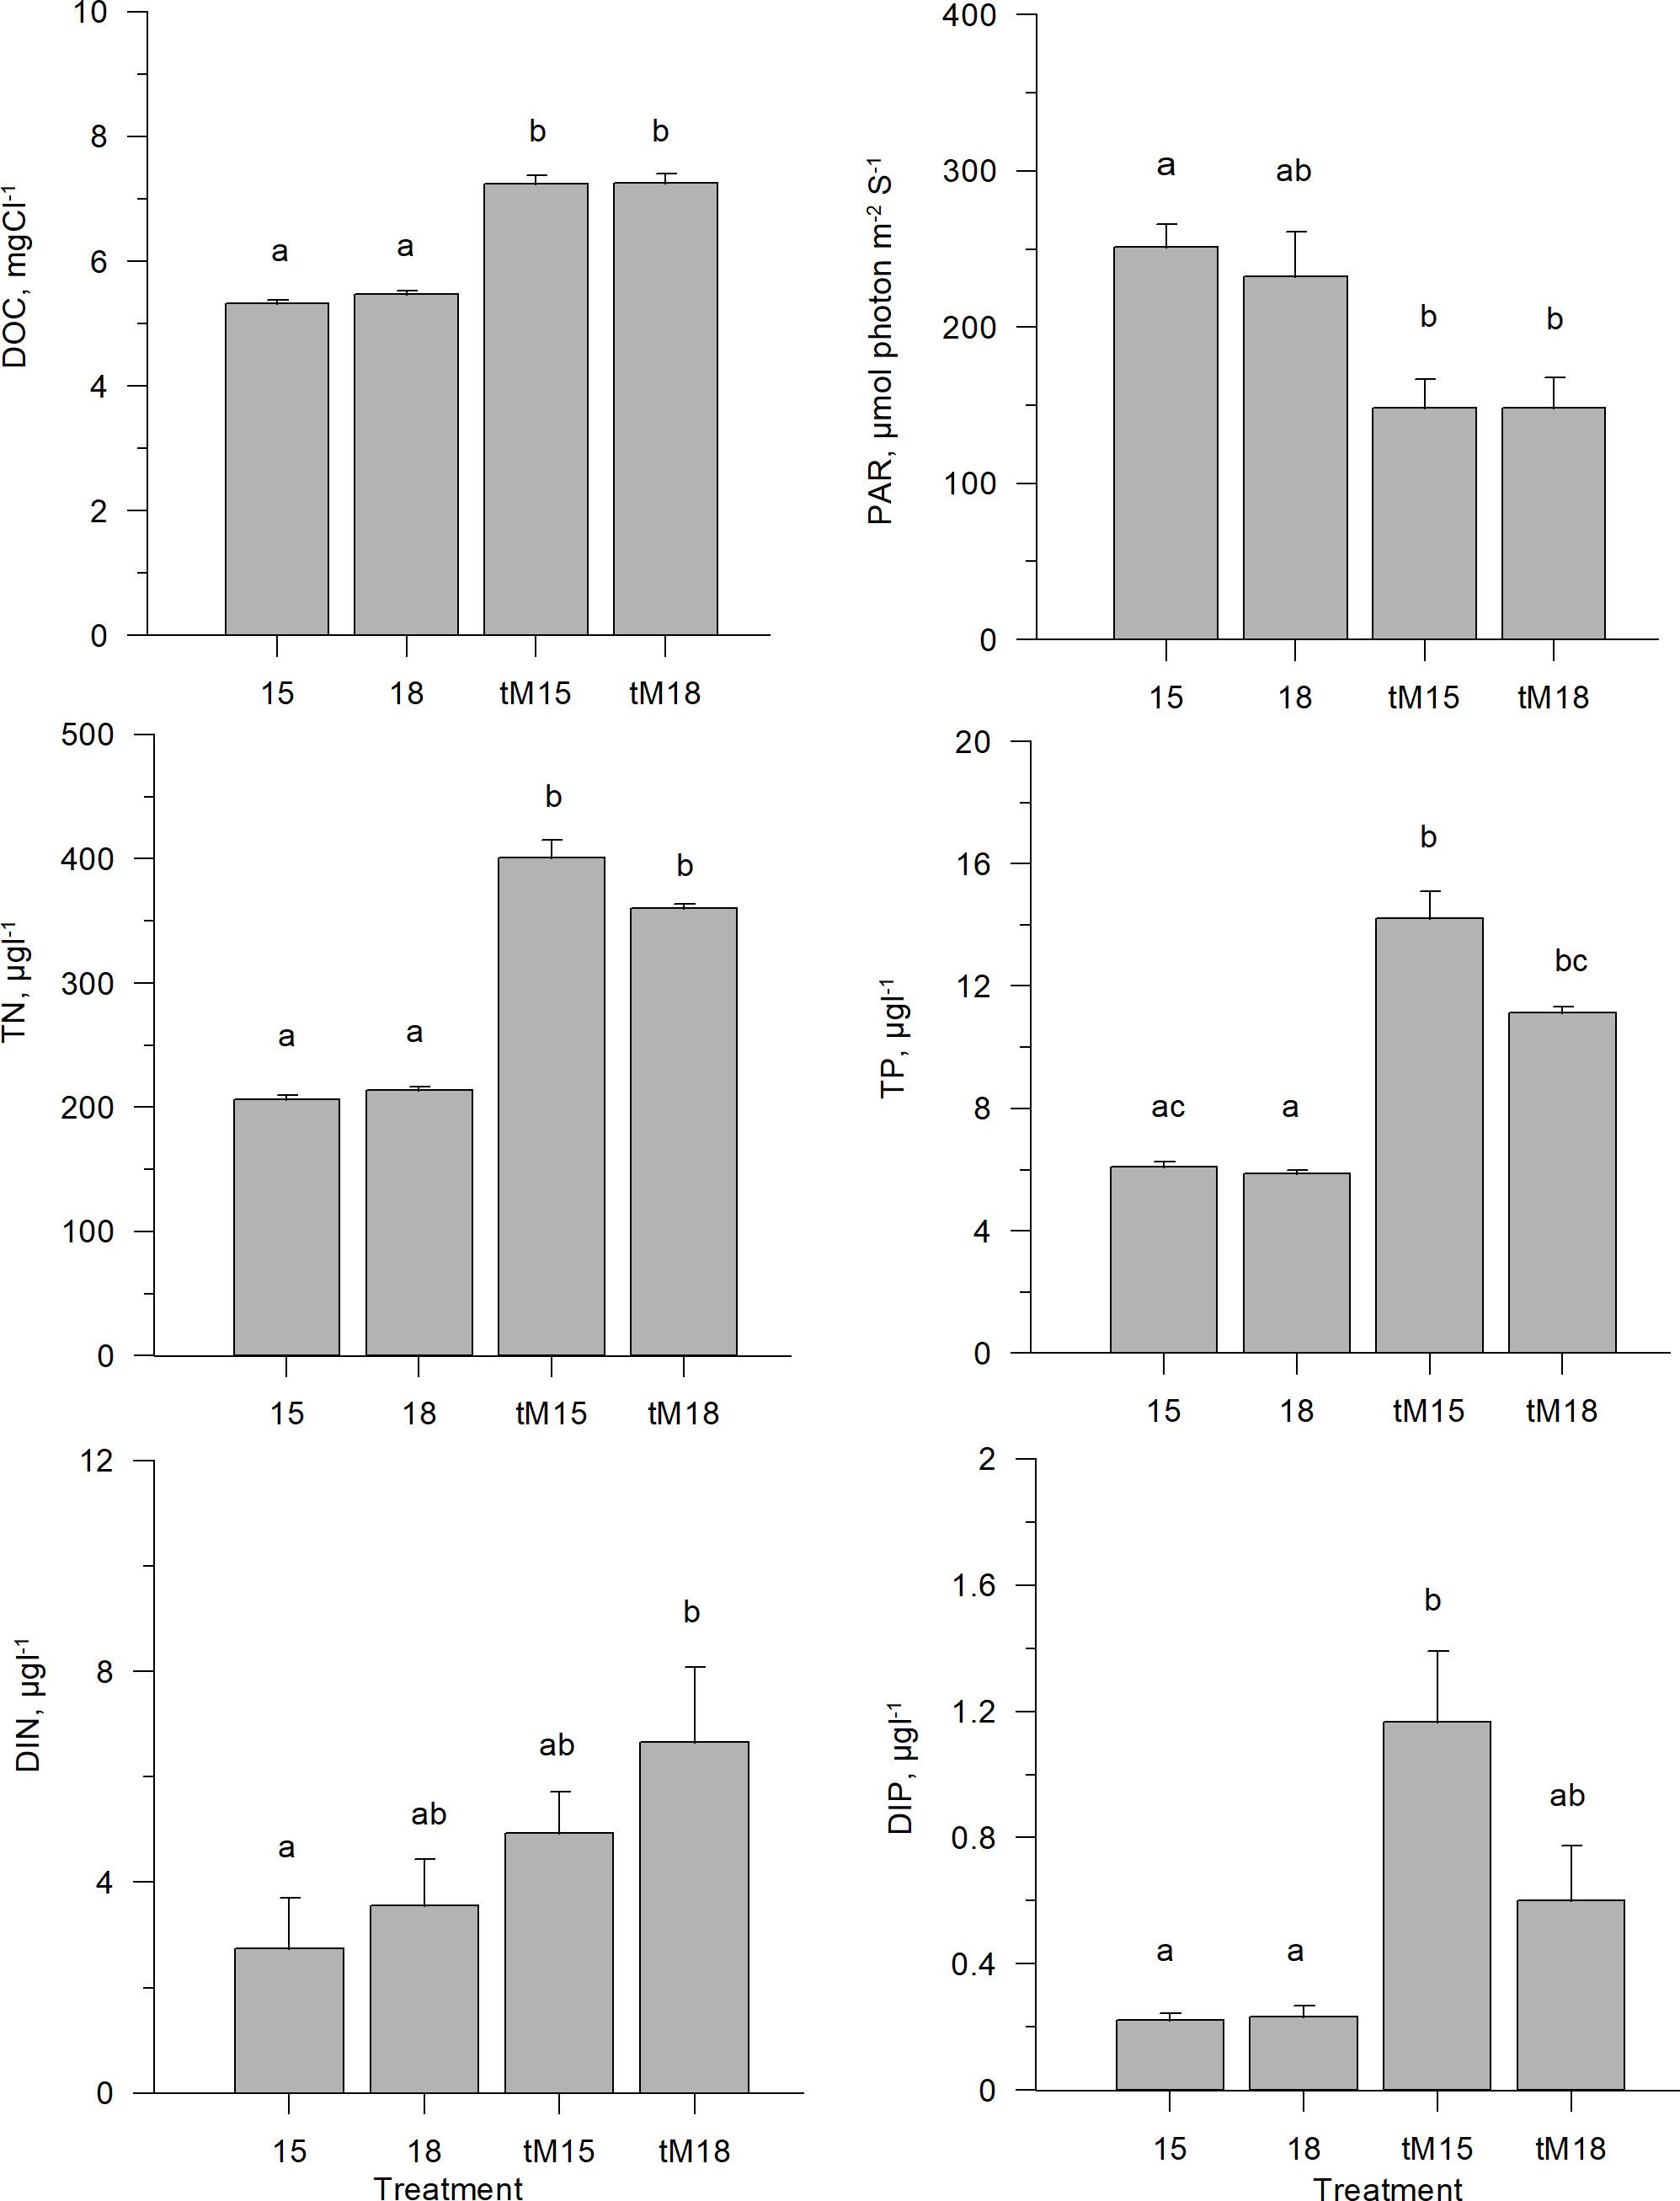
Figure 3 Abiotic variable averages during the last three weeks of experiment; dissolved organic carbon (DOC), photosynthetically active radation (PAR), total nitrogen (TotN), total phosphorus (TotP), dissolved inorganic nitrogen and dissolved inorganic phosphorus in different treatments. Error bars denote standard error. Letters indicate the results of the Kruskal-Wallis test and post-hoc means of ranks for all groups test. Treatments with the same letters are not significantly different based on mean ranks comparison test (p>0.05).
Standing stocks of major plankton groups
During the last weeks of the experiment, the copepod + cladoceran biomass was low in all treatments, and no significant difference was observed between the treatments (Figure 4, Supplementary Table 1). The rotifer biomass was similar in most treatments, but the lowest in the 18°C incubation (Figure 4, Supplementary Table 1). Terrestrial matter addition caused increased biomass of ciliates, total phytoplankton and heterotrophic bacteria, while temperature increase alone did not cause any general increase or decrease of these groups (Figure 4, Supplementary Table 1). Heterotrophic nanoflagellates (HNF) showed a similar pattern, albeit not significant (Figure 4, Supplementary Table 1). In the tM-enriched systems, phytoplankton and heterotrophic bacteria tended to decrease at the highest temperature (Figure 4, Supplementary Table 1).
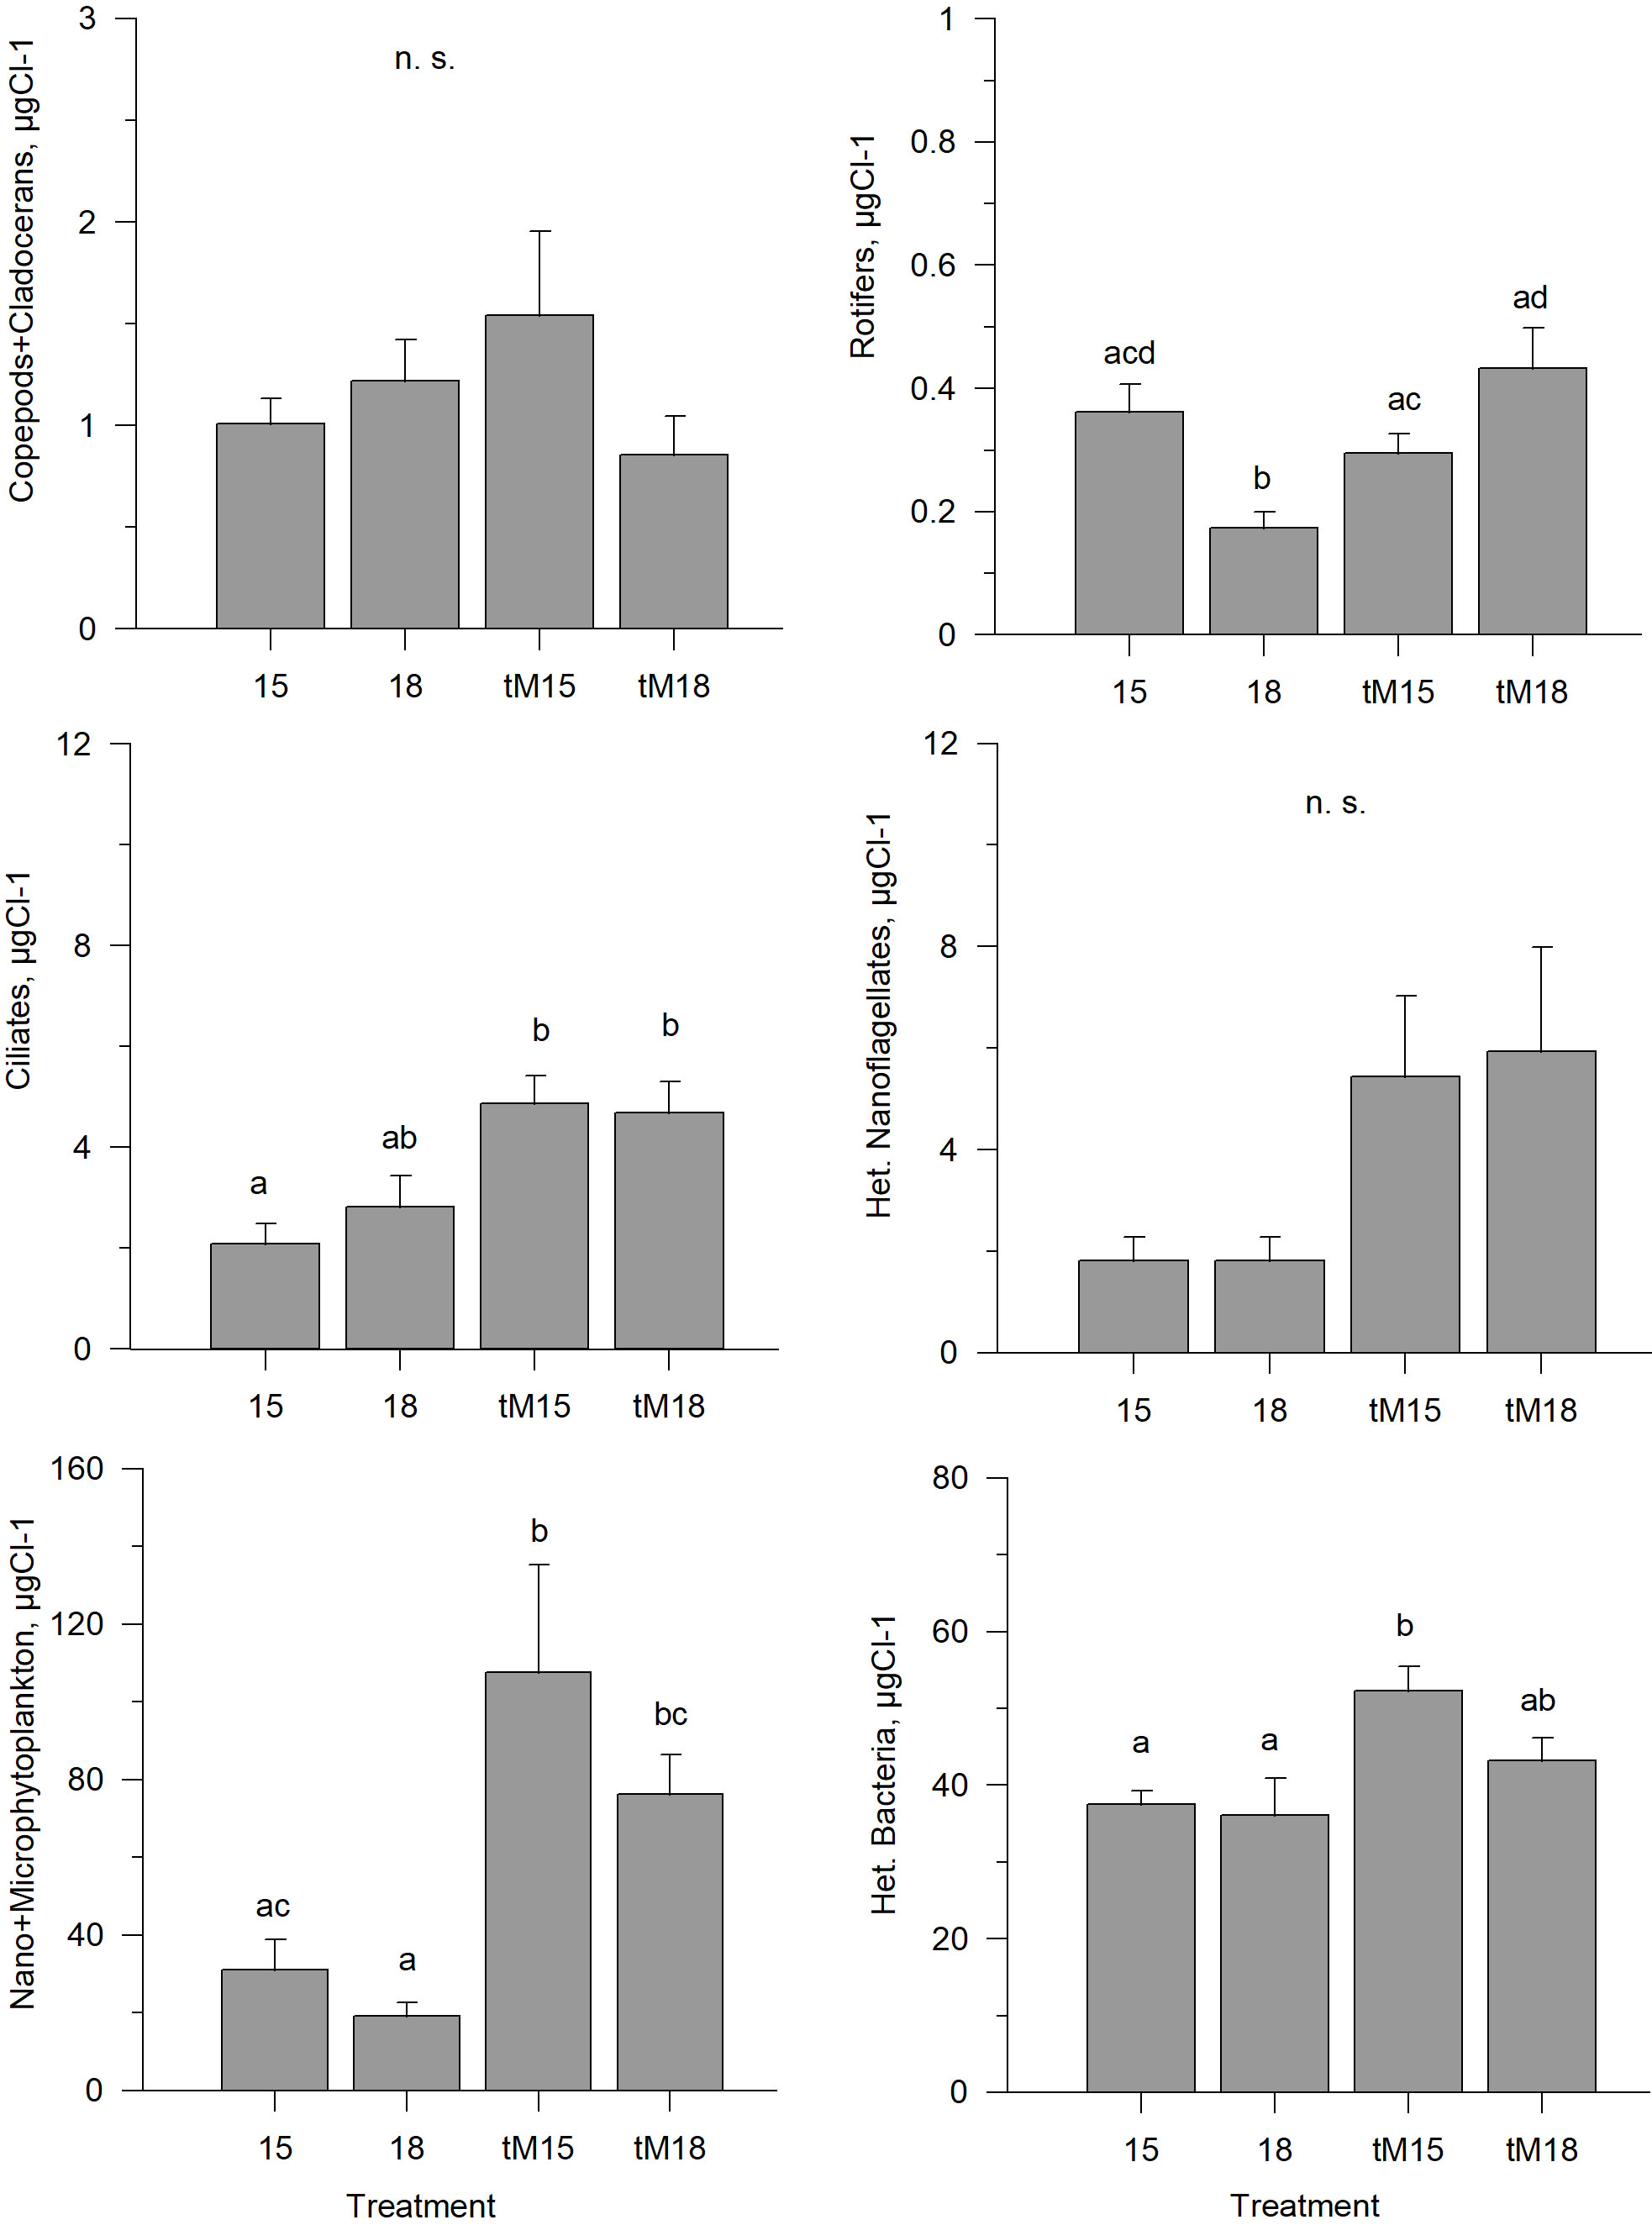
Figure 4 Average biomass of key functional groups of organisms during the last three weeks of the experiment in different treatments. Error bars denote standard error. Letters indicate the results of the Kruskal-Wallis test and post-hoc means of ranks for all groups test. Treatments with the same letters are not significantly different based on mean ranks comparison test (p>0.05), n.s., not significant.
Size-structure of the microbial food web base
Autotrophic and heterotrophic picoplankton constituted the largest pool, 60-90%, of the microbial biomass in all treatments, whereas nanoplankton contributed ~5-10% (Figure 5). Neither tM addition nor elevated temperature affected the picoplankton biomass (Supplementary Table 1), and nanoplankton biomass increased with tM addition (Figure 5, Supplementary Table 1), with no significant temperature effect. Microphytoplankton constituted the second largest biomass pool, contributing 10-30%, increasing with the tM addition and showing some indication of decrease at elevated temperature (Figure 5, Supplementary Table 1). These variations in relative contributions of the micro-, nano- and picoplankton biomass resulted in a changed size structure of the microbial food web base. The tM addition facilitated large-sized organisms (microphytoplankton), while small-sized organisms benefitted from the higher temperature (Figure 5, Supplementary Table 1). Moreover, the tM addition had a larger impact on the size structure than the temperature increase.
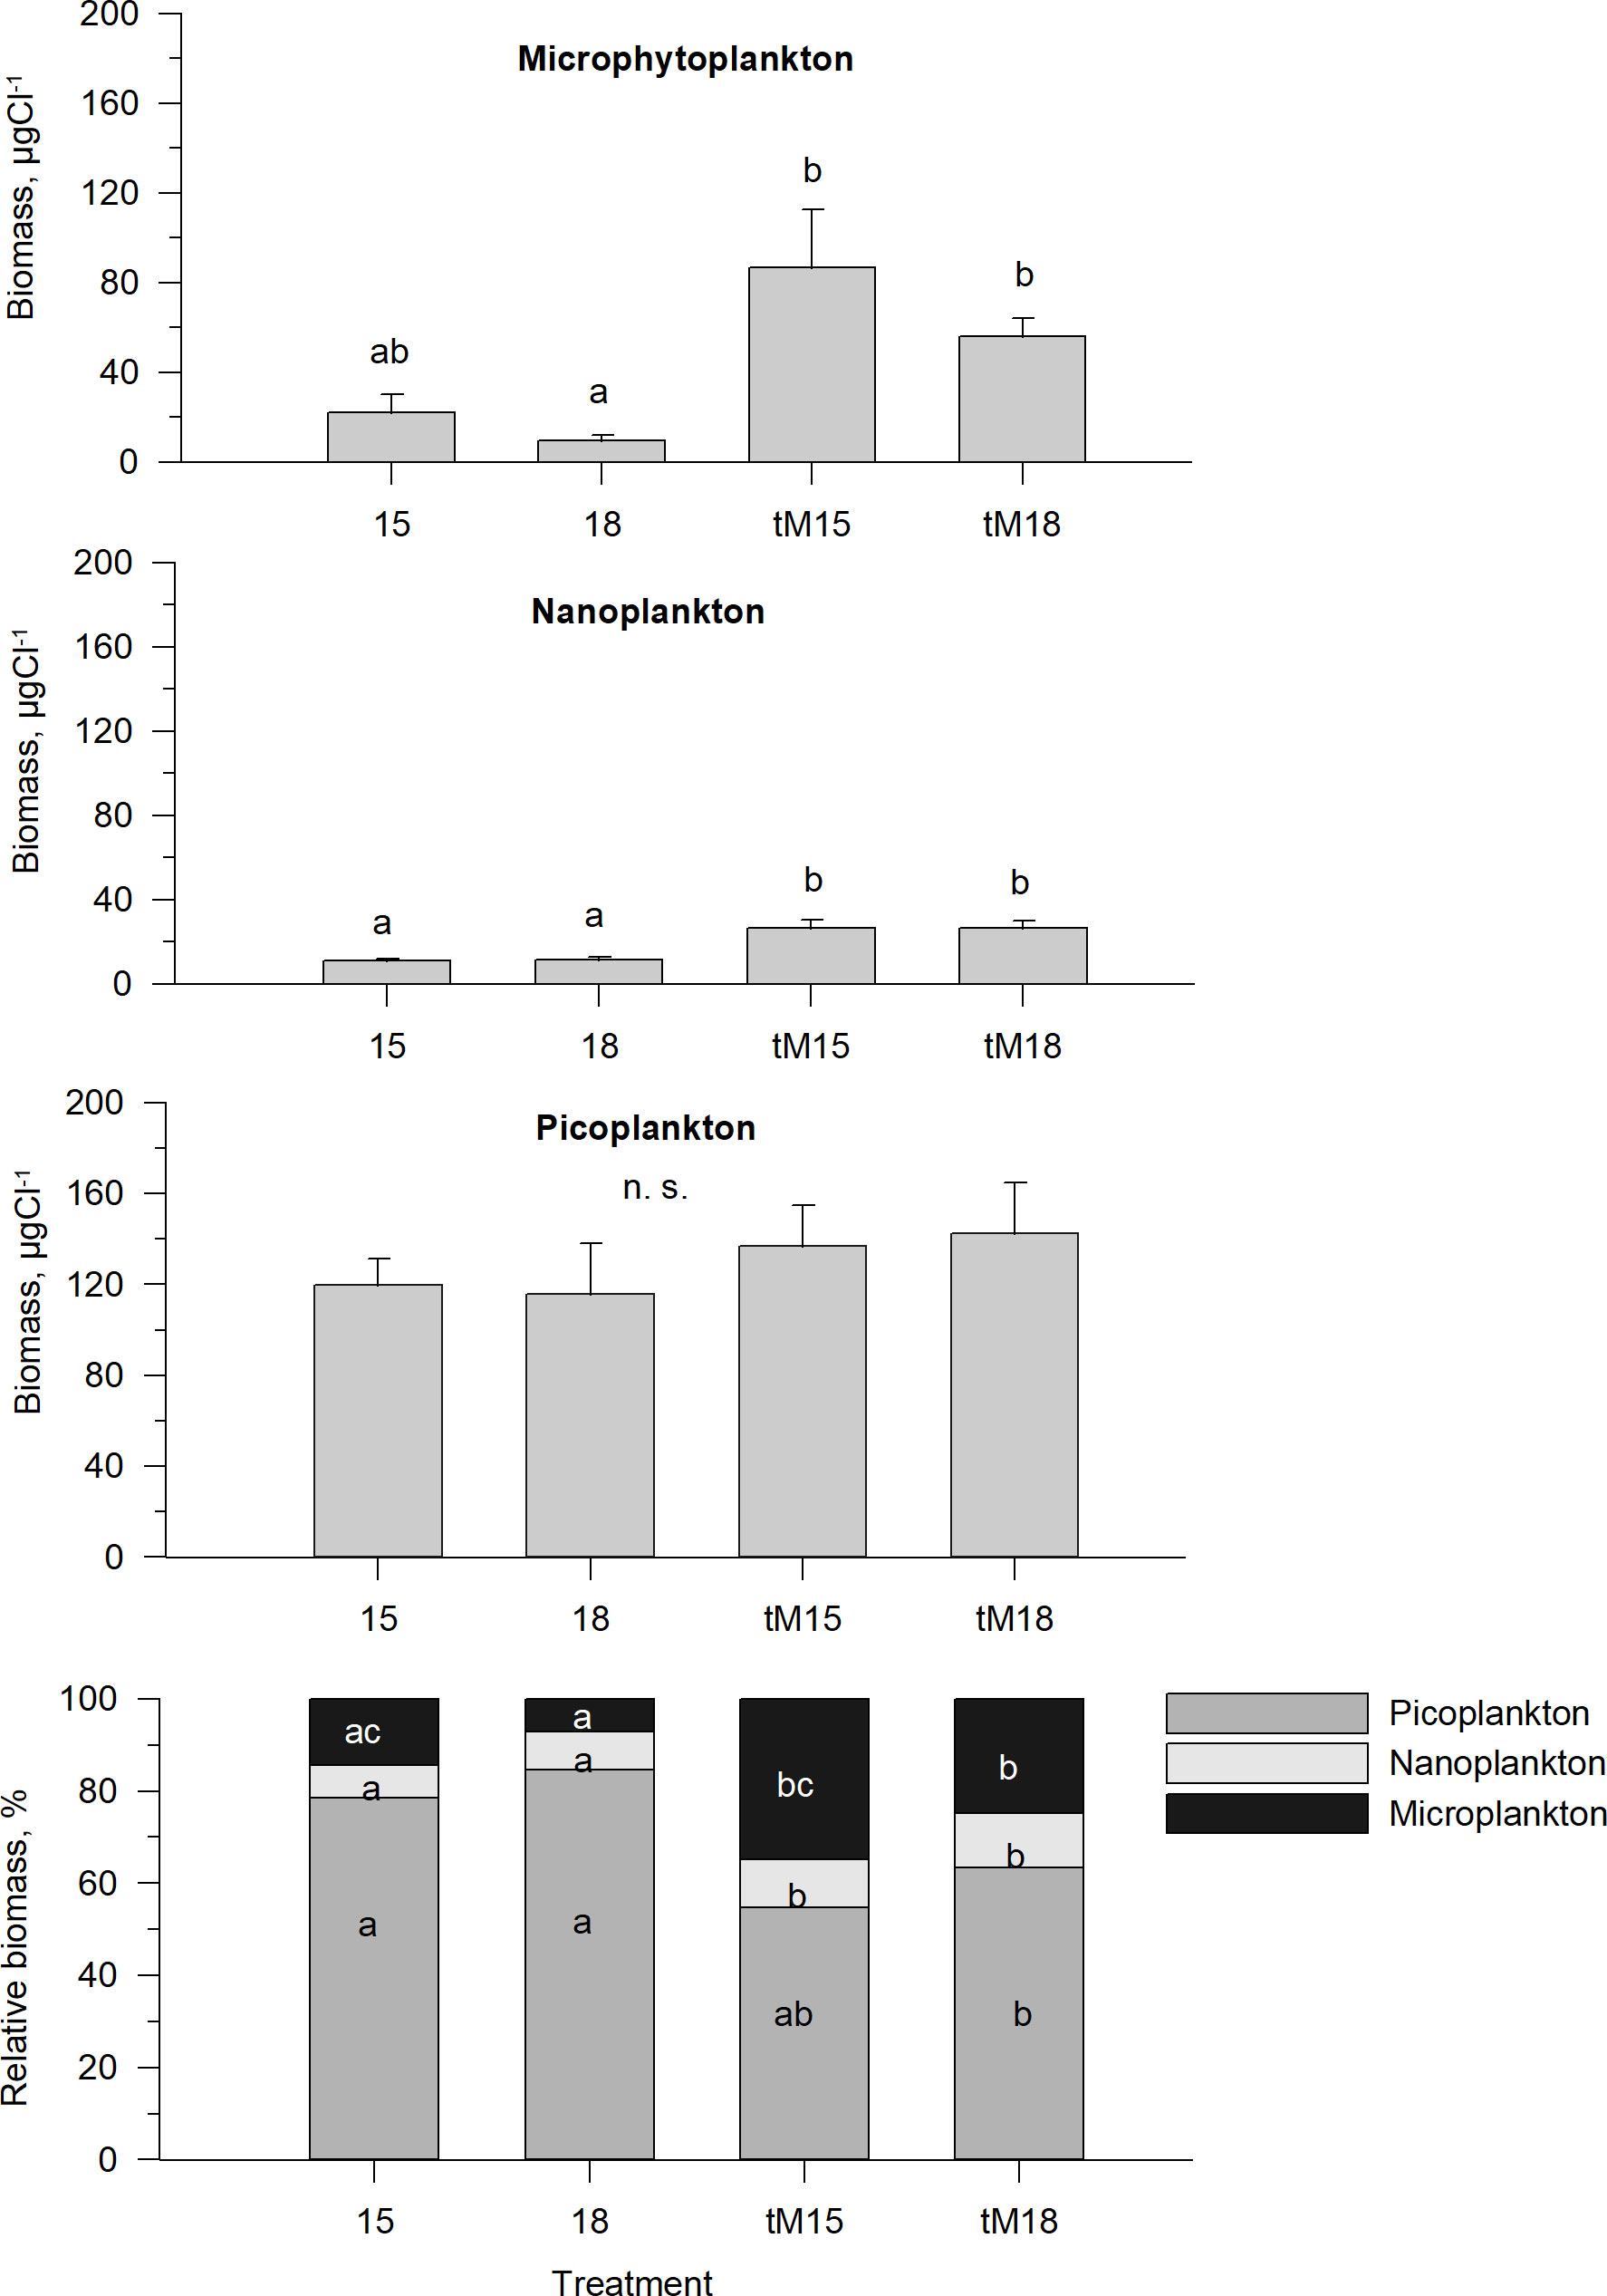
Figure 5 Average biomass and relative biomass of the microbial food web base during the last three weeks of the experiment: microphytoplankton, nanoplankton and picoplankton, including autotrophs, mixotrophs and heterotrophs in different treatments. Error bars denote standard error. Letters indicate the results of the Kruskal-Wallis test and post-hoc means of ranks for all groups test. Treatments with the same letters are not significantly different based on mean ranks comparison test (p>0.05), n.s., not significant.
Size-structure of the ciliate community
Omnivorous ciliates were the only group that responded positively to tM addition, with significant differences found between 15 and tM18 (Figure 6, Supplementary Table 1). Pico-nano filtering ciliates constituted the largest biomass in the ciliate community, but their biomass did not respond significantly to any treatment (Figure 6, Supplementary Table 1). Pico-filterers, nano-filterers and predators constituted somewhat smaller shares of the ciliate community, and with tM addition no significant difference could be identified (Figure 6, Supplementary Table 1).
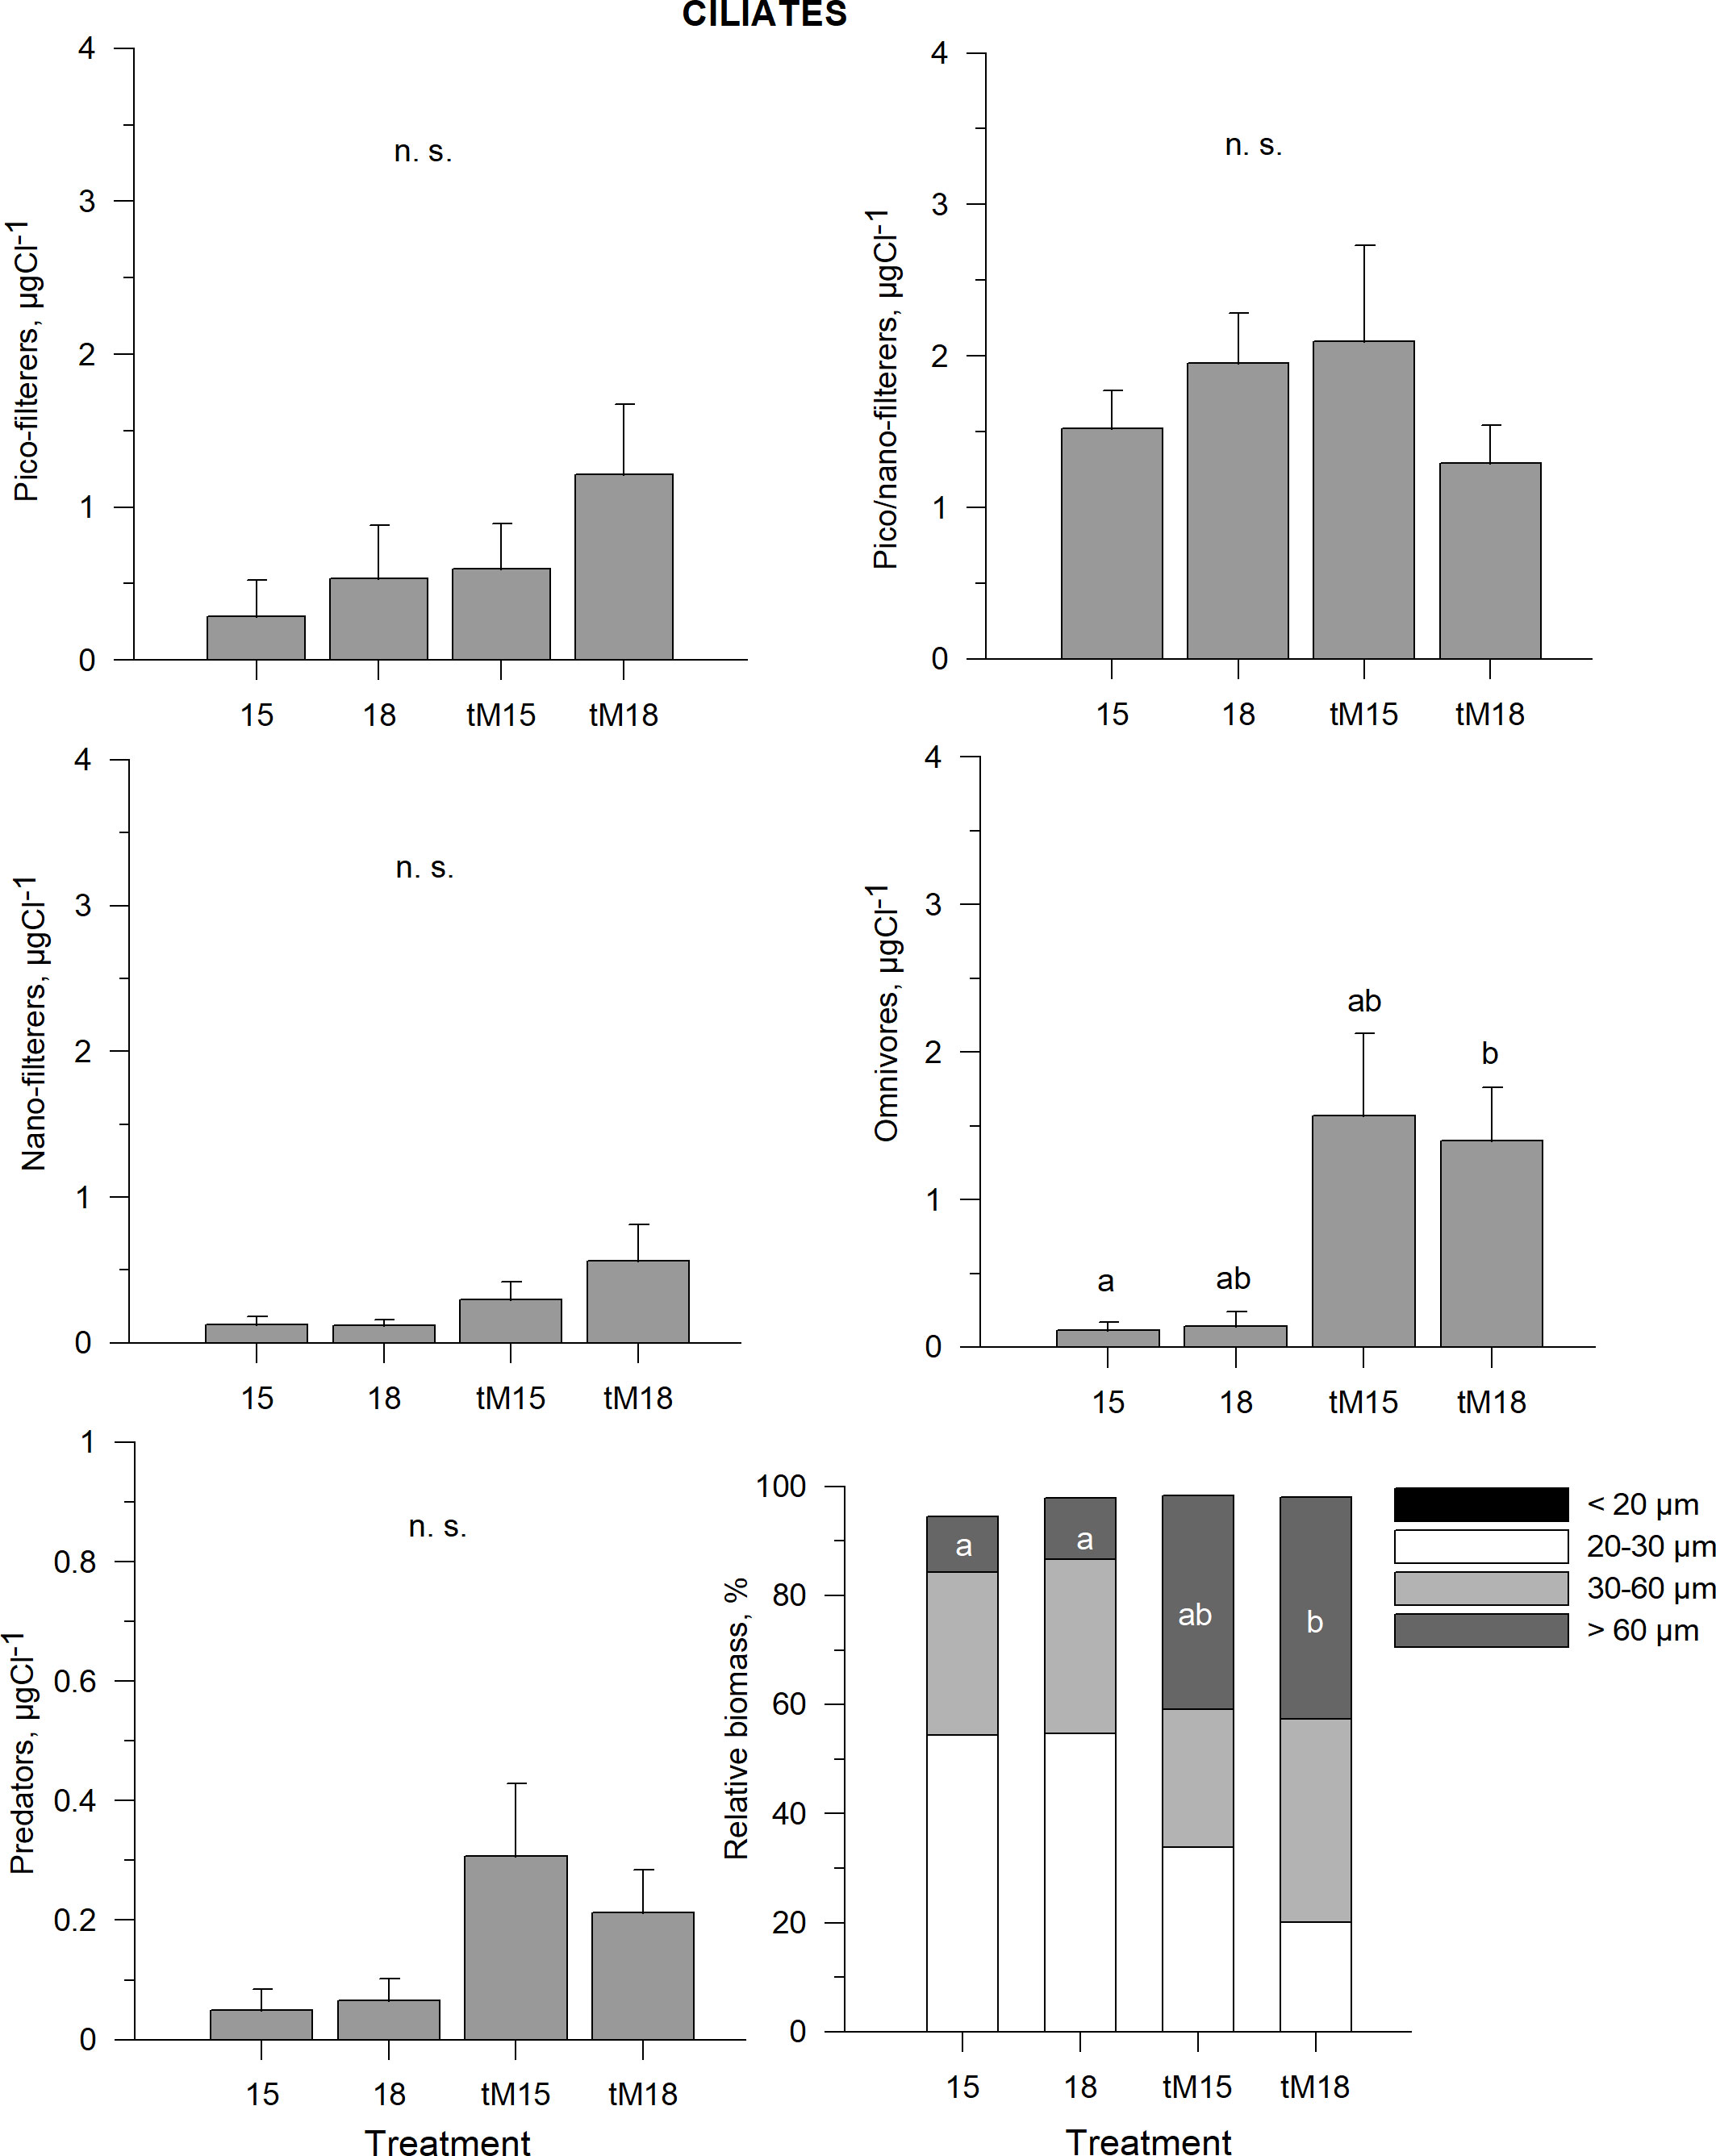
Figure 6 Average biomass of different feeding types of ciliates during the last three weeks of the experiment: picoplankton feeders, pico/nanoplankton feeders, nanoplankton feeders, omnivorous and predators in different treatments. Error bars denote standard error. Letters indicate the results of the Kruskal-Wallis test and post hoc means of ranks for all groups test. Treatments with the same letters are not significantly different based on mean ranks comparison test (p>0.05), n.s., not significant.
The tM addition favored large ciliates (Figure 6, Supplementary Table 1), as indicated by the increased proportion of >60 µm ciliates in the tM18 treatment. No significant temperature effect on the ciliate size structure was found.
Basal production and energy flow in the microbial food web
Phytoplankton primary production and heterotrophic bacterial production constituted the base of the microbial food web. The phytoplankton primary production was relatively similar in the 15°C and 18°C mesocosms during the last weeks of the experiment, but in the tM-enriched mesocosms the primary production rates were approximately twice as high (Figure 7, Supplementary Table 1). A similar pattern was observed for heterotrophic bacterial production (Figure 7, Supplementary Table 1), which was significantly higher in all treatments with tM enrichment. The photosynthetic efficiency in the tM-enriched mesocosms was approximately half that in the non-enriched tanks; however, this difference was not significant (Figure 7, Supplementary Table 1). The lowest heterotrophic bacterial specific growth rates were observed in the non-enriched low-temperature incubations (15°C) and the highest in the tM-enriched mesocosms at 18°C (Figure 7, Supplementary Table 1).
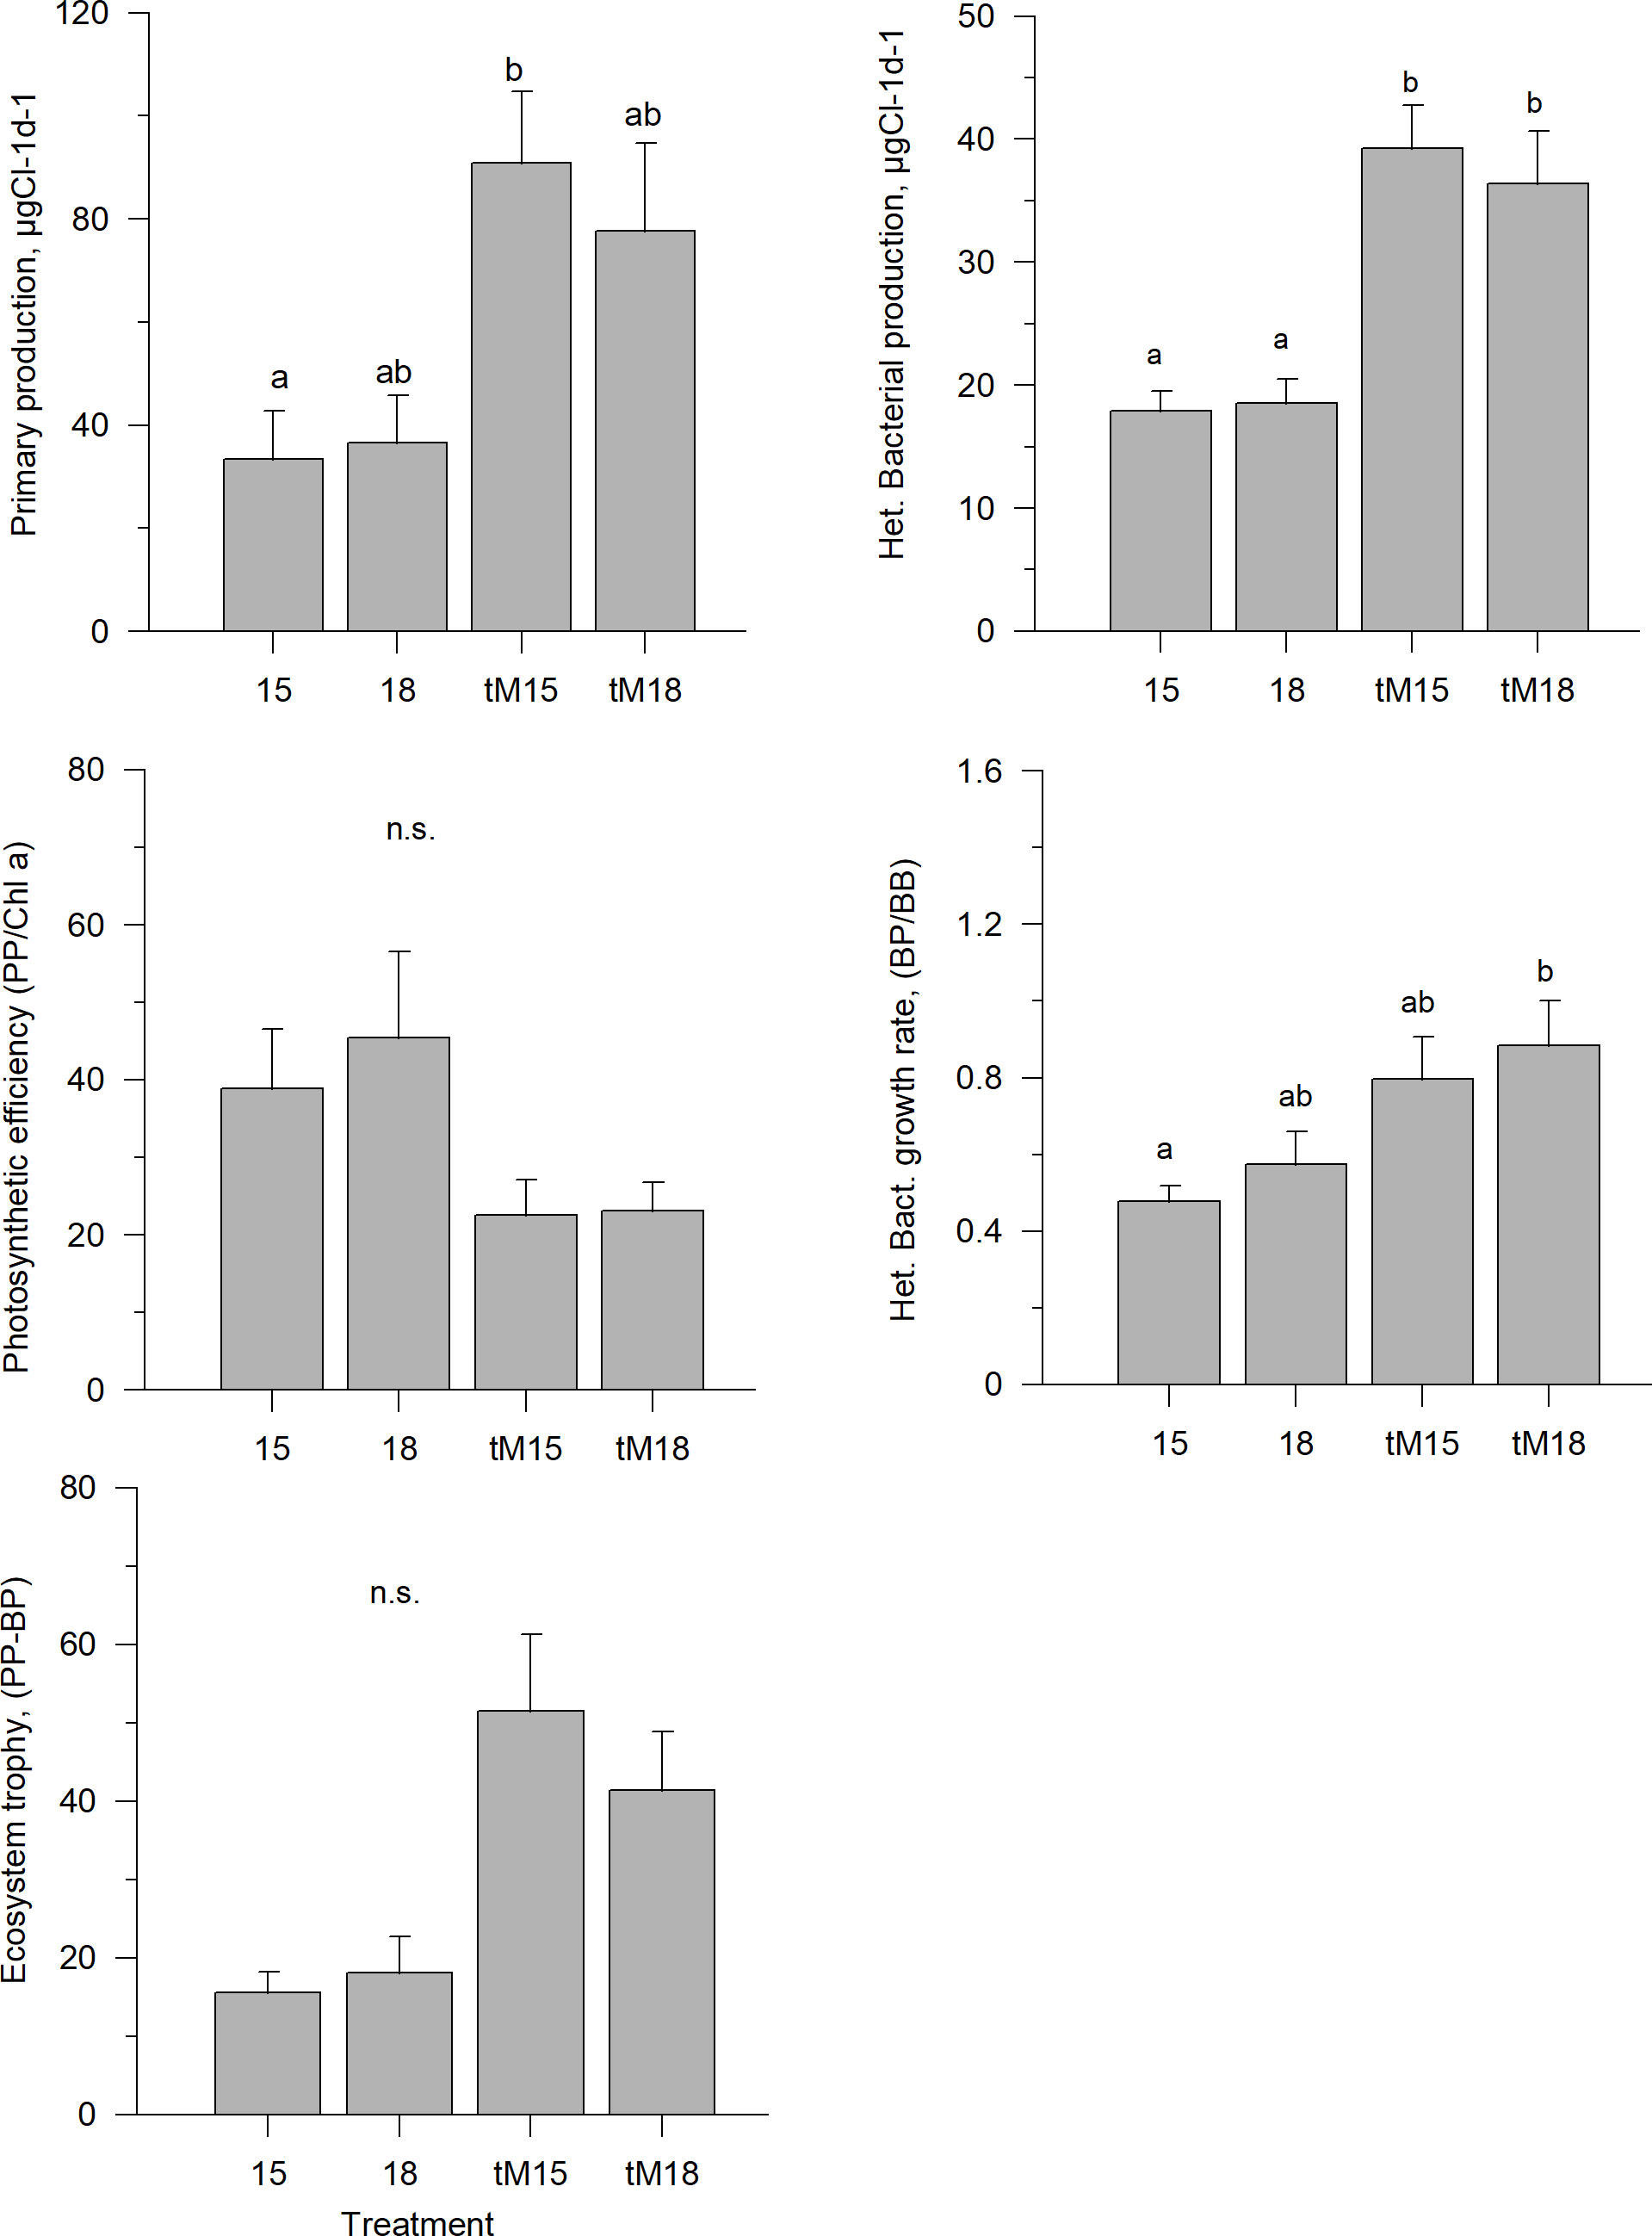
Figure 7 Average phytoplankton and heterotrophic bacterial production rates during the last three weeks of experiment; primary production (PP), bacterial production (BP), photosynthetic efficiency (PP/Chla), bacterial specific growth rate (BP/BB) and ecosystem trophy in different treatments. Error bars denote standard error. Letters indicate the results of the Kruskal-Wallis test and post hoc means of ranks for all groups test. Treatments with the same letters are not significantly different based on mean ranks comparison test (p>0.05), n.s., not significant.
In the grazing experiment, grazers consisted of phagotropic nanoflagellates (heterotrophs and mixotrophs) and phagotrophic ciliates (heterotrophs and mixotrophs). In the non-enriched mesocosms, the experimental start biomass of phagotrophic nanoflagellates was twice as high as that of phagotrophic ciliates (Supplementary Table 2). In the tM enriched mesocosms, the initial biomass of phagotrophic nanoflagellates and phagotrophic ciliates was similar (Supplementary Table 2). The total grazer biomass was 2.5 times higher in the tM enriched samples (Supplementary Table 2). The grazing experiments indicated that both heterotrophic and autotrophic picoplankton were strongly grazed by microzooplankton in most of the mesocosms independent of temperature and tM addition (Table 2), with as much as 60-100% of their potential production consumed daily. By contrast, microzooplankton grazing on nano- and microphytoplankton was not detectable (Table 2).
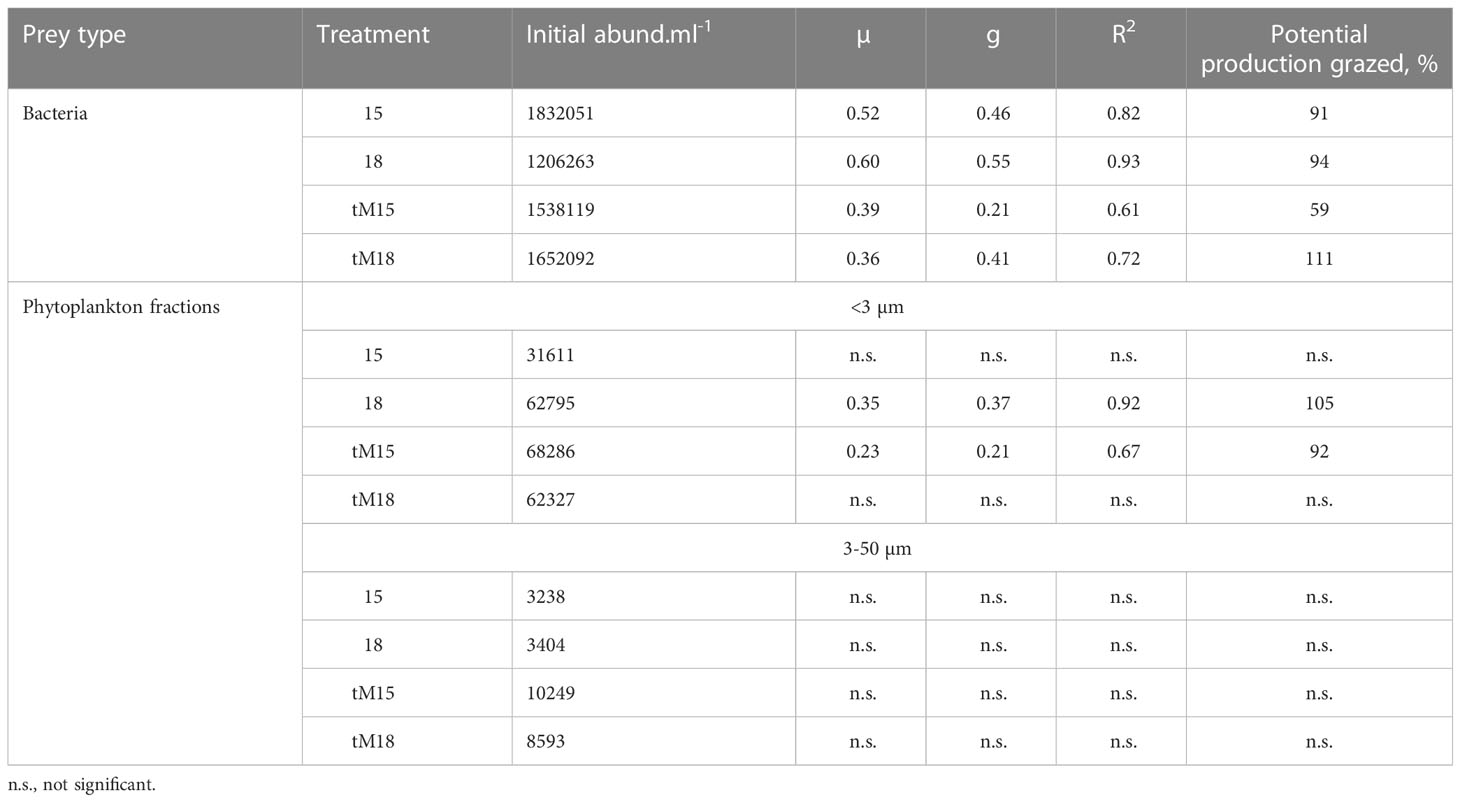
Table 2 Initial abundances of bacteria and phytoplankton size fraction <3 µm and 3-50 µm, growth rates of bacteria and phytoplankton (µ, day-1), grazing rates (g, day-1) and potential production grazed per day (%) in different treatments.
Ecosystem trophy
Average values indicated that all mesocosms were net-autotrophic, i.e., the difference between primary production (PP) and heterotrophic bacterial production (BP) estimates was positive (Figure 7). However, no statistically significant differences between the treatments were found due to the large within-treatment variations (Figure 7, Supplementary Table 1). In the tM-enriched systems, the average PP-BP value was 3-fold higher than in the non-enriched mesocosms, indicating that tM drove the system towards increased net-autotrophy. No indication of temperature effects on the ecosystem trophy was found (Figure 7).
Discussion
The experiment started during the spring bloom, but after a few weeks of incubation the plankton communities and production rates were similar to that of a natural summer community in the study area (e.g. Andersson et al., 2018). The plankton composition and production varied in different treatment, implying that the results would mimic environmental changes during the summer period. We found that the addition of terrestrial organic matter induced significant changes in the production and structure of the microbial food web, including its base (phytoplankton and heterotrophic bacteria) and consumers (ciliates), while elevated temperature only had a slight restructuring effect on the different food web components.
Although the treatments induced changes in mesozooplankton structure, the mesozooplankton community was unlikely to exert substantial predation on the microbial food web because it was heavily predated upon by the fish present in the system. During the experiment, the mesozooplankton biomass decreased from 4 to 2 µg C l-1, corresponding to the lower range of the biomass observed in the Baltic Sea (e.g. Dahlgren et al., 2010). The mesozooplankton to ciliate ratio was low (0.25). We, therefore, assume that mesozooplankton grazing on the microbial food was relatively low and that we can interpret the treatment effects on the microbial food web structure and function as bottom-up effects.
Terrestrial matter promoted both autotrophs and heterotrophs at the food web base
Both primary production and heterotrophic bacterial production were elevated in the tM treatments. The high inorganic nutrient concentrations due to the tM addition have likely promoted phytoplankton growth. In fact, the DIN and DIP concentrations were 1-4 fold higher in the tM-enriched systems. Even though the brown color of the tM caused decreased photosynthetically active radiation (PAR) by 35%, from ~250 to 150 µmol photon m-2 s-1 (midday), these values indicate that light would be sufficient for light-saturated photosynthesis (Andersson et al., 1994). The mesocosm light conditions were similar to that in surface water in the study area during summer (Andersson et al., 2018). Nevertheless, the lower light levels require higher cell pigment content leading to decreased photosynthetic efficiency in the tM-enriched mesocosms.
Promotion of heterotrophic bacterial growth and production by terrestrial matter agrees with the earlier field and experimental studies. Two field studies in the northern Baltic Sea coast showed peaks of bacterial production during the spring river flush and positive correlations between heterotrophic bacterial production and DOC, humic substances and colored dissolved organic matter (CDOM) (Figueroa et al., 2016; Andersson et al., 2018). Other mesocosm experiments have also shown that terrestrial matter enrichment induces elevated heterotrophic bacterial production in coastal waters of the northern Baltic Sea (e.g. Lefébure et al., 2013). Thus, the heterotrophic bacterial growth response can be explained by terrestrial matter being available as a substrate for bacteria, even though a large proportion is refractory (Zhao et al., 2022).
Terrestrial matter shifted the microbial food web towards larger cell size
The addition of terrestrial matter shifted the organism size distribution of the food web base (autotrophic and heterotrophic picoplankton, nanoflagellates and microphytoplankton) towards a larger size. The promotion of large-sized plankton at the food web base was likely caused by the 2-4 fold increase in the nutrient concentrations following the tM addition, implying that the tM-enriched mesocosms had a higher carrying capacity for the standing stocks. Although small osmotrophic cells, with their large surface-to-volume ratios, are more competitive in nutrient uptake at low nutrient concentrations, large cells have an advantage when nutrients are abundant (Samuelsson et al., 2002).
Since the aquatic food web is size-structured (Fenchel, 1987), we could expect that the highest trophic level of the microbial food web, e.g. ciliates, would also show increased cell size. This was indeed observed (Figure 6), and the total biomass and contribution of ciliates >60 µm were higher in the tM-enriched mesocosms. The dominant >60 µm taxa, Stylonichia sp, is an omnivorous ciliate, which is known to feed on a large size range of organisms (Pfister and Arndt, 1998). The results agree with earlier modeling and experimental studies showing that an increase in carrying capacity facilitates the propagation of omnivorous ciliates in microbial systems (Diehl and Feissel, 2000).
Rotifers that responded positively to the terrestrial matter addition, albeit only at the higher temperature (Figure 4), could likely exert a strong predation pressure on the small-sized ciliates, thus exacerbating the shift towards larger ciliates in the community. The rotifer species in the mesocosms, Keratella quadrata and Synchaeta spp., prey preferably on small ciliates and can affect their abundances (Gilbert and Jack, 1993). Therefore, both bottom-up and top-down control mechanisms were most probably contributing to the observed size pattern of the consumers in the microbial food web.
Taken together, terrestrial matter addition promoted larger cell size at the base of the food web. The higher overall production by heterotrophic bacteria and phytoplankton in tM mesocosms caused increased biomass of nano- and microphytoplankton, resulting in an increased fraction of autotrophic microphytoplankton (>20 µm) driven by the high nutrient concentrations. All these changes at the base cascaded to the highest trophic level of the microbial food web composed of larger size ciliates. Moreover, at the higher temperature, the food base and ciliate community changes passed on mesozooplankton and promoted rotifers, which could exacerbate the shift to the large ciliates by selective feeding on small ciliates.
Elevated temperature increased heterotrophic bacterial growth rate and induced smaller size at the food web base
As expected, the elevated temperature increased heterotrophic bacterial growth in both the tM and the non-enriched mesocosms. These results comply with earlier studies showing that increased temperature causes increased bacterial growth rate when nutrients and other resources are available (e.g. Degerman et al., 2013). Apparently, sufficient resources were available in our experiment to support bacterial growth even though inorganic nutrients, especially dissolved inorganic phosphorus (DIP), decreased to very low values (close to the detection limit) in the non-enriched incubations. A fast turn-over with re-mineralized nutrients immediately taken up by bacteria after their release by protozoa, mesozooplankton and fish would result in very low inorganic nutrient values. Since a complete food web was present in all mesocosms, from microbes to fish, re-mineralization of nitrogen and phosphorus and release of DOC by heterotrophic organisms would have continuously renewed and recycled these nutrients (Andersson et al., 1985; Legendre and Rassoulzadegan, 1995). Nevertheless, a nutrient limitation was likely in the non-enriched high-temperature incubations (18°C) compared to the control (15°C). However, no net effect of temperature on total heterotrophic bacterial production was observed, which may have been due to predation control from microzooplankton (phagotrophic nanoflagellates and ciliates).
Increased temperature led the food web base to shift towards smaller cell size, primarily due to the decreased microphytoplankton, while the nano- and picoplankton remained stable. This pattern was observed in both the tM-enriched and non-enriched mesocosms. These results comply with earlier studies reporting that increased temperature promoted smaller-size plankton (e.g., Suikkanen et al., 2013; Mousing et al., 2014). Changed size structure can be caused by faster consumption of nutrients, increased metabolism at the higher temperature, or a combination of both factors. Nutrient measurements showed that DIN and DIP concentrations were reduced during the first week of incubation in all mesocosms. However, later in the experiment, the DIN and DIP concentrations in the tM-enriched mesocosms were twice as high as in the non-enriched irrespective of temperature. As a reduction of the microphytoplankton fraction in both the non-enriched and the tM-enriched mesocosms was found at elevated temperatures, one can speculate that the smaller-celled organisms benefitted due to a faster metabolism combined with the fast nutrient uptake by nano- and picoplankton than by microphytoplankton.
Elevated temperature alone did not cause any major change in either the food base (heterotrophic bacteria, HNF, and total phytoplankton) or the ciliate community during the latter part of the experiment. Pico/nano filtering ciliates dominated the non-enriched mesocosms, with frequently occurring Strombidium, Strobilidium and Lohmaniella, which are common in the study area, the northern Baltic Sea (Samuelsson et al., 2002; Samuelsson and Andersson, 2003). Our results agree with those of Aberle et al. (2007), who observed that the ciliate abundance temporarily increased under elevated temperature due to increased phytoplankton growth in a spring bloom mesocosm experiment (Kiel Bight southern Baltic Sea). However, the growth pulse was shortened by increased temperature. In both studies, the ciliate community was dominated by Strobilidium and Lohmaniella, and a short, one-week growth pulse was observed due to elevated temperature. Taken together, the plankton succession likely speeds up at elevated temperature, which would be a significant ecological consequence of climate change in coastal waters.
Major energy flow from picoplankton to nanoflagellates and ciliates
The major energy flow from heterotrophic and autotrophic picoplankton to nano- and microzooplankton was apparent in all treatments (Table 2, Figure 8).
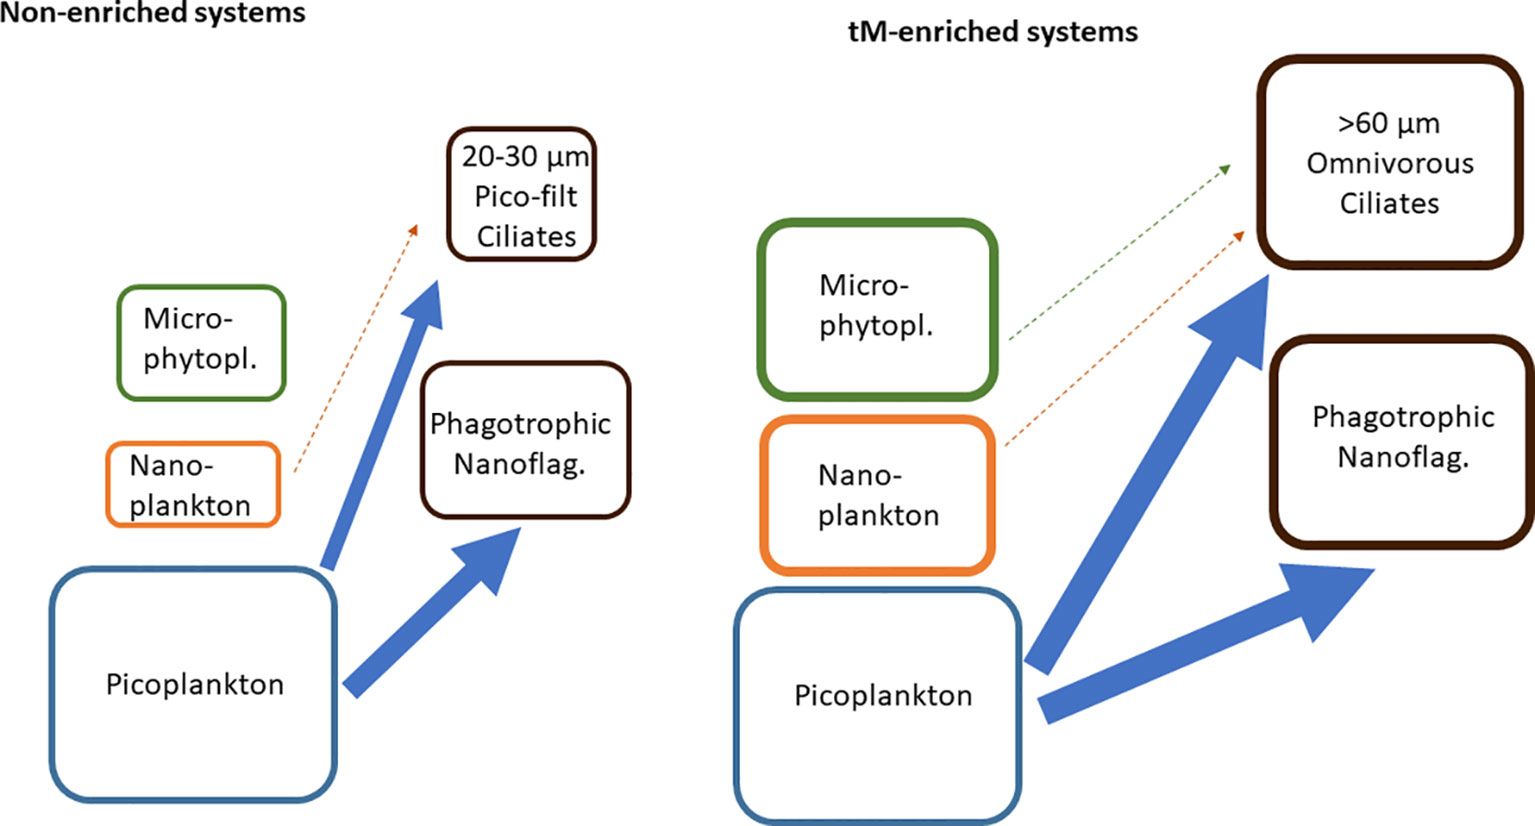
Figure 8 Simplified view of the energy flows in the non-enriched and tM enriched mesocosms. Potential food sources: picoplankton (heterotrophic bacteria, cyanobacteria and autotrophic eukaryotes), nanoplankton (heterotrophic, autotrophic and mixotrophic organisms), microphytoplankton (autotrophic organisms). Grazers phagotrophic nanoflagellates (heterotrophic and mixotrophic flagellates), ciliates (20-30 µm filtering ciliates and >60 µm omnivorous ciliates). Arrows indicate energy flows.
In the non-enriched mesocosms, the grazers of the microbial food-web were dominated by heterotrophic and mixotrophic nanoflagellates (71% of the grazers carbon biomass), feeding on bacteria (Andersson et al., 1985; Andersson et al., 1986; Andersson et al., 1989), and <30 µm ciliates (29% of the grazers carbon biomass), which are known to feed on pico-nanoplankton (Foissner and Berger, 1996, Agatha and Riedel-Lorjé, 1997, Gaedke and Wickham, 2004). These findings are in agreement with Rassoulzadegan et al. (1988), who reported that ciliates <30 µm mainly feed on picoplankton (70%) and to a lesser extent on nanoplankton (30%). As we did not detect any significant grazing on 3-50 µm phytoplankton, we assume that ciliate feeding on nanoplankton was minor. We presume that there was a larger energy flow from picoplankton to nanoflagellates than from picoplankton to ciliates in the non-enriched mesocosms, as the microbial food-web grazers were dominated by nanoflagellates (Figure 8).
In the tM-enriched mesocosms, the microbial food-web grazers were dominated by heterotrophic and mixotrophic nanoflagellates (51% of the grazers carbon biomass) feeding on bacteria, and ciliates >30 µm (49% of the grazers carbon biomass), known to feed on various organisms, from pico- to microplankton (Rassoulzadegan et al., 1988; Foissner and Berger, 1996; Gaedke and Wickham, 2004). Common genera within this size group were Tintinnopsis and Holophrya, and Stylonychia, a relatively large (100 µm) ciliate feeding on pico-, nano- and microplankton (Pfister and Arndt, 1998). Although the grazing experiment did not detect any significant ciliate feeding on nano- and microphytoplankton by these ciliates, we assume that such pathways exist (Figure 8). The grazing experiment might have a greater capacity to detect grazing on more abundant small organisms (picoplankton) than on relatively rare larger organisms (nano- and microplankton). Another concern regarding the grazing experiment design is the excess of nutrients added to the microcosms to exclude the possibility of nutrient limitation. As these nutrients can introduce nonlinearity in the phytoplankton growth, the results should be interpreted with caution. We presume that the energy flow from picoplankton was similarly supplied to nanoflagellates and ciliates in the tM-treated mesocosms, as the microbial food-web grazer biomass was equally distributed between nanoflagellates and ciliates (Figure 8).
In tM-enriched mesocosms, the nano- and microphytoplankton biomass increased, while the picoplankton did not. Concurrently, the heterotrophic bacterial production and growth rate increased in the tM-enriched mesocosms, which, together with the grazing experiment results, suggests a fast turnover of the heterotrophic bacterial biomass (24 hours, Table 2). We did not measure the picophytoplankton production; however, the picophytoplankton peaked in the middle of the experiment in the tM-enriched mesocosms, indicating that autotrophic picoplankton also had a fast turnover due to its rapid growth and grazing.
Taken together, we found picoplankton to be a key group in the energy flows of the microbial food webs, irrespective of treatment, thus supporting the findings of Paczkowska et al. (2020). However, this pathway has been overlooked in many previous studies that did not analyze autotrophic eukaryotic picoplankton (e.g., Andersson et al., 1996). One reason for that could be technical challenges, because the Utermöhl technique does not allow detection of picoplankton, and epifluorescence microscopy has practical limitations for detecting this group of organisms. Using flow cytometry gives cost-efficient, accurate measures of picophytoplankton (Sosik et al., 2010), and should be considered when designing field- and experimental studies of microbial food webs.
Terrestrial organic matter affected ecosystem trophy
Average values indicate that all mesocosms were net-autotrophic, further strengthened by terrestrial matter enrichment. Although the addition of terrestrial matter promoted both heterotrophic bacterial production and primary production, primary production increased more than bacterial production. However, these results are only indicative due to the high variability between the mesocosms. This finding contrasts previous studies on coastal waters showing that terrestrial matter hampers primary production while increasing heterotrophic bacterial production (Andersson et al., 2013; Figueroa et al., 2016; Andersson et al., 2018; Paczkowska et al., 2020), leading to ecosystem net-heterotrophy. Nevertheless, in ecosystems undergoing critical transitions, a high variability often proceeds the functional change (Dakos et al., 2012). Ecosystem trophy is an important functional trait, and our study indicates that shallow coastal areas can shift between net-heterotrophy and net-autotrophy. In shallow lakes, terrestrial matter inflows can positively affect primary production because these inflows also bring nutrients. Moreover, light has been pointed out as a critical factor of the adverse effects of terrestrial matter on primary production (Seekell et al., 2015). Yet, in shallow lakes where light can reach pelagic and benthic primary producers, terrestrial matter inflows can support their growth. Therefore, it is plausible that terrestrial matter can promote primary production in shallow coastal environments where light is not limiting.
Conclusions
If climate change follows current projections (Meier et al., 2022), heterotrophic bacterial production and phytoplankton production will likely increase in shallow coastal areas in the northern Baltic Sea. The combined effects of elevated temperature and increased inflows of terrestrial matter in coastal microbial food webs would mainly be driven by the increased terrestrial matter inflow, while increased temperature may only induce a slight increase of the bacterial growth rates and a minor size-spectrum change of the food web base. Even though phytoplankton photosynthetic efficiency may decrease due to water darkening, the overall increase in nutrient availability will promote phytoplankton production, and higher temperature will likely speed up the succession. The size structure of the microbial food web base would change towards large-sized microphytoplankton, although picoplankton will still constitute the major biomass pool during the summer season. The restructuring of the food web base may favor relatively large omnivorous ciliates, which feed on different size groups of plankton, pico-, nano-, and microphytoplankton, and microphagous mesozooplankton, such as rotifers. Our study also indicates that terrestrial matter inputs in the nearshore shallow coastal zone might lead to a flipping between net-autotrophy and net-heterotrophy. In conclusion, this study demonstrates that the microbial food web compartments adjust due to increased inputs of terrestrial matter and elevated temperature. In climate altered northern coastal systems the major energy path will likely flow from picoplankton to large-sized ciliates during the summer period.
Data availability statement
The original contributions presented in the study are included in the article/Supplementary Materials. Further inquiries can be directed to the corresponding author.
Ethics statement
The experimental procedures comply with the current laws of Sweden and were approved by the Regional Ethics Committee of the Swedish National Board for Laboratory Animals in Umeå (CFN, license no. A24-11).
Author contributions
AA and MT conceived the study; ÅB, CG, MR, DF, AA and MT further developed the initial design and prepared for practical implementation; ÅB, CG, MR, DF and EGr carried out the mesocosm study; SB analyzed picoplankton and EGo analyzed mesozooplankton; EGr carried out the grazing experiment and performed the statistical analyzes; AA and EGr drafted the initial version of the manuscript; all authors reviewed and improved the manuscript to its final version.
Funding
The project was funded by the Swedish Institute (SI reference number 00140/2014), the Swedish research council FORMAS (FR-2019/0007) and the Swedish strategic marine research program EcoChange.
Acknowledgments
We thank the staff at Umeå Marine Sciences Center for excellent support during the mesocosm study and Jonas Forsberg for analysis of nano- and microplankton. Special thanks Dr. Ekaterina I. Mironova (Institute of Cytology, Russian Academy of Sciences, St. Petersburg) for consultancy on identification of ciliates.
Conflict of interest
The authors declare that the research was conducted in the absence of any commercial or financial relationships that could be construed as a potential conflict of interest.
Publisher’s note
All claims expressed in this article are solely those of the authors and do not necessarily represent those of their affiliated organizations, or those of the publisher, the editors and the reviewers. Any product that may be evaluated in this article, or claim that may be made by its manufacturer, is not guaranteed or endorsed by the publisher.
Supplementary material
The Supplementary Material for this article can be found online at: https://www.frontiersin.org/articles/10.3389/fmars.2023.1170054/full#supplementary-material
References
Aberle N., Lengfellner K., Sommer U. (2007). Spring bloom succession, grazing impact and herbivore selectivity of ciliate communities in response to winter warming. Oecologica 150, 668–681. doi: 10.1007/s00442-006-0540-y
Agatha S., Riedel-Lorjé J. (1997). Morphology, infraciliature, and ecology of halteriids and strombidiids (Ciliophora, oligotrichea) from coastal brackish water basins. Archiv für Protistenkunde 148, 445–459. doi: 10.1016/S0003-9365(97)80021-8
Andersson A., Falk S., Samuelsson G., Hagström Å. (1989). Nutritional characteristics of a mixotrophic nanoflagellate, ochromonas sp. Microb. Ecol. 17, 251–262 . doi: 10.1007/BF02012838
Andersson A., Haecky P., Hagström Å. (1994). Effect of temperature and light on the growth of micro- nano- and pico-plankton: impact on algal succession. Mar. Biol. 120, 511–520. doi: 10.1007/BF00350071
Andersson A., Hajdu S., Haecky P., Kuparinen J., Wikner J. (1996). Succession and growth limitation of phytoplankton in the gulf of bothnia. Mar. Biol. 126, 791–801. doi: 10.1007/BF00351346
Andersson A., Jurgensone I., Rowe O. F., Simonelli P., Bignert A., Lundberg E., et al. (2013). Can humic water discharge counteract eutrophication in coastal waters? PloS One 8, 4. doi: 10.1371/journal.pone.00061293
Andersson A., Larsson U., Hagström Å. (1986). Size-selective grazing by a microflagellate on pelagic bacteria. Mar. Ecol. Prog. Ser. 33, 51–57. doi: 10.3354/meps033051
Andersson A., Lee C., Azam F., Hagström Å. (1985). Release of amino acids and inorganic nutrients by heterotrophic marine microflagellates. Mar. Ecol. Prog. Ser. 23, 99–106. doi: 10.3354/meps023099
Andersson A., Meier H. E. M., Ripszam M., Rowe O., Wikner J., Haglund P., et al. (2015). Projected future climate change and Baltic Sea ecosystem management. Ambio 44 (Supplementary 3), 345–356. doi: 10.1007/s13280-015-0654-8
Andersson A., Paczkowska J., Brugel S., Figueroa D., Rowe O., Kratzer S., et al. (2018). Influence of allochthonous dissolved organic matter on pelagic basal production in a northerly estuary. Estuar. Coast. Shelf Sci. 204, 225–235. doi: 10.1016/j.ecss.2018.02.032
Ayo B., Santamaria E., Latatu A., Artolozaga I., Azua I., Iriberri J. (2001). Grazing rates of diverse morphotypes of bacterivorous ciliates feeding on four allochthonous bacteria. Lett. Appl. Microbiol. 33, 455–460. doi: 10.1046/j.1472-765X.2001.01034.x
Azam F., Fenchel T., Field J. G., Gray J. S., Meyer-Reil L. A., Thingstad F. (1983). The ecological role of water-column microbes in the sea. Mar. Ecol. Prog. Ser. 10, 257–263. doi: 10.3354/meps010257
Dahlgren K., Andersson A., Larsson U., Hajdu S., Båmstedt U. (2010). Planktonic production and carbon transfer efficiency along a north-south gradient in the Baltic Sea. Mar. Ecol. Prog. Ser. 409, 77–94. doi: 10.3354/meps08615
Dakos V., Carpenter S. C., Brock W. A., Ellison A. M., Guttal V., Ives A. R., et al. (2012). Methods for detecting early warnings of critical transitions in time series illustrated using simulated ecological data. Plosone 7, e41010. doi: 10.1371/journal.pone.0041010
Degerman R., Dinasquet J., De Luna Sjöstedt S., Riemann L., Andersson A. (2013). Effect of resource availability on bacterial community responses to increased temperature. Aquat. Microbial Ecol. 68, 131–142. doi: 10.3354/ame01609
Diehl S., Feissel M. (2000). Effects of enrichment on three-level food chains with omnivory. Am. Nat. 155, 200–218. doi: 10.1086/303319
Fenchel T. (1987). Ecology of protozoa: the biology of free-living phagotrophic protists (US: Science Tech Publishers), 197.
Figueroa D., Rowe O. F., Paczkowska J., Legrand C., Andersson A. (2016). Allochthonous carbon–a major driver of bacterioplankton production in the subarctic northern Baltic Sea. Microbial Ecol. 71, 789–801. doi: 10.1007/s00248-015-0714-4
Foissner W., Berger H. (1996). A user-friendly guide to the ciliates (Protozoa, ciliophora) commonly used by hydrobiologists as bioindicators in rivers, lakes, and waste waters, with notes on their ecology. Freshw. Biol. 35, 375–482. doi: 10.1111/j.1365-2427.1996.tb01775.x
Fuhrman J., Azam F. (1982). Thymidine incorporation as a measure of heterotrophic bacterioplankton production in marine surface waters: evaluation and field results. Mar. Biol. 66, 109–120. doi: 10.1007/BF00397184
Gaedke U., Wickham S. (2004). Ciliate dynamics in response to changing biotic and abiotic conditions in a large, deep lake (Lake constance). Aquat. Microbial Ecol. 34, 247–261. doi: 10.3354/ame034247
Gilbert J. J., Jack J. D. (1993). Rotifers as predators on small ciliates. Hydrobiologia 255, 247–253. doi: 10.1007/BF00025845
Hägg H. E., Humborg C., Morth C. M., Medina M. R., Wulff F. (2010). Scenario analysis on protein consumption and climate change effects on riverine n export to the Baltic Sea. Environ. Sci. Technol. 44, 2379–2385. doi: 10.1021/es902632p
Hällfors G. (2004). Checklist of Baltic Sea phytoplankton species (Nairobi: United Nations Environment Programme).
HELCOM. (2013a). Climate change in the Baltic Sea Area: HELCOM thematic assessment in 2013. . Balt. Sea Environ. No. 137
HELCOM. (2013b). Manual for marine monitoring in the COMBINE programme of HELCOM. Available at: https://helcom.fi/action-areas/monitoring-and-assessment/monitoring-guidelines/combine-manual/
Hernroth L. (1985). Recommendations on methods for marine biological studies in the Baltic Sea: mesozooplankton biomass assessment, Baltic marine biologists (Lysekil: Institute of Marine Research).
Hoppe H.-G., Gocke K., Koppe R., Begler C. (2002). Bacterial growth and primary production along a north-south transect of the Atlantic ocean. Nature 416, 168–171. doi: 10.1038/416168a
James M. R., Hall J. A. (1998). Microzooplankton grazing in different water masses associated with the subtropical convergence round the south island, new Zealand. Deep Sea Res. I 45, 1689–1707. doi: 10.1016/S0967-0637(98)00038-7
Jonsson P. R. (1986). Particle size selection, feeding rates and growth dynamics of marine plankton oligotrichous ciliates (Ciliophora: oligotrichina). Mar. Ecol. Prog. Ser. 33, 265–277. doi: 10.3354/meps033265
Kivi K., Setälä O. (1995). Simultaneous measurement of food particle selection and clearance rates of planktonic oligotrich ciliates (Ciliophora: oligotrichina). Mar. Ecol. Prog. Ser. 119, 125–137. doi: 10.3354/meps119125
Landry M. R., Hassett R. P. (1982). Estimating the grazing impact of marine micro-zooplankton. Mar. Biol. 67, 283–288. doi: 10.1007/BF00397668
Lee S., Fuhrman J. (1987). Relationship between biovolume and biomass of naturally derived bacterioplankton. Appl. Environ. Microbiol. 53, 1298–1303. doi: 10.1128/aem.53.6.1298-1303.1987
Lefébure R., Degerman R., Andersson A., Larsson S., Eriksson L. O., Båmstedt U., et al. (2013). Impacts of elevated terrestrial nutrient loads and temperature on pelagic food-web efficiency and fish production. Global Change Biol. 19, 1358–1372. doi: 10.1111/gcb.12134
Legendre L., Rassoulzadegan F. (1995). Plankton and nutrient dynamics in marine waters. Ophelia. Ophelia 41, 153–172. doi: 10.1080/00785236.1995.10422042
Lignell R., Hoikkala H., Lahtinen T. (2008). Effects of inorganic nutrients, glucose and solar radiation on bacterial growth and exploitation of dissolved organic carbon and nitrogen in the northern Baltic Sea. Aquat. Microbial Ecol. 51, 209–221. doi: 10.3354/ame01202
Maeda M. (1986). An illustrated guide to the species of the families halteriidae and strobilidiidae (Oligotrichida, ciliophora), free swimming protozoa common in the aquatic environment. Bull. Ocean Res. Inst. Univ. Tokyo 2, 1–67.
Maeda M., Carey P. (1985). An illustrated guide to the species of the family strombidiidae (Oligotrichida, ciliophora), free swimming protozoa common in the aquatic environment. Bull. Ocean Res. Inst. Univ. Tokyo 19, 1–68.
Marie D., Simon N., Vaulot D. (2005). “Phytoplankton cell counting by flow cytometry,” in Algal culturing techniques. Ed. Andersen R. A. (San Diego: Academic Press), 253–267. doi: 10.1016/B978-012088426-1/50018-4
Meier H. E. M., Kniebusch M., Dieterich C., Gröger M., Zorita E., Elmgren R., et al. (2022). Climate change in the Baltic Sea region: a summary. Earth System Dynamics 13, 457–593. doi: 10.5194/esd-13-457-2022
Meier H. E. M., Muller-Karulis B., Andersson H. C., Dieterich C., Eilola K., Gustafsson B. G., et al. (2012). Impact of climate change on ecological quality indicators and biogeochemical fluxes in the Baltic Sea: a multi-model ensemble study. Ambio 41, 558–573. doi: 10.1007/s13280-012-0320-3
Menden-Deuer S., Lessard E. J. (2000). Carbon to volume relationships for dinoflagellates, diatoms, and other protist plankton. Limnology Oceanography 45, 569–579. doi: 10.4319/lo.2000.45.3.0569
Mironova E., Telesh I., Skarlato S. (2013). Planktonic ciliates of the Neva estuary (Baltic sea): community structure and spatial distribution. Acta Protozoologica 52, 13–23. doi: 10.4467/16890027AP.13.002.0830
Mousing E. A., Ellegaard M., Richardson K. (2014). Global patterns in phytoplankton community size structure [[/amp]]mdash; evidence for a direct temperature effect. Mar. Ecol. Prog. Ser. 497, 25–38. doi: 10.3354/meps10583
Müren U., Samuelsson K., Berglund J., Andersson A. (2005). Potential effects of elevated seawater temperature on pelagic food webs. Hydrobiologia 545, 153–166. doi: 10.1007/s10750-005-2742-4
Olenina I., Hajdu S., Edler L., Andersson A., Wasmund N., Busch S., et al. (2006). Biovolumes and size-classes of phytoplankton in the Baltic Sea. HELCOM Baltic Sea Environ. Proc. 106, 1–144.
Paczkowska J., Brugel S., Rowe O. F., Lefébure R., Brutemark A., Andersson A. (2020). Response of coastal phytoplankton to high inflows of terrestrial matter. Front. Mar. Sci. 7-2020 doi: 10.3389/fmars.2020.00080
Paczkowska J., Rowe O., Figueroa D., Andersson A. (2019). Drivers of phytoplankton production and community structure in nutrient-poor estuaries receiving terrestrial organic inflow. Mar. Environ. Res. 151, 1-10. doi: 10.1016/j.marenvres.2019.104778
Pfister G., Arndt H. (1998). Food selectivity and feeding behaviour in omnivorous filter-feeding ciliates: a case study for Stylonychia. European Journal for Protistology 34, 446–457. doi: 10.1016/S0932-4739(98)80013-8
Pörtner H.-O., Roberts D. C., Poloczanska E. C., Mintenbeck K., Tignor M., Alegría A., et al. (2022). “Technical summary,” in Climate change 2022: impacts, adaptation and vulnerability. contribution of working group II to the sixth assessment report of the intergovernmental panel on climate change (Cambridge, UK and New York, NY, USA: Cambridge University Press), 37–118. doi: 10.1017/9781009325844.002
Rassoulzadegan F. E., Laval-Peuto M., Sheldon R. W. (1988). Partitioning of the food ration of marine ciliates between pico- and nanoplankton. Hydrobiologia 159, 75–88. doi: 10.1007/BF00007369
Ripszam M., Gallampois C., Berglund Å., Larsson H., Andersson A., Tysklind M. (2015). Effects of predicted climatic changes on fates of organic contaminants in brackish water mesocosms. Sci. Total Environ. 517, 10–21. doi: 10.1016/j.scitotenv.2015.02.051
Rose J. M., Feng Y., Gobler C. J., Gutierrez R., Hare C. E., Leblanc K., et al. (2009). Effects of increased pCO2 and temperature on the north Atlantic spring bloom. II. microzooplankton abundance and grazing. Mar. Ecol. Prog. Ser. 388, 27–40. doi: 10.3354/meps08134
Samuelsson K., Andersson A. (2003). Predation limitation in the pelagic microbial food web in an oligotrophic aquatic system. Aquat. Microbial Ecol. 30, 239–250. doi: 10.3354/ame030239
Samuelsson K., Haecky P., Berglund J., Andersson A. (2002). Structural changes in an aquatic microbial food web caused by inorganic nutrient addition. Aquat. Microbial Ecol. 29, 29–38. doi: 10.3354/ame029029
Seekell D. A., Lapierre J. F., Ask J., Bergstrom A. K., Deininger A., Rodriguez P., et al. (2015). The influence of dissolved organic carbon on primary production in northern lakes. Limnology Oceanography 60, 1276–1285. doi: 10.1002/lno.10096
Sosik H. M., Olson R. J., Armbrust E. V. (2010). Flow cytometry in phytoplankton research. In: DJ Suggett O Prášil, M.A. Borowitzka (eds.) Chlorophyll a Fluorescence in Aquatic Sciences: Methods and Applications, Developments in Applied Phycology 4, Springer Dordrecht. doi: 10.1007/978-90-481-9268-7_8
Stepanauskas R., Jorgensen N. O. G., Eigaard O. R., Zvikas A., Tranvik L. J., Leonardson L. (2002). Summer inputs of riverine nutrients to the Baltic Sea: bioavailability and eutrophication relevance. Ecol. Monogr. 72, 579–597. doi: 10.1890/0012-9615(2002)072[0579:SIORNT]2.0.CO;2
Stürder-Kypke M. C., Kypke E. R., Agatha S., Warwick J., Motagnes D. J. S. (2000). The “user friendly“ guide to coastal planktonic ciliates. The Planktonic Ciliate Project by University of Liverpool on the internet. Available at: http://www.liv.ac.uk/ciliate/intro.htm
Suikkanen S., Pulina S., Engström-Öst J., Lehtiniemi L., Lehtinen S., Brutemark A. (2013). Climate change and eutrophication induced shifts in northern summer plankton communities. PloS One 6, e66475. doi: 10.1371/journal.pone.0066475
Tikkanen T., Willen T. (1992). Phytoplankton flora (Solna: The Swedish Environmental Protection Agency).
Utermöhl H. (1958). Zur vervollkommnung der quantitativen phytoplankton-methodik. Internationale Vereinigung für theoretische und angewandte Limnologie: Mitt. 9, 1–38.
Vähätalo A. V., Aarnos H., Hoikkala L., Lignell R. (2002). Photochemical transformation of terrestrial dissolved organic matter supports hetero- and autotrophic production in coastal waters. Mar. Ecol. Prog. Ser. 423, 1–14. doi: 10.3354/meps09010
Verity P. G., Lagdon C. (1984). Relationships between lorica volume, carbon, nitrogen, and ATP content of tintinnids in Narragansett bay. J. Plankton Res. 6, 859–868. doi: 10.1093/plankt/6.5.859
Wikner J., Hagström Å. (1999). Bacterioplankton intra-anual variability: importance of hydrography and competition. Aquat. Microbial Ecol. 20, 245–260. doi: 10.3354/ame020245
Keywords: mesocosm experiment, climate change, microbial food web, Baltic Sea, terrestrial matter effects, temperature effect
Citation: Andersson A, Grinienė E, Berglund ÅMM, Brugel S, Gorokhova E, Figueroa D, Gallampois C, Ripszam M and Tysklind M (2023) Microbial food web changes induced by terrestrial organic matter and elevated temperature in the coastal northern Baltic Sea. Front. Mar. Sci. 10:1170054. doi: 10.3389/fmars.2023.1170054
Received: 20 February 2023; Accepted: 04 July 2023;
Published: 25 July 2023.
Edited by:
Donald F. Boesch, University of Maryland, College Park, United StatesReviewed by:
Jennifer L. Bowen, Northeastern University, United StatesSarah K. Hu, Woods Hole Oceanographic Institution, United States
Diane Stoecker, University of Maryland, College Park, United States
Copyright © 2023 Andersson, Grinienė, Berglund, Brugel, Gorokhova, Figueroa, Gallampois, Ripszam and Tysklind. This is an open-access article distributed under the terms of the Creative Commons Attribution License (CC BY). The use, distribution or reproduction in other forums is permitted, provided the original author(s) and the copyright owner(s) are credited and that the original publication in this journal is cited, in accordance with accepted academic practice. No use, distribution or reproduction is permitted which does not comply with these terms.
*Correspondence: Agneta Andersson, YWduZXRhLmFuZGVyc3NvbkB1bXUuc2U=
†Present address: Matyas Ripszam, Department of Chemistry and Industrial Chemistry, University of Pisa, Pisa, Italy