 Zufa Ding1,2
 Youwei Xu3Wenjun Chen2,4Yang Liu2,4Cheng Wang2,4Yuhan Niu2Kui Zhang3
 Ying Wang5*
 Liandong Yang2*
- 1College of Fisheries, Huazhong Agricultural University, Wuhan, China
- 2State Key Laboratory of Freshwater Ecology and Biotechnology, Institute of Hydrobiology, Chinese Academy of Sciences, Wuhan, China
- 3South China Sea Fisheries Research Institute, Chinese Academy of Fishery Sciences, Guangzhou, China
- 4University of Chinese Academy of Sciences, Beijing, China
- 5Hubei Engineering Research Center for Protection and Utilization of Special Biological Resources in the Hanjiang River Basin, School of Life Sciences, Jianghan University, Wuhan, China
Flying fishes, which use their wing-like pectoral fins and hypocercal caudal fin to glide through the air to avoid underwater predators, have independently evolved flight behavior, making them ideal for the study of adaptive evolution. To investigate the adaptation of flight behavior in flying fishes and the origin of Beloniformes fishes, this study obtained the complete mitochondrial genomes of Cheilopogon nigricans and Oxyporhamphus micropterus and constructed the DNA sequences extracted from these newly sequenced mitochondrial genomes with the DNA sequences of 32 previously published mitochondrial genomes into a dataset for reconstructing the phylogenetic relationships of Beloniformes fishes. The phylogeny that emerged strongly supported the possibility that flying fishes developed from halfbeaks and the progressive transition of flying fishes from two-wing to four-wing gliding. The divergence time analysis showed that the split between the suborder Belonidei and the family Adrianichthyidae occurred roughly 77.08 Mya, which fell within the period of evolution of the Indian plate in the late Cretaceous. Selection analyses revealed that flying fishes have a lower dN/dS ratio than the other members of Beloniformes, indicating that flying fishes experienced stronger purifying selection to eliminate deleterious mutations to maintain efficient energy metabolism to adapt to flight behavior. Moreover, this work found the positively selected signal in the ND4 gene, suggesting that different mitogenomic genes might have undergone different selective patterns during adaptive evolution.
Introduction
Several families of teleost fishes have been previously reported to exhibit flight behavior, including the flying gurnards (Dactylopteridae), the osteoglossid African butterfly fish (Pantodon bucholzi), the gasteropelicid flying hatchet fish (Gasteropelecus and Carnegiella), the flying fishes (Exocoetidae), and the marine halfbeaks (Hemiramphidae), but in fact, only flying fishes and marine halfbeaks are supported by evidence (Davenport, 1994). According to FishBase reports (Froese et al.,2023), the family Exocotidae currently consists of seven genera and 71 species. Flying fishes are distributed in all oceans, especially in tropical and warm subtropical waters, and mainly inhabit the top layer of the ocean to a depth of about 200 m (Lewallen et al., 2018). All flying fish have wing-like pectoral fins that form most of the lifting surface during flight to avoid underwater predators such as swordfish, marlin, and tuna (Davenport, 1994; Lewallen et al., 2011). In addition, their lower caudal fins are all longer than their upper caudal fins, which facilitates their exit from the water and provides additional power for some species without fully re-entering the water (Davenport, 1994; Lewallen et al., 2011). The flight behavior of flying fishes has attracted extensive attention from scholars in many fields, including ecology, morphology, genetics, and aerodynamics (Davenport, 1992; Park and Choi, 2010; Lewallen et al., 2018; Daane et al., 2021).
Mitochondria produce adenosine triphosphate (ATP) through oxidative phosphorylation (OXPHOS) to provide energy for various physiological activities and biochemical reactions in organisms, such as muscle contraction, organic matter decomposition, and ion pumping. The key subunits of the respiratory chain complex are encoded by mitochondrial DNA (mtDNA). Therefore mtDNA are sensitive to energy-related selection pressures. Given this, an increasing number of researchers have focused on mtDNA to investigate the adaptive evolution of certain species from an energy standpoint, including the Tibetan loaches (Wang et al., 2016), the Tibetan horse (Ning et al., 2010), glyptosternoid fishes (Ma et al., 2015), salmonids (Wang et al., 2022), schizothoracine fishes (Yonezawa et al., 2014), bats (Shen et al., 2010), Gynaephora species (Zhang et al., 2017), and alpine pheasants (Gu et al., 2016). Compared to other forms of locomotion (such as swimming and running), flying has a higher energy expenditure (Zhang et al., 2013; Butler, 2016); thus, the maintained flight behavior of flying fishes necessitates a more active metabolism. It is clear that investigating the selection pattern of mtDNA in flying fishes can facilitate us to parse the flight adaptation mechanism of flying fishes. Moreover, research on the divergence time of Beloniformes fishes is currently lacking, with the only studies available focusing on their involvement in broader studies of divergence (Meynard et al., 2012; Betancur-R et al., 2015), and the phylogenetic position of Belonidae and Zenarchopteridae within the Beloniformes remains unresolved (Lovejoy, 2004).
This study analyzed 34 complete mitochondrial genomes of Beloniformes fishes, including newly determined mitochondrial genomes of C.nigricans and O.micropterus, to investigate the phylogenetic status and origins of Beloniformes fishes, as well as to provide a comprehensive understanding of the adaptive evolution of mtDNA in flying fishes during adaptation to flight behavior.
Materials and methods
Mitochondrial genome sequencing, assembly, and annotation
The complete mitochondrial genomes of C.nigricans and O.micropterus were sequenced in this experiment. Species identification was based on DNA barcoding. DNA was extracted from muscles. Fragment genomic DNA using fragmentase to an average size of 150bp. Then, perform end repair, add adapters, and sort using magnetic beads. Amplify via PCR and sequence using the high-throughput sequencing platform, DNBSEQ-T7 (Wuhan, Hubei, China), for paired-end sequencing. Using all published mitochondrial genomes of flying fish available in the NCBI database as reference genomes, MitoFinder (Allio et al., 2020) was employed to fully automate the assembly and annotation of the raw sequencing reads of the two species. The data size of each species was about 5 G with approximately 32 million reads per species. This work also utilized MitoAnnotator (Iwasaki et al., 2013) for annotations to guarantee the accuracy, and the final annotation results were consistent with those of MitoFinder. The raw data were deposited in the NCBI database (PRJNA921933).
Phylogenetic analysis
In total, 34 Beloniformes species were used in the phylogenetic analyses, including 15 species from Exocoetidae, eight species from Hemiramphidae, six species from Belonidae, three species from Zenarchopteridae, and two species from Adrianichthyidae as an outgroup. The complete mitochondrial genome data for all species are available for download from the National Center for Biotechnology Information (http://www.ncbi.nih.gov/). The taxonomic information, accession numbers, and mitogenome sizes are provided in Supplementary Table S1. The nucleotide sequences of 13 protein-coding genes (PCGs) were extracted using Perl scripts (Minxiao et al., 2011). Multiple sequence alignment was performed in TranslatorX v1.1 (Abascal et al., 2010), which compared protein-coding DNA sequences based on the corresponding amino acid alignment. Trimal v1.4 (Capella-Gutierrez et al., 2009) was used to automatically trim the result of multiple sequence alignment (-resoverlap = 0.75, -seqoverlap = 80). After removing the stop codon, the 13 PCGs (total = 11367 bp) were concatenated using PhyloSuite v1.2.2 software (Zhang et al., 2020). Tests of the base substitution saturation were performed prior to the phylogenetic reconstruction to avoid the problem of non-homologous similarity due to too rapid a substitution rate. The extent of substitution saturation was estimated separately for the entire concatenated sequence and each codon of the concatenated sequence using DAMBE v7.3.32 (Xia, 2018) with GTR genetic distance.
Both the Maximum Likelihood and Bayesian methods are commonly used to construct phylogenetic trees from genetic sequence data, but they employ different approaches. The Maximum Likelihood method aims to find the tree that maximizes the probability of the observed data, whereas the Bayesian method calculates the posterior probability of various trees given the data and prior knowledge. Comparing the trees generated using both methods can provide an additional layer of validation to the results. Therefore, we use these two methods to construct trees at the same time. The ML phylogenetic analysis was implemented in RAxML (Stamatakis, 2014) v8.2x using the general time reversible model with gamma distribution and a proportion of invariable sites (GTRGAMMAI), which was estimated in jModeltest v2.1.3 (Darriba et al., 2012) based on the Bayesian information criterion (BIC). The bootstrap support values for each node were estimated using the rapid bootstrap algorithm with 1000 replications. Using MrBayes v3.2.7a (Ronquist et al., 2012) software, Bayesian phylogenetic analysis was performed according to the best-fit partition scheme for each gene and codon position determined by PartitionFinder v2.1.1 (Lanfear et al., 2016) based on the BIC. The “prestet” command was used to set the prior parameter “ratepr=variable,” the “unlink” command was used to treat the different partitions differently, and the model parameters for each partition were estimated separately using the “applyto” command. To ensure the convergence of the parameters, the analysis was run twice initiated with a random tree. Four independent Markov Chain Monte Carlo (MCMC) chains (three hot and one cold) were run for 10,000,000 generations with a sampling frequency of 1000 generations and a burn-in of 25%. Tracer v1.7.2 (Rambaut et al., 2018) was also used to access the convergence of the BI analyses (ESS > 200). Trees inferred prior to stationarity were discarded as burn-in, and those remaining were used to construct a 50% majority rule consensus tree with the “smut” command. The online website TVBOT (https://www.chiplot.online/tvbot.html, accessed on 15 December 2022) was used to visualize and beautify the phylogenetic trees.
Divergence time estimation
The approximate likelihood method of MCMCtree within the PAML v 4.9 j package (Yang, 2007) was used to obtain the estimated divergence times for Beloniformes fishes with the independent rate clock model (clock = 2). The ML tree generated in RAxML was used as the input tree. The gradient (g) and Hessian (H) matrix of the ML branch lengths were calculated using BASEML (in PAML) under the GTR+G substitution model with the gamma prior set at 0.5. The two parameters, rgene gamma and sigma2 gamma, were set at G (2, 20) and G (1, 4.5), respectively. Trees were simulated in a birth–death process with three parameters, namely, the birth rate λ, mortality μ, and sampling rate ρ specified as 1, 1, and 0, respectively. The minimum age of the ancient fossil Rhamphexocoetus volans was recorded as 49.11 Mya (Bannikov et al., 1985), which was the most recent common ancestor (MRCA) of Dermogenys and Arrhamphus (Near et al., 2013). Therefore, based on the estimated divergence time of Belonoidei at approximately 48.9–80.1 Mya (Meynard et al., 2012; Sanciangco et al., 2016), this work constrained the age of the Belonoidei split to between 49.11 Mya and 80.1 Mya. According to the TimeTree database (http://timetree.org/), the estimated divergence time between Exocoetidae and Hemiramphidae was about 25.7–49.6 Mya, that between Zenarchopteridae and Belonidae was about 32.5–56.6 Mya, that between Oxyporhamphus and Hemiramphus was about 12.99–17.68 Mya, and the age of Beloniformes fishes was roughly 65.5–92.4 Mya (Near et al., 2012; Rabosky et al., 2013; Betancur-R et al., 2015; Rabosky et al., 2018). After the first 400,000 iterations were discarded as burn-in, the MCMC run was sampled every 100 iterations until it achieved 20,000 samples. To ensure the convergence of BI, two replicate MCMC runs were initiated with two different random seeds. The effective sample sizes (ESS) of each node age and parameter were determined in Tracer v1.72 (Rambaut et al., 2018). The TVBOT website (https://www.chiplot.online/tvbot.html, accessed on 15 December 2022) was used to visualize and beautify the divergence time tree.
Estimation of evolutionary rates
To evaluate the evolutionary rate of flying fishes, the Codeml program in the PAML (Yang, 2007) package with the free-ratio model (model = 1) was run on each of the 13 PCGs and the concatenation sequence. The values of the parameters dN, dS, dN/dS, N*dN, and S*dS were obtained for each branch of the tree. To avoid the effect of outliers on the results, the genes with N*dN or S*dS values less than 1 or dS values greater than 1 were discarded (Goodman et al., 2009). The dN/dS ratios for each terminal branch were divided into two groups: flying fishes and non-flying fishes. The flying fishes comprised 15 species, while the remaining 19 species belonged to the non-flying fishes. The statistical significance of the differences in the mean dN/dS ratios of each gene between the flying fishes and non-flying fishes was tested using the Wilcoxon rank sum test implemented in R v4.2.2 (R Core Team, 2022).
Selection analysis
The codeml program in the PAML package and the fixed-effects likelihood (FEL) method in the Hyphy (Pond et al., 2005) software were used to identify positively selected genes for the flight behavior adaptation of flying fishes. In the codeml program, the two-ratio model was specified as the alternative hypothesis model, which assumed different dN/dS ratios for the foreground and background branches, while the null hypothesis model was set as the one-ratio model, which assumed the same dN/dS ratio between branches. This study also used the branch site model, which further took into account the different dN/dS ratios between sites compared to the branch model. Branch site model includes two built-in models: modelA and modelA1, which assume different dN/dS ratios between sites and the same dN/dS ratios between sites, respectively. The former was designated as the alternative hypothesis. The likelihood ratio test (LRT) was used to detect the fit of the data to the alternative model and the null model, and the posterior probability of the positive selection site was estimated using Bayes empirical Bayes (Yang, 2005). Compared with codeml, FEL can detect not only positive selection sites but also negative selection sites. The method also has two built-in models: H0, dN = dS (the neutral model), and HA, in which dN and dS are estimated independently (the selection model). When the LRT is significant, if dN > dS, the site is declared to be under positive selection; otherwise, the site is declared to be under negative selection.
Results
Mitochondrial genome characteristics
The mitochondrial genome size of C. nigricans was 16,672 bp and that of O. micropterus was 16,683 bp. Differences in mitochondrial genome size compared to that of other species of the same family resulted from variation in the length of the control regions. Both mitochondrial genomes were composed of 37 genes (13 PCGs, 22 tRNAs, and two rRNAs) and a putative control region (CR), which was similar to the mitochondrial genomes of other teleosts (Broughton et al., 2001; Saitoh et al., 2006). Of these 37 genes, the genes ND6, tRNA-Gln, tRNA-Ala, tRNA-Glu, tRNA-Pro, tRNA-Asn, tRNA-Tyr, tRNA-Ser, and tRNA-Cys were encoded on the light strand, whereas the remaining genes were encoded in the heavy chain. Both mitochondrial genome sequences were biased toward A and T. The AT content of C. nigricans was 56% and that of O. micropterus was 57%. The concatenated dataset consisted of 11,367 bp from 13 PCGs of 34 mitochondrial genomes. There were 6388 variable sites and 5451 parsimony informative sites among the identified sites.
Phylogenetic reconstruction
There was no evidence for the saturation of any codons in the 13 PCG saturation tests (Xia et al., 2003). In each case, the index of substitution saturation (Iss) was significantly less than the critical value (Issc, Supplementary Figure S1). The best-fit partitioning scheme across each gene and codon position is determined and shown in Supplementary Table S2. The results of the Bayesian and ML nucleotide analyses performed using MrBayes and RAxML for the 13 PCG sequence datasets showed a marked consistency in topological congruence, differing only in the support values for certain nodes (Figure 1). Herein, ML bootstrap support values > 70 (BP > 70) and BI posterior probabilities > 0.95 (PP > 0.95) were defined as strongly supportive. Most nodes were well-supported, with 28 of 31 nodes having BP > 80 and PP > 95. The best-supported phylogenetic relationships of Beloniformes are as follows: (Adrianichthyidae + ((Belonidae + Zenarchopteridae) + (Hemiramphidae + Exocoetidae))). The position of the family Adrianichthyidae was at the base of the Beloniformes tree. The family Zenarchopteridae was nested within the family Belonidae. An exception was that Dermogenys pusilla formed a sister group with Ablennes hians instead of the genus Zenarchopterus, which included Zenarchopterus buffonis and Zenarchopterus dispar in this study. The family Hemiramphidae formed a paraphyletic group. Within the family Hemiramphidae, the genus Hyporhamphus, excluding Hyporhamphus dussumieri, was found to be monophyletic with a high support value (PP = 1.00 and BP = 100). The family Exocoetidae was strongly supported as a monophyletic group (PP = 1.00 and BP = 100) and was nested within the family Hemiramphidae. Within the family Exocoetidae, the relationships of the genus Cheilopogon were highly complicated, consisting of two well-supported monophyletic clades (PP = 1.00 and BP = 95, PP = 1.00 and BP = 100) and two separate branches, and the species of the genus Hirundichthys formed a monophyletic group (PP = 1.00 and BP = 93).
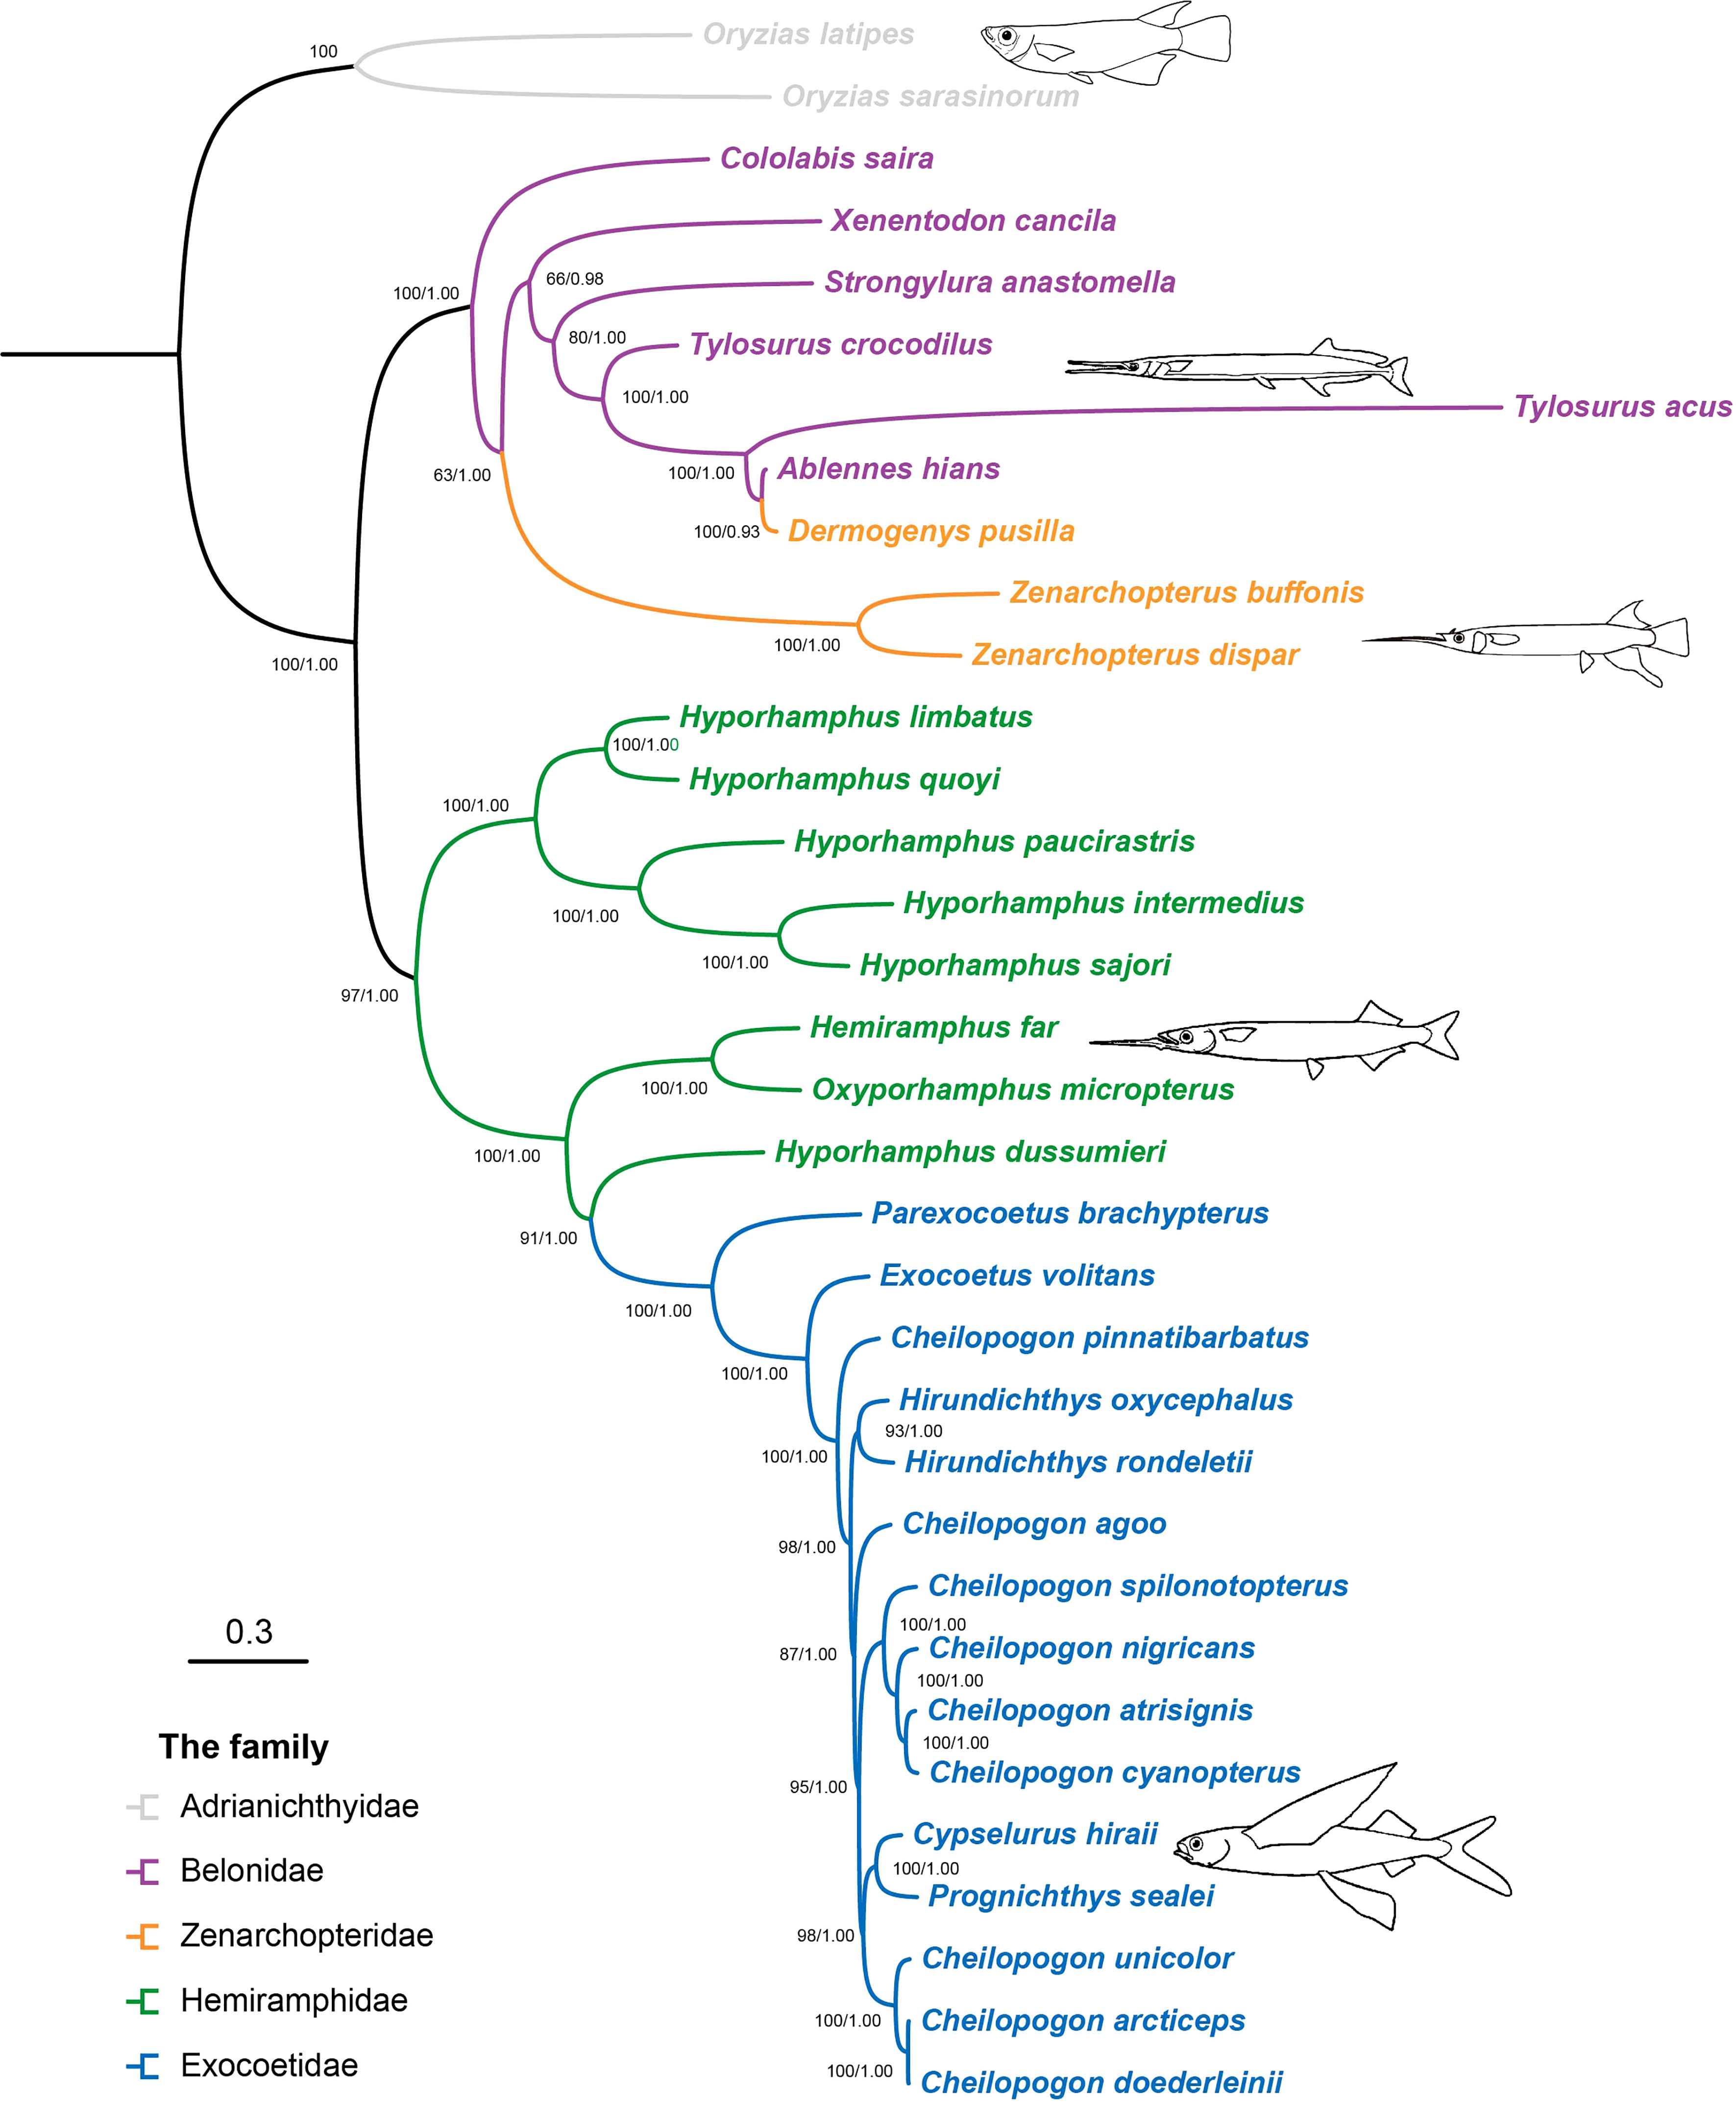
Figure 1 Phylogenetic trees of Beloniformes fishes inferred from the 34 mitogenomes of Beloniformes, reconstructed using the maximum-likelihood and Bayesian inference methods. Node labels represent Bootstrap support values/Bayesian posterior probability. The ML tree and BI tree were shown in Supplementary Figures S2, S3, respectively.
Divergence time
The constructed divergence time tree has a topology consistent with those of the ML trees and is shown in Figure 2 with 95% credible intervals (CIs). The split between the family Adrianichthyidae and other members of the Beloniformes, that is, the suborder Belonoidei (or Exocoetoidei), was dated back to the late Cretaceous period, approximately 77.08 Mya (95% CI: 65.49–90.18 Mya). Within the suborder Belonoidei, the family Belonidae and the family Zenarchopteridae diverged from the other families, namely, Hemiramphidae and Exocoetidae, at an estimated 59.08 Mya (95% CI: 51.93–67.23 Mya). The family Exocoetidae diverged from the family Hemiramphidae approximately 33.00 Mya (95% CI: 28.10–38.24 Mya). The most recent common ancestor of Hemiramphus far and O. micropterus arose at roughly 14.51 Mya (95% CI: 12.77–16.98 Mya). Within the family Exocoetidae branch, the genus Hirundichthys, which included Hirundichthys rondeletiid and Hirundichthys oxycephalus in this study, divided at about 6.73 Mya (95% CI: 4.85–8.56 Mya).
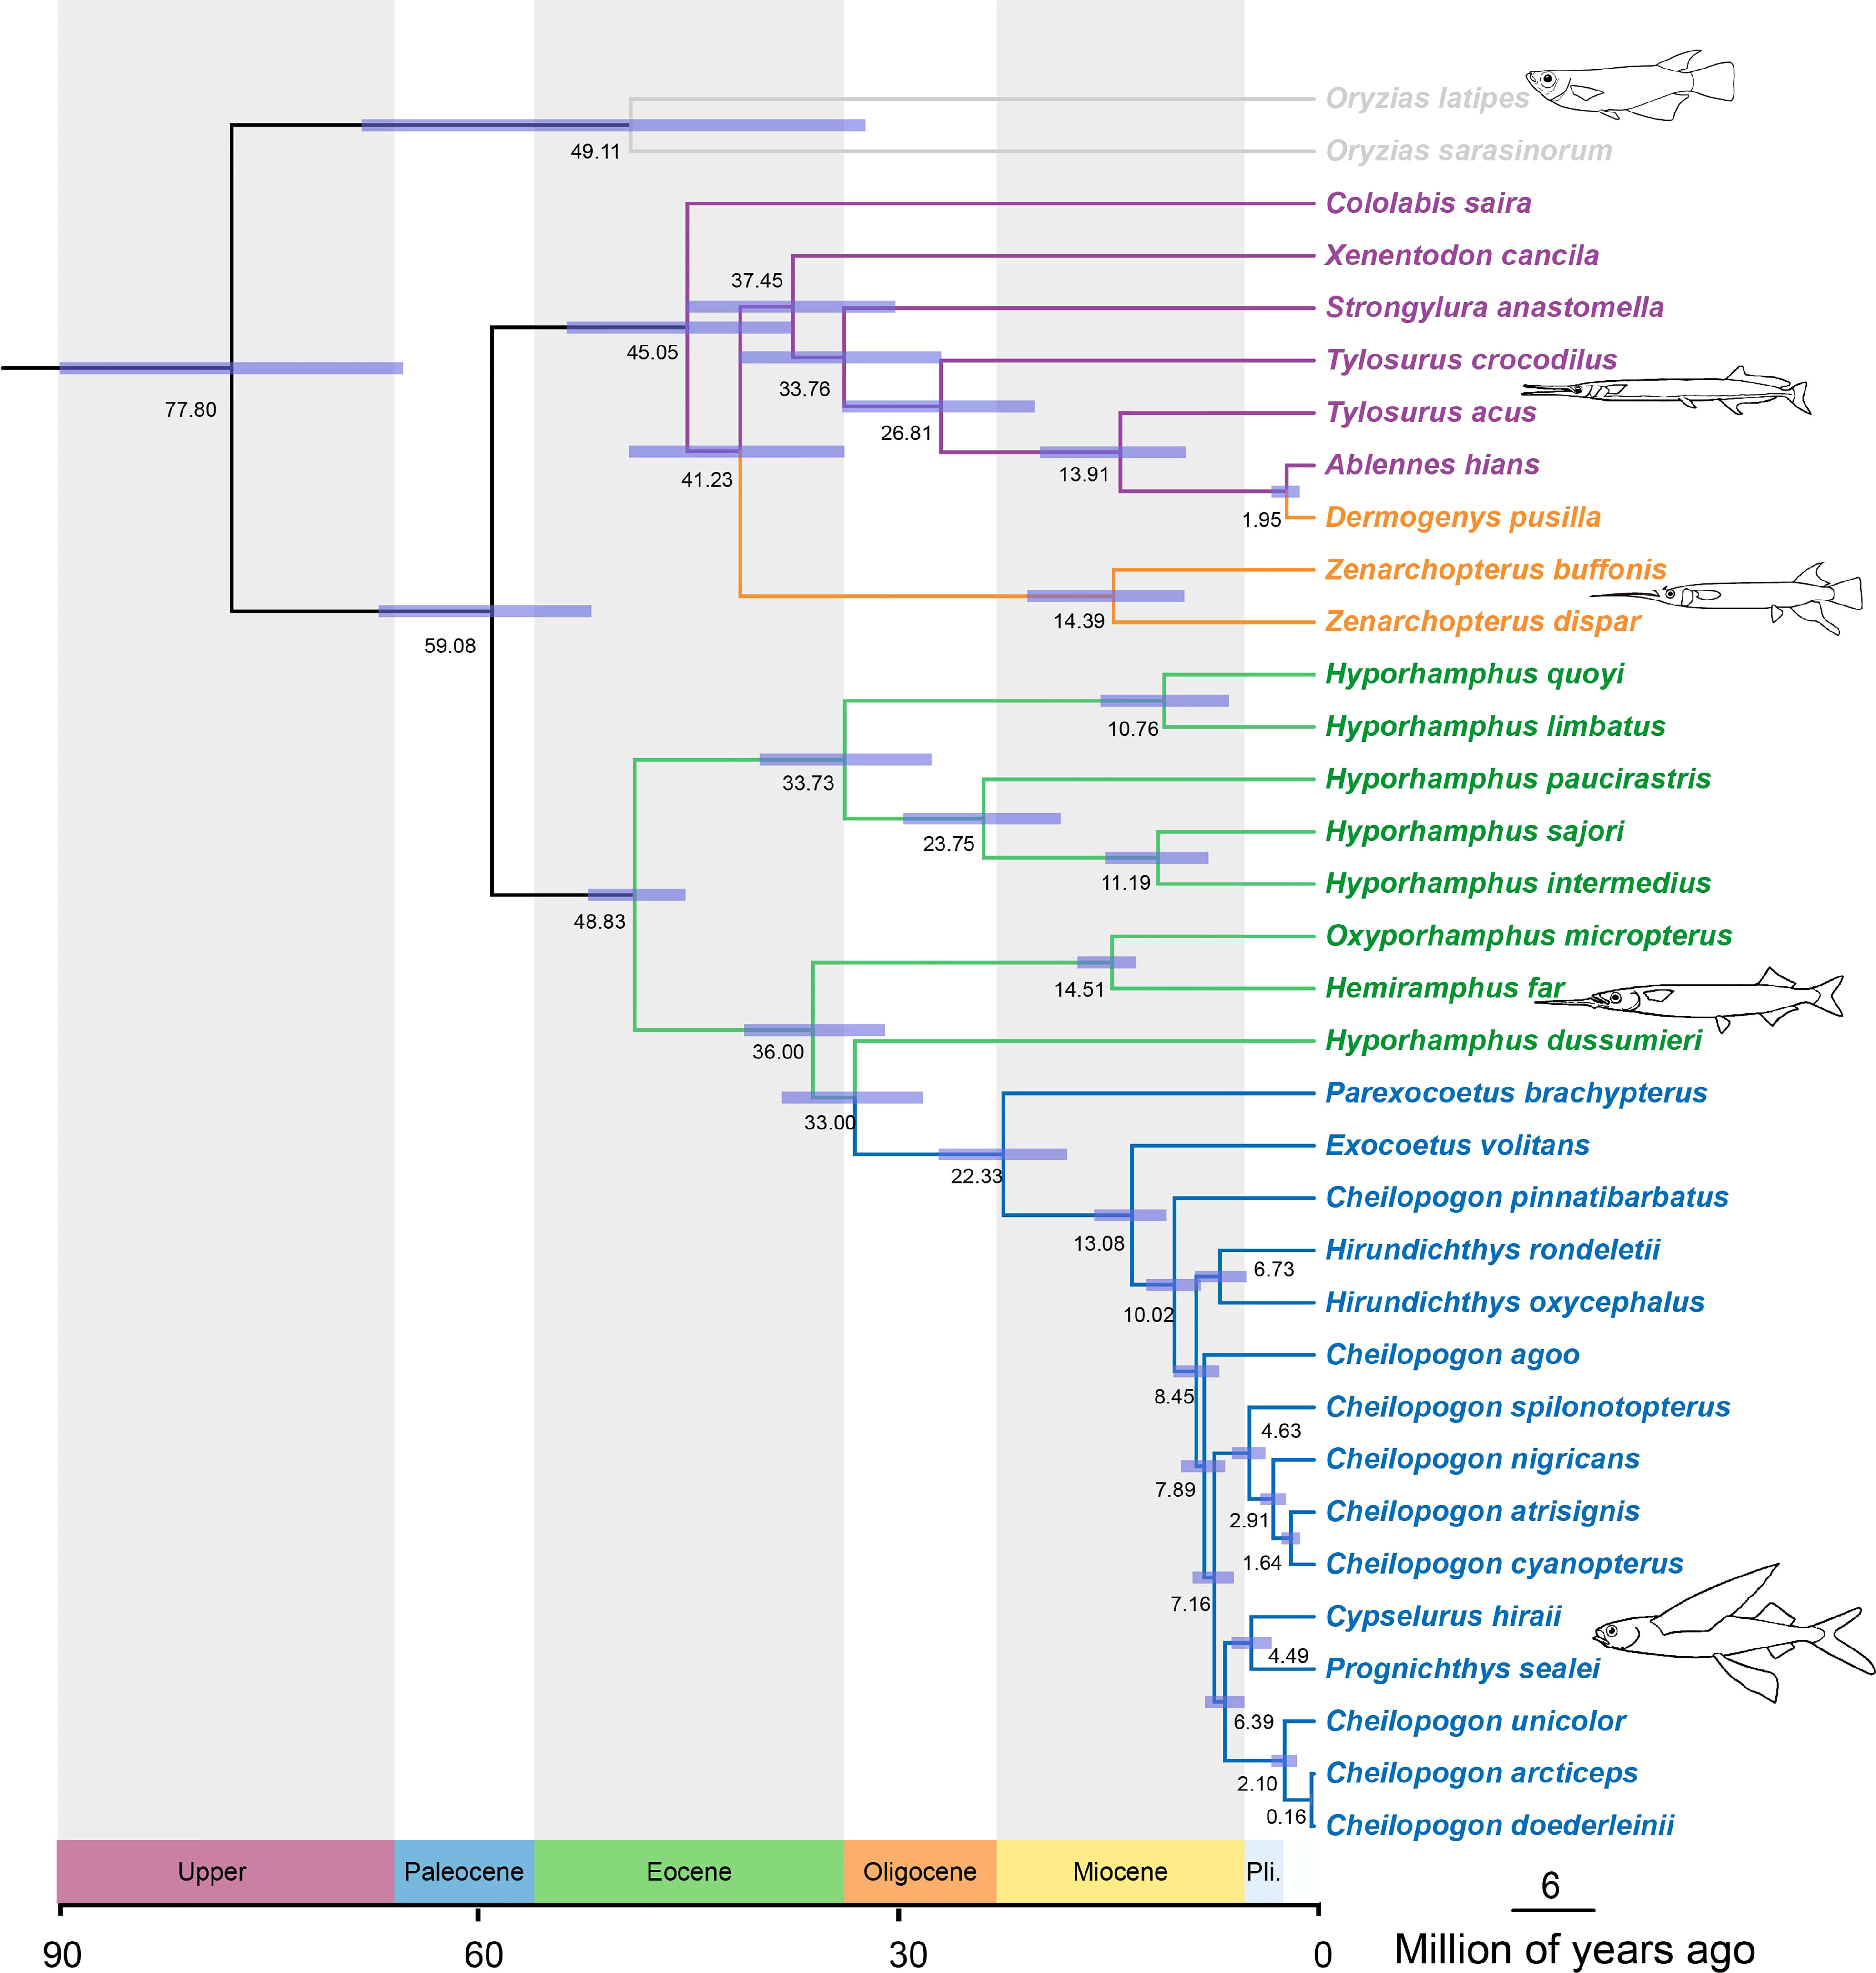
Figure 2 Beloniformes fishes divergence time estimation performed by using MCMCTree on the RAxML topology. Node bars indicate 95% credible intervals of the divergence time estimates. Node labels are the estimates of the mean divergence times (in Mya).
Analysis of evolutionary rates and selection
The analysis of evolutionary rates yielded a separate dN/dS ratio for each terminal branch of the phylogenetic tree. It was found that the overall mean dN/dS ratio for 13 concatenated PCGs of the flying fishes group was significantly smaller than that of the non-flying fishes group (Wilcoxon rank sum test, P = 0.00045). In addition, with respect to each mitochondrial PCG separately, almost half of the genes in the flying fishes group had smaller mean dN/dS ratios than the non-flying fishes group (Supplementary Table S3). In particular, the mean dN/dS ratios of ND1, ND4, ND5, and ND6 in the flying fishes group were significantly smaller than those in the non-flying fishes group (Wilcoxon rank sum test, P = 0.01176, 0.01484, 0.01682, and 0.00168, respectively) among all of the mitochondrial PCGs (Figure 3).
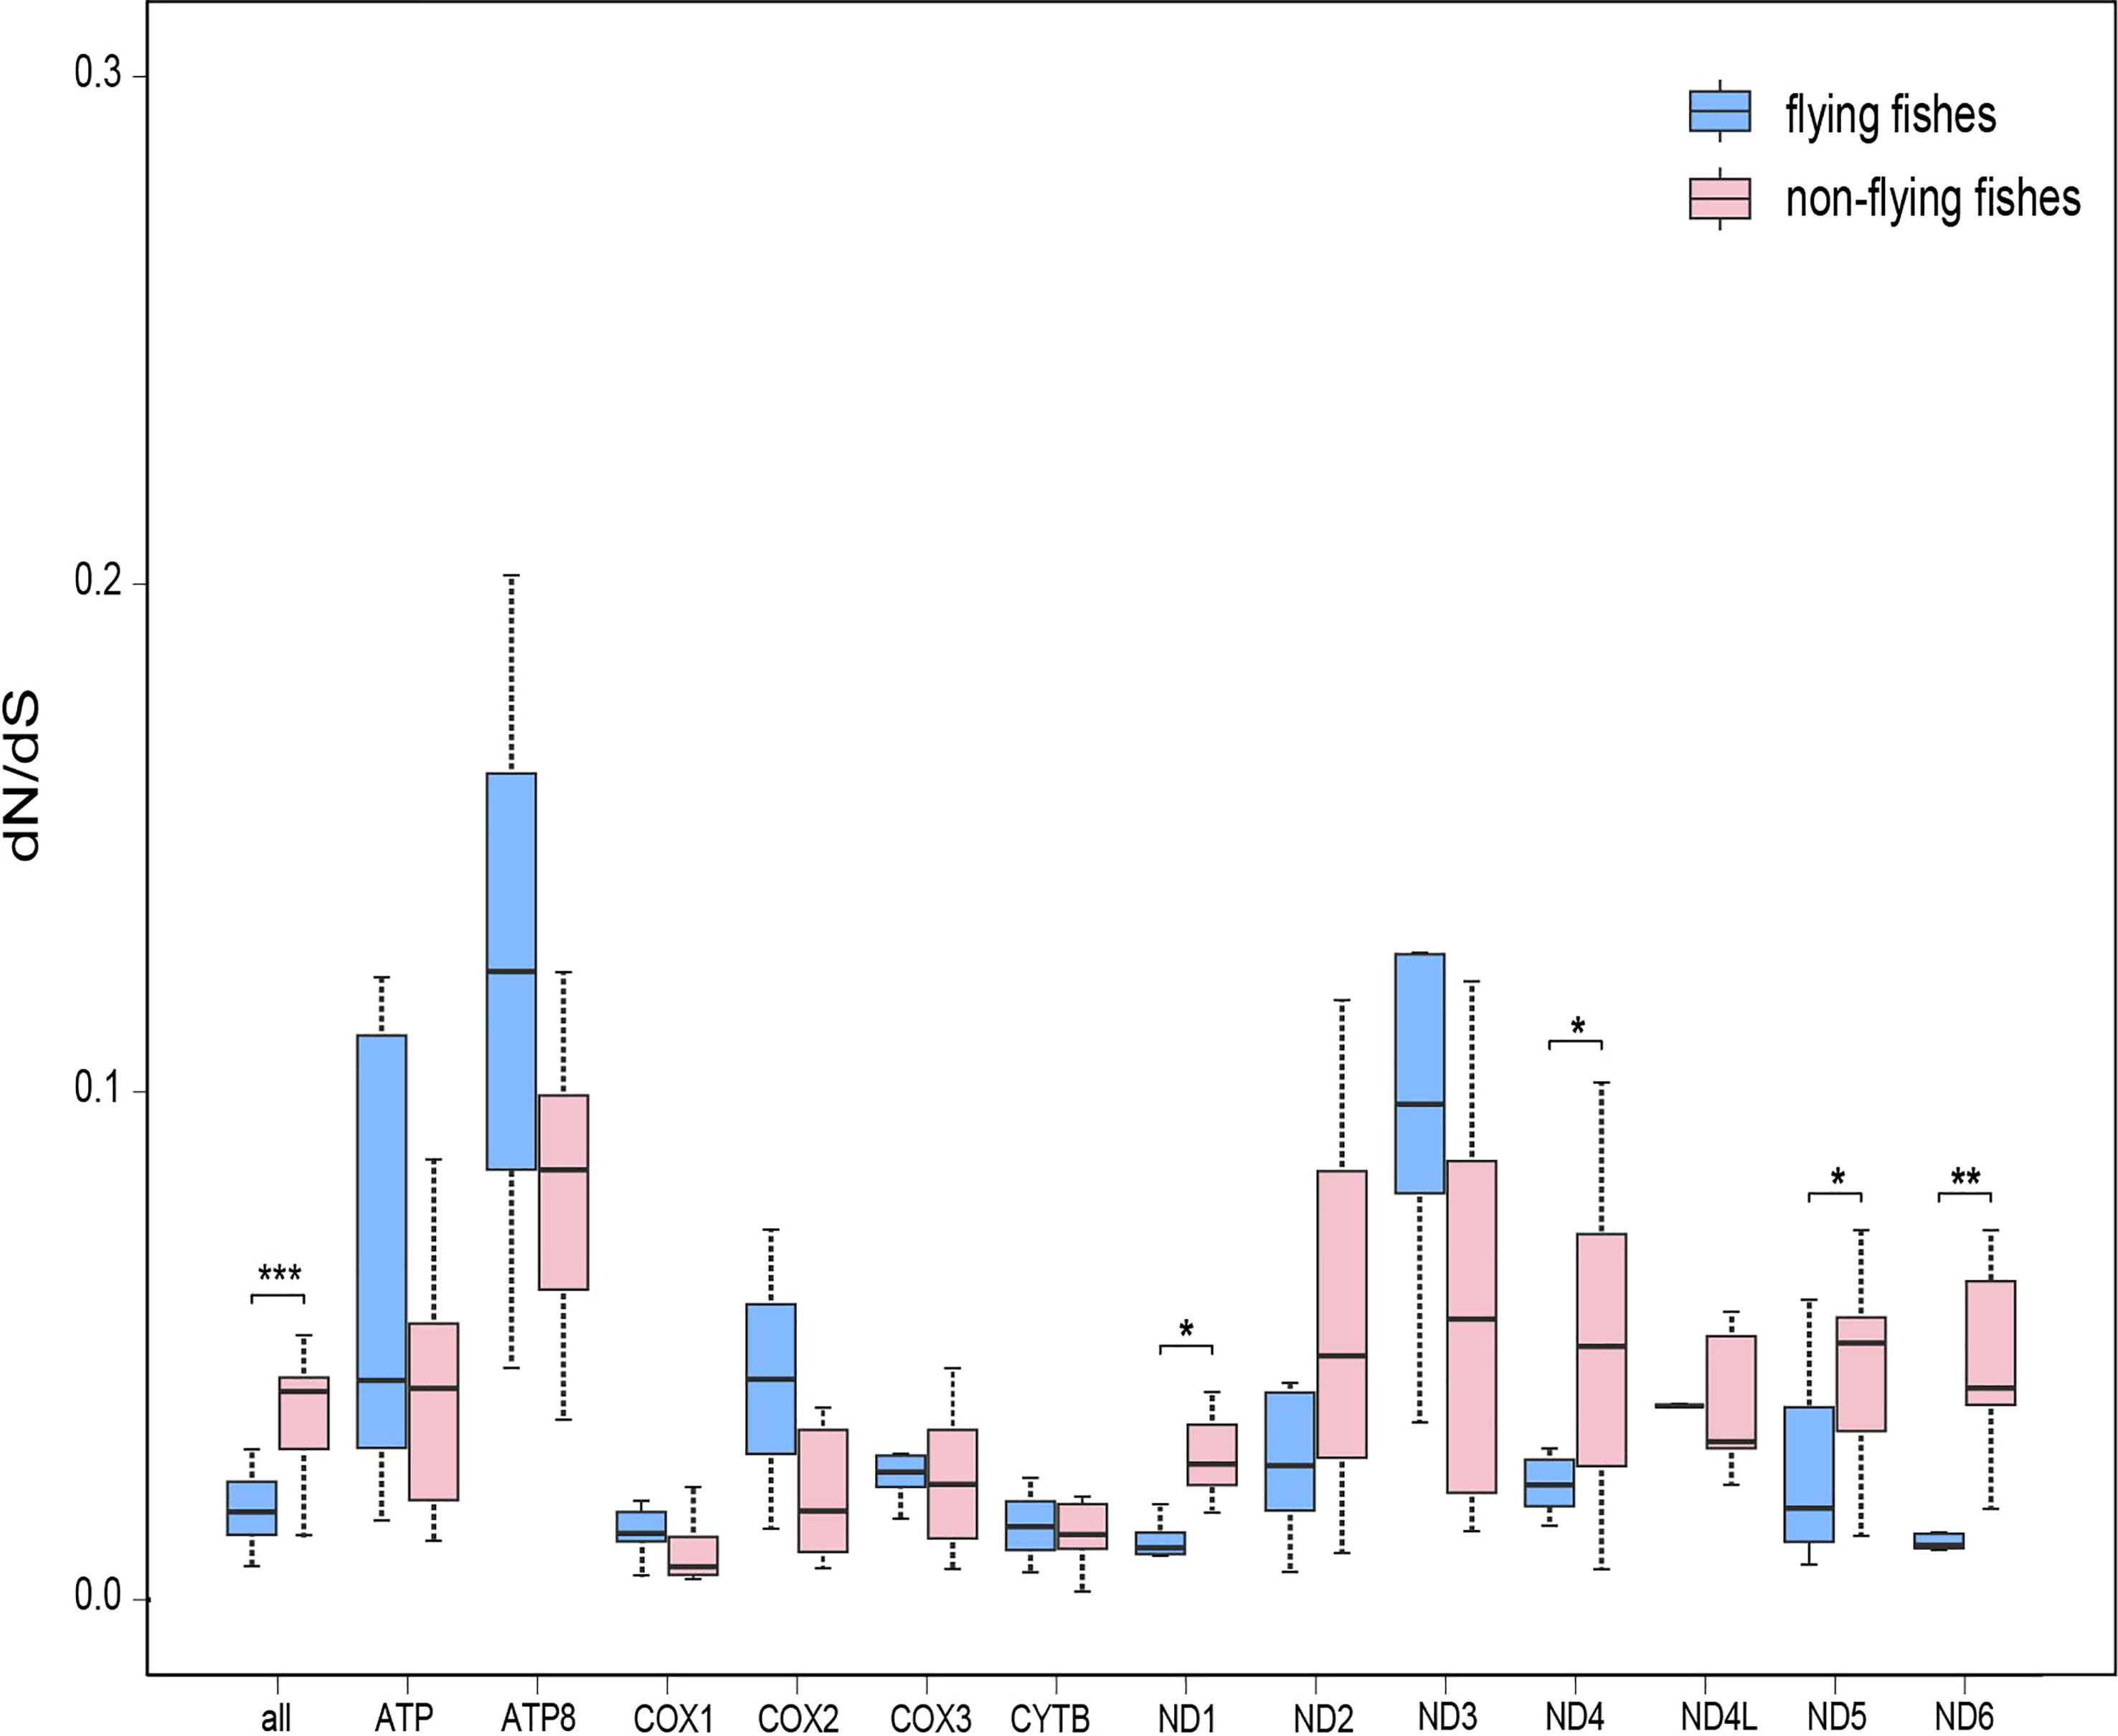
Figure 3 The evolution rate analysis of flying fishes. Comparisons of average dN/dS ratios for 13 individual protein-coding genes between flying fishes and non-flying fishes. Note: *0.01 <P <0.05, **0.001 <P <0.01.
When 15 flying fishes were specified as the foreground branch, the FEL analysis did not identify any positively selected sites, but one positively selected site was detected in the ND4 gene by using the branch site model in the codeml program (corresponding to site 354, positive sites for foreground lineages Prob = 0.976). According to the LRT, the p-value was 0.003933; thus, it was reasonable to believe that this was a positively selected site.
Discussion
There are disagreements over the classification of the order Beloniformes. According to Fishes of the World (Nelson, 2006), Beloniformes is composed of five families, namely, Adrianichthyidae, Scomberesocidae, Belonidae, Exocoetidae, and Hemiramphidae, which is in agreement with the Fish Database of Taiwan (http://fishdb.sinica.edu.tw). However, the freshwater halfbeaks are regarded as a distinct family (Zenarchopteridae) in FishBase(Froese and Pauly, n.d.). In this study, based on the results of phylogenetic trees from previous studies (Toyama et al., 2020; Daane et al., 2021), the classification information from the NCBI Taxonomy Browser (Schoch et al., 2020) was adopted, which divided the sauries (Scomberesocidae) into the family Belonidae and also gave family status (Zenarchopteridae) to the freshwater halfbeaks. The phylogenetic trees based on 13 concatenated PCGs showed a similar topology to the previous molecular phylogenetic analyses based on mitochondrial genome sequences (Cui et al., 2018; Lü et al., 2018; Zhu et al., 2018; Tan et al., 2019), showing that the ricefishes (Adrianichthyidae) were at the base of the phylogenetic tree, the freshwater halfbeaks (Zenarchopteridae) were nested within the needlefishes (Belonidae), and the flying fishes (Exocoetidae) were nested within the marine halfbeaks (Hemiramphidae). However, the results of research by Lovejoy (2000); Lovejoy (2004) based on mtDNA and nuclear loci, revealed a sister relationship between needlefishes and the freshwater halfbeaks, which was consistent with the morphologically based analysis of Beloniformes phylogenetic relationships (Toyama et al., 2020) and the reconstruct the phylogeny of the Beloniformes based on 4683 genes (Daane et al., 2021). Nevertheless, the phylogenetic analysis of the ricefishes by Yamahira et al. (2021) using mtDNA and five nuclear genes supports the present analysis. This different phylogenetic position of needlefishes and freshwater halfbeaks in the present analysis is most likely due to the insufficient abundance of the freshwater halfbeaks because small effective populations might limit the mitochondrial applicability in phylogenetic reconstruction (Chauhan and Rajiv, 2010), which also explains the sister relationship between Dermogenys pusilla and Ablennes hians. In addition, there is a possibility that hybridization has occurred in the sister groups consisting of needlefishes and freshwater fishes, resulting in mtDNA introgression between these two populations, and the likelihood of incomplete lineage sorting cannot be ruled out. Although this study has some limitations, the findings of this study provide a basis for subsequent work to address these questions with additional datasets. As reviewed by Nichols and Breder (1928), all the above-mentioned studies on Beloniformes, including the present research, strongly supported the idea that flying fishes developed from halfbeaks, which was also reflected in the morphological characteristics of the genera Oxyporhamphus and Euleptorhamphus. Both genera exhibit gliding behaviors with elongated pectoral fins, and species of the genus Oxyporhamphus have lost the halfbeak jaw morphology, showing a morphology similar to that of flying fishes (Davenport, 1994; Daane et al., 2021). Moreover, these studies have also demonstrated that the family Exocoetidae is clustered into a monophyletic group. With respect to the family Exocoetidae, the evolutionary relationship (excluding the genus Cheilopogon) is (Parexocoetus, (Exocoetus, (Hirundichthys, (Prognichthys, Cypselurus)))), which is in agreement with the early phylogenetic studies (Lewallen et al., 2011; Daane et al., 2021). Although this differs from the morphology-based phylogenetic analysis (Dasilao and Sasaki, 1998), these results also reflect the progressive evolution of gliding in flying fishes, from two-wing to four-wing gliding, and the extinct thoracopterid flying fishes also exhibited the same evolution trend (Xu et al., 2015). An extended dataset will provide better resolution for the complicated phylogeny of Cheilopogon, the most diverse and morphologically variable genus within the flying fishes.
As the taxonomic and phylogenetic relationships of Beloniformes are not well defined, there are gaps in the research on the divergence time of Beloniformes fishes. Therefore, this study focused on the divergence time of Beloniformes fishes, with the aim of providing a foundation for subsequent studies. The present analysis showed that the estimated divergence time between the Adrianichthyidae and the Belonidei was roughly 77.08 Mya (65.49–90.18 Mya). The divergence time of the Belonidei estimated by Yamahira et al. (2021) based on the lognormal relaxed molecular clock model is similar to the results of this study. Their molecular dating results indicated that the Belonidei appeared about 89 Mya (73–107 Mya). In their response to Britz et al., Yamahira et al. (2022) pointed out that the most probable distribution area of the MRCA of Adrianichthyidae was on the Indian subcontinent only and that the MRCA of Beloniformes was also distributed only on the Indian subcontinent. India broke off from Madagascar during the Late Cretaceous (~90 Mya) with the spreading of the Central Indian Ridge (Chatterjee et al., 2013) and collided with the Kohistan–Ladakh island arc about 85 Mya (Chatterjee and Scotese, 2010). Limited separation of the Seychelles–Laxmi Ridge from India occurred about 68–75 Mya (Chatterjee et al., 2013). The present estimate of the origin of the Belonidei is compatible with the timing of these geological events. In addition, according to a previous study (Hu et al., 2022), the divergence time of the Beloniformes fishes was about 97.8 Mya. These findings appear to support Yamahira et al.’s hypothesis that Beloniformes fishes originated from India and were split into the suborders Belonidei and the family Adrianichthyidae during the evolution of the Indian plate in the late Cretaceous. The widespread distribution of the Belonidei suborder may be attributed to the expansion of the ocean after the separation of the subcontinents. However, as there is no supporting evidence from fossils, this conjecture may be incorrect. Further research is therefore necessary to elucidate the origin of Beloniformes.
Species with higher energy requirements typically experience stronger evolutionary constraints on mtDNA, because nonsynonymous substitutions tend to be more harmful than synonymous substitutions. This view is confirmed by previous studies. For example, Strohm et al. (2015) demonstrated that fishes in the highly locomotive group experienced stronger purifying selection than sedentary fishes. Sun et al. (2017) reported that the weakly locomotive mollusks, compared to strongly locomotive mollusks, experienced more relaxed evolutionary constraints. The comparative genomic analysis conducted by Sun et al. (2011), based on the complete mitochondrial genome of 401 teleosts, showed that compared with migratory fishes, nonmigratory fishes experienced a relaxation of purifying selection. The mean ω (dN/dS) ratio was significantly smaller in birds than in mammals in the analysis performed by Stanley and Harrison (1999), which indicated that birds experienced stronger evolutionary constraints. Therefore, the present work divided 34 species of Beloniformes into two groups, flying fishes and non-flying fishes, to quantify the difference in ω ratios and to explore the selective pressures acting on flying fishes from the mitogenomic perspective. The concatenated 13 mitochondrial PCGs were shown to have extremely significantly smaller mean ω ratios in the flying fishes group than in the non-flying fishes group, and the same results have been reported in studies on insects (Chang et al., 2020) with different flight abilities. Moreover, almost half of the mtDNA in the flying fishes group had smaller mean ω ratios than the non-flying fishes group. The results indicate that flying fishes have undergone stronger selective constraints than non-flying fishes to eliminate deleterious mutations to maintain efficient energy metabolism to adapt to flight behavior at the mitogenome level. Through the branch site model in Codeml, a positive selection signal was detected in the ND4 gene of flying fishes, which was also found in the ND4 gene of flying insects (Yang et al., 2014) and the ancestor of flying bats (Shen et al., 2010). This work suggests that the adaptive evolution of the ND4 gene might have occurred in response to increased energy consumption in flying fishes. It is worth noting that the ND4 gene had a smaller mean ω ratio in the flying fishes group than in the non-flying fishes group, which indicated that the ND4 gene underwent greater purifying selection in the flying fishes group than in the non-flying fishes group. This work speculated that the stronger selective constraints in the ND4 gene might result from the small sample size (n = 34) available for this test in this study. In conclusion, this study reveals that the adaptive mtDNA evolution pattern associated with flying behavior is reflected in flying fishes and different mitogenomic genes might have undergone different selective patterns during the process of adaptive evolution.
Data availability statement
The datasets presented in this study can be found in online repositories. The names of the repository/repositories and accession number(s) can be found below: NCBI with the BioProject accession PRJNA921933. This data can be found here: https://www.ncbi.nlm.nih.gov/bioproject/PRJNA921933.
Ethics statement
All procedures were performed following relevant guidelines and regulations and approved by the ethics committee of the Institute of Hydrobiology (CAS).
Author contributions
LY and YW conceived the research. ZD, YX, WC, YL, CW, YN, and KZ sampled the fishes. ZD analyzed the data and wrote the paper. All authors contributed to the article and approved the submitted version.
Funding
This research was supported by the National Natural Science Foundation of China (32170480 and 31972866), Chinese Academy of Sciences (Youth Innovation Promotion Association, Chinese Academy of Sciences (http://www.yicas.cn), and the Young Top-notch Talent Cultivation Program of Hubei Province. This research was supported by the Wuhan Branch, Supercomputing Center, Chinese Academy of Sciences, China.
Conflict of interest
The authors declare that the research was conducted in the absence of any commercial or financial relationships that could be construed as a potential conflict of interest.
Publisher’s note
All claims expressed in this article are solely those of the authors and do not necessarily represent those of their affiliated organizations, or those of the publisher, the editors and the reviewers. Any product that may be evaluated in this article, or claim that may be made by its manufacturer, is not guaranteed or endorsed by the publisher.
Supplementary material
The Supplementary Material for this article can be found online at: https://www.frontiersin.org/articles/10.3389/fmars.2023.1168417/full#supplementary-material
References
Abascal F., Zardoya R., Telford M. J. (2010). TranslatorX: multiple alignment of nucleotide sequences guided by amino acid translations. Nucleic Acids Res. 38, W7–W13. doi: 10.1093/nar/gkq291
Allio R., Schomaker-Bastos A., Romiguier J., Prosdocimi F., Nabholz B., Delsuc F. (2020). MitoFinder: efficient automated large-scale extraction of mitogenomic data in target enrichment phylogenomics. Mol. Ecol. Resour. 20, 892–905. doi: 10.1111/1755-0998.13160
Bannikov A., Parin N., Pinna J. (1985). Rhamphexocoetus volans, Gen. et sp. nov. a new beloniform fish (Beloniformes, exocoetoidei) from the lower Eocene of Italy. Voprosy Ikhtiologii 25, 343–346.
Betancur-R R., Ortí G., Pyron R. A. (2015). Fossil-based comparative analyses reveal ancient marine ancestry erased by extinction in ray-finned fishes. Ecol. Lett. 18, 441–450. doi: 10.1111/ele.12423
Broughton R. E., Milam J. E., Roe B. A. (2001). The complete sequence of the zebrafish ( Danio rerio ) mitochondrial genome and evolutionary patterns in vertebrate mitochondrial DNA. Genome Res. 11, 1958–1967. doi: 10.1101/gr.156801
Butler P. J. (2016). The physiological basis of bird flight. Phil. Trans. R. Soc B 371, 20150384. doi: 10.1098/rstb.2015.0384
Capella-Gutierrez S., Silla-Martinez J. M., Gabaldon T. (2009). trimAl: a tool for automated alignment trimming in large-scale phylogenetic analyses. Bioinformatics 25, 1972–1973. doi: 10.1093/bioinformatics/btp348
Chang H., Qiu Z., Yuan H., Wang X., Li X., Sun H., et al. (2020). Evolutionary rates of and selective constraints on the mitochondrial genomes of orthoptera insects with different wing types. Mol. Phylogenet. Evol. 145, 106734. doi: 10.1016/j.ympev.2020.106734
Chatterjee S., Goswami A., Scotese C. R. (2013). The longest voyage: tectonic, magmatic, and paleoclimatic evolution of the Indian plate during its northward flight from gondwana to Asia. Gondwana Res. 23, 238–267. doi: 10.1016/j.gr.2012.07.001
Chatterjee S., Scotese C. (2010). “The wandering Indian plate and its changing biogeography during the late Cretaceous-early tertiary period,” in New aspects of mesozoic biodiversity lecture notes in earth sciences (Berlin, Heidelberg: Springer Berlin Heidelberg), 105–126. doi: 10.1007/978-3-642-10311-7_7
Chauhan T., Rajiv K. (2010). Molecular markers and their applications in fisheries and aquaculture. ABB 01, 281–291. doi: 10.4236/abb.2010.14037
Cui L., Dong Y., Cao R., Gao J., Cen J., Zheng Z., et al. (2018). Mitochondrial genome of the garfish Hyporhamphus quoyi (Beloniformes: hemiramphidae) and phylogenetic relationships within beloniformes based on whole mitogenomes. PloS One 13, e0205025. doi: 10.1371/journal.pone.0205025
Daane J. M., Blum N., Lanni J., Boldt H., Iovine M. K., Higdon C. W., et al. (2021). Modulation of bioelectric cues in the evolution of flying fishes. Curr. Biol. 31, 5052–5061.e8. doi: 10.1016/j.cub.2021.08.054
Darriba D., Taboada G. L., Doallo R., Posada D. (2012). jModelTest 2: more models, new heuristics and parallel computing. Nat. Methods 9, 772–772. doi: 10.1038/nmeth.2109
Dasilao J. C., Sasaki K. (1998). Phylogeny of the flyingfish family exocoetidae (Teleostei, beloniformes). Ichthyol Res. 45, 347–353. doi: 10.1007/BF02725187
Davenport J. (1992). Wing-loading, stability and morphometric relationships in flying fish (Exocoetidae) from the north-eastern Atlantic. J. Mar. Biol. Ass. 72, 25–39. doi: 10.1017/S0025315400048761
Davenport J. (1994). How and why do flying fish fly? Rev. Fish Biol. Fisheries 4, 184–214. doi: 10.1007/BF00044128
Goodman M., Sterner K. N., Islam M., Uddin M., Sherwood C. C., Hof P. R., et al. (2009). Phylogenomic analyses reveal convergent patterns of adaptive evolution in elephant and human ancestries. Proc. Natl. Acad. Sci. U.S.A. 106, 20824–20829. doi: 10.1073/pnas.0911239106
Gu P., Liu W., Yao Y., Ni Q., Zhang M., Li D., et al. (2016). Evidence of adaptive evolution of alpine pheasants to high-altitude environment from mitogenomic perspective. Mitochondrial DNA 27, 455–462. doi: 10.3109/19401736.2014.900667
Hu X., Li H., Lin Y., Wang Z., Feng H., Zhou M., et al. (2022). Genomic deciphering of sex determination and unique immune system of a potential model species rare minnow (Gobiocypris rarus). Sci. Adv. 8, eabl7253. doi: 10.1126/sciadv.abl7253
Iwasaki W., Fukunaga T., Isagozawa R., Yamada K., Maeda Y., Satoh T. P., et al. (2013). MitoFish and MitoAnnotator: a mitochondrial genome database of fish with an accurate and automatic annotation pipeline. Mol. Biol. Evol. 30, 2531–2540. doi: 10.1093/molbev/mst141
Lanfear R., Frandsen P. B., Wright A. M., Senfeld T., Calcott B. (2016). PartitionFinder 2: new methods for selecting partitioned models of evolution for molecular and morphological phylogenetic analyses. Mol. Biol. Evol. 34, 772–773 doi: 10.1093/molbev/msw260
Lewallen E. A., Pitman R. L., Kjartanson S. L., Lovejoy N. R. (2011). Molecular systematics of flyingfishes (Teleostei: exocoetidae): evolution in the epipelagic zone: molecular systematics of flyingfishes. Biol. J. Linn. Soc. 102, 161–174. doi: 10.1111/j.1095-8312.2010.01550.x
Lewallen E. A., van Wijnen A. J., Bonin C. A., Lovejoy N. R. (2018). Flyingfish (Exocoetidae) species diversity and habitats in the eastern tropical pacific ocean. Mar. Biodiv 48, 1755–1765. doi: 10.1007/s12526-017-0666-7
Lovejoy N. R. (2000). Reinterpreting recapitulation: systematics of needlefishes and their allies (Teleostei: beloniformes). Evolution 54, 1349–1362. doi: 10.1111/j.0014-3820.2000.tb00567.x
Lovejoy N. R. (2004). Phylogeny and jaw ontogeny of beloniform fishes. Integr. Comp. Biol. 44, 366–377. doi: 10.1093/icb/44.5.366
Lü Z., Zhu K., Liu L., Liu B., Jiang L., Gong L. (2018). Phylogenetic analysis of the complete mitochondrial genome of hyporhamphus limbatus (Beloniformes; hemiramphidae). Mitochondrial DNA Part B 3, 1292–1293. doi: 10.1080/23802359.2018.1532342
Ma X., Kang J., Chen W., Zhou C., He S. (2015). Biogeographic history and high-elevation adaptations inferred from the mitochondrial genome of glyptosternoid fishes (Sisoridae, siluriformes) from the southeastern Tibetan plateau. BMC Evol. Biol. 15, 233. doi: 10.1186/s12862-015-0516-9
Meynard C. N., Mouillot D., Mouquet N., Douzery E. J. P. (2012). A phylogenetic perspective on the evolution of Mediterranean teleost fishes. PloS One 7, e36443. doi: 10.1371/journal.pone.0036443
Minxiao W., Song S., Chaolun L., Xin S. (2011). Distinctive mitochondrial genome of calanoid copepod calanus sinicus with multiple large non-coding regions and reshuffled gene order: useful molecular markers for phylogenetic and population studies. BMC Genomics 12, 73. doi: 10.1186/1471-2164-12-73
Near T. J., Dornburg A., Eytan R. I., Keck B. P., Smith W. L., Kuhn K. L., et al. (2013). Phylogeny and tempo of diversification in the superradiation of spiny-rayed fishes. Proc. Natl. Acad. Sci. U.S.A. 110, 12738–12743. doi: 10.1073/pnas.1304661110
Near T. J., Eytan R. I., Dornburg A., Kuhn K. L., Moore J. A., Davis M. P., et al. (2012). Resolution of ray-finned fish phylogeny and timing of diversification. Proc. Natl. Acad. Sci. U.S.A. 109, 13698–13703. doi: 10.1073/pnas.1206625109
Nichols J. T., Breder C. (1928). An annotated list of the synentognathi with remarks on their development and relationships. Zoologica (NY) 8, 423–448. doi: 10.5962/p.184694
Ning T., Xiao H., Li J., Hua S., Zhang Y. P. (2010). Adaptive evolution of the mitochondrial ND6 gene in the domestic horse. Genet. Mol. Res. 9, 144–150. doi: 10.4238/vol9-1gmr705
Park H., Choi H. (2010). Aerodynamic characteristics of flying fish in gliding flight. J. Exp. Biol. 213, 3269–3279. doi: 10.1242/jeb.046052
Pond S. L. K., Frost S. D. W., Muse S. V. (2005). HyPhy: hypothesis testing using phylogenies. Bioinformatics 21, 676–679. doi: 10.1093/bioinformatics/bti079
Rabosky D. L., Chang J., Title P. O., Cowman P. F., Sallan L., Friedman M., et al. (2018). An inverse latitudinal gradient in speciation rate for marine fishes. Nature 559, 392–395. doi: 10.1038/s41586-018-0273-1
Rabosky D. L., Santini F., Eastman J., Smith S. A., Sidlauskas B., Chang J., et al. (2013). Rates of speciation and morphological evolution are correlated across the largest vertebrate radiation. Nat. Commun. 4, 1958. doi: 10.1038/ncomms2958
Rambaut A., Drummond A. J., Xie D., Baele G., Suchard M. A. (2018). Posterior summarization in Bayesian phylogenetics using tracer 1.7. Systematic Biol. 67, 901–904. doi: 10.1093/sysbio/syy032
R Core Team (2022). R: a language and environment for statistical computing (Vienna, Austria: R Foundation for Statistical Computing). Available at: https://www.R-project.org/.
Ronquist F., Teslenko M., van der Mark P., Ayres D. L., Darling A., Höhna S., et al. (2012). MrBayes 3.2: efficient Bayesian phylogenetic inference and model choice across a Large model space. Systematic Biol. 61, 539–542. doi: 10.1093/sysbio/sys029
Saitoh K., Sado T., Mayden R. L., Hanzawa N., Nakamura K., Nishida M., et al. (2006). Mitogenomic evolution and interrelationships of the cypriniformes (Actinopterygii: ostariophysi): the first evidence toward resolution of higher-level relationships of the world’s largest freshwater fish clade based on 59 whole mitogenome sequences. J. Mol. Evol. 63, 826–841. doi: 10.1007/s00239-005-0293-y
Sanciangco M. D., Carpenter K. E., Betancur-R. R. (2016). Phylogenetic placement of enigmatic percomorph families (Teleostei: percomorphaceae). Mol. Phylogenet. Evol. 94, 565–576. doi: 10.1016/j.ympev.2015.10.006
Schoch C. L., Ciufo S., Domrachev M., Hotton C. L., Kannan S., Khovanskaya R., et al. (2020). NCBI taxonomy: a comprehensive update on curation, resources and tools. Database 2020, baaa062. doi: 10.1093/database/baaa062
Shen Y.-Y., Liang L., Zhu Z.-H., Zhou W.-P., Irwin D. M., Zhang Y.-P. (2010). Adaptive evolution of energy metabolism genes and the origin of flight in bats. Proc. Natl. Acad. Sci. U.S.A. 107, 8666–8671. doi: 10.1073/pnas.0912613107
Stamatakis A. (2014). RAxML version 8: a tool for phylogenetic analysis and post-analysis of large phylogenies. Bioinformatics 30, 1312–1313. doi: 10.1093/bioinformatics/btu033
Stanley S. E., Harrison R. G. (1999). Cytochrome b evolution in birds and mammals: an evaluation of the avian constraint hypothesis. Mol. Biol. Evol. 16, 1575–1585. doi: 10.1093/oxfordjournals.molbev.a026070
Strohm J. H. T., Gwiazdowski R. A., Hanner R. (2015). Fast fish face fewer mitochondrial mutations: patterns of dN/dS across fish mitogenomes. Gene 572, 27–34. doi: 10.1016/j.gene.2015.06.074
Sun S., Li Q., Kong L., Yu H. (2017). Limited locomotive ability relaxed selective constraints on molluscs mitochondrial genomes. Sci. Rep. 7, 10628. doi: 10.1038/s41598-017-11117-z
Sun Y.-B., Shen Y.-Y., Irwin D. M., Zhang Y.-P. (2011). Evaluating the roles of energetic functional constraints on teleost mitochondrial-encoded protein evolution. Mol. Biol. Evol. 28, 39–44. doi: 10.1093/molbev/msq256
Tan W., Liu J., Wang Y., Liu H., Ke H., Fan J., et al. (2019). Complete mitochondrial genome of buffon’s river garfish Zenarchopterus buffonis (Valenciennes 1847). Mitochondrial DNA Part B 4, 2001–2002. doi: 10.1080/23802359.2019.1617087
Toyama T., Kawai T., Imamura H. (2020). Phylogenetic systematics of the needlefishes (Beloniformes: belonidae). Natural History Museum
Wang Y., Shen Y., Feng C., Zhao K., Song Z., Zhang Y., et al. (2016). Mitogenomic perspectives on the origin of Tibetan loaches and their adaptation to high altitude. Sci. Rep. 6, 29690. doi: 10.1038/srep29690
Wang Y., Xiong F., Song Z. (2022). Molecular phylogeny and adaptive mitochondrial DNA evolution of salmonids (Pisces: salmonidae). Front. Genet. 13. doi: 10.3389/fgene.2022.903240
Xia X. (2018). DAMBE7: new and improved tools for data analysis in molecular biology and evolution. Mol. Biol. Evol. 35, 1550–1552. doi: 10.1093/molbev/msy073
Xia X., Xie Z., Salemi M., Chen L., Wang Y. (2003). An index of substitution saturation and its application. Mol. Phylogenet. Evol. 26, 1–7. doi: 10.1016/S1055-7903(02)00326-3
Xu G.-H., Zhao L.-J., Shen C.-C. (2015). A middle Triassic thoracopterid from China highlights the evolutionary origin of overwater gliding in early ray-finned fishes. Biol. Lett. 11, 20140960. doi: 10.1098/rsbl.2014.0960
Yamahira K., Ansai S., Kakioka R., Yaguchi H., Kon T., Montenegro J., et al. (2021). Mesozoic origin and ‘out-of-India’ radiation of ricefishes (Adrianichthyidae). Biol. Lett. 17, 20210212. doi: 10.1098/rsbl.2021.0212
Yamahira K., Fujimoto S., Takami Y. (2022). Earth and life evolve together from something ancestral–reply to britz et al. Biol. Lett. 18, 20220010. doi: 10.1098/rsbl.2022.0010
Yang Z. (2005). Bayes empirical bayes inference of amino acid sites under positive selection. Mol. Biol. Evol. 22, 1107–1118. doi: 10.1093/molbev/msi097
Yang Z. (2007). PAML 4: phylogenetic analysis by maximum likelihood. Mol. Biol. Evol. 24, 1586–1591. doi: 10.1093/molbev/msm088
Yang Y., Xu S., Xu J., Guo Y., Yang G. (2014). Adaptive evolution of mitochondrial energy metabolism genes associated with increased energy demand in flying insects. PloS One 9, e99120. doi: 10.1371/journal.pone.0099120
Yonezawa T., Hasegawa M., Zhong Y. (2014). Polyphyletic origins of schizothoracine fish (Cyprinidae, Osteichthyes) and adaptive evolution in their mitochondrial genomes. Genes Genet. Syst. 89, 187–191. doi: 10.1266/ggs.89.187
Zhang D., Gao F., Jakovlić I., Zou H., Zhang J., Li W. X., et al. (2020). PhyloSuite: an integrated and scalable desktop platform for streamlined molecular sequence data management and evolutionary phylogenetics studies. Mol. Ecol. Resour 20, 348–355. doi: 10.1111/1755-0998.13096
Zhang S., Han J., Zhong D., Wang T. (2013). Analysis of selective constraints on mitochondrial DNA, Flight ability and physiological index on avian. in 2013 35th Annual International Conference of the IEEE Engineering in Medicine and Biology Society (EMBC) (IEEE). 1498–1501. doi: 10.1109/EMBC.2013.6609796
Zhang Q.-L., Zhang L., Zhao T.-X., Wang J., Zhu Q.-H., Chen J.-Y., et al. (2017). Gene sequence variations and expression patterns of mitochondrial genes are associated with the adaptive evolution of two gynaephora species (Lepidoptera: lymantriinae) living in different high-elevation environments. Gene 610, 148–155. doi: 10.1016/j.gene.2017.02.014
Keywords: flying fishes, mitochondrial DNA, divergence time, selective constraints, adaption
Citation: Ding Z, Xu Y, Chen W, Liu Y, Wang C, Niu Y, Zhang K, Wang Y and Yang L (2023) Stronger selective constraints on the mitochondrial genome in flying fishes. Front. Mar. Sci. 10:1168417. doi: 10.3389/fmars.2023.1168417
Received: 17 February 2023; Accepted: 21 April 2023;
Published: 01 May 2023.
Edited by:
Anna Rita Rossi, Sapienza University of Rome, ItalyReviewed by:
Geng Qin, South China Sea Institute of Oceanology (CAS), ChinaGuang-Hui Xu, Institute of Vertebrate Paleontology and Paleoanthropology (CAS), China
Copyright © 2023 Ding, Xu, Chen, Liu, Wang, Niu, Zhang, Wang and Yang. This is an open-access article distributed under the terms of the Creative Commons Attribution License (CC BY). The use, distribution or reproduction in other forums is permitted, provided the original author(s) and the copyright owner(s) are credited and that the original publication in this journal is cited, in accordance with accepted academic practice. No use, distribution or reproduction is permitted which does not comply with these terms.
*Correspondence: Ying Wang, eGlueXVhbndhbmd5aW5nQDE2My5jb20=; Liandong Yang, eWFuZ2xpYW5kb25nMTk4N0AxNjMuY29t