 Junling Li
 Kang Xu
 Weiqiang Wang1*
 Zhuoqi He
 Ke Huang
94% of researchers rate our articles as excellent or good
Learn more about the work of our research integrity team to safeguard the quality of each article we publish.
Find out more
ORIGINAL RESEARCH article
Front. Mar. Sci., 17 April 2023
Sec. Physical Oceanography
Volume 10 - 2023 | https://doi.org/10.3389/fmars.2023.1168385
This article is part of the Research TopicMulti-Scale Ocean Dynamical Processes and Their Climatic, Ecological and Sedimentological Effects in the Eastern Indian OceanView all 19 articles
We assessed the performance of state-of-the-art coupled models in reproducing the equatorial undercurrent (EUC) in the Indian Ocean based on the outputs of the Coupled Model Intercomparison Project Phase 6 (CMIP6) models and compared with the Phase 5 (CMIP5) models. Our results showed that the CMIP6 models reproduced the boreal winter–spring Indian Ocean EUC more realistically than the CMIP5 models, although both generations of models underestimated the strength of the Indian Ocean EUC compared with the observations. This underestimation of the Indian Ocean EUC can be attributed to the excessively strong and westward-extended cold tongue in the equatorial Pacific. In the CMIP models, a stronger winter-mean cold tongue favors a stronger zonal sea surface temperature gradient, which forces a strong easterly wind bias over the equatorial western Pacific. This, in turn, contributes to an acceleration of the Walker circulation. This enhanced Walker circulation over the Indo-Pacific Ocean directly causes a lower level westerly wind bias over the equatorial Indian Ocean and drives a shallow west–deep east thermocline tilt bias, ultimately leading to an excessively weak EUC in the Indian Ocean via wind-induced thermocline processes. Compared with the CMIP5 models, the overall improvement in the strength of the winter–spring Indian Ocean EUC in the CMIP6 models can be traced back to the improvement in the degree of the strong and westward-extended cold tongue bias. Our results suggest that efforts should be made to reduce the bias in the mean-state equatorial Pacific sea surface temperature to further improve the simulation and projection of the atmospheric and oceanic circulations in the Indian Ocean.
The subsurface of the equatorial Indian Ocean (EIO) is as energetic as its surface. The subsurface of the EIO is characterized by a vigorous eastward current, known as the equatorial undercurrent (EUC) in the boreal winter–spring, particularly in February–March–April (FMA), and in the boreal summer–fall in August–September–October (ASO) (Iskandar et al., 2009; Chen et al., 2015; Gnanaseelan and Deshpande, 2018). The EUC in the Pacific and Atlantic Oceans is seen throughout the year as a result of the quasi-permanent eastward pressure gradient forced by the prevailing easterly trade winds (Metcalf and Stalcup, 1967; Mcphaden, 1986; Izumo, 2005). By contrast, the EUC is a transient feature in the Indian Ocean and is associated with the seasonally varying component of the surface winds (Knauss and Taft, 1964; Bruce, 1973; Schott and McCreary, 2001; Chen et al., 2015). This transient and energetic EUC can modulate the variations in the volume transport and heat content of the EIO (Reppin et al., 1999; Nyadjro and McPhaden, 2014), which significantly influences the regional energy balance and global climate change through basin wave dynamics and air–sea thermodynamics (Schott and McCreary, 2001; Thompson et al., 2006; Godfrey et al., 2007; Schott et al., 2009; Wang and Dong, 2015; Huang et al., 2018).
Previous studies have indicated that the eastward EUC in the Indian Ocean shows a remarkable semiannual variability (Knauss and Taft, 1964; Schott et al., 2009; Phillips et al., 2021). The winter–spring EUC is caused by the eastward pressure gradient in the thermocline, which is closely associated with the upwelling equatorial Kelvin waves excited by the prevailing easterly winds, whereas the summer–fall EUC is attributed to both wind-driven equatorial Kelvin waves and Rossby waves reflected from the eastern boundary (Iskandar et al., 2009). This transient feature of the EUC also determines the semiannual variations of zonal volume transport in the EIO, with the maximum eastward subsurface transport occurring in April and October (Nyadjro and McPhaden, 2014). The EUC shows a remarkable interannual variability and is significantly modulated by the Indian Ocean dipole (IOD) (Nagura and McPhaden, 2010; Zhang et al., 2014; Sachidanandan et al., 2017). Gnanaseelan and Deshpande (2018) showed that the enhancement and eastward extension of the EUC during strong IOD events could intensify and maintain the IOD through the intensification of oceanic responses.
Coupled general circulation models (CGCMs) participating in the Coupled Model Intercomparison Project (CMIP) are effective tools for understanding the variabilities of oceanic and atmospheric circulations and projecting their associated climate changes under global warming. Unfortunately, most of the state-of-the-art CMIP models suffer from serious errors in simulating climate variability in the Pacific and Atlantic Oceans, including an excessive equatorial cold tongue bias in the Pacific Ocean (Li et al., 2016a; Ying et al., 2019; Jiang et al., 2020; Li et al., 2021), a basin-wide shallow thermocline bias in the southern tropical Pacific (Samuels et al., 2021), a spurious double intertropical convergence zone caused by the meridional pattern of the sea surface temperature (SST) bias over the tropical Pacific and Atlantic (Li and Xie, 2012; Li and Xie, 2014; Wang et al., 2014; Siongco et al., 2015; Samanta et al., 2019; Zhou et al., 2020), a weak zonal SST gradient along the equatorial Atlantic Ocean (Kozar and Misra, 2013; Liu et al., 2013), and a weak subtropical cell in the southern Atlantic Ocean (Fu et al., 2022).
Similarly, many CGCMs also show large biases in simulating the climate variability of the tropical Indian Ocean (TIO) (Cai and Cowan, 2013; Shashikanth et al., 2014; Li et al., 2016b; Cai et al., 2018; Long et al., 2020; Cai et al., 2021). The common easterly wind biases over the EIO (Cai and Cowan, 2013; Lee et al., 2013) can deepen the South Indian Ocean thermocline dome and suppress its related effects on the SST in the CMIP Phase 5 (CMIP5) models (Li et al., 2015b; Zheng et al., 2016). Levine et al. (2013) suggested that the excessively cold SST bias simulated in the northern Indian Ocean by CGCMs could enhance the Indian winter monsoon circulations and maintain them until the spring and summer seasons, which could significantly weaken the subsequent Indian summer monsoon rainfall (Sandeep and Ajayamohan, 2014; Wang et al., 2018). Li et al. (2015a) identified an IOD-like bias pattern in the CMIP5 models, with a strong equatorial easterly wind bias accompanied by physically consistent biases in precipitation, SSTs and subsurface ocean temperatures, which resulted from biases in the South Asian summer monsoon. Liu et al. (2016) also found that the Wyrtki jet simulated by most of the CMIP5 models is delayed by one month compared with the observations, primarily due to the late onset of westerly winds.
Many studies have reported simulation errors in the atmospheric and oceanic circulations over the TIO in CGCMs, but little attention has been paid to the performance of CGCMs in reproducing the subsurface oceanic circulation, especially the EUC in the Indian Ocean. The simulation of the Indian Ocean EUC might be influenced by the large biases in the surface atmospheric circulations. Recently, the outputs from the latest climate system models for the CMIP Phase 6 (CMIP6) models have been released (Eyring et al., 2016), and CMIP6 models have been improved in comparison to CMIP5 models in terms of the resolution in the atmosphere and ocean, the dynamic core and the model physics (Wu et al., 2019; McKenna et al., 2020; Wyser et al., 2020). Given the importance of the Indian Ocean EUC, we addressed the following questions: how well do the CMIP5 and CMIP6 models simulate the Indian Ocean EUC; do the CMIP6 models have higher skills in simulating the Indian Ocean EUC than the CMIP5 models; and, if so, what processes are responsible for the improvements?
The remainder of this paper is organized as follows. Section 2 introduces the datasets and methods. Section 3 demonstrates the biases in simulating the boreal winter–spring Indian Ocean EUC among the CMIP5 and CMIP6 models. The origins of the simulated Indian Ocean EUC biases from CMIP models are explored in Section 4. Section 5 compares the performance of the winter–spring Indian Ocean EUC between the CMIP5 and CMIP6 models. Summary and discussion are given in Section 6.
The monthly-mean outputs of the historical runs from 23 CMIP5 (Taylor et al., 2012) and 25 CMIP6 models (Eyring et al., 2016) were used in this study. Tables 1, 2 show the model names, modeling holders, used ocean model names, horizontal resolutions, and number of vertical levels in each of the CMIP5 and CMIP6 models (see also http://www-pcmdi.llnl.gov). Since some models contain multiple realizations in their historical runs, we only analyzed the first realization member (r1i1p1 for CMIP5 and r1i1p1f1 for CMIP6) run of each model, with the exception of the HadGEM3-GC31-LL (r1i1p1f3) and UKESM1-0-LL (r1i1p1f2) models in CMIP6. The monthly-mean three-dimensional ocean currents, ocean potential temperature, SST, and atmospheric winds for the period of 1970–2005 and 1979–2014 were extracted from the historical runs of the CMIP5 and CMIP6 models, respectively.
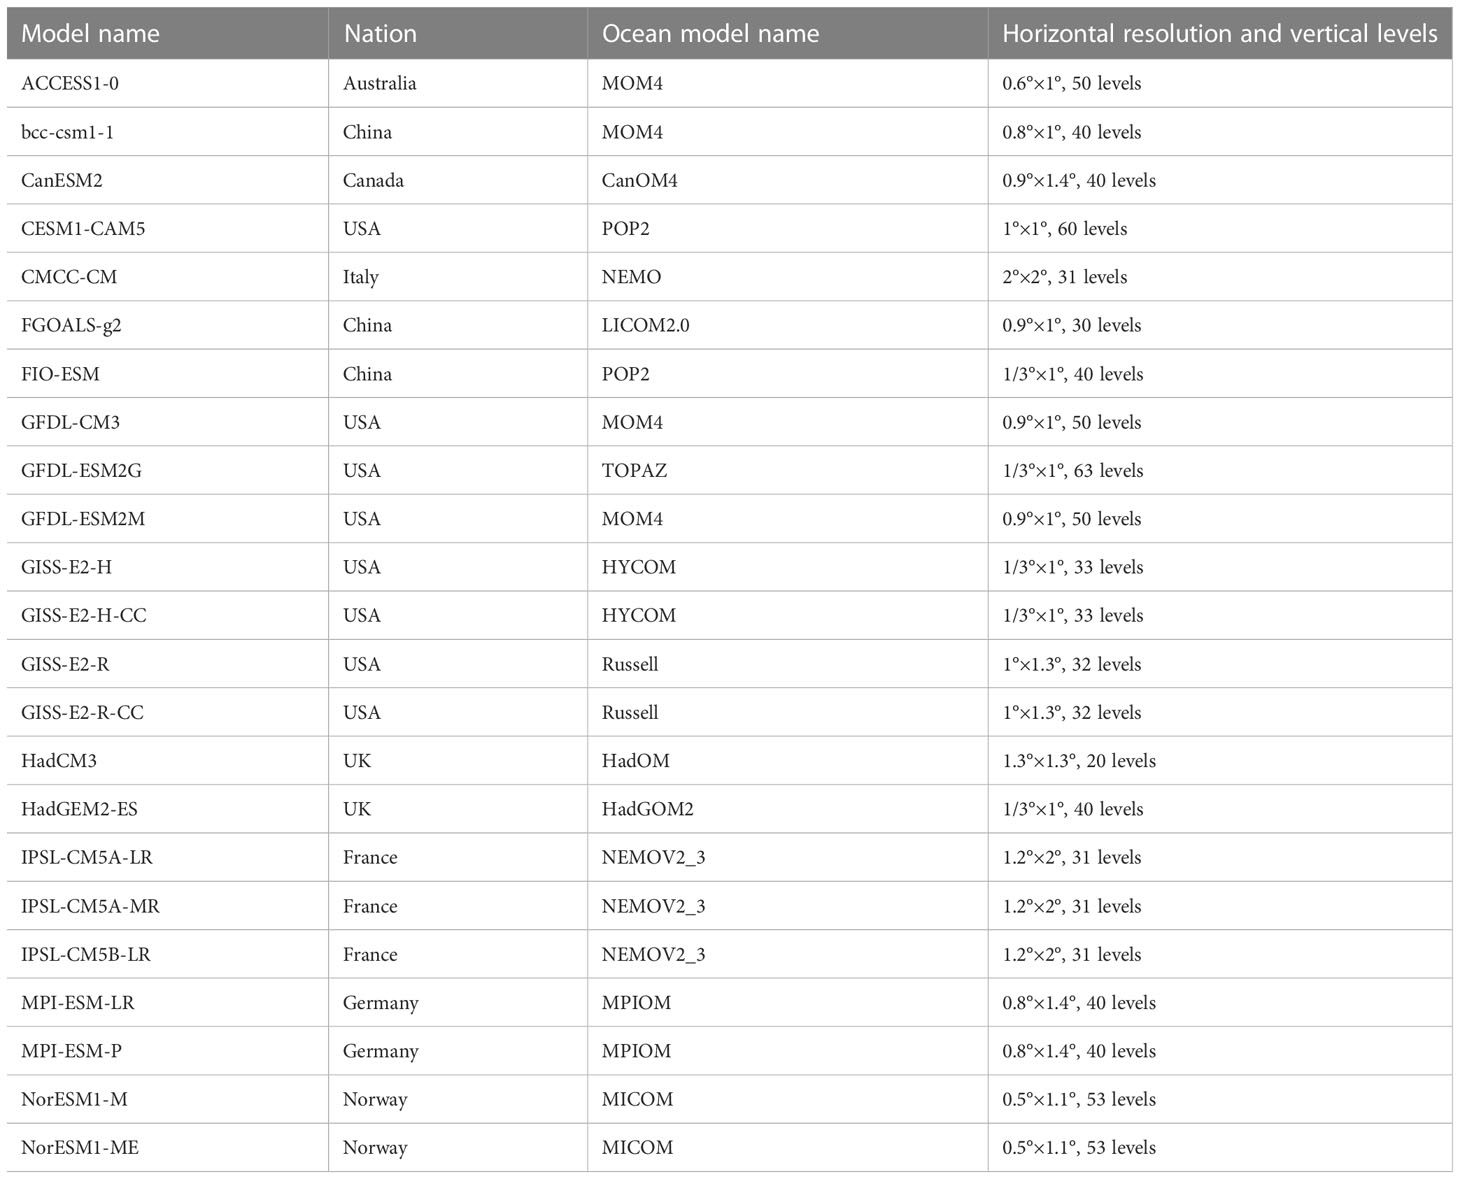
Table 1 Basic information of the 23 CMIP5 coupled models used in this study.
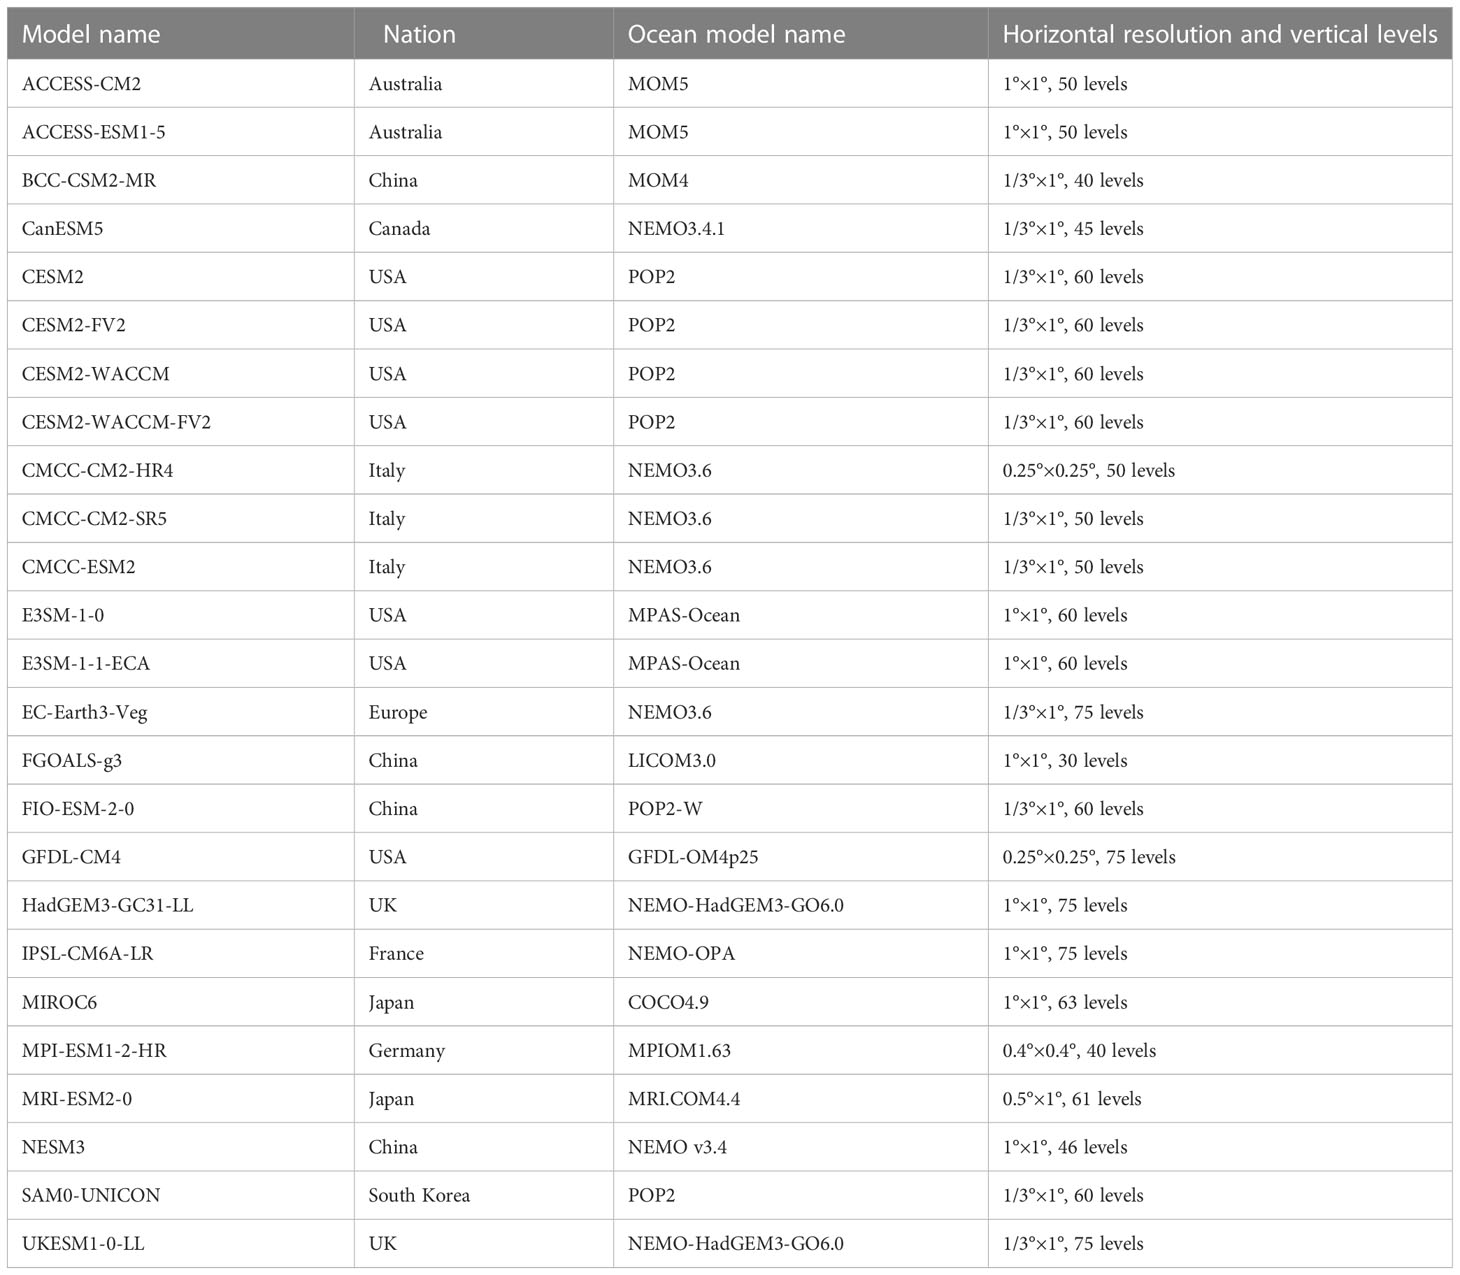
Table 2 Basic information of the 25 CMIP6 coupled models used in this study.
For comparison, we also used the observational and reanalysis datasets (for simplicity, both referred to as observations). Specifically, the monthly-mean ocean currents and ocean potential temperature were obtained from the Simple Ocean Data Assimilation (SODA version 3.4.2; Carton and Giese, 2008) reanalysis products, with a horizontal resolution of 0.5°×0.5° and 50 vertical levels. To validate the results from the SODA3.4.2, the zonal current data from the European Centre for Medium-Range Weather Forecasts (ECMWF) Ocean Reanalysis System 4 (ORAS4; Balmaseda et al., 2013) and the Global Ocean Data Assimilation System (GODAS; Behringer and Xue, 2004) were utilized. The monthly SST data used in this study were extracted from the Hadley Centre Global Sea Ice and Sea Surface Temperature (HadISST version 1.1; Rayner et al., 2003) analysis dataset with a horizontal resolution of 1°×1°. The observed monthly atmospheric variables were taken from the National Centers for Environmental Prediction/National Center for Atmospheric Research (NCEP/NCAR) reanalysis with a horizontal resolution of 2.5°×2.5° and 17 standard isobaric surfaces (Kalnay et al., 1996). The analysis period of the above observed datasets covers the year 1982–2017.
All the model outputs and observational data were first interpolated onto a uniform spatial grid of 1°×1° horizontal resolution using bilinear interpolation before analysis. The Taylor diagram (Taylor, 2001) was applied to investigate the simulation performance among the CMIP models, which is an advanced method to express the skill level of models by representing the correlation coefficient, standard deviation, and root-mean-square difference between the models and reference datasets (Lee et al., 2013). The multi-model ensemble-mean (MME) was calculated as the simple average of the results from all the selected models. The MME bias was defined as the difference between the results from the ensemble-mean of the CMIP models and the observations. We also used the intermodel consistency to evaluate the robustness of the MME bias. For the intermodel consistency to attain the 95% significance test, >70% of the models need to produce the same change in the bias sign for a particular variable based on a binomial distribution (Power et al., 2013; Xu et al., 2017). All the statistical significance tests of the differences were carried out using a two-tailed Student’s t-test.
The EUC in the Indian Ocean, which exhibits significant semiannual variability, occurs regularly in the winter–spring across the entire EIO basin and primarily occupies the western EIO in the summer–fall (Iskandar and McPhaden, 2011; Chen et al., 2015; Chen et al., 2019). To evaluate the performance of the CMIP5 and CMIP6 models in simulating the Indian Ocean EUC, Figure 1 gives the climatological area-averaged zonal currents over the central EIO (2° S–2° N, 60–90° E) in the observations, the CMIP5 MME, and the CMIP6 MME. In observations, the subsurface zonal current captures a transient phenomenon of the typical Indian Ocean EUC, with the eastward undercurrent appearing during FMA and ASO. Note that the EUC is generally confined between 60 and 150 m depth in the upper Indian Ocean and its associated core depth is near the 20°C isotherm depth (D20) within the thermocline (Figure 1A). As a result of the downward propagation of equatorial wave energy (Reppin et al., 1999; Chen et al., 2015), the surface eastward Wyrtki jet emerges as the EUC weakens and disappears, characterized by a clear upward phase propagation (Figure 1A).
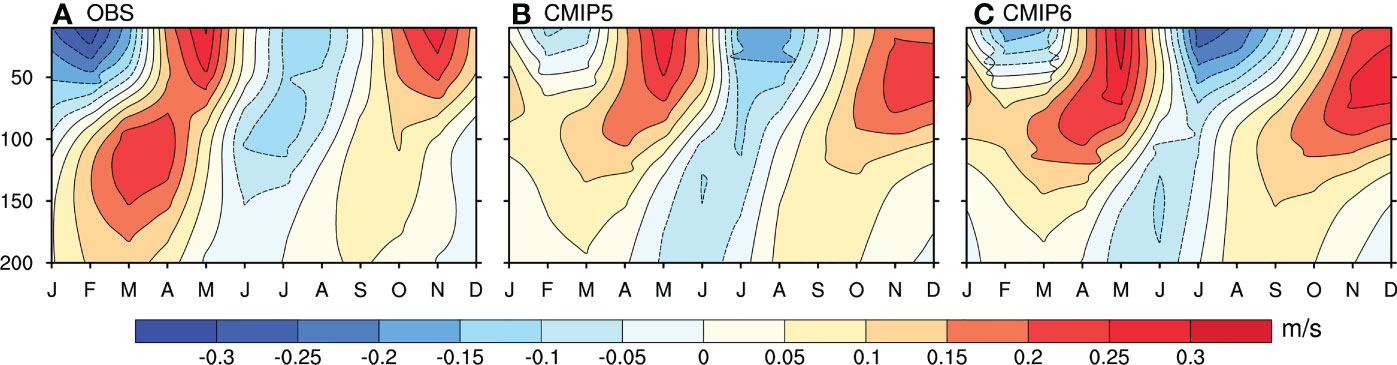
Figure 1 Time–depth cross-section of the climatological zonal currents (units: m/s) averaged over the central EIO (60°–90° E, 2° S–2° N) in the (A) observations, (B) the MME of 23 CMIP5 models, and (C) the MME of 25 CMIP6 models.
Although the two generations of models roughly reproduce the spatial pattern and phase-locking of the Indian Ocean EUC, there still exist some biases in the strength of the EUC, with a significantly weaker winter–spring EUC and a slightly stronger summer–fall EUC in the CMIP models relative to the observations (Figures 1B, C), suggesting that the biases in the EUC strength simulated by the CMIP models are more significant in winter–spring. In addition to the intensity bias, the winter–spring EUC in the CMIP5 and CMIP6 models is at a shallower depth than the observations, which might be associated with the strength of the surface easterly winds simulated by the CMIP models. These biases in the winter–spring Indian Ocean EUC are slightly improved in the CMIP6 MME compared with the CMIP5 MME, but are still significant. The other ocean reanalysis products (i.e., ORAS4 and GODAS) are also able to reproduce the reasonable subsurface zonal currents in the EIO with reference to the SODA3.4.2 data, indicating that the underestimated winter–spring EUC biases are robust in both the CMIP5 and CMIP6 models.
Figure 2 shows the horizontal distributions of the FMA mean Indian Ocean EUC in the observations and its associated biases in the CMIP5 and CMIP6 models. The EUC core depth averaged from 60 to 150 m shows that the winter–spring EUC is characterized by a remarkable eastward zonal current with a maximum velocity of +0.35 m/s (Figure 2A), which can extend to the eastern EIO. However, a significant westward subsurface current bias in the EIO is clearly seen in both the CMIP5 and CMIP6 MMEs (Figures 2B, C). For the CMIP5 models, such reduced EUC signals with the intermodel consistency >70% are positioned in the central-eastern EIO around 2° S–2° N, 50–95° E (Figure 2B), suggesting that these biases in the underestimated winter–spring EUC in the CMIP5 models are robust. There is still a reduced winter–spring EUC in the CMIP6 MME, but the simulation skill with respect to the EUC pattern is improved in the CMIP6 models relative to that in the CMIP5 models as a result of a relatively weaker westward subsurface current bias (Figure 2C). Notable differences in the EIO subsurface zonal current between the CMIP6 and CMIP5 models (Figure 2D) also confirm that the simulated winter–spring EUC in the CMIP6 models is much closer to the observations, highlighting an overall improvement in the Indian Ocean EUC from the CMIP5 to CMIP6 models.
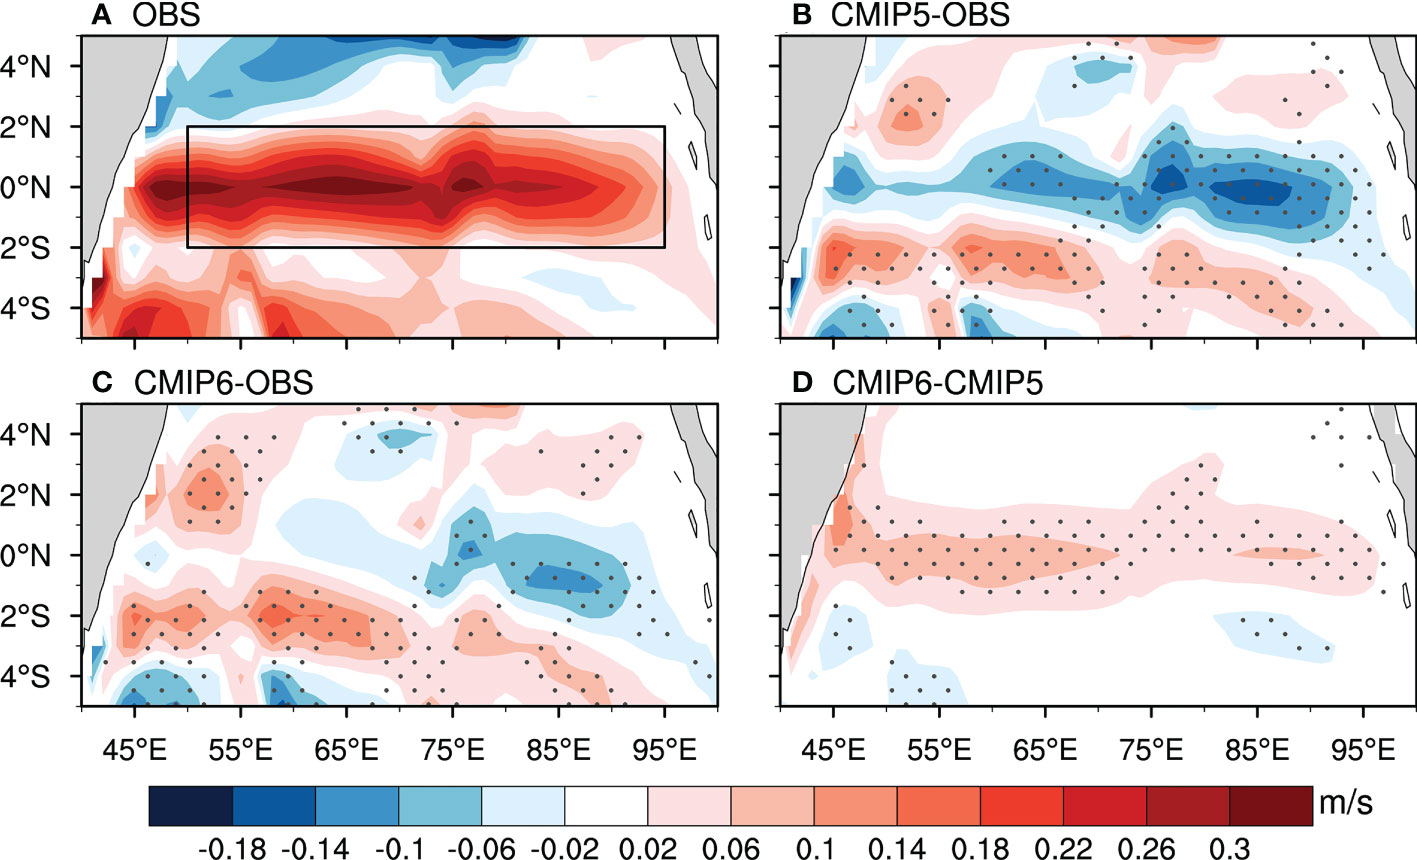
Figure 2 (A) FMA mean observed subsurface (averaged from 60 to 150 m) zonal current (units: m/s) over the EIO from the SODA 3.4.2 dataset. The black box denotes the domain of the Indian Ocean EUC (2° S–2° N, 50–95° E). The MME biases of the EIO subsurface zonal currents in the (B) CMIP5 and (C) CMIP6 models, the gray dots denote locations over which >70% of models agree on the same sign of subsurface zonal current bias. (D) Difference in the EIO subsurface zonal current between the CMIP6 and CMIP5 models; the gray dots indicate signals that are statistically significant at the 90% confidence level.
To delineate the performance of the CMIP5 and CMIP6 models in capturing the winter–spring EUC, the Taylor diagram in Figure 3 shows a statistical comparison with the observations for the FMA mean subsurface zonal current over the TIO (5° S–5° N, 40–100° E). It is clear that the spatial correlations between the simulations and observations are greater than +0.60, indicating that the CMIP models are able to simulate the FMA mean EUC well. Their MMEs are better than almost all the individual models in simulating the winter–spring EUC climatology. Despite the fact that the correlation coefficient (+0.88) between the CMIP6 MME and the observations is almost identical to that (+0.82) for the CMIP5 MME, it is clear that the correlation coefficients in most of the CMIP6 models are higher than those in the CMIP5 models, suggesting that there is an improvement in the CMIP6 models in the simulated winter–spring Indian Ocean EUC pattern. However, the spatial standard deviations of the simulated EUC are still smaller in most of the CMIP models compared with the observations, indicating that there is a significant strength bias in the Indian Ocean EUC in the CMIP5 and CMIP6 models despite the overall good performance of the CMIP models in simulating the winter–spring Indian Ocean EUC pattern. Twenty of the 23 CMIP5 models (87%) and 18 of the 25 (72%) CMIP6 models significantly underestimate the magnitudes of the winter–spring EUC relative to the observations, implying that the winter–spring EUC is slightly better simulated in the CMIP6 models. This is because some of the CMIP6 models capture the large amplitude of the Indian Ocean EUC. These results suggest that most of the CMIP models show a weak winter–spring EUC in the Indian Ocean and that the simulated EUC pattern in the CMIP6 MME is much closer to the observations than that in the CMIP5 MME. The strength biases in the CMIP6 models are significantly reduced relative to the CMIP5 models.
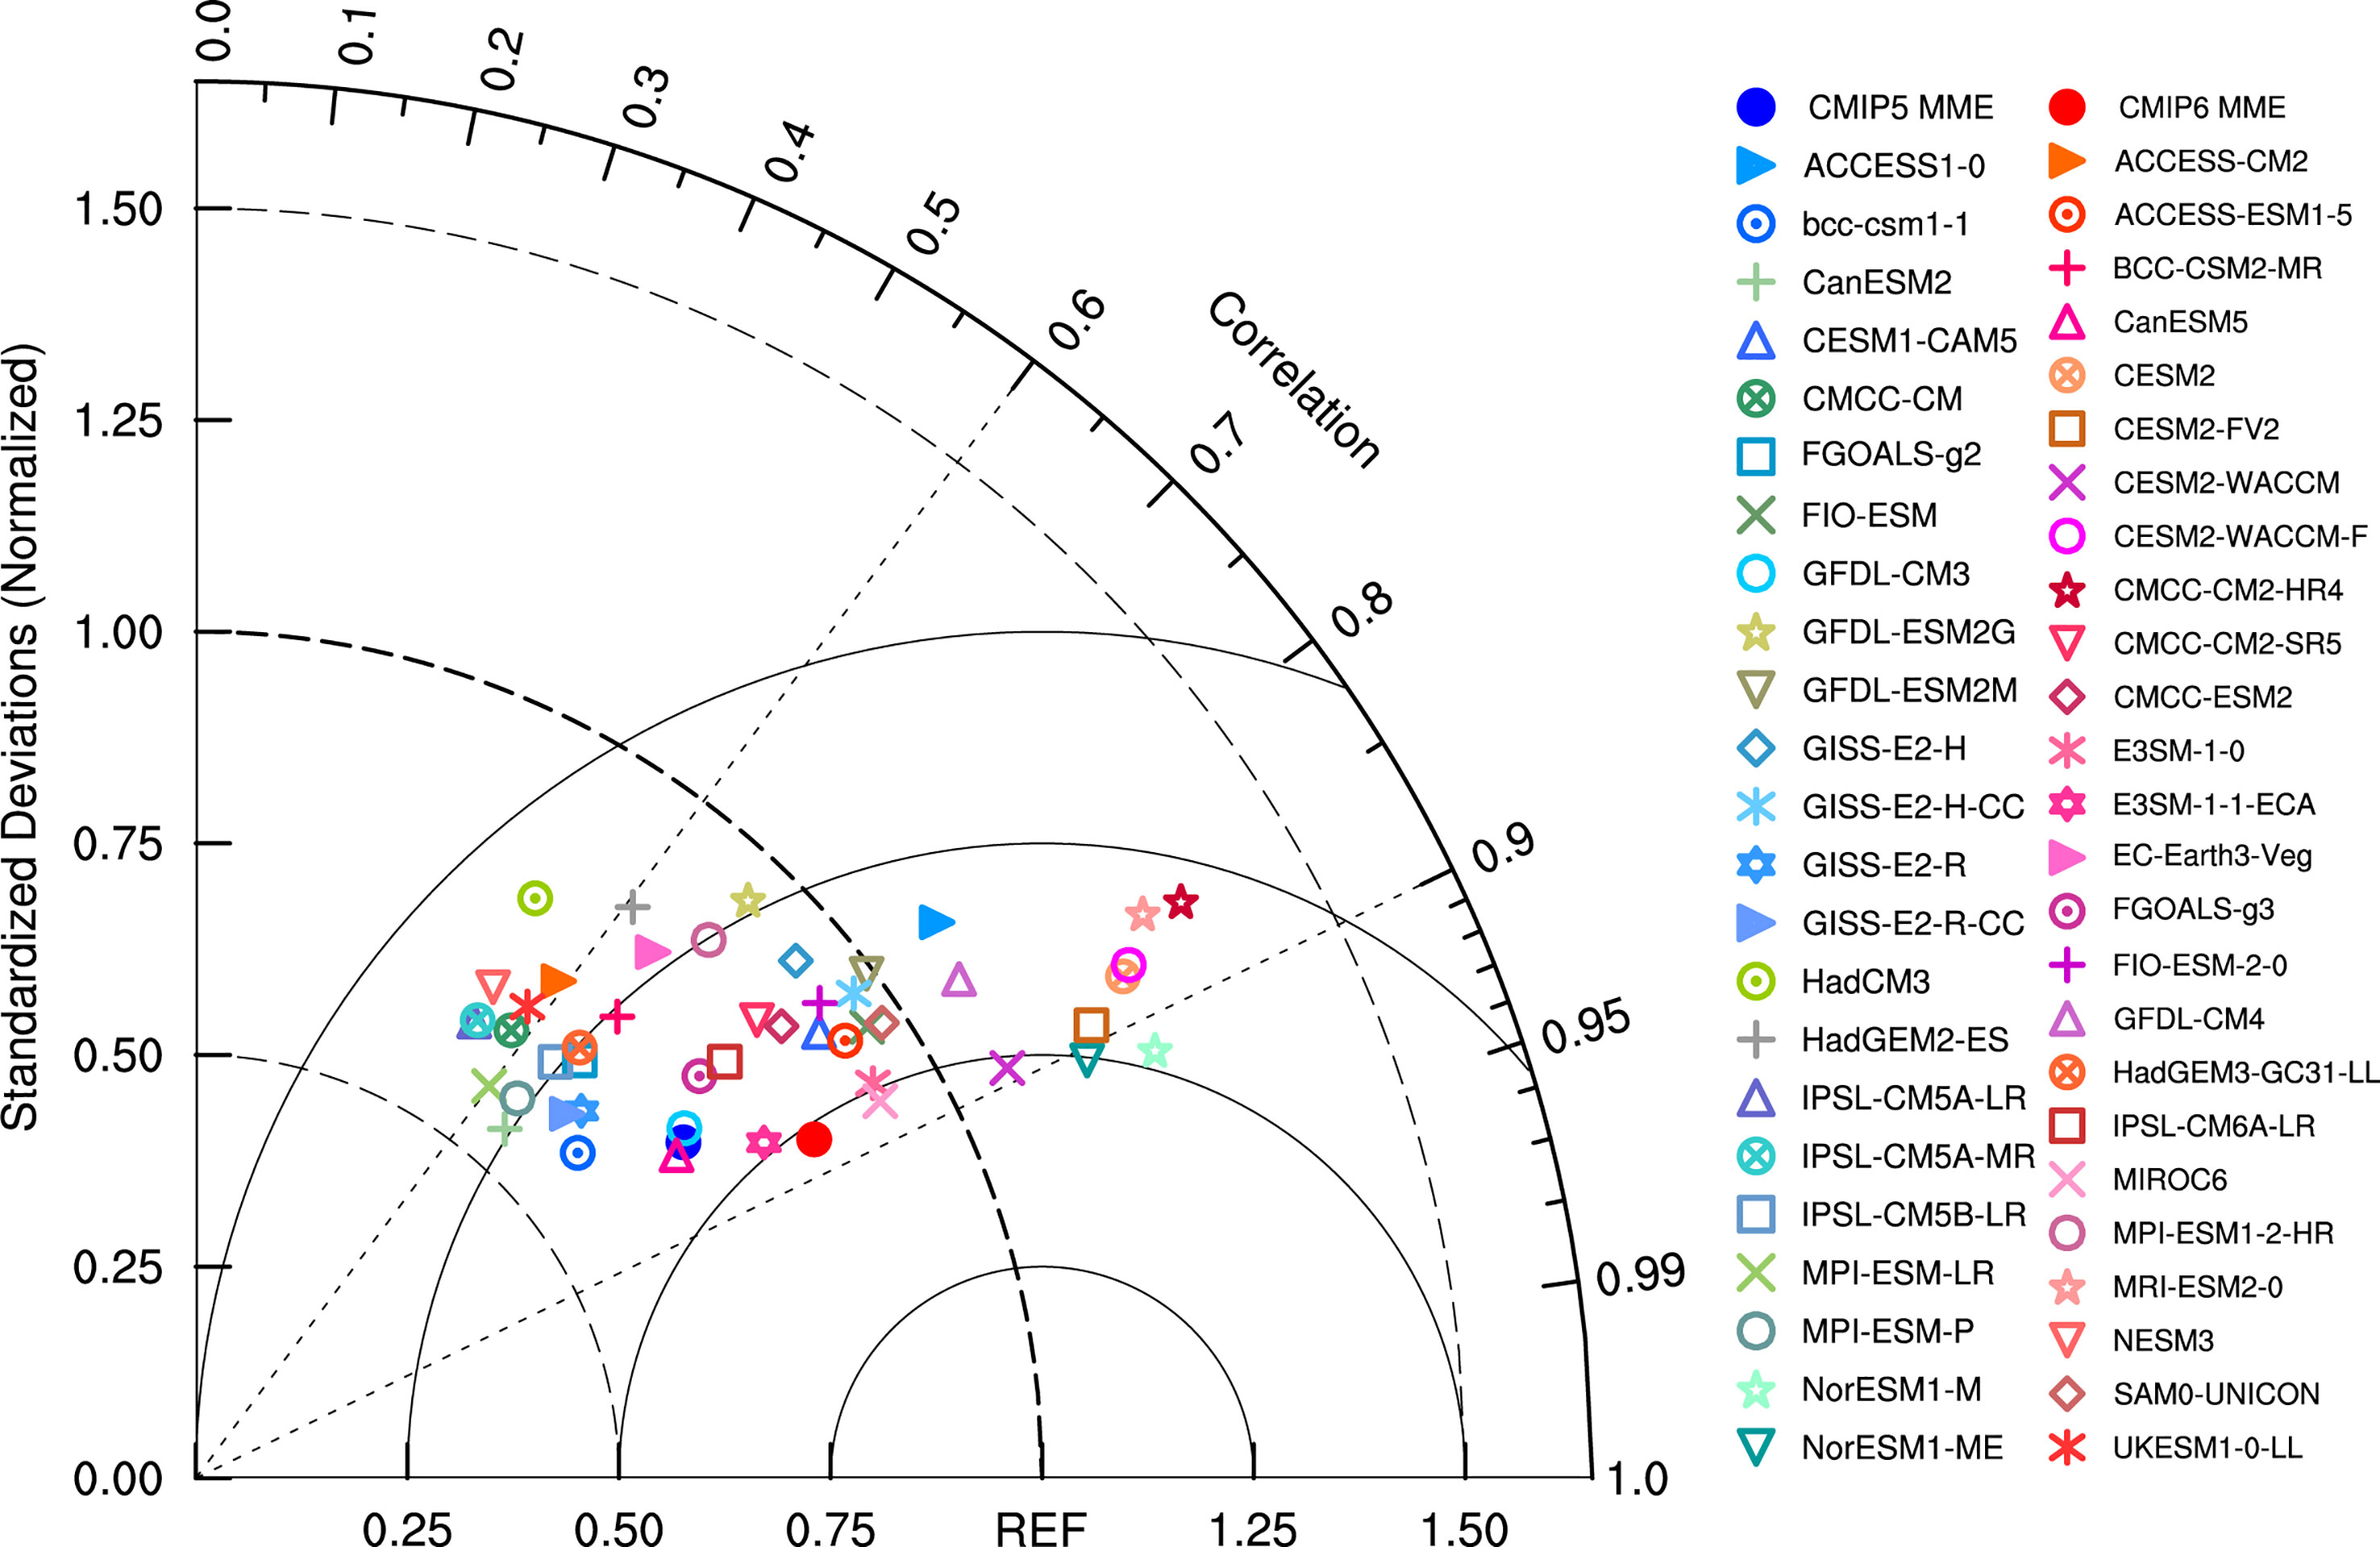
Figure 3 Taylor diagram of the simulated FMA mean Indian Ocean EUC from the CMIP5 and CMIP6 models compared with the corresponding observations. Colored markers indicate the results for the MME and individual models. The radius is the spatial standardized deviations normalized by the reference observations. The solid circles represent the root-mean-square difference relative to the reference value. The angular coordinates shown by dotted lines denote spatial correlations of +0.6 and +0.9.
Previous studies have shown that the surface easterly winds over the EIO pile up more surface waters toward the western boundary, which causes the equatorial thermocline to deepen in the western Indian Ocean and to shoal in the eastern Indian Ocean, eventually driving the EUC eastward (Chen et al., 2015; Phillips et al., 2021). To investigate the impact of the thermocline tilt in the EIO on the EUC, we examined the depth–longitude cross-section of the FMA mean equatorial ocean temperature in the observations and the CMIP5 and CMIP6 MMEs (Figure 4).
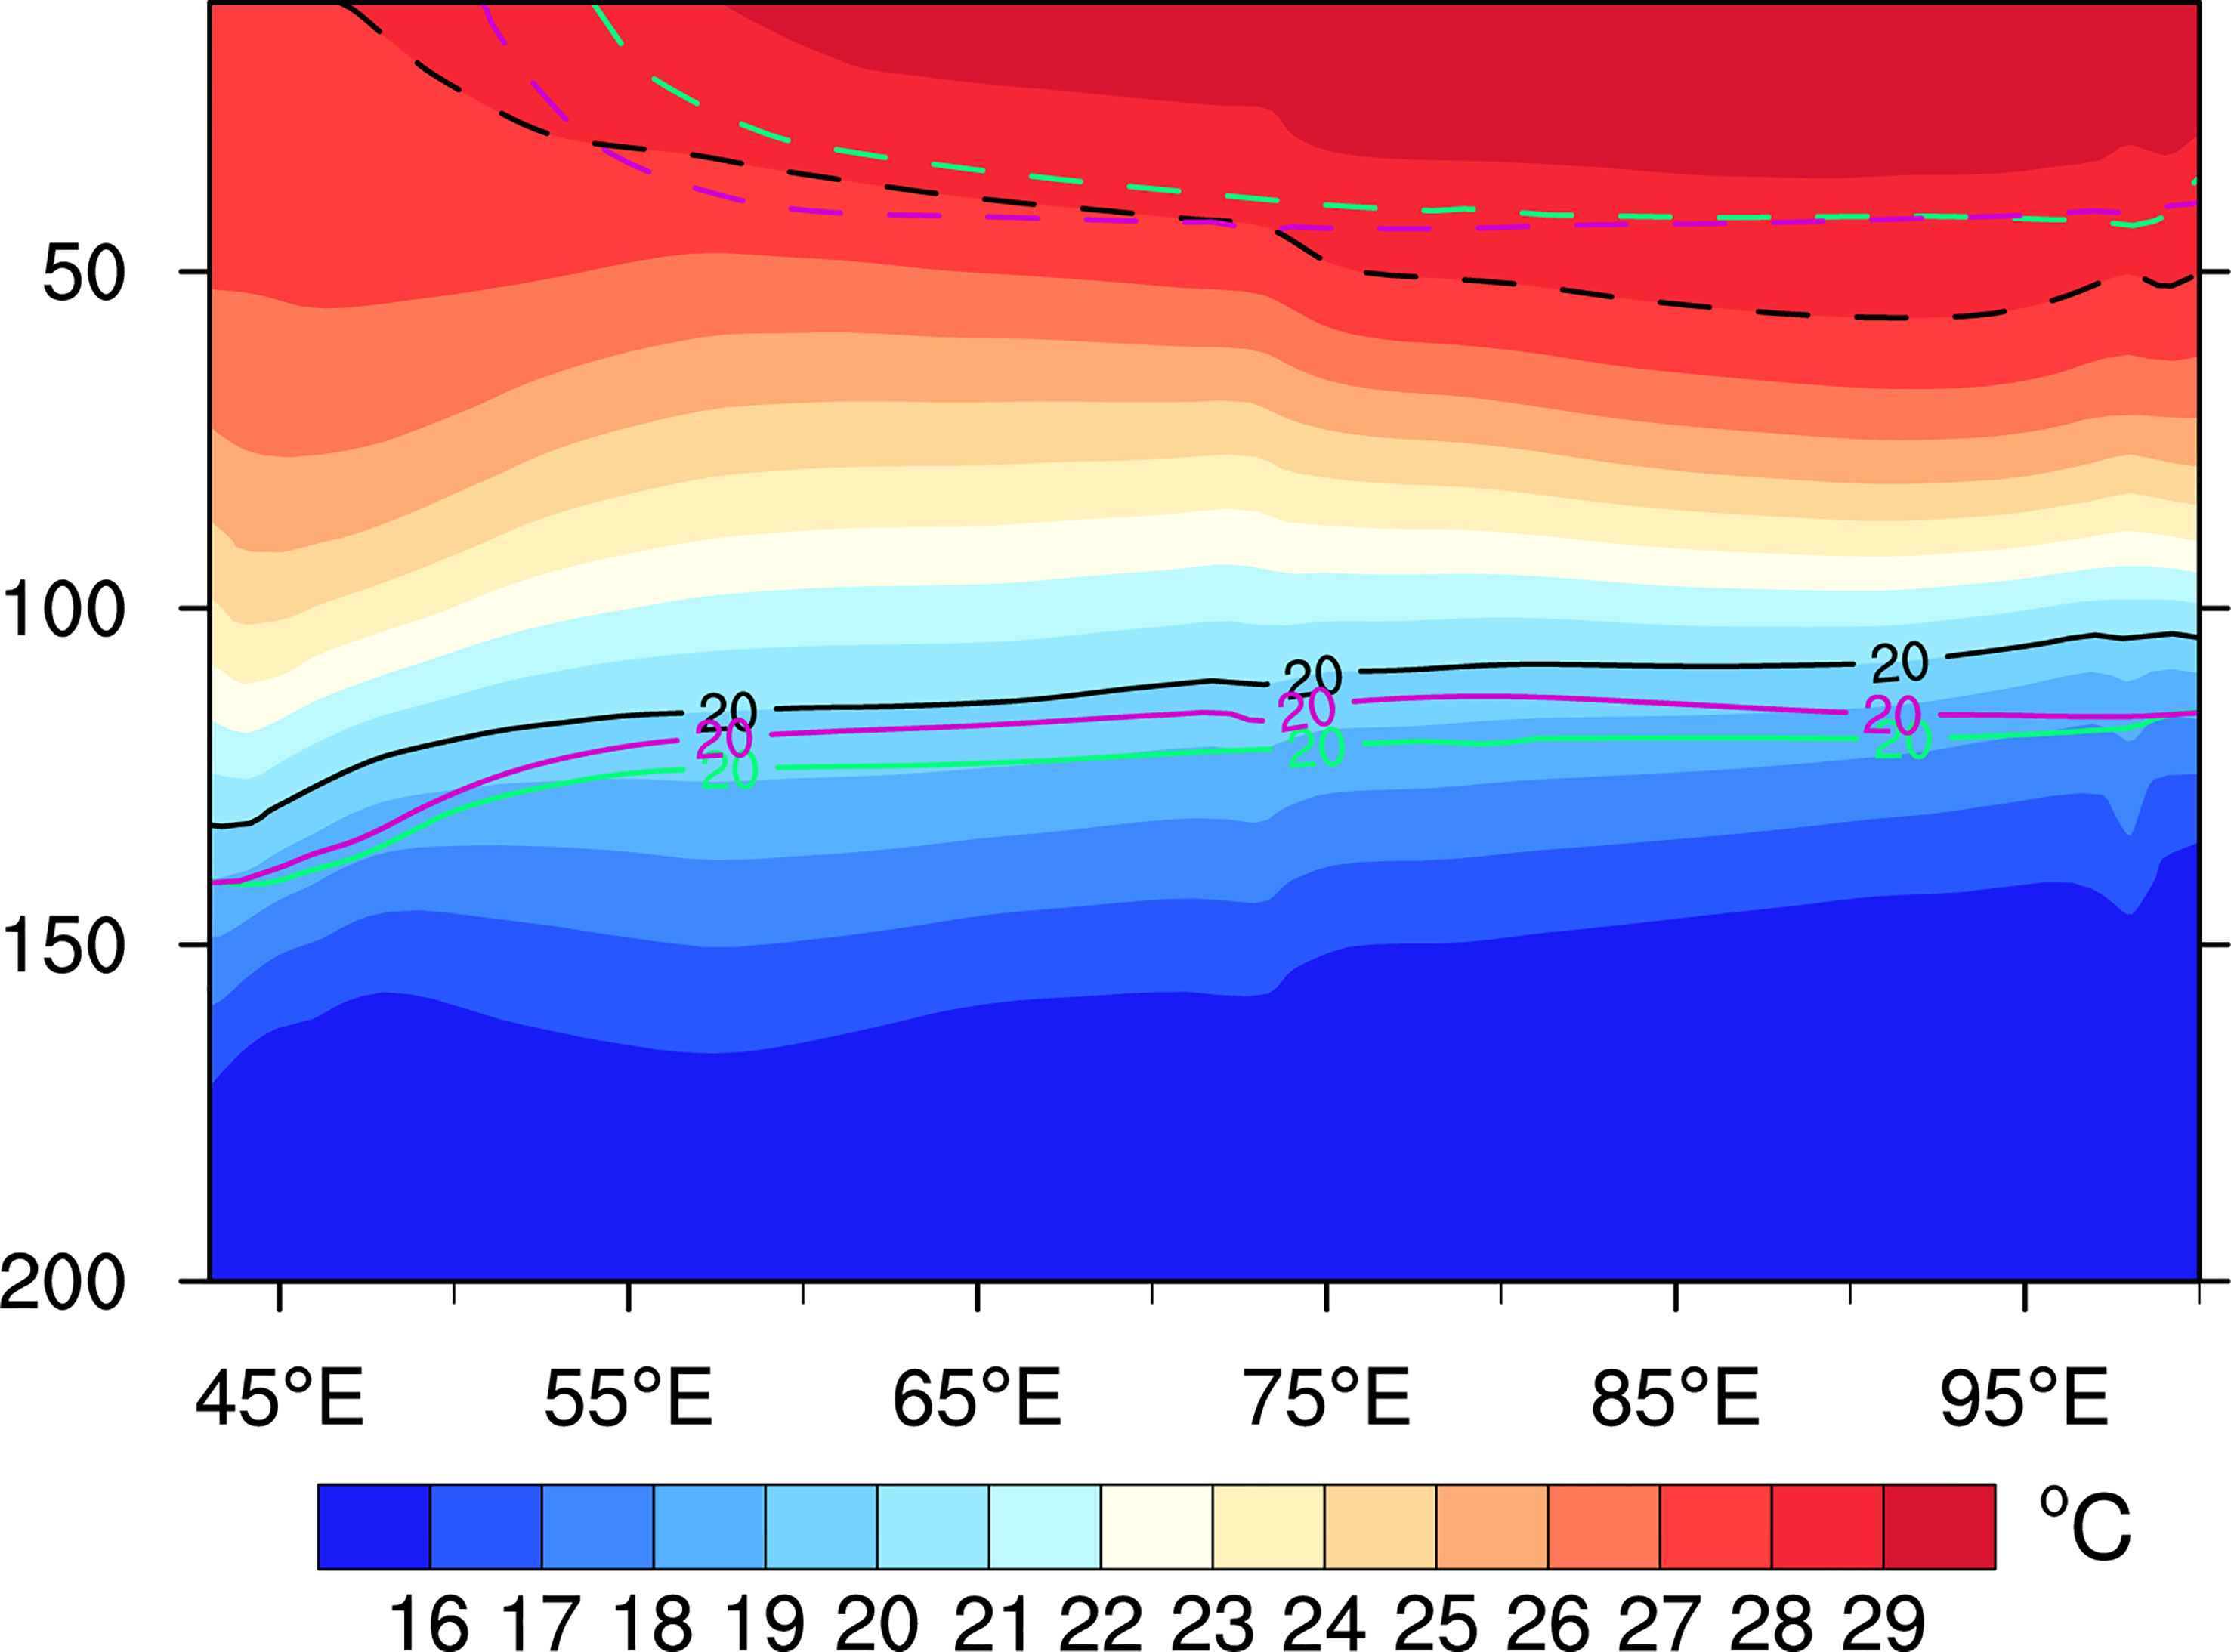
Figure 4 Depth–longitude cross-section of the FMA mean ocean temperature (shading; units: °C) along the EIO averaged between 2° S–2° N in the observations. The 20°C (28°C) isotherms in the observations, the CMIP5 MME, and the CMIP6 MME are marked by the black, green, and purple solid (dashed) curves, respectively.
During the winter–spring season, both the CMIP5 and CMIP6 MMEs show a flatter thermocline along the EIO relative to the observations, which might contribute to the relatively weaker EUC. Comparing the performance of the CMIP5 and CMIP6 models, we found that the simulated EIO thermocline is generally improved in the CMIP6 models, with a shallower thermocline depth. Despite the fact that there is still a flatter thermocline, the vertical structure of the ocean temperature in the CMIP6 models closely resembles the pattern in the observations, implying that the improvement in the strength of the Indian Ocean EUC in the CMIP6 models can be traced back to the improvement in the simulated thermocline.
To further investigate the lead–lag relationship between the surface winds and the EUC, Figure 5 shows the time–longitude cross-section of the 925-hPa zonal wind and subsurface zonal current over the EIO from the previous December to May for the observations and their associated biases in the CMIP5 and CMIP6 models. In the observations, the climatological easterly winds prevail over the western and central EIO from January to March (Figure 5A). As a response to these easterly winds in winter, the eastward basin-scale EUC usually appears along the equator with a one-month delay (Figure 5A), indicating that the winter–spring EUC might be effectively controlled by the easterly winds over the EIO in the preceding winter. Compared with observations, the surface easterly winds in the CMIP5 models show decreased magnitudes over the western and central EIO during winter, which is characterized by the surface westerly wind biases from January to March (Figure 5B). The >70% intermodel consistency over the western and central EIO indicates that the underestimated easterly winds in winter are robust among the CMIP5 models, leading to a reduced and shallower EUC in the Indian Ocean (Figure 5B).
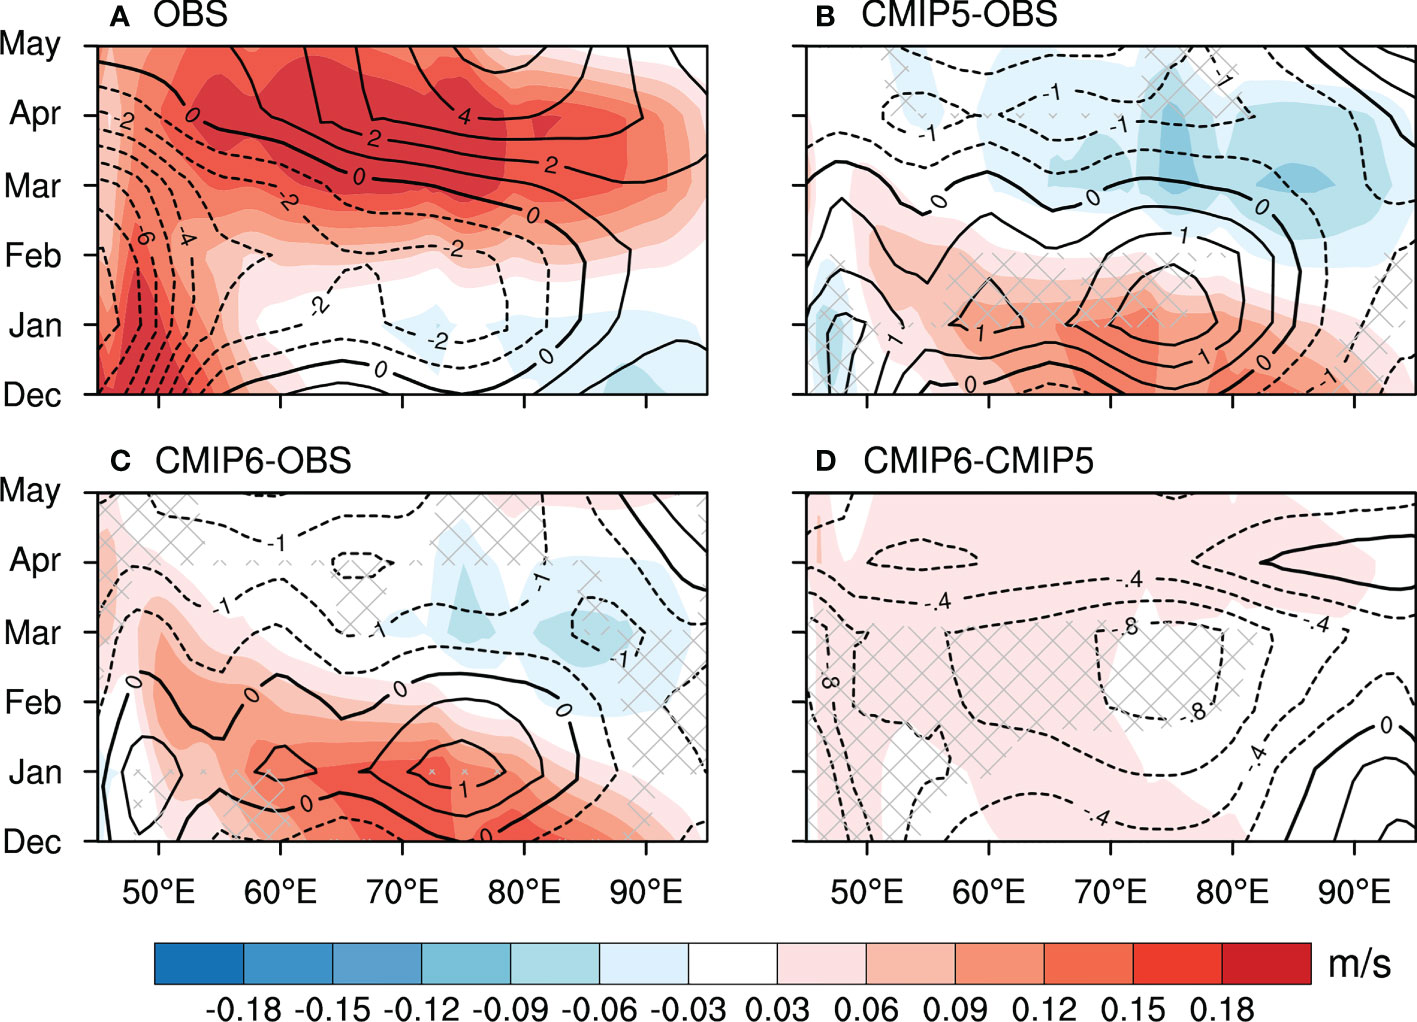
Figure 5 (A) Time–longitude cross-section of the climatological zonal wind at 925-hPa (contours; units: m/s) and subsurface (averaged from 60 to 150 m) zonal current (shading; units: m/s) over the EIO (averaged between 2° S and 2° N) from the previous December to May from the SODA 3.4.2 dataset. The MME biases of the EIO zonal winds and subsurface zonal currents in the (B) CMIP5 and (C) CMIP6 models, the gray crosses denote locations over which >70% of models agree on the same sign of zonal wind bias. (D) Difference in the EIO zonal winds and subsurface zonal currents between the CMIP6 and CMIP5 models; the gray crosses indicate signals that are statistically significant at the 90% confidence level.
Although there still exist excessively weak amplitudes of the easterly winds and EUC in the CMIP6 models, these biases are relatively smaller than those in the CMIP5 models (Figure 5C). The differences in the zonal winds and subsurface zonal flows between the CMIP6 and CMIP5 models show a reverse spatial pattern to that in the CMIP5 models (Figure 5D), showing the improvement of the CMIP6 MME over the CMIP5 MME in simulating the winter–spring Indian Ocean EUC. Both the poorer MME performance and the higher intermodel consistency in the CMIP5 models indicate that the EUC strength is more consistently underestimated in the CMIP5 models than in the CMIP6 models (Figure 5). There is therefore an overall improvement in the simulated Indian Ocean EUC in the CMIP6 models. These results also imply that the significantly reduced Indian Ocean EUC can be traced back to the excessively weak amplitude of the equatorial easterly winds simulated in most CGCM models.
The intermodel statistics also support the hypothesis that the winter–spring EUC strength biases in the CMIP5 and CMIP6 models are induced by biases in the equatorial easterly winds in January–February–March (JFM). Figure 6 shows that the JFM 925-hPa zonal wind is significantly correlated with the simulated west-minus-east D20 tilt in FMA, with an intermodel correlation coefficient among all the CMIP models of –0.51 (Figure 6A), indicating that a stronger easterly wind would develop a greater thermocline tilt in the following month, with deepening in the western EIO and shallowing in the eastern EIO. This stronger basin-scale zonally tilted thermocline further causes a larger eastward subsurface zonal pressure gradient in the EIO, leading to a stronger EUC (Figure 6B). This is supported by the significant intermodel correlation of +0.41 between the FMA mean D20 tilt and the amplitude of the EUC. Compared with the observations, the CMIP5 and CMIP6 MMEs show weak easterly winds and thermocline tilts, which contribute to the underestimation of the strength of the EUC. It is also found that the associated wind-induced thermocline tilt processes simulated in the CMIP6 models are more significant and stronger than those in the CMIP5 models as a result of the remarkably improved correlation coefficients in CMIP6 models (Figure 6). The intermodel relationships of the corresponding biases (not shown) are consistent with the results of this process (see Figure 6), suggesting that the commonly underestimated winter–spring Indian Ocean EUC among the CMIP models can be attributed to the weakened lower level easterly winds over the EIO and that the simulation skills of the Indian Ocean EUC have been improved in most CMIP6 models relative to the CMIP5 models.
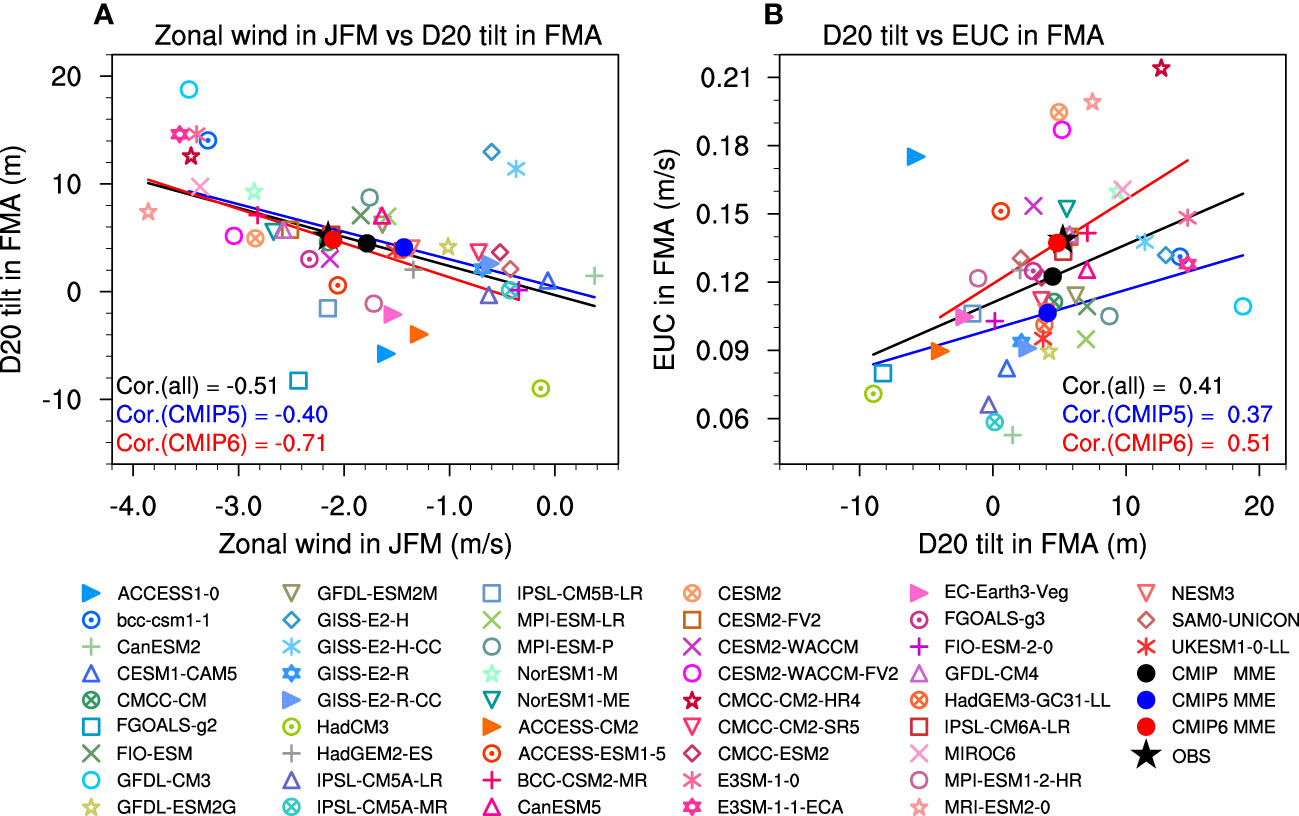
Figure 6 Scatterplots of (A) the JFM mean 925-hPa zonal wind averaged over the region (2° S–2° N, 50–80° E) versus the FMA mean D20 tilt (2° S–2° N, 50–70° E minus 70–90° E), and (B) the FMA mean equatorial D20 tilt vs the FMA EUC in CMIP5 and CMIP6 models. The black, blue, and red solid lines denote the best-fit line for all the CMIP models, the CMIP5 models, and the CMIP6 models, respectively, based on linear regression. The intermodel correlation coefficients for all the CMIP models (black font), the CMIP5 models (blue font), and the CMIP6 models (red font) are shown underneath each panel.
To quantitatively illustrate the capacities of capturing the intensity of the winter–spring EUC in the CMIP models, Figure 7 shows the area-averaged subsurface (averaged from 60 to 150 m) zonal current biases over the region (2° S–2° N, 50–95° E) in the individual models. Even though the strength of the simulated Indian Ocean EUC bias varies across the models, the majority of the models simulate a pronounced weak EUC with a negative bias, indicating an underestimated winter–spring EUC in the CMIP models. Negative EUC intensity biases are found in almost all the CMIP5 models (except for ACCESS1-0, NorESM1-M, and NorESM1-ME), which contribute to an overly weak EUC in the CMIP5 MME (Figure 7A). By contrast, the CMIP6 models show no clear consensus, with negative biases in 14 models and positive biases in 11 models. They therefore cause a smaller negative bias in the strength of the Indian Ocean EUC in the CMIP6 MME (Figure 7B). This result suggests that the CMIP6 models have a higher skill in simulating a more realistic intensity of the Indian Ocean EUC than the CMIP5 models.
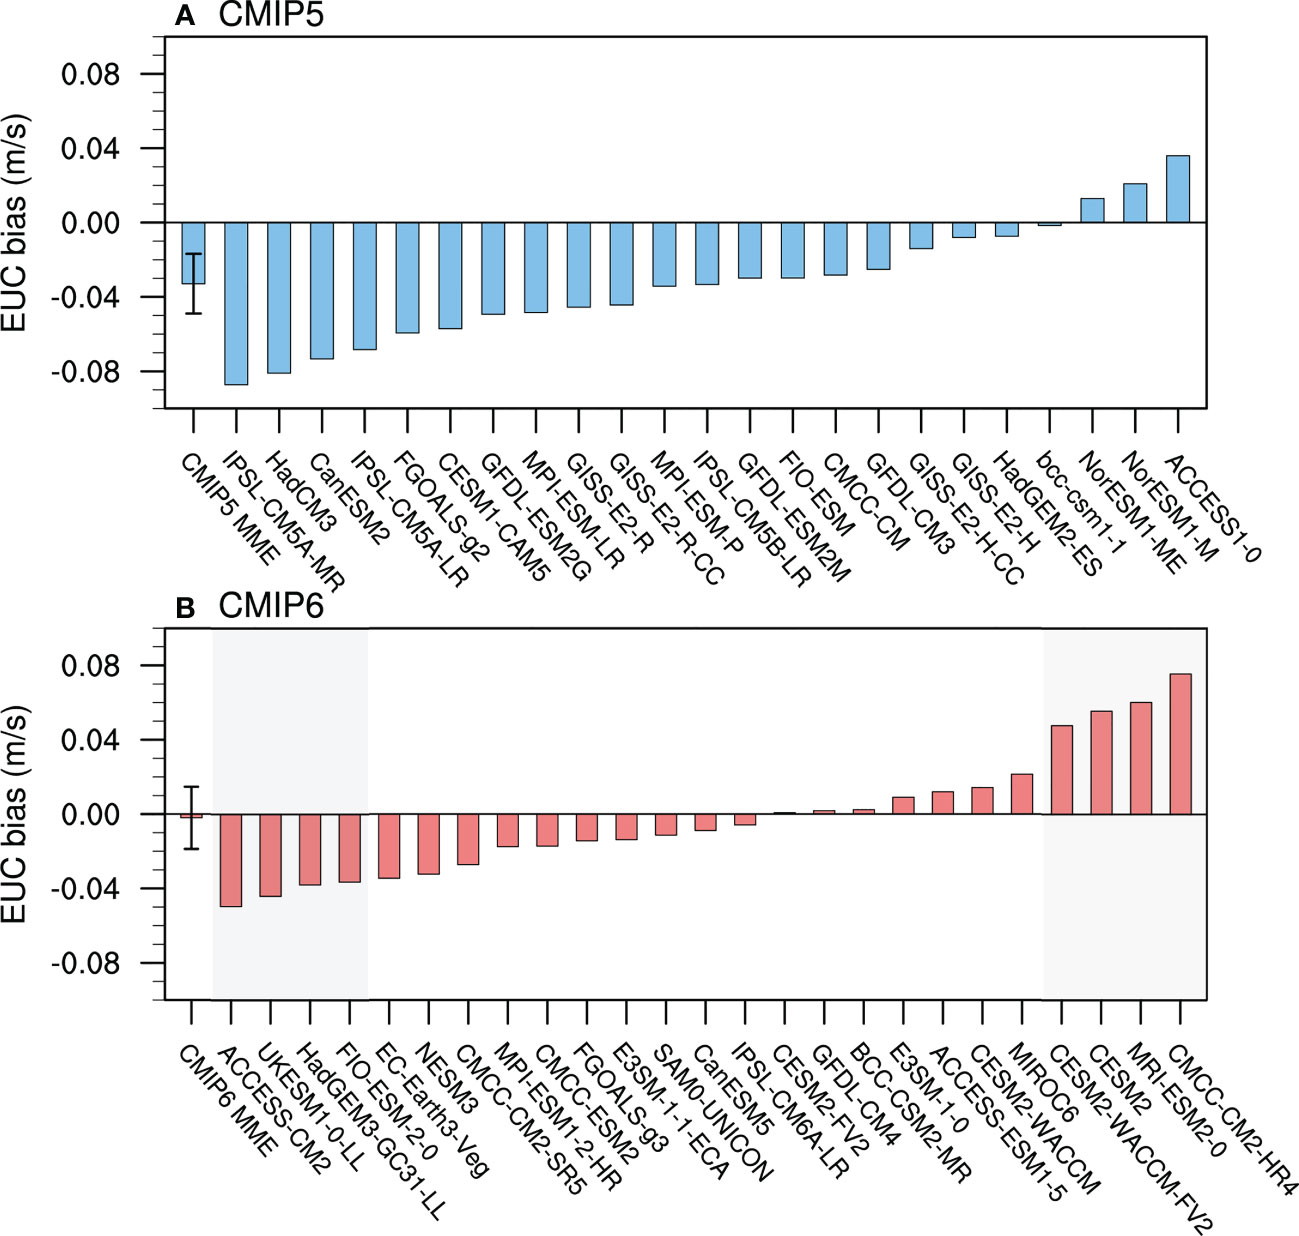
Figure 7 JFM mean EUC biases (units: m/s) averaged over the region (2° S–2° N, 50–95° E) among the (A) CMIP5 and (B) CMIP6 models. The first bar and its corresponding error bar indicate the MME bias and the standard deviation spread among the CMIP5 and CMIP6 models, respectively. The gray shading on the left and right of (B) indicate the four weak EUC models (WEUC group) and the four strong EUC models (SEUC group), respectively.
Based on the winter–spring EUC intensity bias index in the CMIP6 models, we selected four models (CMCC-CM2-HR4, MRI-ESM2-0, CESM2, and CESM2-WACCM-FV2) that simulated a strong intensity for the Indian Ocean EUC (the SEUC group) and four models (ACCESS-CM2, UKESM1-0-LL, HadGEM3-GC31-LL, and FIO-ESM3) that simulated a weak intensity of the Indian Ocean EUC (the WEUC group). We used these two groups to explore the physical processes responsible for the improvement among the CMIP6 models. Figure 8 shows the composite biases of the JFM 925-hPa zonal wind and the FMA subsurface zonal current for the SEUC and WEUC groups and their differences. The models in the SEUC group show a noticeably enhanced EUC over the western and central EIO during FMA as a response to the easterly wind bias over the entire EIO in the preceding JFM (Figure 8A). By contrast, the models in the WEUC group simulate the reduced winter–spring EUC over the EIO, corresponding to the robust underestimated easterly wind in the previous JFM (Figure 8B). These biases of the westerly wind and EUC over the EIO in the WEUC group are greater than those in the CMIP5 models (see Figure 2B and Figure 5B). The differences between the SEUC and WEUC groups are also characterized by the significant surface easterly wind biases in JFM and the eastward subsurface zonal current biases over the EIO in FMA (Figure 8C). These results suggest that the strength of simulated EUC might be closely related to the lower level easterly winds in the preceding season among the current CGCMs.
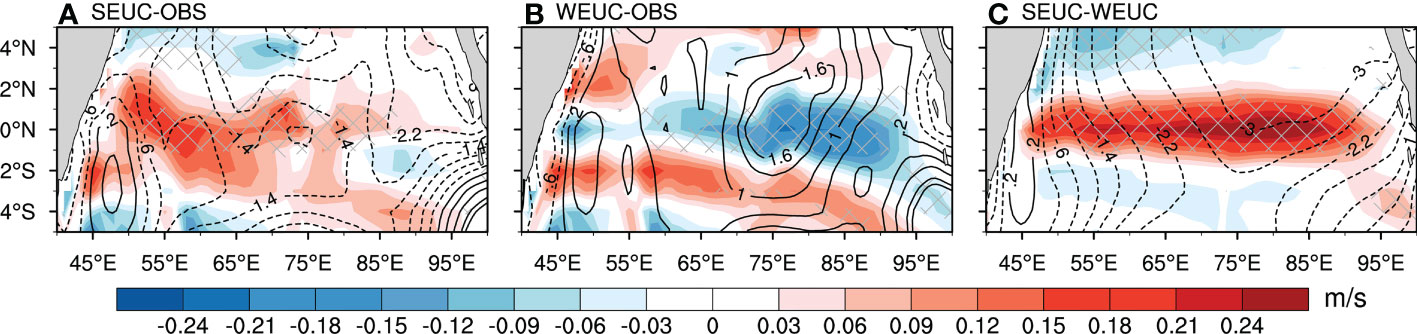
Figure 8 Differences of the JFM mean 925-hPa zonal wind biases (contours; units: m/s) and FMA mean subsurface (averaged from 60 to 150 m) zonal current biases (shading; units: m/s) over the EIO between (A) the SEUC group and (B) the WEUC group and the observations. (C) Same as (A), but for the differences between the SEUC and WEUC groups. Gray crosses indicate the signals that are statistically significant at the 90% confidence level.
After inspecting the connection between the EUC and surface easterly winds over the EIO, we quantitatively assessed the wind-induced thermocline tilt processes in the CMIP models. Figure 9 shows the area-averaged zonal surface wind bias in JFM and the west-minus-east D20 tilt bias indices in FMA for the CMIP5 models and the models in SEUC and WEUC groups. For the models in the SEUC group, a pronounced JFM mean easterly wind bias (Figure 9A) leads to a deep west–shallow east thermocline tilt bias (i.e., a positive west-minus-east mean zonal D20 tilt bias, Figure 9B), which contributes to an overestimation of the winter–spring Indian Ocean EUC via the wind-induced thermocline processes. However, the models in the CMIP5 MME and WEUC group simulate a mean surface westerly wind bias (Figure 9A) and a shallow west–deep east (i.e., a negative west-minus-east mean) D20 tilt bias (Figure 9B) over the EIO in JFM, ultimately resulting in an underestimation of the winter–spring EUC. Note that the biases in the westerly winds and the zonal thermocline tilt in the WEUC group are stronger than those in the CMIP5 MME, which is consistent with a more serious underestimation of the Indian Ocean EUC in the WEUC group. Comparisons of the wind-induced thermocline tilt processes simulated in the CMIP5, SEUC, and WEUC groups also confirm that the lower level easterly wind bias in winter dominates the variability of the winter–spring Indian Ocean EUC among the models.
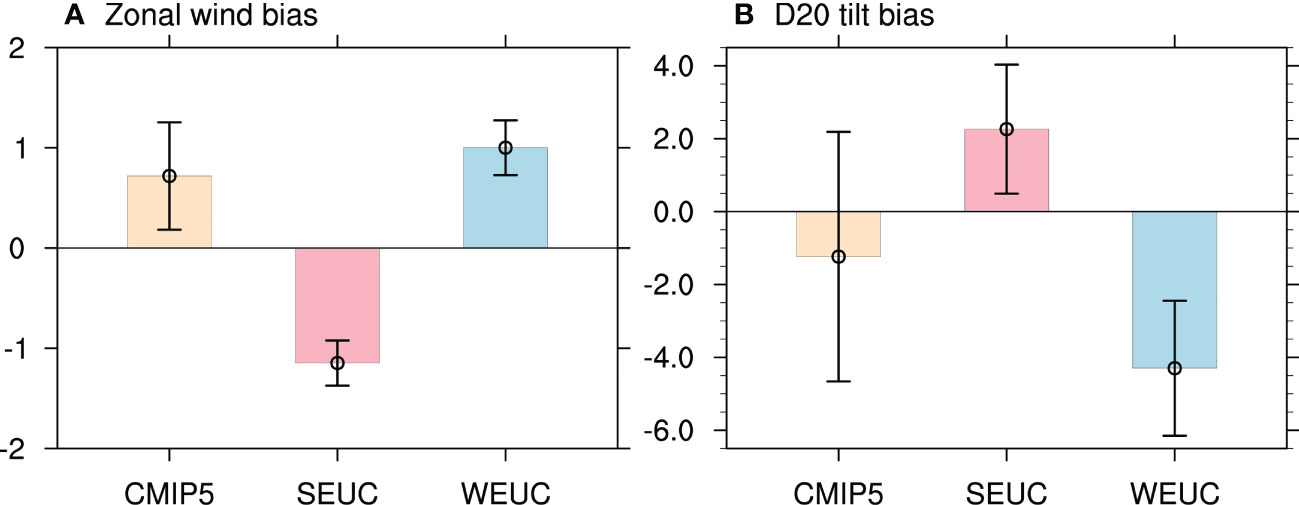
Figure 9 Histograms of the (A) JFM mean 925-hPa zonal wind biases (units: m/s) averaged for 2° S–2° N, 50–80° E and (B) FMA mean D20 tilt (2° S–2° N, 50–70° E minus 70–90° E) biases in the MME of the CMIP5 models (yellow bars), the SEUC group (red bars), and the WEUC group (blue bars). The error bars indicate the standard deviation spread among the models.
Our findings show that the lower level westerly wind bias over the EIO in winter is the source of the underestimation of the strength of the winter–spring Indian Ocean EUC in the CMIP models. It is still not clear, however, which physical processes are dominant in the lower level zonal wind biases over the EIO in winter in CGCMs. Previous studies have shown that a strong and westward-extended cold tongue in the equatorial Pacific might significantly affect the air–sea coupling processes over the tropical Indo-Pacific Ocean simulated in the CGCMs (Li et al., 2016a; Jiang et al., 2018; Li et al., 2019; Wang et al., 2019; Ying et al., 2019; Jiang et al., 2021; Li et al., 2021; Jiang et al., 2022).
To further unveil the possible role of the excessive cold tongue bias on the performance of the models in simulating surface easterly winds over the EIO and the associated EUC, Figure 10 compares the JFM climatological equatorial Pacific SST from the observations, the CMIP5 models, and the models in the SEUC and WEUC groups. It can be clearly seen that the models in both the CMIP5 MME and WEUC group give a cooler mean Pacific SST than the observations, with WEUC group models having a more serve cold tongue bias and a more westward extension. However, the SEUC group realistically reproduces the observed equatorial Pacific SST, despite the fact that it is slightly higher to the west of 130° W.
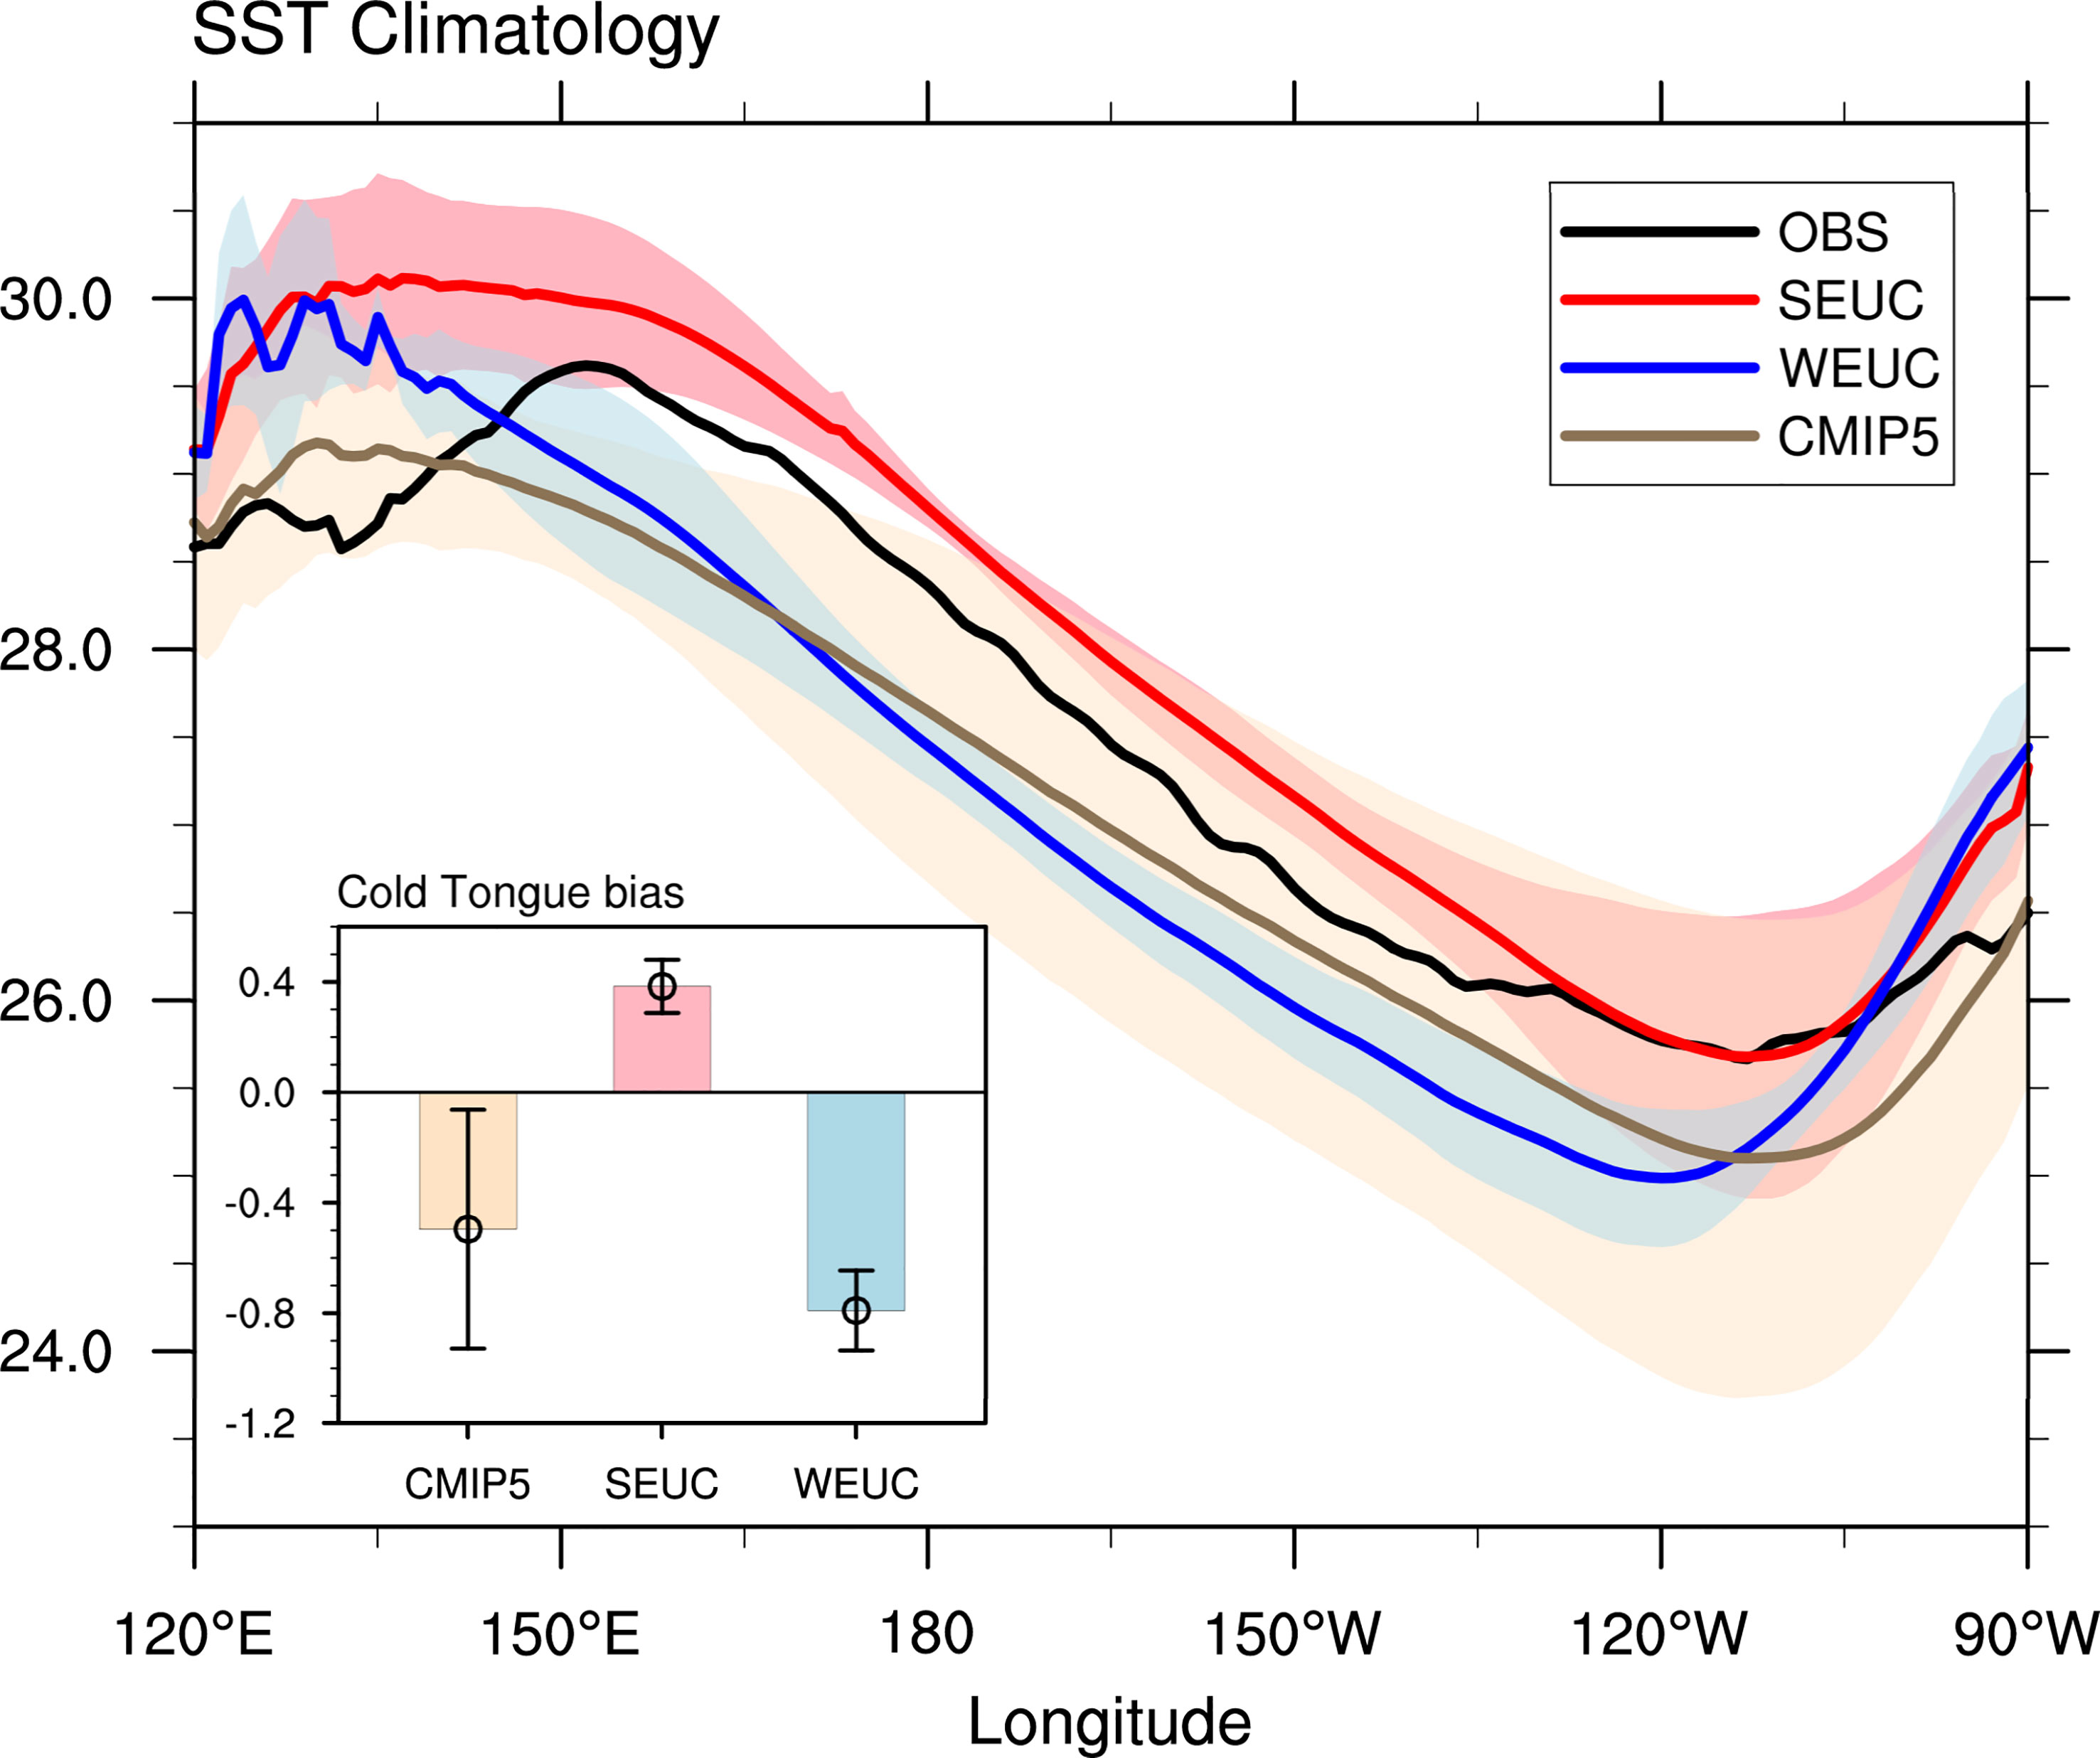
Figure 10 JFM mean SST (units: °C) averaged over the equatorial Pacific (2° S–2° N) from the observations (black curve), the MME of the CMIP5 models (brown curve), the composite of the SEUC group (red curve) and the WEUC group (blue curve). Light brown, red, and blue shading indicate the standard deviations among the models, respectively. The histograms at the lower left represent the cold tongue bias averaged over the region (2° S–2° N, 175° E–90° W) in the MME of the CMIP5 models (light brown bar), the composite of the SEUC group (red bar), and the WEUC group (blue bar). The error bars indicate the standard deviation spread among the corresponding models.
We also calculated the cold tongue bias index averaged over the region (2° S–2° N, 175° E–90° W) to distinguish the differences in the cold tongue bias simulated in the CMIP5 models and the models in the SEUC and WEUC groups (Figure 10, histogram). Excessively strong cold tongue biases in the equatorial Pacific are found both in the CMIP5 models and the models in the WEUC group, whereas the models in the SEUC group show warm cold tongue biases, implying that the cold tongue biases in the CGCMs would significantly affect the simulated strength of the EUC in the Indian Ocean. The CMIP5 models show a common bias of a strong cold tongue in the mean state, but the CMIP6 models show no consensus, with an overly warming cold tongue bias for the SEUC group and a cooling cold tongue bias for the WEUC group. This implies an overall improvement in the simulated cold tongue in the CMIP6 MME, ultimately improving the simulations of the surface winds and its induced-EUC over the EIO.
The spatially inhomogeneous SST across the tropical Pacific basin (i.e., the zonal SST gradient) is the key to the variability of the Walker circulation (Deser et al., 2010; Meng et al., 2012; Tokinaga et al., 2012; Sohn et al., 2013; McGregor et al., 2014). Figure 11 depicts the JFM mean Walker circulation for the observations, the CMIP5 models, and the models in the SEUC and WEUC groups and their differences. The climatological patterns of the Walker circulation from the CMIP5 MME and the two EUC groups show a double-cell pattern with an ascending branch over the Indo-Pacific warm pool flanked by descending branches over the eastern equatorial Pacific and the western EIO. These results resemble the observations, albeit with different magnitudes (Figures 11A–D). The ascending and descending branches associated with the Walker circulation from the CMIP5 models and WEUC group are shifted westward relative to the observations (Figures 11B, D), corresponding to the excessively strong equatorial Pacific cold tongue biases (Figure 10).
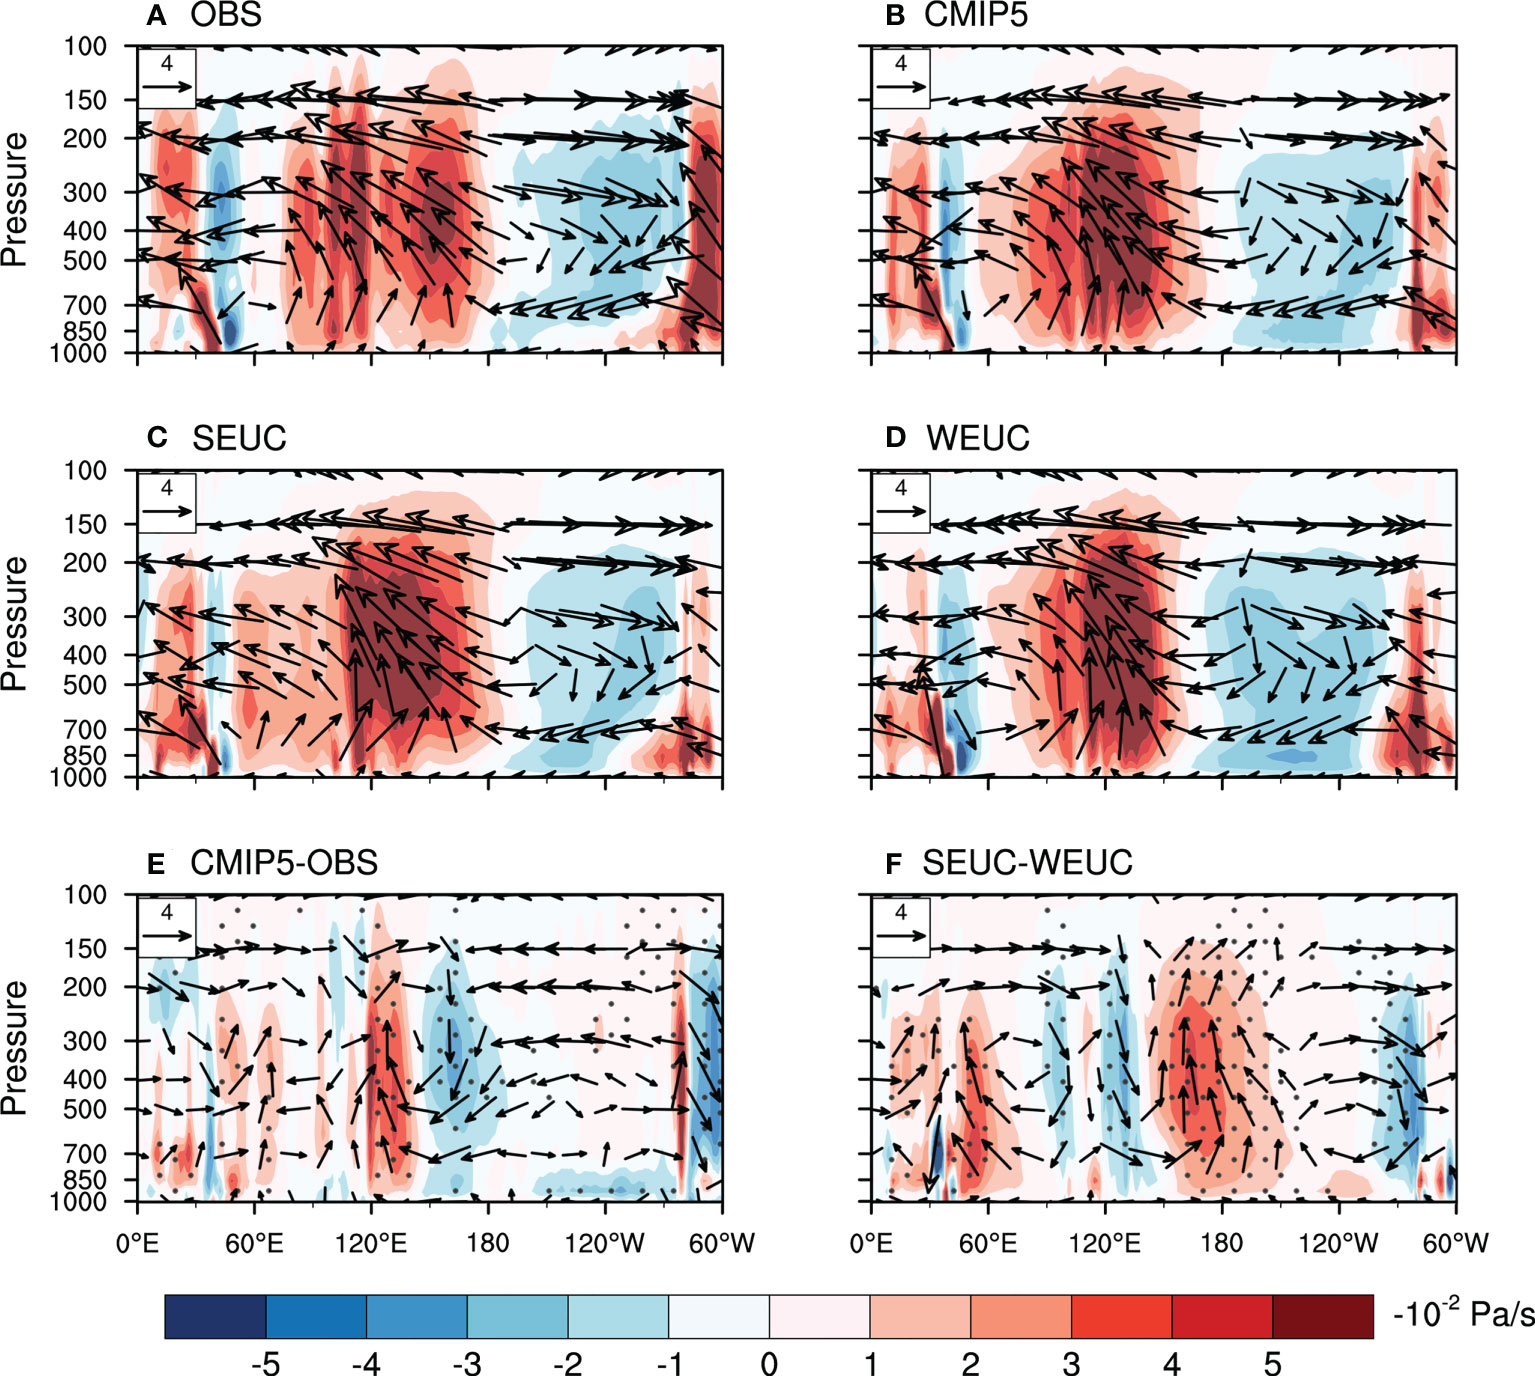
Figure 11 JFM mean zonal wind and pressure velocity (vectors; m/s for zonal wind and −10−2 Pa/s for pressure velocity) averaged over the equatorial Pacific (2° S–2° N) based on (A) the observations, (B) the MME of the CMIP5 models, (C) the composite of SEUC group, (D) the composite of the WEUC group, (E) the differences between the CMIP5 models and the observations, and (F) the differences between the SEUC and WEUC groups. Shading denotes the pressure velocity (multiplied by a factor of −100 for clarity). Gray dots in (E) indicate the locations over which >70% of models agree on the same sign of the pressure velocity biases. Gray dots in (F) denote the signals above the 90% significance level.
The difference between the CMIP5 MME and the observations has a similar double-cell pattern to that found in the CMIP5 MME (Figure 11E), indicating that the Walker circulation simulated in the CMIP5 models is strengthened relative to the observations, in accordance with the significant lower level westerly (easterly) wind bias over the central EIO (equatorial Pacific), finally leading to the excessively weak Indian Ocean EUC in the CMIP5 models. In addition, the difference in the overturning circulation between the models in the SEUC and WEUC groups shows a reverse double-cell pattern to that found in the models in the SEUC group (Figure 11F), implying a slowdown of the winter-mean Walker circulation. The lower level easterly bias in the EIO associated with the weakened Walker circulation results in an enhancement of the winter–spring EUC in the models in the SEUC group.
The commonly underestimated strength of the winter–spring Indian Ocean EUC among the CMIP models can therefore be traced back to the strong and westward-extended cold tongue bias in the equatorial Pacific. This excessive cold tongue bias could give rise to a strong equatorial SST gradient in the Pacific, which, in turn, could accelerate the Walker circulation and lead to the lower level westerly wind bias over the EIO. This enhanced equatorial westerly bias could induce a shallow west–deep east thermocline tilt bias (Figure 9B), contributing to an underestimation of the EUC in the Indian Ocean. Although the negative winter–spring strength bias of the EUC still exists in the CMIP6 MME, the simulated EUC strength in the CMIP6 MME is much closer to the observations than that in the CMIP5 MME (Figures 2, 5) and the bias in the CMIP6 MME is significantly reduced relative to the CMIP5 models. Similarly, the improvement in the simulated cold tongue can be clearly seen in the CMIP6 models relative to the CMIP5 models (Figure 10), which further confirms the importance of the simulated strong cold tongue bias in the underestimated variability of the Indian Ocean EUC in the CGCMs. The improvement in the CMIP6 MME in the simulation of the Indian Ocean EUC can be traced back to the improvement in the degree of the strong and westward-extended cold tongue bias.
We evaluated the winter–spring EUC over the Indian Ocean based on 23 CMIP5 and 25 CMIP6 models. These state-of-the-art-models reasonably capture the winter–spring patterns of the EUC in the Indian Ocean, but most of them underestimate the strength of the EUC in the Indian Ocean and show a robust intermodel consistency. However, compared with the CMIP5 MME, the simulation skill of the winter–spring EUC is improved in the CMIP6 MME, with a more realistic EUC amplitude. Our results also show that this commonly underestimated winter–spring Indian Ocean EUC is primarily dominated by the excessive EIO westerly wind biases in the preceding winter among the CMIP5 and CMIP6 models. Specifically, the CMIP models with a weaker lower level easterly wind over the EIO in winter tend to simulate an underestimated strength of the EUC in the Indian Ocean in winter–spring through modulating the wind-induced thermocline tilt processes.
Further inspection showed that the commonly underestimated strength of the EUC in the Indian Ocean in winter–spring is closely linked to another long-standing system bias: the excessively strong and westward extended cold tongue in the equatorial Pacific (Li and Xie, 2014; Ying et al., 2019). Figure 12 summarizes the physical processes of the Indian Ocean winter–spring EUC bias in the CMIP models driven by the excessive cold tongue bias. For the CMIP models, a stronger cold tongue in the equatorial Pacific in winter favors a stronger zonal SST gradient, which, in turn, forces strong easterly winds over the western equatorial Pacific. This contributes to an enhanced Walker circulation, which can give rise to a lower level westerly wind bias over the EIO and drive a shallow west–deep east thermocline tilt bias. This ultimately leads to a weaker Indian Ocean EUC in the subsequent winter–spring through wind-induced thermocline tilt processes (Iskandar et al., 2009; Chen et al., 2015; Phillips et al., 2021). Comparisons of the performances of the CMIP5 and CMIP6 models suggested that the improvement in the strength of the Indian Ocean EUC in winter–spring in the CMIP6 models can be attributed to the improvement in the degree of bias in the strong and westward-extended cold tongue. We also examined the simulated SST–wind coupling relationship in winter in the CMIP models in the EIO, which may exert an influence on the winter–spring EUC, and found that the west-minus-east SST gradient along the EIO shows negative biases in the CMIP models which correspond to the surface westerly biases in the EIO, contributing to the overly underestimated EUC in winter–spring (not shown). Additionally, the surface westerly biases in JFM are also associated with the excessive cold tongue biases in the equatorial Pacific through enhancing the Walker circulation, consistent with our results in this study.
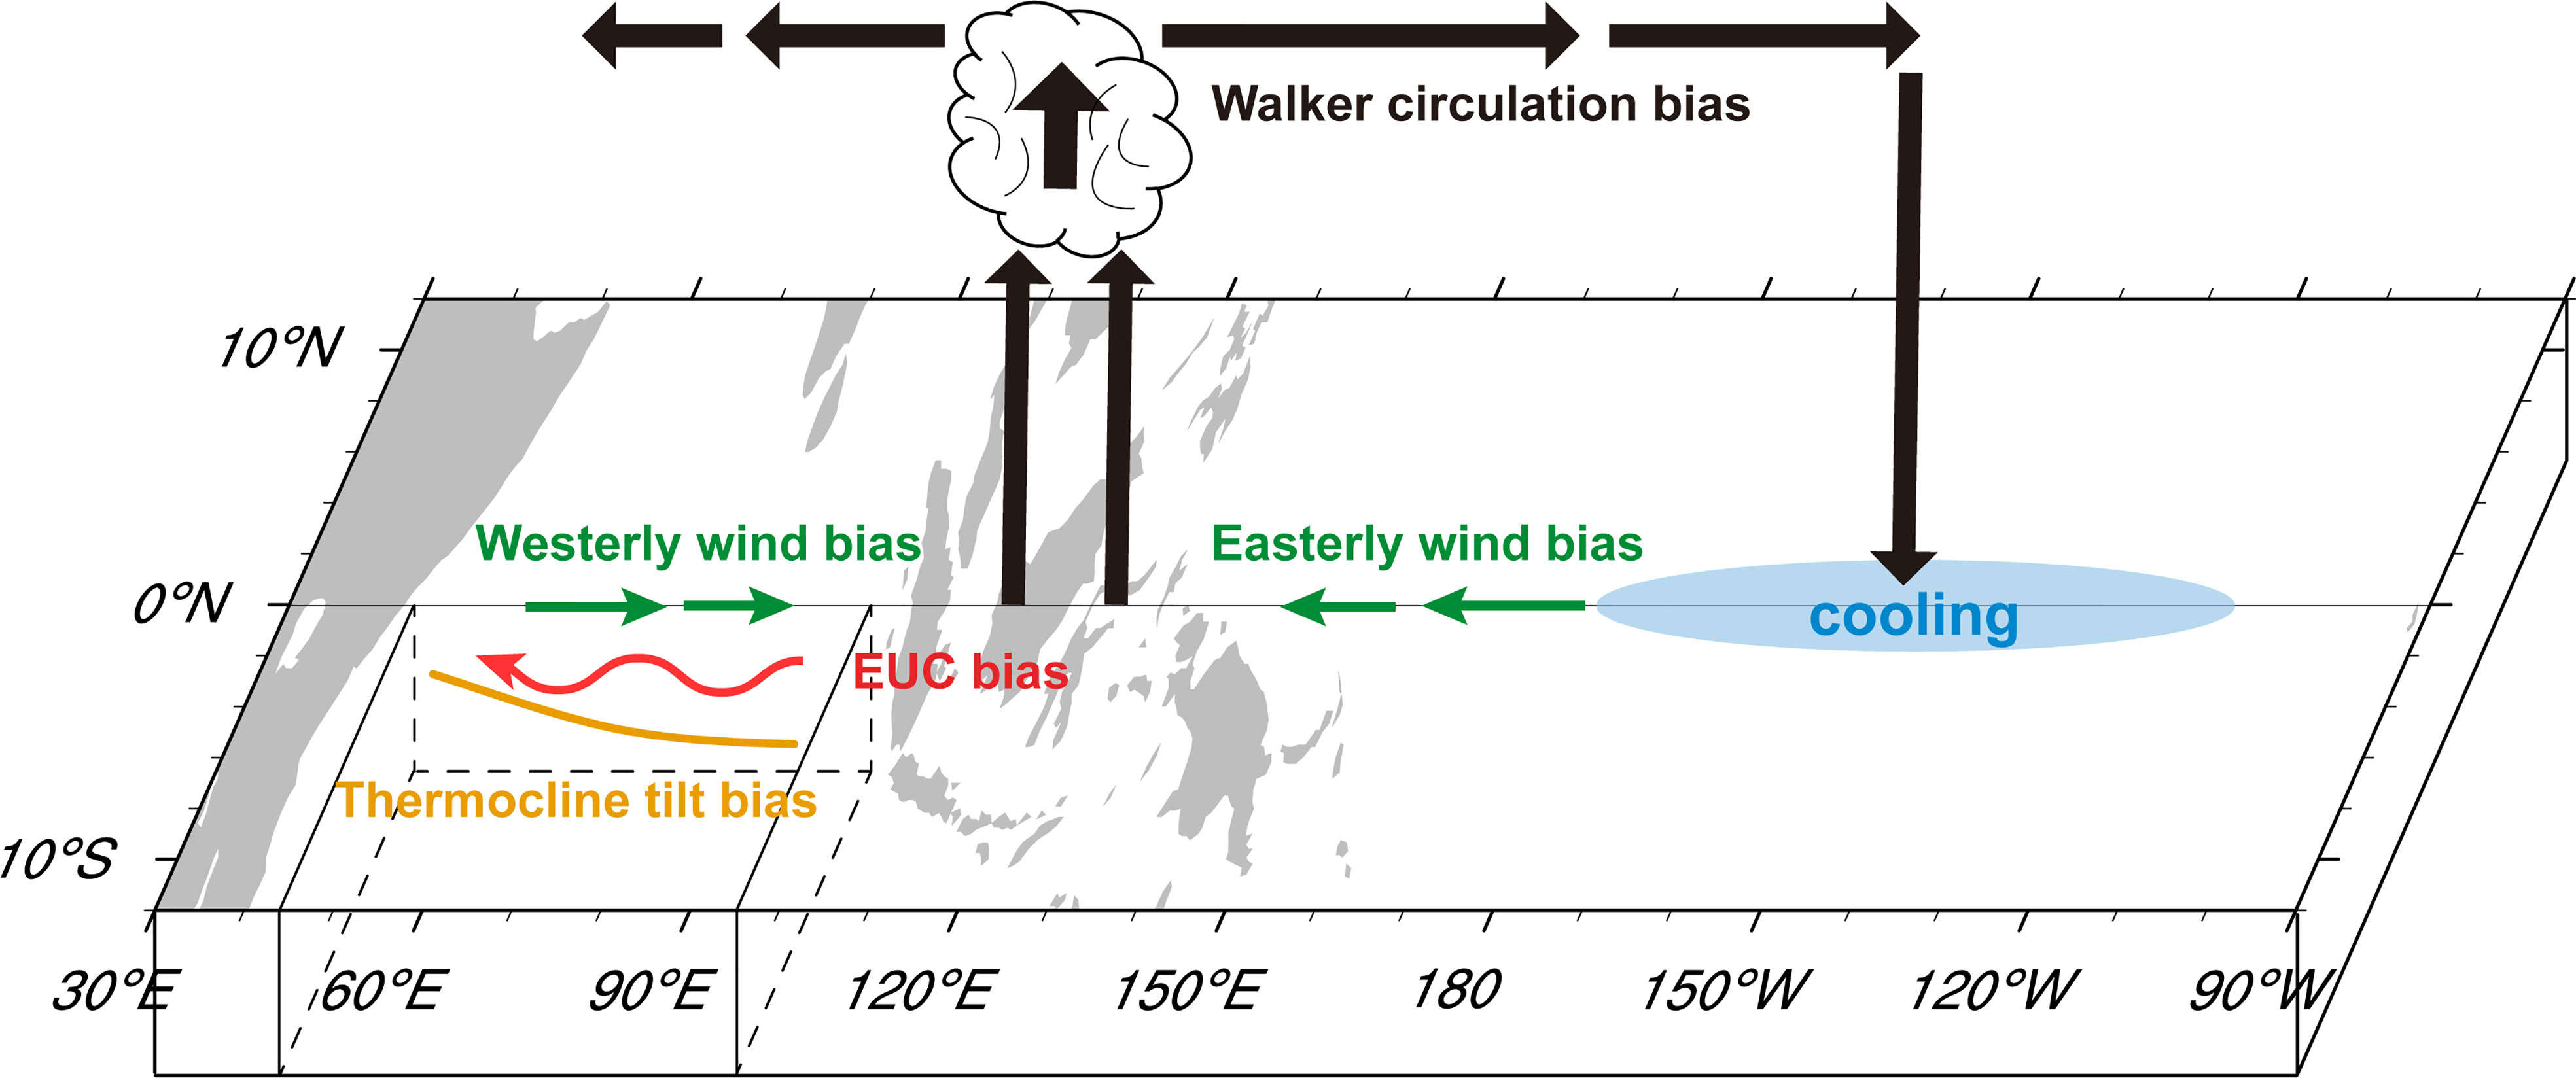
Figure 12 Schematic diagram illustrating the origin and physical processes of the Indian Ocean winter–spring EUC bias in the CMIP models. Light blue shading represents the cold SST bias; the green vectors and thick black arrows denote the biases in the simulated surface zonal winds and the related Walker circulation in the CMIP models, respectively. The red arrow and orange curve indicate the simulated EUC bias and thermocline tilt bias, respectively.
This study assessed the abilities of the CMIP5 and CMIP6 models to simulate the winter–spring Indian Ocean EUC. Our results emphasize the importance of a realistic simulation of the cold tongue in the equatorial Pacific in improving the simulation of the winter–spring Indian Ocean EUC in CGCM models. This result also provides useful information for studying air–sea connections between the Indian and Pacific Oceans and indicates that more attention should be paid to understanding and improving the simulation of the mean-state equatorial Pacific SST in the CMIP models. Although previous studies have found that the excessively strong cold tongue biases could remarkably affect the simulation of the ENSO-related teleconnections and other climate modes in the CMIP models (Gong et al., 2015; Li et al., 2019; Wang et al., 2019), there is no consensus on the origin of the excessive cold tongue bias (Guilyardi et al., 2009; Zhang and Song, 2010; Li and Xie, 2014; Bayr et al., 2019). Previous studies have shown that the excessive cold tongue bias might be linked to various physical process biases in CGCMs, including the convection scheme (Zhang and Song, 2010), underestimated negative shortwave–SST feedback (Bayr et al., 2019), excessively strong upper ocean heat advection (Zheng et al., 2012), and a very shallow thermocline depth in the equatorial eastern Pacific (Li and Xie, 2012). More effort should therefore be made to reduce these biases in physical processes in the next generation of CGCMs to improve the simulation of the Indian Ocean EUC.
In addition to the underestimation of the winter–spring EUC, two generations of the CMIP models also overestimate the mean EUC bias in ASO (Figure 1). We found that the IOD-like biases show remarkable seasonal differences, with positive biases in June–July–August and September–October–November and negative biases in JFM (not shown). We infer that these positive IOD-like biases over the TIO might lead to a significantly overestimated summer–fall EUC. In addition, we only focused on the effect of the excessively strong cold tongue bias in the equatorial Pacific on the underestimation of the intensity of the EUC in winter–spring in the CMIP models. However, the other air–sea interactions and equatorial wave dynamics over the TIO also play important roles in the variability of the Indian Ocean EUC (Iskandar et al., 2009; Nyadjro and McPhaden, 2014; Chen et al., 2015). The CMIP models also have long-lasting biases in simulating atmospheric and oceanic circulations over the TIO (Cai and Cowan, 2013; Li et al., 2016b). The relative contributions of multiple air–sea processes and the mean-state climate biases to changes in the Indian Ocean EUC in the CGCM models therefore require further quantitative assessment.
The original contributions presented in the study are included in the article/supplementary material. Further inquiries can be directed to the corresponding authors.
KX and WW conceived the idea and designed the study. JL and KX processed and analyzed the datasets, and performed the relevant statistical analysis. JL wrote the first draft of the manuscript. All authors contributed to manuscript revision, read, and approved the submitted version.
This work was jointly supported by the National Key R&D Program of China (2022YFE0203500), the National Natural Science Foundation of China (42076020, 42275024, 42176026, 42275035), the National Key Research and Development Program of China (2022YFF0801701), the Youth Innovation Promotion Association CAS (2020340), the Guangdong Basic and Applied Basic Research Foundation (2023B1515020009, 2023A1515030102, 2022A1515011967), Science and Technology Program of Guangdong Province (2022B1212050003) the Hainan Province Science and Technology Special Fund (ZDYF2020174), the Rising Star Foundation of the SCSIO (NHXX2018WL0201), the Science and Technology Program of Guangzhou (202002030492), and the Independent Research Project Program of LTO (LTOZZ2101, LTOZZ2005).
We would like to acknowledge the China-Sri Lanka Joint Center for Education and Research (CSL-CER), Chinese Academy of Science.
The authors declare that the research was conducted in the absence of any commercial or financial relationships that could be construed as a potential conflict of interest.
All claims expressed in this article are solely those of the authors and do not necessarily represent those of their affiliated organizations, or those of the publisher, the editors and the reviewers. Any product that may be evaluated in this article, or claim that may be made by its manufacturer, is not guaranteed or endorsed by the publisher.
Balmaseda M. A., Mogensen K., Weaver A. T. (2013). Evaluation of the ECMWF ocean reanalysis system ORAS4. quart. J. R. Meteor. Soc 139, 1132–1161. doi: 10.1029/JC078i027p06386
Bayr T., Wengel C., Latif M., Dommenget D., Lübbecke J., Park W. (2019). Error compensation of ENSO atmospheric feedbacks in climate models and its influence on simulated ENSO dynamics. Clim. Dyn. 53, 155–172. doi: 10.1007/s00382-018-4575-7
Behringer D. W., Xue Y. (2004). Evaluation of the global ocean data assimilation system at NCEP: The pacific ocean. eighth symp. on integrated observing and assimilation sys- tems for atmosphere, oceans, and land surface (Seattle, WA: Amer. Meteor. Soc), 2.3.
Bruce J. (1973). Equatorial undercurrent in the western Indian Ocean during the southwest monsoon. J. Geophys. Res. 78, 6386–6394. doi: 10.1029/JC078i027p06386
Cai W., Cowan T. (2013). Why is the amplitude of the Indian ocean dipole overly large in CMIP3 and CMIP5 climate models? Geophys. Res. Lett. 40, 1200–1205. doi: 10.1002/grl.50208
Cai W., Wang J., Gan B., Wu L., Santoso A., Lin X., et al. (2018). Stabilised frequency of extreme positive Indian ocean dipole under 1.5 °C warming. Nat. Commun. 9, 1419. doi: 10.1038/s41467-018-03789-6
Cai W., Yang K., Wu L., Huang G., Santoso A., Ng B., et al. (2021). Opposite response of strong and moderate positive Indian ocean dipole to global warming. Nat. Clim Change 11, 27–32. doi: 10.1038/s41558-020-00943-1
Carton J. A., Giese B. S. (2008). A reanalysis of ocean climate using simple ocean data assimilation (SODA). Mon Weather Rev. 136, 2999–3017. doi: 10.1175/2007MWR1978.1
Chen G., Han W., Li Y., Wang D., McPhaden M. J. (2015). Seasonal-to-Interannual time-scale dynamics of the equatorial undercurrent in the Indian ocean. J. Phys. Oceanogr. 45, 1532–1553. doi: 10.1175/JPO-D-14-0225.1
Chen G., Han W., Li Y., Yao J., Wang D. (2019). Intraseasonal variability of the equatorial undercurrent in the Indian ocean. J. Phys. Oceanogr. 49, 85–101. doi: 10.1175/JPO-D-18-0151.1
Deser C., Phillips A. S., Alexander M. A. (2010). Twentieth century tropical sea surface temperature trends revisited. Geophys. Res. Lett. 37, 1–6. doi: 10.1029/2010GL043321
Eyring V., Bony S., Meehl G. A., Senior C. A., Stevens B., Stouffer R. J., et al. (2016). Overview of the coupled model intercomparison project phase 6 (CMIP6) experimental design and organization. Geosci Model. Dev. 9, 1937–1958. doi: 10.5194/gmd-9-1937-2016
Fu Y., Brandt P., Tuchen F. P., Lübbecke J. F., Wang C. (2022). Representation of the mean Atlantic subtropical cells in CMIP6 models. J. Geophys. Res. Oceans. 127, 2169–9275. doi: 10.1029/2021JC018191
Gnanaseelan C., Deshpande A. (2018). Equatorial Indian ocean subsurface current variability in an ocean general circulation model. Clim. Dyn. 50, 1705–1717. doi: 10.1007/s00382-017-3716-8
Godfrey J. S., Hu R.-J., Schiller A., Fiedler R. (2007). Explorations of the annual mean heat budget of the tropical Indian ocean. part I: Studies with an idealized model. J. Clim. 20, 3210–3228. doi: 10.1175/JCLI4157.1
Gong H., Wang L., Chen W., Nath D., Huang G., Tao W. (2015). Diverse influences of ENSO on the East Asian-western pacific winter climate tied to different ENSO properties in CMIP5 models. J. Clim. 28, 2187–2202. doi: 10.1175/JCLI-D-14-00405.1
Guilyardi E., Wittenberg A., Fedorov A., Collins M., Wang C., Capotondi A., et al. (2009). Understanding El niño in ocean-atmosphere general circulation models: Progress and challenges. Bull. Am. Meteorol Soc 90, 325–340. doi: 10.1175/2008BAMS2387.1
Huang K., Wang D., Wang W., Xie Q., Chen J., Chen L., et al. (2018). Multi-scale variability of the tropical Indian ocean circulation system revealed by recent observations. Sci. China Earth Sci. 61, 668–680. doi: 10.1007/s11430-017-9179-x
Iskandar I., Masumoto Y., Mizuno K. (2009). Subsurface equatorial zonal current in the eastern Indian ocean. J. Geophys. Res. Oceans. 114, 1–12. doi: 10.1029/2008JC005188
Iskandar I., McPhaden M. J. (2011). Dynamics of wind-forced intraseasonal zonal current variations in the equatorial Indian ocean. J. Geophys. Res. Oceans. 116, 1–16. doi: 10.1029/2010JC006864
Izumo T. (2005). The equatorial undercurrent, meridional overturning circulation, and their roles in mass and heat exchanges during El niño events in the tropical pacific ocean. Ocean Dyn. 55, 110–123. doi: 10.1007/s10236-005-0115-1
Jiang W., Gong H., Huang P., Wang L., Huang G., Hu L. (2022). Biases and improvements of the ENSO-East Asian winter monsoon teleconnection in CMIP5 and CMIP6 models. Clim. Dyn. 59, 2467–2480. doi: 10.1007/s00382-022-06220-5
Jiang W., Huang G., Huang P., Hu K. (2018). Weakening of northwest pacific anticyclone anomalies during post-El niño summers under global warming. J. Clim. 31, 3539–3555. doi: 10.1175/JCLI-D-17-0613.1
Jiang W., Huang P., Huang G., Ying J. (2021). Origins of the excessive westward extension of ENSO SST simulated in CMIP5 and CMIP6 models. J. Clim. 34, 2839–2851. doi: 10.1175/JCLI-D-20-0551.1
Jiang W., Huang P., Li G., Huang G. (2020). Emergent constraint on the frequency of central pacific El niño under global warming by the equatorial pacific cold tongue bias in CMIP5/6 models. Geophys. Res. Lett. 47, 1–9. doi: 10.1029/2020GL089519
Kalnay E., Kanamitsu M., Kistler R., Collins W., Deaven L., Gandin L., et al. (1996). The NCEP/NCAR 40-year reanalysis project. Bull. Am. Meteorol. Soc. 77, 437–471. doi: 10.1175/1520-0477(1996)077<0437:TNYRP>2.0.CO;2
Knauss J. A., Taft B. A. (1964). Equatorial undercurrent of the Indian ocean. Science. 143, 354–356. doi: 10.1126/science.143.3604.354
Kozar M. E., Misra V. (2013). Evaluation of twentieth-century Atlantic warm pool simulations in historical CMIP5 runs. Clim. Dyn. 41, 2375–2391. doi: 10.1007/s00382-012-1604-9
Lee T., Waliser D. E., Li J.-L., Landerer F. W., Gierach M. M. (2013). Evaluation of CMIP3 and CMIP5 wind stress climatology using satellite measurements and atmospheric reanalysis products. J. Clim. 26, 5810–5826. doi: 10.1175/JCLI-D-12-00591.1
Levine R. C., Turner A. G., Marathayil D., Martin G. M. (2013). The role of northern Arabian Sea surface temperature biases in CMIP5 model simulations and future projections of Indian summer monsoon rainfall. Clim. Dyn. 41, 155–172. doi: 10.1007/s00382-012-1656-x
Li G., Jian Y., Yang S., Du Y., Wang Z., Li Z., et al. (2019). Effect of excessive equatorial pacific cold tongue bias on the El niño-Northwest pacific summer monsoon relationship in CMIP5 multi-model ensemble. Clim. Dyn. 52, 6195–6212. doi: 10.1007/s00382-018-4504-9
Li G., Xie S.-P. (2012). Origins of tropical-wide SST biases in CMIP multi-model ensembles. Geophys. Res. Lett. 39, 1–5. doi: 10.1029/2012GL053777
Li G., Xie S.-P. (2014). Tropical biases in CMIP5 multimodel ensemble: The excessive equatorial pacific cold tongue and double ITCZ problems. J. Clim. 27, 1765–1780. doi: 10.1175/JCLI-D-13-00337.1
Li G., Xie S.-P., Du Y. (2015a). Monsoon-induced biases of climate models over the tropical Indian ocean. J. Clim. 28, 3058–3072. doi: 10.1175/JCLI-D-14-00740.1
Li G., Xie S.-P., Du Y. (2015b). Climate model errors over the south Indian ocean thermocline dome and their effect on the basin mode of interannual variability. J. Clim. 28, 3093–3098. doi: 10.1175/JCLI-D-14-00810.1
Li G., Xie S.-P., Du Y. (2016b). A robust but spurious pattern of climate change in model projections over the tropical Indian ocean. J. Clim. 29, 5589–5608. doi: 10.1175/jcli-d-15-0565.1
Li G., Xie S.-P., Du Y., Luo Y. (2016a). Effects of excessive equatorial cold tongue bias on the projections of tropical pacific climate change. part I: the warming pattern in CMIP5 multi-model ensemble. Clim. Dyn. 47, 3817–3831. doi: 10.1007/s00382-016-3043-5
Li G., Zhang Z., Lu B. (2021). Effects of excessive equatorial cold tongue bias on the projections of tropical pacific climate change . part II: The extreme El niño frequency in CMIP5 multi-model ensemble. Atmosphere. 12, 851. doi: 10.3390/atmos12070851
Liu L., Liu B., Han G., Feng L., Li X., Yu W. (2016). Assessment of the seasonal variation of simulated wyrtki jet over the tropical Indian ocean in CMIP5 models. Arab. J. Geosci. 9, 676. doi: 10.1007/s12517-016-2704-3
Liu H., Wang C., Lee S.-K., Enfield D. (2013). Atlantic Warm pool variability in the CMIP5 simulations. J. Clim. 26, 5315–5336. doi: 10.1175/JCLI-D-12-00556.1
Long S., Li G., Hu K., Ying J. (2020). Origins of the IOD-like biases in CMIP multimodel ensembles: The atmospheric component and ocean–atmosphere coupling. J. Clim. 33, 10437–10453. doi: 10.1175/JCLI-D-20-0459.1
McGregor S., Timmermann A., Stuecker M. F., England M. H., Merrifield M., Jin F.-F., et al. (2014). Recent walker circulation strengthening and pacific cooling amplified by atlantic warming. Nat. Clim Change. 4, 888–892. doi: 10.1038/nclimate2330
McKenna S., Santoso A., Gupta A. S., Taschetto A. S., Cai W. (2020). Indian Ocean dipole in CMIP5 and CMIP6: characteristics, biases, and links to ENSO. Sci. Rep. 10, 1–13. doi: 10.1038/s41598-020-68268-9
Mcphaden M. J. (1986). The equatorial undercurrent: 100 years of discovery. Eos Trans. Am. Geophysical Union. 67, 762–765. doi: 10.1029/EO067I040P00762
Meng Q., Latif. M., Park W., Keenlyside N. S., Semenov V. A., Martin T. (2012). Twentieth century walker circulation change: Data analysis and model experiments. Clim. Dyn. 38, 1757–1773. doi: 10.1007/s00382-011-1047-8
Metcalf W. G., Stalcup M. C. (1967). Origin of the Atlantic equatorial undercurrent. J. Geophys. Res. 72, 4959–4975. doi: 10.1029/jz072i020p04959
Nagura M., McPhaden M. J. (2010). Dynamics of zonal current variations associated with the Indian ocean dipole. J. Geophys. Res. Oceans. 115, 1–12. doi: 10.1029/2010JC006423
Nyadjro E. S., McPhaden M. J. (2014). Variability of zonal currents in the eastern equatorial Indian ocean on seasonal to interannual time scales. J. Geophys. Res. Oceans. 119, 7969–7986. doi: 10.1002/2014JC010380
Phillips H. E., Tandon A., Furue R., Hood R., Ummenhofer C. C., Benthuysen J. A., et al. (2021). Progress in understanding of Indian ocean circulation, variability, air–sea exchange, and impacts on biogeochemistry. Ocean Sci. 17, 1677–1751. doi: 10.5194/os-17-1677-2021
Power S., Delage F., Chung C., Kociuba G., Keay K. (2013). Robust twenty-first-century projections of El niño and related precipitation variability. Nature. 502, 541–545. doi: 10.1038/nature12580
Rayner N. A., Parker D. E., Horton E. B., Folland C. K., Alexander L. V., Rowell D. P., et al. (2003). Global analyses of sea surface temperature, sea ice, and night marine air temperature since the late nineteenth century. J. Geophys. Res. Atmos. 108, 4407. doi: 10.1029/2002jd002670
Reppin J., Schott F. A., Fischer J., Quadfasel D. (1999). Equatorial currents and transports in the upper central Indian ocean: Annual cycle and interannual variability. J. Geophys. Res. Oceans. 104, 15495–15514. doi: 10.1029/1999jc900093
Sachidanandan C., Lengaigne M., Muraleedharan P. M., Mathew B. (2017). Interannual variability of zonal currents in the equatorial Indian ocean: respective control of IOD and ENSO. Ocean Dyn. 67, 857–873. doi: 10.1007/s10236-017-1061-4
Samanta D., Karnauskas K. B., Goodkin N. F. (2019). Tropical pacific SST and ITCZ biases in climate models: Double trouble for future rainfall projections? Geophys. Res. Lett. 46, 2242–2252. doi: 10.1029/2018GL081363
Samuels M., Adam O., Gildor H. (2021). A shallow thermocline bias in the southern tropical pacific in CMIP5/6 models linked to double-ITCZ bias. Geophys. Res. Lett. 48, 1–11. doi: 10.1029/2021GL093818
Sandeep S., Ajayamohan R. S. (2014). Origin of cold bias over the Arabian Sea in climate models. Sci. Rep. 4, 1–7. doi: 10.1038/srep06403
Schott F. A., McCreary J. P. (2001). The monsoon circulation of the Indian. Prog. Oceanogr. 51, 1–123. doi: 10.1016/S0079-6611(01)00083-0
Schott F. A., Xie S.-P., McCreary J. P. (2009). Indian Ocean circulation and climate variability. Rev. Geophys. 47, 1–46. doi: 10.1029/2007RG000245
Shashikanth K., Salvi K., Ghosh S., Rajendran K. (2014). Do CMIP5 simulations of Indian summer monsoon rainfall differ from those of CMIP3? Atmospheric Sci. Lett. 15, 79–85. doi: 10.1002/asl2.466
Siongco A. C., Hohenegger C., Stevens B. (2015). The Atlantic ITCZ bias in CMIP5 models. Clim. Dyn. 45, 1169–1180. doi: 10.1007/s00382-014-2366-3
Sohn B. J., Yeh S.-W., Schmetz J., Song H.-J. (2013). Observational evidences of walker circulation change over the last 30 years contrasting with GCM results. Clim. Dyn. 40, 1721–1732. doi: 10.1007/s00382-012-1484-z
Taylor K. E. (2001). Summarizing multiple aspects of model performance in a single diagram. J. Geophys. Res. 106, 7183–7192. doi: 10.1029/2000JD900719
Taylor K. E., Stouffer R. J., Meehl G. A. (2012). An overview of CMIP5 and the experiment design. Bull. Am. Meteorol Soc 93, 485–498. doi: 10.1175/BAMS-D-11-00094.1
Thompson B., Gnanaseelan C., Salvekar P. (2006). Variability in the Indian ocean circulation and salinity and its impact on SST anomalies during dipole events. Mar. Freshw. Res. 64, 853–880. doi: 10.1357/002224006779698350
Tokinaga H., Xie S.-P., Deser C., Kosaka Y., Okumura Y. M. (2012). Slowdown of the walker circulation driven by tropical indo-pacific warming. Nature. 491, 439–443. doi: 10.1038/nature11576
Wang J., Dong L. (2015). Roles of western and eastern boundary reflections in the interannual sea level variations during negative Indian ocean dipole events. J. Phys. Oceanogr. 45, 1804–1821. doi: 10.1175/JPO-D-14-0124.1
Wang Z., Li G., Yang S. (2018). Origin of Indian summer monsoon rainfall biases in CMIP5 multimodel ensemble. Clim. Dyn. 51, 755–768. doi: 10.1007/s00382-017-3953-x
Wang P., Tam C.-Y., Xu K. (2019). El Niño–East Asian monsoon teleconnection and its diversity in CMIP5 models. Clim. Dyn. 53, 6417–6435. doi: 10.1007/s00382-019-04938-3
Wang C., Zhang L., Lee S.-K., Wu L., Mechoso C. R. (2014). A global perspective on CMIP5 climate model biases. Nat. Clim Change. 4, 201–205. doi: 10.1038/nclimate2118
Wu T., Lu Y., Fang Y., Xin X., Li L., Li W., et al. (2019). The Beijing climate center climate system model (BCC-CSM): The main progress from CMIP5 to CMIP6. Geosci Model. Dev. 12, 1573–1600. doi: 10.5194/gmd-12-1573-2019
Wyser K., Noije T. V., Yang S., Hardenberg J. V., O’Donnell D., Döscher R. (2020). On the increased climate sensitivity in the EC-earth model from CMIP5 to CMIP6. Geosci Model. Dev. 13, 3465–3474. doi: 10.5194/gmd-13-3465-2020
Xu K., Huang R., Wang W., Zhu C., Lu R. (2017). Thermocline fluctuations in the equatorial pacific related to the two types of El niño events. J. Clim. 30, 6611–6627. doi: 10.1175/JCLI-D-16-0291.1
Ying J., Huang P., Lian T., Tan H. (2019). Understanding the effect of an excessive cold tongue bias on projecting the tropical pacific SST warming pattern in CMIP5 models. Clim. Dyn. 3–4), 1805–1818. doi: 10.1007/s00382-018-4219-y
Zhang D., McPhaden M. J., Lee T. (2014). Observed interannual variability of zonal currents in the equatorial Indian ocean thermocline and their relation to Indian ocean dipole. Geophys. Res. Lett. 41, 7933–7941. doi: 10.1002/2014GL061449
Zhang G., Song X. (2010). Convection parameterization, tropical pacific double ITCZ, and upper-ocean biases in the NCAR CCSM3. part II: Coupled feedback and the role of ocean heat transport. J. Clim. 23, 800–812. doi: 10.1175/2009JCLI3109.1
Zheng X., Gao L., Li G., Du Y. (2016). The southwest Indian ocean thermocline dome in CMIP5 models: Historical simulation and future projection. Adv. Atmos Sci. 33, 489–503. doi: 10.1007/s00376-015-5076-9
Zheng Y., Lin J.-L., Shinoda T. (2012). The equatorial pacific cold tongue simulated by IPCC AR4 coupled GCMs: Upper ocean heat budget and feedback analysis. J. Geophys. Res. Oceans. 117 (5), C05024. doi: 10.1029/2011JC007746
Keywords: equatorial undercurrent, westerly wind bias, thermocline tilt, cold togue bias, walker circulation, CMIP models
Citation: Li J, Xu K, Wang W, He Z and Huang K (2023) Biases and improvements of the boreal winter–spring equatorial undercurrent in the Indian Ocean in the CMIP5 and CMIP6 models. Front. Mar. Sci. 10:1168385. doi: 10.3389/fmars.2023.1168385
Received: 17 February 2023; Accepted: 30 March 2023;
Published: 17 April 2023.
Edited by:
Tengfei Xu, Ministry of Natural Resources, ChinaCopyright © 2023 Li, Xu, Wang, He and Huang. This is an open-access article distributed under the terms of the Creative Commons Attribution License (CC BY). The use, distribution or reproduction in other forums is permitted, provided the original author(s) and the copyright owner(s) are credited and that the original publication in this journal is cited, in accordance with accepted academic practice. No use, distribution or reproduction is permitted which does not comply with these terms.
*Correspondence: Kang Xu, eHVrYW5nQHNjc2lvLmFjLmNu; Weiqiang Wang, d2VpcWlhbmcud2FuZ0BzY3Npby5hYy5jbg==
Disclaimer: All claims expressed in this article are solely those of the authors and do not necessarily represent those of their affiliated organizations, or those of the publisher, the editors and the reviewers. Any product that may be evaluated in this article or claim that may be made by its manufacturer is not guaranteed or endorsed by the publisher.
Research integrity at Frontiers
Learn more about the work of our research integrity team to safeguard the quality of each article we publish.