- 1College of Fisheries, Zhejiang Ocean University, Zhoushan, China
- 2Yellow Sea Fisheries Research Institute, Chinese Academy of Fishery Sciences, Qingdao, China
- 3Laboratory for Marine Science and Food Production Processes, Laoshan Laboratory, Qingdao, China
Neopyropia yezoensis is a typical intertidal seaweed and an indispensable species for conservation of seaweed resources. As one of the most important marine vegetables, the cultivation area of N. yezoensis has been largely increasing in the past decade and ranked the second highest among all the farmed seaweeds in China. It remains unknown whether large-scale cultivation of N. yezoensis has a genetic impact on wild populations. In this study, SSR markers and 18S rDNA were applied for diversity and genetic structure analysis of 22 N. yezoensis populations from North China. Twenty-two haplotypes were generated from 352 18S rDNA sequences and only three haplotypes were shared by both cultivated and wild populations. Based on 11 polymorphic SSR markers developed, the average polymorphism of the cultivated N. yezoensis populations was higher than that of the wild populations, with the percentage of polymorphic loci being 90.91% in most cultivated populations. The cultivated populations were clustered separately from the wild ones based on the population phylogenetic tree. This indicates that cultivated N. yezoensis populations are diverse and divergent from wild populations in China. However, there were cultivated individuals mixed with the wild ones based on the individual phylogenetic tree and STRUCTURE analysis. The genetic differentiation between cultivated and wild populations decreased with increasing cultivation time, suggesting a possible long-term and slow process of genetic introgression between cultivated N. yezoensis and the wild resource. The wild populations were grouped into two distinct clades by SSRs, with one distributed around the intersection between the Yellow Sea and the Bohai Sea, where the populations were characterized by a specific 18S rDNA haplotype. These findings provide useful insights into germplasm conservation, genetic breeding and improvement of N. yezoensis farming practices.
Background
Global warming and human activities are causing significant climatic, environmental and ecological changes, which leads to various problems, such as the change of macroalgal habitat, germplasm degradation, frequent occurrence of harmful algal blooms (Zhao, 2014; Huang and Yan, 2019a; Huang and Yan, 2019b). Due to the ecological and economic values, the scale and yield of cultivated macroalgae in China has been increasing dramatically, ranking the first in the world (Yang, 2016). It is essential to determine whether large-scale cultivation of seaweed has a genetic impact on wild resources for the protection of germplasm resources and to improve farming strategies. It was found that the cultivated population of Undaria pinnatifida (Shan et al., 2018; Li et al., 2020) and Saccharina japonica (Shan et al., 2019) had higher gene exchange with the spontaneous populations on the cultivation rafts, but less with the spontaneous populations in the adjacent subtidal zone. This area of research has recently gained attention and warrants further study.
Neopyropia yezoensis belongs to the primitive red algal order Bangiales, is a typical intertidal macroalga, and has received great interest as a model organism for the study of intertidal germplasm resources (Iitsuka et al., 2002; Mao et al., 2019). N. yezoensis is an endemic laver species in the Northwest Pacific and is widely distributed in North China, Korea and Japan (Yang et al., 2020). It is one of the most important mariculture crops with high nutritional values and is mainly cultivated in Japan, Korea and China (Miura, 1988; Park et al., 2007). In China, the earliest artificial cultivation of N. yezoensis began in the 1970s and gained a rapid development in the late 1980s in the southern Yellow Sea that has long been the main cultivation area of this species with the annual cultivation area exceeding 40,000 hectares (Yang et al., 2017). Owing to the full-exploitation of the applicable culture area in southern Yellow Sea and global warming, farming of N. yezoensis has been moving northward to the middle and northern Yellow Sea in recent years, with the culture area increasing year by year (Li et al., 2018; Wang et al., 2019; Liang et al., 2022).
Bangiales has simple and highly variable morphology, which leads to difficulties in species identification, interpretation of the distribution of particular species and consequent knowledge of the biodiversity in a particular region (Guillemin et al., 2016; Gunnarsson et al., 2016). Molecular techniques provide a practical tool to make the identification of Bangiales more accurate and enable worldwide comparisons to be made (Yang et al., 2020). One such technique involves the use of specific DNA sequences. Several DNA sequences have been applied for species identification and biosystematics of Bangiales, i.e., the nuclear small RNA gene (SSU-nrDNA, 18S rDNA), the internal transcribed spacers of the nuclear ribosomal DNA cistron (ITS-1 and ITS-2), the plastid-encoded ribulose-1,5-biphospate carboxylase/oxygenase large subunit gene (rbcL), the intergenic spacer between rbcL and small subunit gene (rbcS) and the cytochrome c oxidase subunit I (COI-5P), among which 18S rDNA and rbcL sequences are the most widely applied due to the moderate evolution rate and the abundance of reference data in GenBank (Sutherland et al., 2011; Guillemin et al., 2015; Gunnarsson et al., 2016; Yang et al., 2017; Yang et al., 2020). New insights have been made regarding the systematics of bladed Bangiales based on 18S rDNA and rbcL sequences, e.g., the species N. yezoensis was initially defined as Porphyra yezoensis, later Pyropia yezoensis (Sutherland et al., 2011), and now Neopyropia yezoensis (Yang et al., 2020). Except for species identification, DNA sequences have been widely subject to phylogeographic analysis of particular seaweed species (Hu et al., 2017; Koh and Kim, 2020).
Another technique involves the use of molecular markers. Several traditional molecular markers have been applied for N. yezoensis, such as Amplified Fragment Length Polymorphisms (AFLPs; Iitsuka et al., 2002; Weng et al., 2005; Yang et al., 2016; Cao et al., 2018), Inter-Simple Sequence Repeats (ISSRs; Cui et al., 2006; Sun et al., 2007; Yang et al., 2016), Randomly Amplified Polymorphic DNAs (RAPDs; Song et al., 1998; Jia et al., 2000; Yang et al., 2016), and Sequence-Related Amplified Polymorphisms (SRAPs; Huang and Yan, 2019a). Microsatellite DNA, also known as the simple sequence repeats (SSRs), is ubiquitously distributed throughout both eukaryotic and prokaryotic genomes (Tautz and Schlötterer, 1994). Due to the advantages of high polymorphism, codominant inheritance, objective and clear amplification bands, simple experimental operation, good stability and repeatability, SSRs have become the most widely used molecular marker system for molecular biological research (Rungis et al., 2004; Shan et al., 2018; Jia et al., 2022), including the use for genetic differentiation of wild and farmed populations of varying economic species (Pan and Yang, 2010; An et al., 2011). SSRs have been used for population genetic diversity analysis of N. yezoensis (Yu, 2010; Wei, 2012). In recent years, more and more SSR markers have been developed for N. yezoensis based on the genomic and transcriptomic data (Lu, 2016; Huang and Yan, 2019b; Liu et al., 2019; Kim et al., 2021). The most relevant studies were focused on the genetic diversification of different geographical populations and/or species, and some were regarding the construction of the genetic linkage maps, while none have investigated the genetic impact of large-scale N. yezoensis aquaculture on wild populations.
In this study, our primary objectives are to investigate the genetic diversity and population structure of wild and cultivated N. yezoensis populations from the Yellow Sea and the Bohai Sea in China. By utilizing microsatellite markers and 18S rDNA sequencing, we aim to (1) assess the genetic diversity within and among these populations, (2) explore the genetic differentiation and phylogenetic relationships between wild and cultivated populations, and (3) evaluate the potential impacts of cultivation practices on the genetic diversity of cultivated populations. Our findings will provide valuable insights into the conservation and sustainable management of N. yezoensis resources and may facilitate the development of more effective breeding strategies to improve the productivity and resilience of cultivated N. yezoensis populations.
Materials and methods
Sample collection
A total of 22 Neopyropia yezoensis populations were extensively collected along the coasts and islands of the Yellow Sea and the Bohai Sea in China, including 13 wild populations (grown naturally on rocks and/or other natural substrates in intertidal zones) and 9 cultivated populations (cultivated on culture nets, with the samples from the same source of seedlings defined as a cultured population). The sampling sites selected represent a comprehensive range of geographical locations and environmental conditions across the coasts and islands of the Yellow Sea and the Bohai Sea in China, which allowed us to capture the potential genetic variation in N. yezoensis populations that may be influenced by factors such as latitude, water temperature, salinity, and nutrient levels. The detailed information on the sampling sites, including their geographical coordinates, was provided in Figure 1 and Table S1 (Supplementary Material 1). Samples were collected in the spring of 2021, with at least 15 samples from each population. After the samples were transported to the laboratory in Qingdao at 4°C, they were rinsed several times with filtered (0.22 μm pore size) and autoclaved seawater to remove the epiphytic organisms. Subsequently, the surface water was dried with absorbent paper. Then, each sample (individual) was immediately frozen in liquid nitrogen and stored at -80°C.
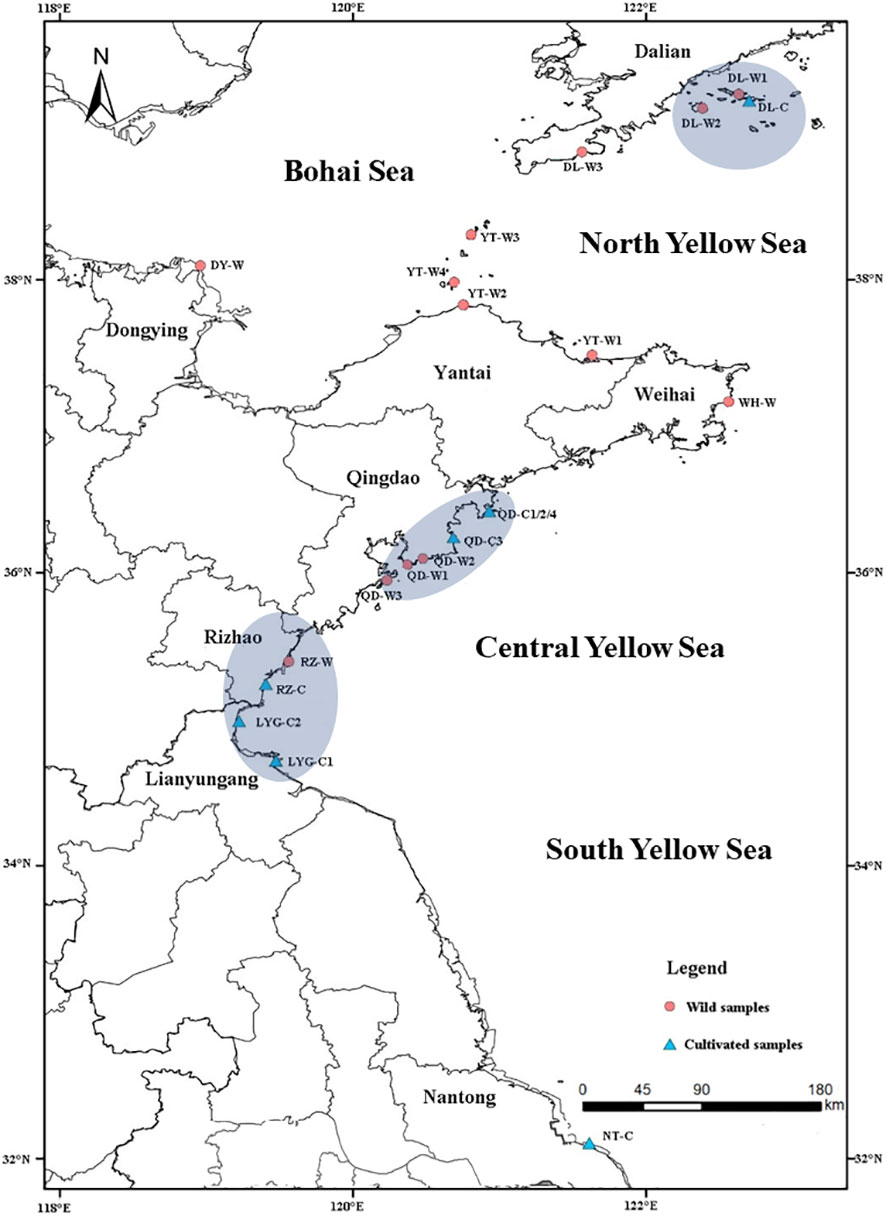
Figure 1 Geographical location of the sampling sites for Neopyropia yezoensis. The three blue circles showed the three regions with both wild and cultivated populations.
Genomic DNA extraction and PCR amplification
The genomic DNAs of the samples were extracted by using the Super Plant Genomic DNA Kit (for polysaccharide- and polyphenol-rich plants) (DP360, Tiangen, Beijing, China). The concentration and purity of the DNAs were assessed by a nucleic acid protein detector (FC-2100, Lifereal, Hangzhou, China) and 1% agarose gel electrophoresis (DYY-10C, Beijing Liuyi Biotechnology, Beijing, China).
The primer sequences for 18S rDNA amplification were:
Forward: 5’- CAGAGCGCTTTGAGATGATTC-3’;
Reverse: 5’- CCCGACAAGAGGAGACAAACT-3’.
The 25 μL reaction system was composed of 2 μL template DNA (25 ng μL-1), 0.5 μL of each primer (10 μmol L-1), 12.5 μL 2×Rapid Taq Master Mix (Sangon Biotech, China) and 9.5 μL ddH2O. The PCR reactions were conducted on a gradient thermocycler (Bioer Technology, China) using the program: initialization at 95 °C for 3 min, followed by 35 cycles of denaturation at 94 °C for 15 s, annealing at 53 °C 15 s, and extension at 72 °C for 30 s, then a final extension at 72 °C for 5 min. The amplified products were stored at 4°C at the end of the reaction process. The concentration and purity of the PCR products were assessed using a NanoDrop spectrophotometer (Thermo Fisher Scientific) and agarose gel electrophoresis, respectively. Primers were synthetized and PCR products were sequenced by Sangong Biotech (Shanghai, China). The raw-reads data were deposited in the NCBI Sequence Read Archive (SRA) with the accession number of PRJNA936265.
Screening of microsatellite markers
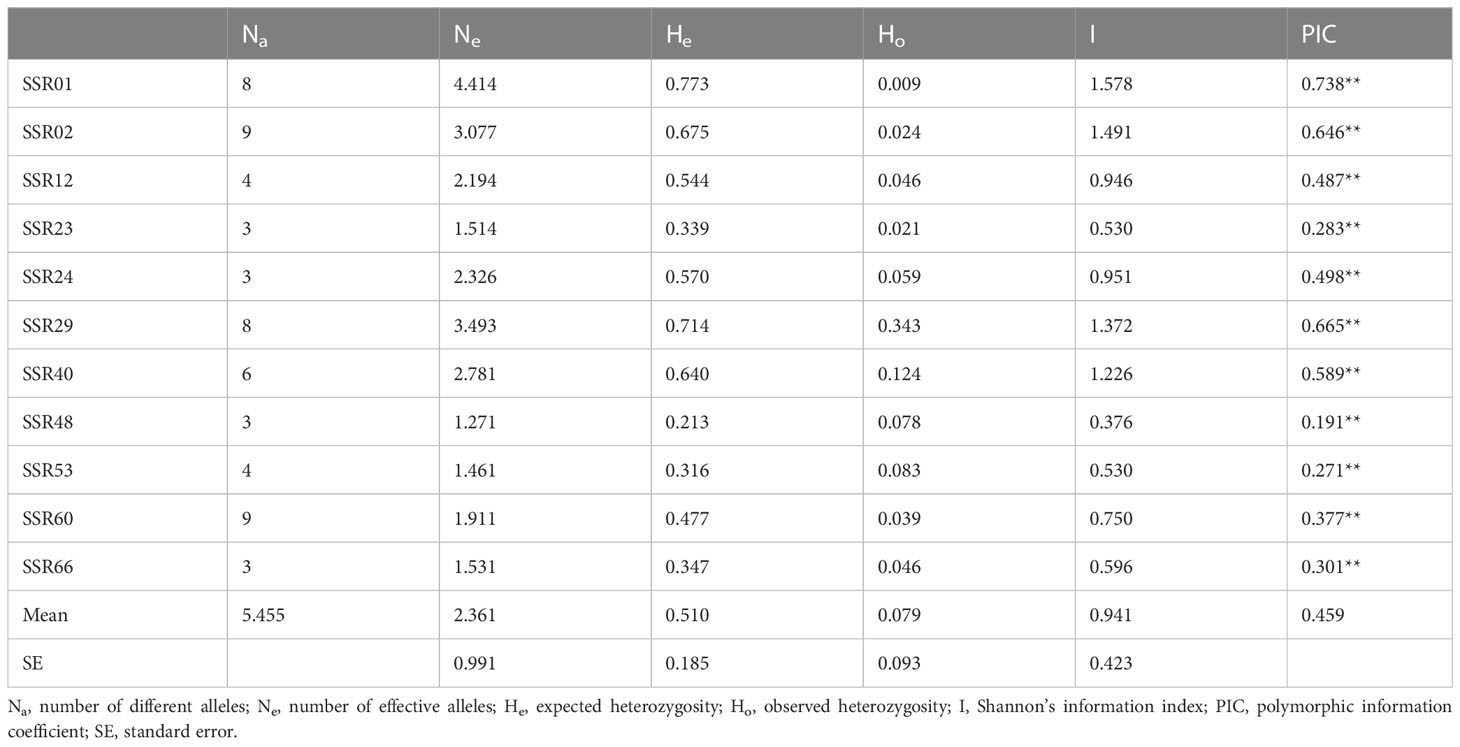
Eight genomic DNA samples were randomly selected from 22 N. yezoensis populations for SSR markers screening. A total of 68 SSR markers from the transcriptome data were used for screening (Lu, 2016). All amplifications were performed in 20 μL reactions, which included 1 μL of template DNA (50 ng μL-1), 0.5 μL of each primer (20 μmol L-1), 10 μL of 2×Taq Master mix (Taq DNA Polymerase, dNTP, MgCl2 and reaction buffer) and 8 μL of ddH2O. The PCR amplification procedure was as follows: initial denaturation at 94°C for 5 min; followed by 35 cycles of denaturation at 94°C for 30 s, annealing at 55°C for 30 s, and elongation at 72°C for 20 s; and a final extension at 72°C for 10 min. The amplified products were stored at 4°C at the end of the reaction process. Electrophoresis of the amplified products was conducted in 1.5% agarose gel at 100 V for 15 min and then photographed and detected by a fully automated image analysis system. (Tanon-3500R, Biotanon, Shanghai, China). Capillary electrophoresis and genotyping of the PCR products with stable amplification process and clear bands were performed using a 3730xl sequencer, and the data were analyzed by GeneMapper 4.1 software. The SSR markers with fragment polymorphism and high amplification efficiency were screened out and used to analyze the genetic diversity of the total 375 samples from the 22 N. yezoensis populations. The PCR amplification procedure for 375 individuals were performed at each annealing temperature of the screened SSR primer pairs as shown in Table 1.
Data analysis
Popgen 32 software (Yeh et al., 1999) was used to calculate the SSR loci and to analyze the genetic diversity of the N. yezoensis populations. The following parameters were obtained: number of observed alleles (Na), effective number of alleles (Ne), Shannon’s information index (I), polymorphism information coefficient (PIC), expected heterozygosity (He), observed heterozygosity (Ho) and Hardy-Weinberg Equilibrium (HWE). The phylogenetic trees were constructed based on 375 individuals and 22 populations, respectively, by using POPULATIONS version 1.2.30 and FigTree version 1.4.3 (Andrew, 2016). The clustering analysis of the N. yezoensis populations was performed using STRUCTURE version 2.3.4 based on Bayesian models, with the number of clusters set to 2-22, and 20 independent runs were performed for each K value using a mixture model and an allele frequency correlation model (Pritchard et al., 2000), and the best K value was determined using STRUCTURE HARVESTER based on the delta K value (Evanno et al., 2005). Based on the result of population genetic structure analysis, the genetic differentiation coefficient (Fst) between populations were determined with GenAlex version 6.501 (Nei, 1972). Analysis of molecular variance (AMOVA) was performed on the N. yezoensis populations, and principal coordinates analysis (PCoA) was performed based on individual genetic distance matrices (Anderson and Willis, 2003; Chae and Warde, 2006) to infer the genetic relationship between populations.
BioEdit version 7.0.9.0 and MEGA 11 were used to manually edit and align the obtained 18S rDNA sequences of the 22 N. yezoensis populations. The number of segregating sites (S), number of haplotypes (h), haplotype diversity (Hd), and nucleotide diversity (Pi) were measured with DnaSP version 6.0. NETWORK 10.2 software was used to generate the parsimony networks of haplotypes based on the median-joining method.
Results
Characteristics and polymorphism of SSR markers
Eleven pairs of primers with polymorphism were obtained (Table 1). The genetic parameters showed that 60 alleles were amplified for 11 microsatellite loci from 375 individuals of 22 N. yezoensis populations (Table 2). The minimum number of different alleles (Na) was 3 (SSR23, SSR24, SSR48, SSR66), and the maximum Na was 9 (SSR02, SSR60). The number of effective alleles (Ne) varied from 1.271 (SSR48) to 4.414 (SSR01). Among the 11 microsatellite markers, SSR48 had the minimum Shannon’s information index (I) value (0.376) and polymorphic information coefficient (PIC) value (0.191), which indicated its lowest polymorphism. I value (1.578) and PIC value (0.738) of SSR01 were the maximum, indicating the highest polymorphism of this locus. Except for SSR48, the I value of the other 10 microsatellite markers were all greater than 0.5, and the PIC value were all greater than 0.25. The expected heterozygosity (He) ranged from 0.213 (SSR48) to 0.773 (SSR01), with an average of 0.510, and the observed heterozygosity (Ho) ranged from 0.009 (SSR01) to 0.343 (SSR29). All the Ho were smaller than He, indicating the loss of heterozygosity. All of the SSRs deviated from the Hardy-Weinberg equilibrium significantly (P<0.01).
Genetic diversity analysis of Neopyropia yezoensis populations based on microsatellite markers
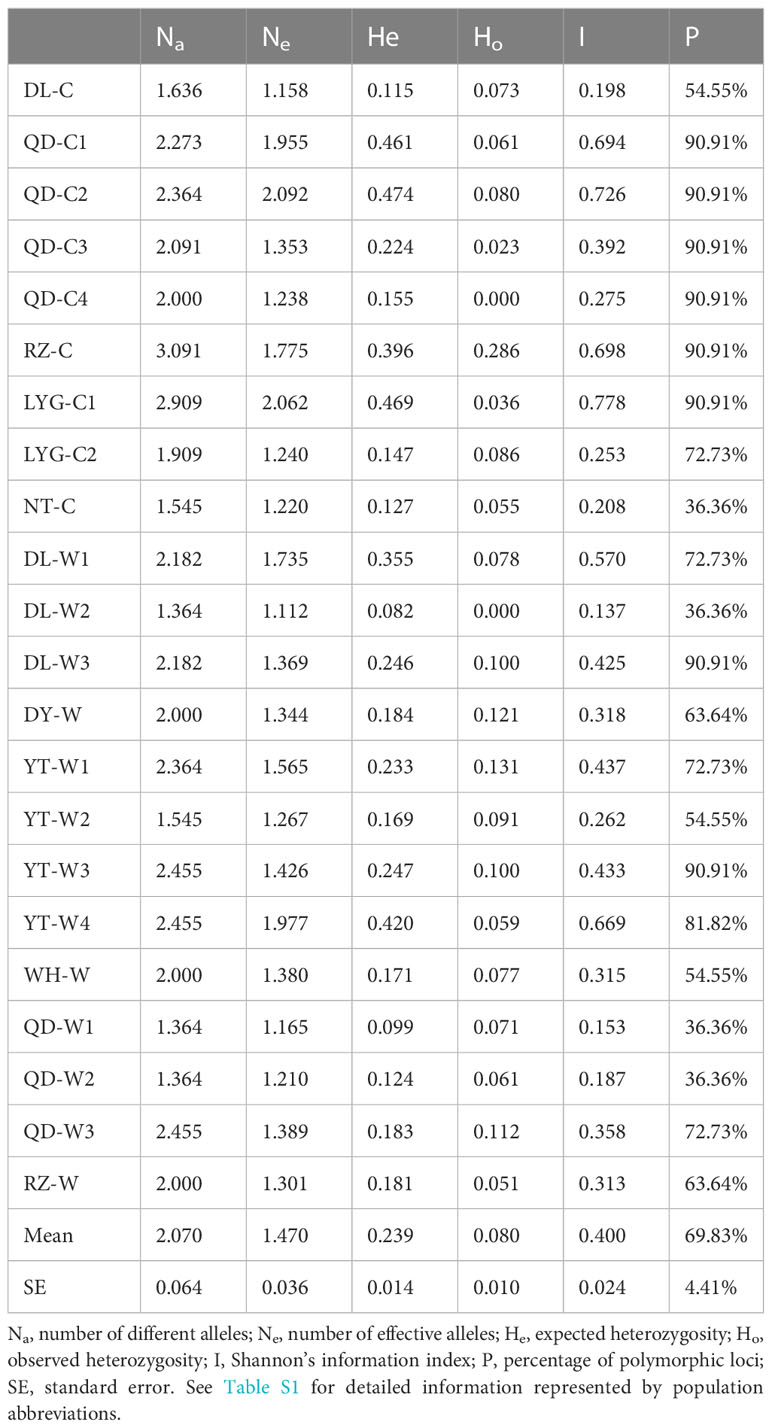
Among the 22 N. yezoensis populations, Na ranged from 1.364 (DL-W2 and QD -W1, QD-W2) to 3.091(RZ-C), Ne varied from 1.112 (DL-W2) to 2.092 (QD-C2), He ranged from 0.082 (DL-W2) to 0.474 (QD-C2), and Ho ranged from 0.000 (QD-C4 and DL-W2) to 0.286 (RZ-C). The I value in the 22 populations ranged from 0.137 (DL-W2) to 0.778 (LYG-C1), with the average of 0.400. The percentage of polymorphic SSR loci in the 22 populations ranged from 36.36% to 90.91%, with the average P value of 69.83% (Table 3). The Na, Ne, He and Ho values of population DL-W2 were all the minimum. Meanwhile, the I and P value of DL-W2 were the lowest. It indicated that DL-W2 had the lowest genetic diversity among these 22 N. yezoensis populations.
The phylogenetic tree based on 375 individuals identified 2 major clusters (I and II), each of which was further grouped into 2 subclades (C1 and C2, C3 and C4) (Figure 2). Two hundred and forty-two (64.53%) of the individuals were assigned into C3. The C1 contained the second largest number of individuals (66). The C2 contained the least individuals (12). None of the major clusters and/or sub-clusters was composed of exclusively individuals from a particular population or collection zone, indicating intermixing among N. yezoensis populations.
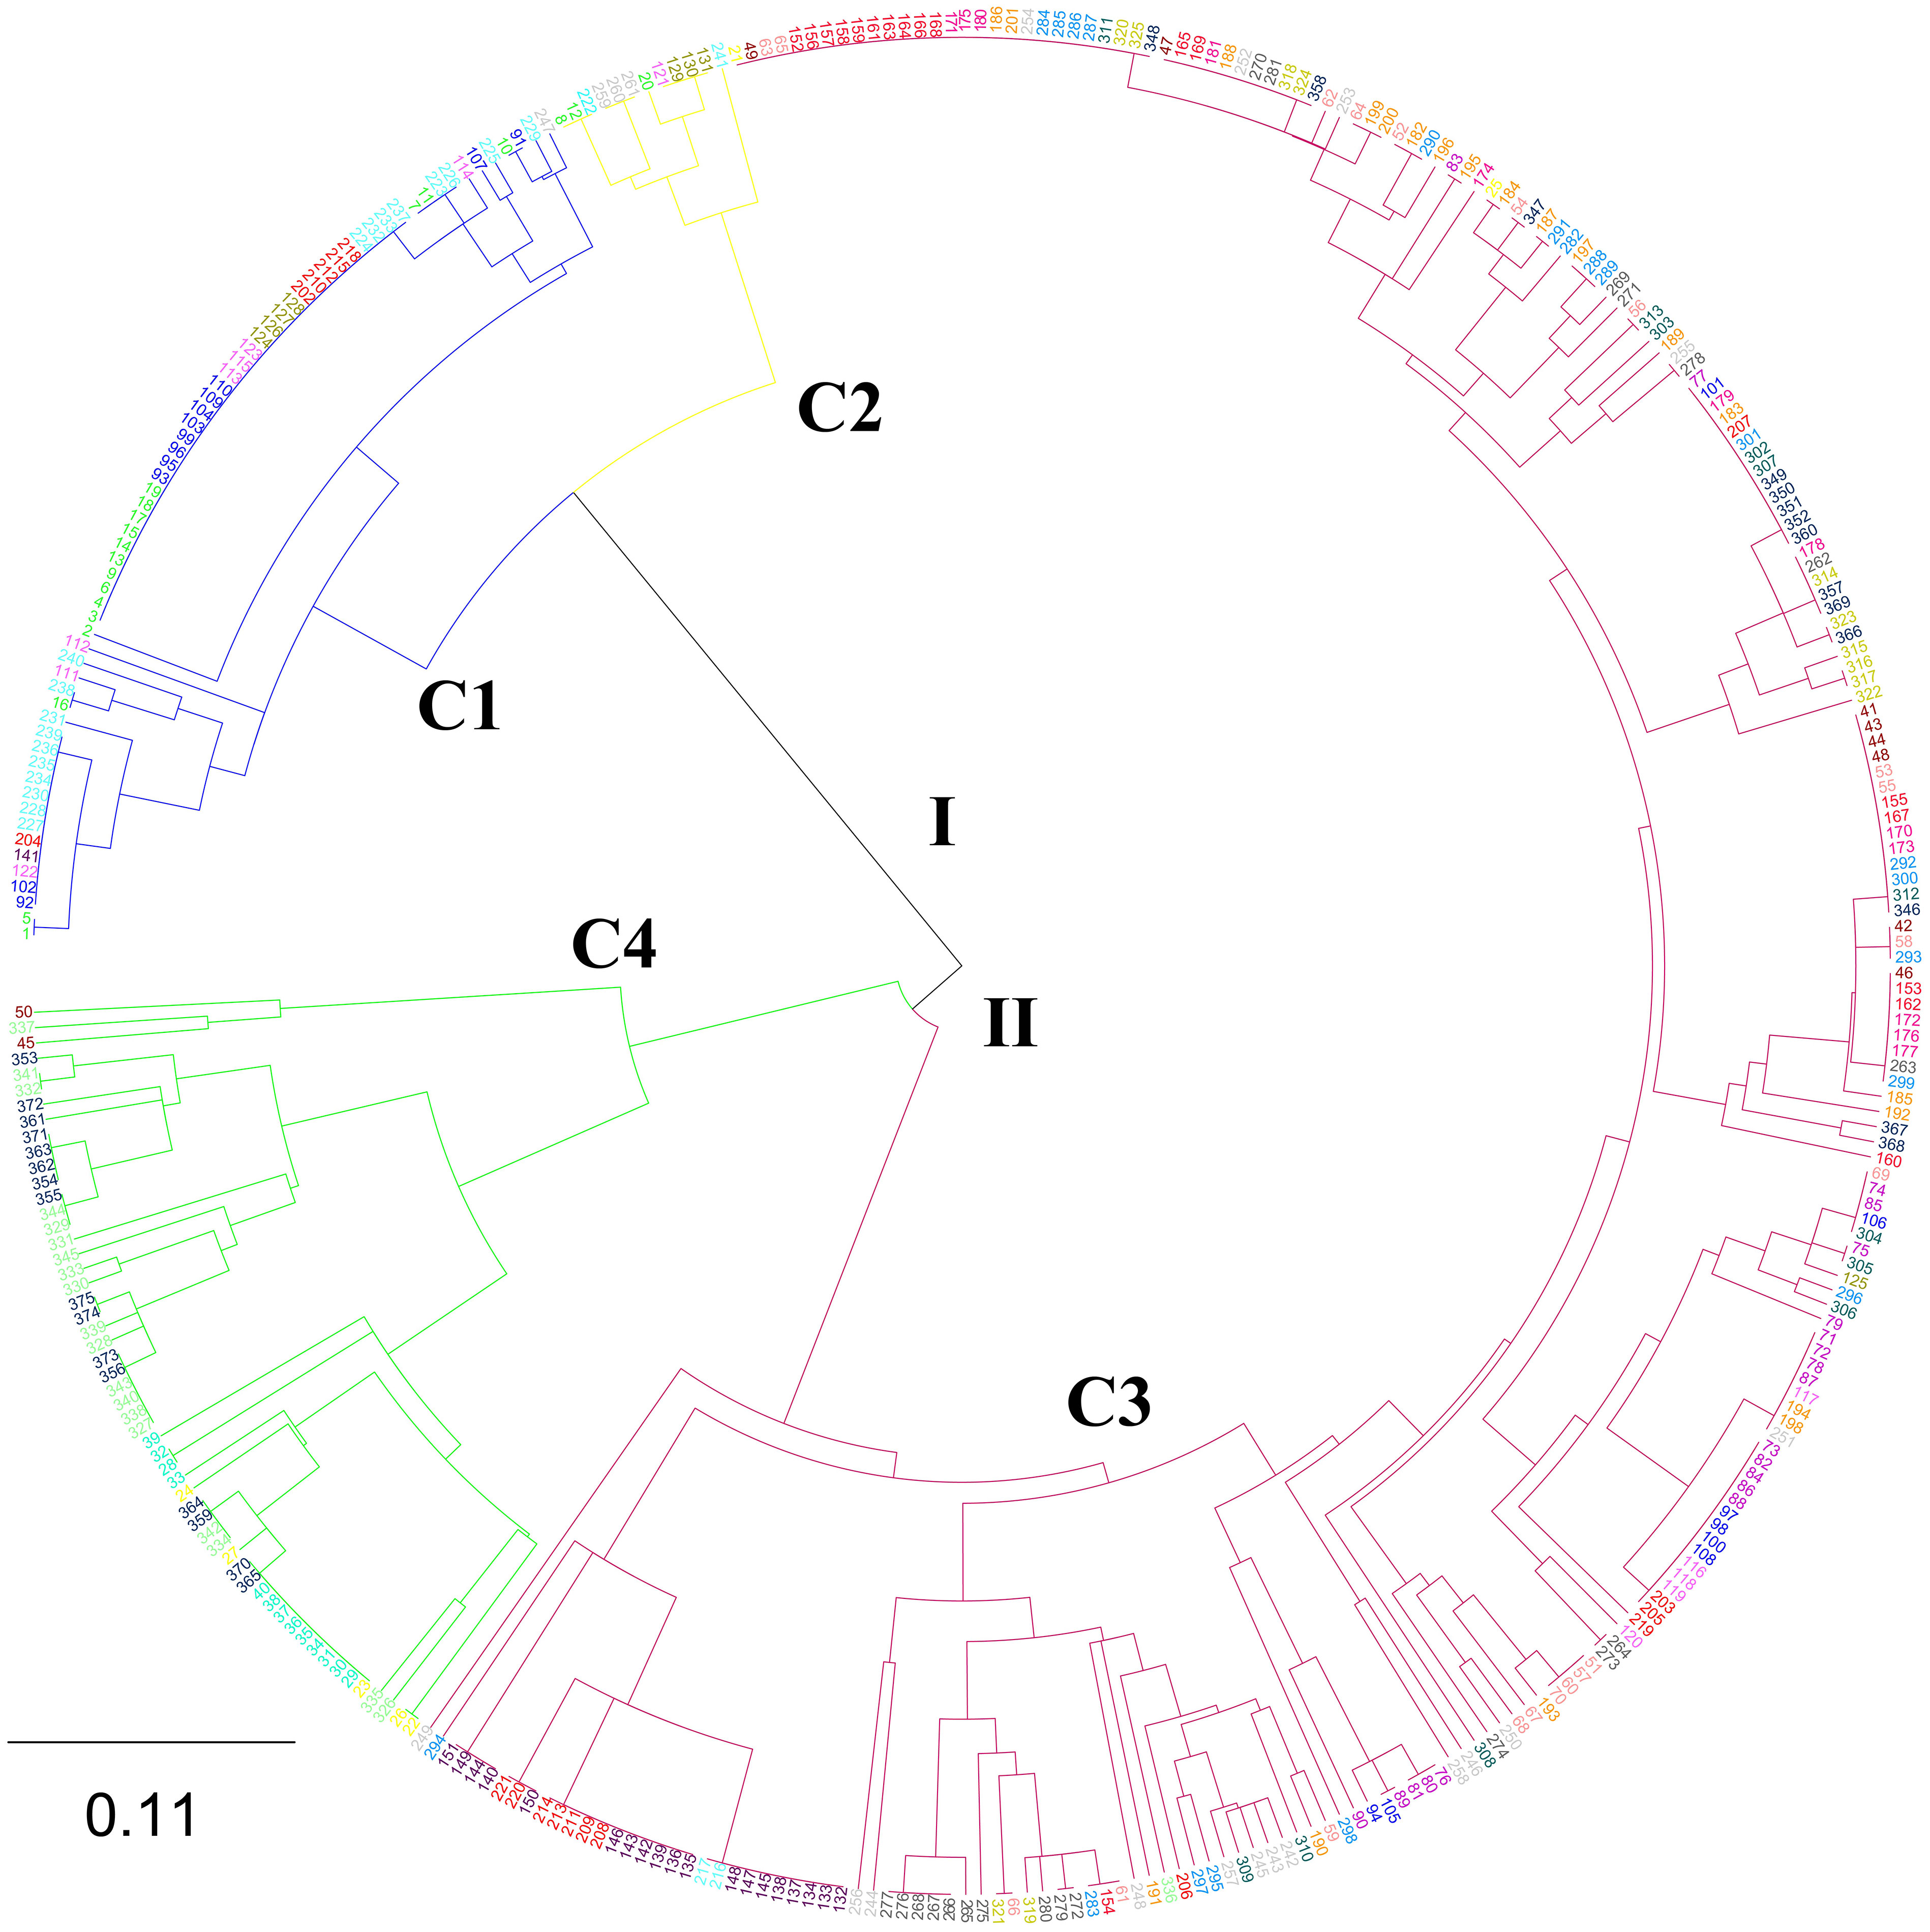
Figure 2 The phylogenetic tree based on 375 individuals of 22 Neopyropia yezoensis populations by UPGMA method. See Table S1 for detailed information of the 375 individuals.
The optimal K value was determined to be 4 based on the delta K value (Figure 3), and the structure plot showed that the 22 N. yezoensis populations were divided into 4 groups (Figure 4A). Thirteen wild populations and 9 cultivated populations were both divided into 2 different groups, respectively. If set the K value to 2 manually (Figure 4B), i.e., assigning the 22 populations into two groups, it was found there was a high gene exchange between the cultivated populations of NT-C, QD-C4, LYG-C1 and RZ-C and the wild populations.
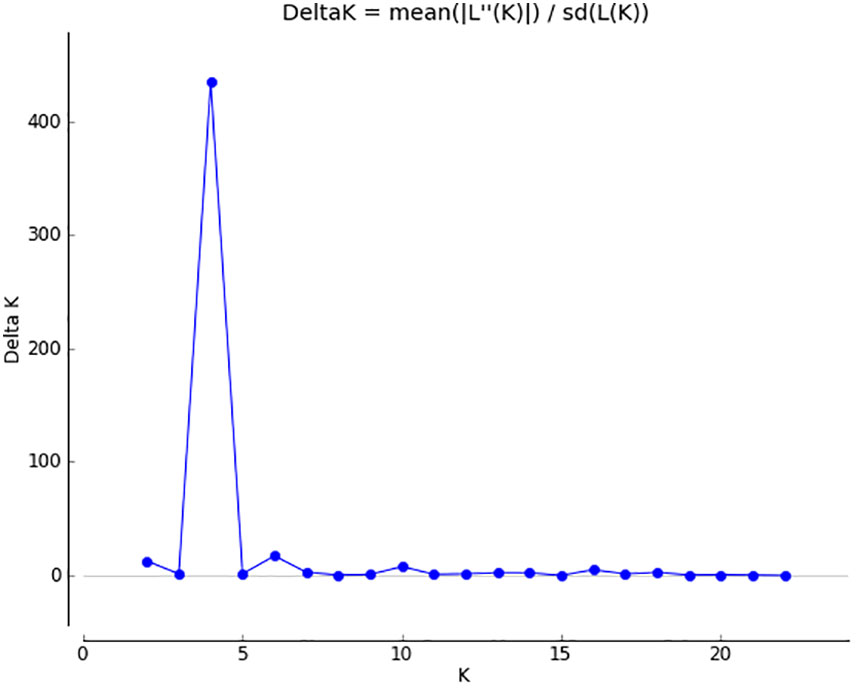
Figure 3 Determination of optimal K value: the optimal K value was identified by the use of STRUCTURE HARVESTER according to the delta K value.
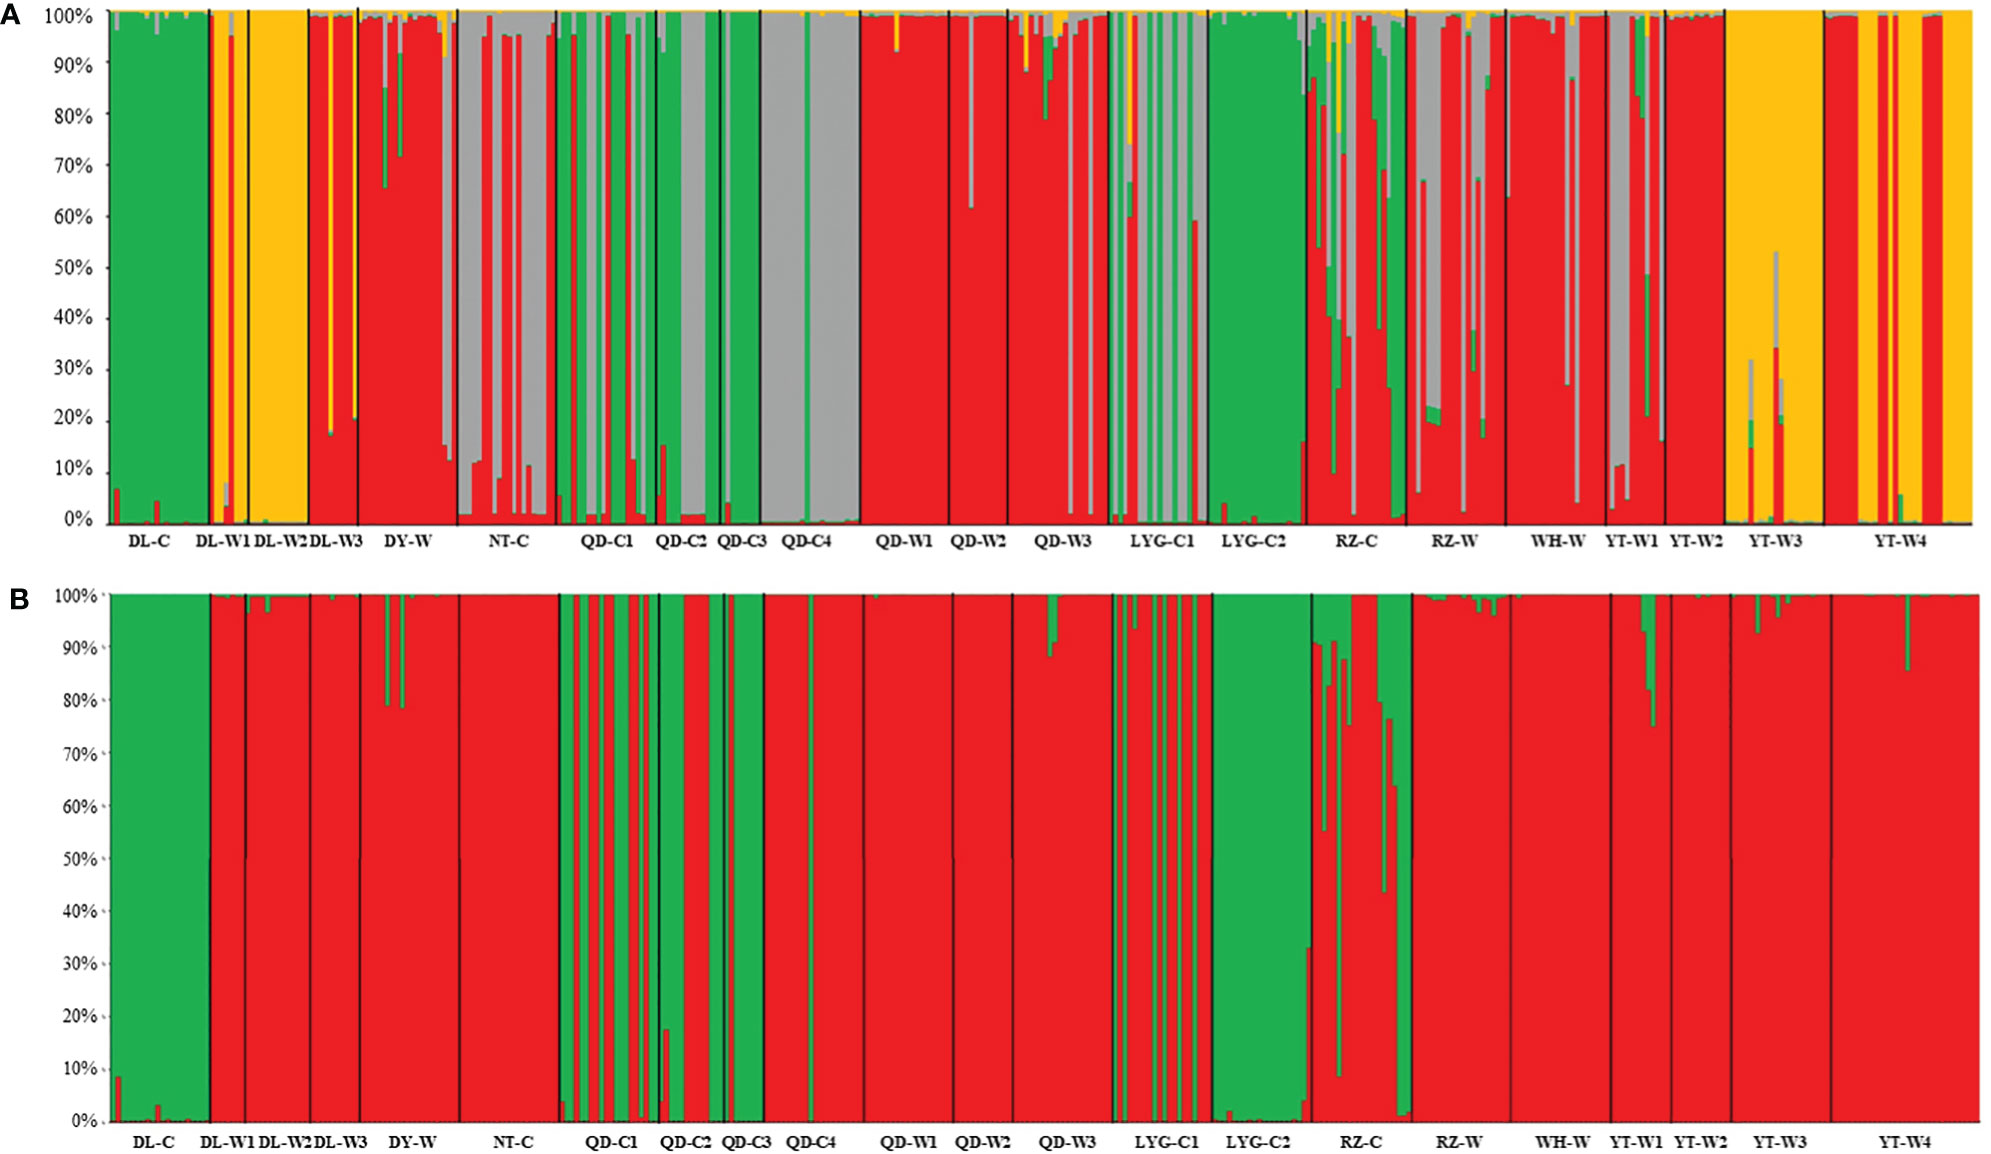
Figure 4 Genetic structure analysis resulting from a Bayesian model-based analysis using STRUCTURE Version 2.3.4 for 22 populations of Neopyropia yezoensis (A: K=4; B: K=2). Each individual is represented by a colored bar, and the proportion of the color in each bar represents the probability of membership in the relevant cluster. See Table S1 for detailed information represented by population abbreviations.
The 22 populations were divided into 3 major taxa based on the PCoA analysis. DL-W1, DL-W2, DL-W3, YT-W3, YT-W4 were one taxon, DL-C, LYG-C2, QD-C1, QD-C2, QD-C3 and a small amount of individuals from RZ-C formed a taxon, and the remaining individuals were clustered into a taxon (Figure 5).
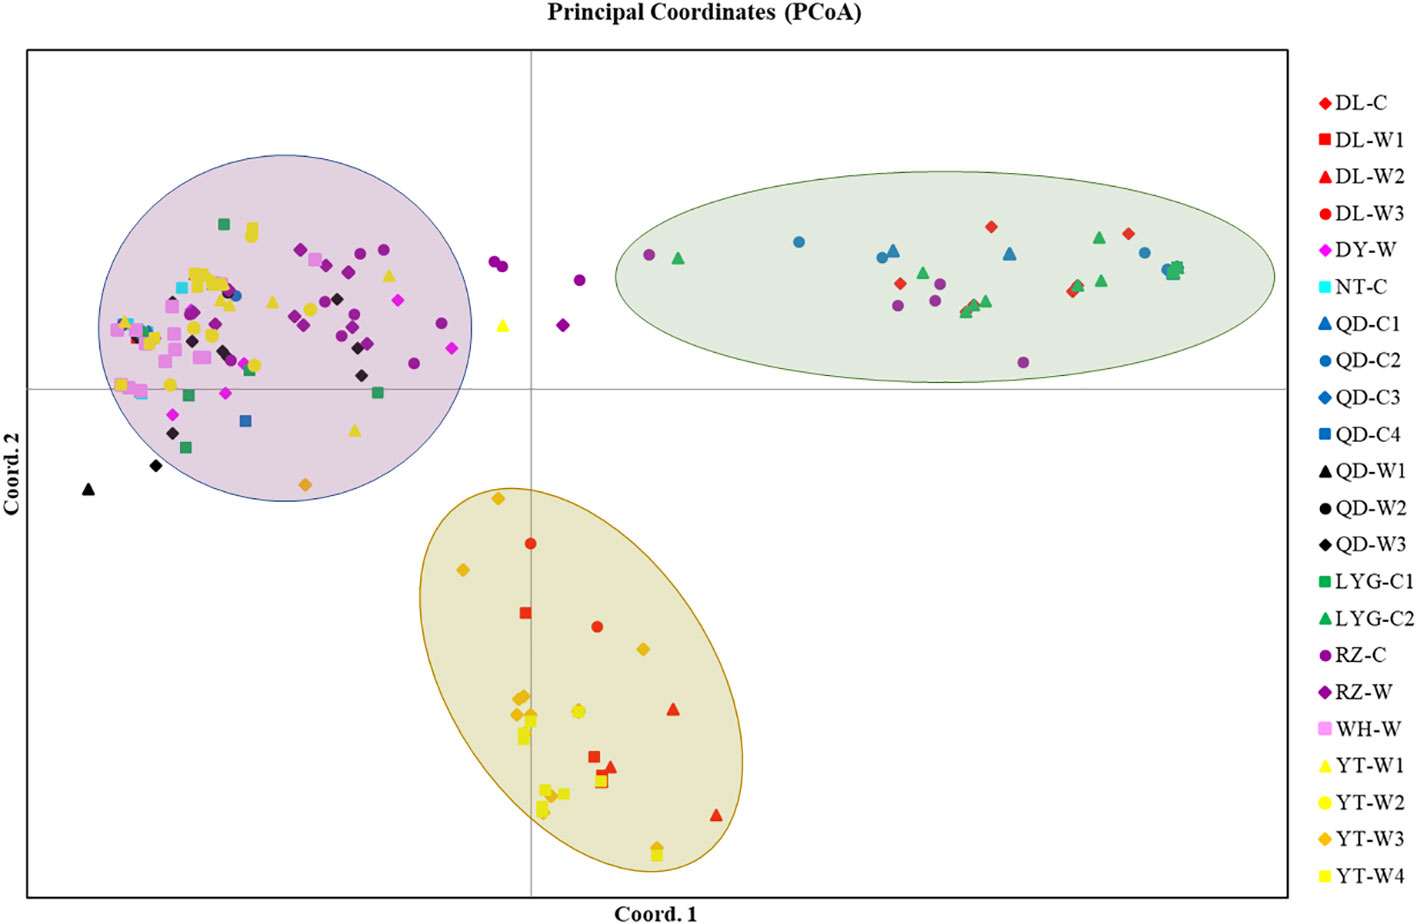
Figure 5 Genetic relationship analysis of 22 populations of Neopyropia yezoensis using a scatter plot of the principal coordinates analysis (PCoA). See Table S1 for detailed information represented by population abbreviations.
The above analysis was made based on 375 individuals. It was further analyzed based on 22 populations. It was found that the highest genetic differentiation was between DL-C and NT-C (Fst=0.767) and the lowest was between QD-C1 and QD-C2 (Fst=0.006) (Table S2 (Supplementary Material 2)). The populations phylogenetic tree showed that 22 populations were divided into 2 main groups (Figure 6). Five cultured populations of DL-C, LYG-C2, QD-C3, QD-C1 and QD-C2 were grouped into one branch. Another 17 populations were divided into 2 subgroups, among which 4 populations of DL-W1, DL-W2, YT-W3 and YT-W4 were grouped into one branch, and 9 wild populations clustered together and formed another subgroup.
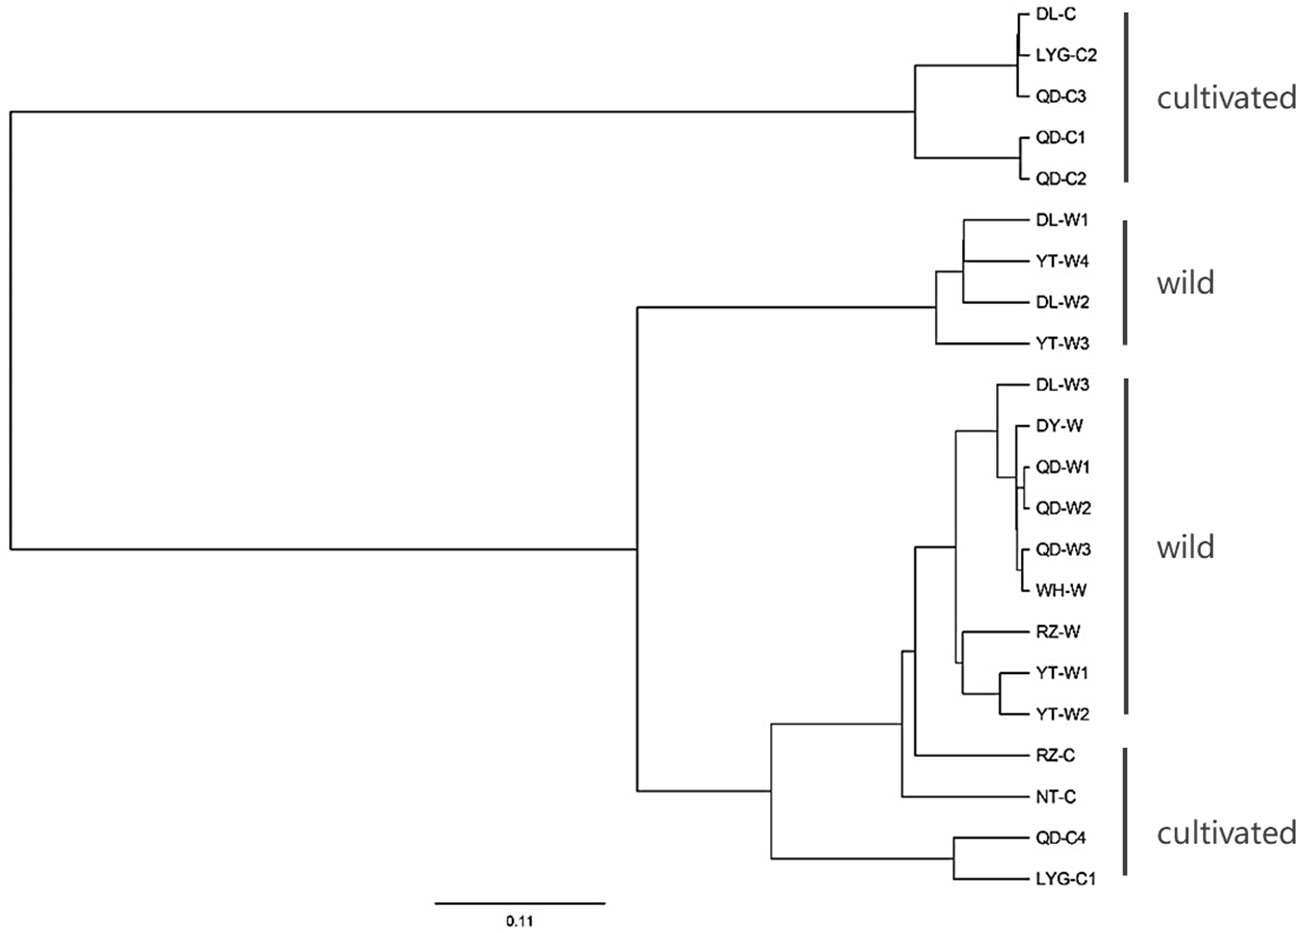
Figure 6 The populations phylogenetic tree constructed based on the genetic distance between individuals of 22 Neopyropia yezoensis populations and through UPGMA method. See Table S1 for detailed information represented by population abbreviations.
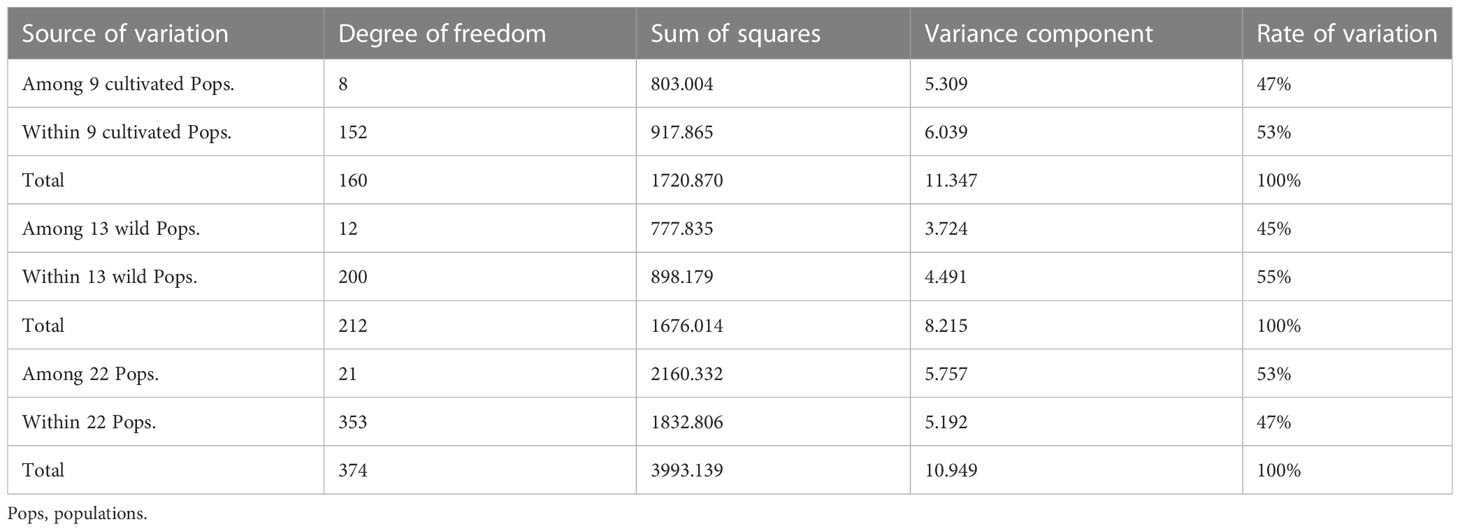
The AMOVA (Table 4) showed that the genetic variation among the 22 N. yezoensis populations (53%) was higher than the intra-populational genetic variation (47%). However, the degree of intra-populational genetic variations of both cultivated (53%) and wild (55%) populations were higher than the inter-populational ones (45% and 47%).
Gene exchange between cultivated and wild populations based on SSR markers
Both wild and cultured populations were collected from 3 geographically separate regions, the northern Yellow Sea (Dalian), the middle Yellow Sea (Qingdao) and the southern Yellow Sea (the southern Rizhao and the northern Lianyungang) (Figure 1).
Among the 3 N. yezoensis populations in the northern Yellow Sea, the genetic differentiation coefficient between DL-C and DL-W2 was the highest (Fst=0.683), and that between DL-W1 and DL-W2 was the lowest (Fst=0.141) (Table S2 (Supplementary Material 2)). The optimal K value was identified to be 2, i.e., the 3 populations were divided into two groups (Figure 7A). DL-C was clustered into a separate group with a high proportion of membership (average Q=0.981), and DL-W1 and DL-W2 were clustered into another group (average Q=0.997 and 0.997).
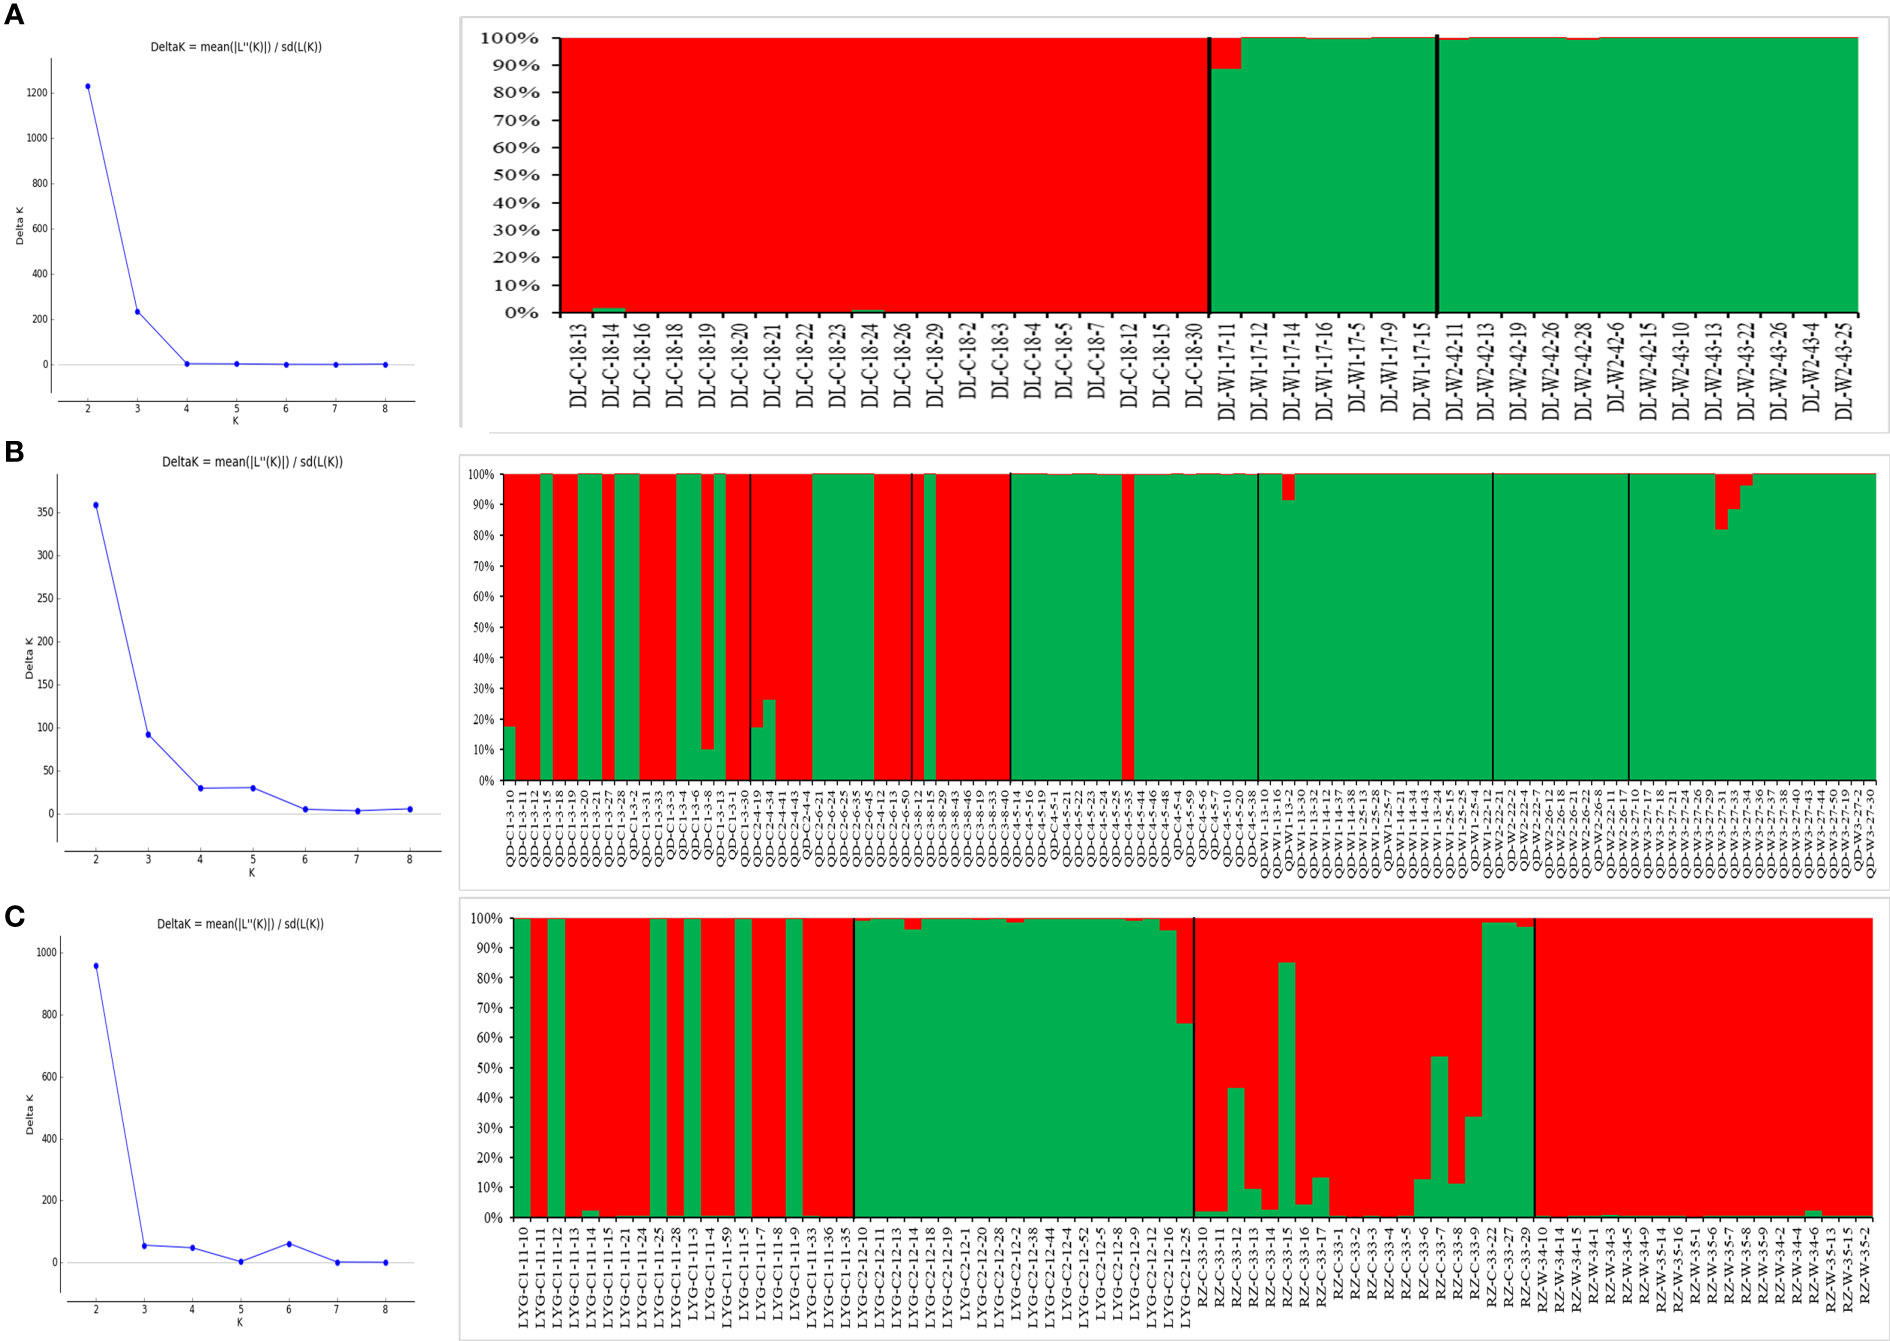
Figure 7 Structure analysis of Neopyropia yezoensis populations in the 3 regions where wild and cultured populations were both collected. (A) 1 farmed and 2 wild populations in the northern Yellow Sea (Dalian). (B) 4 farmed and 3 wild populations in the middle Yellow Sea (Qingdao). (C) 3 farmed and 1 wild populations in the southern Yellow Sea (Rizhao and Lianyungang). See Table S1 for detailed information represented by population abbreviations.
Among the 7 N. yezoensis populations in the middle Yellow Sea, the genetic differentiation coefficient between QD-C3 and QD-W2 was the highest (Fst=0.641), and that between QD-C1 and QD-C2 was the lowest (Fst=0.006). The membership proportion was 0.586:0.414 in QD-C1 and 0.582:0.418 in QD-C2. The genetic identity was the highest between QD-W1 and QD-W2 (0.994) and the lowest between QD-C3 and QD-W2 (0.273) (Table S2 (Supplementary Material 2)). The optimal K value was 2. QD-W1, QD-W2, QD-W3 and QD-C4 were clustered into a group with high proportion of membership (average Q=0.993, 0.998, 0.981 and 0.950) and QD-C3 formed another group with high proportion of membership (average Q=0.874) (Figure 7B).
Among the 4 N. yezoensis populations in the southern Yellow Sea, the genetic differentiation coefficient between LYG-C2 and RZ-W was the highest (Fst=0.605), and that between LYG-C1 and RZ-C was the lowest (Fst=0.072). The genetic identity was the highest between RZ-C and RZ-W (0.909) and the lowest between LYG-C2 and RZ-W (0.309) (Table S2 (Supplementary Material 2)). The optimal K value was 2. RZ-W formed a separate group with high proportion of membership (average Q= 0.994) and LYG-C2 formed another group with high proportion of membership (average Q=0.974). Marked admixture was identified in LYG-C1 and RZ-C, with the membership proportion being 0.697:0.303 and 0.716: 0.284, respectively (Figure 7C).
Genetic diversity analysis and haplotype network of Neopyropia yezoensis populations based on 18S rDNA sequences
A total of 352 18S rDNA sequences were obtained, after fully aligned, the sequences length was 1249 bp. A total of 22 haplotypes (H1~H22) and 156 segregating sites were identified, with the haplotype diversity (Hd) of 0.77300 and nucleotide diversity (Pi) of 0.02660. Among the 22 N. yezoensis populations, Hd ranged from 0.00000 (DL-C, DL-W2, NT-C and RZ-C) to 0.68506 (DL-W3), and Pi ranged from 0.00000 (DL-C, DL-W2, NT-C and RZ-C) to 0.09914 (DL-W3). The maximum values of both Hd and Pi were in the DL-W3 population. The largest number (7/22) of 18S rDNA haplotypes was identified in DL-W3 and WH-W. Three haplotypes (H2, H5 and H16) were present in both the cultivated and wild populations, 3 haplotypes (H1, H10 and H15) were only identified in the cultivated populations, and the remaining 16 haplotypes (H3, H4, H6~H9, H11~H14 and H17~H22) were only present in the wild populations (Table 5).
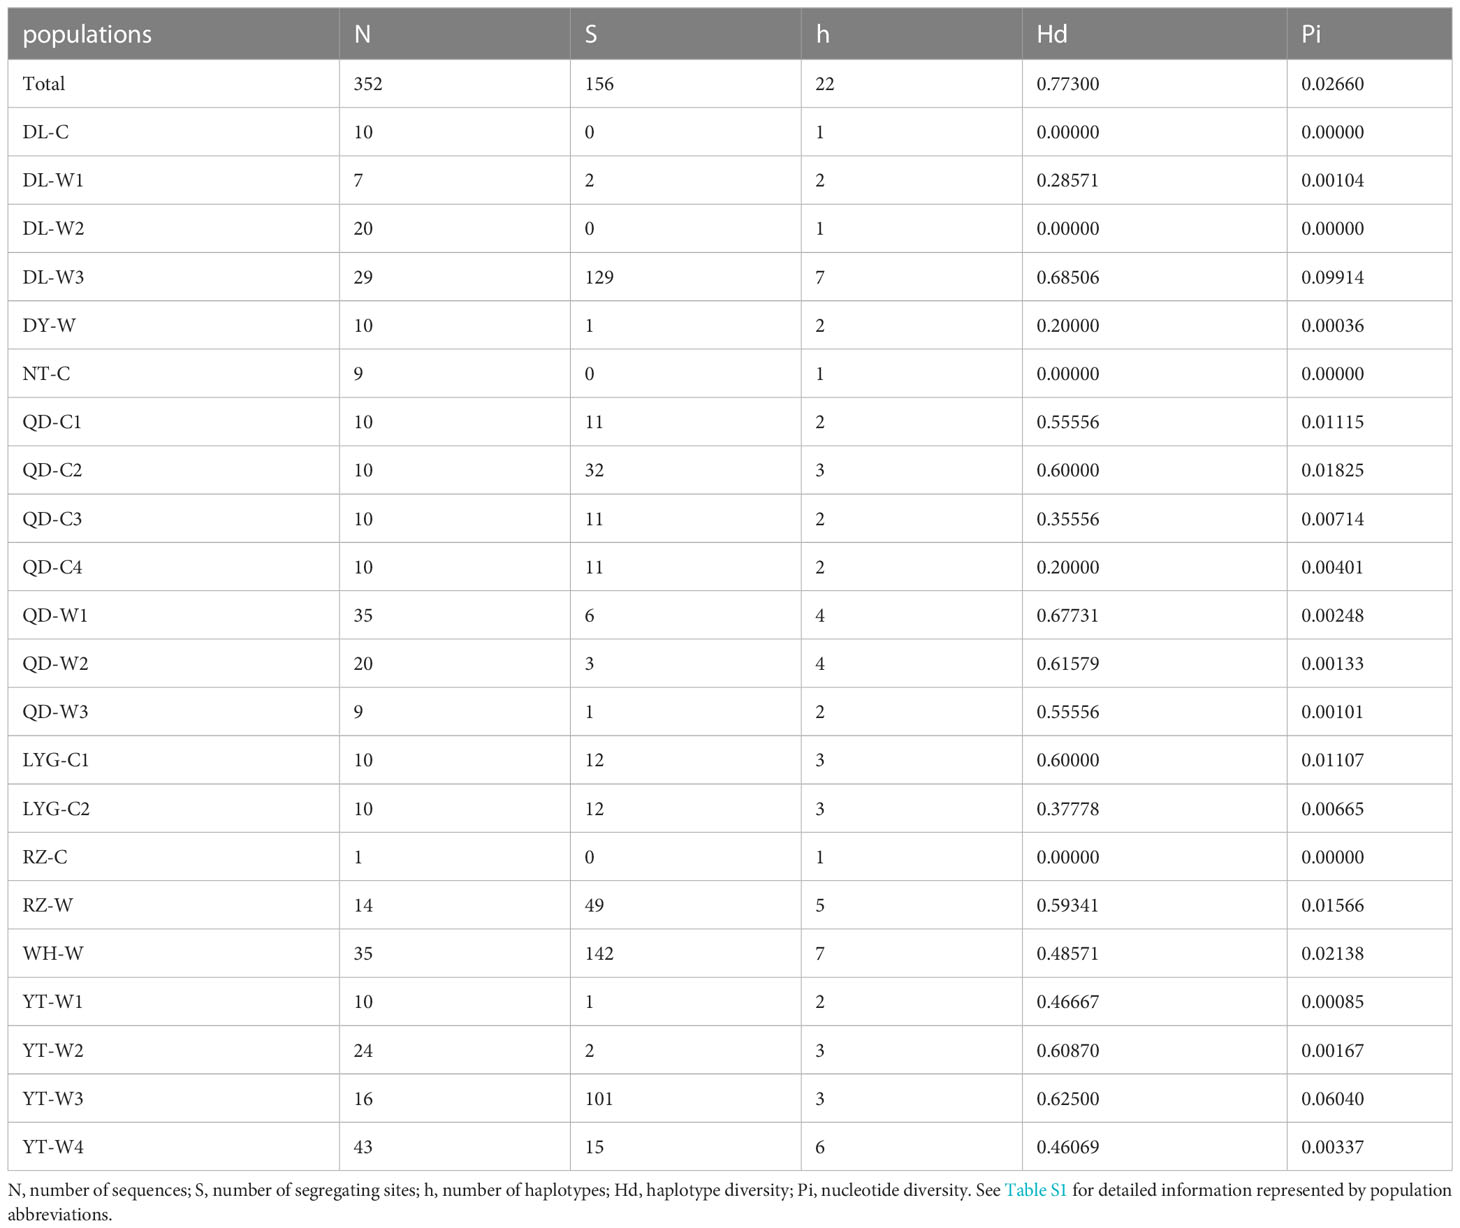
Table 5 Summary of genetic diversity of 22 Neopyropia yezoensis populations based on 18S rDNA sequences.
The network of 18S rDNA haplotypes showed that the most numerous linkages were emanated from H2. H2 was the most closely associated with other haplotypes: 10 haplotypes (H3, H5, H9, H11~H14, H16~H17 and H22) experienced within 10 steps of mutation from H2. H6 and H8 were the most divergent from H2, experiencing more than 100 steps of mutation from H2 (Figure 8A). Among the 22 haplotypes, 12 haplotypes (H7, H8, H10, H12~H15, H17 and H19~H22) were site-specific, and 10 haplotypes (H1~H6, H9, H11, H16 and H18) were shared among locations (Figure 8B). The most abundant haplotype H2 was shared by 142 specimens, accounting for 40.06% of all individuals, and existed in 19 N. yezoensis populations. Thirteen haplotypes (H7, H8, H10, H12, H13~H16 and H18~H22, 59.09%) were represented by 1-2 specimens. Except for H2, H5 and H16 were shared by both wild and cultivated populations, with H5 present in DL-W3, WH-W, QD-W1, QD-W2, and RZ-C and H16 present in LYG-C2 and RZ-W (Figure 8).
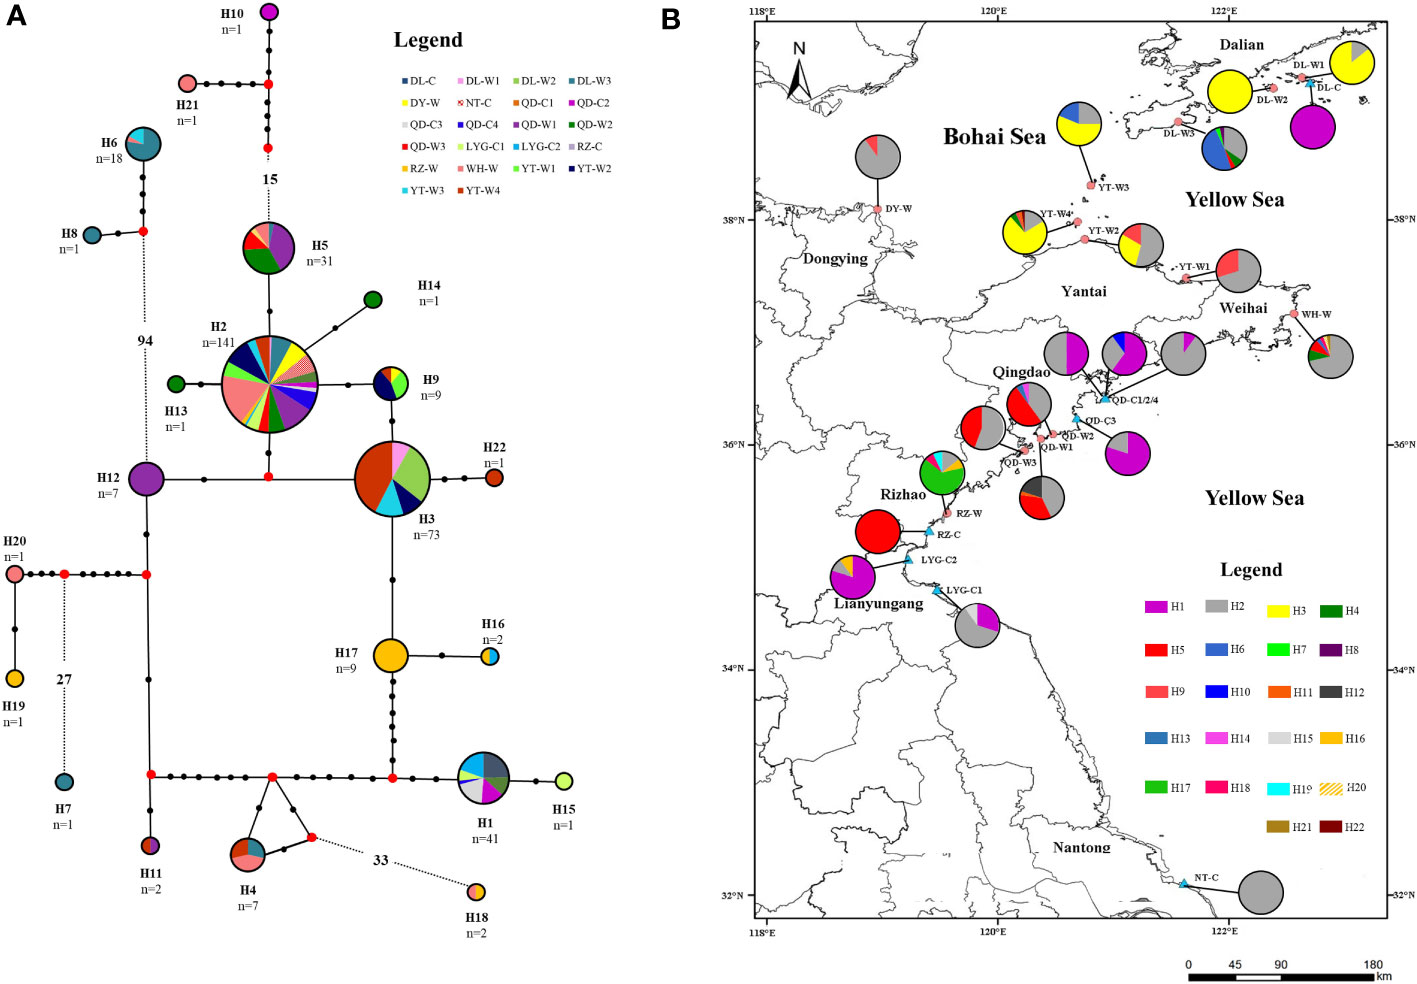
Figure 8 The (A) Median-Joining network constructed using the haplotypes of 18S rDNA sequences, and (B) distribution of 22 18S rDNA haplotypes detected in the 22 Neopyropia yezoensis populations. In (A) each connecting line indicates one mutation step between haplotypes, each black dot represents one mutation step and more than 6 are indicated by dotted line with number, small red nodes represent a haplotype which is necessary intermediate but is not found in the sampled population. See Table S1 for detailed information represented by population abbreviations.
Discussion
Polymorphism of the microsatellite loci
As codominant markers, microsatellite markers have a high mutation rate among tandem repeat sequences and can form many alleles. Therefore, microsatellite markers have been known highly polymorphic (Weber, 1990; Gur-Arie et al., 2000). According to Botstein et al. (1980), the polymorphic information coefficient (PIC) is divided into three grades: PIC<0.25 (indicating a low polymorphic level), 0.25<PIC<0.5 (a moderate polymorphic level), and PIC>0.5 (a high polymorphic level). Eleven microsatellite markers were developed in this study. The mean PIC of these 11 markers was 0.459, with the values for SSR01, SSR02, SSR 029 and SSR40 over 0.5 and only the value for SSR48 lower than 0.25, indicating that the developed microsatellite markers were highly polymorphic.
Most of the microsatellites were dinucleotide and trinucleotide repeats. This result was consistent with the findings in many plants (Sonah et al., 2011; Shan et al., 2018; Zhang et al., 2018). Besides, GC-rich repeats types were the most populous, which is related to the high GC content of N. yezoensis genome (Lu, 2016). SSR01 and SSR02 had the longest sequences and were highly polymorphic. Generally, a longer microsatellite DNA sequence or a greater number of nucleotide repeats leads to higher polymorphism of the microsatellite locus (Gou et al., 2007). In addition, the genetic parameters of the SSR markers developed in this study were all higher than those of Wei (2012) when both cultivated and wild N. yezoensis populations were used as samples. The numbers of allele per SSR were higher than the SSRs developed by Kim et al. (2021). The Ho of the 11 SSR markers were all lower than the He, and they all deviated significantly from the Hardy-Weinberg Equilibrium. Purifying selection, population substructure, copy number variation, genotyping error and sampling effect are all potential causes of departure from Hardy-Weinberg Equilibrium (Kang et al., 2013; Chen et al., 2017; Qi et al., 2017). Taken together, these markers will be valuable tools for germplasm resource evaluation, genetic diversity protection and breeding of N. yezoensis.
Genetic diversity of wild N. yezoensis resource in China
The wild populations of N. yezoensis collected in this study were widely collected along the coast of the Yellow Sea and Bohai Sea, covering the major natural distribution areas of this species in China (Zhang and Zheng, 1962; Cao et al., 2018). These collecting sites were almost geographically separated from each other. Fujio et al. (1985) found that the natural populations of N. yezoensis has more geographical genetic differentiation than many other diploid organisms. The present SSR AMOVA analysis of 13 wild N. yezoensis populations showed that the genetic variation mainly occurred within the populations and no obvious correlation between the genetic variation and geographical distance was identified. The previous study has revealed that the genetic distance between laver species is not always related to geography or growing environment (Cui et al., 2006).
The phylogenetic tree, Structure and PCoA analysis based on SSR markers consistently showed that the wild populations were divided into two distinct groups, with the populations that were distributed in the intersection region between the Yellow Sea and the Bohai Sea forming a distinct clade (DL-W1, DL-W2, YT-W3, YT-W4, Figures 4A, 5, 6). It was further found based on 18S rDNA haplotype analysis that the H3 haplotype was specifically identified in the populations distributed in this region (DL-W1, DL-W2, YT-W2, YT-W3, YT-W4, Figure 8). In addition, the largest number of haplotypes (10) were identified in DL-W3, YT-W2, YT-W3 and YT-W4 (Figure 8), accounting for 45.45% of the total detected haplotypes. The highest intra-populational genetic diversity (Hd=0.68506, Pi=0.09914) was present in DL-W3. For the populations in this region (DL-W1, 3, YT-W2~4), the average Hd (0.71139) was a little lower and the average Pi (0.05322) was a little higher than that of all the 22 N. yezoensis populations (Nd=0.77300, Pi=0.02660). Relatively high Pi and low Nd suggest divergence between geographically subdivided populations (Grant and Bowen, 1998). Thus, it was consistently revealed by both SSR and 18S rDNA that the N. yezoensis populations distributed around the intersection region between the Yellow Sea and the Bohai Sea have undergone distinct genetic divergence from the other populations in China. It has been confirmed that genetic variation in organisms at the molecular level was correlated with environmental heterogeneity (Smith and Levins, 1970: Nevo, 2001). For example, the genetic diversity of plants such as Primulafarinosa (Reisch et al., 2005) and Pogonatherum paniceum (Ma et al., 2006) was correlated with altitude and average annual temperature, and showed regular patterns with altitude change. There is a strong intermix of distinct water quality and between warm and cold ocean current around the intersection between the Yellow Sea and the Bohai Sea, which may lead to the genetic divergence (Koh and Kim, 2020; Zhou et al., 2023). This region can be served as a genetic diversity hotspot of N. yezoensis and needs to be further monitored for conservation (Hu et al., 2017).
Genetic diversity of cultivated N. yezoensis resource in China
The cultivation area of N. yezoensis is mainly distributed in the southern Yellow Sea, accounting for more than 99% of N. yezoensis production and processing enterprises in China (Yang et al., 2017). The semi-floating raft or standing-pole culture systems are generally used for laver cultivation, which leads to the limitation of laver aquaculture in shallow water (Wang et al., 2016). The intensive cultivation and long-term selective breeding of cultivated N. yezoensis germplasm led to reduced genetic diversity of stock, fragility to climate change, susceptibility to disease, and decline in product quality (Wernberg et al., 2013; Buschmann et al., 2017; Li et al., 2018). New strains of N. yezoensis with varying good agronomic characters such as adaptation to non-drying culture system (Wang et al., 2016; Li et al., 2018), resistance to high temperature (Zhang et al., 2011) and disease (Park and Hwang, 2014) were bred to expand culture space, improve production quality, adapt to different sea conditions and meet diversified market demands.
The cultivated populations of N. yezoensis were collected from 3 representative farming areas along the coast of southern, middle and northern Yellow Sea, respectively. Based on SSR markers, the AMOVA analysis of 9 cultivated populations showed that the genetic variation mainly existed within the population, which was consistent with the previous study (Yang et al., 2016). The average polymorphism of 9 cultured N. yezoensis populations in this study was higher than that of the wild populations, and the percentage of polymorphic loci of the most cultivated populations was at a high level (P=90.91%). This suggested that the germplasm of cultivated N. yezoensis in China are diversified, which was consistent with the previous studies based on different molecular markers (Mei et al., 2000; Chen et al., 2012). Based on 18S rDNA sequences, except for H2, the ancestral haplotype of this species (Crandall and Templeton, 1993), only 2 out of 22 haplotypes were shared by both cultivated and wild populations. There was a haplotype (H1) identified in almost all the cultivated populations but not in the wild populations (Figure 8). The result confirmed the genetic divergence of the cultivated populations from the wild populations.
Comparison between cultivated and wild populations
Generally, the genetic diversity is higher in wild populations than in cultured ones, owing to multi-generational selection and purification of the cultivars (Wei, 2012). In this study, by contrast, a higher genetic diversity was identified in the cultivated populations (average I=0.469, P=78.79%) than in the wild populations (average I=0.352, P=63.64%) based on SSR analysis. Although a higher genetic diversity was identified in the wild populations (average Hd=0.44712, Pi=0.01491) than in the cultivated populations (average Hd=0.29877, Pi=0.00647) based on 18S rDNA sequences. As mentioned above, the cultivated populations contained 18S rDNA haplotypes distinct from the wild populations. Population isolation caused by environmental or anthropogenic disturbances and other factors can influence the genetic diversity and population structure (Wen et al., 2010). In recent years, wild resources of seaweeds were deteriorated and the biodiversity was declining due to global climate and coastal environmental change (Sun et al., 2010; Tanaka et al., 2012; Koh and Kim, 2020). Aquaculture of N. yezoensis has incorporated new germplasm resources from natural populations and new strains obtained through mutation or crossbreeding (Zhang et al., 2011; Park and Hwang, 2014; Li et al., 2018). It has been reported that some of the N. yezoensis cultivars in China were introduced from abroad (Qiao et al., 2007), implying possible distinct genetic background from the indigenous germplasm. In addition, the distinct genetic background of some cultured populations may result from mutation or cross breeding. It seemed that different source of N. yezoensis germplasm and different strategy for N. yezoensis seedling rearing (single strain or a mixture of several strains) have led to the varying genetic backgrounds and genetic diversity levels of the cultivated populations (Tables 3, 5).
A high genetic differentiation was identified between the cultivated populations and the wild populations (Fst=0.529-0.683) in the northern Yellow Sea according to the criteria of Wright (1978). In the middle Yellow Sea, gene exchange was present between some of the cultivated populations and the wild ones (Fst=0.218-0.641). In the southern Yellow Sea, there was a high gene exchange and a low genetic differentiation between the cultured populations and the wild ones, especially between RZ-C and RZ-W (Fst=0.095). RZ-W, RZ-C and LYG-C1 were aggregated into a group. There is the longest history of N. yezoensis aquaculture in the southern Yellow Sea (40~50 years). Industrial culture of N. yezoensis in the middle Yellow Sea (Qingdao) and northern Yellow Sea (Dalian) started just 5-7 years ago. Thus, the gene exchange between the cultivated populations and the wild populations seemed to be related to the length of culture time. Nonetheless, it can be seen from the structure analysis that the gene flow between the cultivated populations and the wild populations was asymmetric, and the gene flow from the cultivated populations to the wild populations was limited (Figure 7). For 18S rDNA haplotypes, 19 haplotypes were shown to be present either in the wild populations or in the cultivated ones, only 3 haplotypes (H2, H5 and H16) shared by both wild and cultivated populations (Figure 8). H2 was present in all the populations, thought to be an ancestral haplotype of this species (Crandall and Templeton, 1993). H5 was present in 4 wild (DL-W3, QD-W1, W2, W3) and 1 cultivated (RZ-C) population. Only H16 was shared by one wild (RZ-W) and one cultivated population (LYG-C2) in the southern Yellow Sea. Thus, both SSRs and 18S rDNA analysis indicated that there was limited genetic impact of the cultivated N. yezoensis populations on the wild ones. Even if there was an impact of N. yezoensis aquaculture on the wild resource, it is a long-term and slow process.
Reproductive patterns can influence the genetic diversity and population structure (Wen et al., 2010). N. yezoensis is a monoecious and self-fertilized species. The sporophytic blades can repeat themselves by means of asexual reproduction through archeospores (Fujio et al., 1985). The spreading of archeospores may cause exchange and thereby decrease genetic variation between the geographically adjacent populations (Cao et al., 2018). Nevertheless, the survival and germinating of archeospores depends on suitable environmental conditions. Although there is the longest N. yezoensis culture history in the southern Yellow Sea, almost none spontaneous N. yezoensis has been identified along the coast (Yang et al., 2017). It may be due to the sandy substrate in this region. It has been found that the cultivated population of U. pinnatifida (Shan et al., 2018; Li et al., 2020) and S. japonica (Shan et al., 2019) had higher gene exchange with the spontaneous populations on the cultivation rafts, but less gene exchange with the spontaneous populations in the adjacent subtidal zone. In practice, there are very few individuals of N. yezoensis naturally settling on the cultivation stem ropes and rafts. In this study, the QD-C4 was genetically distinct from the QD-C1 and QD-C2 that were cultured at the same time and next to each other. It indicated that the genetic impact between the adjacent N. yezoensis populations is limited.
Conclusion
Eleven polymorphic SSR markers were developed to identify a higher average polymorphism among the cultured N. yezoensis populations than among the wild ones. The cultivated populations were clustered separately from the wild ones based on the population phylogenetic tree. A total of 22 haplotypes were identified from 352 18S rDNA sequences and 86.36% of them were specifically assigned to either the wild populations or the cultivated ones. The results indicated that the cultivated N. yezoensis are diversified and divergent from the wild populations in China. The relationship between some populations can be well-traced by these molecular markers e.g., QD-C4 and LYG-C1 seemed to come from the same parents or germplasm, and the germplasm for DL-C and LYG-C2 had very close genetic relationship. The genetic exchange between the cultivated N. yezoensis populations and the wild populations seemed to be related to the length of culture time, being a long-term and slow process. The wild N. yezoensis populations were grouped into two distinct clades by SSRs, with one distributed around the intersection between the Yellow Sea and the Bohai Sea, where 5 out of 6 wild populations were characterized by a specific 18S rDNA haplotype. This region can be served as a genetic diversity hotspot of N. yezoensis resource and needs to be further monitored for conservation.
Data availability statement
The datasets presented in this study can be found in online repositories. The names of the repository/repositories and accession number(s) can be found below: BioProject, PRJNA936265.
Author contributions
HX and RJ: complete the experiments, investigate and analyze the data, and wrote original draft of the paper. ZL: sample and process the experiments. XL: data analysis. WW: conceptualize, supervision, project administration, writing - review and editing. All authors contributed to the article and approved the submitted version.
Funding
This project was supported by the National Key R&D Program of China “Scientific and Technological Innovation of Blue Granary” (2018YFD0901500), China Agriculture Research System of MOF and MARA (CARS-50), Shandong Province Key Research and Development Program (2022LZGC004, 2021LZGC004), National Marine Genetic Resource Centre, and Central Public-interest Scientific Institution Basal Research Fund (2020TD27).
Conflict of interest
The authors declare that the research was conducted in the absence of any commercial or financial relationships that could be construed as a potential conflict of interest.
Publisher’s note
All claims expressed in this article are solely those of the authors and do not necessarily represent those of their affiliated organizations, or those of the publisher, the editors and the reviewers. Any product that may be evaluated in this article, or claim that may be made by its manufacturer, is not guaranteed or endorsed by the publisher.
Supplementary material
The Supplementary Material for this article can be found online at: https://www.frontiersin.org/articles/10.3389/fmars.2023.1166508/full#supplementary-material
Supplementary Table 1 | The sample information of Neopyropia yezoensis
Supplementary Table 2 | Coefficient of genetic differentiation (Fst; below diagonal) and genetic identity (above diagonal) among the 22 Neopyropia yezoensis populations. Population codes as in Table S1. The highlighted values indicated maximum values for genetic differentiation and genetic identity; the colored values were used to facilitate differentiation of genetic differentiation in different regions.
References
An H. S., Kim E. M., Lee J. W., Dong C. M., Lee B. I., Kim Y. C. (2011). Novel polymorphic microsatellite loci for the Korean black scraper (Thamnaconus modestus), and their application to the genetic characterization of wild and farmed populations. Int. J. Mol. Sci. 12 (6), 4104–4119. doi: 10.3390/ijms12064104
Anderson M. J., Willis T. J. (2003). Canonical analysis of principal coordinates: a new ecologically meaningful approach for constrained ordination. Ecology 84, 511–525. doi: 10.1890/0012-9658
Andrew R. (2016). FigTree: tree figure drawing tool, version 1.4.3. institute of evolutionary biology (United Kingdom: University of Edinburgh).
Botstein D., White R. L., Skolnick M., Davis R. W. (1980). Construction of a genetic linkage map in man using restriction fragment length polymorphism. Am. J. Hum. Genet. 32, 314–331.
Buschmann A. H., Camus C., Infante J., Neori A., Israel Á., Hernández-González M. C., et al. (2017). Seaweed production: overview of the global state of exploitation, farming and emerging research activity. Eur. J. Phycol 52 (4), 391–406. doi: 10.1080/09670262.2017.1365175
Cao Y., Wang W. J., Liu F. L., Liang Z. R., Sun X. T., Li X. L., et al. (2018). AFLP fingerprints of Pyropia yezoensis (Bangiales, rhodophyta) populations revealed the important effect of farming protocols on genetic diversity. Bot. Mar. 61, 141–147. doi: 10.1515/bot-2017-0073
Chae S. S., Warde W. D. (2006). Effect of using principal coordinates and principal components on retrieval of clusters. Comput. Stat. Data An. 50, 1407–1417. doi: 10.1016/j.csda.2005.01.013
Chen B., Cole J. W., Grond-Ginsbach C. (2017). Departure from hardy Weinberg equilibrium and genotyping error. Front. Genet. 8. doi: 10.3389/fgene.2017.00167
Chen S. Y., Lu Q. Q., Zhang M. R., Hu C. M., Xu G. P. (2012). ISSR analysis of ten breeding lines of Pyropia yezoensis. Tianjin Agricult. Sci. 18, 19–23. doi: 10.3969/j.issn.1006-6500.2012.05.005
Crandall K. A., Templeton A. R. (1993). Empirical tests of some predictions from coalescent theory with applications to intraspecific phylogeny reconstruction. Genetics 134 (3), 959–969. doi: 10.1101/gad.7.7b.1459
Cui L. Y., Xu P., Zhu J. Y., Xu G. P., Luo Q. J., Ma J. H. (2006). Inter-simple sequence repeats (ISSR) applied in four species of Porphyra (Rhodophyta, bangiales). J. Fish. Sci. Chn. 13, 371–377.
Evanno G., Regnaut R., Goudet J. (2005). Detecting the number of clusters of individuals using the software STRUCTURE: a simulation study. Mol. Ecol. 14, 2611–2620. doi: 10.1111/j.1365-294X.2005.02553.x
Fujio Y., Kodaka P. L. G., Hara M. (1985). Genetic differentiation and amount of genetic variability in natural populations of the haploid layer Porphyra yezoensis. Jap. J. Genet. 60, 347–354. doi: 10.1266/jjg.60.347
Gou L. W., Wang G. Y., He H. C., Liu Y., Yang X. H., Zhang Q. Y. (2007). The research and application of microsatellite marher. Grass-Freeding Livestock 3, 1–4. doi: 10.16863/j.cnki.1003-6377.2007.03.001
Grant W. A. S., Bowen B. W. (1998). Shallow population histories in deep evolutionary lineages of marine fishes: insights from sardines and anchovies and lessons for conservation. J. Hered. 89 (5), 415–426. doi: 10.1093/jhered/89.5.415
Guillemin M. L., Contreras-Porcia L., Ramírez M. E., Macaya E. C., Contador C. B., Woods H., et al. (2016). The bladed bangiales (Rhodophyta) of the south Eastern pacific: molecular species delimitation reveals extensive diversity. Mol. Phylogenet. Evol. 94 (Pt B), 814–826. doi: 10.1016/j.ympev.2015.09.027
Gunnarsson K., Egilsdóttir S., Nielsen R., Brodie J. (2016). A collections-based approach to the species and their distribution based on the bladed bangiales (Rhodophyta) of Iceland. Bot. Mar. 59 (4), 223–229. doi: 10.1515/bot-2016-0037
Gur-Arie R., Cohen C. J., Eitan Y., Shele L., Kashi Y. (2000). Simple sequence repeats in Escherichia coli: abundance, distribution, composition, and polymorphism. Genome Res. 10, 62–71. doi: 10.1038/sj.gt.3301059
Hu Z. M., Li J. J., Sun Z. M., Gao X., Yao J. T., Choi H. G., et al. (2017). Hidden diversity and phylogeographic history provide conservation insights for the edible seaweed Sargassum fusiforme in the Northwest pacific. Evol. Appl. 10 (4), 366–378. doi: 10.1111/eva.12455
Huang L. B., Yan X. H. (2019a). Construction of a genetic linkage map in Pyropia yezoensis (Bangiales, rhodophyta) and QTL analysis of several economic traits of blades. PloS One 14, e0209128. doi: 10.1371/journal.pone.0209128
Huang L. B., Yan X. H. (2019b). Development of simple sequence repeat markers in Pyropia yezoensis (Bangiales, rhodophyta) by high–throughput sequencing technology. Aquac. Res. 50, 2646–2654. doi: 10.1111/are.14222
Iitsuka O., Nakamura K., Ozaki A., Okamoto N., Saga N. (2002). Genetic information of three pure lines of Porphyra yezoensis (Bangiales, rhodophyta) obtained by AFLP analysis. Fisheries Sci. 68, 1113–1117. doi: 10.1046/j.1444-2906.2002.00540.x
Jia R., Lu X., Wang W., Liang Z., Yao H., Li B. (2022). Development and validation of microsatellite markers for Sargassum fusiforme based on transcriptomic data. Bot. Mar. 65, 197–207. doi: 10.1515/bot-2021-0091
Jia J. H., Wang P., Jin D. M., Qu X. P., Wang Q., Li C. Y., et al. (2000). The application of RAPD markers in diversity detection and variety identification of Porphyra. Acta Bot. Sin. 42, 403–407. doi: 10.1016/S0168-9452(99)00258-7
Kang J. H., Kim Y. K., Park J. Y., Noh E. S., Jeong J. E., Lee Y. S., et al. (2013). Development of microsatellite markers for a hard-shelled mussel, Mytilus coruscus, and cross-species transfer. Genet. Mol. Res. 12, 4009–4017. doi: 10.4238/2013.September.27.2
Kim M. S., Wi J. W., Lee J. H., Cho W. B., Park E. J., Hwang M. S., et al. (2021). Development of genomic simple sequence repeat (SSR) markers of Pyropia yezoensis (Bangiales, rhodophyta) and evaluation of genetic diversity of Korean cultivars. J. Appl. Phycol. 33, 3277–3285. doi: 10.1007/s10811-021-02536-7
Koh Y. H., Kim M. S. (2020). Genetic diversity and distribution pattern of economic seaweeds Pyropia yezoensis and Py. suborbiculata (Bangiales, rhodophyta) in the northwest pacific. J. Appl. Phycol. 32, 2495–2504. doi: 10.1007/s10811-019-01984-6
Li Q. X., Shan T. F., Wang X. M., Su L., Pang S. J. (2020). Evaluation of the genetic relationship between the farmed populations on a typical kelp farm and the adjacent subtidal spontaneous population of Undaria pinnatifida (Phaeophyceae, laminariales) in China. J. Appl. Phycol. 32, 653–659. doi: 10.1007/s10811-019-01917-3
Li X. L., Wang W. J., Liu F. L., Liang Z. R., Sun X. T., Yao H. Q., et al. (2018). Periodical drying or no drying during aquaculture affects the desiccation tolerance of a sublittoral Pyropia yezoensis strain. J. Appl. Phycol. 30, 697–705. doi: 10.1007/s10811-017-1227-y
Liang Z. R., Wang W. J., Liu L. L., Li G. L. (2022). The influence of ecological factors on the contents of nutritional components and minerals in laver based on open sea culture system. J. Mar. Sci. Eng. 10, 864. doi: 10.3390/jmse10070864
Liu Y., Pan X., Xu K., Mao Y. (2019). Distribution, function and polymorphism characteristics of microsatellites in Pyropia yezoensis transcriptome. J. Ocean Univ. Chn. 18 (3), 693–700. doi: 10.1007/s11802-019-3817-6
Lu X. P. (2016). Analysis of resistance related pathway and screening of SSR molecular markers in porphyra yezoensis (China: University of Chinese Academy of Sciences), 98.
Ma D. Y., Wang S. H., Luo T., Wang W. G., Zhuang G. Q., Chen F. (2006). Effects of environmental factors on the genetic diversity of Pogonatherum paniceum. Acta Sci. Nat. Univ Sunyatseni. 45 (2), 5. doi: 10.3321/j.issn:0529-6579.2006.02.018
Mao Y. X., Chen N. C., Cao M., Chen R., Guan X. W., Wang D. M. (2019). Functional characterization and evolutionary analysis of glycine-betaine biosynthesis pathway in red seaweed Pyropia yezoensis. Mar. Drugs 17, 70–82. doi: 10.3390/md17010070
Mei J. X., Jin D. M., Jia J. H., Fei X. G. (2000). DNA Polymorphism of Porphyra yezoensis and its application to cultivar discrimination. J. Shandong Univ. 35, 230–234.
Miura A. (1988). Taxonomic studies of Porphyra species cultivated in Japan, referring to their transition to the cultivated variety. J. Tokyo Univ. Fish 75, 311–325. doi: 10.1016/j.aquculture.2021.737650
Nevo E. (2001). Evolution of genome–phenome diversity under environmental stress. P. Natl. Acad. Sci. U.S.A. 98 (11), 6233–6240. doi: 10.1073/pnas.101109298
Pan G., Yang J. (2010). Analysis of microsatellite DNA markers reveals no genetic differentiation between wild and hatchery populations of pacific threadfin in Hawaii. Int. J. Biol. Sci. 6 (7), 827–833. doi: 10.7150/ijbs.6.827
Park E. J., Fukuda S., Endo H., Kitade Y., Saga N. (2007). Genetic polymorphism within Porphyra yezoensis (Bangiales, rhodophyta) and related species from Japan and Korea detected by cleaved amplified polymorphic sequence analysis. Eur. J. Phycol. 42, 29–40. doi: 10.1080/09670260601127681
Park C. S., Hwang E. K. (2014). Isolation and evaluation of a strain of Pyropia yezoensis (Bangiales, rhodophyta) resistant to red rot disease. J. Appl. Phycol. 26, 811–817. doi: 10.1007/s10811-013-0183-4
Pritchard J. K., Stephens M. J., Donnelly P. J. (2000). Inference of population structure using multilocus genotype data. Genetics 155, 945–959. doi: 10.1093/genetics/155.2.945
Qi Z. C., Shen C., Han Y. W., Shen W., Yang M., Liu J. L., et al. (2017). Development of microsatellite loci in Mediterranean sarsaparilla (Smilax aspera; smilacaceae) using transcriptome data. Appl. Plant Sci. 5, 1700005. doi: 10.3732/apps.1700005
Qiao L. X., Weng M. L., Kong F. N., Dai J. X., Wang B. (2007). The application of RSAP marker technique in diversity detection and germplasms identification of Porphyra. Period. Ocean Univ. China 37, 951–956. doi: 10.16441/j.cnki.hdxb.2007.06.17
Reisch C., Anke A., R Hl M. (2005). Molecular variation within and between ten populations of primula farinosa (Primulaceae) along an altitudinal gradient in the northern Alps. Basic Appl. Ecology. 6 (1), 35–45. doi: 10.1016/j.baae.2004.09.004
Rungis D., Bérubé Y., Zhang J., Ralph S., Ritland C. E., Ellis B. E., et al. (2004). Robust simple sequence repeat markers for spruce (Picea spp.) from expressed sequence tags. Theor. Appl. Genet. 109, 1283–1294. doi: 10.1007/s00122-004-1742-5
Shan T. F., Li Q. X., Wang X. M., Li S., Pang S. J. (2019). Assessment of the genetic connectivity between farmed populations on a typical kelp farm and adjacent spontaneous populations of Saccharina japonica (Phaeophyceae, laminariales) in China. Front. Mar. Sci. 6. doi: 10.3389/fmars.2019.00494
Shan T. F., Pang S. J., Wang X. M., Li J., Su L. (2018). Assessment of the genetic connectivity between farmed and wild populations of Undaria pinnatifida (Phaeophyceae) in a representative traditional farming region of China by using newly developed microsatellite markers. J. Appl. Phycol. 30, 2707–2714. doi: 10.1007/s10811-018-1449-7
Smith J. M., Levins R. (1970). Evolution in changing environments. Population Stud. 24 (1), 127. doi: 10.2307/2173276
Sonah H., Deshmukh R. K., Sharma A., Singh V. P., Gupta D. K., Gacche R. N., et al. (2011). Genome-wide distribution and organization of microsatellites in plants: an insight into marker development in Brachypodium. PloS One 6, e21298. doi: 10.1371/journal.pone.0021298
Song L. S., Duan D. L., Li X. H., Li C. X. (1998). Use of RAPD for detecting and identifying Porphyra (Bangiales, rhodophyta). Chin. J. Oceanol. Limnol. 16, 237–242. doi: 10.1007/BF02848729
Sun X., Luo Q. J., Yang R., Pei L. Q. (2007). ISSR analysis on genetic variation in Porphyra. Oceanol. Limnol. Sin. 38, 141–145.
Sun J. Z., Ning X. R., Le F. F., Chen W. D., Zhuang D. G. (2010). Long term changes of biodiversity of benthic macroalgae in the intertidal zone of the nanji islands. Acta Ecol. Sin. 30, 106–112. doi: 10.1016/j.chnaes.2010.03.010
Sutherland J. E., Lindstrom S. C., Nelson W. A., Brodie J., Lynch M. D. J., Hwang M. S., et al. (2011). A new look at an ancient order: generic revision of the bangiales (Rhodophyta). J. Phycol. 47, 1131–1151. doi: 10.1111/j.1529-8817.2011.01052.x
Tanaka K., Taino S., Haraguchi H., Prendergast G., Hiraoka M. (2012). Warming off southwestern Japan linked to distributional shifts of subtidal canopy-forming seaweeds. Ecol. Evol. 2, 2854–2865. doi: 10.1002/ece3.391
Tautz D., Schlötterer C. (1994). Simple sequences. Cur. Opin. Genet. Dev. 4, 832–837. doi: 10.1016/0959-437X(94)90067-1
Wang W. J., Li X. L., Sun T. Q., Liang Z. R., Liu F. L., Sun X. T., et al. (2019). Effects of periodical drying and non-drying on nutrient content and desiccation tolerance of an intertidal Pyropia yezoensis strain subject to farming conditions. J. Appl. Phycol. 31, 1897–1906. doi: 10.1007/s10811-018-1684-y
Wang W. J., Sun X. T., Liu F. L., Liang Z. R., Zhang J. H., Wang F. J. (2016). Effect of abiotic stress on the gameophyte of Pyropia katadae var. hemiphylla (Bangiales, rhodophyta). J. Appl. Phycol. 28, 469–479. doi: 10.1007/s10811-015-0579-4
Weber J. L. (1990). Informativeness of human poly (GT)n polymorphisms. Genomics 7, 524–530. doi: 10.1016/0888-7543(90)90195-Z
Wei L. (2012). Genetic diversity analysis of p. yezoensis and p. haitanensis with simple sequence repeat (China: Ocean University of China), 65.
Wen Y. F., Han W. J., Wu S. (2010). Plant genetic diversity and its influencing factors. J. Cent. South Univ. 30 (12), 8. doi: 10.3969/j.issn.1673-923X.2010.12.016
Weng M. L., Liu B., Jin D. M., Yang Q. K., Zhao G., Ma J. H., et al. (2005). Identification of 27 Porphyra lines (Rhodophyta) by DNA fingerprinting and molecular markers. J. Appl. Phycol. 17, 91–97. doi: 10.1007/s10811-005-4845-8
Wernberg T., Smale D. A., Tuya F., Thomsen M. S., Langlois T. J., Bettignies T. D., et al. (2013). An extreme climatic event alters marine ecosystem structure in a global biodiversity hotspot. Nat. Clim. Change. 3 (1), 78–82. doi: 10.1038/NCLIMATE1627
Wright S. (1978). Evolution and the genetics of populations Vol. 1 (Chicago: University of Chicago Press). doi: 10.2307/1224510
Yang Y. F. (2016). Coastal environmental bioremediation and seaweed resource utilization (Beijing: Science Press). doi: 10.16418/j.issn.1000-3045.20210217103
Yang L. E., Deng Y. Y., Xu G. P., Russell S., Lu Q. Q., Brodie J. (2020). Redefining Pyropia (Bangiales, rhodophyta): four new genera, resurrection of Porphyrella and description of calidia pseudolobata sp. nov. from China. J. Phycol. 56, 862–879. doi: 10.1111/jpy.12992
Yang L. E., Han X. L., Zhou W., Deng Y. Y., Xu G. P., Hu C. M., et al. (2016). Genetic diversity of different cultivars of Pyropia yezoensis. Guangxi Sci. 23 (3), 241–247. doi: 10.13656/j.cnki.gxkx.20160713.012
Yang L. E., Lu Q. Q., Brodie J. (2017). A review of the bladed bangiales (Rhodophyta) in China: history, culture and taxonomy. Eur. J. Phycol. 52 (3), 251–263. doi: 10.1080/09670262.2017.1309689
Yeh F. C., Yang R. C., Boyle T., Ye Z. H., Mao J. X., Yeh B., et al. (1999). Popgene, version 1.32; the user-friendly shareware for population genetic analysis. molecular biology and biotechnology (Alberta: University of Alberta).
Yu Y. (2010). Screening of SSR from p. yezoensis and p. haitanensis and their applications on analysis of genetic polymorphism (China: Ocean University of China), 58.
Zhang J., Liu T., Rui F. P. (2018). Development of EST-SSR markers derived from transcriptome of Saccharina japonica and their application in genetic diversity analysis. J. Appl. Phycol. 30, 2101–2109. doi: 10.1007/s10811-017-1354-5
Zhang B. L., Yan X. H., Huang L. B. (2011). Evaluation of an improved strain of Porphyra yezoensis ueda (Bangiales, rhodophyta) with high-temperature tolerance. J. Appl. Phycol. 23, 841–847. doi: 10.1007/s10811-010-9587-6
Zhang D. R., Zheng B. F. (1962). The Chinese porphyras and their ceographical distribution. Oceanol. Limnol. Sin. 4, 183–188.
Zhou W. Y., Li B. X., Xu H., Liang Z. R., Lu X. P., Yang L. E., et al. (2023). Potential distribution of two economic laver species-neoporphyra haitanensis and neopyropia yezoensis under climate change based on MaxEnt prediction and phylogeographic profiling. Ecol. Indic. 150, 110219. doi: 10.1016/j.ecolind.2023.110219
Keywords: aquaculture, genetic structure, haplotype, microsatellite, seaweed
Citation: Xu H, Jia R, Liang Z, Lu X and Wang W (2023) SSR and 18S rDNA based molecular profiling of Neopyropia yezoensis (Rhodophyta) in China: insight into genetic impact of laver aquaculture on wild resource. Front. Mar. Sci. 10:1166508. doi: 10.3389/fmars.2023.1166508
Received: 15 February 2023; Accepted: 15 May 2023;
Published: 24 May 2023.
Edited by:
Rafael R. Robaina, University of Las Palmas de Gran Canaria, SpainReviewed by:
Zengling Ma, Wenzhou University, ChinaGuangce Wang, Chinese Academy of Sciences (CAS), China
Copyright © 2023 Xu, Jia, Liang, Lu and Wang. This is an open-access article distributed under the terms of the Creative Commons Attribution License (CC BY). The use, distribution or reproduction in other forums is permitted, provided the original author(s) and the copyright owner(s) are credited and that the original publication in this journal is cited, in accordance with accepted academic practice. No use, distribution or reproduction is permitted which does not comply with these terms.
*Correspondence: Wenjun Wang, d2p3YW5nQHlzZnJpLmFjLmNu
†These authors have contributed equally to this work and share first authorship
 Hui Xu1,2†
 Zhourui Liang
 Wenjun Wang
