 Shuai Peng1,2
 Xuehui Wang1,3,4,5,6,7,8*
 Feiyan Du1
 Dianrong Sun1Yuezhong Wang1Pimao Chen1,3,4,5,6,7Yongsong Qiu1
- 1South China Sea Fisheries Research Institute, Chinese Academy of Fishery Sciences, Guangzhou, China
- 2College of Marine Sciences, Shanghai Ocean University, Shanghai, China
- 3National Digital Fisheries (Marine Ranching) Innovation Sub-Center, Guangzhou, China
- 4Key Laboratory of Marine Ranching, Ministry of Agriculture and Rural Affairs, Guangzhou, China
- 5Scientific Observing and Experimental Station of South China Sea Fishery Resources and Environments, Ministry of Agriculture and Rural Affairs, Guangzhou, China
- 6Guangdong Engineering Technology Research Center of Marine Recreational Fishery, Guangzhou, China
- 7Key Laboratory of Marine Ranching Technology, Chinese Academy of Fishery Sciences, Guangzhou, China
- 8Sanya Tropical Fisheries Research Institute, Sanya, China
Introduction: Beibu Gulf is a semi-enclosed bay with important ecological and economic value of the northwestern South China Sea (SCS). It proved to be a stressed ecosystem and therefore clearly vulnerable to further external disturbances.
Methods: Data from 26 fishery bottom trawl surveys in the Beibu Gulf from 2006 to 2018 are analyzed to reveal changes in the fish abundance, dominant species composition, diversity, mean trophic level (MTL), and fishing-in-balance (FiB) index.
Results: Fish abundance decreased significantly (p< 0.05) with increased anthropogenic disturbance (e.g., fishing intensity and land-derived pollutants), with catch per unit effort (CPUE) decreasing from 40.69 kg·h−1 in 2006 to 15.84 kg·h−1 in 2018. Dominant species composition has changed dramatically from 2006 to 2018, with fish communities shifting from demersal to pelagic species, and from large and high-trophic-level species to small and low-trophic-level species. Meanwhile, Margalef’s richness and Shannon–Wiener diversity indexes trend downward. The MTL declines from 3.82 in 2006 to 3.71 in 2018 (at 0.08 trophic level per decade), and decreasing with the decrease of the proportion of high-trophic fish and demersal fish in total catch (p< 0.05). A FiB index tends to be less than 0, this index declines with decreasing MTL and fish abundance (p< 0.05).
Discussion: Overall, fish stocks in the Beibu Gulf continue to decline and are currently overexploited. Multiple external disturbances, such as fishing (including overfishing, dominance of trawl fishery, and ‘skipper effect’), habitat disturbance, pollution, and temperature changes, may have contributed to significant changes in fish communities and trophic structure in the Beibu Gulf.
1 Introduction
Coastal ecosystems are highly productive, rich in biodiversity, have sustained coastal fisheries for centuries, and support the livelihoods of millions of people globally (Barbier et al., 2011; Lau et al., 2019; Zhang et al., 2020b). In China, since the 1950s, more than 90% of the total marine catch has come from coastal waters (Shan et al., 2016). Unfortunately these waters are also becoming increasingly degraded by fishing (including overfishing, dominance of trawl fishery, and ‘skipper effect’), aquaculture, pollution, industrialization, and the effects of climate change (Crain et al., 2008; Bland et al., 2018; Han et al., 2018; Liang and Pauly, 2019), especially in semi-enclosed shallow bays (Chen et al., 2015; Shan et al., 2016; Zhang et al., 2020b).
Beibu Gulf is a natural semi-enclosed shallow bay in the northwestern SCS. Its unique geomorphology and climate render the area highly productive, and its fishery resources rich (Chen et al., 2009; Wang et al., 2012a). For instance, there are 960 fish species belonging to 475 genera and 162 families reported from the Beibu Gulf, approximately 80% of them are demersal and 20% of them are pelagic (Nguyen et al., 2013). The gulf waters is also one of four traditional fishing grounds in China, and this region is important for food security, the economy, and for employment (Chen et al., 2009; Su et al., 2021).
However, growing demand for fish products has led to increased fishing intensity within the SCS, where the total power of motorized fishing vessels has increased almost 8-fold since the 1980s (Wei et al., 2019). Among them, trawlers were dominant, and their proportion of fishery production remained stable at 40%-50% from 2006-2018 (Wei et al., 2019). At the same time, the skippers tend to target species with high-trophic-level and high value (‘skipper effect’), even though their biomass may be low (Liang and Pauly, 2019). Overfished has led to a decrease in fish abundance and diversity (Pauly et al., 1998; Zhang et al., 2020b). In addition to marine fishing, Beibu Gulf is also affected by increased regional aquaculture and pollution from land (e.g., nitrogen and phosphorus), causing significant eutrophication and red tides (Liu et al., 2019; Leng et al., 2020; Ning and Chen, 2021; Wen et al., 2022), thereby reducing fish growth rates and abundance (Cao et al., 2012; Shan et al., 2016). Meanwhile, nuclear power plants in Guangxi and Hainan province coastal areas also contribute to environmental problems, such as increased water temperature (Yu et al., 2010). Climate change may further degrade critical fish habitat, increase natural fish mortality and reduce fish stocks (Hoegh-Guldberg and Bruno, 2010; Wang et al., 2022).
Furthermore, in addition to reducing fish stocks and biodiversity, overfished affects mean trophic levels (Pauly and Liang, 2019; Su et al., 2021)—one of eight diversity metrics indicating levels of biodiversity reported by Pauly and Watson (2005). MTL has been widely used to evaluate the effects of fishing on fish communities and fisheries resource sustainability (Cury et al., 2005), and many national and international accounts have since identified it to be decreasing. For instance, the MTL in the Quanzhou Bay declined at a rate of 0.10 trophic-level per decade (Du et al., 2010), in the Persian Gulf by 0.11 trophic-level per decade (Razzaghi et al., 2017), and in the Beibu Gulf by 0.04 trophic-level per decade (Su et al., 2021).
In recent decades, studies on the Beibu Gulf fish stocks have focused on fisheries stocks (Sun and Lin, 2004; Wang and Yuan, 2008; Zou et al., 2013; Fu et al., 2019), fish community structure (Chen et al., 2006; Qiao et al., 2008), species diversity (Wang et al., 2011; Wang et al., 2012b), and biological characteristics (Wang et al., 2012a; Wang et al., 2020; Zhang et al., 2020a; Wang et al., 2021). However, few studies have examined how fish communities and trophic structure have changed in response to external stressors. We analyze fish communities and MTL in the Beibu Gulf using data from 26 bottom trawl fishery resource surveys conducted twice annually from 2006–2018. We describe successional characteristics of these communities, and provide a reference for more sustainable development of these fishery resources.
2 Materials and methods
2.1 Data sources
2.1.1 Catch data
Catch data were obtained from bottom-trawl fishery resource surveys in the Beibu Gulf (17°00’–21°45’N, 105°40’–110°10’E) in January (dry season) and July (wet season) from 2006–2018. During each survey, 52 stations were trawled (Figure 1) using a single vessel, the Beiyu 60011 (441 kW power) and gear of 60.5-m length, 37.7-m headrope length, 40-mm codend mesh sizes, towed for ~1 h, and hauled at 3.0–4.0 kn.
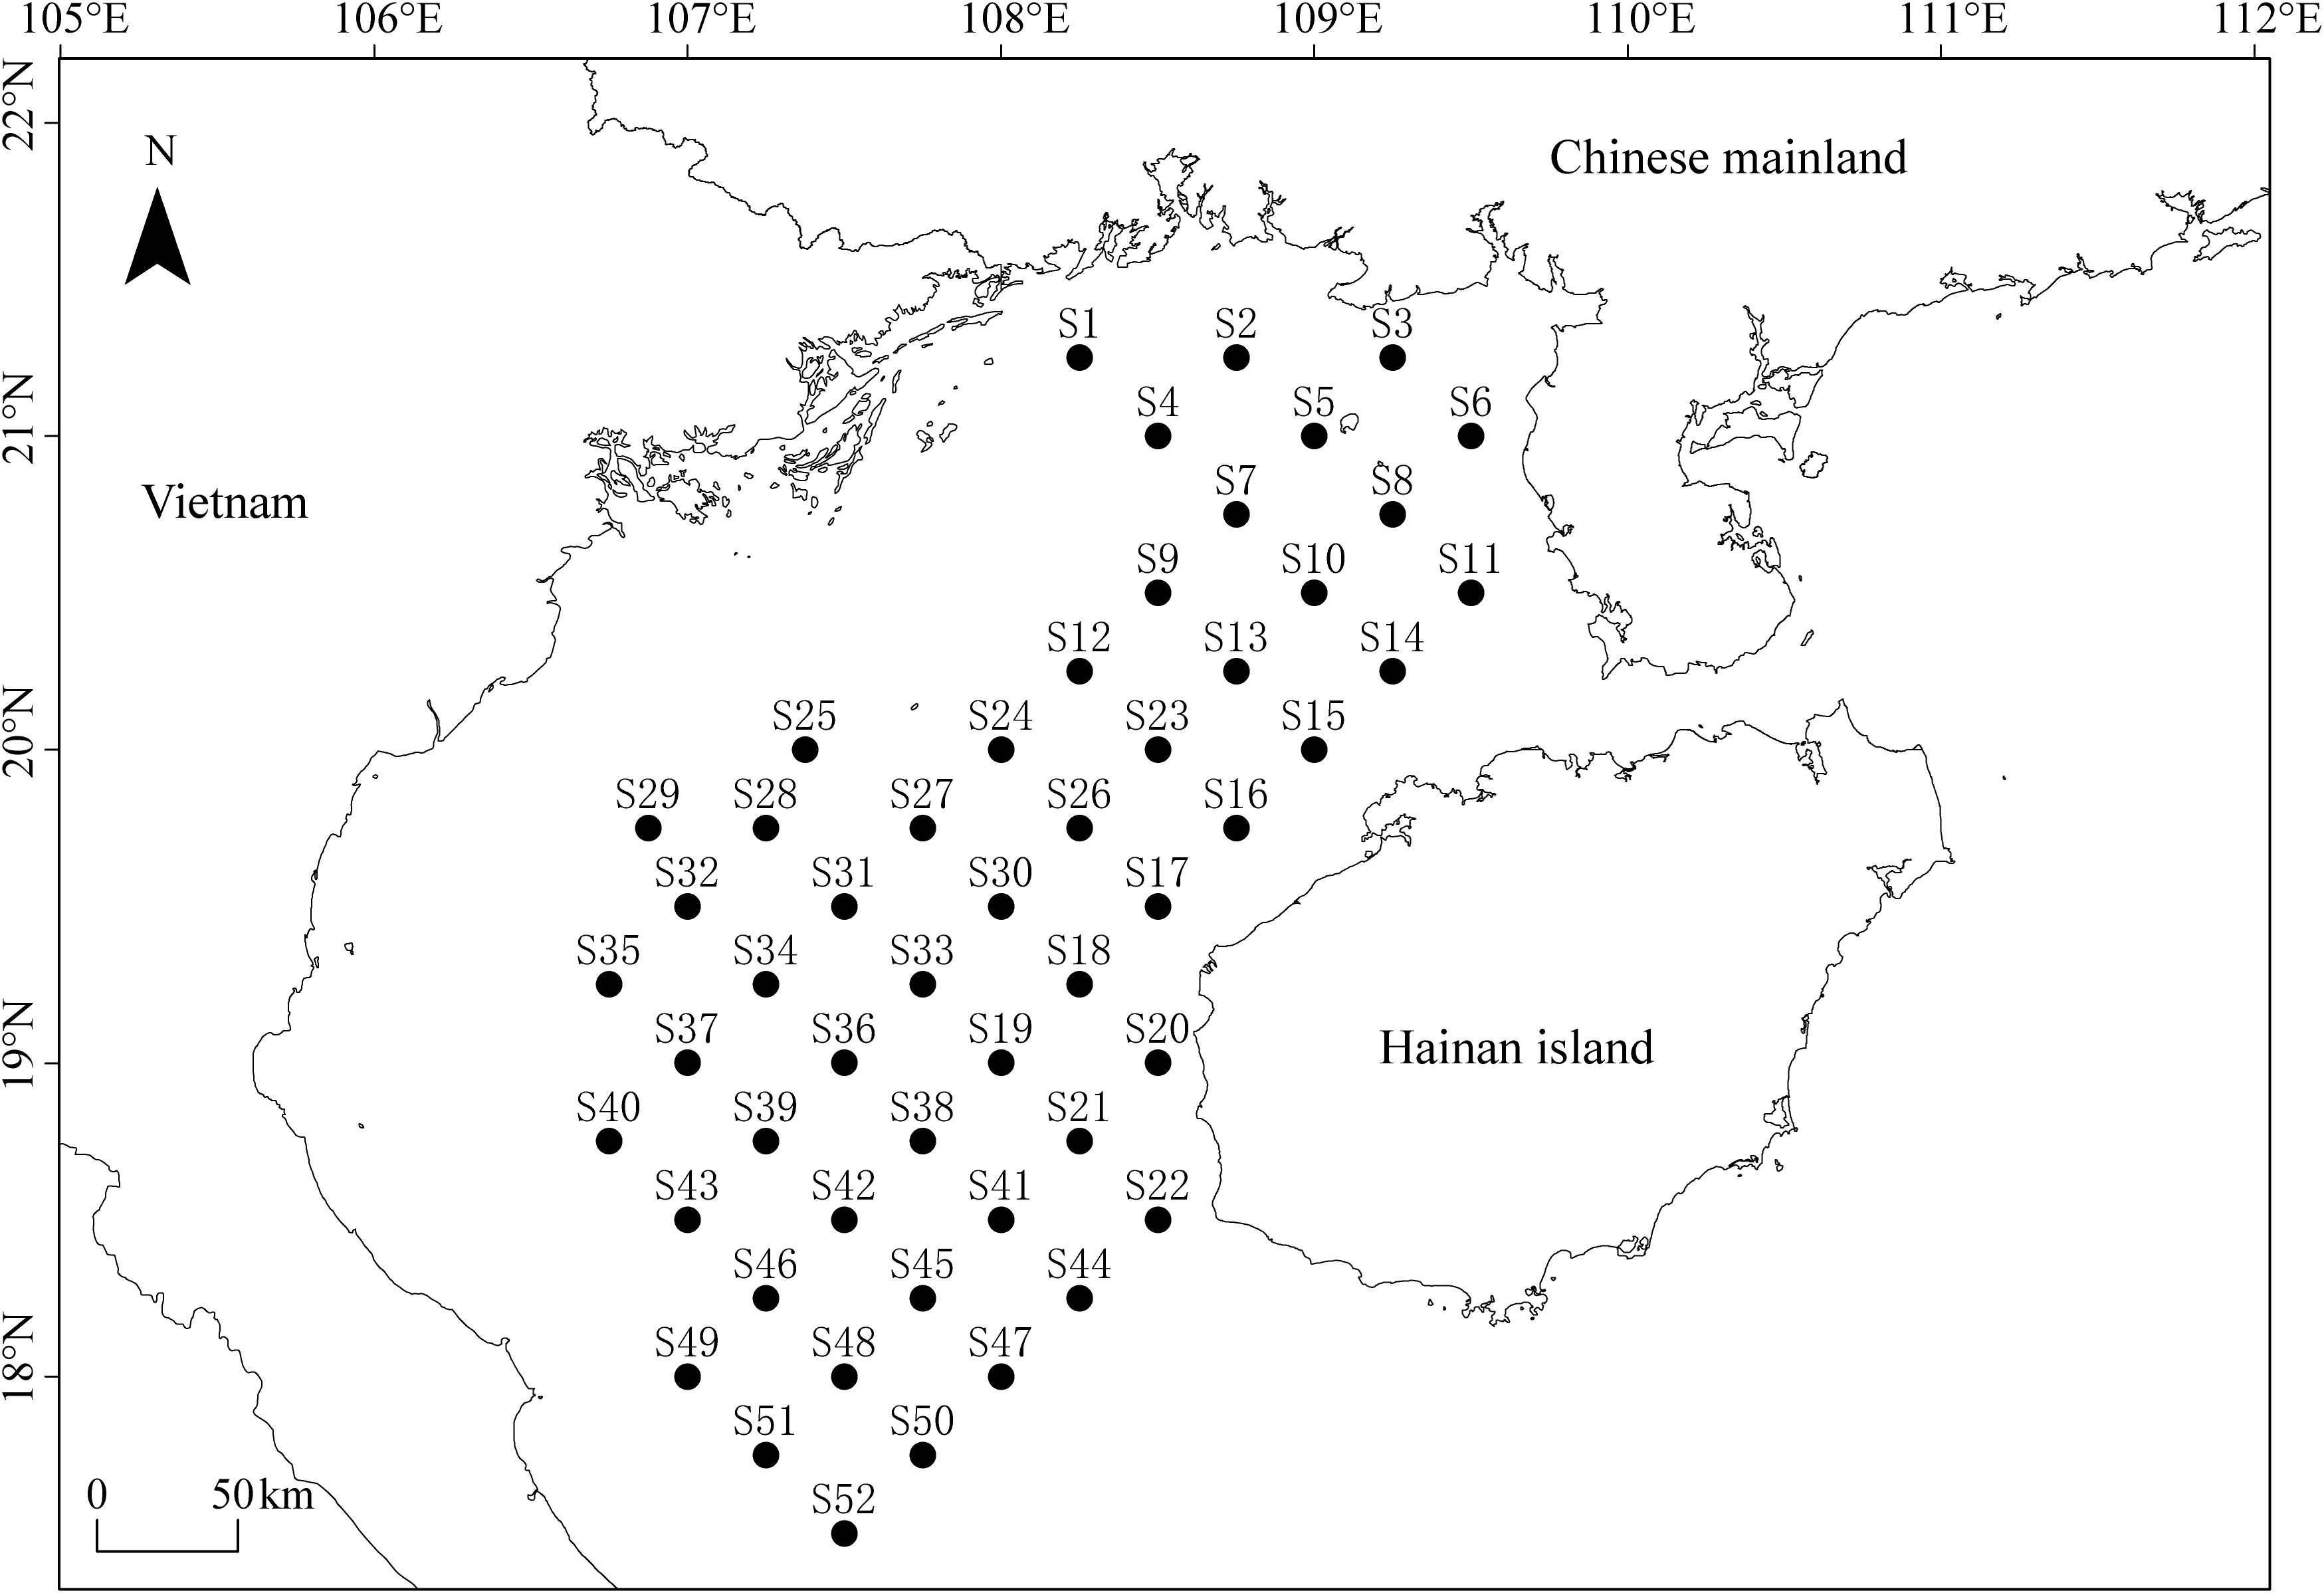
Figure 1 Map of Beibu Gulf survey stations (black dots) from 2006–2018, surrounded by Guangxi, Guangdong and Hainan provinces of China, and Vietnam.
2.1.2 Correlation analysis
Data for total motorized fishing vessel power in the SCS were obtained from Wei et al. (2019) and Chinese Fishery Statistical Yearbooks (Fishery Bureau of Ministry of Agriculture and Rural Affairs of China, 2006-2018). Data for total land-derived pollutants into the Beibu Gulf were retrieved from Ning and Chen (2021) and Zhu et al. (2022), and sea surface temperature (SST) for the region (105–110°E and 17–21°N) from NOAA (https://coastwatch.pfeg.noaa.gov/erddap/griddap/erdMH1sstdmdayR20190SQ.html). Total motorized fishing vessel power in the SCS and total land-derived pollutants and SST in the Beibu Gulf did not correlate significantly (Pearson correlation analysis, p > 0.05).
2.2 Data processing
2.2.1 Fish abundance
Because the survey vessel and gear were consistent from 2006–2018, we analyze CPUE normalized to a hauling speed of 3.5 kn. CPUE for each year is calculated as follows (Nishida and Chen, 2004):
where CPUEik is stock abundance at station i in year k (kg·h−1), Yik is the catch at station i in year k (kg), Tik is the hauling time at station i in year k (h).
2.2.2 Dominant species composition
We regard the top 10 species with the greatest proportional (%) contribution to total catch as being dominant for each year (Su et al., 2021). Interannual variation in these dominant species is assessed using dominant species replacement rate (R), calculated as follows (Yang et al., 2000):
where a and b are the number of dominant species in consecutive years, and c is the number of common dominant species in consecutive years.
2.2.3 Diversity indexes
We appraise diversity using the Shannon–Wiener diversity (H′) and Margalef’s richness (D′) indexes (Young and Young, 1998). Because of considerable variation in catch existed both within species and among species, diversity expressed using catch was closer to energy distribution among species (Wilhm, 1968). Accordingly, for each index we calculate diversity using catch data as follows:
where S is number of species, W is total catch (g), and Pi is the proportion of species i to the total catch.
2.2.4 Mean trophic level
We apply a trophic level of 3.5 to differentiate high from low-trophic-level species (Liang and Pauly, 2019) using trophic level reference data from FishBase (www.fishbase.org) and the Sea Around Us Project Database (www.seaaroundus.org). We calculate MTL following Pauly et al. (1998):
where MTLk is mean trophic level in year k, TLi is trophic level of species i, m is number of species in year k, Yik is catch of species i in year k (kg), and Yk is total catch in year k (kg).
2.2.5 Fishing-in-balance index
Because it is not rigorous to assess the impact of fishing on marine ecosystems through changes in MTL alone, thereby we use the FiB index of Pauly et al. (2000) to independently identify ‘trophic balance’ in marine fisheries management. The calculation formula of FiB index is as follows:
where Yk is total catch in year k (kg), TE is conversion efficiency, usually taken as 0.1 (Pauly and Christensen, 1995), MTLk is mean trophic level in year k, and 0 is the base year (we use 2006).
3 Results
3.1 Fish abundance
CPUE in the Beibu Gulf decreased from 40.69 kg·h−1 in 2006 to 15.48 kg·h−1 in 2018 (Figure 2A). Among years, there was a wavy downward trend from 2006 to 2014 at 11.64 kg·h−1·a−10 and a sharp decline from 2014–2018 at 29.46 kg·h−1·a−10. Correlations between CPUE and total motorized fishing vessel power, and total land-derived pollutants were negative (Figures 2B, C; p< 0.05).
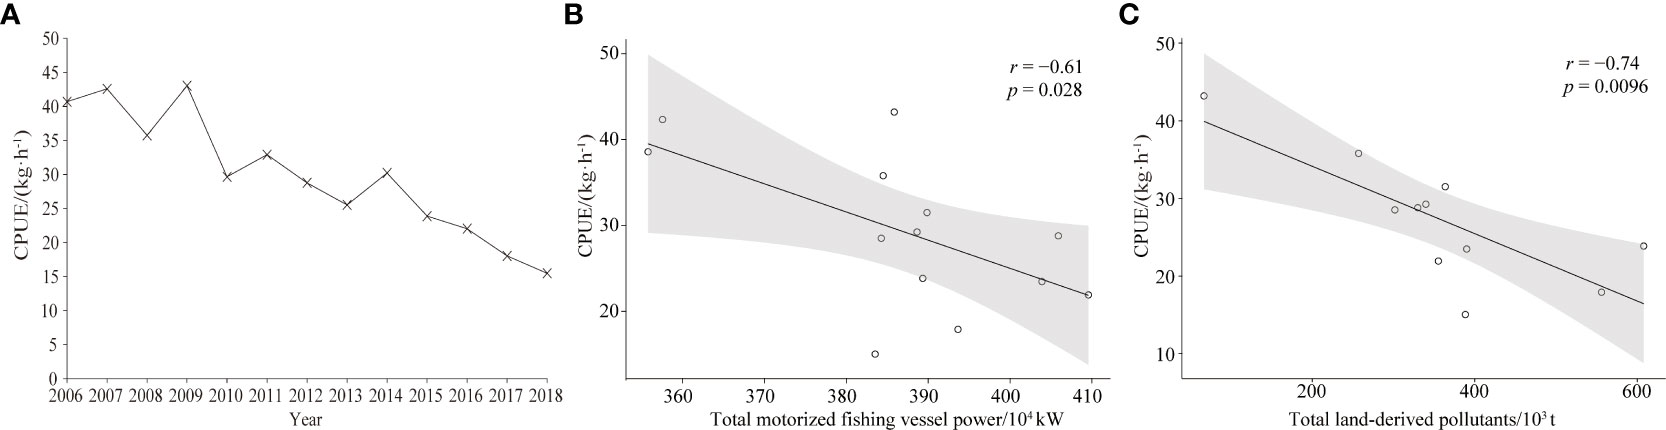
Figure 2 Trends of CPUE in Beibu Gulf (A); and correlation analysis of CPUE with: (B) total motorized fishing vessel power, and (C) total land-derived pollutants.
3.2 Percentage of total catch with the different taxonomic groups
Figure 3 depicts interannual variation in the percentage of total catch with the different taxonomic groups in the Beibu Gulf. Figure 3A illustrates interannual trends in proportions of demersal and pelagic species, with the percentage of the former gradually decreasing over 3-year blocks of time (2006–2008 (mean 87.51%), 2009–2011 (mean 84.73%), 2012–2014 (mean 83.34%), 2015–2017 (mean 81.04%)), and remaining low in 2018 (mean 81.04%). While proportions of low-trophic-level species trended upward (Figure 3C), especially after 2010, proportions of high-trophic-level species trended downward and correlated positively with the proportion of demersal species (Figure 3B; p< 0.05). Moreover, the proportion of high-trophic-level species also correlated negatively with total motorized fishing vessel power (Figure 3D; p< 0.05), and decreased as power increased.
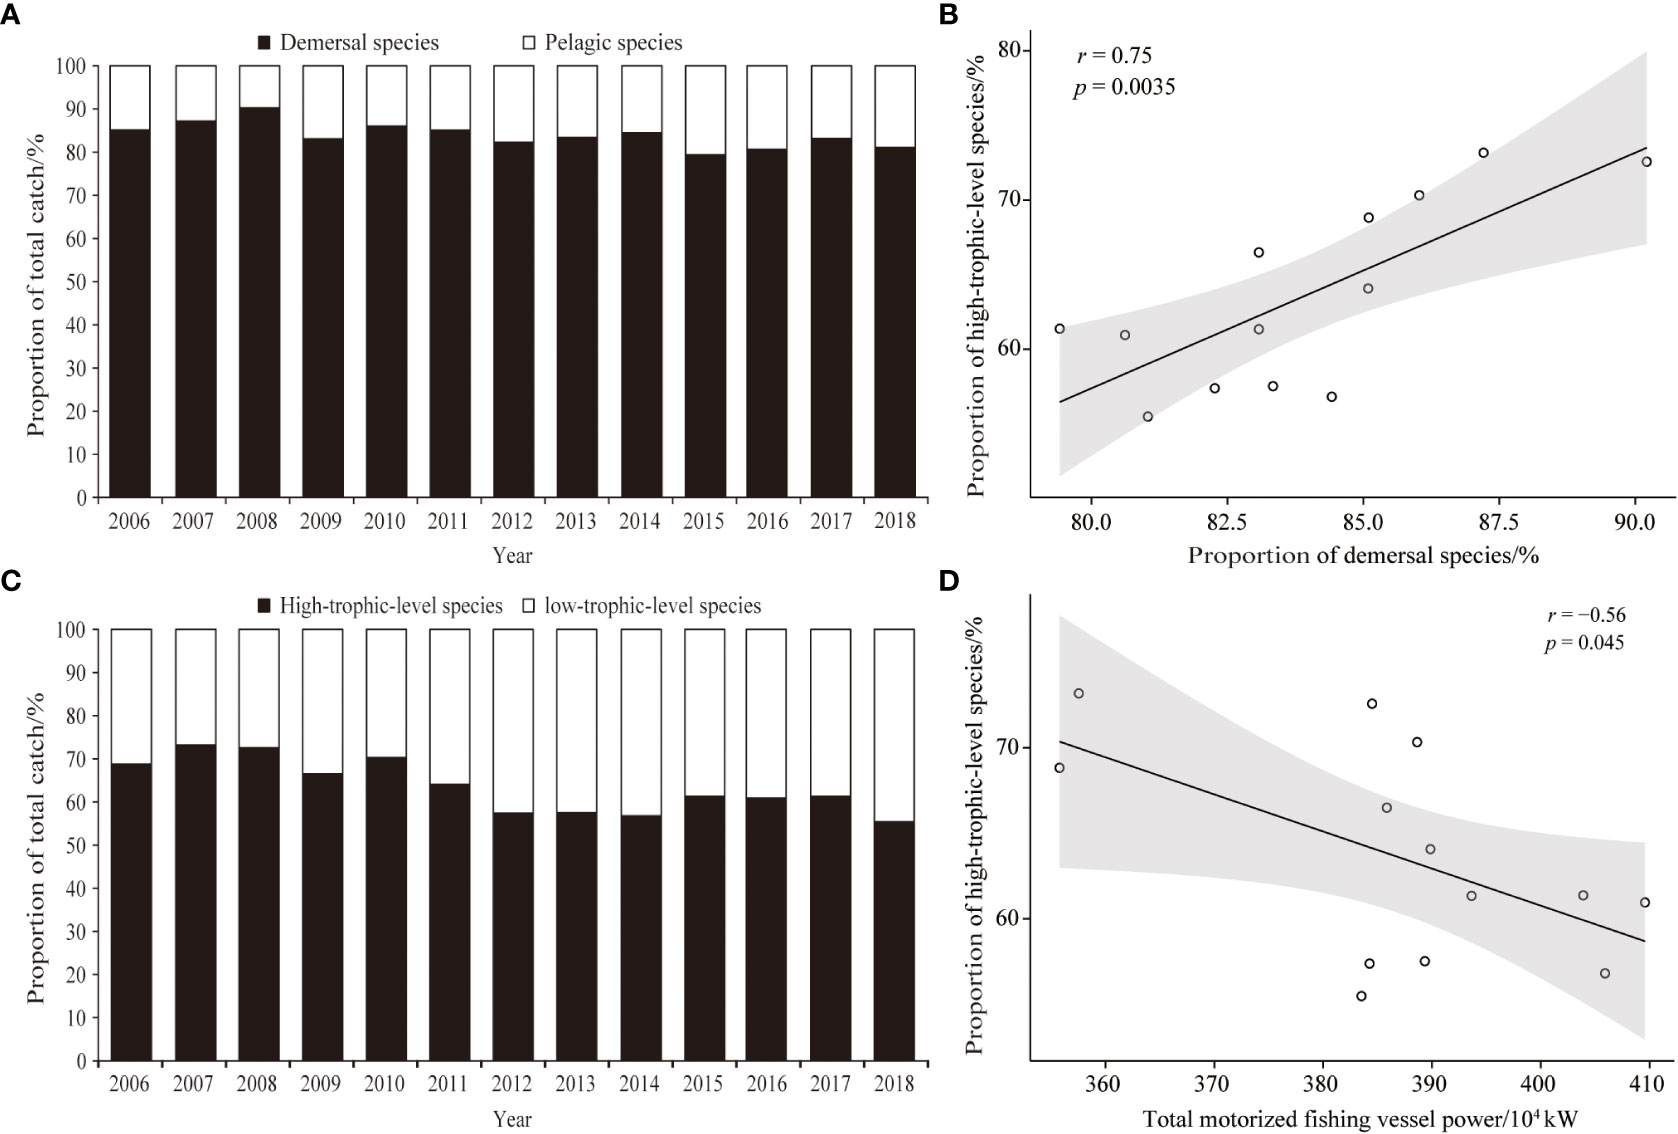
Figure 3 Temporal variation in the proportional contributions of demersal and pelagic species to total catch in Beibu Gulf (A); correlation analysis of proportions of high-trophic-level species with demersal species (B); (C) proportions of high/low-trophic-level species; (D) correlation analysis of proportions of high-trophic-level species and total motorized fishing vessel power.
3.3 Dominant species composition
Dominant species composition in the Beibu Gulf changed dramatically from 2006–2018, but Trachurus japonicus, Parargyrops edita, and Saurida tumbil were consistently dominant (Table 1). Dominant species composition and their proportional contributions to community structure varied between years (Table 1), with demersal species (e.g., Argyrosomus argentatus, A. macrocephalus, Johnius belangerii, Nemipterus virgatus) gradually disappearing, and the proportions to total catch of pelagic dominant species (e.g., T. japonicus, P. edita, Decapterus maruadsi) trending upward.
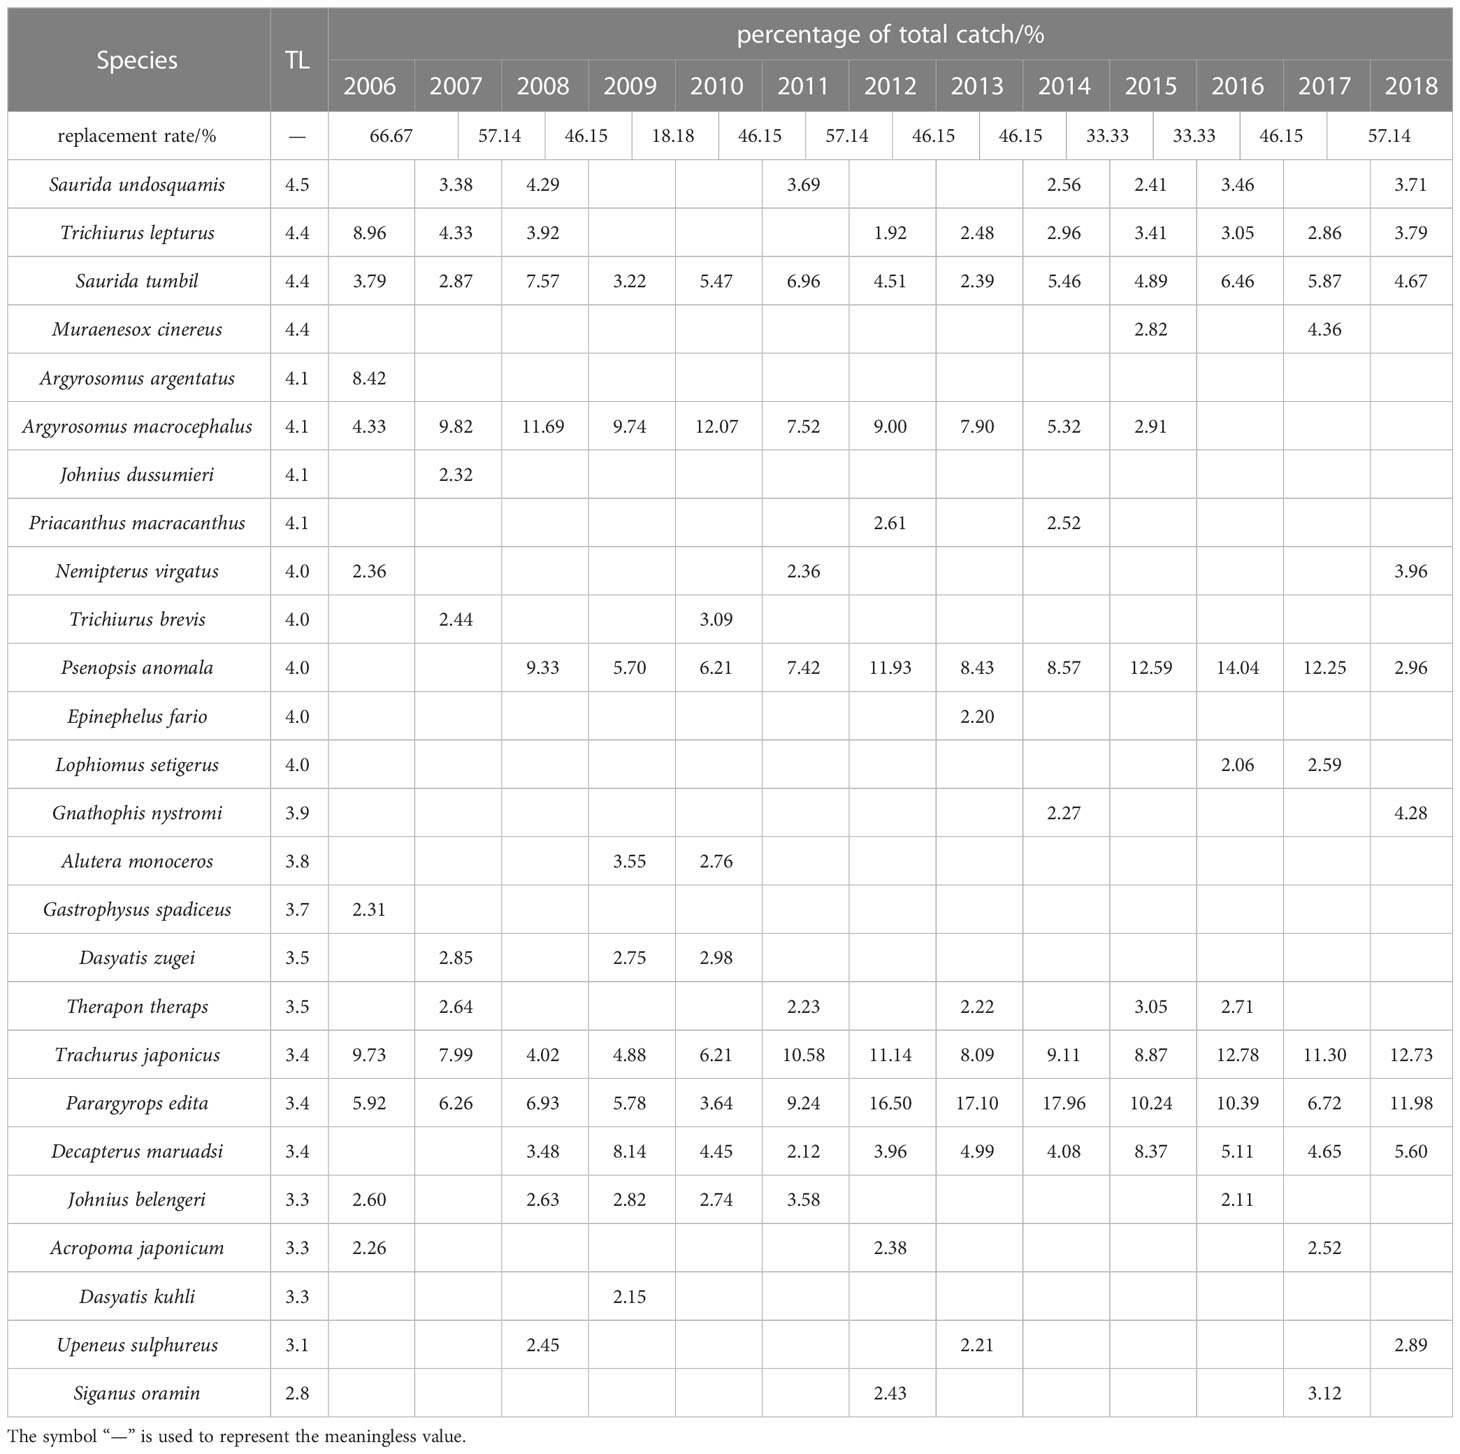
Table 1 Variation in dominant species composition and replacement rate in Beibu Gulf.
3.4 Diversity indexes
Diversity indexes fluctuated, but generally trended downward (Figure 4). The mean Margalef’s richness index value gradually decreased from 2.83 in 2006 to 2.41 in 2012, and then gradually increased to 2.78 in 2018; the mean Shannon–Wiener diversity index gradually decreased from 2.27 in 2006 to 2.09 in 2012, and then gradually increased to 2.26 in 2018. Pearson correlation analysis revealed both Margalef’s richness and Shannon–Wiener diversity indexes to correlate significantly (p< 0.05).
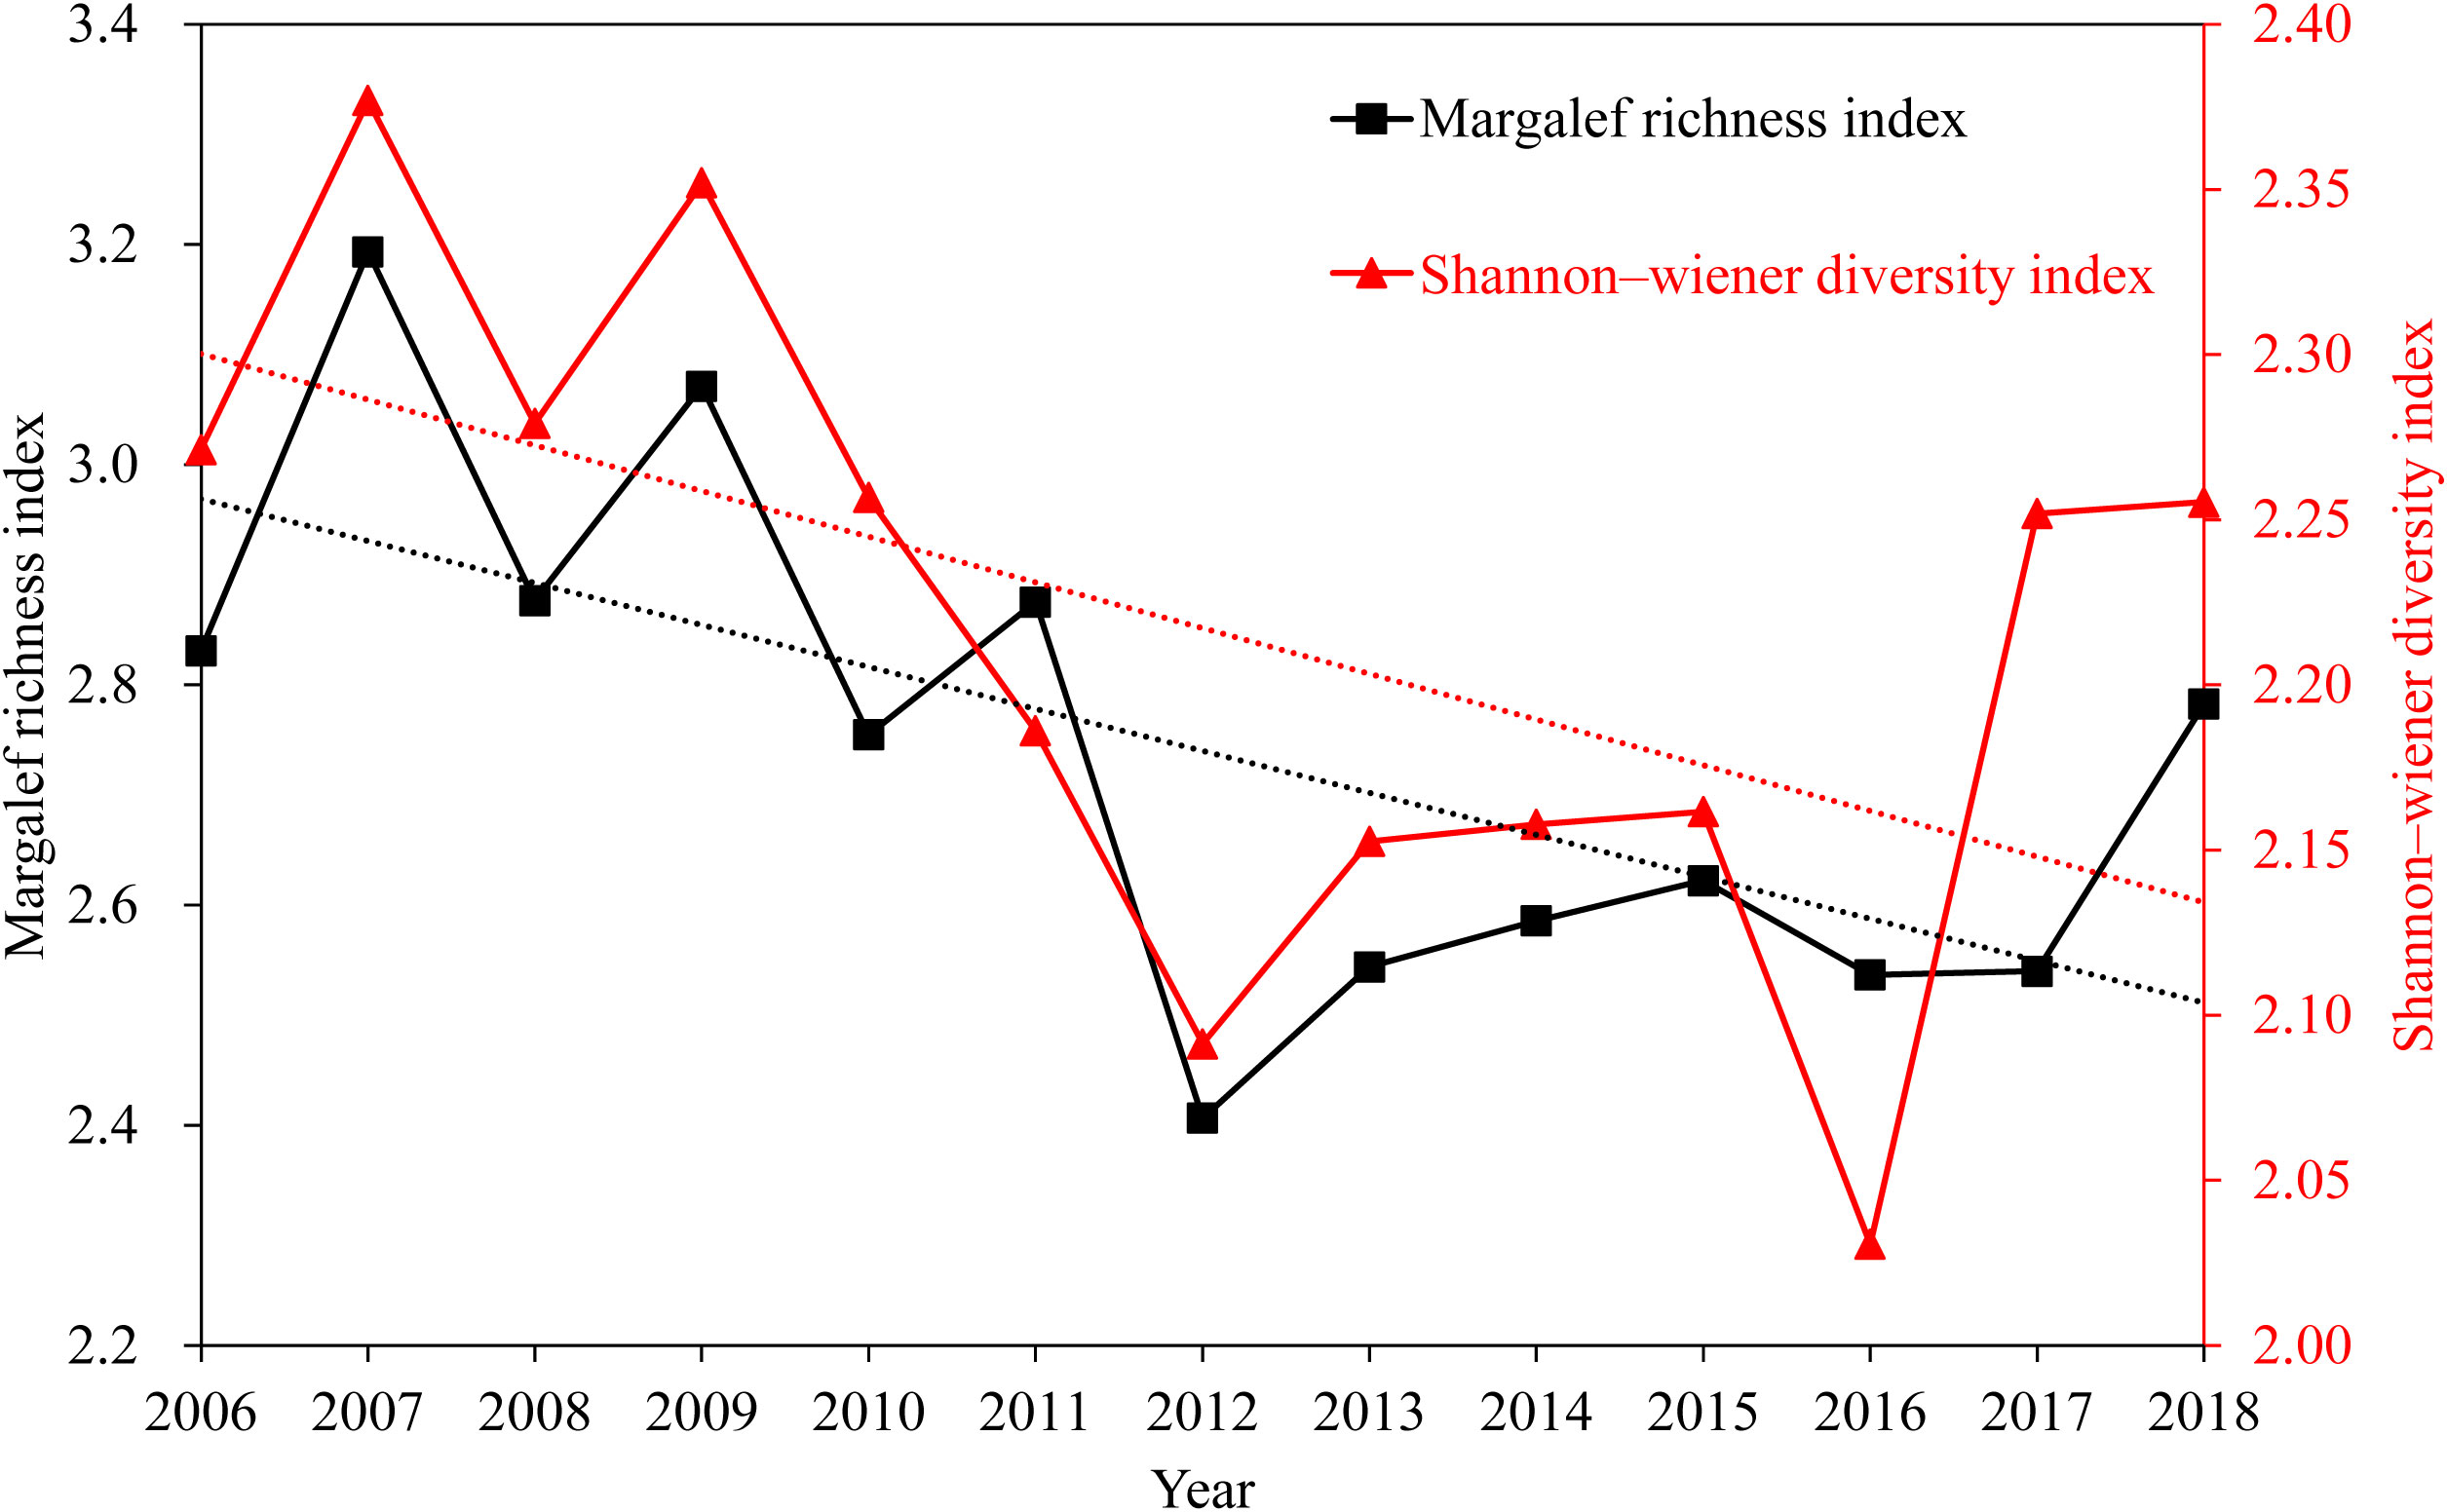
Figure 4 Interannual variation in fish diversity indexes, Beibu Gulf.
3.5 Mean trophic level
The MTL showed an overall wavelike downward trend from 3.82 in 2006 to 3.71 in 2018, decreasing by 0.08 trophic-level per decade (Figure 5A); MTL decreased from 2008–2009, 2010–2013, and 2016–2018, and increased from 2006–2008, 2009–2010, and 2013–2016. The correlation between MTL and proportion of high-trophic-level and demersal species (Figures 5C, D; p< 0.05) was positive, and negative with SST (Figure 5B; p< 0.05).
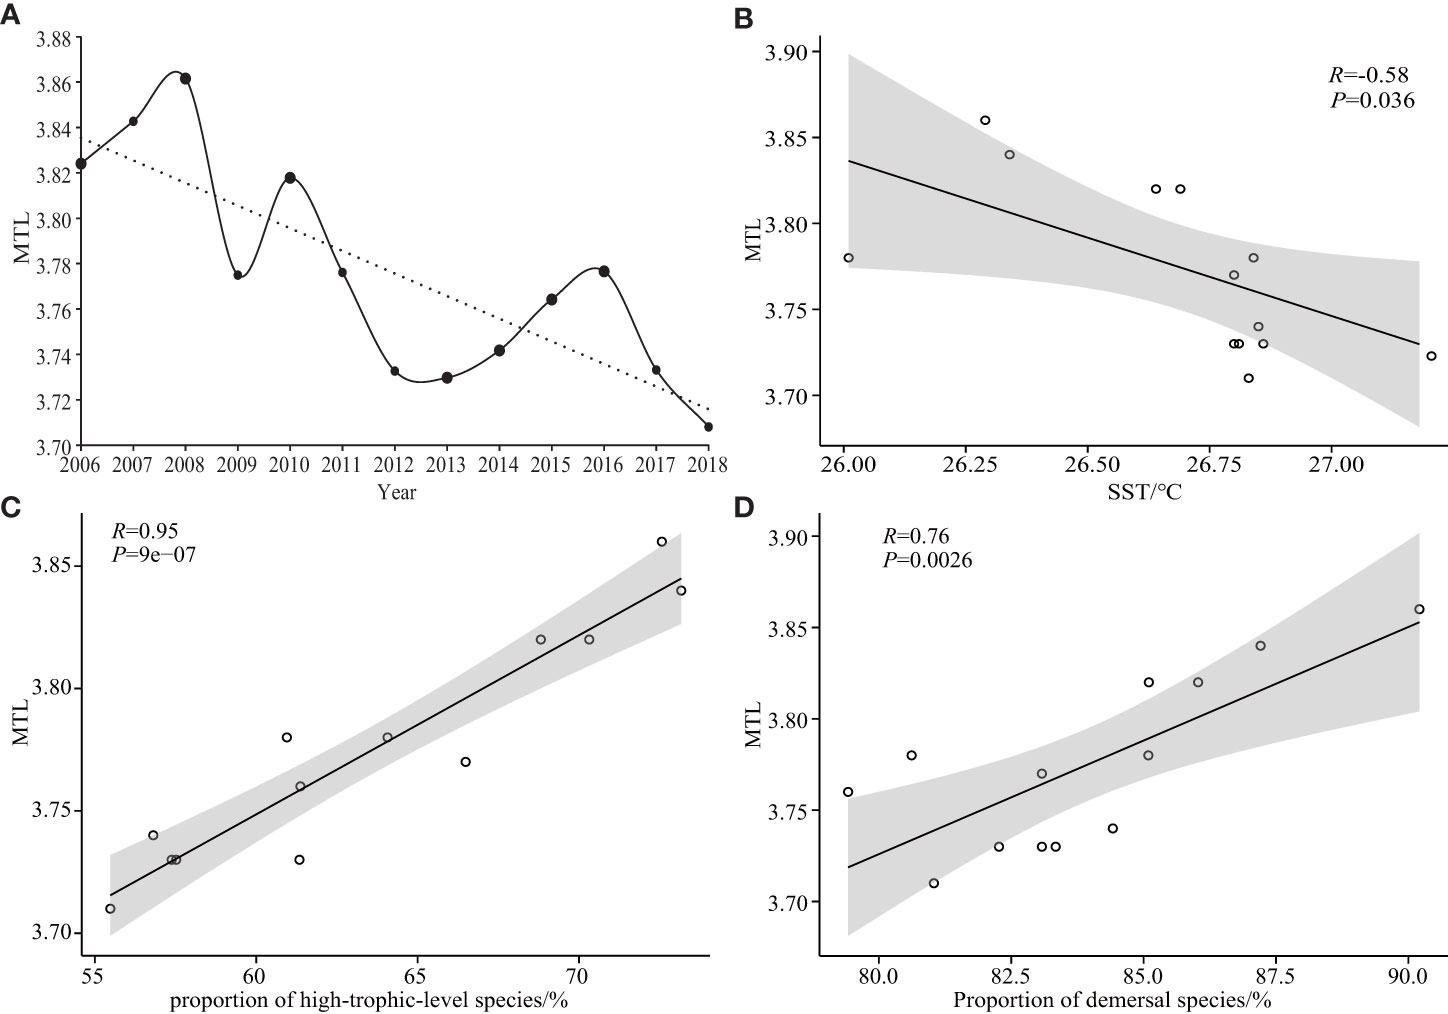
Figure 5 Trends in mean trophic level of Beibu Gulf fish communities (A); correlation analysis of MTL with: (B) SST, and proportions of (C) high-trophic-level species, and (D) demersal species.
3.6 Fishing-in-balance index
The FiB index showed a wavy downward trend (Figure 6A), was closely related to changes in MTL and fish abundance (Figures 6B–D; p< 0.05), and decreased with decreased MTL and fish abundance. This index peaked from 2006 to 2007, and gradually declined to its lowest point from 2007–2018.
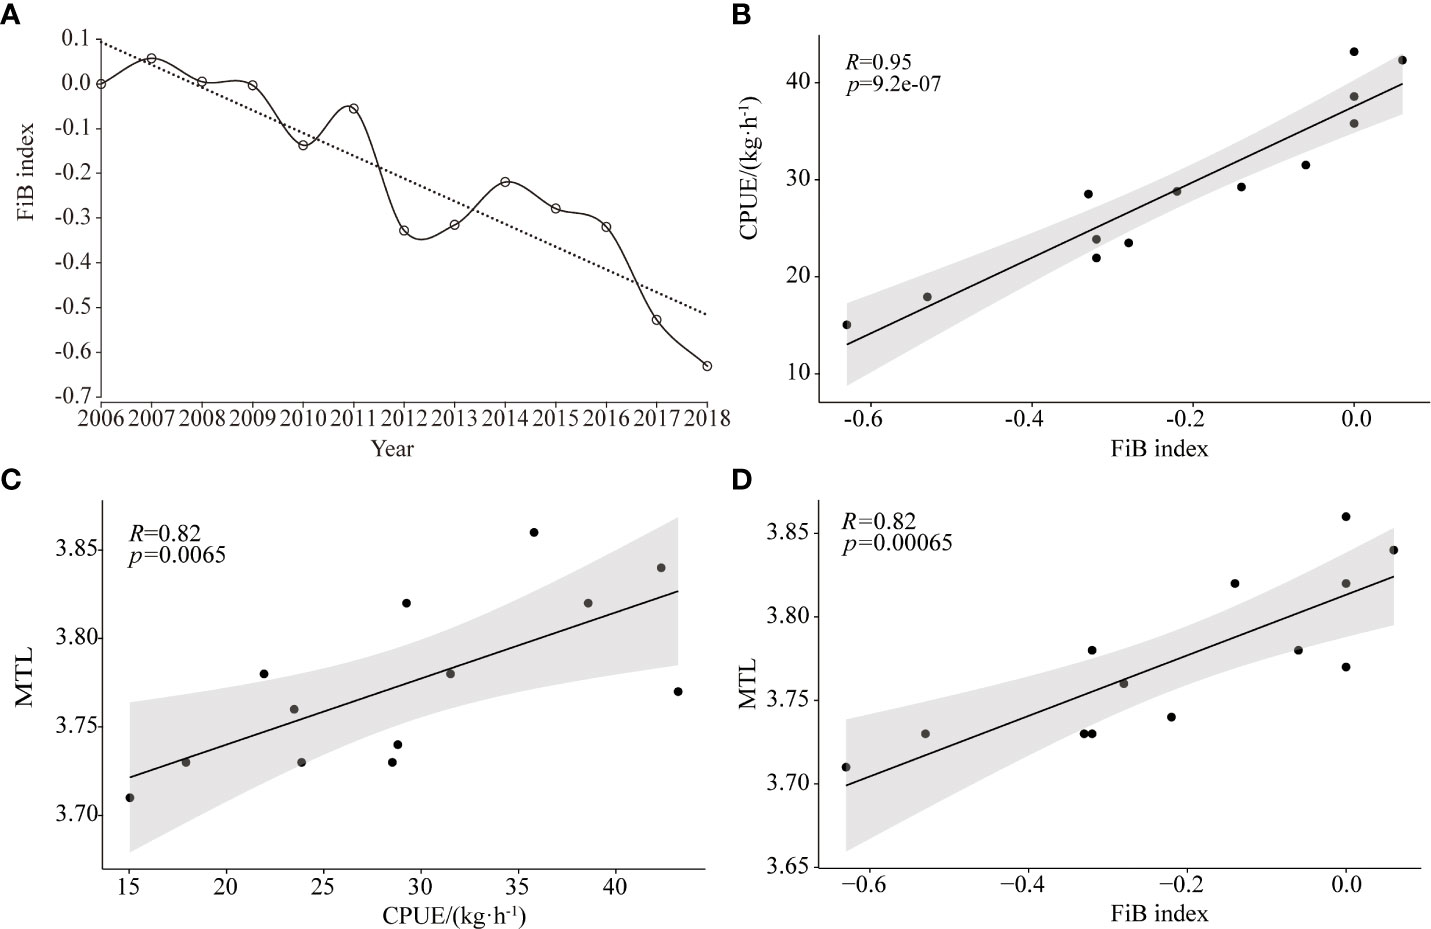
Figure 6 Trends in FiB index in Beibu Gulf (A); and correlation analysis of: CPUE with FiB index (B), MTL with CPUE (C), and MTL with FiB index (D).
4 Discussion
4.1 Declining fish stocks
In recent decades, overfished, aquaculture, pollution, industrialization, and Climate change have all contributed to declining fisheries resources in the Beibu Gulf (Zou et al., 2013; Su et al., 2021). The decline in fisheries stocks is shown as a decrease in fish abundance (Su et al., 2021). The total motorized fishing vessel power and total marine catch in the SCS have gradually increased from 2006–2016 (Wei et al., 2019), while fish abundance in the Beibu Gulf has trended down, especially from 2014–2018 during which time CPUE decreased by 27.50 kg·h−1·a−10, indicating that fishing had significantly impacted fish abundance (Figure 2B; p< 0.05). However, the total motorized fishing vessel power and total marine catch in the SCS decreased from 2016–2018 (still at a high level) (Wei et al., 2019), while fish abundance in the Beibu Gulf declined at an increased rate, indicating that declining fish abundance was influenced by a combination of other factors.
Habitat loss may contribute to declining fish stocks (Nakagiri et al., 2001; Safina and Duckworth, 2013; Zhang et al., 2020b). Large-scale reclamation, port construction and aquaculture in the Beibu Gulf have changed coastal contours, affected sediment deposition, and altered natural habitats (Sun et al., 2020; Wen et al., 2022). Coastline in the Beibu Gulf has generally advanced seaward, and mangrove habitat has declined from the 1990 to 2007 (Li et al., 2015; Sun et al., 2020; Tian et al., 2021). Pollutants from residential, industrial and agricultural activities have also contributed to eutrophication and harmful algal blooms, significantly affecting the ecology, reducing natural habitat and losing native species (Liu et al., 2019; Leng et al., 2020; Ning and Chen, 2021). For instance, there was a significant negative correlation between fish abundance in the Beibu Gulf and increased land-derived pollutants from 2006–2018 (Figure 2C; p< 0.05).
4.2 Shifts in fish community composition
Dominant species composition in the Beibu Gulf has changed dramatically between 2006 and 2018 (Table 1), with high-trophic-level species (e.g., A. argentatus, A. macrocephalus, J. belangerii, N. virgatus) gradually disappearing from the list of the 10-most dominant species, and the proportion of low-trophic-level dominant species (e.g., T. japonicus, P. edita and D. maruadsi) tending to increase. Moreover, the change in proportional contribution of high-trophic-level and demersal species from 2006 to 2018 is closely correlated (Figure 3B; p< 0.05), with the decrease in high-trophic-level species occurring with a decrease in demersal species, indicating that most demersal species were high-trophic-level species.
Overall, the fish community in the Beibu Gulf has shifted from demersal to pelagic species, and from large, commercially important, high-trophic-level species to small, lower-value, low-trophic-level species. This shift is likely because of overfishing, the dominance of a trawl fishery, and ‘skipper effect,’ whereby the decline in high-trophic-level species is accelerated by a captains’ preference for high-value species and their attempts to maintain catch of large, high-trophic-level species (Liang and Pauly, 2019). For instance, the proportion of high-trophic-level species in the Beibu Gulf decreased with increased total motorized fishing vessel power (Figure 3D; p< 0.05). Obvious consequences of this overfishing are the decline in high-value species and increased difficulty in catching large, high-trophic-level species (Zhang et al., 2020b). Therefore, fisheries in the Beibu Gulf have largely shifted from large, long-lived, high-trophic-level species to small, short-lived, low-trophic-level species.
Unlike Daya Bay, another semi-enclosed marine ecosystem in China (Zhang et al., 2020b), fish communities in the Beibu Gulf have shifted from demersal to pelagic species, possibly because of the dominance of the trawl fishery. Since the 1980s, trawls have been the main fishing gear used in the SCS, with the proportion of landings from trawl fisheries to total landings generally declining each year, from 68% in 1980 to 41% in 2017 (Wei et al., 2019). Demersal species are mainly caught by trawls, reducing their number and leading to their eventual replacement by pelagic species.
4.3 Changes in fish community diversity
Margalef’s richness and Shannon–Wiener diversity indexes fluctuated from 2006 to 2018, but their general downward trend indicates a gradual decrease in biodiversity in the Beibu Gulf (Figure 4). Fishing is a major contributor to declining biodiversity (Pauly et al., 1998; Zhang et al., 2020b), and overexploitation of fisheries resources in the Beibu Gulf has caused their continuous decline since the 1980s (Wang et al., 2012b; Wei et al., 2019). Rapid fishery development in the Beibu Gulf, modernization of fishing gear, and the gradual improvement of technology have progressively increased the intensity of fishing to a point that significantly exceeds the ability of stocks to recover, causing changes in community structure, and some economically important species to disappear (Liu et al., 2019; Leng et al., 2020; Ning and Chen, 2021). For instance, some high-trophic-level species (e.g., A. argentatus, A. macrocephalus, J. belangerii, N. virgatus) have gradually disappeared from the 10-most dominant species from 2006–2018 (Table 1).
Environmental pollution also affects diversity (Cao et al., 2012; Shan et al., 2016). With development of industry and agriculture, the Beibu Gulf is increasingly affected by discharged industrial wastewater and domestic sewage. Previous studies have shown that tourism, industry and transportation around the Beibu Gulf have rapidly increased pollution (e.g., inorganic nitrogen, phosphate, heavy metals) in nearshore waters, stressing coastal marine ecosystems and changing natural habitats (Liu et al., 2019; Leng et al., 2020; Ning and Chen, 2021). Habitat-sensitive species (e.g., A. macrocephalus, J. belangerii) are gradually disappearing as dominant species (Table 1).
Diversity in the Beibu Gulf rebounded between 2012 and 2018 (Figure 4). Because mangroves can absorb, filter and precipitate nutrients from land-derived runoff, they improve water quality before it reaches the sea (Fan, 2021; Liu et al., 2022). For many fish species, mangrove habitat also provides breeding grounds and refuge for juveniles, and their presence significantly and positively affects fish community structure and biomass (Fan, 2021; Liu et al., 2022). Mangrove habitat in the Beibu Gulf has increased nearly 4-fold from 2007 to 2012 and remained stable until 2018 (Li et al., 2015; Ning and Chen, 2021; Deng et al., 2022). There appears to have been a 5-year lag in recovery in the Margalef’s richness and Shannon–Wiener diversity indexes, which rose from 2012 to 2018.
4.4 Reduction in mean fish community trophic level
The reliability of MTL as a metric for assessing the effects of fishing on fish communities or fisheries resource sustainability depends on the quality and length of time-series data available (Pauly et al., 2001). Our data span 13 consecutive years and are collected from a single survey vessel using consistent gear, so we regard them to be of both excellent quality and long-term duration.
Long-term changes in MTL can indicate changes in fish community structure and fishery resources (Su et al., 2021). The MTL in the Beibu Gulf shows an overall wavelike downward trend from 3.82 in 2006 to 3.71 in 2018, and to have decreased by 0.08 trophic-level per decade (Figure 5A). This indicates that fish communities have changed and that fish stocks are declining. The rate of decline in MTL in the Beibu Gulf exceeds the rate throughout China (0.02 trophic-level per decade) (Du et al., 2014), but is lower than the global rate (0.1 trophic-level per decade) (Pauly et al., 1998) and that for other regions, where the rates of decline were between 0.09 and 0.17 (Zhang et al., 2007; Connell et al., 2014; Wu et al., 2017). Compared with Quanzhou Bay (0.1 trophic-level per decade) (Du et al., 2010) and Persian Gulf (0.11 trophic-level per decade) (Razzaghi et al., 2017), the decline of MTL in the Beibu Gulf is moderate.
The FiB index tends to be less than 0 (Figure 6A), indicating that fish stocks in the Beibu Gulf have been overfished (Su et al., 2021). Variation in the FiB index is closely related to changes in MTL and fish abundance (Figures 6B–D; p< 0.05), decreasing with a decrease in both MTL and fish abundance. The main reason for the decline in MTL is overfishing, with the main catch shifting from high-value, long-lived, high-trophic-level, demersal species to lower-value, small-sized, low-trophic-level, pelagic species, which is present in many aquatic ecosystems worldwide (Pauly et al., 1998; Liang and Pauly, 2019). The proportion of high-trophic-level species to total catch in the Beibu Gulf has decreased with an increase in total motorized fishing vessel power (Figure 3D; p< 0.05), and the proportion of high-trophic-level and demersal species in the total catch correlates positively with MTL (Figures 5C, D; p< 0.05). Therefore, because of overfishing, fish communities in the Beibu Gulf have changed from long-lived, high-value, high-trophic-level, demersal species to short-lived, low-value, low-trophic-level, pelagic species, then leading to a decline in MTL. Similar ‘fishing down marine food webs’ has been reported elsewhere in China (Liang and Pauly, 2017; Liang and Pauly, 2019).
Furthermore, climate-change may have contributed to observed changes in community composition and structure. For example, while the diversity index trended upwards from 2016 to 2018, each of MTL, the FiB index, and fish abundance trended down (Figures 1A, 4, 5A, 6A). Ocean SST and eutrophication are affected by climate change (Painting et al., 2013; Mediodia et al., 2020). We report SST to correlate negatively with MTL (Figure 5B; p< 0.05), and for higher temperatures to simplify food-web structure and shorten the path of energy between consumers and resources, accelerating the decrease in MTL (O'Gorman et al., 2019). Pollution from residential, industrial and agricultural activities may also exacerbate eutrophication in the Beibu Gulf (Ning and Chen, 2021), increasing primary productivity, significantly increasing the abundance of phytophagous, low-trophic-level species (Caddy, 1993; Caddy et al., 1998; Connell et al., 2014). While this increase in low-trophic-level species contributes to a statistical recovery in diversity, it also led to decreased MTL, FiB index, and fish abundance (Caddy, 1993; Caddy et al., 1998; Connell et al., 2014).
There were some uncertainties in MTL. As fish grow and develop, their diet can change, resulting in changes in their trophic level (Jennings et al., 2002). The MTL calculation does not take into account the size of individual fish. Therefore, changes in trophic level due to individual growth can have an effect on the MTL.
5 Conclusion
Multiple external disturbances (e.g., overfishing, trawl fisheries, ‘skipper effect’, habitat damage, pollution, and anthropogenic-induced temperature changes) may all have collectively contributed to changes in fish community composition and trophic structure in the Beibu Gulf. Fish abundance and diversity in the Beibu Gulf has trended down from 2006 to 2018. Dominant species composition has changed dramatically, and low-trophic-level dominant species have tended to become increasingly, proportionally prevalent in the total catch. Fish communities have changed from those dominated by demersal species to those dominated by pelagic species, and from large, high-value, high-trophic-level to small, lower-value, low-trophic-level species. Additionally, MTL has decreased from 3.82 in 2006 to 3.71 in 2018, and the FiB index has tended be less than 0, suggesting that the Beibu Gulf fish stocks are overfished. Therefore, fish stocks in the Beibu Gulf are in a state of continuous decline and overexploitation. We suggest reducing the fishing intensity and strengthening the pretreatment and supervision of land-derived pollutants before their discharge.
Data availability statement
The raw data supporting the conclusions of this article will be made available by the authors, without undue reservation.
Ethics statement
The animal study was reviewed and approved by South China Sea Fisheries Research Institute, Chinese Academy of Fishery Sciences.
Author contributions
SP: methodology, data processing and writing the manuscript. XW and FD: reviewing, editing, and funding acquisition. DS, YW, PC and YQ: conceptualization and reviewing. All authors contributed to the article and approved the submitted version.
Funding
This work was supported by Hainan Provincial Natural Science Foundation of China (422MS156) and Science and Technology Basic Resources Investigation Program of China (2018FY100105, 2017FY201405).
Acknowledgments
We thank Steve O’Shea, PhD, from Liwen Bianji (Edanz) (www.liwenbianji.cn) for editing a draft of this manuscript.
Conflict of interest
The authors declare that the research was conducted in the absence of any commercial or financial relationships that could be construed as a potential conflict of interest.
Publisher’s note
All claims expressed in this article are solely those of the authors and do not necessarily represent those of their affiliated organizations, or those of the publisher, the editors and the reviewers. Any product that may be evaluated in this article, or claim that may be made by its manufacturer, is not guaranteed or endorsed by the publisher.
References
Barbier E. B., Hacker S. D., Kennedy C., Koch E. W., Stier A. C., Silliman B. R. (2011). The value of estuarine and coastal ecosystem services. Ecol. Monogr. 81 (2), 169–193. doi: 10.1890/10-1510.1
Bland L. M., Watermeyer K. E., Keith D. A., Nicholson E., Regan T. J., Shannon L. J. (2018). Assessing risks to marine ecosystems with indicators, ecosystem models and experts. Biol. Conserv. 227, 19–28. doi: 10.1016/j.biocon.2018.08.019
Caddy J. (1993). Toward a comparative evaluation of human impacts on fishery ecosystems of enclosed and semi-enclosed seas. Rev. Fish. Sci. 1 (1), 57–95. doi: 10.1080/10641269309388535
Caddy J., Csirke J., Garcia S., Grainger R. (1998). How pervasive is "Fishing down marine food webs"? Science 282 (5393), 1383–1383. doi: 10.1126/science.282.5393.1383a
Cao L., Huang W., Shan X., Ye Z., Dou S. (2012). Tissue-specific accumulation of cadmium and its effects on antioxidative responses in Japanese flounder juveniles. Environ. Toxicol. Pharmacol. 33 (1), 16–25. doi: 10.1016/j.etap.2011.10.003
Chen J., Ou Y., Liao Y., Lu H., Chen R., Peng H., et al. (2006). Preliminary study on fish community structure in the coastal waters of leizhou in beibu gulf during spring and summer. Ecol. Sci. 25 (4), 354–358. doi: 10.3969/j.issn.1008-8873.2006.04.016
Chen Z., Xu S., Qiu Y. (2015). Using a food-web model to assess the trophic structure and energy flows in daya bay, China. Cont. Shelf Res. 111 (14), 316–326. doi: 10.1016/j.csr.2015.08.013
Chen Z., Xu S., Qiu Y., Lin Z., Jia X. (2009). Modeling the effects of fishery management and marine protected areas on the beibu gulf using spatial ecosystem simulation. Fish. Res. 100 (3), 222–229. doi: 10.1016/j.fishres.2009.08.001
Connell S., Alleway H., Gillanders B., Ward T. (2014). Historical changes in mean trophic level of southern Australian fisheries. Mar. Freshw. Res. 65 (10), 884–893. doi: 10.1071/MF13246
Crain C. M., Kroeker K., Halpern B. S. (2008). Interactive and cumulative effects of multiple human stressors in marine systems. Ecol. Lett. 11 (12), 1304–1315. doi: 10.1111/j.1461-0248.2008.01253.x
Cury P. M., Shannon L. J., Roux J.-P., Daskalov G. M., Jarre A., Moloney C. L., et al. (2005). Trophodynamic indicators for an ecosystem approach to fisheries. ICES J. Mar. Sci. 62 (3), 430–442. doi: 10.1016/j.icesjms.2004.12.006
Deng W., You H., Lei P., Li M., Chen J. (2022). Monitoring of monthly dynamic changes of mangroves based on the FSDAF model. J. Cent. South Univ. For. Technol. 42 (08), 27–39. doi: 10.14067/j.cnki.1673-923x.2022.08.003
Du J., Chen B., Lu Z., Song P., Xu Z., Yu W., et al. (2010). Changes of fish diversity and trophic levels in quanzhou bay. Biodivers. Sci. 18 (4), 420–427. doi: 10.3724/SP.J.1003.2010.420
Du J., Ye G., Chen B., Zheng X. (2014). Changes in the marine trophic index of Chinese marine area. Biodivers. Sci. 22 (4), 532–539. doi: 10.3724/SP.J.1003.2014.13200
Fan H. (2021). Mangroves at the intersection of ecological protection and targeted poverty alleviation. Bull. Chin. Acad. Sci. 35 (3), 138–143.
Fishery Bureau of Ministry of Agriculture and Rural Affairs of China (2006-2018). China Fishery statistical yearbook (Beijing: China Agriculture Press).
Fu X., Xu Z., Que J., Yan T. (2019). Temporal-spatial distribution characteristics of fish stocks in north-west coastal waters of beibu gulf. Fish. Sci. 38 (1), 10–18. doi: 10.16378/j.cnki.1003-1111.2019.01.002
Han D., Chen Y., Zhang C., Ren Y., Xu B., Xue Y. (2018). Evaluation of effects of shellfish aquaculture and capture fishery on a semi-closed bay ecosystem. Estuar. Coast. Shelf Sci. 207, 175–182. doi: 10.1016/j.ecss.2018.04.005
Hoegh-Guldberg O., Bruno J. F. (2010). The impact of climate change on the world's marine ecosystems. Science 328 (5985), 1523–1528. doi: 10.1126/science.1189930
Jennings S., Greenstreet S., Hill L., Piet G., Pinnegar J., Warr K. J. (2002). Long-term trends in the trophic structure of the north sea fish community: evidence from stable-isotope analysis, size-spectra and community metrics. Mar. Biol. 141 (6), 1085–1097. doi: 10.1007/s00227-002-0905-7
Lau J. D., Hicks C. C., Gurney G. G., Cinner J. E. (2019). What matters to whom and why? understanding the importance of coastal ecosystem services in developing coastal communities. Ecosyst. Serv. 35, 219–230. doi: 10.1016/j.ecoser.2018.12.012
Leng Y., Xiao H., Li Z., Wang J. (2020). Tetracyclines, sulfonamides and quinolones and their corresponding resistance genes in coastal areas of beibu gulf, China. Sci. Total Environ. 714, 136899. doi: 10.1016/j.scitotenv.2020.136899
Li C., Xia Y., Dai H. (2015). Temporal analysis on spatial structure of mangrove distribution in guangxi, China from 1960 to 2010. Wetl. Sci. 13 (03), 265–275. doi: 10.13248/j.cnki.wetlandsci.2015.03.001
Liang C., Pauly D. (2017). Fisheries impacts on china's coastal ecosystems: unmasking a pervasive ‘fishing down’ effect. PloS One 12 (3), e0173296. doi: 10.1371/journal.pone.0173296
Liang C., Pauly D. (2019). Masking and unmasking fishing down effects: the bohai Sea (China) as a case study. Ocean. Coast. Manage. 184, 105033. doi: 10.1016/j.ocecoaman.2019.105033
Liu G., Lao Q., Su Q., Shen Y., Chen F., Qing S., et al. (2019). Spatial and seasonal characteristics of dissolved heavy metals in the aquaculture areas of beibu gulf, south China. Hum. Ecol. Risk Assess. 26 (7), 1–13. doi: 10.1080/10807039.2019.1629273
Liu X., Liu H., Chen L., Wang X. (2022). Ecological interception effect of mangroves on microplastics. J. Hazard. Mater. 423 (B), 127231. doi: 10.1016/j.jhazmat.2021.127231
Mediodia H. J., Kahui V., Noy I. (2020). Sea Surface temperature and Tuna catch in the eastern pacific ocean under climate change. CESifo Work. Pap. No. 8533. 1–37. doi: 10.2139/ssrn.3689455
Nakagiri N., Tainaka K., Tao T. (2001). Indirect relation between species extinction and habitat destruction. Ecol. Modell. 137 (2-3), 109–118. doi: 10.1016/S0304-3800(00)00417-8
Nguyen K. Q., Tran P. D., Nguyen L. T., Opoku-Acheampong A. A. (2013). Appropriate fishing depths for squid longline fishery in the gulf of tonkin, Vietnam. Fish People. 11 (3), 29–32.
Ning Q., Chen Y. (2021). The situation and protection suggestions of marine ecological environment in the beibu gulf of guangxi. Ocean. Dev. Manage. 38 (6), 60–64. doi: 10.3969/j.issn.1005-9857.2021.06.010
Nishida T., Chen D. (2004). Incorporating spatial autocorrelation into the general linear model with an application to the yellowfin tuna (Thunnus albacares) longline CPUE data. Fish. Res. 70 (2), 265–274. doi: 10.1016/j.fishres.2004.08.008
O'Gorman E., Petchey O. L., Faulkner K. J., Gallo B., Gordon T. A. C., Neto-Cerejeira J., et al. (2019). A simple model predicts how warming simplifies wild food webs. Nat. Clim. Change. 9 (8), 611–616. doi: 10.1038/s41558-019-0513-x
Painting S., Foden J., Forster R., Molen J. V. D., Aldridge J., Best M., et al. (2013). Impacts of climate change on nutrient enrichment. Mar. Clim. Change impacts Annu. Rep. Card 219–235. doi: 10.14465/2013.arc23.219-235
Pauly D., Christensen V. (1995). Primary production required to sustain global fisheries. Nature 376 (6519), 279–279. doi: 10.1038/376279b0
Pauly D., Christensen V., Dalsgaard J., Froese R., Torres F. (1998). Fishing down marine food webs. Science 279 (5352), 860–863. doi: 10.1126/science.279.5352.860
Pauly D., Christensen V., Walters C. (2000). Ecopath, ecosim, and ecospace as tools for evaluating ecosystem impact of fisheries. ICES J. Mar. Sci. 57 (3), 697–706. doi: 10.1006/jmsc.2000.0726
Pauly D., Liang C. (2019). The fisheries of the south China Sea: major trends since 1950. Mar. Policy. 121 (4), 103584. doi: 10.1016/j.marpol.2019.103584
Pauly D., Palomares M. L., Froese R., Sa-a P., Vakily M., Preikshot D., et al. (2001). Fishing down Canadian aquatic food webs. Can. J. Fish. Aquat. Sci. 58 (1), 51–62. doi: 10.1139/cjfas-58-1-51
Pauly D., Watson R. (2005). Background and interpretation of the 'Marine trophic index' as measure of biodiversity. Philos. Trans. R. Soc Lond. Ser. B Biol. Sci. 360 (1454), 415–423. doi: 10.1098/rstb.2004.1597
Qiao Y., Chen Z., Lin Z. (2008). Changes of community structure of fishery species during spring and autumn in beibu gulf. J. Fish. Sci. China. 15 (5), 816–821. doi: 10.3321/j.issn:1005-8737.2008.05.014
Razzaghi M., Mashjoor S., Kamrani E. (2017). Mean trophic level of coastal fisheries landings in the Persian gulf (Hormuzgan province), 2002–2011. Chin. J. Oceanol. Limnol. 35 (3), 528–536. doi: 10.1007/s00343-017-5311-6
Shan X., Jin X., Dai F., Chen Y., Yang T., Yao J. (2016). Population dynamics of fish species in a marine ecosystem: a case study in the bohai Sea, China. Mar. Coast. Fish. 8 (1), 100–117. doi: 10.1080/19425120.2015.1114543
Su L., Chen Z., Zhang K., Xu Y., Xu S., Wang K. (2021). Decadal-scale variation in mean trophic level in beibu gulf based on bottom-trawl survey data. Mar. Coast. Fish. 13 (3), 174–182. doi: 10.1002/mcf2.10144
Sun D., Lin Z. (2004). Variations of major commercial fish stocks and strategies for fishery management in beibu gulf. J. Trop. Oceanogr. 23 (2), 62–68. doi: 10.3969/j.issn.1009-5470.2004.02.008
Sun X., Zhang L., Lu S., Tan X., Chen K., Zhao S., et al. (2020). A new model for evaluating sustainable utilization of coastline integrating economic output and ecological impact: A case study of coastal areas in beibu gulf, China. J. Cleaner Prod. 271, 122423. doi: 10.1016/j.jclepro.2020.122423
Tian Y., Huang H., Zhou G., Zhang Q., Tao J., Zhang Y., et al. (2021). Aboveground mangrove biomass estimation in beibu gulf using machine learning and UAV remote sensing. Sci. Total Environ. 781 (3), 146816. doi: 10.1016/j.scitotenv.2021.146816
Wang X., Qiu Y., Du F., Lin Z., Sun D., Huang S. (2011). Spatio-temporal variability of fish diversity and dominant species in the beibu gulf. J. Fish. Sci. China. 18 (2), 427–436. doi: 10.3724/SP.J.1118.2011.00427
Wang X., Qiu Y., Du F., Lin Z., Sun D., Huang S. (2012a). Population parameters and dynamic pool models of commercial fishes in the beibu gulf, northern south China Sea. Chin. J. Oceanol. Limnol. 30 (1), 105–117. doi: 10.1007/s00343-012-1017-y
Wang X., Qiu Y., Du F., Lin Z., Sun D., Huang S. (2012b). Dynamics of demersal fish species diversity and biomass of dominant species in autumn in the beibu gulf, northwestern south China Sea. Acta Ecol. Sin. 32 (2), 333–342. doi: 10.5846/stxb201011291700
Wang X., Qiu Y., Du F., Sun D., Wang Y. (2020). Using length-based Bayesian biomass method to estimate Parargyrops edita population parameters in the beibu gulf, south China Sea. J. Fish. China. 44 (10), 1654–1662. doi: 10.11964/20191012025
Wang M., Wang X., Sun D., Wang Y., Chen X., Du F., et al. (2021). Assessment of Pennahia macrocephalus stock in beibu gulf by length Bayesian biomass estimation method. South China Fish. Sci. 17 (2), 20–27. doi: 10.12131/20200202
Wang Y., Yuan W. (2008). Changes of demersal trawl fishery resources in northern south China Sea as revealed by demersal trawling. South China Fish. Sci. 4 (2), 26–33. doi: 10.3969/j.issn.2095-0780.2008.02.005
Wang Y., Zhou X., Xie B., Chen J., Huang L. (2022). Climate-induced habitat suitability changes intensify fishing impacts on the life history of large yellow croaker (Larimichthys crocea). Authorea Prepr. 12 (10), e9342. doi: 10.1002/ece3.9342
Wei P., Wang X., Ma S., Zhou Y., Huang Y., Su Y., et al. (2019). Analysis of current status of marine fishing in south China Sea. J. Shanghai Ocean. Univ. 28 (6), 976–982. doi: 10.12024/jsou.20180902393
Wen Y., Xu Y., Li H., Lei F., Xie H., Wu M. (2022). Nutrient and eutrophication in coastal waters of beibu gulf in guangxi. Guangxi Sci. 29 (3), 541–551. doi: 10.13656/j.cnki.gxkx.20220601.001
Wilhm J. L. (1968). Use of biomass units in shannon's formula. Ecology 49 (1), 153–156. doi: 10.2307/1933573
Wu J., Xue Y., Liu X., Ren Y., Wan R. (2017). Long-term trends in the mean trophic level of marine fisheries in the yellow Sea and bohai Sea. Period. Ocean. Univ. China. 47 (11), 53–60. doi: 10.16441/j.cnki.hdxb.20170070
Yang G., He D., Wang C., Miao Y., Yu H. (2000). Study on biological oceanography charateristics of planktonic copepods in waters north of Taiwan II. community characteristics. Acta Oceanol. Sin. 19 (3), 139–152.
Yu J., Tang D., Yao L., Chen P., Jia X., Li C. (2010). Long-term water temperature variations in daya bay, China using satellite and in situ observations. Terr. Atmos. Ocean. Sci. 21 (2), 393–399. doi: 10.3319/TAO.2009.05.26.01(Oc
Zhang K., Cai Y., Liao B., Jiang Y., Sun M., Su L., et al. (2020a). Population dynamics of threadfin porgy evynnis cardinalis, an endangered species on the IUCN red list in the beibu gulf, south China Sea. J. Fish Biol. 97 (2), 479–489. doi: 10.1111/jfb.14398
Zhang K., Guo J., Xu Y., Jiang Y., Chen Z. (2020b). Long-term variations in fish community structure under multiple stressors in a semi-closed marine ecosystem in the south China Sea. Sci. Total Environ. 745, 140892. doi: 10.1016/j.scitotenv.2020.140892
Zhang B., Tang Q., Jin X. (2007). Decadal-scale variations of trophic levels at high trophic levels in the yellow Sea and the bohai Sea ecosystem. J. Mar. Syst. 67 (3), 304–311. doi: 10.1016/j.jmarsys.2006.04.015
Zhu Z., Wei H., Guan Y., Zhang L., Sun P., Zhang Q. (2022). Spatial and seasonal characteristics of dissolved heavy metals in the seawater of beibu gulf, the northern south China Sea. Front. Mar. Sci. 9. doi: 10.3389/fmars.2022.996202
Keywords: fish community, diversity, trophic level, human activities, Beibu Gulf, South China Sea
Citation: Peng S, Wang X, Du F, Sun D, Wang Y, Chen P and Qiu Y (2023) Variations in fish community composition and trophic structure under multiple drivers in the Beibu Gulf. Front. Mar. Sci. 10:1159602. doi: 10.3389/fmars.2023.1159602
Received: 06 February 2023; Accepted: 28 February 2023;
Published: 14 March 2023.
Edited by:
Shiqiu Peng, State Key Laboratory of Tropical Oceanography, Chinese Academy of Sciences (CAS), ChinaReviewed by:
Xiujuan Shan, Yellow Sea Fisheries Research Institute, Chinese Academy of Fishery Sciences (CAFS), ChinaJianguo Du, State Oceanic Administration, China
Copyright © 2023 Peng, Wang, Du, Sun, Wang, Chen and Qiu. This is an open-access article distributed under the terms of the Creative Commons Attribution License (CC BY). The use, distribution or reproduction in other forums is permitted, provided the original author(s) and the copyright owner(s) are credited and that the original publication in this journal is cited, in accordance with accepted academic practice. No use, distribution or reproduction is permitted which does not comply with these terms.
*Correspondence: Xuehui Wang, d3hoc2NzQDE2My5jb20=