 Jiajie Chen
 Ronglin Li
 Shen Xie1,2
 Jian Shi
- 1Frontier Science Center for Deep Ocean Multispheres and Earth System (FDOMES) and Physical Oceanography Laboratory, Ocean University of China, Qingdao, China
- 2College of Oceanic and Atmospheric Sciences, Ocean University of China, Qingdao, China
Warm blobs are persistently warmer-than-normal seawaters over the Northeast Pacific (NEP), which cause substantial impacts on marine ecosystems and climate. Recently, the warm blobs occurred consecutively in spring and summer of 2021 and 2022. The warm blob in 2021 was mostly located east of 155°W, while it shifted to west of 155°W in 2022. Based on a mixed-layer heat budget analysis, we find that atmospheric processes positively and dominantly contributed in May 2021 and July 2022. Specifically, less latent heat loss from the ocean caused by reducing background westerlies and evaporation intensified the 2021 warm blob, while more shortwave radiation heating due to decreased low clouds intensified the one in 2022. However, the positive contribution of the atmospheric processes cannot maintain a season due to their strong internal variability. The seasonal persistence of the warm blobs, instead, is owing to the offset between the atmospheric and oceanic processes. We highlight the importance of atmospheric processes in the evolution of the NEP warm blobs in spring and summer, which lacks sufficient investigation but can provide more potential predictability for the NEP warm blobs.
1 Introduction
Warm blobs are anomalously warm seawater events over the Northeast Pacific (NEP) that can have significant impacts on climate and marine ecosystems (e.g., Bond et al., 2015; Liang et al., 2017; Chen et al., 2021a). During 2013–2016, a long-lasting record warm blob, known as “The Blob,” had dramatic impacts on weather (Hartmann, 2015; Walsh et al., 2017), fishery economies (Jones et al., 2018; Yang et al., 2019), and ocean circulation (Zaba and Rudnick, 2016). Recently, Amaya et al. (2020) reported another warm blob event that featured prominent warmer-than-normal sea surface temperature (SST) in 2019 summer, which was called “blob 2.0.” This warm blob event persisted during 2019–2020 and was characterized by four peaks in its lifetime (Chen et al., 2021b).
In terms of the seasonal evolution of warm blobs, most studies paid more attention to winter season. For example, for the 2013–2016 warm blob event, Di Lorenzo and Mantua (2016) found that the large-scale SST anomaly (SSTA) pattern shifted from a North Pacific Gyre Oscillation–like (NPGO-like; Di Lorenzo et al., 2008) signature in 2014 winter to a Pacific Decadal Oscillation–like (PDO-like; Mantua et al., 1997; Zhang et al., 1997; Zhang et al., 2018) signature in 2015 winter. Then, Hu et al. (2017) illustrated the vertical profile of this warm blob event and confirmed the maximum SSTA in 2014 winter. Importantly, they also identified a significant amplification of this warm blob in 2015 summer. From a statistical perspective based on historical warm blobs, Chen et al. (2021a) classified the NEP warm blobs into double-peak (in winter and summer) and single-peak (in winter) types, with different evolutionary characteristics, especially in summer. Liu et al. (2022) analyzed four summer warm blobs and found that they were induced by different mechanisms. Nevertheless, investigations of warm blob characteristics in summer are still limited. In addition, a peak of SSTA in spring is observed for the 2019–2020 warm blob (Chen et al., 2021b), but the detailed characteristics of such warm blobs in spring have not been well documented. Therefore, the features and mechanisms of NEP warm blobs in spring and summer need more in-depth investigations.
Researchers sought to explore the factors that initiate and maintain the warm blobs. The warm blobs are formed by a combination of oceanic and atmospheric processes. For the 2013–2016 extreme warm blob, an anomalously strong high pressure over the NEP caused easterly anomalies near the Gulf of Alaska and weakened local prevailing westerly winds, which reduced surface evaporation, weakened ocean cold advection, and thus promoted the warm blob development in winter (Bond et al., 2015; Seager et al., 2015; Hu et al., 2017; Liang et al., 2017). Schmeisser et al. (2019) indicated that negative ocean advection and entrainment offset positive surface heat flux anomalies during this event, causing the warm blob to persist for more than 2 years. Recently, Chen et al. (2023) found that turbulent heat flux anomalies during this warm blob event were mainly induced by increased air temperature and specific humidity. During the 2019–2020 warm blob event, surface heat flux anomalies played a major role in the winter peak, while the spring peak was developed by a combined contribution of vertical entrainment and surface heat flux (Chen et al., 2021b). Statistically, the principal factors in the formation and maintenance of the warm blobs resulted from surface heat flux in winter but from the vertical entrainment process in summer (Chen et al., 2021a). However, Amaya et al. (2020) revealed that the “blob 2.0” in 2019 summer was induced by the weakening of the North Pacific high-pressure system, which reduced wind speed and evaporative cooling and finally heated the ocean through a low-cloud positive feedback, emphasizing the contribution of atmospheric processes to NEP warm blobs in summer. Therefore, atmospheric effects on the warm blobs are largely variable in summer (Liu et al., 2022). In addition, the specific role of summer atmospheric circulation and radiation in the warm blobs may be related to the location of the warm blobs.
Motivated by the above, we will investigate the characteristics and physical mechanisms of the NEP warm blobs in spring (i.e., May) and summer of 2021 and 2022 and compare them with previous results (e.g., Amaya et al., 2020; Chen et al., 2021b). Furthermore, we have found that the 2021 and 2022 warm blobs are located in different regions (Figure 1), but the detailed contribution of atmospheric and oceanic processes to them is not clear. Thus, we will illuminate the mechanisms of the 2021 and 2022 warm blobs, emphasizing the role of atmospheric processes in spring and summer. Section 2 briefly describes the datasets and main methods. The characteristics and mechanisms of 2021 and 2022 warm blobs, as well as their differences, are demonstrated in Section 3. Section 4 gives conclusions and discussion.
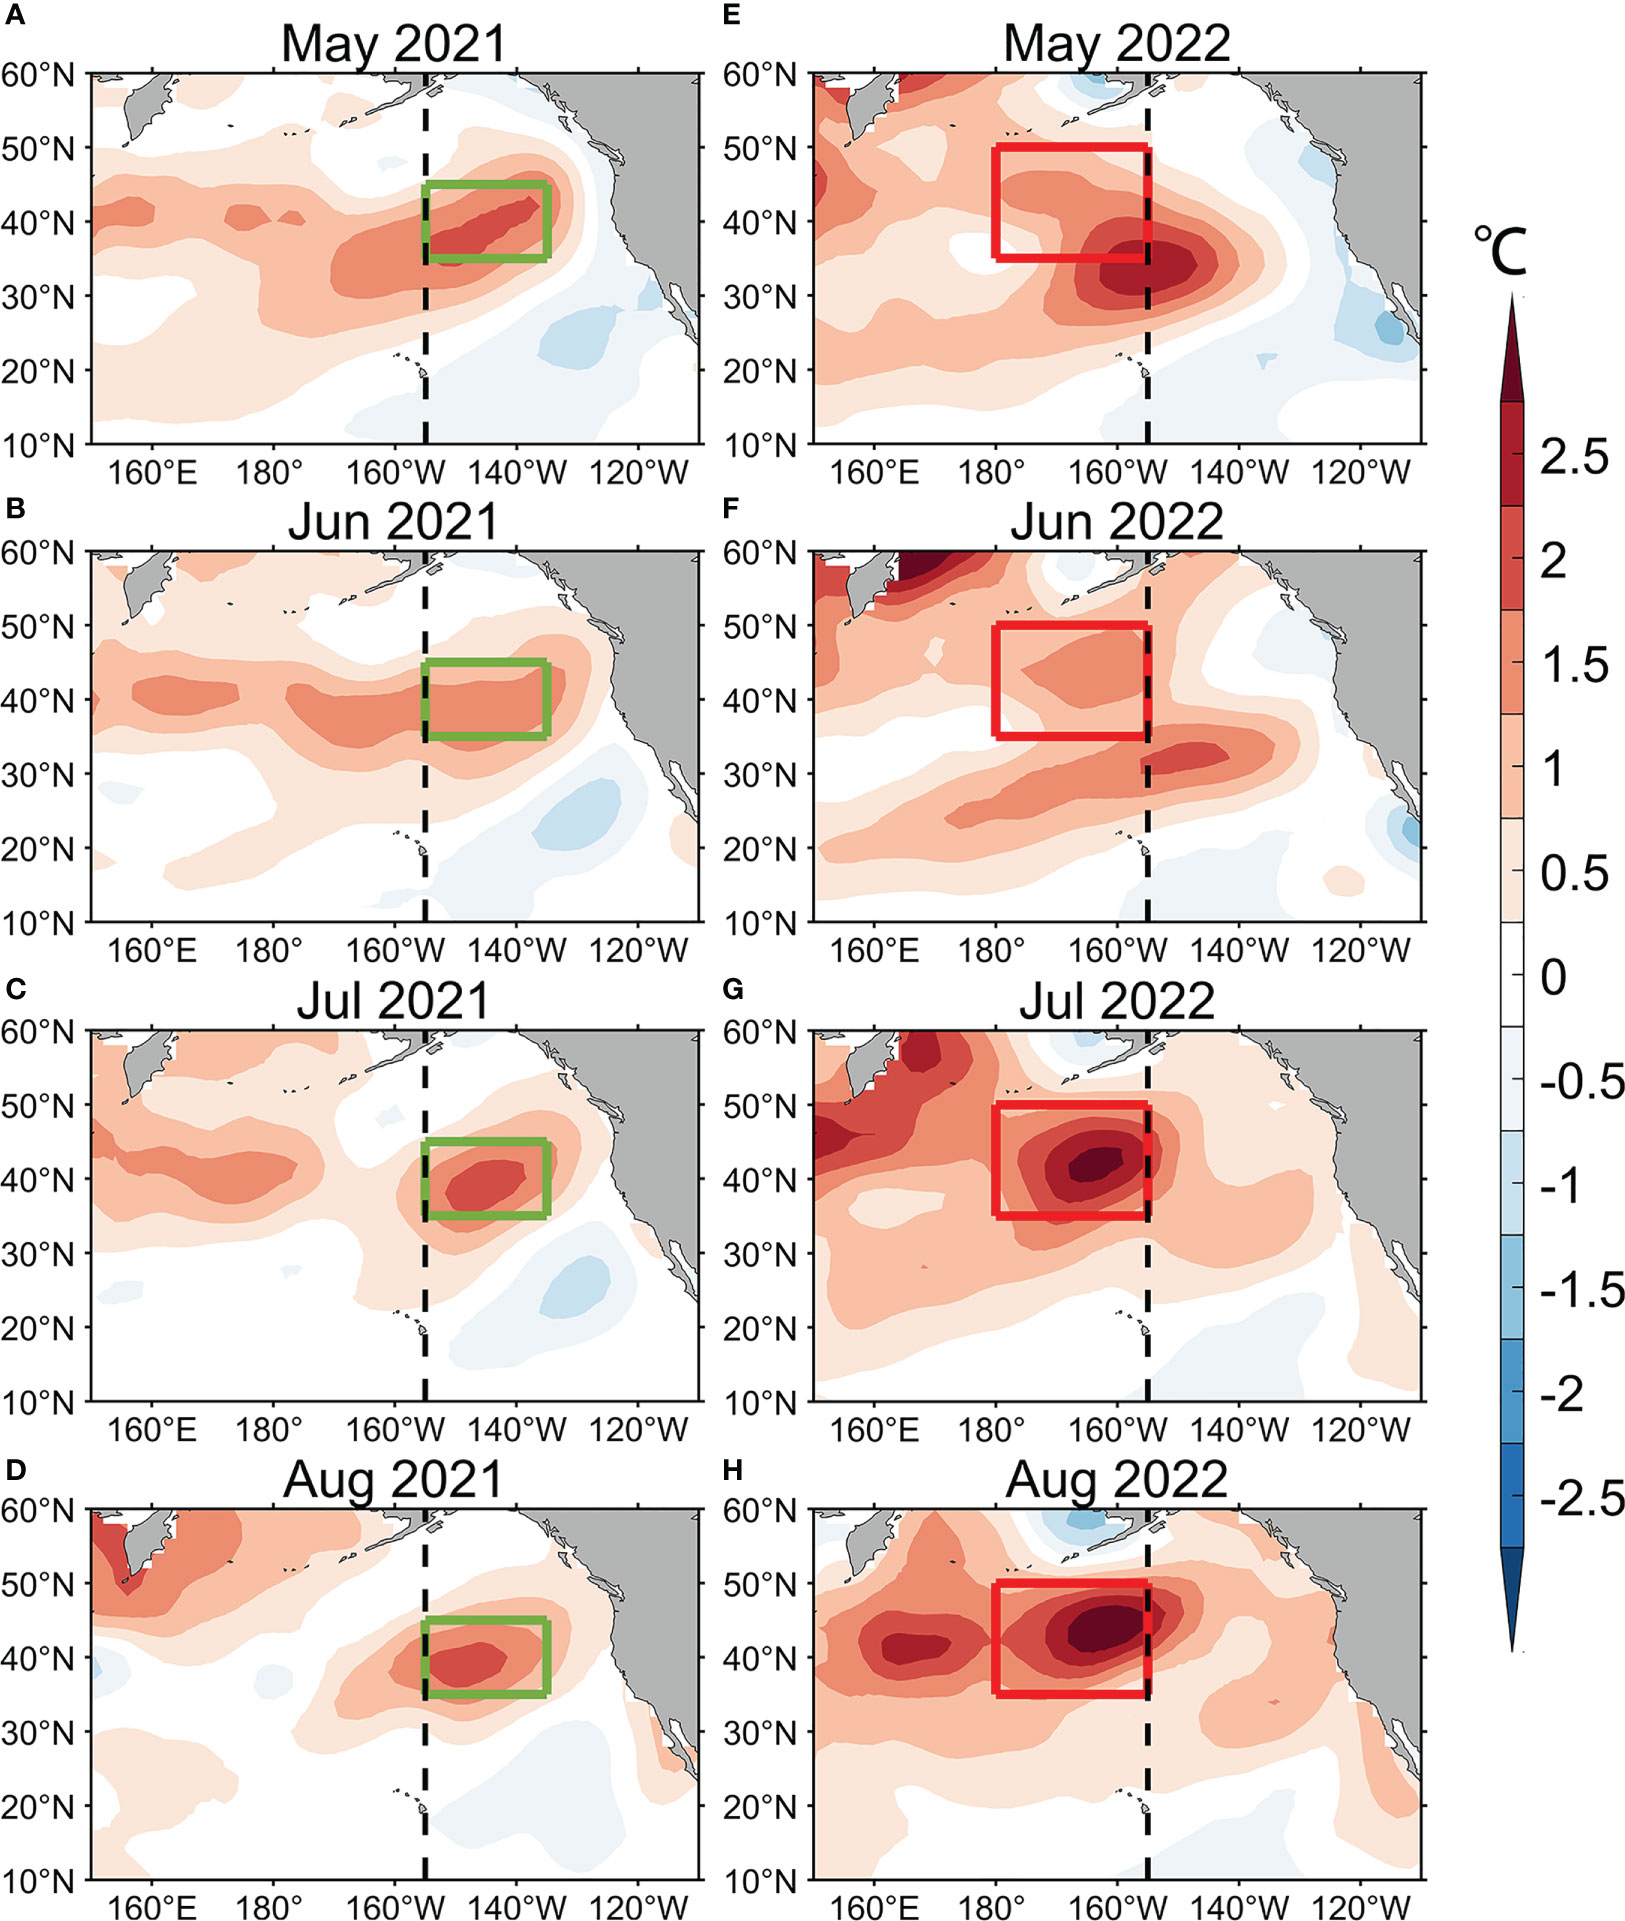
Figure 1 (A–D) The evolution of summer sea surface temperature (SST) anomalies (shading; °C) in (A) May, (B) June, (C) July, and (D) August of 2021. (E–H) Same as (A–D) but for 2022. The green (red) box denotes the 2021 (2022) study area. Vertical dashed line represents the location at 155°W. The green box outlines 135°–155°W, 35°–45°N in 2021, while the red box outlines 155°W–180°, 35°–50°N in 2022.
2 Data and methods
For SST, we employ a monthly dataset from the National Oceanic and Atmospheric Administration (NOAA) Extended Reconstructed SST V5 with 2°×2° horizontal resolution from January 1951 to November 2022 (Huang et al., 2017). The subsurface current velocity, temperature, and mixed-layer depth data are obtained from the National Centers for Environmental Prediction (NCEP) Global Ocean Data Assimilation System (GODAS) (Saha et al., 2006). The GODAS data have a horizontal resolution of 1/3°-latitude×1°-longitude with 40 vertical levels from 5 to 4,478 m.
Monthly atmospheric variables, including surface winds, 2 m specific humidity, net shortwave radiation (SW), net longwave radiation (LW), net sensible heat flux (SH), and net latent heat flux (LH), are derived from the NCEP-National Center for Atmospheric Research (NCEP-NCAR) reanalysis 1 (Kalnay et al., 1996). The flux variables are placed on T62 Gaussian grids, while other variables are on horizontal 2.5°×2.5° grids. We also utilize the Japanese 55-year Reanalysis (JRA-55) (Kobayashi et al., 2015) and the fifth generation of European Centre for Medium-Range Weather Forecasts (ERA5) atmospheric reanalysis (Hersbach et al., 2019) to get the cloud cover and heat flux data for comparison. The JRA-55 ranges from January 1980 to December 2022 with 1°×1° resolution. The ERA5 are on 0.25 × 0.25° resolution over 1959–2022. In this study, we calculate the monthly climatology of 1980–2020 as the mean state and monthly anomaly as the departure from the corresponding climatology.
We use a mixed-layer heat budget analysis to explore the physical mechanisms of 2021–2022 warm blobs (Equation 1):
In Equation 1, T represents the SSTA averaged over the NEP study area, and denotes the rate of change of SSTA with time (i.e., the tendency of SSTA). The terms on the right-hand-side (RHS) of Equation 1 indicate net surface heat flux, horizontal oceanic advection within the mixed layer, vertical entrainment, and diffusion at the bottom of mixed layer, respectively. The is net surface heat flux exchange at the ocean–atmosphere interface, including SW (), LW, SH, and LH. The penetrative SW (is computed based on Equation 2 (Paulson & Simpson, 1977).
The denotes the volumetric heat capacity of sea water with a value of J . The heat fluxes are defined as positive downward. represents horizontal current velocity. is the vertical velocity (temperature) at the bottom of the mixed layer. is the vertical diffusivity constant. Vertical entrainment and diffusion are calculated as residuals, which are obtained by subtracting the first and second terms on the RHS of Equation 1 from the SSTA tendency term (Cronin et al., 2015; Schmeisser et al., 2019).
LH is calculated using the following aerodynamic bulk formula:
where and are surface air density, surface wind speed at sea surface, and specific humidity at 2 m above sea surface, respectively. represents the saturated specific humidity at the SST . is the latent heat of vaporization for water, and is the bulk coefficient for moisture. The LH anomalies () can be written as follows:
The first term on the RHS of Equation (4) represents the contribution of wind speed (wind speed term), the second term denotes the contribution of sea surface–specific humidity, and the third term represents the contribution of 2 m specific humidity (2 m specific humidity term). The fourth term is considered to be small and negligible. Due to the inaccuracy of the sea surface–specific humidity term calculated by saturated specific humidity, the sea surface–specific humidity term is not discussed in this study. Overbars indicate climatological mean and prime indicates anomalies.
3 Results
3.1 Evolution of the Northeast Pacific warm blobs in 2021 and 2022
First, we showed the evolution of the SSTA pattern in 2021 and 2022 (Figures 1, 2). In 2021, positive SSTA in the study area (green box in Figure 1) over the NEP reached more than 1.5°C in May (Figures 1A, 2). Then, the positive SSTA slightly weakened in June (Figure 1B). However, the positive SSTA increased rapidly in July and reached a peak (Figures 1C, 2). The SSTA maintained in August (Figures 1D, 2). In addition, anomalous warming appeared over the western North Pacific (WNP; Figures 1A–D). As for 2022, the central signature of anomalous warming shifted westward (Figures 1E–H). Positive SSTA in the study area (red box in Figure 1) increased rapidly in July (Figures 1G, 2) and peaked in August (Figures 1H, 2), whose central location was westward of 155°W. Moreover, the positive SSTA over the WNP also strengthened. Comparing the 2 years, the intensity of the warm blob in 2022 was stronger than that in 2021. Considering the differences in the intensity and location of warm blobs in the 2 years, we conjecture that there may be differences in their underlying physical mechanisms.
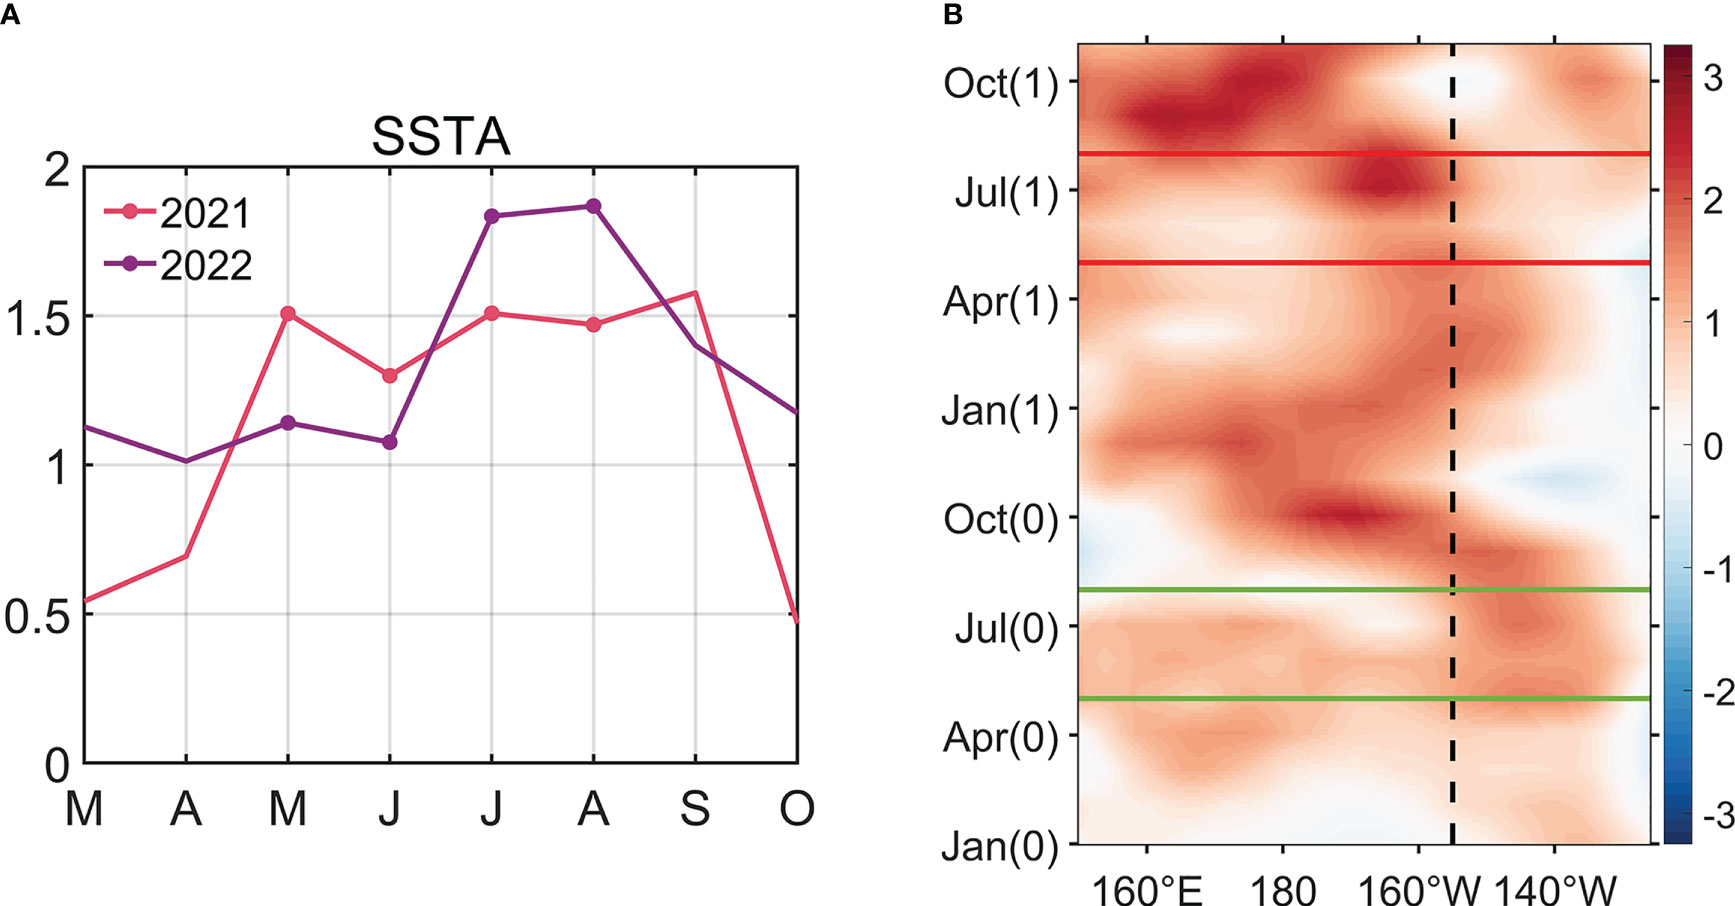
Figure 2 (A) Time series of SST anomaly (SSTA) (shading; °C) in 2021 (pink line) and 2022 (purple line) averaged over 155°W–135°W, 30°N–45°N and 180°–155°W, 30°N–50°N, respectively. (B) The Hovmöller diagram of SSTA for the 2021–2022 warm blob event. Year (0) indicates 2021, and year (1) indicates 2022. The area between green (red) lines represents the SSTA from May to August in 2021 (2022). The reference longitude of 155°W is indicated by the vertical black dashed line.
Then, we dig into the vertical structure of the warm blobs in 2021 and 2022 (Figure 3). In 2021, the warm water masses were widely distributed in the subsurface of the study area. The 1°C isotherm in May was all confined within the mixed layer (Figures 3A, E). The mixed layer depth (MLD) was 20 m shallower than the climatological MLD. In June, the MLD became a bit deeper than climatology (Figures 3B, F). Moreover, the vertical penetration of warm waters became deeper. In July, the warm blob largely intensified with a stronger warm core (Figures 3C, G). A significant portion of the warm anomalies was stored below the mixed layer due to its shoaling. The maximum warm anomalies were mainly distributed near the surface in July (Figures 3C, G) but near the bottom of the mixed layer in August (Figures 3D, H). As for 2022, the intensity of the warming signal was relatively weaker in the study area in May and June (Figures 3I, J, M, N). Similarly as in 2021, the MLD was deeper compared to climatology in June. In July and August, the warm water masses rapidly intensified with vertical location of central warming similar to that in 2021 (Figures 3K, L, O, P). Compared to 2021, the warm blob in 2022 summer showed stronger warm anomaly and deeper vertical propagation. In addition, the MLD was 5 m shallower than that in July. Moreover, the MLD slightly changed during the warm blobs compared to the climatology (Figure 3). Consistently, previous studies found that parts of warm water masses existed below the mixed layer in summer due to the shoaling of the mixed layer (Chen et al., 2021b; Shi et al., 2022).
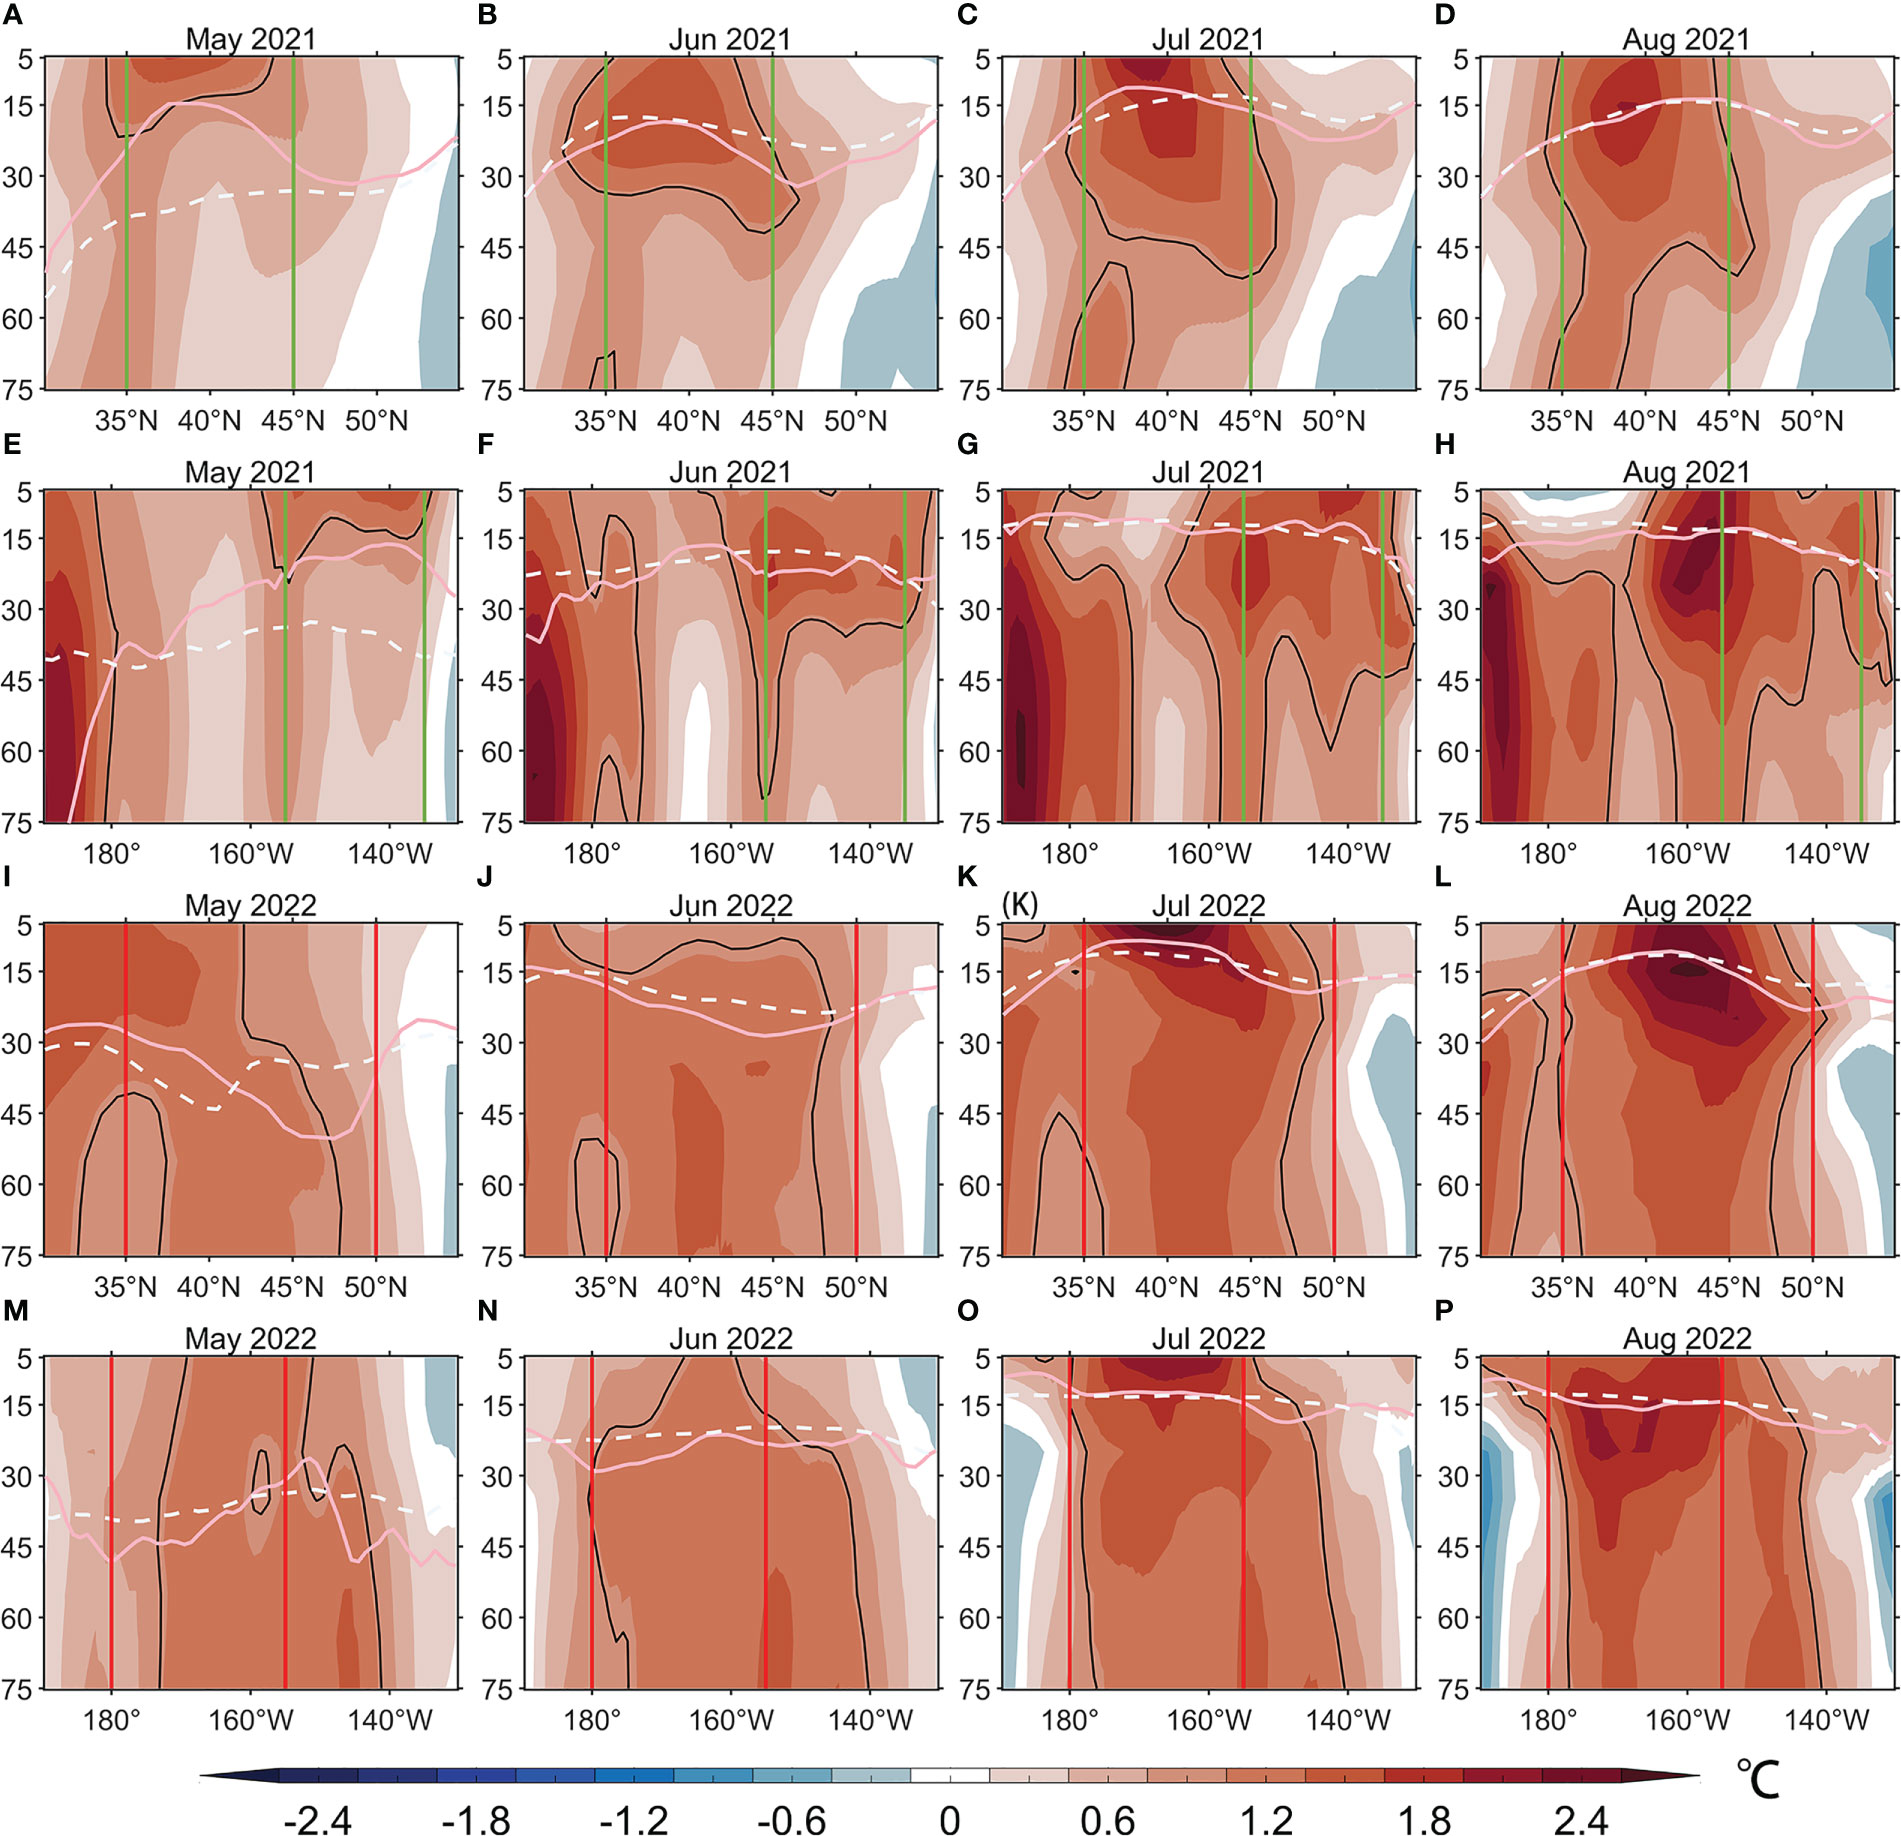
Figure 3 (A–D) Latitude–depth vertical sections of temperature anomalies (shading and contour; °C) averaged over 135–155°W in (A) May, (B) June, (C) July, and (D) August of 2021. (E–H) Same as (A–D) but for longitude–depth vertical sections averaged over 35–45°N. (I–P) Same as (A–H) but for 2022. The pink-solid (white-dashed) lines indicate actual (climatological) mixed layer depth. Vertical green (red) lines outline the green (red) box in Figure 1. Black contours indicate the 1°C isotherm.
3.2 Mechanisms and processes influencing the warm blobs in 2021 and 2022
3.2.1 Warm blob in 2021
Here, we quantify the contribution of oceanic and atmospheric processes to the 2021 warm blob based on a mixed-layer heat budget analysis (Figure 4). In May, the temperature tendency was positive with a large value, suggesting a great intensification of the warm blob (Figures 4A, C, E). All three datasets (NCEP-NCAR, ERA5, and JRA-55) showed that strong positive surface heat flux anomalies played a dominant role in May, while oceanic processes exerted a much weaker effect. In June, the temperature tendency term became negative with a weak magnitude, indicating a slight weakening of the warm blob. Again, negative surface heat flux anomaly contributed dominantly to this intensity variation. However, positive vertical entrainment and diffusion terms attenuated the temperature decrease so that the warm blob was maintained (Figures 4A, C, E). The warm blob peaked in July under the effects of positive vertical entrainment and diffusion processes, when surface heat flux anomalies did not work (Figure 4A) or performed a negative effect (Figures 4C, E). Then, the warm blob slightly decayed in August (Figures 4A, C, E). At this time, the surface heat flux term derived from three datasets did not match each other in part because of their different ways in handling low clouds, downward solar radiation, and surface net latent heat flux (Figures 4B, D, F). Oceanic processes were mostly led by vertical entrainment and diffusion, while horizontal advection had a limited effect on the evolution of the 2021 warm blob (Figures 4A, C, E).
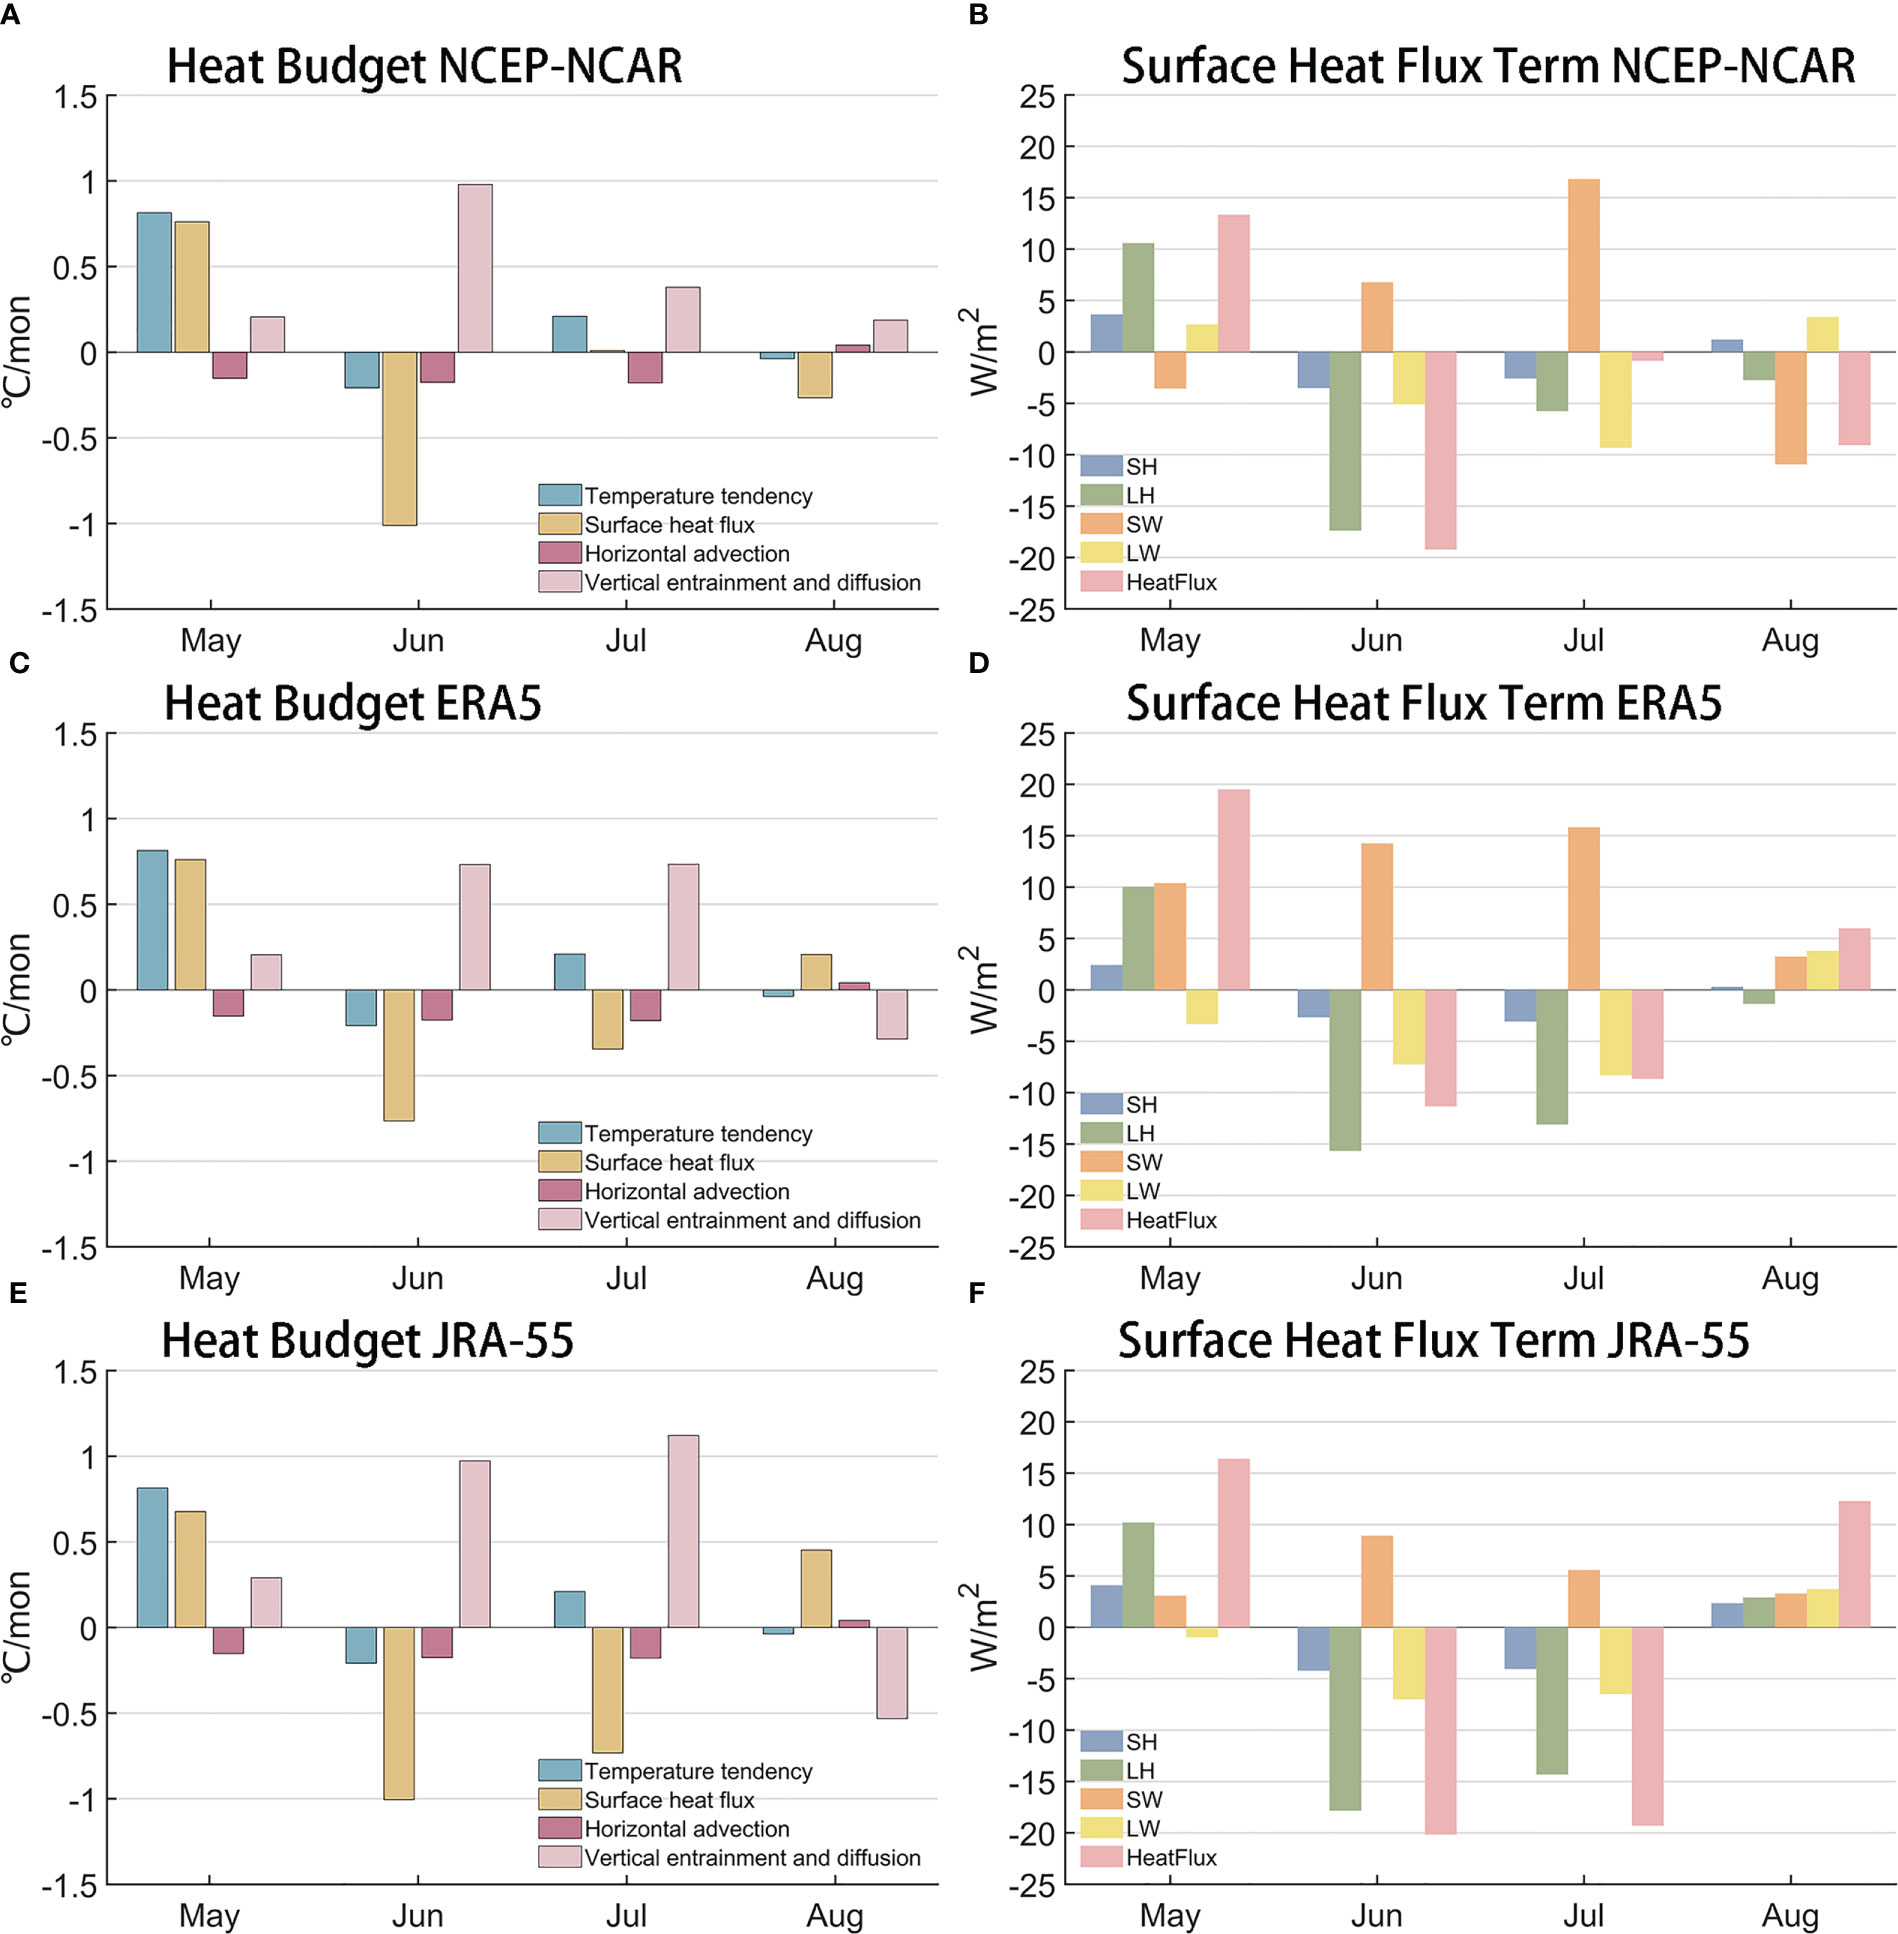
Figure 4 (A) The evolution of the mixed-layer heat budget (°C/mon) of the warm blob in 2021. Temperature tendency (blue), surface heat flux (yellow), horizontal advection (purple), vertical entrainment, and diffusion (pink) are calculated in terms of anomalies relative to their climatology. (B) The surface heat flux term (pink; W/m2) and its components from the National Centers for Environmental Prediction–National Center for Atmospheric Research (NCEP-NCAR), including longwave radiation (yellow), shortwave radiation (orange), latent heat flux (LH; green), and sensible heat flux (blue) of the warm blob in 2021. (C, D) and (E, F) Same as (A, B) but using the fifth generation of European Centre for Medium-Range Weather Forecasts (ERA5) and Japanese 55-year Reanalysis (JRA-55) data, respectively. The calculated area is the green box in Figure 1.
To investigate how surface heat flux and related atmospheric processes affected the warm blob in 2021, we further decomposed the surface heat flux term to quantify the contribution of SW, LW, LH, and SH (Figures 4B, D, F). Based on the three datasets, LH was positive in May. The LH anomaly can be attributed to anomalous easterly winds (Figure 5A), which weakened the prevailing westerly winds in the NEP and reduced wind speed. The slower wind speed led to less evaporation from the sea surface and therefore increased SST, which is also known as the wind–evaporation–SST (WES) feedback (Xie, 1999). Under the ocean–atmosphere interactions, SST increased and the warm blob rapidly intensified (Figure 1A). Furthermore, the cloud cover reduced (Figure 5D) mainly contributed by the loss of low clouds (Figures 6A, D). Less low clouds reduced the reflection of SW, and thus, sea surface received more SW, favoring the enhancement of the warm blob. However, the NCEP-NCAR reanalysis had negative SW anomalies in May (Figure 4B), which may be attributed to different procedures in calculating low clouds among reanalysis datasets. As for June, surface heat flux anomalies played a negative role in the development of the warm blob (Figures 4A, C, E). The surface heat flux decomposition showed that negative LH anomalies played a major role in it (Figures 4B, D, F). The anomalous westerlies and southerlies enhanced climatological winds (now shown) and increased wind speed, thus increasing sea surface evaporation (Figure 5B). This led to more heat transfer from the ocean to the atmosphere and suppressed the increase of SST. Nevertheless, the reduction of low clouds reduced the reflection of downward SW as it passed through the clouds, and the sea surface obtained more heat from SW (Figures 5B, 6B, E). In addition, the reduction of clouds resulted in more loss of net LW (Figures 6B, E), and thus, sea surface gained less heat from LW. In July, there was a sustained reduction in the low cloud cover, leading to a significant increase in SW anomaly (Figures 5F, 6C, F). However, the contribution of atmospheric processes to the warm blob was negative because SW was offset by other heat flux components. We found that LH had a detrimental impact on the warm blob, despite the decrease in wind speed (Figure 5C). Moreover, the LH decomposition results indicated that the wind speed factor positively contributed to the warm blob’s development (Figure 7). The rise in SST increased the sea surface humidity more prominently, leading to an increase in LH transfer from the ocean surface to the atmosphere. Due to the inconsistency of reanalysis datasets in August (Figure 4), we did not probe into the detailed processes in this study.
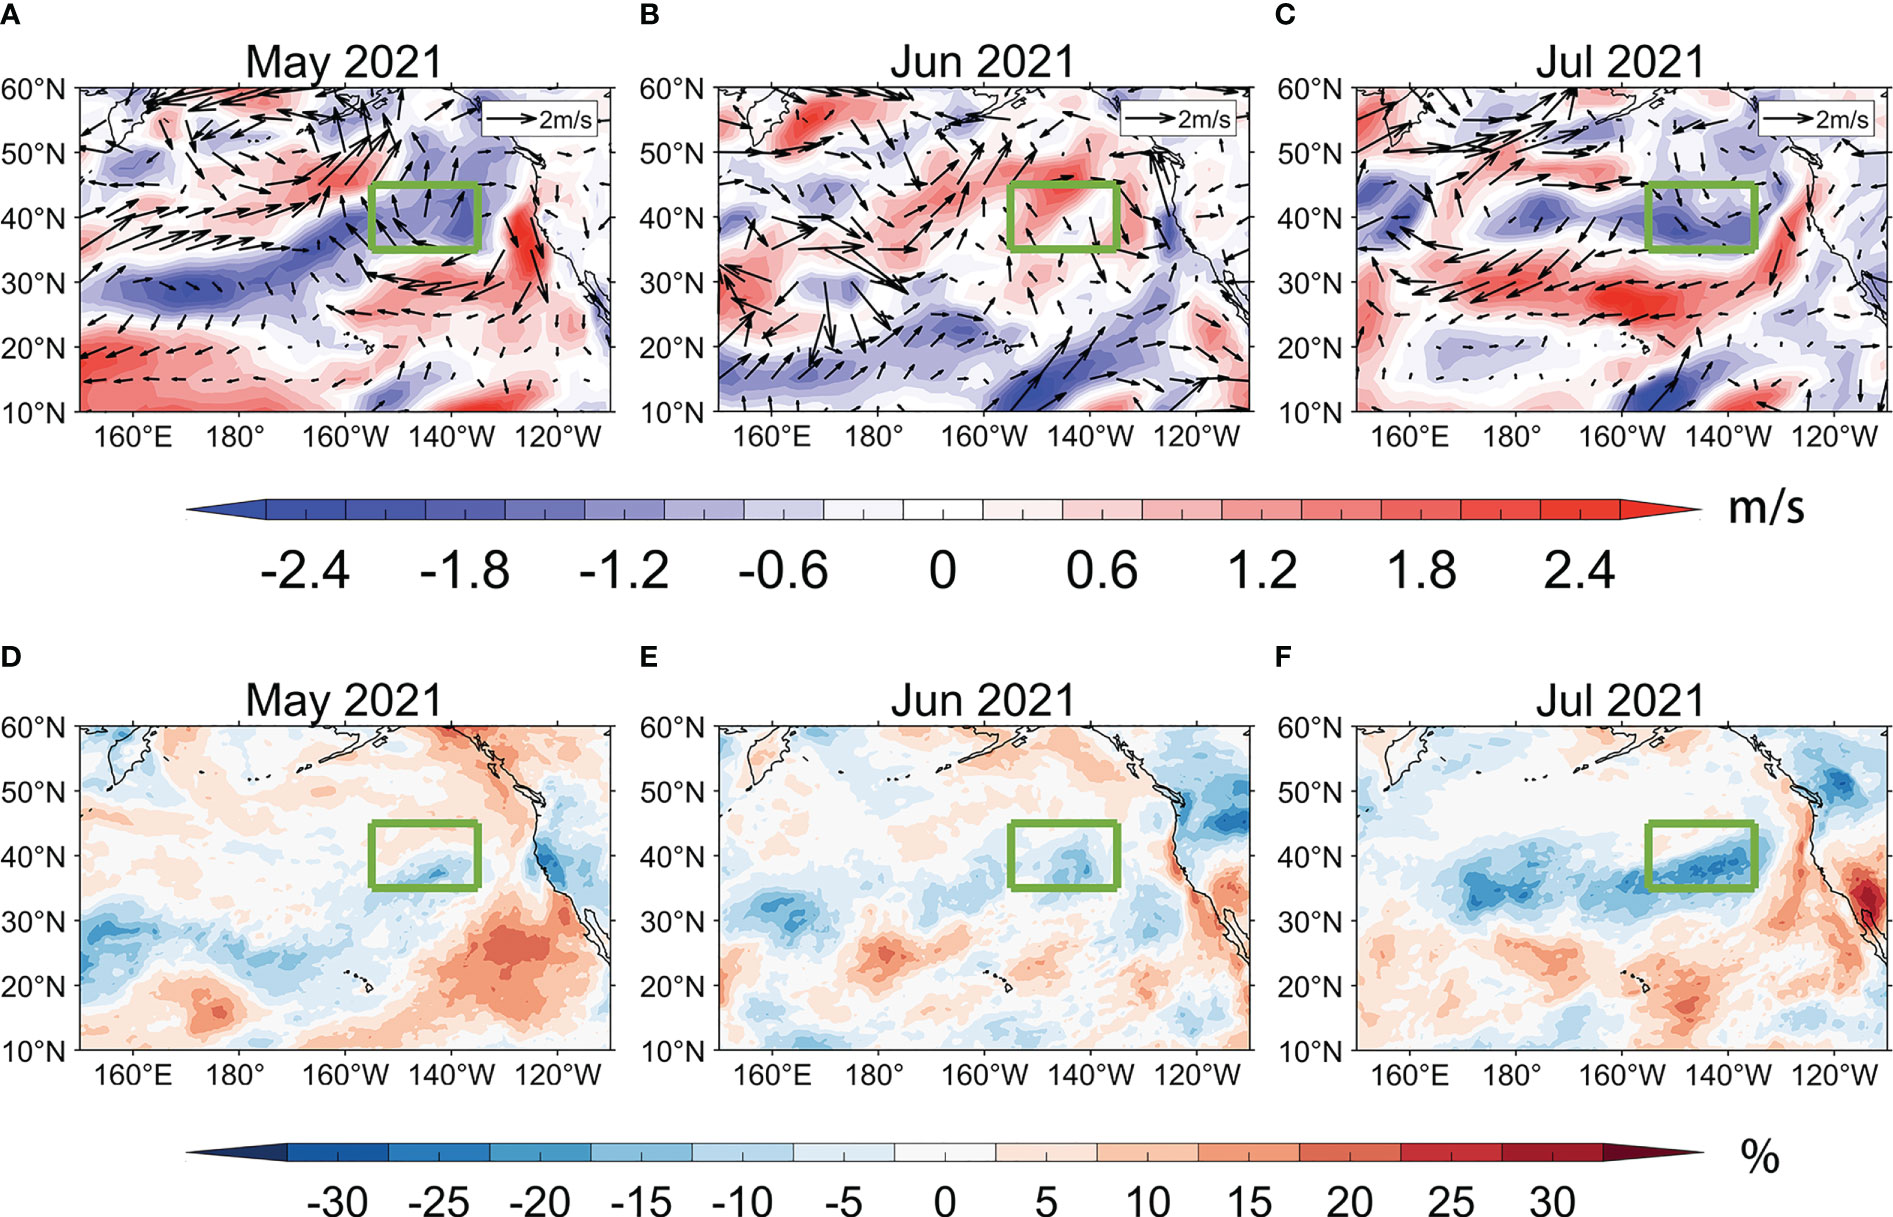
Figure 5 (A–C) Surface wind anomalies (vector; m/s) and surface wind speed anomalies (shading; m/s) in (A) May, (B) June, and (C) July of 2021 using NCEP-NCAR data. (D–F) Same as (A–C) but for total cloud cover anomalies (shading; %) using the ERA5 dataset. The green boxes denote the study area.
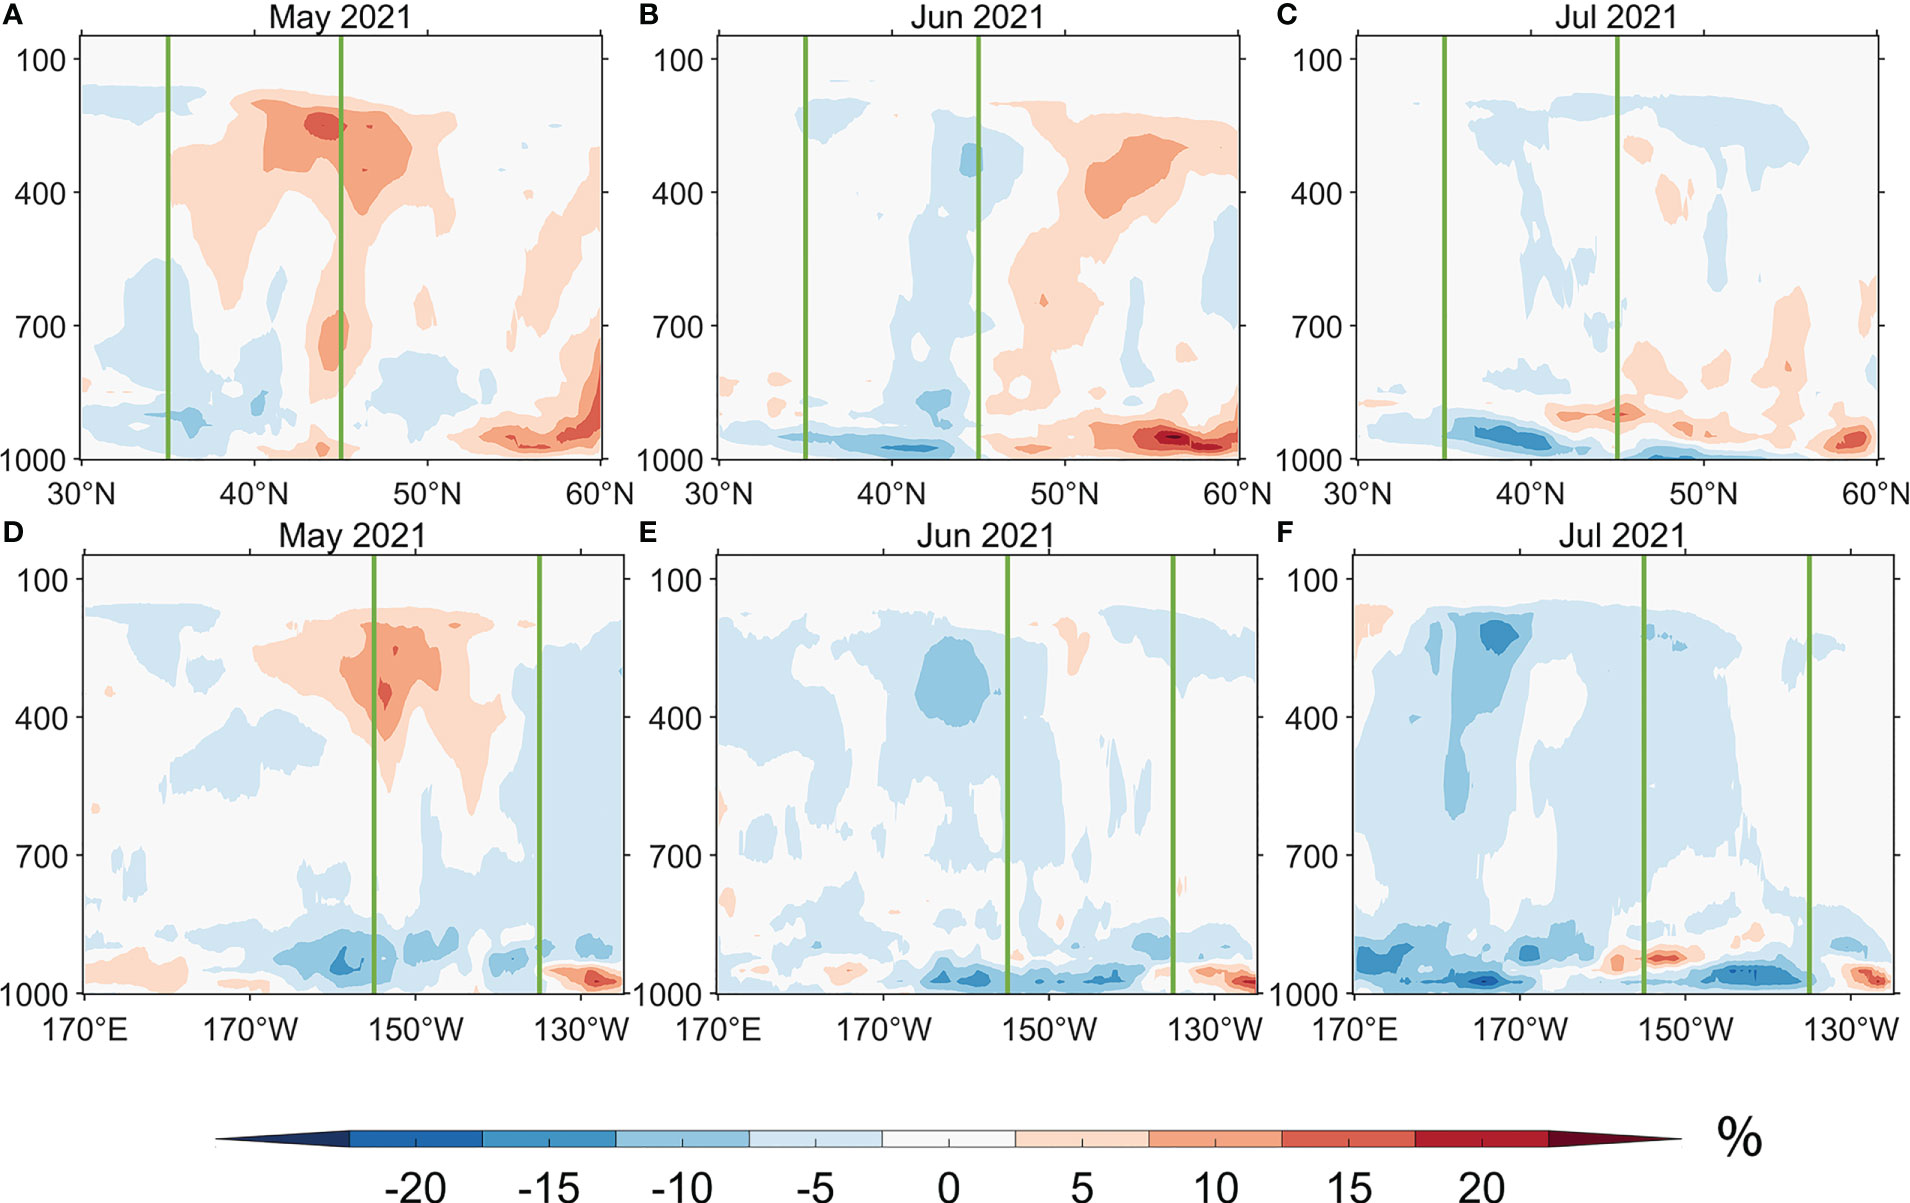
Figure 6 (A–D) Latitude–pressure vertical sections of cloud cover anomalies (shading; %) using the ERA5 dataset averaged over 135–165°W in (A) May, (B) June, and (C) July of 2021. (E, F) Same as (A–C) but for longitude–pressure vertical sections averaged over 35–45°N. The vertical green lines outline the green box in Figure 1.
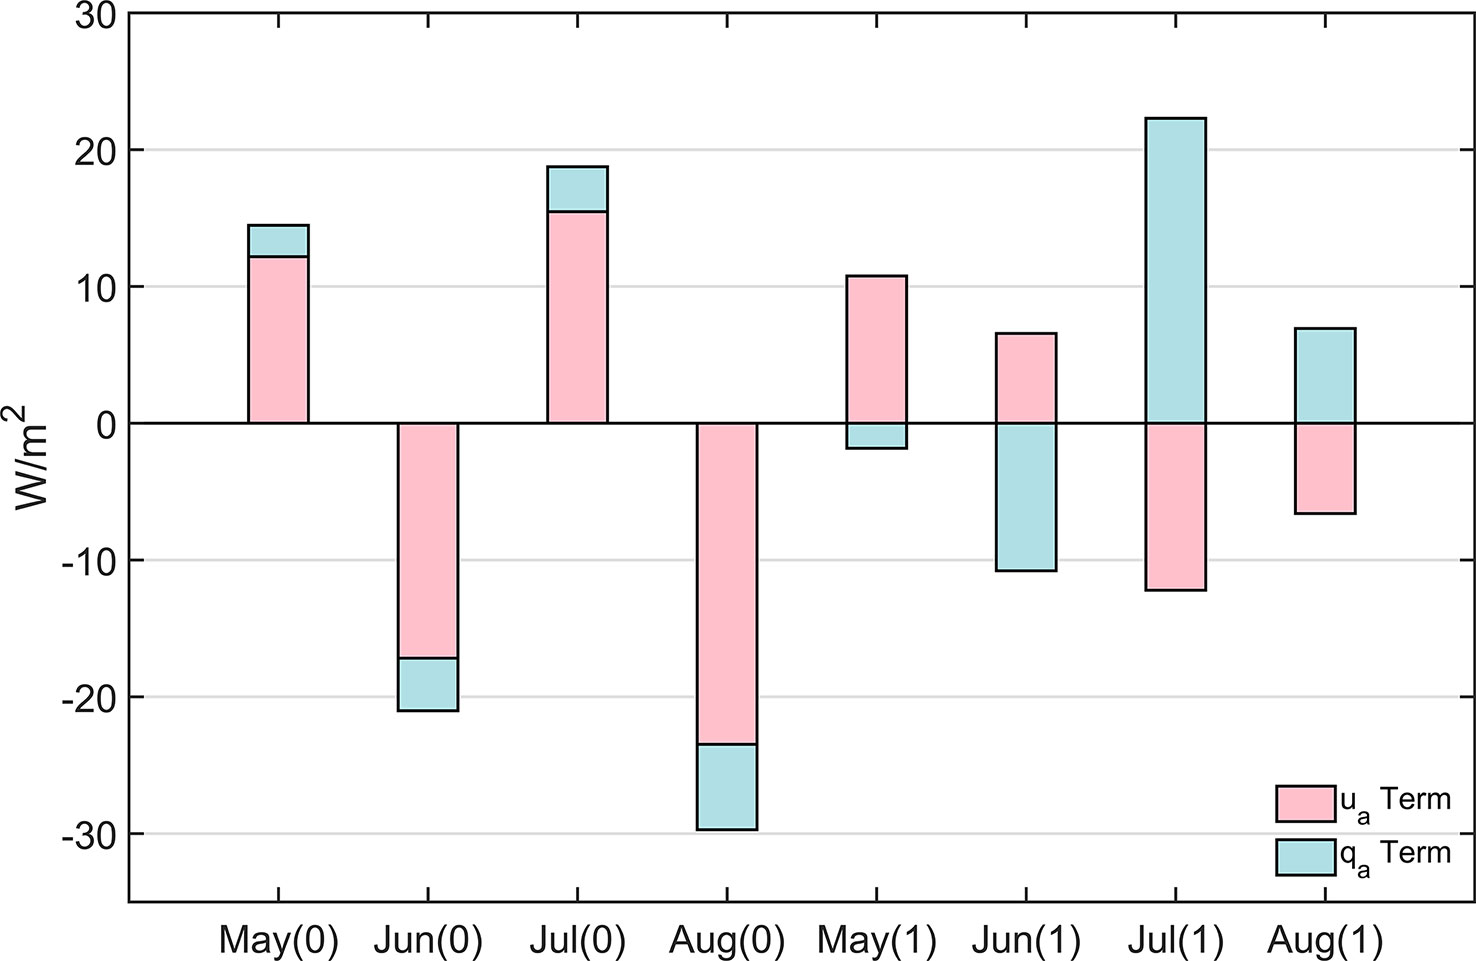
Figure 7 The wind speed term (term; pink bar) and 2 m specific humidity term (term; blue bar) of decomposed LH during the 2021–2022 warm blob event. Numbers 0 and 1 indicate year 2021 and 2022, respectively.
To summarize, the warm blob from May to August in 2021 exhibited an intensification–weakening–reinforcement evolution. Atmospheric processes, such as circulation and cloud cover variability, played an important role in this evolution. Specifically, LH and SW anomalies induced by atmospheric processes intensified the warm blob in May but did not favor its development in June and July. Oceanic processes were mainly driven by vertical entrainment and diffusion, favoring warm blob development mainly in June and July. Ocean horizontal advection was not important in 2021. Our results were consistent with Chen et al. (2021a) and emphasized the importance of atmospheric processes in the warm blobs. Similar to the 2013–2016 warm blob event, the competition between atmospheric and oceanic processes maintained the warm blob during the 2021 warm blob (Schmeisser et al., 2019).
3.2.2 Warm blob in 2022
In this subsection, we first showed the results of a mixed-layer heat budget for the warm blob in 2022 (Figure 8). In May, the warm blob did not develop significantly (Figures 8A, C, E). In June, atmospheric processes negatively contributed to the warm blob, while oceanic processes did oppositely. Therefore, the two terms were balanced with small tendency in SSTA (Figures 1F, 8A, C, E). In July, positive SSTA drastically increased (Figure 1G), indicating that the warm blob was developing. The surface heat flux anomaly acted as the leading contribution at this time. Note that the horizontal advection played a negative role in July, whose magnitude was larger than the 2021 warm blob. Then, the warm blob peaked in August, although the positive tendency of SSTA was small. The contribution of positive vertical entrainment and diffusion terms was relatively larger, while the surface heat flux anomaly was not conducive to the development of the warm blob (Figures 8A, C, E).
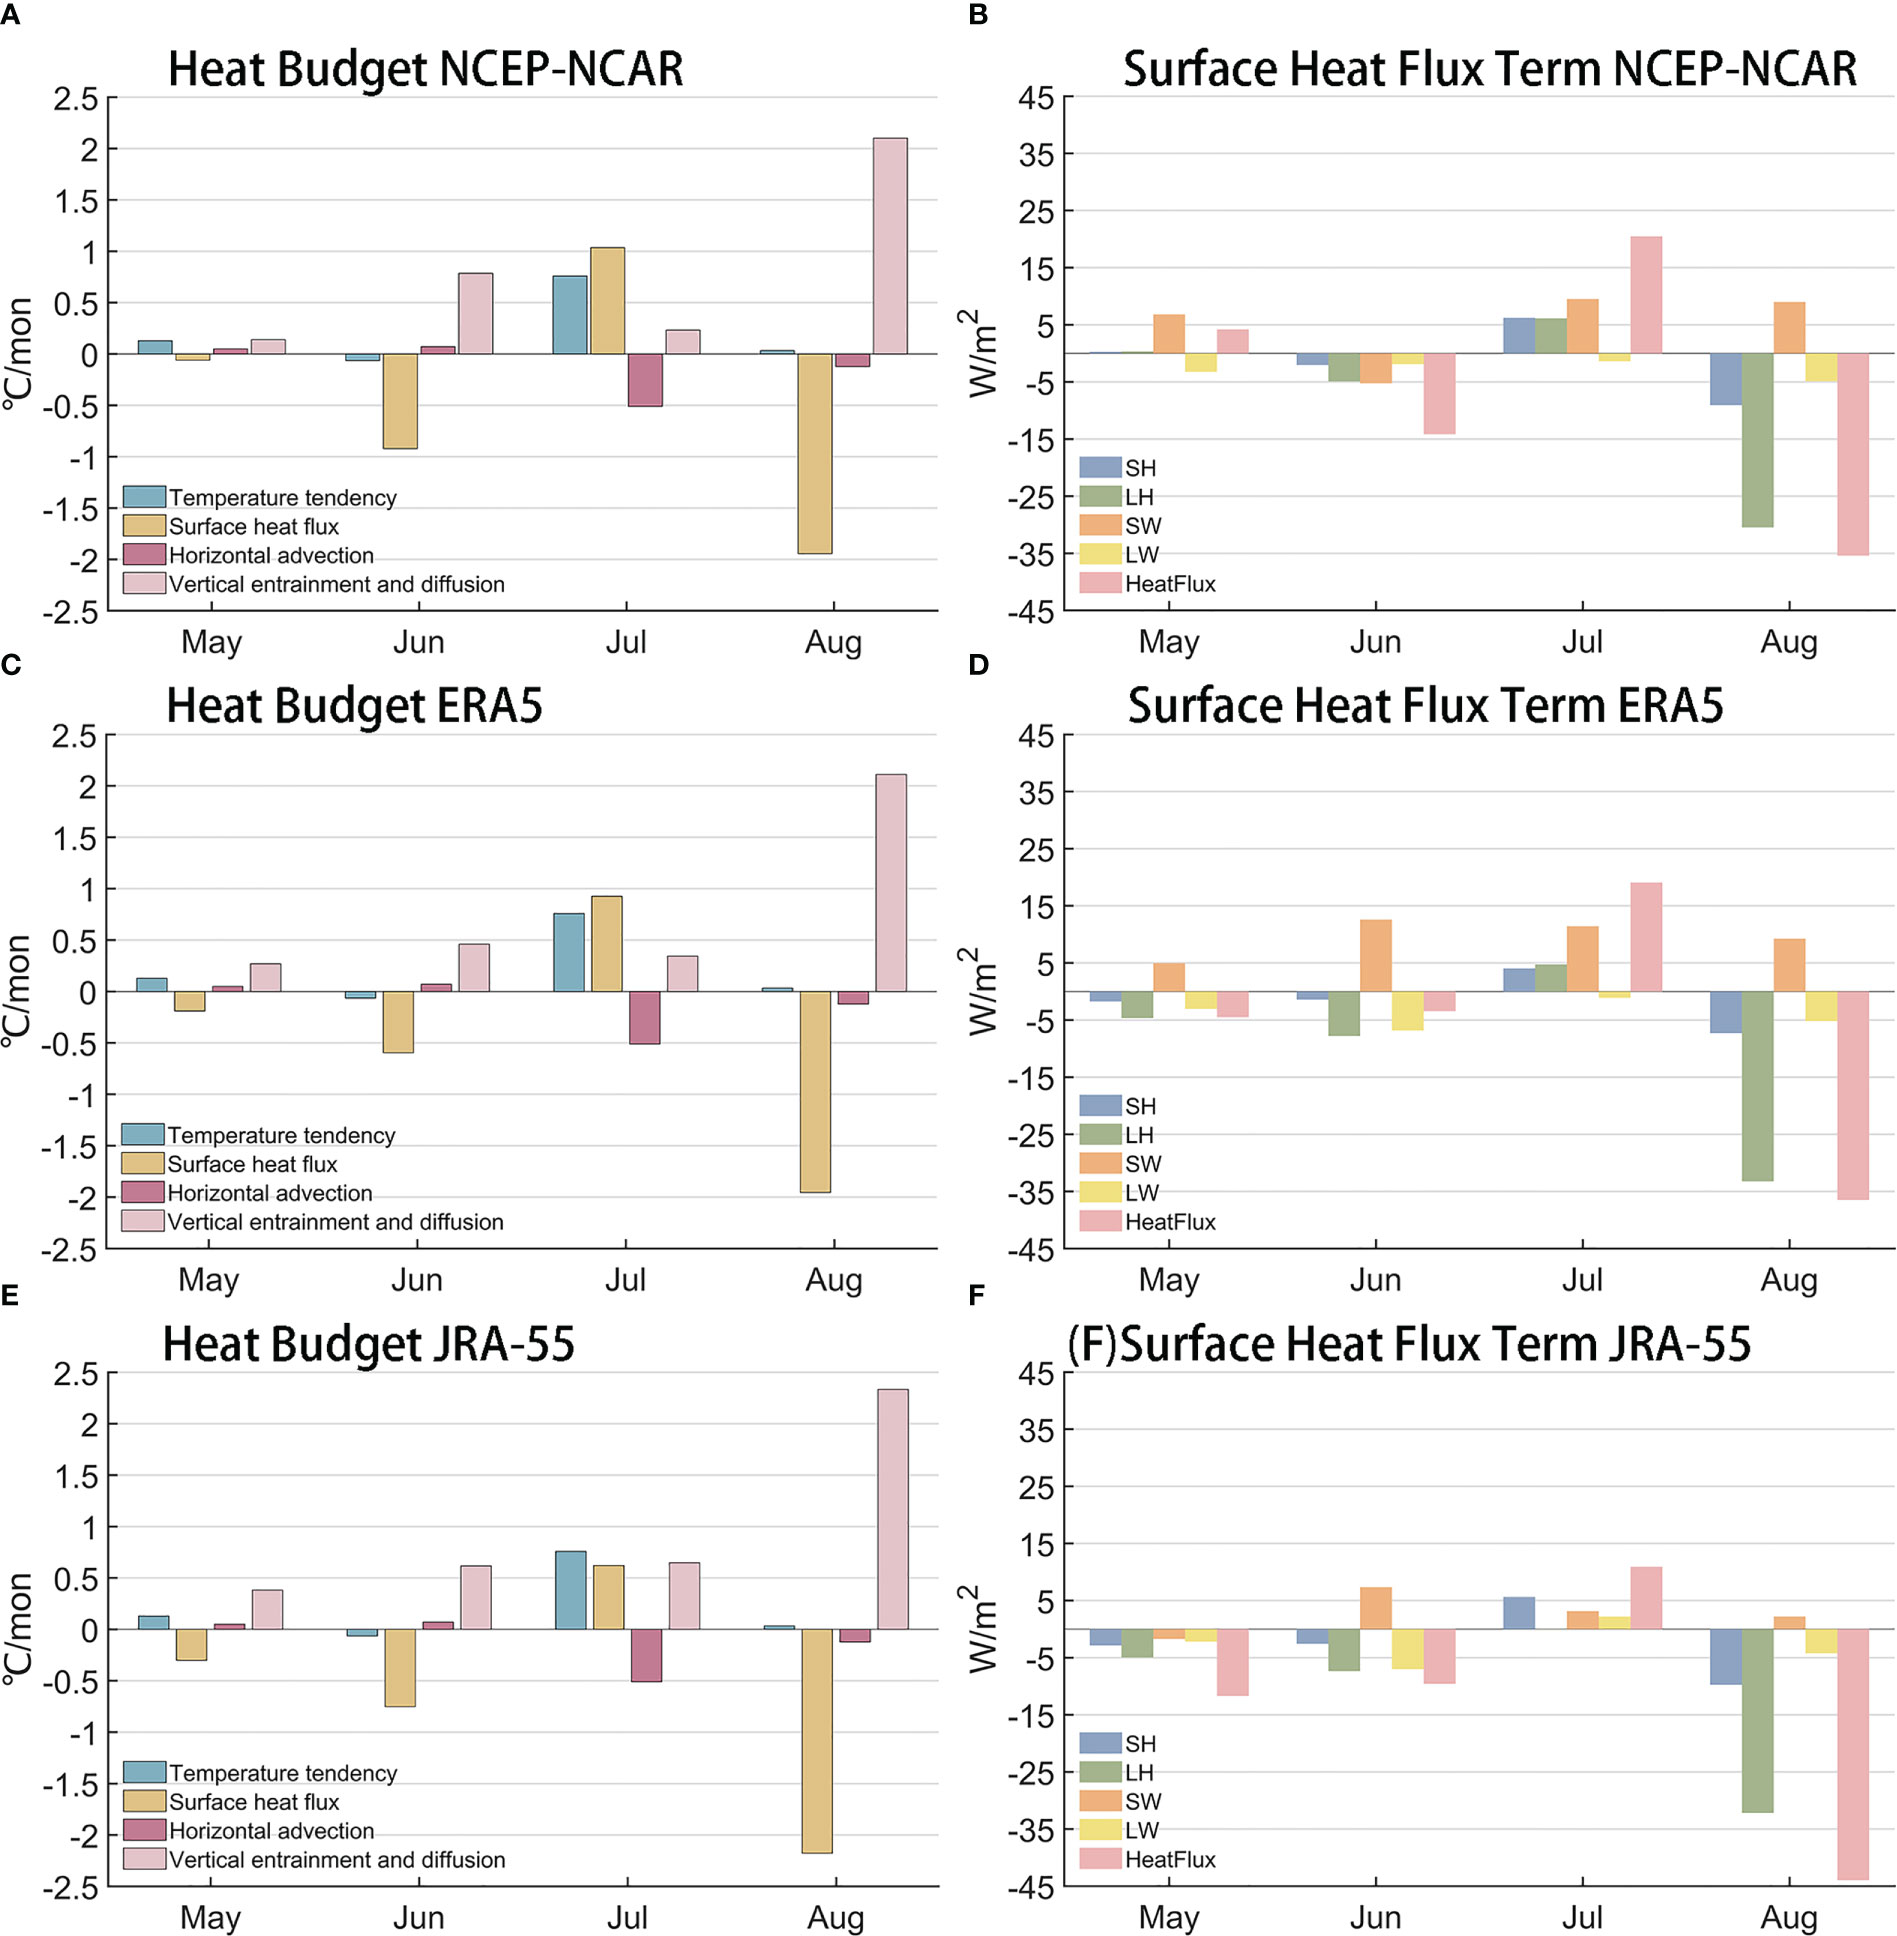
Figure 8 Same as Figure 4 but for the warm blob in 2022. The calculated area is the red box in Figure 1.
Similar to the analysis of the 2021 warm blob, we further decomposed the surface heat flux term (Figures 8B, D, F). In June, although all three datasets revealed a negative influence of surface heat flux anomalies, the NCEP-NCAR reanalysis decomposition result (Figure 8B) did not match those of the ERA5 (Figure 8D) and JRA-55 (Figure 8F) reanalysis, mainly manifested in the different signs of SW. As suggested above, the three datasets may not give consistent heat flux results in summer due to the differences in handling low clouds and thus SW. On the other hand, negative LH anomalies were detected in June (Figures 8B, D, F). We found that there were anomalous northeasterly winds weakening the prevailing southwesterly winds in the study area (red box in Figure 9) at this time (Figure 9D), thus weakening the wind speed, which was favorable for positive LH anomalies. However, the 2 m specific humidity was reduced, especially in the northwestern part of the study area (Figure 9G), providing favorable condition for more evaporation from the sea surface. Therefore, more LH was transmitted from the ocean to the atmosphere, inhibiting the rise of SST (Figures 8B, D, F). In July, SSTA increased rapidly as a result of the decrease in low clouds and more SW reaching the sea surface (Figure 9B). We found that the anomalous southerly winds enhanced the background southerly winds. The faster wind speeds favored the evaporation from the sea surface, which was not conducive to the development of warm blobs (Figure 9E). However, the decomposition of the surface heat flux term showed that LH contributed to the growth of positive SSTA (Figures 8B, D, F). In contrast to June, although wind speed increased to some extent compared to the climatology (Figure 9E), the increased 2 m specific humidity inhibited evaporation from the sea surface in July (Figure 9H). The contribution of the humidity contrast between the ocean and the atmosphere was greater (Figure 7), resulting in weaker evaporation and thus favoring the development of warm blobs. In August, the SW anomaly was positive due to decreased low cloud cover (Figure 9C) as those in June (Figure 9A) and July (Figure 9B), which was conducive to the anomalous warming of SST. However, the LH anomaly was negative with a much larger magnitude, which was the major part of the surface heat flux term. Note that the actual northeasterly winds in the study area were contrary to the background southwesterly winds with nearly the same magnitude (not shown); thus, the wind speed did not vary significantly (Figure 9F). The 2 m specific humidity anomaly also increased, but its magnitude was weaker (Figure 9I) compared to that in July (Figure 9H). The LH decomposition results showed that the wind speed term and the 2 m specific humidity term offset each other (Figure 7). In this regard, we suggest that the positive SSTA of nearly 3°C decreased the relative humidity at 2 m by elevating the saturated specific humidity, thus facilitating evaporation and heat loss from the sea surface as a negative feedback mechanism to regulate SST, which may in part explain the strong magnitude of negative LH anomaly in August (Figures 8B, D, F).
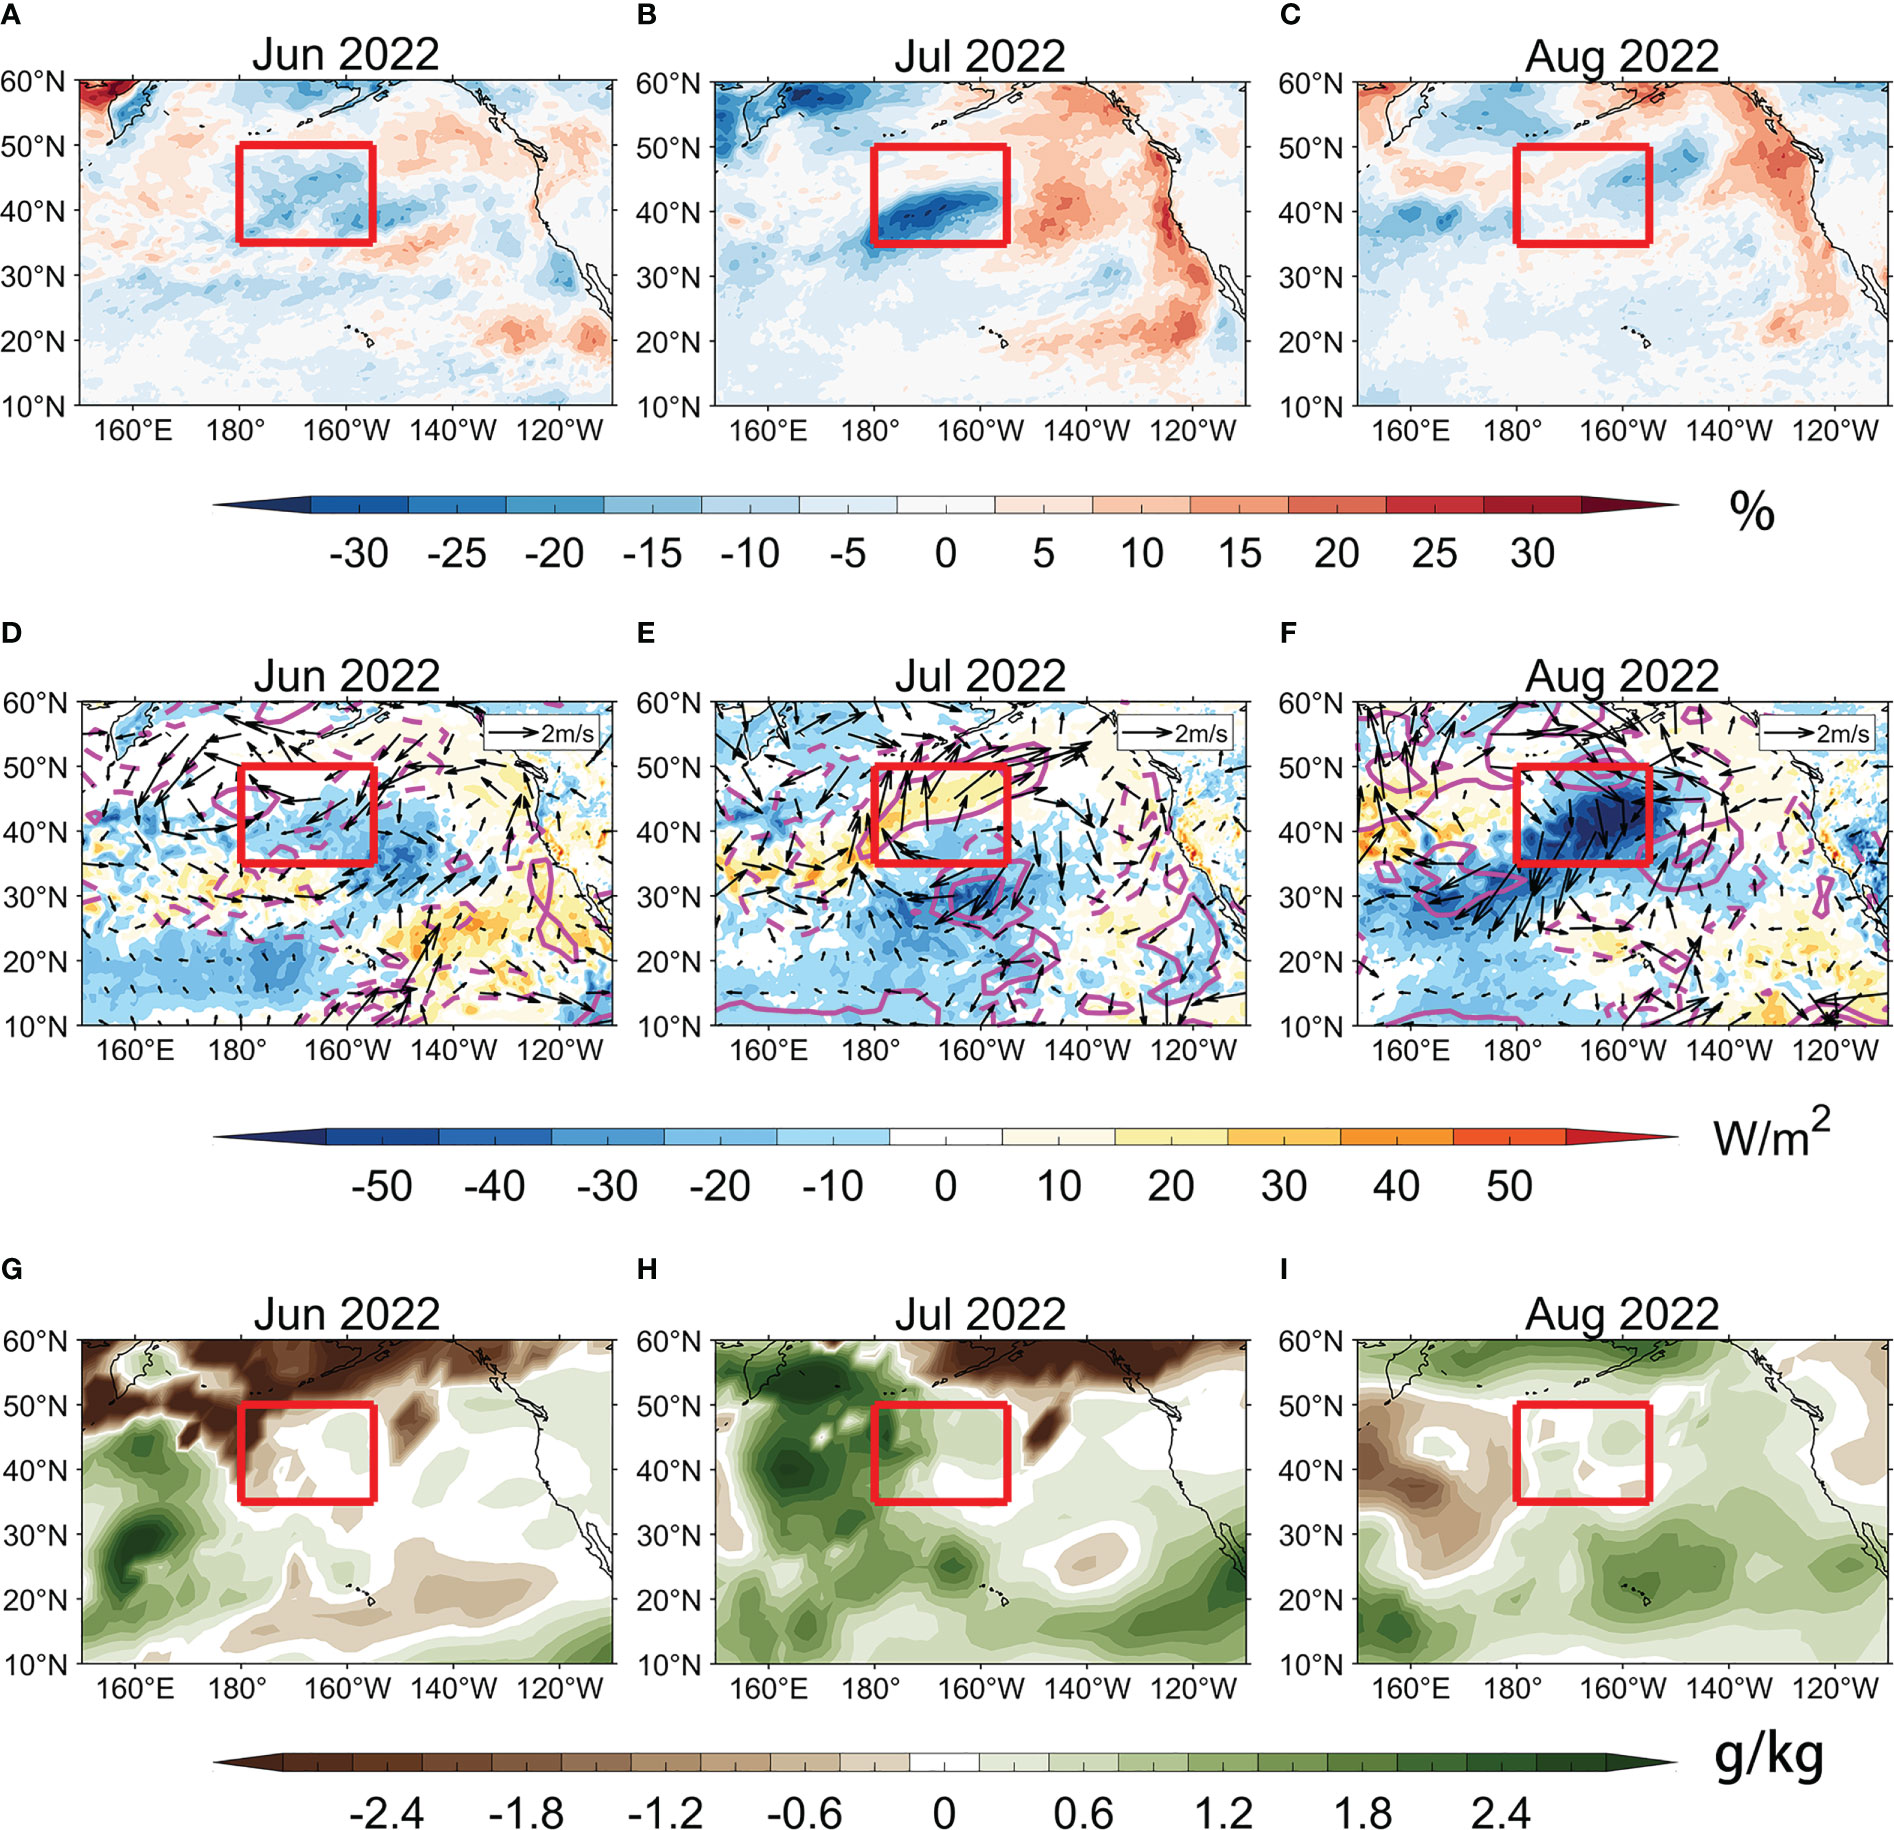
Figure 9 (A–C) Low cloud cover anomalies (shading; %) using the ERA5 dataset in (A) June, (B) July, and (C) August of 2022. (D–F) Same as (A–C), but for net LH (shading; W/m2; downward positive), surface wind anomalies (vector; m/s), and wind speed anomalies (magenta contours; 1 m/s interval; solid for positive and dashed for negative). (G–I) Same as (A–C) but for 2 m specific humidity anomalies (shading; g/kg) using the NCEP-NCAR dataset. The red boxes denote the study area.
In brief, the warm blob in 2022 rapidly intensified in July and peaked in August. Atmospheric processes were largely variable, favoring the warm blob development in July but inhibiting it in August. In the study area, we emphasized that the LH component exhibited the largest variability affected by both atmospheric dynamic and thermodynamic processes. The SW anomaly was positive during the warm blob evolution, which was mainly caused by the decrease of low clouds. As for oceanic processes, vertical entrainment and diffusion played an essential role in intensifying the warm blob. The effect of ocean horizontal advection was generally limited but relatively strong in July, which was somewhat different from that in 2021 and previous studies (e.g., Chen et al., 2021a; Chen et al., 2021b).
3.3 Comparison of mechanisms of the warm blobs in 2021 and 2022
The above results showed that the intensification and maintenance mechanisms of warm blobs in spring (i.e., May) and summer in the NEP were different in part because the central signature of the 2021 and 2022 warm blobs were located in different regions. The two study regions had different background atmospheric circulations.
The warm blobs experienced both intensification and damping evolution in 2021 and 2022. The warm blobs largely strengthened when the surface heat flux term and oceanic vertical terms worked positively together (Figures 4, 8). However, the atmospheric and oceanic terms worked against each other in most times. Atmospheric processes contributed positively and dominantly in May 2021 and in July 2022. By decomposing surface heat flux term, we found that the relative importance of specific atmospheric processes was different. For the 2021 warm blob, anomalous easterly winds in May weakened the background westerly winds, thus increasing SST and intensifying the warm blob by modifying LH. As for the 2022 warm blob, increased SW heated the sea surface due to the decrease of low cloud cover in July. Moreover, the LH anomaly in 2022 summer was strongly modulated by atmospheric humidity condition compared to that in 2021 summer (Figure 7). In addition, the effect of oceanic horizontal advection was relatively stronger in July 2022 for the warm blob compared to 2021. Note that due to the relatively quicker variation of atmospheric conditions, the contribution of the atmosphere can be greatly variable in both magnitude and sign (Figures 4, 8).
4 Conclusions and discussion
Recently, the warm blobs occurred consecutively in spring and summer of 2021 and 2022 over the NEP. Apart from the significant warming over the NEP, the centers of warm blobs were located in different regions. The warm blob in 2021 was situated mostly east of 155°W, while it shifted to west of 155°W in 2022. Vertically, warmer-than-normal waters were mostly stored within the mixed layer in 2021 May but a substantial part of them were below the mixed layer in May 2022. In summer, due to the shoaling of the mixed layer or the vertical penetration of warm waters, more signals of warm blobs can be stored beneath the mixed layer. Nevertheless, the surface warming was prominent in July of both 2021 and 2022.
Based on a mixed-layer heat budget, we found that atmospheric processes were crucial for warm blobs in both 2021 and 2022. In terms of positive contribution, positive LH anomaly due to the weakening of background winds and evaporation was the primary factor in May 2021, while increased SW due to fewer low clouds combined with positive SH and LH worked together to intensify the warm blob in July 2022. On the other hand, circulation-related processes can also play a negative role in hindering the development/maintenance of warm blobs. For example, the intensified westerlies over the study region reinforced evaporation and ocean heat loss through LH in June of 2021. In 2022 summer, the LH was also the leading factor for negative contribution, but atmospheric thermodynamic condition (i.e., humidity) exerted a more important effect compared to that of wind speed. We emphasize that atmospheric processes play a pivotal role in the evolution of the warm blobs in spring and summer, which provides more potential predictability for the warm blobs.
Moreover, oceanic processes are critical and cannot be ignored when analyzing the mechanisms of warm blobs. However, vertical entrainment and diffusion are currently considered as residuals in the calculation, which may introduce some errors and uncertainty. Further studies on the quantitative contribution of oceanic processes to warm blobs should be followed up using finer observations and high-resolution modeling.
Data availability statement
The ERSST dataset is available at https://psl.noaa.gov/data/gridded/data.noaa.ersst.v5.html. The NCEP-NCAR monthly reanalysis is available at https://psl.noaa.gov/data/gridded/data.ncep.reanalysis.html. The GODAS data are available at https://psl.noaa.gov/data/gridded/data.godas.html. The ERA5 dataset is available at https://cds.climate.copernicus.eu. The JRA-55 dataset is available at https://rda.ucar.edu/datasets/ds628.1/.
Author contributions
JC and JS derived the research idea and conducted the analysis. JC processed and visualized the datasets and wrote the first manuscript. All authors contributed to the article and approved the submitted version.
Funding
This study was supported by the National Natural Science Foundation of China (42006013).
Acknowledgments
We thank the data providers from the NCEP-NCAR, NOAA, ECMWF, and JRA.
Conflict of interest
The authors declare that the research was conducted in the absence of any commercial or financial relationships that could be construed as a potential conflict of interest.
Publisher’s note
All claims expressed in this article are solely those of the authors and do not necessarily represent those of their affiliated organizations, or those of the publisher, the editors and the reviewers. Any product that may be evaluated in this article, or claim that may be made by its manufacturer, is not guaranteed or endorsed by the publisher.
References
Amaya D. J., Miller A. J., Xie S.-P., Kosaka Y. (2020). Physical drivers of the summer 2019 north pacific marine heatwave. Nat. Commun. 11 (1), 1903. doi: 10.1038/s41467-020-15820-w
Bond N. A., Cronin M. F., Freeland H., Mantua N. (2015). Causes and impacts of the 2014 warm anomaly in the NE pacific. Geophys. Res. Lett. 42 (9), 3414–3420. doi: 10.1002/2015GL063306
Chen Z., Shi J., Li C. (2021a). Two types of warm blobs in the northeast pacific and their potential effect on the El niño. Int. J. Climatol. 41 (4), 2810–2827. doi: 10.1002/joc.6991
Chen Z., Shi J., Liu Q., Chen H., Li C. (2021b). A persistent and intense marine heatwave in the northeast pacific during 2019–2020. Geophys. Res. Lett. 48 (13), e2021GL093239. doi: 10.1029/2021GL093239
Chen H. H., Wang Y., Xiu P., Yu Y., Ma W., Chai F. (2023). Combined oceanic and atmospheric forcing of the 2013/14 marine heatwave in the northeast pacific. NPJ Climate Atmospheric Sci. 6 (1), 3. doi: 10.1038/s41612-023-00327-0
Cronin M. F., Pelland N. A., Emerson S. R., Crawford W. R. (2015). Estimating diffusivity from the mixed layer heat and salt balances in the n orth p acific. J. Geophysical Research: Oceans 120 (11), 7346–7362. doi: 10.1002/2015JC011010
Di Lorenzo E., Mantua N. (2016). Multi-year persistence of the 2014/15 north pacific marine heatwave. Nat. Climate Change 6 (11), 1042–1047. doi: 10.1038/nclimate3082
Di Lorenzo E., Schneider N., Cobb K. M., Franks P., Chhak K., Miller A. J., et al. (2008). North pacific gyre oscillation links ocean climate and ecosystem change. Geophysical Res. Lett. 35 (8), L08607. doi: 10.1029/2007GL032838
Hartmann D. L. (2015). Pacific sea surface temperature and the winter of 2014. Geophysical Res. Lett. 42 (6), 1894–1902. doi: 10.1002/2015GL063083
Hersbach H., Bell B., Berrisford P., Hirahara S., Horányi A., Muñoz-Sabater J., et al. (2020). The ERA5 global reanalysis. Q J R Meteorol Soc 146, 1999–2049. doi: 10.1002/qj.3803
Hu Z.-Z., Kumar A., Jha B., Zhu J., Huang B. (2017). Persistence and predictions of the remarkable warm anomaly in the northeastern pacific ocean during 2014–16. J. Climate 30 (2), 689–702. doi: 10.1175/JCLI-D-16-0348.1
Huang B., Thorne P. W., Banzon V. F., Boyer T., Chepurin G., Lawrimore J. H., et al. (2017). Extended reconstructed sea surface temperature, version 5 (ERSSTv5): upgrades, validations, and intercomparisons. J. Climate 30 (20), 8179–8205. doi: 10.1175/JCLI-D-16-0836.1
Jones T., Parrish J. K., Peterson W. T., Bjorkstedt E. P., Bond N. A., Ballance L. T., et al. (2018). Massive mortality of a planktivorous seabird in response to a marine heatwave. Geophys. Res. Lett. 45 (7), 3193–3202. doi: 10.1002/2017GL076164
Kalnay E., Kanamitsu M., Kistler R., Collins W., Deaven D., Gandin L., et al. (1996). The NCEP/NCAR 40-year reanalysis project. Bull. Am. meteorological Soc. 77 (3), 437–472. doi: 10.1175/1520-0477(1996)077<0437:TNYRP>2.0.CO;2
Kobayashi S., Ota Y., Harada Y., Ebita A., Moriya M., Onoda H., et al. (2015). The JRA-55 reanalysis: General specifications and basic characteristics. J. Meteorological Soc. Japan. Ser. II 93 (1), 5–48. doi: 10.2151/jmsj.2015-001
Liang Y.-C., Yu J.-Y., Saltzman E. S., Wang F. (2017). Linking the tropical northern hemisphere pattern to the pacific warm blob and Atlantic cold blob. J. Climate 30 (22), 9041–9057. doi: 10.1175/JCLI-D-17-0149.1
Liu Y., Sun C., Li J. (2022). Nonidentical mechanisms behind the north pacific summer blob events in the satellite era. Climate Dynamics, 1–12. doi: 10.1007/s00382-022-06584-8
Mantua N. J., Hare S. R., Zhang Y., Wallace J. M., Francis R. C. (1997). A Pacific Interdecadal Climate Oscillation with Impacts on Salmon Production. Bull Am Meteorol Soc 78 (6), 1069–1080. doi: 10.1175/1520-0477(1997)078<1069:APICOW>2.0.CO;2
Paulson C. A., Simpson J. J. (1977). Irradiance measurements in the upper ocean. J. Phys. Oceanography 7 (6), 952–956. doi: 10.1175/1520-0485(1977)007<0952:IMITUO>2.0.CO;2
Saha S., Nadiga S., Thiaw C., Wang J., Wang W., Zhang Q., et al. (2006). The NCEP climate forecast system. J. Climate 19 (15), 3483–3517. doi: 10.1175/JCLI3812.1
Schmeisser L., Bond N. A., Siedlecki S. A., Ackerman T. P. (2019). The role of clouds and surface heat fluxes in the maintenance of the 2013–2016 northeast pacific marine heatwave. J. Geophysical Research: Atmospheres 124 (20), 10772–10783. doi: 10.1029/2019JD030780
Seager R., Hoerling M., Schubert S., Wang H., Lyon B., Kumar A., et al. (2015). Causes of the 2011–14 California drought. J. Climate 28 (18), 6997–7024. doi: 10.1175/JCLI-D-14-00860.1
Shi J., Tang C., Liu Q., Zhang Y., Yang H., Li C. (2022). Role of mixed layer depth in the location and development of the northeast pacific warm blobs. Geophysical Res. Lett. 49 (16), e2022GL098849. doi: 10.1029/2022GL098849
Walsh J. E., Bieniek P. A., Brettschneider B., Euskirchen E. S., Lader R., Thoman R. L. (2017). The exceptionally warm winter of 2015/16 in Alaska. J. Climate 30 (6), 2069–2088. doi: 10.1175/JCLI-D-16-0473.1
Xie S.-P. (1999). A dynamic ocean–atmosphere model of the tropical Atlantic decadal variability. J. Climate 12 (1), 64–70. doi: 10.1175/1520-0442-12.1.64
Yang Q., Cokelet E. D., Stabeno P. J., Li L., Hollowed A. B., Palsson W. A., et al. (2019). How “The blob” affected groundfish distributions in the gulf of Alaska. Fisheries Oceanography 28 (4), 434–453. doi: 10.1111/fog.12422
Zaba K. D., Rudnick D. L. (2016). The 2014–2015 warming anomaly in the southern California current system observed by underwater gliders. Geophys. Res. Lett. 43 (3), 1241–1248. doi: 10.1002/2015GL067550
Zhang Y., Wallace J. M., Battisti D. S. (1997). ENSO-like interdecadal variability: 1900–93. J. Climate 10 (5), 1004–1020. doi: 10.1175/1520-0442(1997)010<1004:ELIV>2.0.CO;2
Keywords: Northeast Pacific warm blob, heat budget, surface heat flux, wind speed, specific humidity, cloud cover
Citation: Chen J, Li R, Xie S, Wei J and Shi J (2023) Characteristics and mechanisms of long-lasting 2021–2022 summer Northeast Pacific warm blobs. Front. Mar. Sci. 10:1158932. doi: 10.3389/fmars.2023.1158932
Received: 04 February 2023; Accepted: 29 March 2023;
Published: 18 April 2023.
Edited by:
Lichuan Wu, Uppsala University, SwedenReviewed by:
Hu Yang, Alfred Wegener Institute Helmholtz Centre for Polar and Marine Research (AWI), GermanyJing Ma, Nanjing University of Information Science and Technology, China
Copyright © 2023 Chen, Li, Xie, Wei and Shi. This is an open-access article distributed under the terms of the Creative Commons Attribution License (CC BY). The use, distribution or reproduction in other forums is permitted, provided the original author(s) and the copyright owner(s) are credited and that the original publication in this journal is cited, in accordance with accepted academic practice. No use, distribution or reproduction is permitted which does not comply with these terms.
*Correspondence: Jian Shi, c2hpamlhbkBvdWMuZWR1LmNu