
94% of researchers rate our articles as excellent or good
Learn more about the work of our research integrity team to safeguard the quality of each article we publish.
Find out more
ORIGINAL RESEARCH article
Front. Mar. Sci. , 18 September 2023
Sec. Physical Oceanography
Volume 10 - 2023 | https://doi.org/10.3389/fmars.2023.1155270
This article is part of the Research Topic Wave-Induced Particle Motions in the Ocean View all 10 articles
Internal solitary waves (ISWs) of large amplitude moving in the coastal ocean induce sizeable horizontal velocities above the sea bed. In turn, these give rise to instability and vortex formation in the bottom boundary layer (BBL), and sediment resuspension and concentration maintenance in the water column. We present two-dimensional laminar simulations in a numerical tank suitable for internal wave motion, including the processes of the BBL. The combined wave and vorticity field encounters a cloud of tracer particles near the bottom. The tracer particles are moved vertically because of the vorticity field during a first encounter. The reflected wave intercepts a second time with the tracer particles, which are then moved further vertically. Numerical experiments with a kinematic viscosity of 1/100 cm2 s−1 or 1/1000 cm2 s-1 are used to manipulate the scale of the Reynolds number at a moderate and great laboratory scale. The final vertical position of the tracer particles is found below a vertical level of approximately 0.23 times the water depth (H) after the second passage. The result is independent of the scale. This vertical position matches available field measurements of a summer benthic nepheloid layer reaching a height of 0.19H. The laminar model predictions compare very well to the ISW-driven vortex formation measured in a three-dimensional laboratory wave tank. Convergence of the calculated vortex formation is documented.
Internal solitary waves (ISWs) are commonly observed in the coastal ocean and are generally driven by the wind or the tide (Helfrich and Melville, 2006). The ISWs are driven by the acceleration of gravity ( m) and may move along the pycnocline of the ocean located at a middle depth , which is small compared to the local water depth , implying the dimensionless ratio . The density jump across the pycnocline () relative to the density of the water below the pycnocline () is typically small, with a dimensionless value of . In practice, is . The wave motion and the velocity field are functions of the wave amplitude , obtaining another dimensionless variable . The wave-driven velocities scale according to a reference velocity . This is proportional to times a function of . As regards the bottom boundary layer effect, it is commonly characterized by the Reynolds number based on the total water depth, the wave speed , and the kinematic viscosity , obtaining .
ISWs are often highly nonlinear. The theories, like weakly nonlinear Korteweg–de Vries (KdV) -type theories, have played a primary role in explaining the essential features of the observed wave, even though those theories do not always provide accurate quantitative details. Grue et al. (1999) conducted laboratory experiments of solitary waves propagating in a two-layer fluid. They compared the weakly nonlinear KdV theory and a fully nonlinear interface model towards the experimental results. Having a small amplitude, both theory and model compared excellently. However, above a certain amplitude threshold, the weakly nonlinear theory exhibits systematic deviation from the experiments where the fully nonlinear model still compared excellently for all quantities measured.
Above the pycnocline, the velocities have a dominant horizontal component, a substantial fraction of the wave propagation velocity. Below the pycnocline, the horizontal velocity is opposite of the wave propagation and is also a substantial fraction of the wave propagation speed. The vertically integrated horizontal velocity is zero and satisfies the mass balance. There are also vertical velocities. These are proportional to the horizontal gradient of the displaced pycnocline along the wave propagation times the wave speed.
The wave-induced boundary layer underneath an ISW of depression separates in the adverse pressure gradient region behind the trough. Strong enough instability may give rise to the spontaneous onset of vortex shedding (e.g., Diamessis and Redekopp, 2006; Carr et al., 2008; Aghsaee et al., 2012; Sakai et al., 2020). The vortex structures are formed behind the wave trough, ascend vertically into the water column, and then propagate downstream in the same direction as the mother wave but with a much slower speed (Carr et al., 2008). The instabilities in the bottom boundary layer may contribute to the resuspension of particles due to, e.g., substantial variation of the shear stress (e.g., Bogucki and Redekopp, 1999; Boegman and Stastna, 2019). The ability of nonlinear internal waves to move sediments on the bottom vertically in the water column has been observed by Bogucki et al. (1997), and has been further studied model-wise by, e.g., Bogucki and Redekopp (1999), and in field observations, e.g., Bourgault et al. (2007); Quaresma et al. (2007); Zulberti et al. (2020), see also the review by Boegman and Stastna (2019).
Large eddy simulations (LES) in three dimensions (3D) of the ISW-driven separated boundary layer and its development were carried out by Sakai et al. (2020) for a Reynolds number similar to our (). A strong wave of was moving on a counter-current of the same magnitude as the wave propagation speed, implying that the excitation is stronger than in our cases. The LES computations were compared to two-dimensional direct numerical simulations finding that the vortex generation was essential two-dimensional down to a distance of six water depths behind the wave trough. Further downstream, vortex breakup and degeneration into turbulent clouds, and relaxation to a spatially developing turbulent boundary layer were found to take place.
In this research, we investigate the ISW-driven vortex formation and tracer particle displacements in the bottom boundary layer. We conduct laminar two-dimensional numerical simulations of a set of laboratory experiments by Carr et al. (2008) where this kind of physical effect has been measured. Several questions are addressed, including:
1. As regards the two-dimensional laminar method: How well can the model reproduce the laboratory measurements conducted in a three-dimensional (3D) wave tank? In particular, how well can the model calculations reproduce the measured vortices at the bottom behind the wave?
2. As regards accuracy: How close are prediction and measurement?
3. As regards flow and motion properties: How can the model be used to evaluate quantities which have not been measured in the laboratory?
4. As regards the tracer particle motion: The wave- and boundary-layer-induced tracer particle motion is of interest to study and visualize. This motion was not measured in the laboratory experiments, even though the experimental visual tracking method is based on neutrally buoyant tracer particles added to the fluid.
5. As regards the vertical tracer particle displacements: In the shallow ocean, the particles at the sea bed contain organic matter that is important to the marine production taking place in the euphotic zone in the upper part of the water column. By the present model calculations, we investigate how high up in the water column the tracer particles may be transported. The wave may intercept a cloud of tracer particles once and twice.
6. Finally, we compare the simulated results with available field observations.
In section 2, we present the numerical wave tank, wave generation, wave characteristics, and the Stokes boundary layer thickness. Further, details of the two-dimensional numerical solver are described. The grid resolution and information regarding the Lagrangian tracer particles used in this study are provided. Section 3 presents the obtained results, including answers to the research questions posed. In section 3.1, similarities between the vortex formation in simulation and experiment at are presented. A convergence study of the calculated vortex separation distance and the vortex strength is performed. In section 3.2, we present the Lagrangian tracer particle displacements and paths. The vertical tracer particle distribution is calculated. The results are briefly compared to available field measurements in section 3.3, and conclusions are given in section 4.
This article presents numerical simulations of non-linear internal solitary waves (ISWs) of large amplitude, as visualized in Figure 1B, where the wave travels from left to right with a speed c. The wave-induced velocity field beneath the wave interacts with the bottom, initiating instabilities in the viscous bottom boundary layer (BBL) (e.g., Carr and Davies, 2006; Diamessis and Redekopp, 2006; Aghsaee et al., 2012; Sakai et al., 2020). Tracer particles are implemented close to the bottom in order to investigate their motion in the fluid induced by the wave (Boegman and Stastna, 2019).
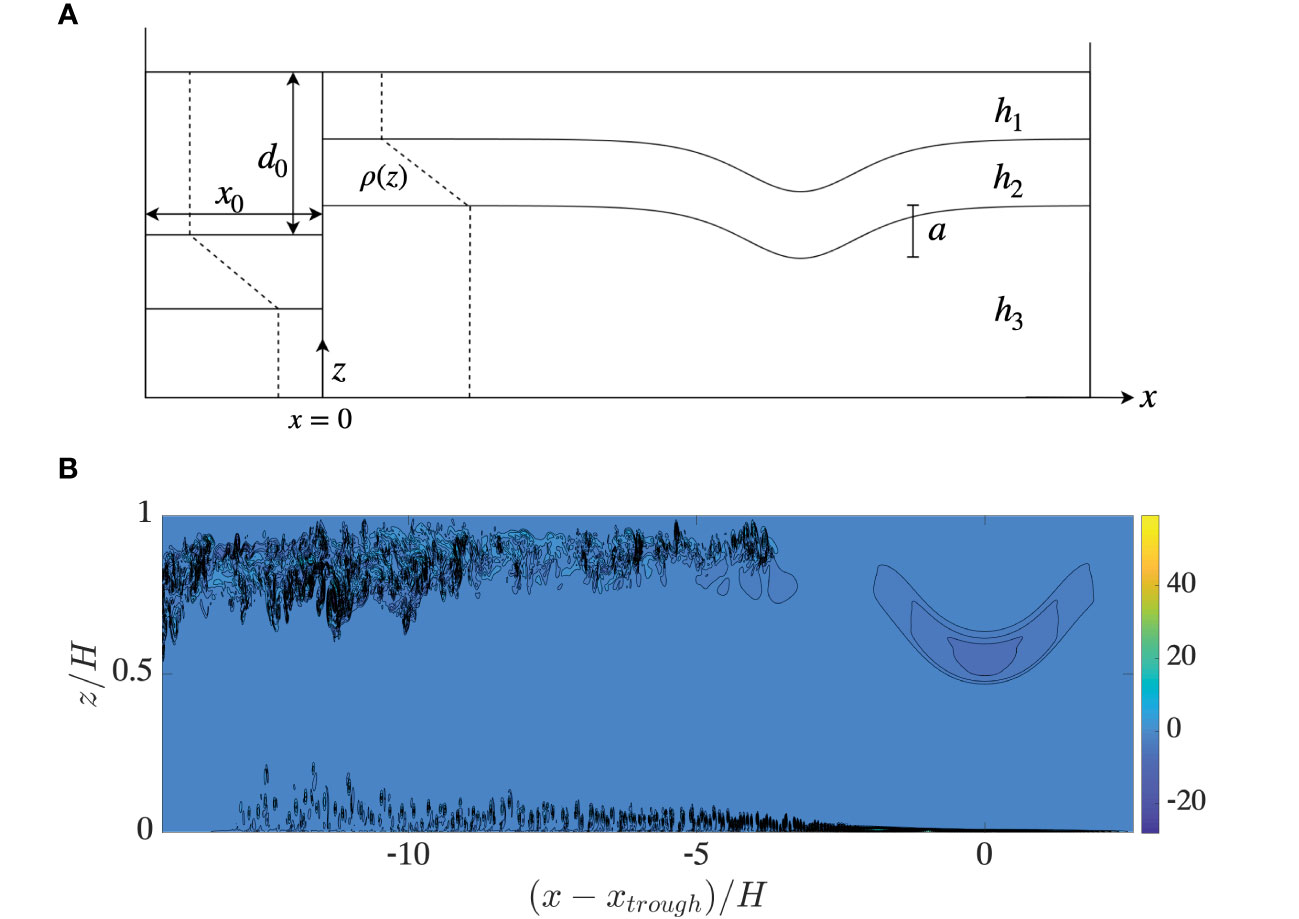
Figure 1 (A) Sketch of the wave tank. (B) Vorticity field ω/(c0/H) (color scale, black contour lines of ω) due to ISW travelling to the right at tc0/H = 6.4 with a/H = 0.30 and Rew = 5.9 · 104.
We are following the same setup of the wave tank and the wave generation procedure as conducted in the laboratory experiments by Carr et al. (2008). The numerical wave tank is filled with a stratified fluid. The upper layer has a depth of and a density of . The pycnocline has a thickness of and density , which varies as a linear function of . The lower layer has thickness and density . The density is continuous throughout the vertical. The total water depth is . Figure 1A is a sketch of the wave tank. The amplitude is defined as the maximum excursion of the isoline separating layers two and three. The middle depth of the pycnocline is defined by . In the present investigation, two different stratifications are studied, where stratification one, denoted by Strat. 1, has , and stratification two,denoted by Strat. 2, has . These two stratifications correspond to two of the pycnocline depths studied by Carr et al. (2008). In present calculations, the thickness of the pycnocline is , and the wave amplitude .
The physical dimensions of the 2D numerical wave tank are the same as those used in the laboratory setup by Carr et al. (2008). The length m and depth m provide a non-dimensional length of .
To generate ISWs in the tank (physical or numerical), the trapped volume method is applied where a large volume , given by () of density , is added behind a gate. The gate is located at a distance of m from the left tank wall. Its horizontal position defines , where the horizontal -axis is along the bottom. The total volume can be modified by varying the depth , generating ISWs with different amplitudes, by releasing the volume. In the laboratory, the gate is removed by quickly lifting it upwards. In the numerical simulations, the gate is imposed beforetime zero, and after time zero, we assume it is instantaneously removed. A leading wave of mode 1 is generated in each experiment (physical or numerical).
The wave frequency is defined by , where is the linear long wave speed given by the two-layer approximation
where and . The wavelength of the ISW is defined by
where denotes the vertical displacement of the isoline separating layers two and three, and the amplitude is defined above.
The Reynolds number based on the water depth, alternatively denoted the wave Reynolds number, is a helpful quantity used by a group of researchers studying the combined wave and boundary layer effects (e.g., Diamessis and Redekopp, 2006; Carr et al., 2008; Aghsaee et al., 2012; Sakai et al., 2020). The quantity is defined by where is the kinematic viscosity of the water. In the laboratory experiments by Carr et al. (2008), the was approximately . In the field scale, is (e.g., Zulberti et al., 2020). The present calculations are carried out with between and . The calculations at are carried out with c for fresh water at 20 °C. In the calculations at , the is manipulated with a value put to cm2 s−1. Alternatively, the water depth may be increased to , , and cm2 s−1 producing . Additionally, we define a boundary layer Reynolds number, , where is the free stream horizontal velocity underneath the wave trough, right above the bottom, and is the boundary layer thickness, defined in section 2.3 below.
The wave travels along the pycnocline from left to right. The nonlinear celerity is . There is no background current. A snapshot of an ISW at time is visualized by its nondimensional vorticity field in Figure 1B (corresponding to run 1 in Table 1). The simulation is run with a kinematic viscosity of cm2 s−1. The wave drives the instability and vortex formation in the BBL, in addition to the shear instability in the pycnocline (e.g., Fructus et al., 2009; Lamb, 2014). As the volume is released, a local mixing of the fluid taking place across the gate position is confined to a small volume (physical or numerical). This is set into horizontal motion along the pycnocline, generating a short and slower wave of mode 2, observed at approximately nine water depths behind the main wave. Such a wave is measured by Sveen et al. (2002), their Figure 17 and more recently studied by Carr et al. (2019).

Table 1 Layer depths, stratification (Strat.), calculated amplitude , numerical values for , , , , and .
The ISW propagating at small speed , proportional to , implies that the effect on the free surface elevation is small. The vertical velocity is approximately zero at the free surface. The small free surface elevation may be calculated a posteriori from the Bernoulli equation giving , where is the horizontal speed driven by the ISW at the free surface (e.g., Fructus and Grue, 2004). On the laboratory scale, the wave speed is m , for the waves of large amplitude (and the wavelength is approximately m). This obtains a surface elevation of cm while the internal wave amplitude is cm. Corresponding estimates of ISWs in the coastal ocean are: wave speed of m , a surface elevation of cm, while the internal wave amplitude is typically m. The internal waves are m to m long.
The Stokes boundary layer thickness at the bottom beneath the wave phase is characterized by , where is defined in § 2.2.
We present numerical simulations of ISWs, utilizing the open-source software Basilisk (Popinet and collaborators, 2013–2023). The important part of the calculation is to resolve the wave-driven viscous boundary layer effect at the bottom of the fluid domain. Basilisk is a second-order finite volume solver, where the two-phase incompressible Navier-Stokes equations are solved and is the successor of Gerris (Popinet, 2003; Popinet, 2009). Basilisk provides ready-to-use finite volume solvers for fluid dynamics and has been widely used in calculations and simulations of several problems, i.e., tsunamies (e.g., Popinet, 2015), shallow water, wave breaking and surface flows (e.g., Popinet, 2011; Mostert and Deike, 2020; Popinet, 2020), incompressible two-phase flow (e.g., López-Herrera et al., 2019), and atmospheric turbulent boundary layer (e.g., van Hooft et al., 2018).
In this two-dimensional (2D) study, the incompressible, non-hydrostatic equations in a Cartesian reference frame become,
where , , and are the density, velocity vector, pressure and kinematic viscosity, respectively. The vector , where is the acceleration due to gravity. Further, is time, and are the (horizontal, vertical) coordinates. The Navier-Stokes equations determine the pressure and the velocity field driven by the wave where mass conservation is included, additionally to set the effect of viscosity in the viscous boundary layer at the bottom.
The field equations are solved by means of a multilevel Poisson solver. The Bell-Colella-Glaz (Bell et al., 1989) advection scheme integrates the momentum equation. The viscous terms are treated implicitly. The solver employs a geometric volume of fluid method (VOF) to reconstruct the interfaces by the continuous change of the fluid properties; density and viscosity. The cells that include an interface are treated by introducing the volume fraction of the two fluids, . The implementation of the numerical scheme is briefly described below. The time integration (supplied in Appendix A.1) adheres to the standard Basilisk setup, with a slight modification where the dynamic viscosity is harmonically averaged. For more details, see the Basilisk web page (basilisk.fr), Popinet (2003); Popinet (2009), and references therein.
By default, Basilisk defines a computational domain with sides L. Our numerical wave tank is defined as a part of this spatial domain, with horizontal length L and vertical height H . At ( at the tank bottom, see Figure 1A), a rigid lid is placed, implying no motion in the domain . The effect of viscosity is taken into account within the fluid and at the bottom. This means that the no-slip condition is applied at the lower boundary. Free-slip conditions are used at the upper boundary, vertical end walls, and gate. The depth provides the physical length scale in the calculations. The time and velocity scales are and , respectively.
The discretization of the computational domain utilizes a quad-tree scheme (Popinet, 2003; van Hooft et al., 2018) where the user can choose to run the scheme with either a non-adaptive mesh or an adaptive mesh, further referred to as “refine” and “adapt”, respectively.
The size of a cell is characterized by its level where it is located. The cells are square finite volume cells, providing equal subdivisions vertically and horizontally, creating . Hence, the grid size of the cell at a given level is .
The grid resolution is discussed relative to the boundary layer thickness, i.e., . A fine discretization with is developed near the bottom for , where the finest resolution becomes (run 3, Table 1). Hence, . This is to ensure grid independence of the results.
Adaptive meshing is widely used and is known to significantly reduce the computation cost. We will utilize adapting meshing when exploring convergence properties of our numerical scheme. When the mesh is adapted, the refinement criterion is based on the discretization error of the velocities and , and the criterion for refinement of the volume fraction is based upon a wavelet algorithm. The threshold values are set to and . Further details are provided in the Appendix A.2.
van Hooft et al. (2018), their Figure 8, have compared the numerical dissipation in the “refine” and “adapt” versions of Basilisk, finding that small discrepancies on the order of were present between the runs with the fixed uniform grid and the adaptive grid, where this discrepancy decreased with increasing refinement. Numerical tests diagnosed with a lower dissipation rate were associated with lower kinetic energy, indicating that a small part of the dissipation was of numerical/non-physical origin.
The advantage of the Basilisk framework is that it includes OpenMP/MPI parallelism capability. The simulations were run in parallel using shared memory (OpenMP), and the computations were performed on the Norwegian Research and Education Cloud (NREC).
Tracking of Lagrangian tracer particles is performed using a two-stage Runge-Kutta (RK2) scheme. The seeded neutrally buoyant tracer particles are purely Lagrangian tracers, and their settling velocity, added mass, history effects, etc., are ignored (Necker et al., 2005; Stastna and Lamb, 2008).
The tracer particles are seeded close to the bottom in a two-dimensional rectangular grid. More precisely, tracer particles are equally distributed horizontally between and vertically between before time zero. Table 1 provides the values. The tracer particle positions are presented relative to the total water depth and the boundary layer’s height (§2.3). The vertical extent is .
However, the boundary layer thickness, , is a better vertical scale of the tracer particle vertical motion, providing vertical extension between for and , and for and .
The tracer particles displacement ( and the path driven by the wave-induced instabilities are calculated by integrating:
obtaining
The RK2 scheme employs
where , and , and , , and (Sanderse and Veldman, 2019). The tracer particles paths are visualized both in a fixed frame of reference and a frame of reference following the wave.
In this section, a numerical simulation of the wave-induced instability is presented. We simulate one of the laboratory experiments by Carr et al. (2008), their experiment dated 080207, and directly compare our results. The parameters of the numerical simulation corresponding to the experiment are provided in Table 1, denoted by Run 1. In the table, is the non-dimensionalized amplitude and is similar in the computation and experiment (as ).
The created wave, numerically and physically, is strong enough to induce instability and vortices. Figure 2A shows the instability and vortex ejection from the boundary layer due to the wave illustrated in Figure 1B. The horizontal axis is , where denotes the position of the wave trough. The instability grows exponentially between and , whereafter the vortices are formed. The series of vortex rolls in the instability growth area have a shorter separation length than the vortices found further downstream. The vortex formation goes on continuously, producing the vortex wake. Specifically, we compare to the experiment in which Carr et al. (2008) presented the vertical velocity corresponding to the vortices, their Figure 13, reproduced here in Figure 2C.
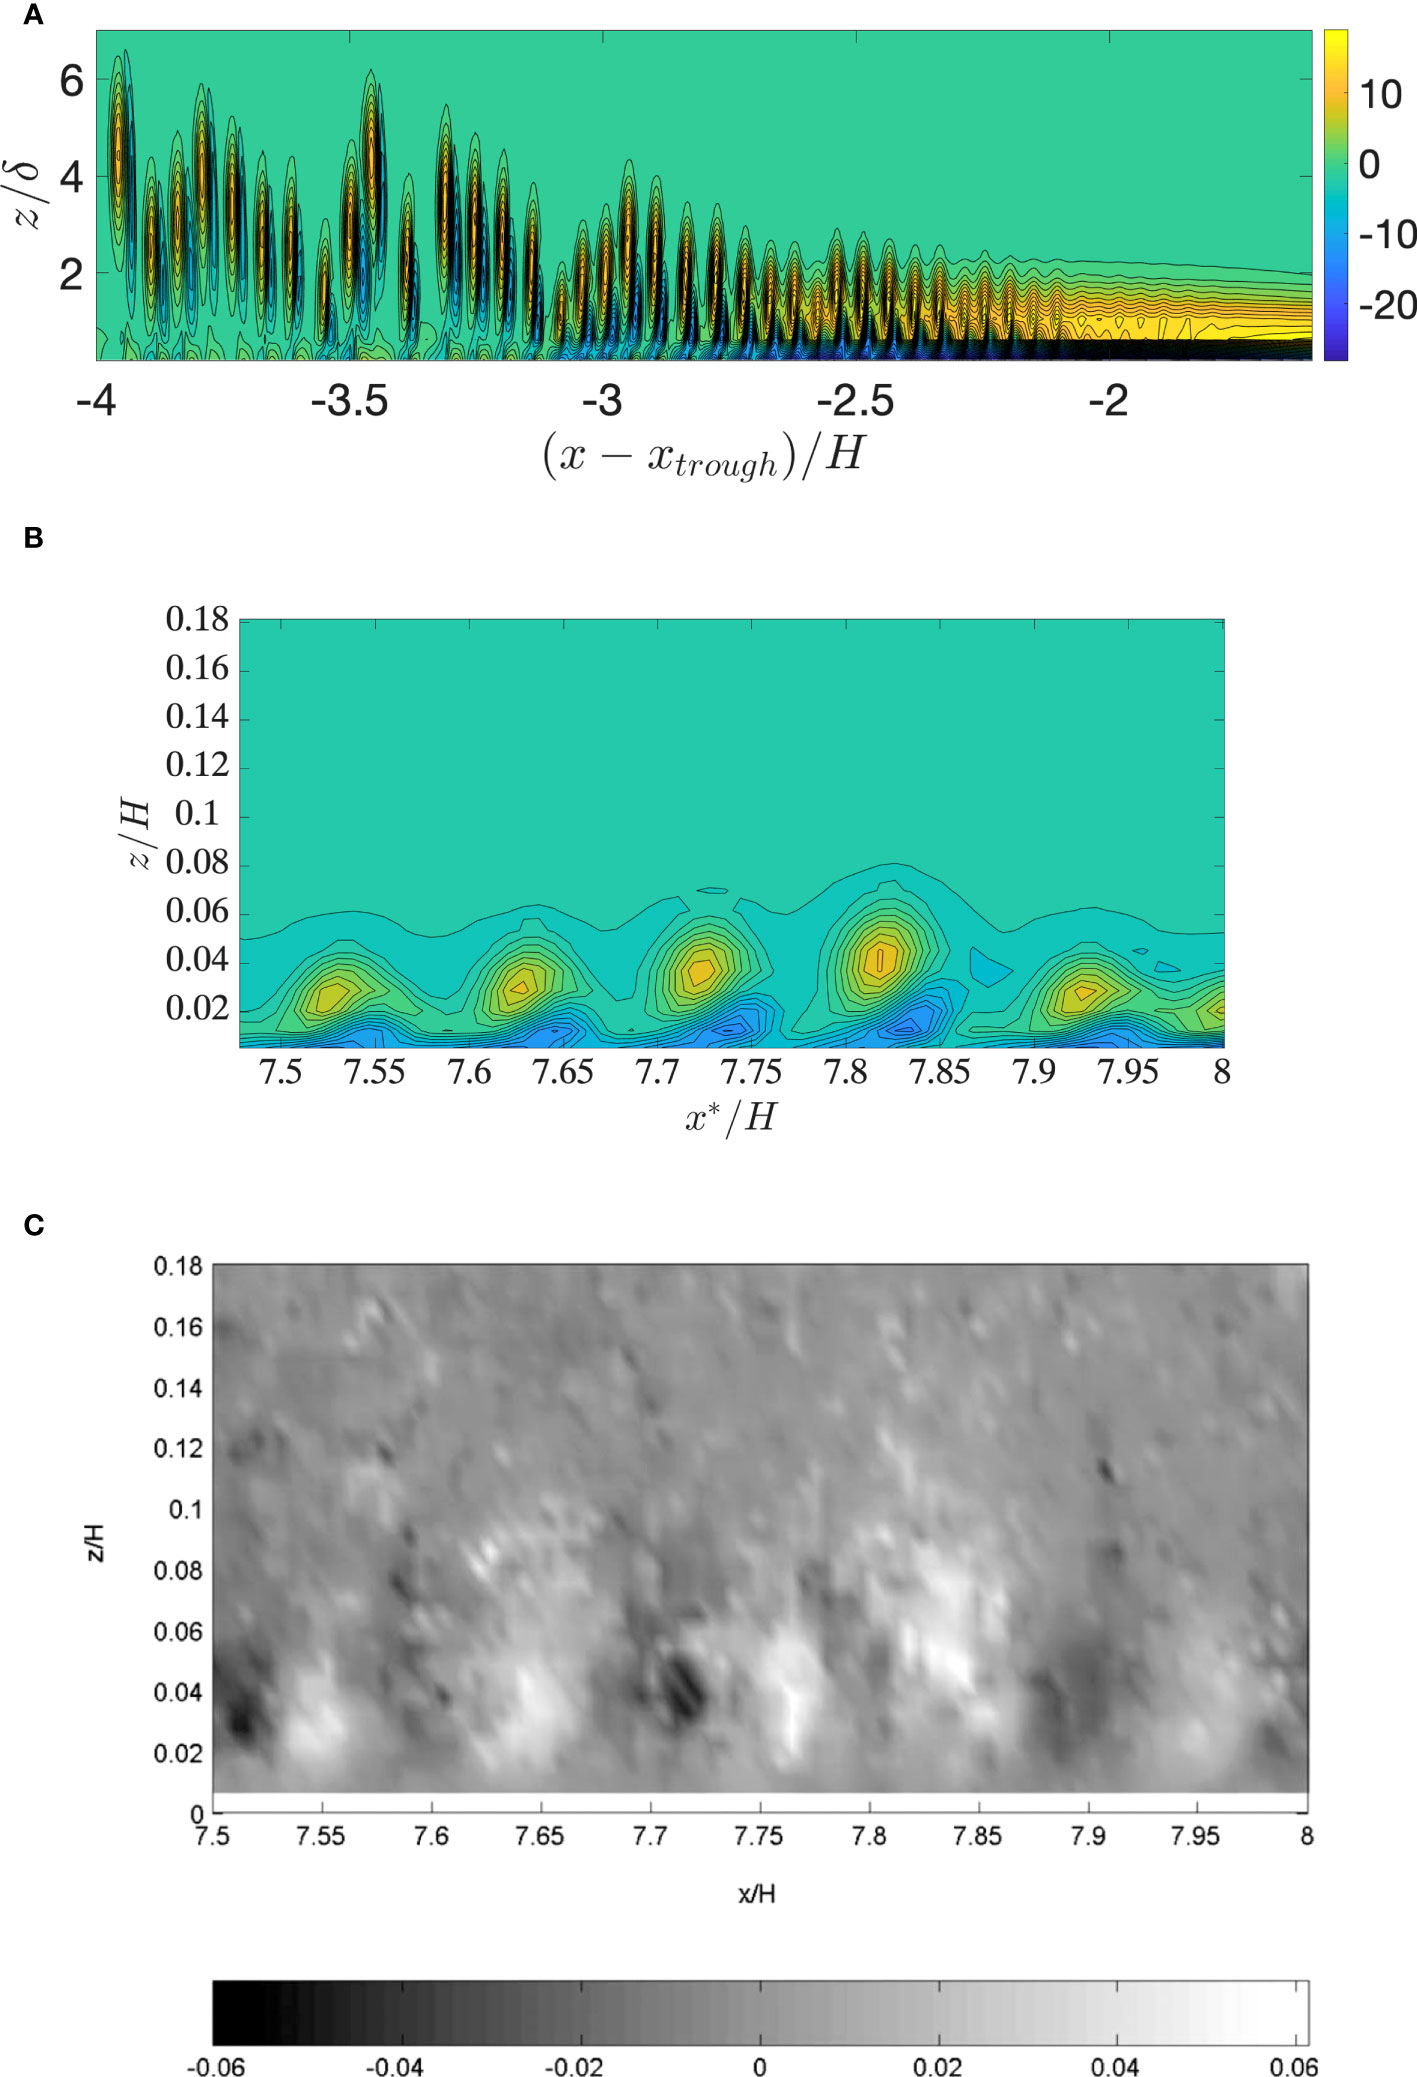
Figure 2 (A) Vorticity field ω/(c0/H) (color scale, black contour lines of ω) vs. horizontal position. (B) ω/(c0/H) with horizontal position x*/H = ct/H + constant corresponding to the measurement area in c). (C) Image: Reprinted from Carr et al., (2008), with the permission of AIP Publishing. Vortices displayed by their vertical velocity at time tc0/H = 6.4.
The separation distance between the vortices located in the vortex wake is set to be the center-to-center distance between the vortices. The computational result (Figure 2B) shows five vortices, the same number as in the experiment for the similar horizontal extension (Figure 2C). In the experiment, the separation distance between the vortices is between and , with an average of . The similar average distance in the computation is , which is exactly the same result. The maximum vertical extent of the vortices was of the water depth in the laboratory and in the simulation. The results in Figure 2 were simulated with and , see section 2.6.
We now discuss research question two of the introduction: how close are prediction and measurement?
Two different numerical representations are included in Basilisk, as described in section 3.6. Calculations using both representations are presented.
The resolution level is in the range of . When running with “refine”, there is no additional refinement close to the bottom. The minimum and maximum refinement levels in “adapt” are set to and .
Each simulation was performed ten times with the same settings and executed with and without parallelization. The average values and standard deviations of the variables: distance, vorticity, amplitude, and speed were calculated over the ten runs with the same settings. Hence, a total of 120 simulations were run.
The vortices measured in Carr et al. (2008) (Figure 2C) exhibit an individual distance that slightly varies. Figure 3 illustrates the respective computational distance, calculated over the same area, further referred to as the local area, as a function of the resolution level . The distance is further explored over a broader range in the wave tank where (results are not shown). The simulations converge for increasing resolution level. A small anomaly for “adapt” in the result presented in Figure 3 is observed. However, if we increase the respective local area three times, its average distance reduces from to (marked by a green circle in the figure). When simulating with the lowest resolution, the vortex formation formed is the main difference between “refine” and “adapt”. However, this discrepancy decreases with increasing resolution. For our purposes, the advantages of utilizing “adapt” instead of “refine” are minor.
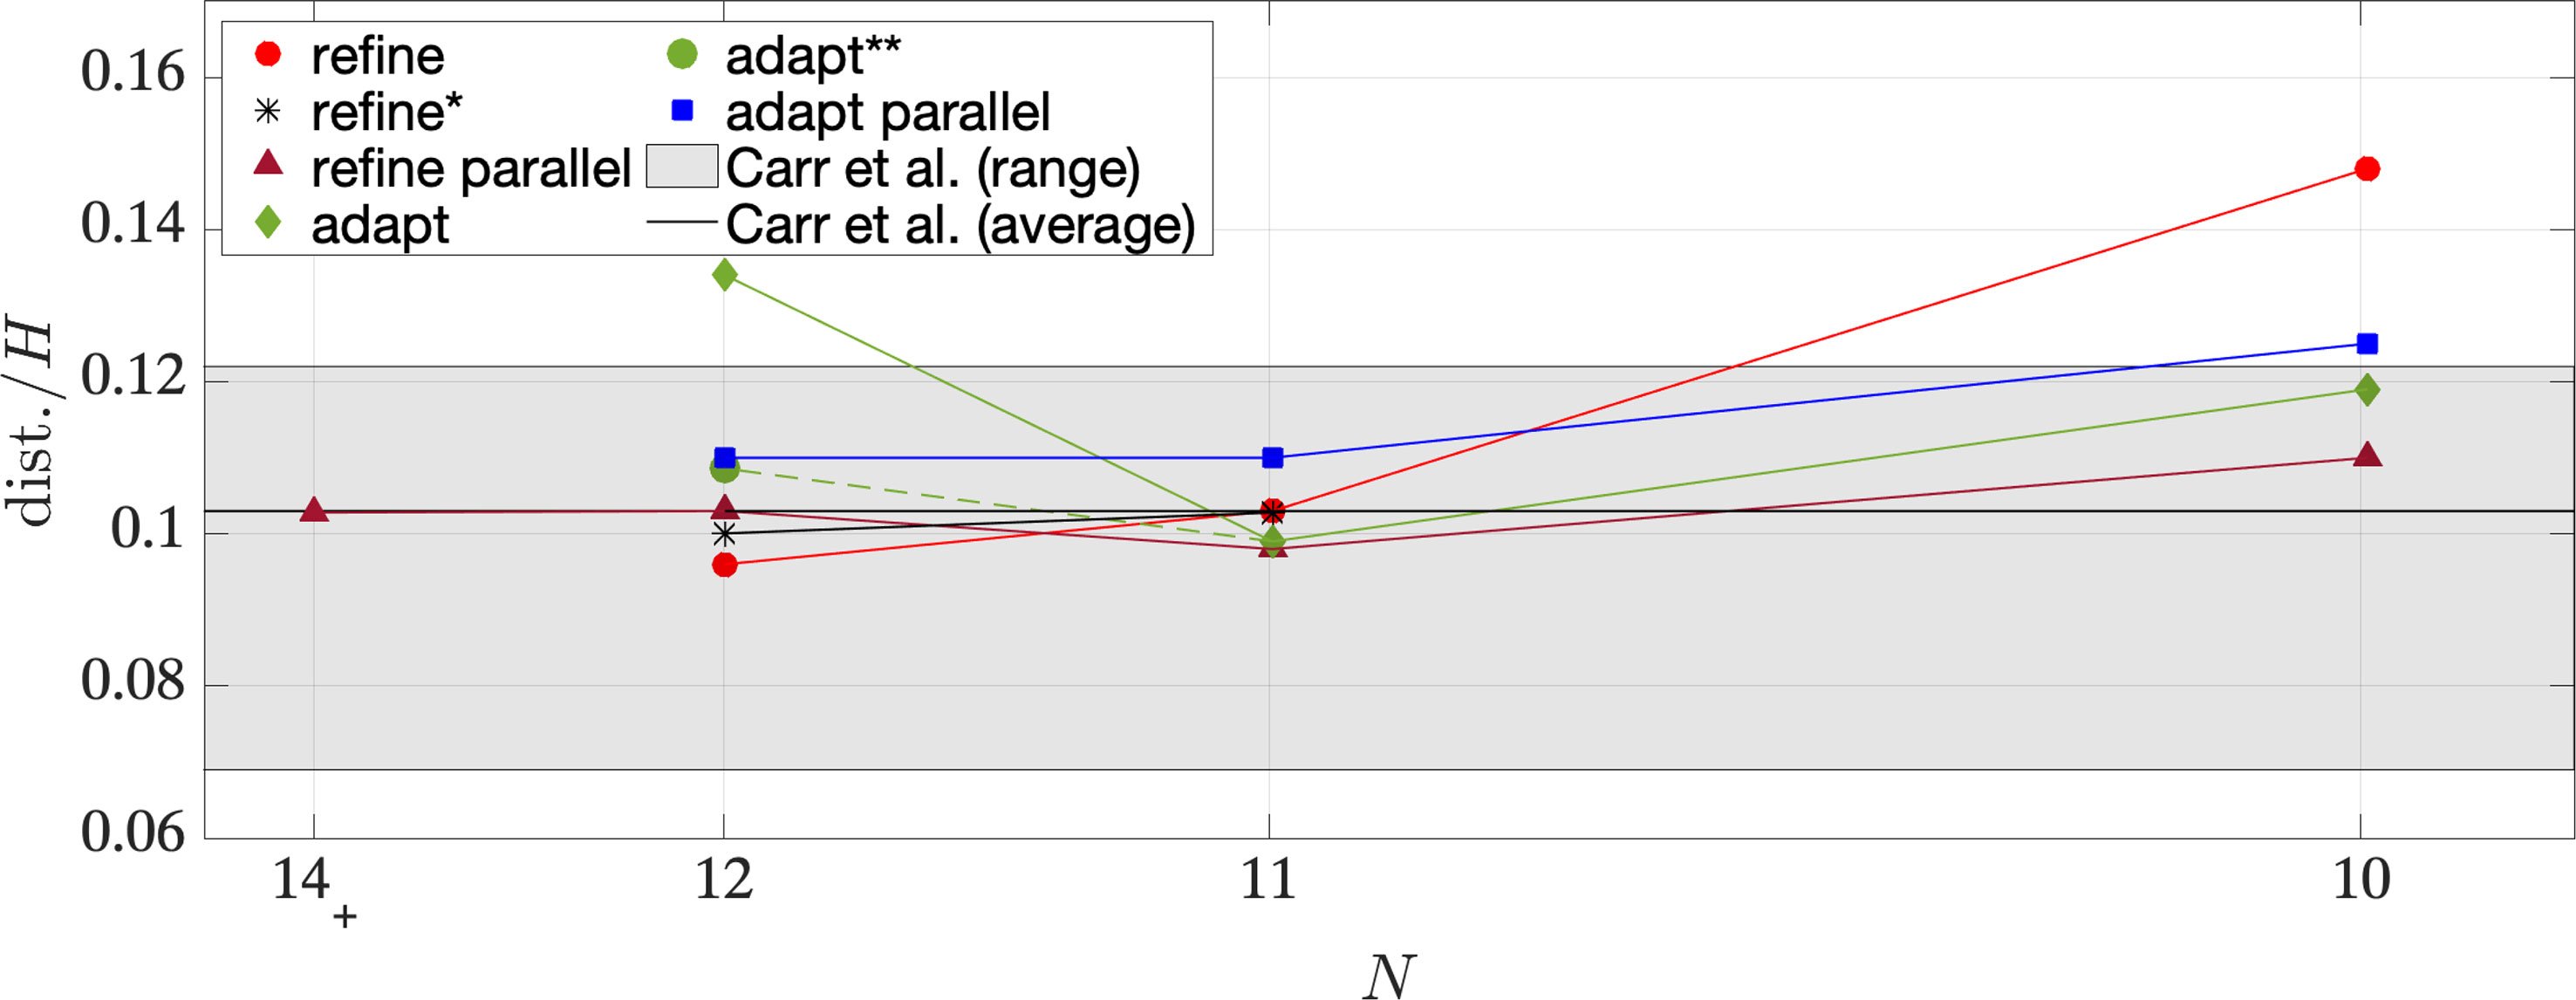
Figure 3 Vortex separation distance (dist.) over the local area versus the resolution level N. The result from the simulation with N = 12, N+ = 14 is marked by N = 14+. The black line corresponds to the experimental average local distance. The grey-shaded area corresponds to the measured individual separation distance in Figure 2C. Simulations without parallelization: refine ◯, refine∗∗, adapt ♦ and adapt∗∗ ◯.Simulations with parallelization: refine △ and adapt □.
An additional convergence check is conducted where the results are analyzed after a downscaling of the resolution in the post-processing procedure. Hence, the simulations are executed with “refine” and and 12. In the post-processing procedure, the simulations conducted with are downscaled to level , and the simulations performed with are downscaled to level . The results are plotted in Figures 3, 4C with black and are marked with an asterisk in the figure legend.
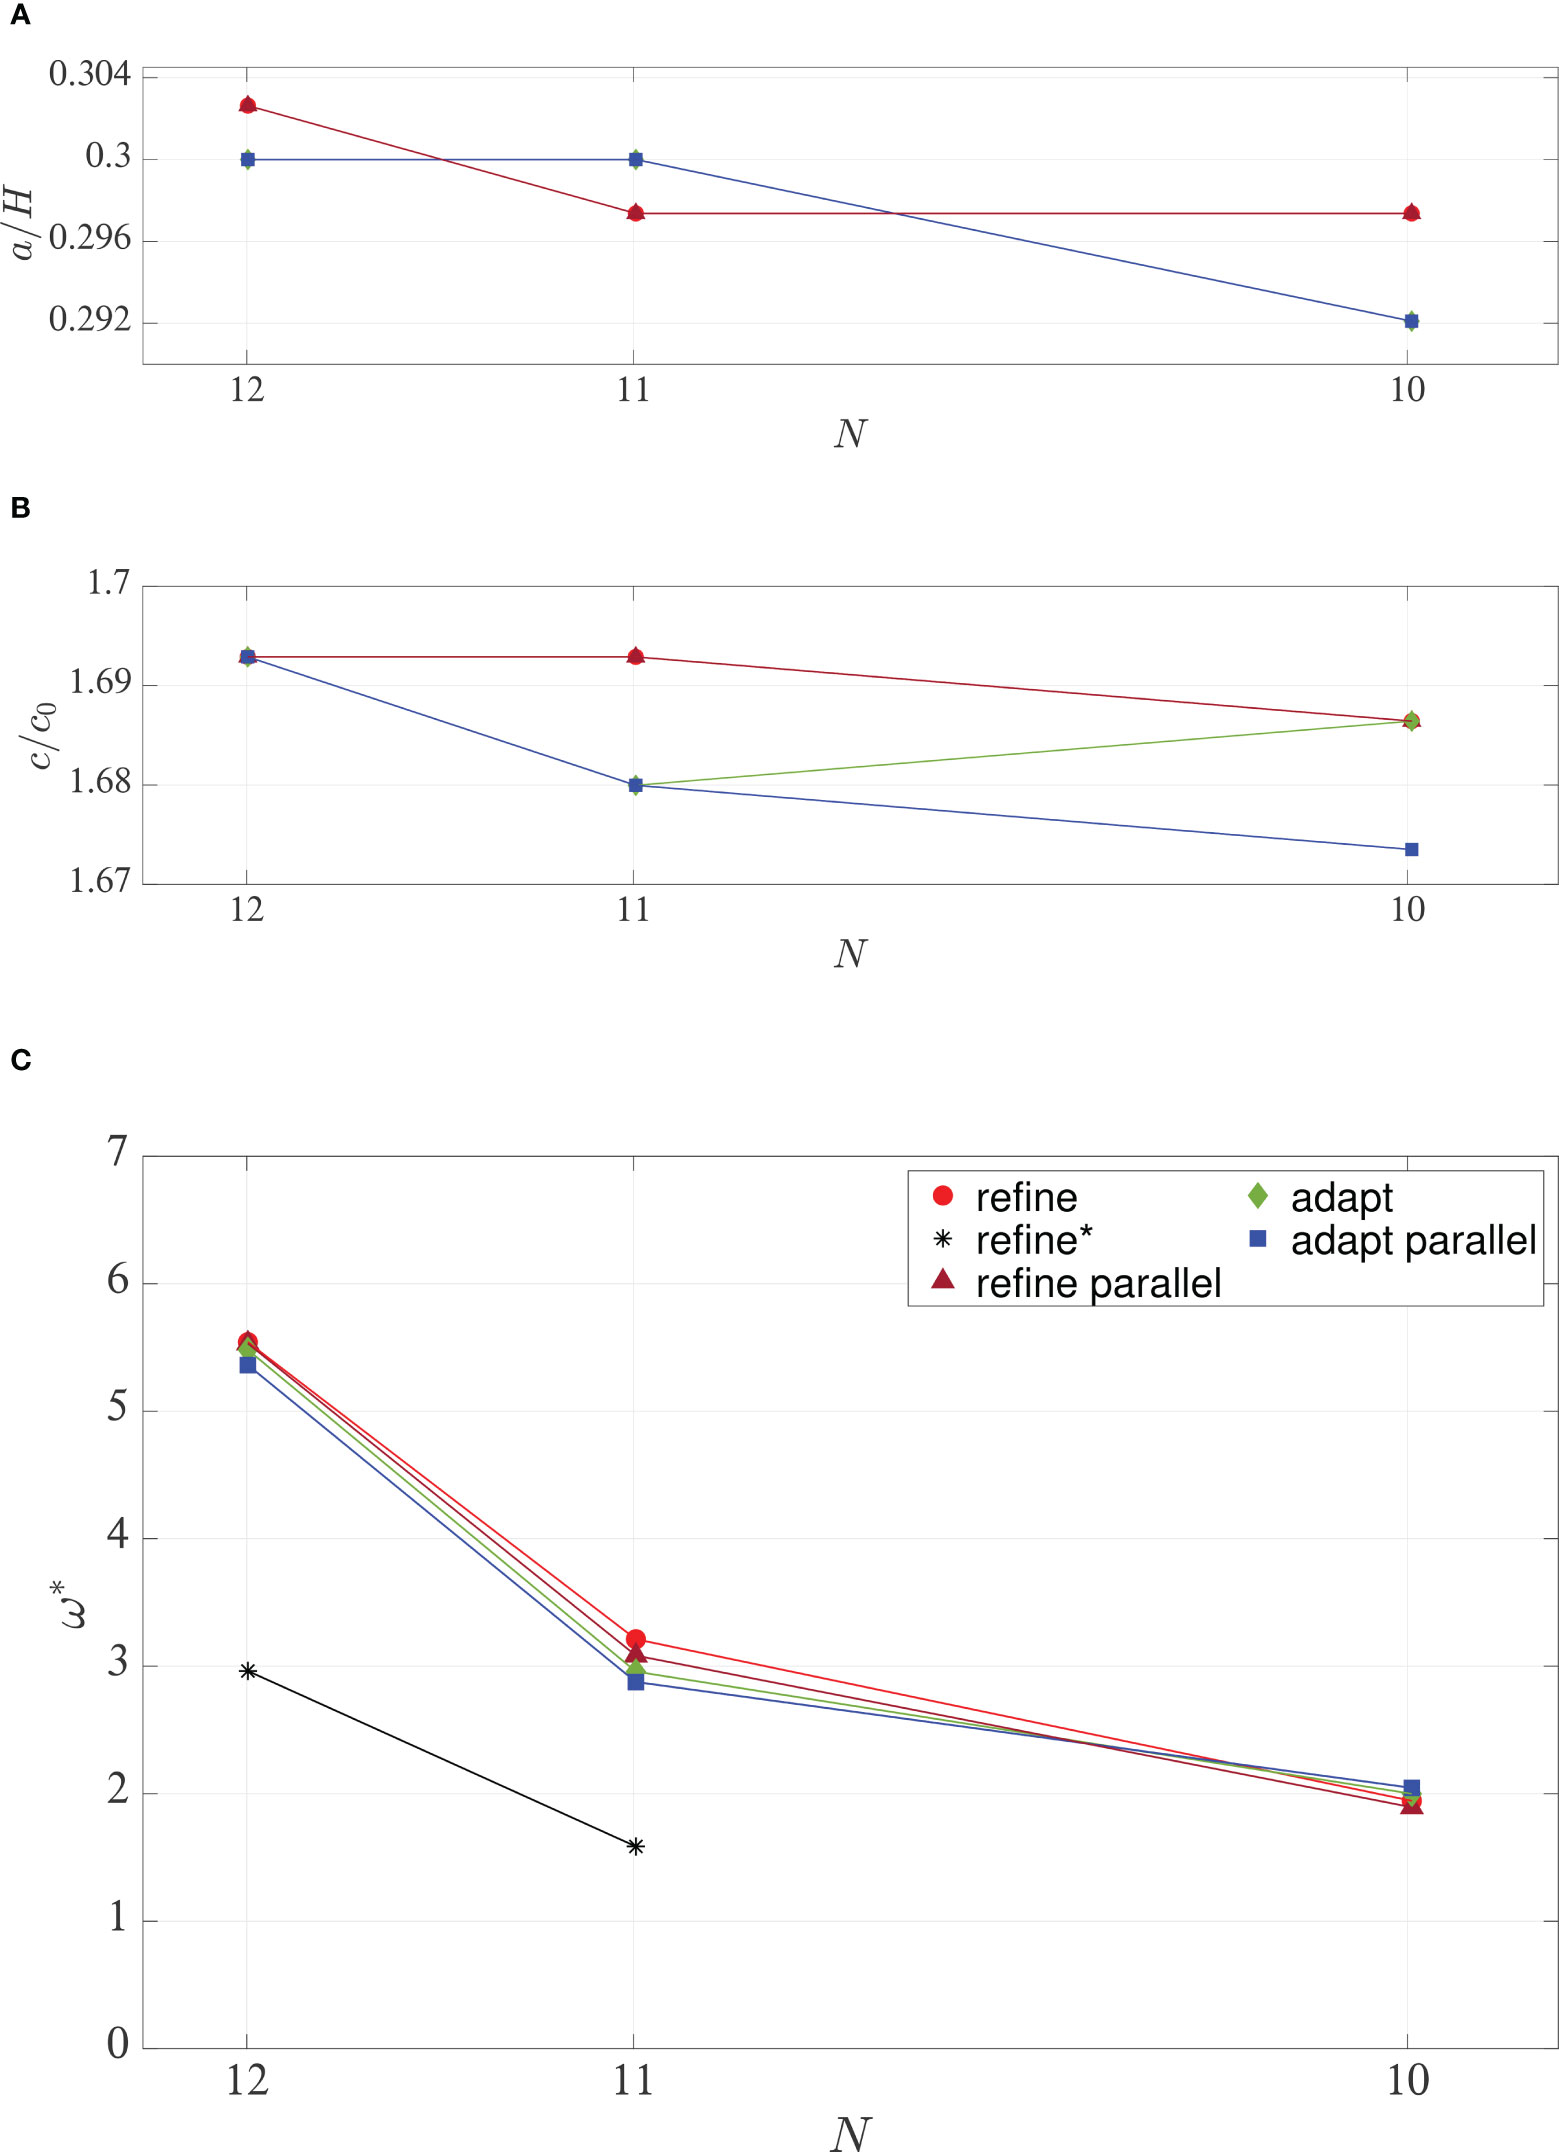
Figure 4 (A) Wave amplitude a/H, (B) speed c/c0 and (C) maximum vorticity versus resolution level N. Simulations without parallelization: refine ◯, refine∗ ∗, and adapt ♦. Simulations with parallelization: refine △ and adapt □.
The measured average amplitude and wave speed are visualized in Figures 4A, B, respectively. The amplitude in the simulation is higher than the amplitude measured in the laboratory experiments by Carr et al. (2008). The average wave speed in the computations converges to m , corresponding to the upper limit of the wave speed measured in the laboratory of m .
The vorticity in the numerical simulations is obtained by evaluating the circulation integral in each grid cell, divided by the area enclosed by the integration contour obtaining . Here is the vector length along the side of the grid cell. An average of the non-dimensional maximum vorticity is calculated over the vortices located in the local area and in the global area . The results of averaging over the broader range are illustrated in Figure 4C. The respective standard deviation of is found to be (), “refine” and “adapt”, (), “refine”, and (), “adapt”.
The comparison between the computations and the laboratory experiments by Carr et al. (2008), presented in § 3.1.1, is also included in Figure 3. The simulation conducted with is marked in the figure by .
This subsection illustrates that the model very well reproduces the laboratory experiment in the 3D wave tank by Carr et al. (2008). The predictions and measurements are very close. Moreover, the 2D laminar calculations illustrate that the dominant processes in the laboratory experiments are dominated by 2D processes. The processes investigated by Carr et al. (2008) are indeed dominated by two-dimensionality. This correspondence lasts up to a distance of eight water depths behind the wave trough.
The computations in this section illustrate the convergence of the method where the vorticity and the distance between the vortices are evaluated. The computed and measured averaged separation distance at water depths behind the trough correspond. The vorticity strength is computed, where this motion property was not measured in the laboratory. The calculated amplitude and wave speed were both converged. These findings respond to research points of the introduction.
As seen in section 3.1.1, the wave-induced velocity field interacts with the bottom, and vortices are being ejected from the bottom boundary layer (BBL). In this section we explore how the wave-induced velocity field moves a cloud of tracer particles, initially found in the BBL, upstream of the ISW. The tracer particles are located approximately between and before time zero, and the simulations are conducted with wave Reynolds number in the range (Table 1).
In our numerical simulations, we can only generate one wave and not a train of waves as may be observed in the coastal ocean (e.g., Quaresma et al., 2007; Zulberti et al., 2020). We let the wave intercept the tracer particle cloud twice, first during the propagation along the undisturbed fluid and second as a reflected wave from the right end of the tank. When the wave becomes a reflected wave, the horizontal velocity changes the sign, while the vertical velocity maintains the sign. During wave passage one, the time runs from 0 to and for Strat.1 and Strat.2, respectively, and is defined as the transit until the wave encounters the right end wall. Then the wave passage two stage starts and endures until and for Strat.1 and Strat.2, respectively.
The wave propagating from left to right induces a velocity of the lower fluid layer in the opposite direction of the wave propagation, pushing the fluid backward. The vertical velocity in the forward part of the wave is also negative, pushing the fluid downward. When the wave encounters the cloud of tracer particles, the tracer particles are first driven backward, approximately a horizontal distance of for Strat. 1 (visualized in in Figures 5, 6) and for Strat. 2 (results are not shown). The figures display the traces of random tracer particles out of the tracer particles implemented. The colors are constant according to the vertical position of tracer particles before time zero.
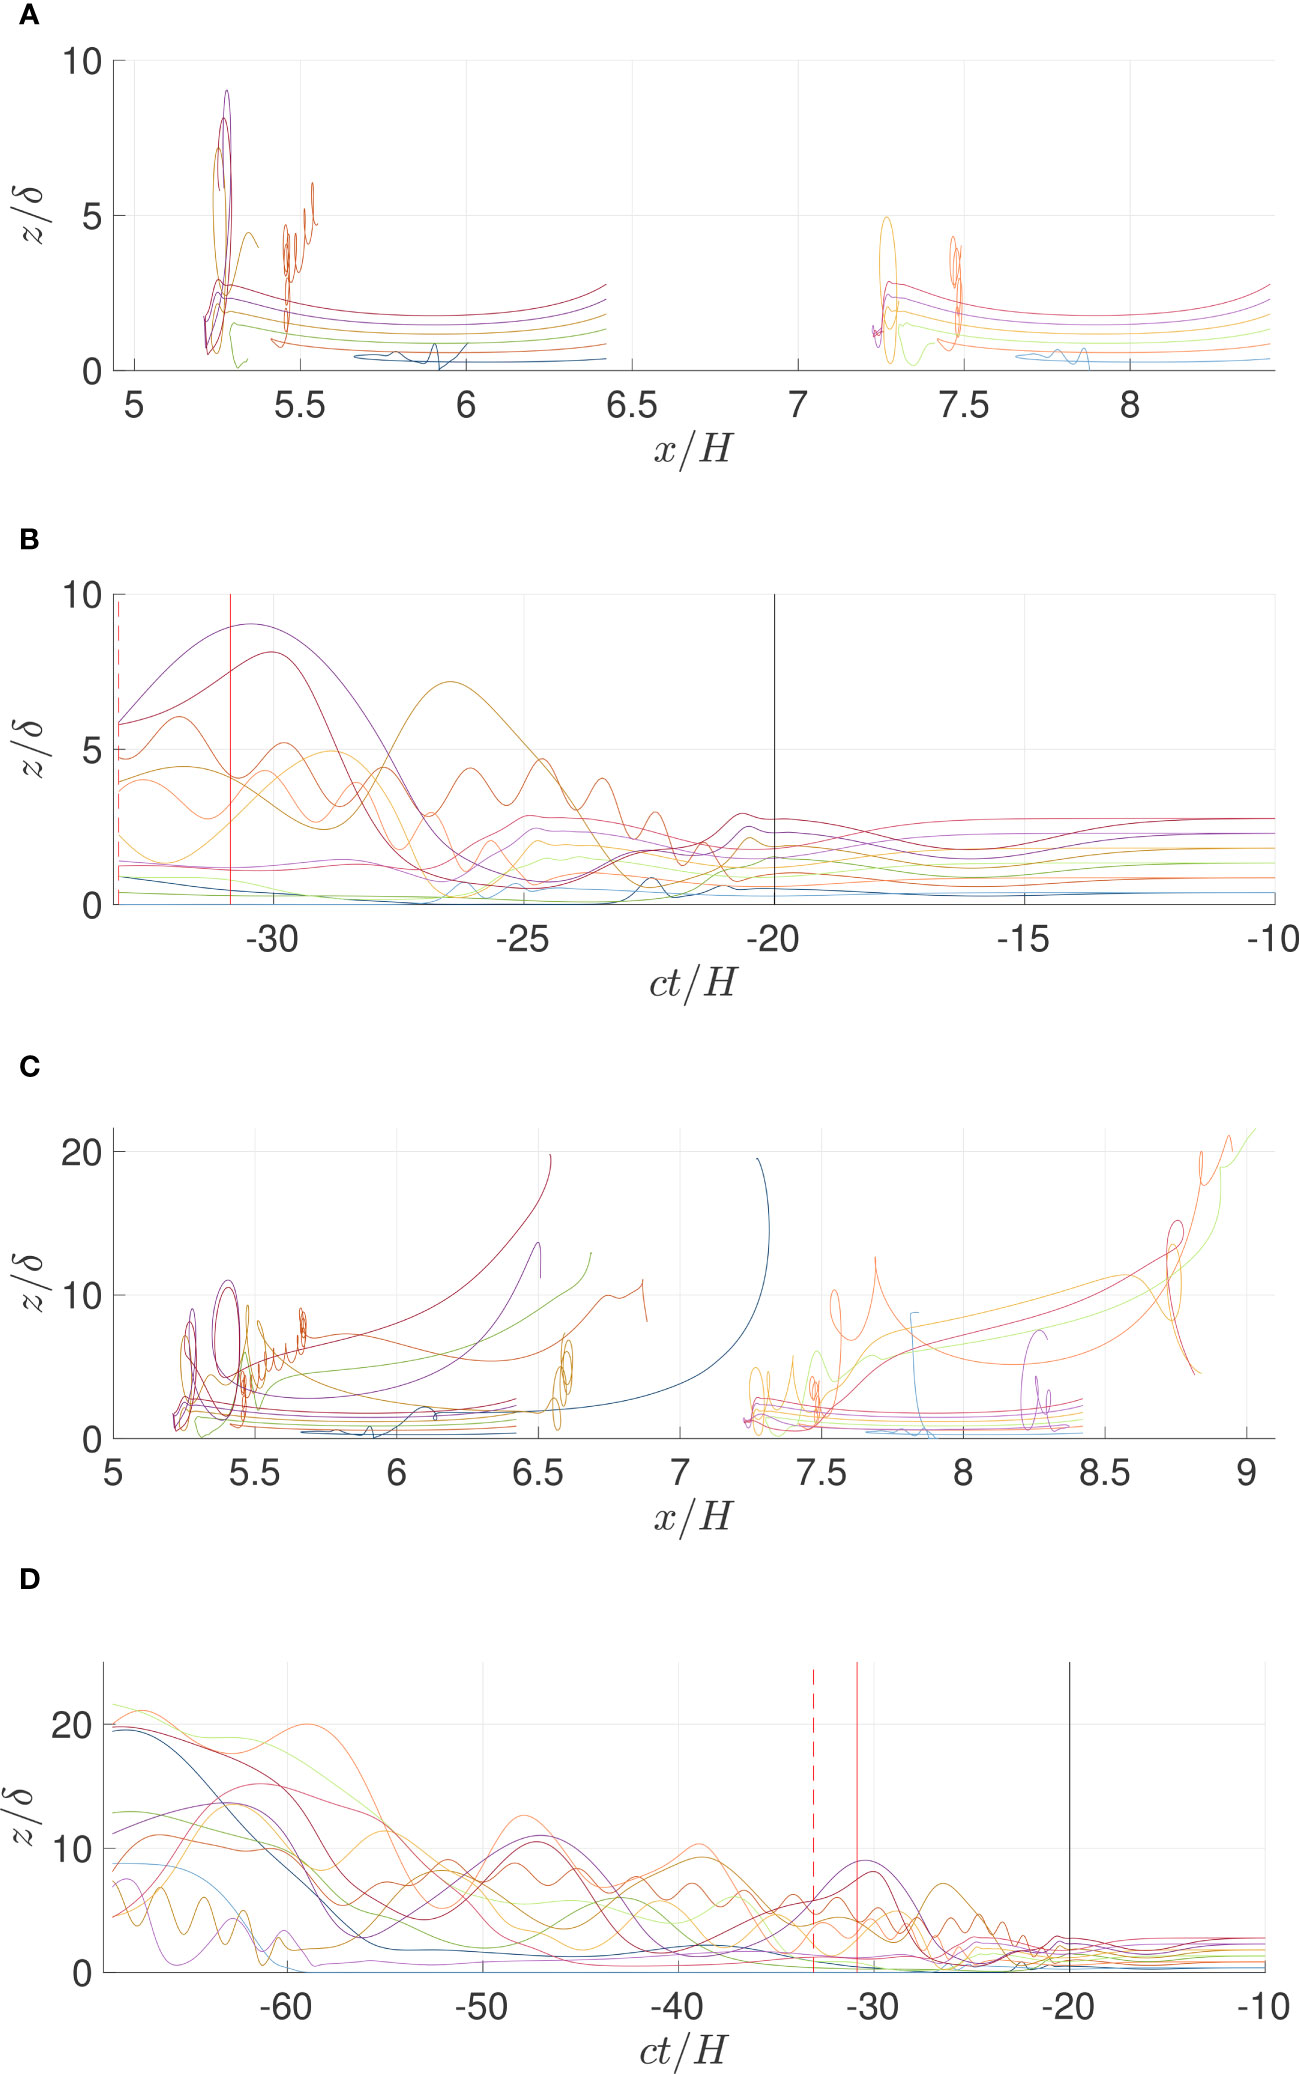
Figure 5 Tracer particle trajectories for Rew = 5.9 · 104. (A, C) Fixed frame of reference. (B, D) Frame of reference following the wave. In (A, B) wave passage one, tc0/H = 0 − 19.6. In (C, D) wave passage two, tc0/H = 0 − 40.7.
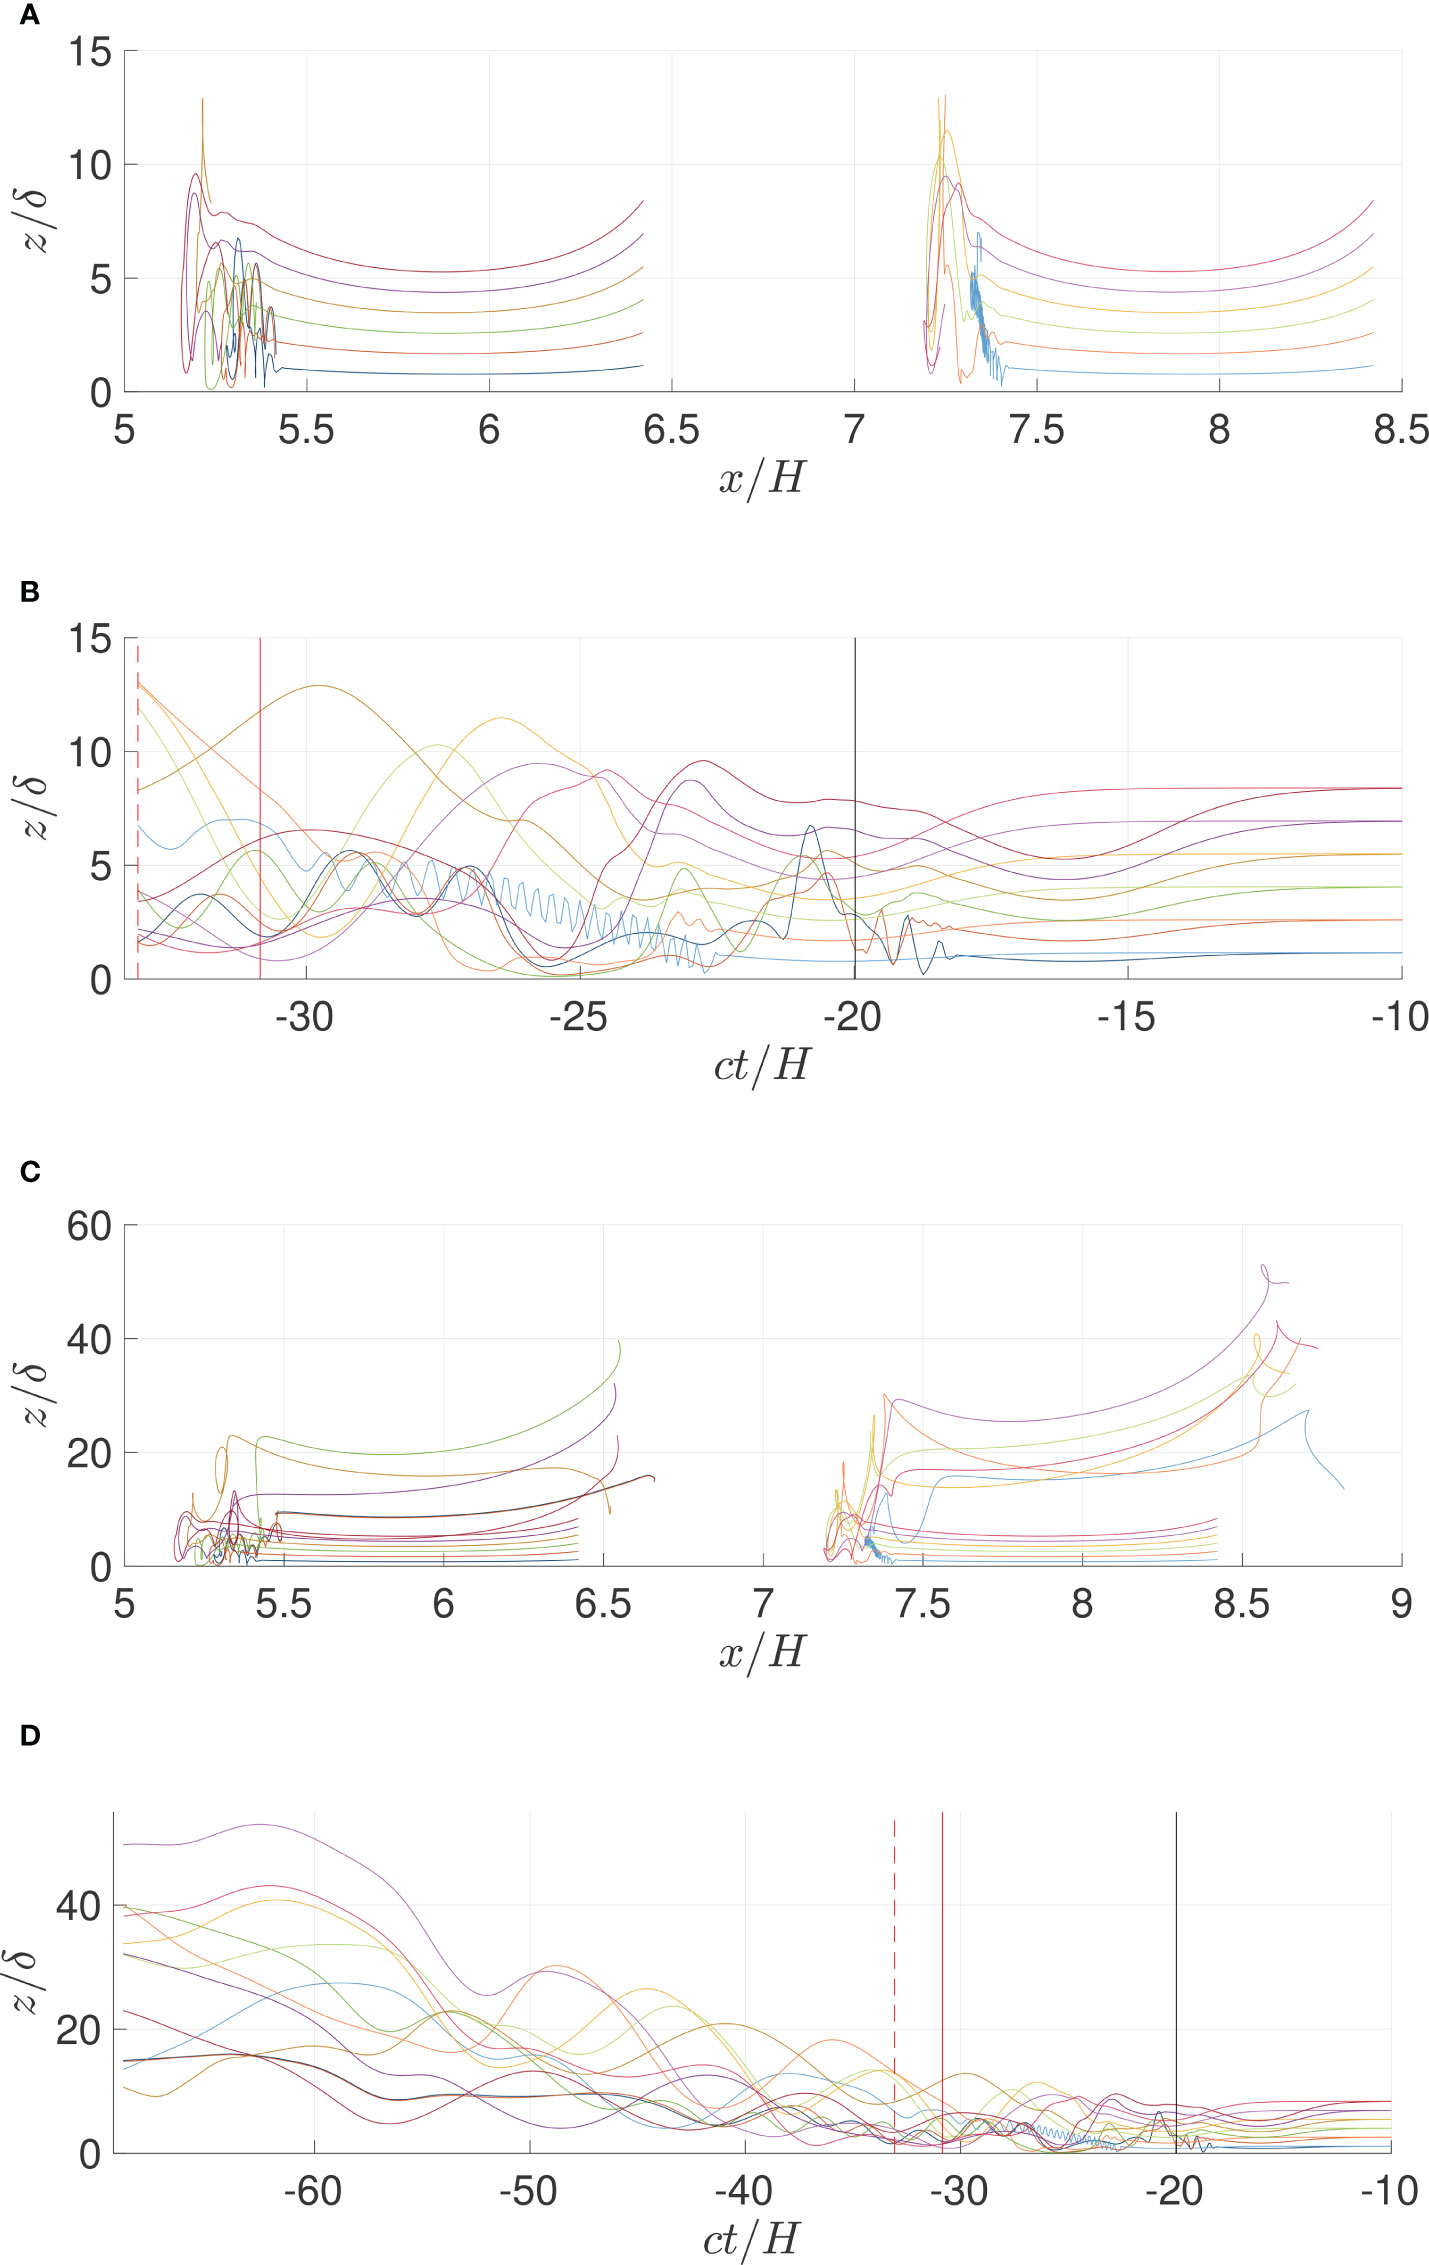
Figure 6 Same as Figure 3 (A–D) but with Rew = 5.9 · 105.
The trajectory of the tracer particles has the same shape as the wave displacement before the vortices intercept the tracer particles’ movement. The tracer particles are then displaced vertically. The vortices intercept the cloud of the leftmost tracer particles when the wave trough is at approximately when , see Figures 5A, B. The integration illustrates how the displacements and paths depend on the location of the tracer particle before time zero.
Figures 5B, D illustrate the trajectories in a reference frame that follows the wave. The time period illustrated lies between to . In the figures, the black vertical line indicates when the wave trough is at . The solid red line is a time later and shows the position at this time. The dashed red line indicates when the wave begins its encounter with the wall.
The trajectories at the beginning are almost horizontal, with some small fluctuations. The vortices behind the trough intercept the tracer particles, where the tracers acquire an oscillatory behavior of a range of wavelengths. They are in the range from (Run ) up to (Run ). The shortest wavelengths are in the same order of magnitude as the separation distance of the vortices generated behind the trough when the instability saturates. Run exhibits very short wavelengths and a wavelength of .
The wave propagates to the end of the tank and returns. The wave intercepts again with the group of tracer particles, visualized in Figures 5, 6, plots C and D. During the second passage, the tracer particles are moved further upward. The vertical position, relative to the boundary layer , depends on the Reynolds number. In Figure 6C, the uppermost position after wave passage one is and after wave passage two.
Figures 7 and 8 show paths due to tracer particles. Plots A and C display that the downstream vortices transport the tracer particles upwards and out of the boundary layer. In plots b and d, the second wave encounter and its induced instabilities move the tracer particles even higher.
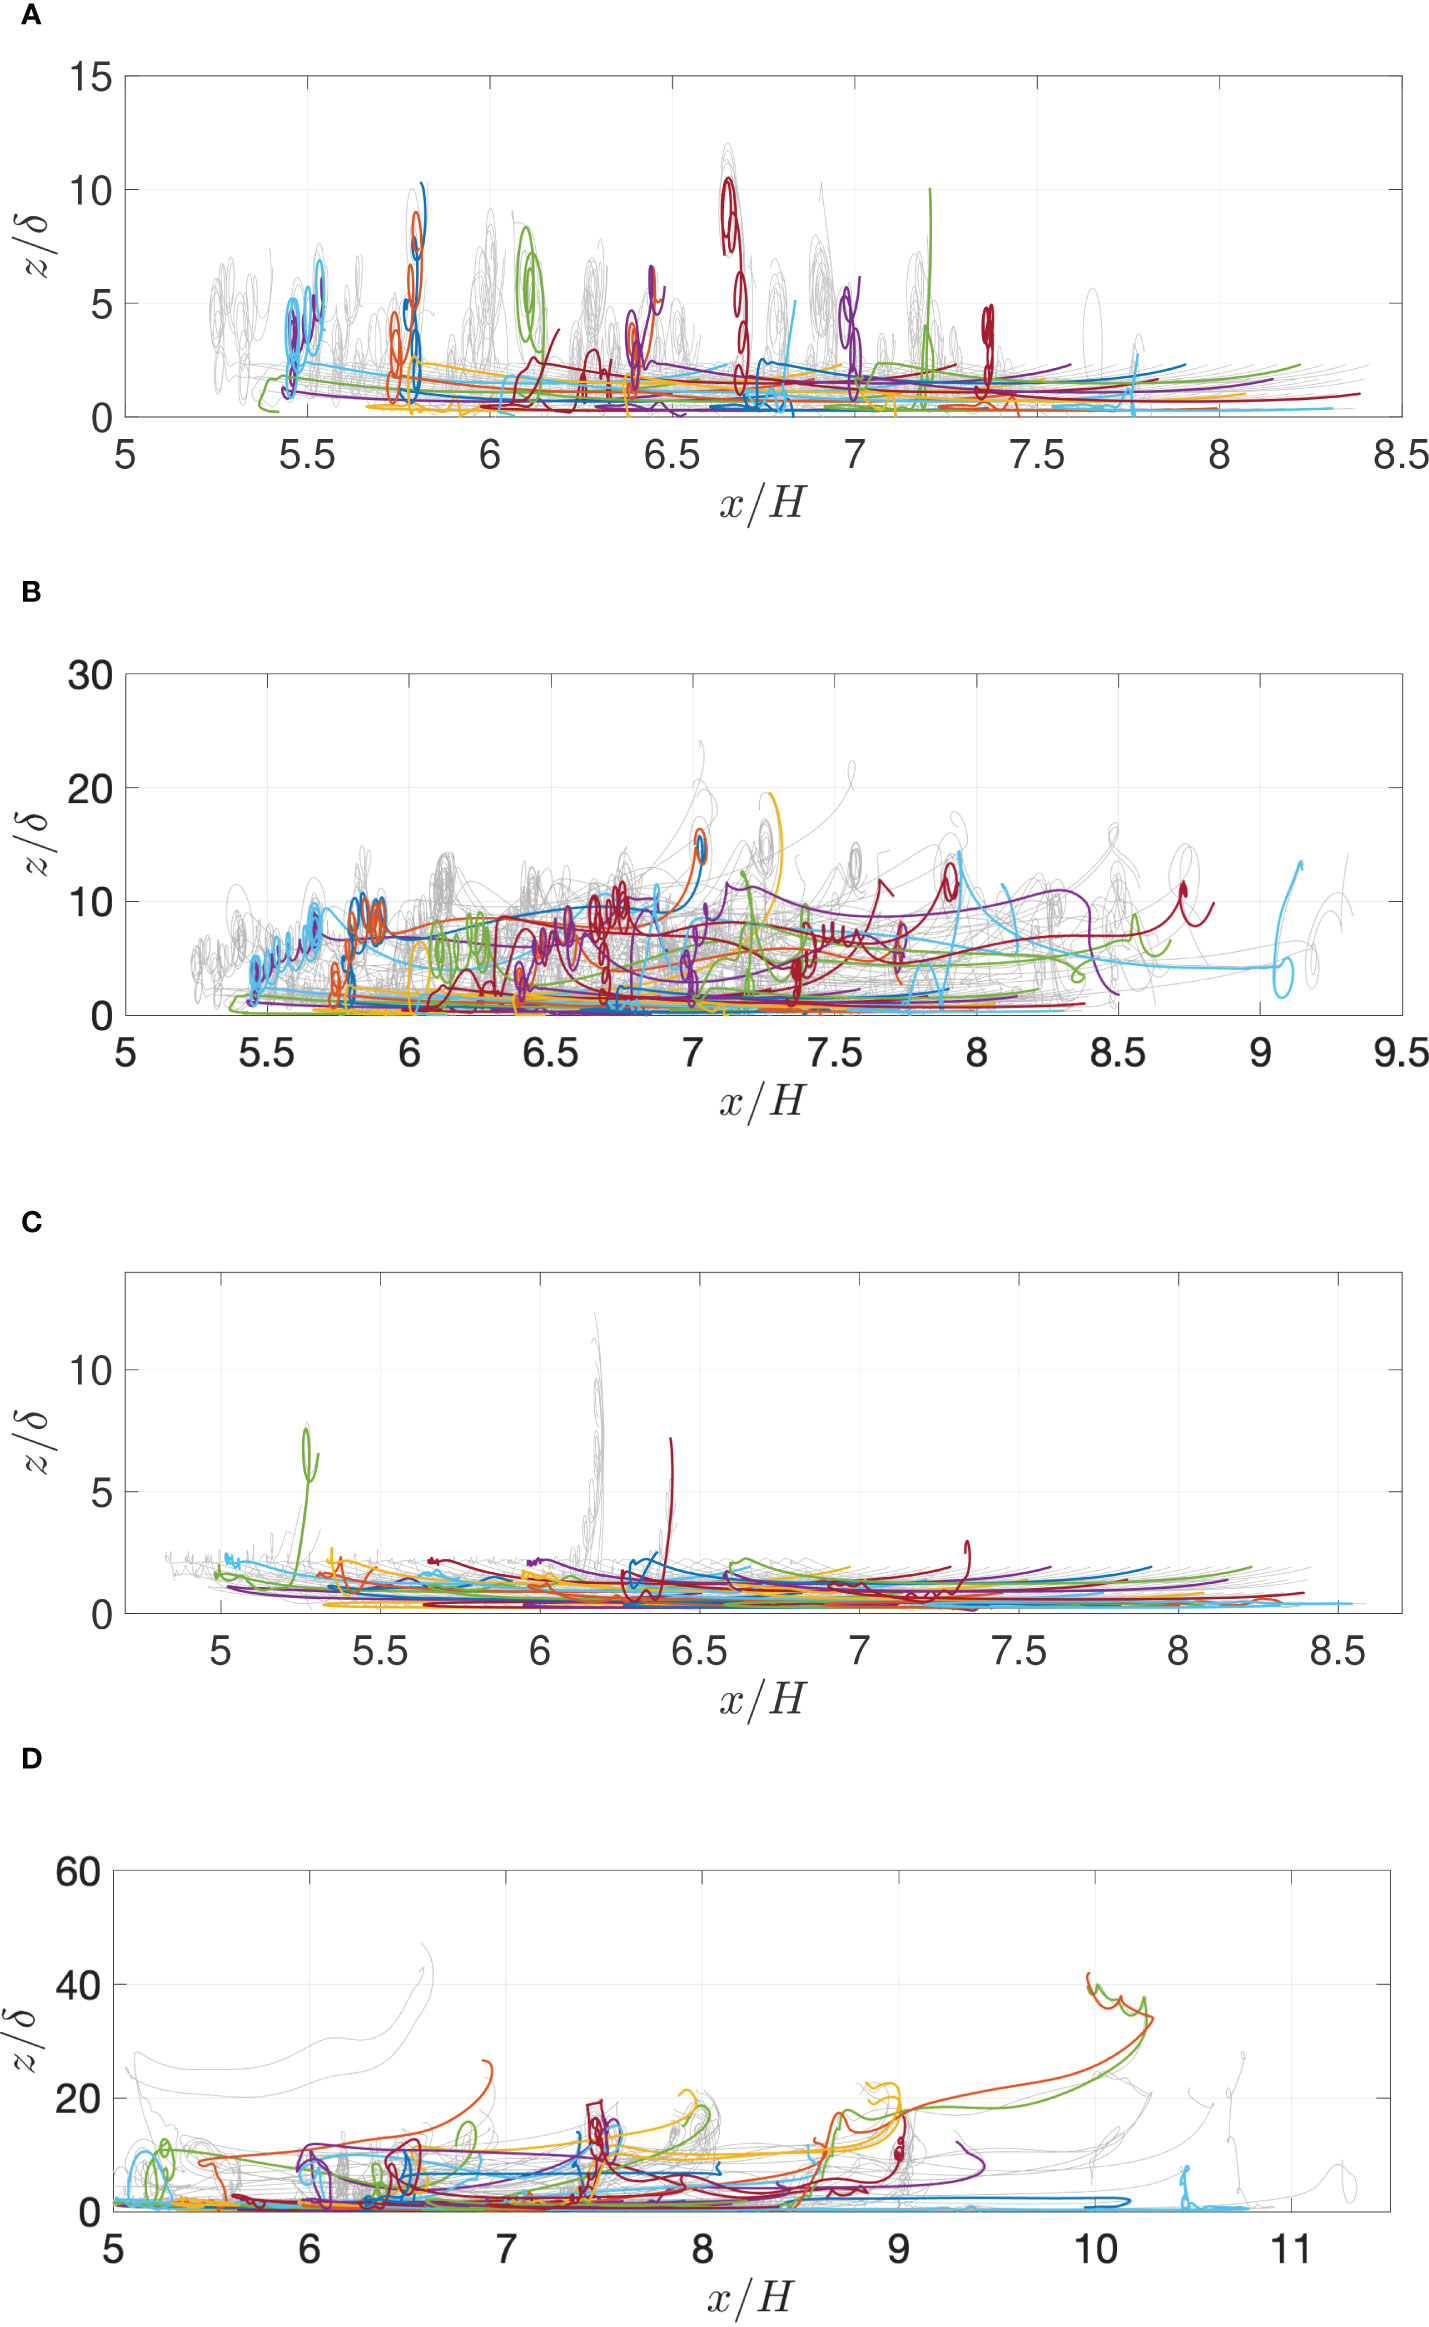
Figure 7 Tracer particle trajectories of 128 particles. (A) Rew = 5.9 · 104. Wave passage one, tc0/H = 0 − 19.6. (B) Rew = 5.9 · 104. Wave passage two, tc0/H = 0 − 40.7. (C) Rew = 6.5 · 104. Wave passage one, tc0/H = 0 − 21.0. (D) Rew = 6.5 · 104. Wave passage two, tc0/H = 0 − 44.7.
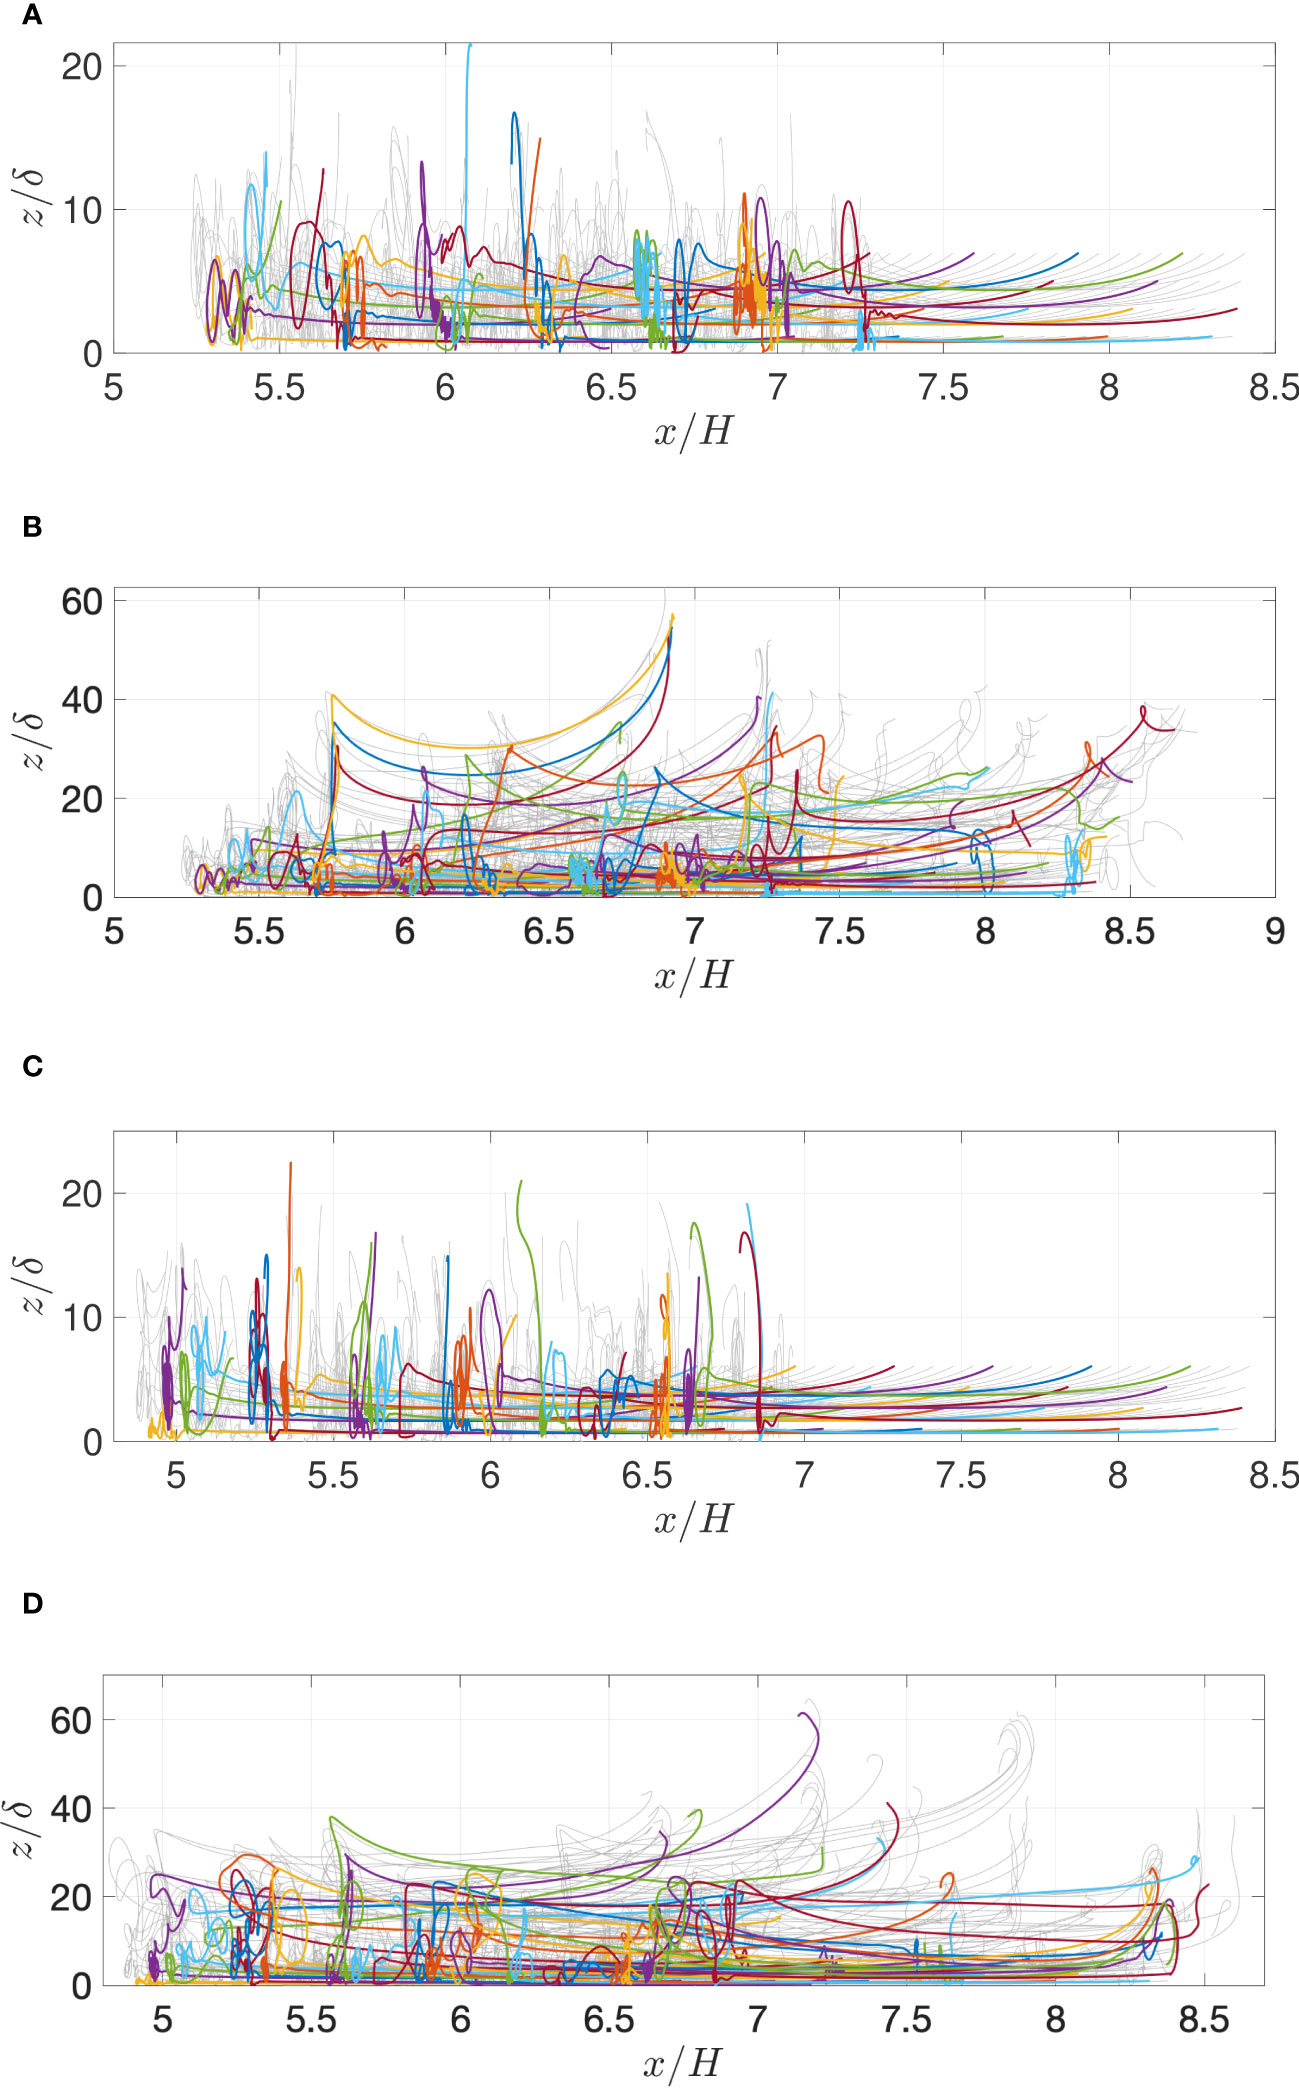
Figure 8 Same as Figure 7 but with (A) and (B) Rew = 5.9 · 105. (C, D) Rew = 6.5 · 105.
The terminal position of a number of particles are then discussed (Figure 9). The 50th (median) and 90th percentile of the vertical tracer particle position are evaluated. For the 90th percentile, the vertical height increases by a factor of three between passage one and passage two. The vertical displacement of the 50th percentile is similar, although there are some large variations at the moderate (Table 2). For the same percentile, the height relative to increases by a factor of , approximately, when the wave Reynolds number increases by a factor of . The horizontal position of the tracer particle cloud is negative during the first passage and positive during the second passage due to the reflected wave. The net horizontal displacement of the tracer particle cloud is approximately zero. The red lines in the figure indicate the tracer particles’ left and right most horizontal seeded position before time zero.
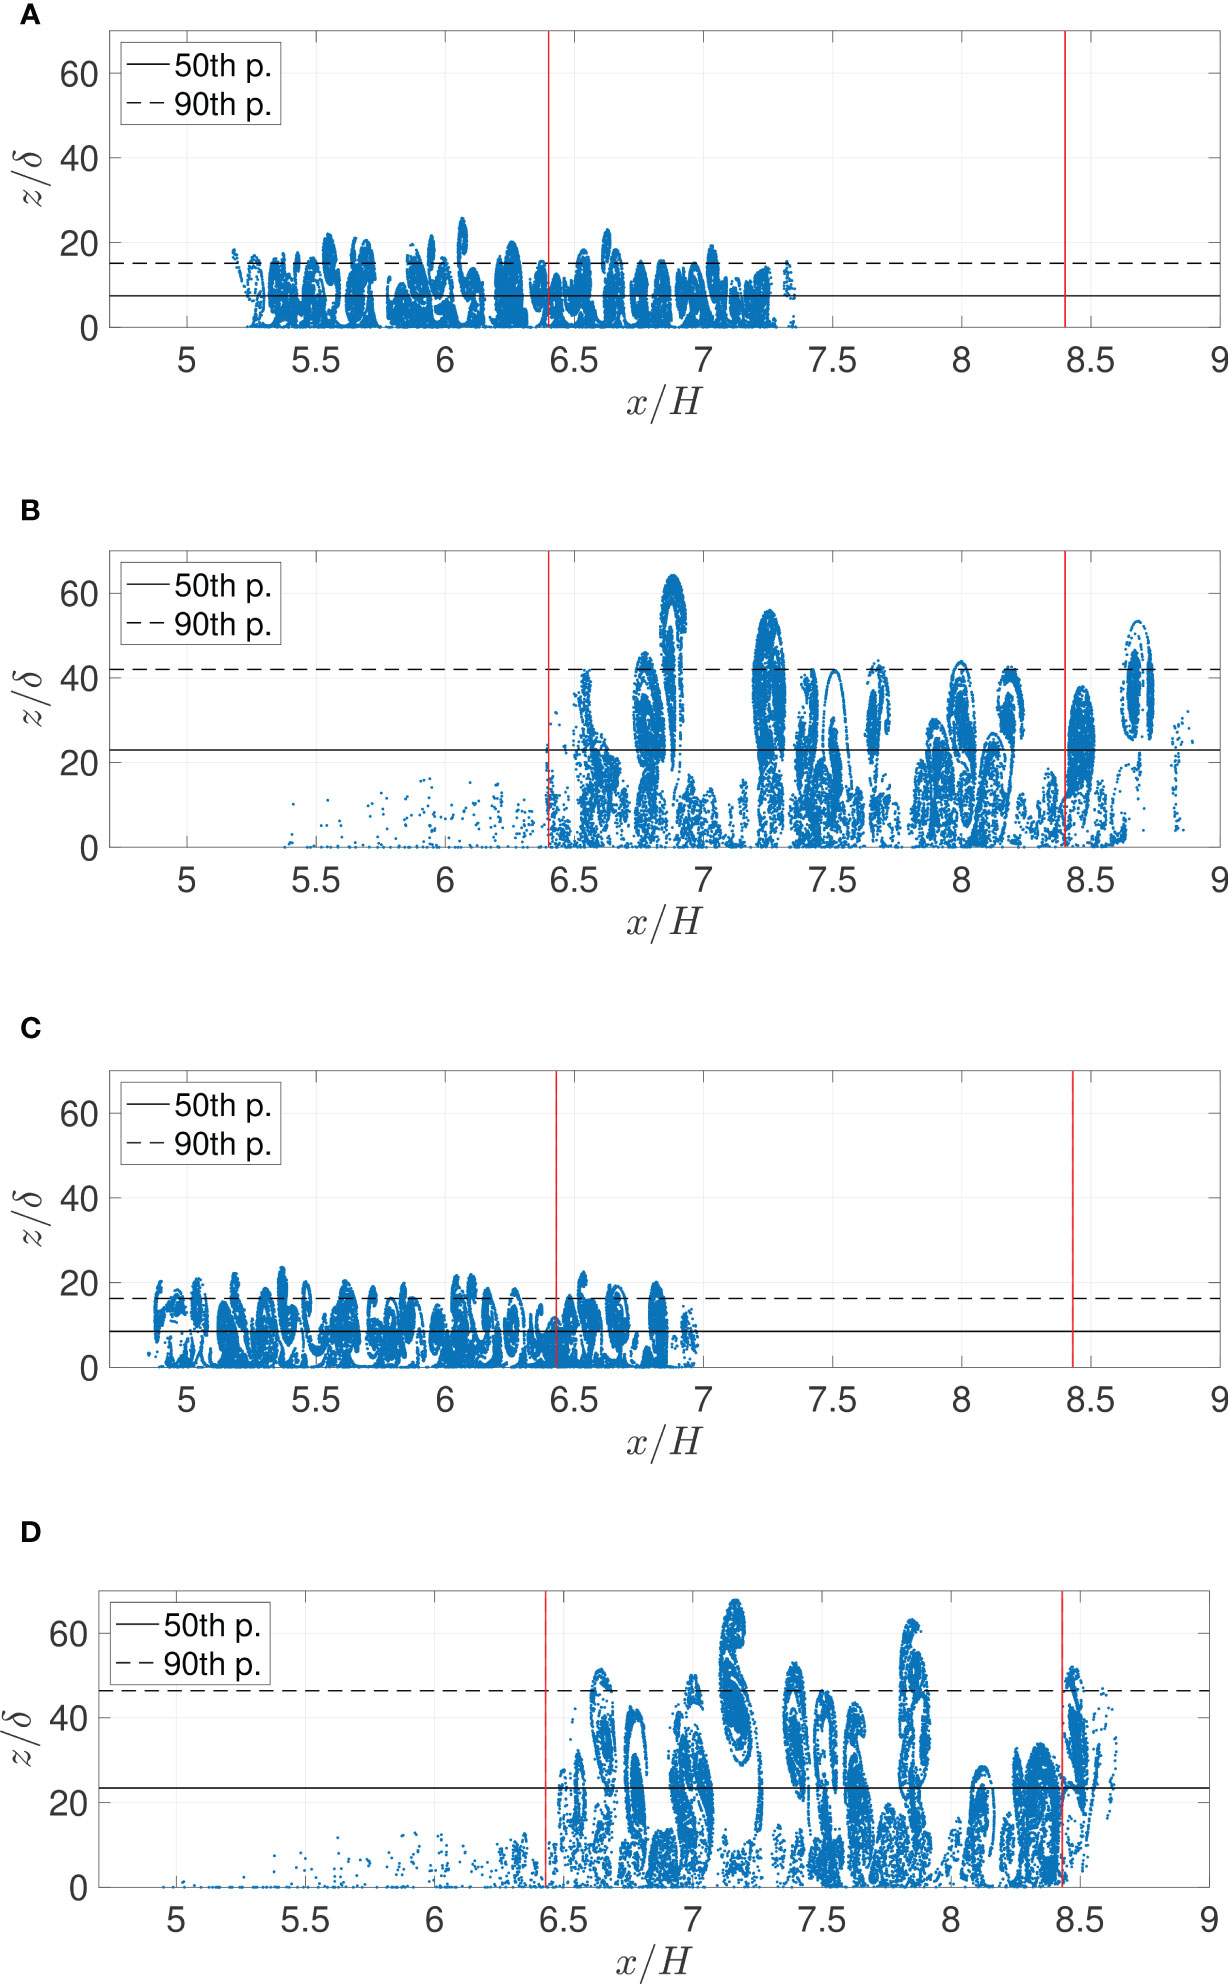
Figure 9 Snapshots of the Lagrangian tracer particle density field. The black solid line indicates the 50th percentile (median depth) of the tracer particles vertical height and the black dashed line indicates the layer containing up to 90% of all of the tracer particles. The red lines indicate the tracer particles’ left and right most horizontal seeded position before time zero. (A) Rew = 5.9 · 105. Wave passage one, tc0/H = 19.6. (B) Rew = 5.9·105. Wave passage two, tc0/H = 40.7. (C) Rew = 6.5·105. Wave passage one, tc0/H = 21.0. (D) Rew = 6.5 · 105. Wave passage two, tc0/H = 44.7.

Table 2 The vertical location corresponding to the 50th and 90th percentiles of the tracer particle density field for wave passage one and two.
The probability density function (PDF) of the tracer particles’ vertical position as a function of time is illustrated in Figure 10. The black line indicates the initial uppermost vertical position of the tracer particles. The blue line indicates the tracer particle distribution after wave passage one. The red line provides the tracer particle distribution when the wave has intercepted the cloud of tracer particles for the second time. After passage one, tracer particle distribution is below , and after passage two, below for the large . The similar numbers for the smaller are and , respectively.
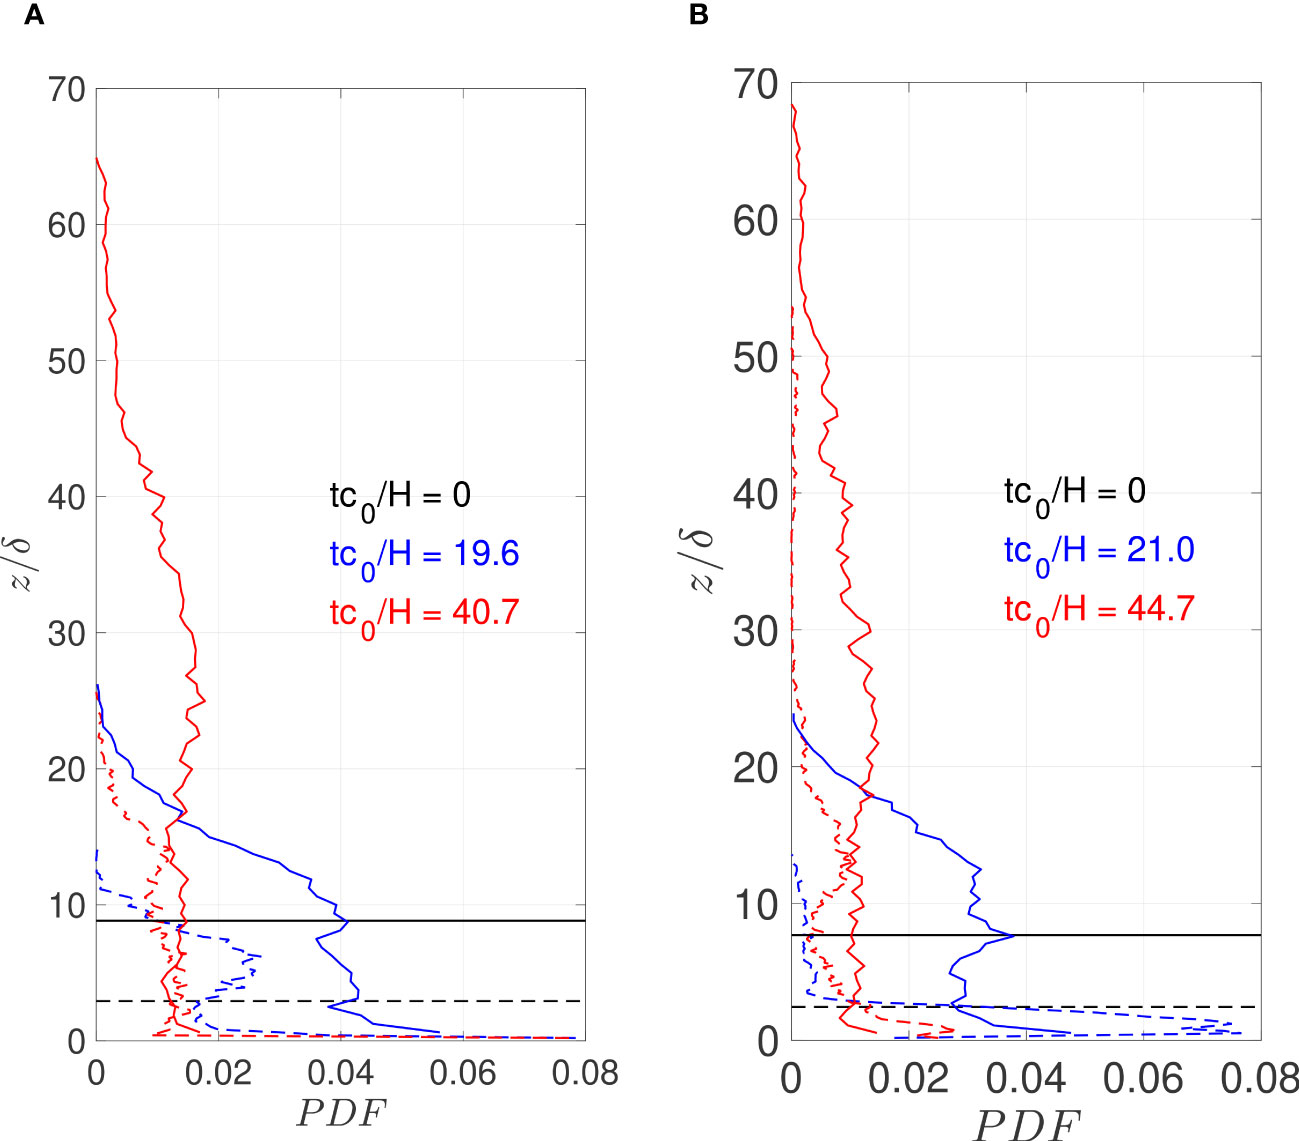
Figure 10 Probability distribution function of the vertical position of the tracer particles relative to the boundary layer thickness δ. (A) Rew = 5.9 · 104 (dashed lines) and 5.9 · 105 (solid lines). Black line, tc0/H = 0; blue line, tc0/H = 19.6 (wave passage one); red line, tc0/H = 40.7 (wave passage two). (B) Rew = 6.5 · 104 (dashed lines) and 6.5 · 105 (solid lines). Black line, tc0/H = 0; blue line, tc0/H = 21.0 (wave passage one); red line, tc0/H = 44.7 (wave passage two).
The results imply that the particles are found below a vertical level of approximately after the second passage for both Reynolds numbers.
Quaresma et al. (2007) conducted a field study of internal waves propagating over the northern shelf of Portugal over a canyon head. The local water depth was measured to be m with a middle depth of the pycnocline of . The wave amplitudes were in the range . The measured local sediment concentration mainly consists of sandy sediments () of a settling velocity of cm . The remaining sediments, silt and clay components with diameters in the range m were found to remain suspended. Their measurements showed that only the strongest waves were capable of suspending the sediments, contributing to a summer bottom nepheloid layer (BNL) of m thickness, corresponding to .
We note that the vertical height of the tracer particles after wave passage two was found to be approximately in our numerical computations and was insensitive to the . This tracer particle height is in correspondence with the height of the BNL measured by Quaresma et al. (2007).
Quaresma et al. (2007) also measured a strong local sediment concentration up to a height of below the leading wave. Our present computation does not exhibit such an effect.
Zulberti et al. (2020) conducted field observations of nonlinear internal waves over a low-gradient topography on Australia’s Northwest Shelf. They observed that large-amplitude internal waves of depression greatly enhanced the sediment transport. From sediment grab samples, they deduced that the bed sediment was of typical silt. The settling velocity of silt particles of density kg and diameter of m, may be calculated to be cm . They measured sediment resuspension to exceed m () beneath the leading wave of amplitude . However, they measured a density gradient at this level, limiting the advancement of bottom sediments. A direct correspondence between the measurements and the present computations are not realistic because we have not included a weak stratification layer at the bottom. One of the factors driving the resuspension mechanism in the measurement of Zulberti et al. (2020), was a vertical pumping mechanism associated with the compression underneath the wave trough followed by a subsequent expansion of the mixing-layer at the bottom. This effect is included in our simulations, however.
Finally, the subjects discussed in these result sections 3.2 and 3.3 include the tracer particles, the vertical tracer particle displacement during the wave encounters, as well as comparison to observations in the field, and response to the research subject , , and as presented in the introduction.
By a 2D laminar method, the vortex formation and the tracer particle motion in the bottom boundary layer of the water column of a fluid layer, driven by large internal solitary waves of depression, are calculated. The motion in a numerical wave tank for internal waves is simulated. Comparison is made to a set of available laboratory observations, and a very good match between the model and the laboratory measurements is found. Convergence of the numerical calculation of the vortex formation is documented.
A cloud of tracer particles in the bottom boundary layer obtains vertical displacements because of the wave-driven vortices. The paths exhibit the following properties: when the wave approaches the tracer particle cloud, the tracer particles are first moved horizontally in the opposite direction of the wave. Behind the wave trough, the tracer particles are transported vertically in the water column. The wave is reflected and returns to the tracer particle cloud. At the second passage, the tracer particles are moved in the opposite direction of the wave propagation. The vortices behind the trough transport the tracer particles further vertically. The tracer particles are found below a vertical level of approximately after the second passage, for the Reynolds number in the range . The net horizontal transport of the tracer particle cloud is approximately zero.
We have compared the results to available field observations by Quaresma et al. (2007), obtained at the northern shelf of Portugal, where the local depth was m. The wave amplitude was in the range , and a summer bottom nepheloid layer was measured to be m, corresponding to . Our computational results are in a fair match with that observation. We note that the processes in the computations at the moderate scale and the processes at the field scale may not be directly similar, however. In another field measurement by Zulberti et al. (2020), large amplitude internal waves of depression were found to resuspend the sediments at the sea bed greatly. In their measurements, a density gradient at m () above the sea bottom was found to limit the vertical advancement of the bottom sediments. Direct correspondence to the present computations is not realistic.
The raw data supporting the conclusions of this article will be made available by the authors, without undue reservation.
TE, JG, and JS contributed to the conception and methodology of the study. TE and JS wrote the code. TE performed the processing of the data. Visualization by TE and JG. TE wrote the first draft of the manuscript. TE and JG wrote the submitted manuscript. All authors contributed to the article and approved the submitted version.
The funding by the Research Council of Norway (Ecopulse, NFR300329) is gratefully acknowledged.
The discussions with Dr. Johannes Röhrs are acknowledged. The computations were performed on the Norwegian Research and Education Cloud (NREC), using resources provided by the University of Bergen and the University of Oslo. http://www.nrec.no/. The authors would like to acknowledge the referees for helpful comments.
The authors declare that the research was conducted in the absence of any commercial or financial relationships that could be construed as a potential conflict of interest.
All claims expressed in this article are solely those of the authors and do not necessarily represent those of their affiliated organizations, or those of the publisher, the editors and the reviewers. Any product that may be evaluated in this article, or claim that may be made by its manufacturer, is not guaranteed or endorsed by the publisher.
Aghsaee P., Boegman L., Diamessis P. J., Lamb K. G. (2012). Boundary-layer-separation driven vortex shedding beneath internal solitary waves of depression. J. Fluid Mech. 690, 321–344. doi: 10.1017/jfm.2011.432
Bell J. B., Colella P., Glaz M. G. (1989). A second-order projection method for the incompressible Navier-Stokes equations. J. Comp. Phys. 85, 257–283. doi: 10.1016/0021-9991(89)90151-4
Boegman L., Stastna M. (2019). Sediment resuspension and transport by internal solitary waves. Annu. Rev. Fluid Mech. 51, 129–154. doi: 10.1146/annurev-fluid-122316-045049
Bogucki D., Dickey T., Redekopp L. G. (1997). Sediment resuspension and mixing by resonantly generated internal solitary waves. J. Phys. Oceanogr. 27, 1181–1196. doi: 10.1175/1520-0485(1997)027(1181:SRAMBR)2.0.CO;2
Bogucki D. J., Redekopp L. G. (1999). A mechanism for sediment resuspension by internal solitary waves. Geophys. Res. Lett. 26, 1317–1320. doi: 10.1029/1999GL900234
Bourgault D., Blokhina M. D., Mirshak R., Kelley D. E. (2007). Evolution of a shoaling internal solitary wave train. Geophys. Res. Lett. 34, L03601–1–5. doi: 10.1029/2006GL028462
Carr M., Davies P. A. (2006). The motion of an internal solitary wave of depression over a fixed bottom boundary in a shallow, two-layer fluid. Phys. Fluids 18, 016601. doi: 10.1063/1.2162033
Carr M., Davies P. A., Shivaram P. (2008). Experimental evidence of internal solitary wave-induced 454 global instability in shallow water benthic boundary layers. Phys. Fluids 20, 066603. doi: 10.1063/1.2931693
Carr M., Stastna M., Davies P. A., van de Wal K. J. (2019). Shoaling mode-2 internal solitary-like waves. J. Fluid Mechanics 879, 604–632. doi: 10.1017/jfm.2019.671
Chorin A. (1968). Numerical solution of the Navier-Stokes equations. Math. Comp. 22, 745–762. doi: 10.1090/S0025-5718-1968-0242392-2
Diamessis P. J., Redekopp L. G. (2006). Numerical investigation of solitary internal wave-induced global instability in shallow water benthic boundary layers. J. Phys. Oceanogr. 36, 784–812. doi: 10.1175/JPO2900.1
Fructus D., Carr M., Grue J., Jensen A., Davies P. A. (2009). Shear-induced breaking of large internal solitary waves. J. Fluid Mech. 620, 1–29. doi: 10.1017/S0022112008004898
Fructus D., Grue J. (2004). Fully nonlinear solitary waves in a layered stratified fluid. J. Fluid Mechanics 505, 323–347. doi: 10.1017/S0022112004008596
Grue J., Jensen A., Rusås P.-O., Sveen J. K. (1999). Properties of large-amplitude internal waves. J. Fluid Mech. 380, 257–278. doi: 10.1017/S0022112098003528
Helfrich K. R., Melville W. K. (2006). Long nonlinear internal waves. Annu. Rev. Fluid Mech. 38, 395–425. doi: 10.1146/annurev.fluid.38.050304.092129
Lamb K. G. (2014). Internal wave breaking and dissipation mechanisms on the continental slope/shelf. Annu. Rev. Fluid Mech. 46, 231–254. doi: 10.1146/annurev-fluid-011212-140701
López-Herrera J. M., Popinet S., Castrejón-Pita A. A. (2019). An adaptive solver for viscoelastic incompressible two-phase problems applied to the study of the splashing of weakly viscoelastic droplets. J. Non-Newtonian Fluid Mech. 264, 144–158. doi: 10.1016/j.jnnfm.2018.10.012
Mostert W., Deike L. (2020). Inertial energy dissipation in shallow-water breaking waves. J. Fluid Mechanics 890, A12. doi: 10.1017/jfm.2020.83
Necker F., Härtel C., Kleiser L., Meiburg E. (2005). Mixing and dissipation in particle-driven gravity currents. J. Fluid Mechanics 545, 339–372. doi: 10.1017/S0022112005006932
Popinet S. (2003). Gerris: a tree-based adaptive solver for the incompressible Euler equations in complex geometries. J. Comp. Phys. 190, 572–600. doi: 10.1016/S0021-9991(03)00298-5
Popinet S. (2009). An accurate adaptive solver for surface-tension-driven interfacial flows. J. Comp. Phys. 228, 5838–5866. doi: 10.1016/j.jcp.2009.04.042
Popinet S. (2011). Quadtree-adaptive tsunami modelling. Ocean Dyn. 61, 1261–1285. doi: 10.1007/s10236-011-0438-z
Popinet S. (2015). A quadtree-adaptive multigrid solver for the Serre-Green-Naghdi equations. J. Comp. Phys. 302, 336–358. doi: 10.1016/j.jcp.2015.09.009
Popinet S. (2020). A vertically-Lagrangian, non-hydrostatic, multilayer model for multiscale free-surface flows. J. Comp. Phys. 418, 109609. doi: 10.1016/j.jcp.2020.109609
Popinet S., collaborators (2013–2023)Basilisk. Available at: http://basilisk.fr (Accessed 18.10.2021).
Quaresma L. S., Vitorino J., Oliveira A., da Silva J. (2007). Evidence of sediment resuspension by nonlinear internal waves on the western Portuguese mid-shelf. Mar. Geol. 246, 123–143. doi: 10.1016/j.margeo.2007.04.019
Sakai T., Diamessis P. J., Jacobs G. B. (2020). Self-sustained instability, transition, and turbulence induced by a long separation bubble in the footprint of an internal solitary wave. I. Flow topology. Phys.Rev. Fluids 5, 103801. doi: 10.1103/PhysRevFluids.5.103801
Sanderse B., Veldman A. (2019). Constraint-consistent Runge–Kutta methods for one-dimensional incompressible multiphase flow. J. Comput. Phys. 384, 170–199. doi: 10.1016/j.jcp.2019.02.001
Stastna M., Lamb K. G. (2008). Sediment resuspension mechanisms associated with internal waves in coastal waters. J. Geophys. Res. 113, C10016–1–19. doi: 10.1029/2007JC004711
Sveen J. K., Guo Y., Davies P. A., Grue J. (2002). On the breaking of internal solitary waves at a ridge. J. Fluid Mech. 469, 161–188. doi: 10.1017/S0022112002001556
van Hooft J. A., Popinet S., van Heerwaarden C. C., van der Linden S. J. A., de Roode S. R., van de Wiel B. J. H. (2018). Towards adaptive grids for atmospheric boundary-layer simulations. Boundary-Layer Meteorol. 167, 421–443. doi: 10.1007/s10546-018-0335-9
Zulberti A., Jones N. L., Ivey G. N. (2020). Observations of enhanced sediment transport by nonlinear internal waves. Geophys. Res. Lett. 47, 1–11. doi: 10.1029/2020GL088499
The discretization in time is staggered and second-order accurate. The advection term is calculated using the Bell-Colella-Glaz scheme Bell et al., 1989. The unsplit, upwind scheme reads:
where = (∇u+(∇u)T)/2) is the strain rate tensor, where ()T denotes transpose. The index n indicates time tn, and likewise for n+1, n+1/2, n−1, etc.
An equivalent advection equation of the volume fraction replaces the advection equation of the density. The density and viscosity are defined using the averages =(ρ1−ρ2)+ρ2 and μ=[(1/μ1−1/μ2)+1/μ2]−1, where ρ1, μ1, and ρ2, μ2 are the densities and dynamic viscosities of the upper and lower fluid layers, respectively. The field is constructed by applying a smoothing spatial filter to f. This is accomplished by averaging the four corner values of f obtained from the cell-centered values by bilinear interpolation. The fluid properties are updated by:
By using a classical time-splitting projection method Chorin, 1968, the system is further simplified:
The velocity at the new time is found by combining equations 13 and 18. Hence,
The equation for the pressure is found by requiring
This leads to a Poisson equation for the pressure
The time step in each iteration is controlled by the Courant-Friedrich-Levy CFL condition.
The quadtree structure can be seen as a family tree. An important parameter is the level N of a given cell of the tree. The root cell is that corresponding to N=0, from which the cells at the next level hang down. A parent cell at (level N) can have zero or four children cells, where the children are at level N+1. If the cell has no children it is called a leaf cell. The size of a cell is characterized by its level N, where it is located. Hence, the grid size of the cells at that level is ΔN=L/2N. The cells are square finite volume cells, providing ΔN=Δx=Δz, where (x,z) are the horizontal and vertical coordinates.
Further, a few restrictions apply. For example, the maximum difference of the level between two neighboring leaf cells is one; each cell has a direct neighbor at the same level; the level increases by one for each successive generation; the grid can be refined and coarsened dynamically adapted as the simulation proceeds, where this occurs at an affordable computational cost. We have used two central representations of the numerical grid, a non-adaptive static grid mesh and an adaptive mesh.
1. “Refine”:
Refine static grid refinement is referred to when the simulation is run with the same level of refinement in the mesh hierarchy.
2. “Adapt”:
The adaptive mesh hierarchy enables increase/decrease of the grid resolution where necessary. Such an approach can significantly reduce the memory required to obtain a given level of accuracy. The algorithm is based on the estimation of the numerical errors in the representation of the spatially discretized fields. This analysis is used to determine which grid cells require refinement, and wherein the domain cells can be coarsened. Following van Hooft et al. (2018) and López-Herrera et al. (2019), a scalar field gN discretized at grid level N, can be coarsened one level down utilizing a downsampling operation denoted by restriction, gN−1=restriction(gN). Next, the upsampled (or prolongated) operator, which upsamples the coarser field distribution, gN−1, to the original level, =prolongation(gN−1), is defined. The prolongation procedure is second-order accurate. Noting that in general gN≠, a comparison provides an estimation of the absolute discretization error, ζN=|gN−|. A particular cell i with level N in which the error is , will be,
• refined if >ζ,
• coarsened if <2ζ/3,
• remain unchanged otherwise,
where ζ is called the refinement criterion and is the error threshold set in the numerical scheme. The “refine” and “adapt” procedures are used in the present study. Further details of the algorithm can be found in Popinet (2003) and van Hooft et al. (2018).
Near the resolution boundaries, ghost cells are generated as virtual cells. This allows for simple Cartesian stencil operations, for the typically uneven grid at the boundary. The ghost cells have neighbours with the same refinement level N, whereas their values are defined by interpolating the original field values.
Keywords: internal waves, vortex formation, Lagrangian tracer particle trajectories, probability distribution, upscaling to field dimension
Citation: Ellevold TJ, Grue J and Sletten JS (2023) Tracer particle motion driven by vortex formation in the bottom boundary layer underneath internal solitary waves. Front. Mar. Sci. 10:1155270. doi: 10.3389/fmars.2023.1155270
Received: 31 January 2023; Accepted: 09 August 2023;
Published: 18 September 2023.
Edited by:
Henrik Kalisch, University of Bergen, NorwayReviewed by:
Magda Carr, Newcastle University, United KingdomCopyright © 2023 Ellevold, Grue and Sletten. This is an open-access article distributed under the terms of the Creative Commons Attribution License (CC BY). The use, distribution or reproduction in other forums is permitted, provided the original author(s) and the copyright owner(s) are credited and that the original publication in this journal is cited, in accordance with accepted academic practice. No use, distribution or reproduction is permitted which does not comply with these terms.
*Correspondence: Thea Josefine Ellevold, dGhlYWplbEBtYXRoLnVpby5ubw==
Disclaimer: All claims expressed in this article are solely those of the authors and do not necessarily represent those of their affiliated organizations, or those of the publisher, the editors and the reviewers. Any product that may be evaluated in this article or claim that may be made by its manufacturer is not guaranteed or endorsed by the publisher.
Research integrity at Frontiers

Learn more about the work of our research integrity team to safeguard the quality of each article we publish.