 Agneta Fransson
 Melissa Chierici
 Mats A. Granskog
 Paul A. Dodd1
 Colin A. Stedmon
95% of researchers rate our articles as excellent or good
Learn more about the work of our research integrity team to safeguard the quality of each article we publish.
Find out more
ORIGINAL RESEARCH article
Front. Mar. Sci. , 20 October 2023
Sec. Marine Biogeochemistry
Volume 10 - 2023 | https://doi.org/10.3389/fmars.2023.1155126
This article is part of the Research Topic The Changing Carbonate Systems in Coastal, Estuarine, Shelf Areas and Marginal Seas View all 7 articles
The waters adjacent to the Nioghalvfjerdsbræ (79 North Glacier, 79NG) are influenced by Greenland Ice Sheet (GrIS) melt, sea-ice meltwater, and waters on the adjacent northeast Greenland shelf (NEGS). We investigated ocean acidification (OA) variables and the role of freshening, primary production, and air-sea CO2 exchange in Dijmphna Sound (DS) and on the NEGS in the summers of 2012 and 2016. The upper 150 m consisted of Polar Water with Arctic origin that was divided into a fresh surface layer (SL<50 m) and a cold halocline layer (CHL, 50 to 150 m). The layer below 150 m was of Atlantic origin. The SL freshwater was larger in 2012 than in 2016, mainly originated from local 79NG (and GrIS) runoff in DS, whereas on the NEGS in both years, it was mainly from sea-ice melt. The lowest aragonite saturation state (ΩAr) of 1.13 was found in the SL in 2012. Biological CO2 drawdown at primary production caused increased ΩAr in SL, which compensated for most of the ΩAr decrease due to the freshwater dilution of carbonate ions reducing total alkalinity, hence preventing corrosive conditions. This was most pronounced near the 79NG front in 2012, where surface stratification was most pronounced coinciding with large glacial meltwater fractions. Freshening decreased ΩAr by 0.4 at the 79NG front was compensated by biological CO2 drawdown by ~0.5. In 2016, a well-mixed water column in DS and NEGS, with dilution by sea-ice meltwater, caused less compensation on ΩAr by biological CO2 drawdown than in 2012. In future with changing climate and changing ocean chemistry, the increased meltwater effects may overcome the alleviating effects of biological CO2 drawdown on OA with unfavorable conditions for calcifying organisms. However, our study also suggests that primary production may be stimulated by stratification from surface meltwater. In addition, Atlantification and subglacial discharge may result in upwelling of inorganic nutrients that could promote primary production.
Substantial thinning, retreat, and melting of the Greenland Ice Sheet (GrIS) and Arctic glaciers have been observed over the last decades (e.g., Rignot et al., 2008; Rignot et al., 2010; Khan et al., 2014) due to climate change, as resulting in changes in the seawater chemical composition and carbonate chemistry (e.g., Meire et al., 2014; Fransson et al., 2015; Henson et al., 2022). Melting of glacier ice by increased presence and warming of the Atlantic water (Atlantification) by marine-terminating glaciers in northeast Greenland fjords have recently been reported (Straneo et al., 2010; de Steur et al., 2014; Gjelstrup et al., 2022), which will further act to accelerate GrIS glacial melting. Dijmphna Sound (DS) is a site of significant meltwater export from the Nioghalvfjerdsbræ (79 North Glacier; 79NG; von Albedyll et al., 2021; Figure 1A) and suitable laboratory for the study of the effects of freshening on the marine carbonate system (or CO2 system).
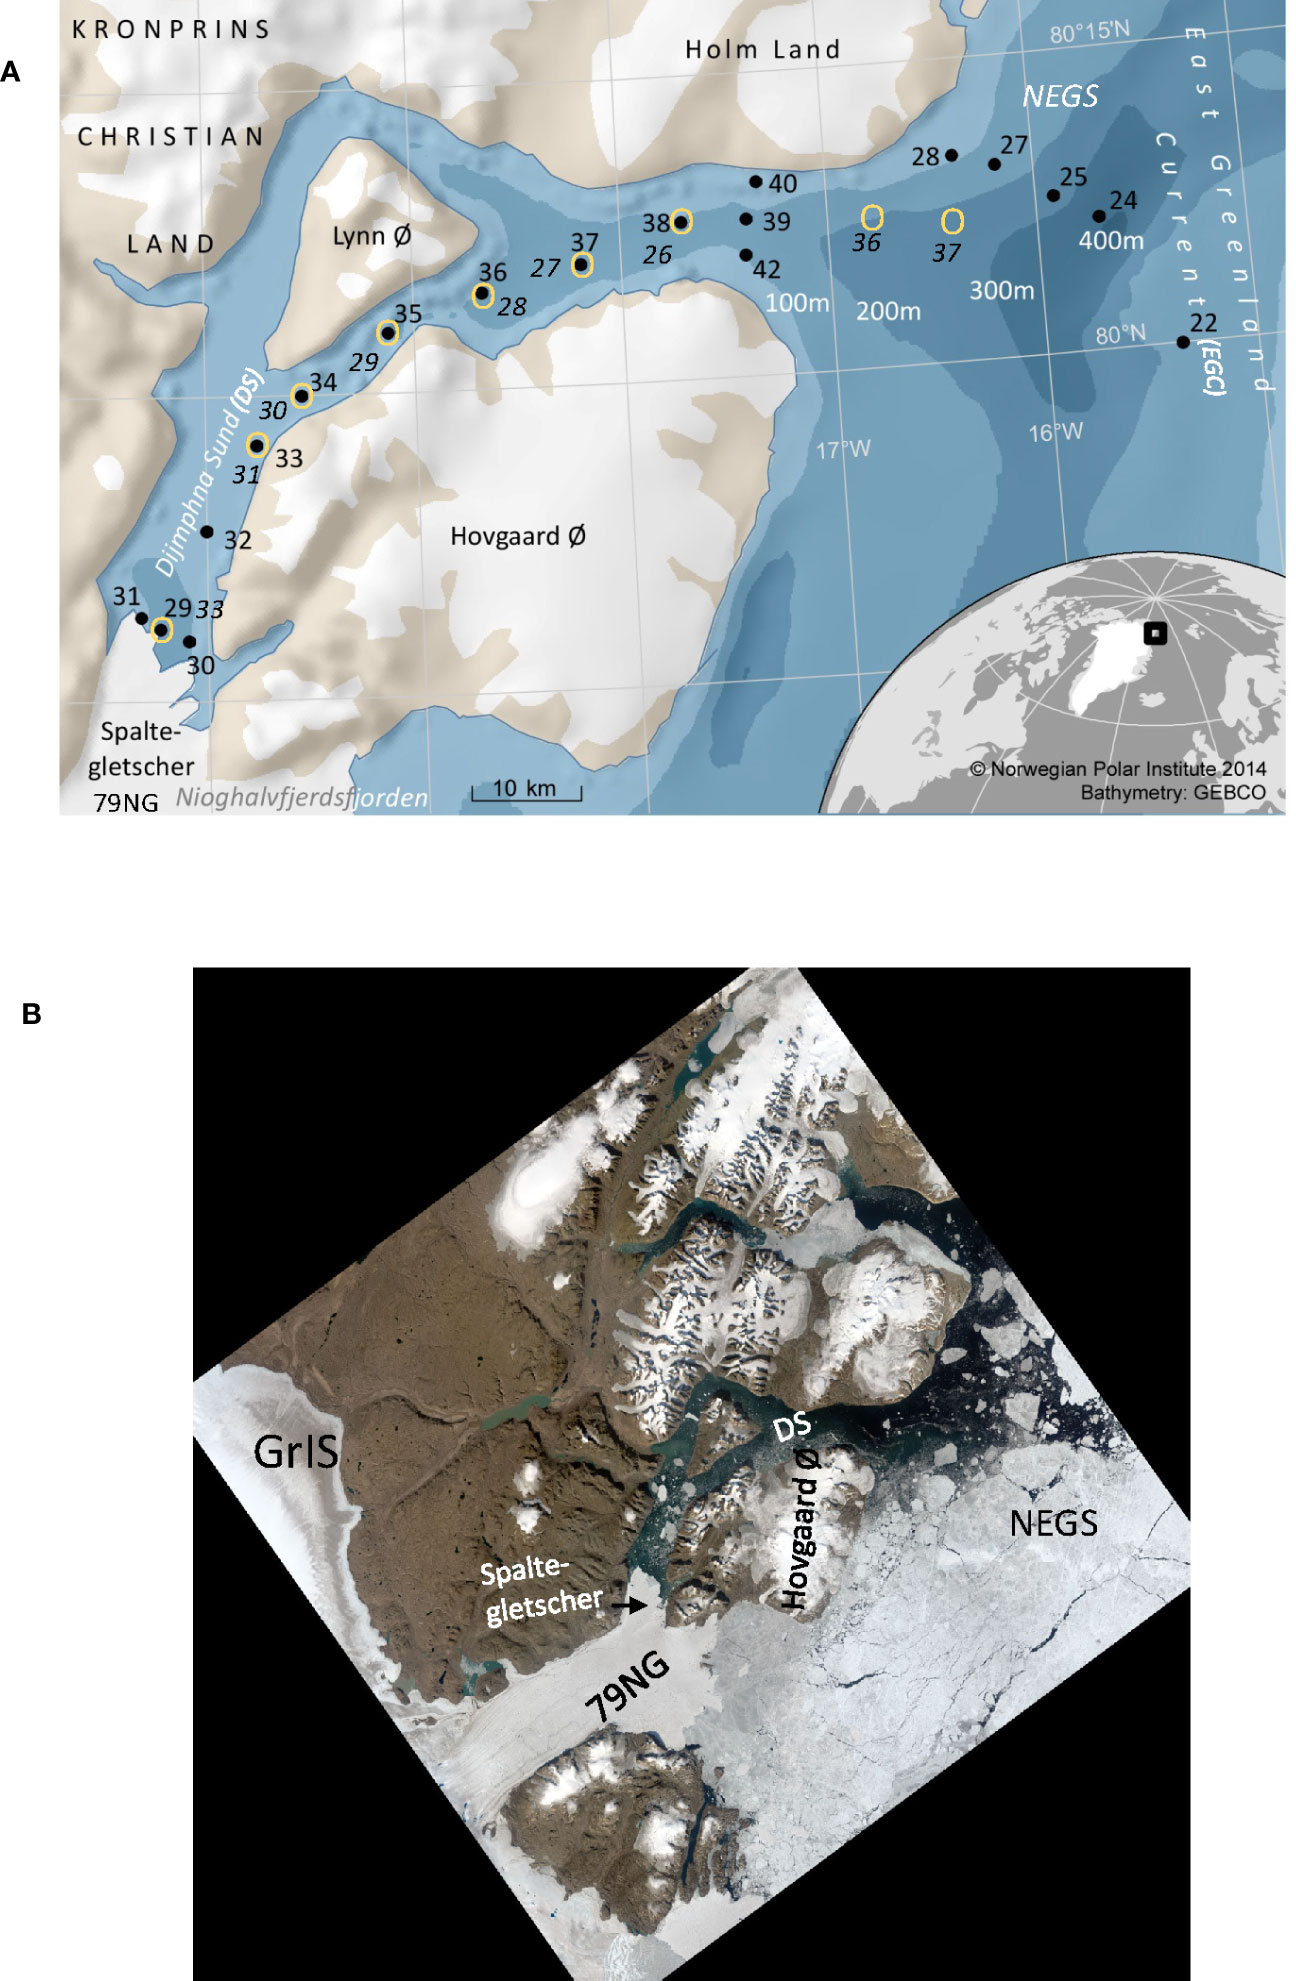
Figure 1 (A) Map of study area and location of stations collected in the Dijmphna Sound (DS), the glacier front of Spaltegletscher (a branch of the 79°CNorth Glacier, 79NG) and on the adjacent Northeast Greenland shelf (NEGS) in 27–28/08/2012 (black dots) and 3–4/09/2016 (yellow circles). Station numbers in 2012 (black) and 2016 (black italic font) and in 2012 stations #39, #40, and #42 in 2012 were located at the sill of DS. In 2016, there was no sampling at the sill. Bathymetry is shown in different shades of blue, and white numbers represent the depth of the contour in meters. White areas on land are glaciers. (B) Aerial view from satellite (Landsat image courtesy of the U.S. Geological Survey) of the area adjacent to the 79NG in August 2012 including Dijmphna Sound (DS), Northeast Greenland shelf (NEGS), and Greenland Ice Sheet (GrIS). The picture also shows the bedrock (brown area) and sea ice (white) on the adjacent shelf. The DS was mainly open and interspersed with occasional ice bergs (white squares).
The carbonate chemistry parameters, including calcium carbonate (CaCO3) saturation state (Ω), are key variables to monitor and assess a change in ocean carbonate chemistry and ocean acidification (OA) state. Ω provides information about the thermodynamic potential for CaCO3 shell dissolution. The calcite and aragonite forms of CaCO3 are biologically produced and are rarely formed inorganically. However, the solubility is chemically controlled and depends on salinity, temperature, pressure, and carbonate ion concentration. Calcite (Ca) is the stable form and aragonite (Ar) is the meta-stable form, which is given by their different solubility products, Ksp. When Ω >1, the mineral will be kept in solid state and when Ω<1, thermodynamic state, the mineral will tend to dissolve, also referred to as corrosive condition for CaCO3. The Ω value is expressed by the product of concentrations of calcium ([Ca2+]) and carbonate ions ([CO32-]) in seawater divided by the Ksp at a given temperature (T), practical salinity (S), and pressure, according to Equation 1:
In the ocean, the [CO32−] and [Ca2+] control much of the variability in ΩAr and susceptibility for dissolution.
Previous studies in the Arctic Ocean and fjords in Spitsbergen and southern Greenland show changes in ocean chemistry with freshening and that it results in lower Ω, total alkalinity (AT), and pHT referred to as OA (Chierici and Fransson, 2009; Yamamoto-Kawai et al., 2009; Azetsu-Scott et al., 2010; Sejr et al., 2011; Azetsu-Scott et al., 2014; Fransson et al., 2015; Fransson et al., 2016; Ericson et al., 2019a; Fransson et al., 2020; Henson et al., 2022). Decreasing Ω and loss in [CO32−] will cause damage to CaCO3 shells of calcifying marine organisms, such as aragonite-shell forming pteropods, with potentially detrimental effects on organisms and ecosystem (e.g., Manno et al., 2017; Bednaršek et al., 2021; Niemi et al., 2021). However, living calcifying organisms can produce shells at Ω<1 but to an energetic cost and lead to unfavorable conditions (Spalding et al., 2017).
The Arctic Ocean is particularly vulnerable to OA due to the cold and relatively fresh surface waters from meltwater (glacial and sea-ice melt) and river runoff that dissolves more atmospheric CO2 than saltier and warmer waters (Chierici and Fransson, 2009). These waters have locally low pHT and are naturally low in carbonate ions (CO32−) and total alkalinity (AT) due to dilution by large freshwater runoff (Fransson et al., 2009; Chierici et al., 2011). Consequently, the Arctic Ocean has the lowest ΩAr compared with the world oceans (e.g., Chierici and Fransson, 2009). Increased freshwater runoff from the GrIS has the potential to further enhance OA both locally in Greenland fjords (e.g., Henson et al., 2022) and on the shelf (e.g., NEGS). On the other hand, studies in Arctic fjords have shown that glacial drainage water from calcareous bedrock can partly mitigate the effect of freshening due to addition of buffering ions such as [CO32−] (Sejr et al., 2011; Fransson et al., 2015; Fransson et al., 2020). Moreover, sea ice can also contribute with [CO32−] during the dissolution of sea-ice-derived CaCO3 (ikaite) (Rysgaard et al., 2012; Fransson et al., 2015; Fransson et al., 2020).
Primary production (PP) results in increased ΩAr and pHT due to CO2 (DIC) drawdown in spring/summer, net respiration (i.e., CO2 production) decreases ΩAr and pHT in fall/winter, and freshwater supply generally lowers ΩAr and pHT through dilution of ions (Chierici and Fransson, 2018). Primary and secondary production in glacier influenced fjords can be stimulated by meltwater-driven upwelling of nutrient-rich subglacial water (Apollonio, 1973; Sejr et al., 2011; Lydersen et al., 2014; Meire et al., 2014; Fransson et al., 2015; Halbach et al., 2019) and addition of micronutrients (e.g., iron; Bhatia et al., 2013; Hopwood et al., 2020; Krisch et al., 2021). Moreover, deeper waters that have been isolated from the surface and accumulated CO2 from organic matter degradation can be entrained and further decrease Ω and pHT (Henson et al., 2022).
Observations of carbonate chemistry in the northern Greenland fjords are scarce due to limited accessibility. Here, we focus on the water column carbonate chemistry, inorganic nutrients, and OA state in 2 years in DS and NEGS, next to the 79NG (Figure 1A). Estimates and evaluation of drivers affecting the carbonate chemistry, OA, and potential for air-sea CO2 exchange in the upper 50 m in the DS and NEGS are presented and discussed for the two summers/years, in relation to freshening and climate change.
The DS and NEGS system are one of the largest outlets of the northeast Greenland ice stream (NEGIS), extending more than 600 km into the interior of the GrIS and draining 9% of it (Figure 1B; Thomsen et al., 1997; Joughin et al., 2001; Khan et al., 2014). The 79NG is a marine-terminating glacier with two calving fronts and is connected to GrIS (Figures 1A, B). One front is located south of Hovgaard Island and is 30–35 km wide. A second front (Spaltegletscher) calves into the 10-km-wide DS (e.g., Thomsen et al., 1997; Mayer et al., 2000; Khan et al., 2014), which is the focus of this study (Figures 1A, B). The floating part of the 79NG ice tongue shows strong surface melting during summer with an annual ablation of 1 m (Thomsen et al., 1997). The DS is around 60–70 km long from near the sill (at 130 m) to the 79NG front at the fjord head. The upper 150 m is the Polar Water (PW; Gjelstrup et al., 2022), which in this study is divided into two layers; the relatively fresh surface layer affected by seasonal processes such as primary production, meltwater, and seasonal warming (SL; 0 to<50 m), and a cold halocline layer (CHL; >50–150 m) at near-freezing temperatures (θ<0°C) with a salinity of approximately 32.5 (Figure 2A). The SL is mainly formed locally and is affected by glacial meltwater (Thomsen et al., 1997). The layer below 150 m to bottom consists of water of Atlantic origin (AW; S >34.4, θ >0°C; Gjelstrup et al., 2022).
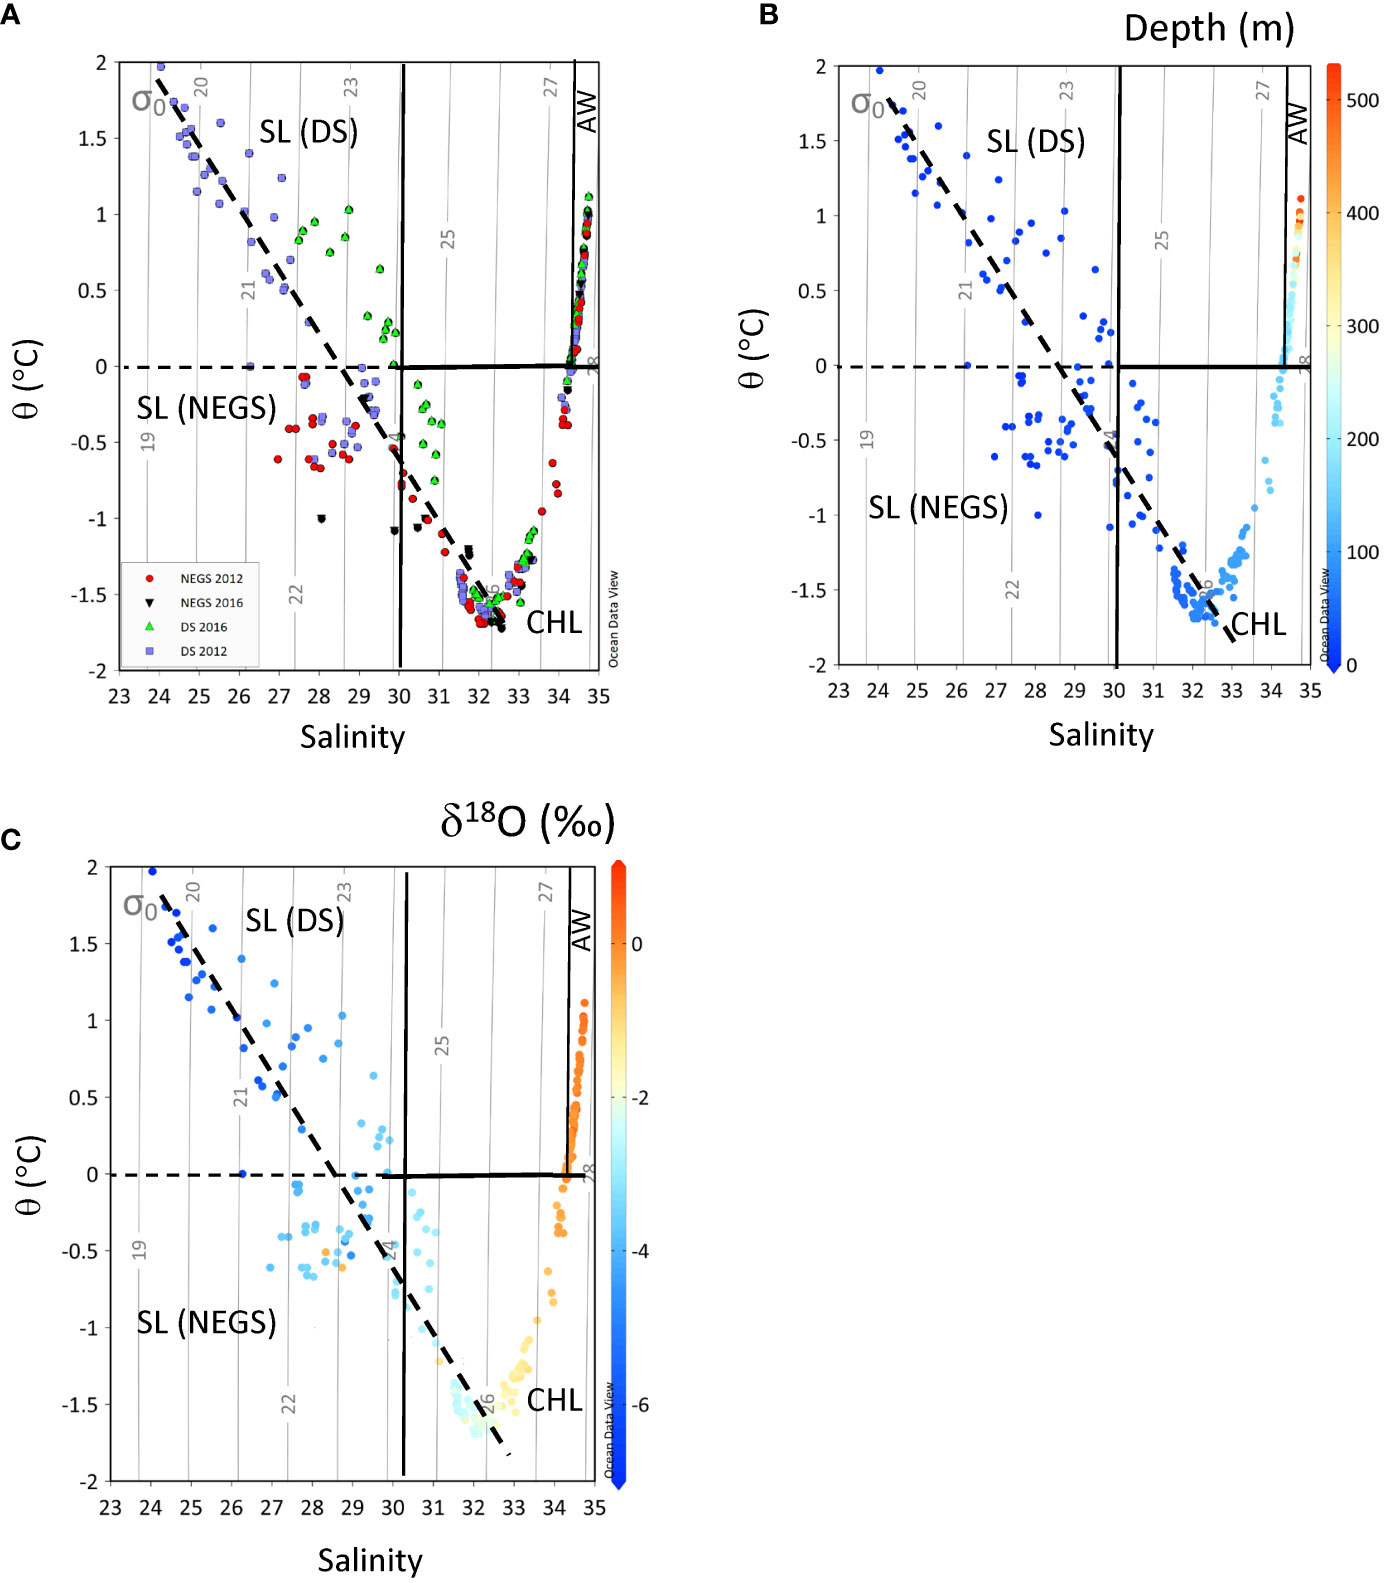
Figure 2 Potential temperature (⊖, y-axis, °C) against practical salinity (S, x-axis) for (A) Dijmphna Sound (DS) in 2012 (purple squares) and in 2016 (light-green triangle), the Northeast Greenland shelf (NEGS) in 2012 (red filled circles) and in 2016 (black filled inverted triangle). (B) Depth (m, z-axis) and (C) δ18O (‰, z-axis), in 2012 and 2016, respectively. The light-gray contours show the density (σθ) at zero-reference pressure σθ, (kg m-3). The mixing line (dashed black line) shows the dilution line from cold halocline layer (CHL) to the surface layer (SL). Water masses are divided into SL in DS and on the NEGS, CHL, and the Atlantic water (AW) according to properties after Gjelstrup et al. (2022).
Sampling in the DS and NEGS was performed in 27–28/08/2012 and 3–4/09/2016 onboard R/V Lance, as part of the Norwegian Polar Institute’s long-term monitoring in the area. The station locations are presented in Table 1 and Figure 1A. In our study, summer data from DS and 40 km to the east from the sill of DS represent water on the adjacent NEGS (Figure 1A). Abbreviations throughout the manuscript are summarized in a glossary table (Table S1).
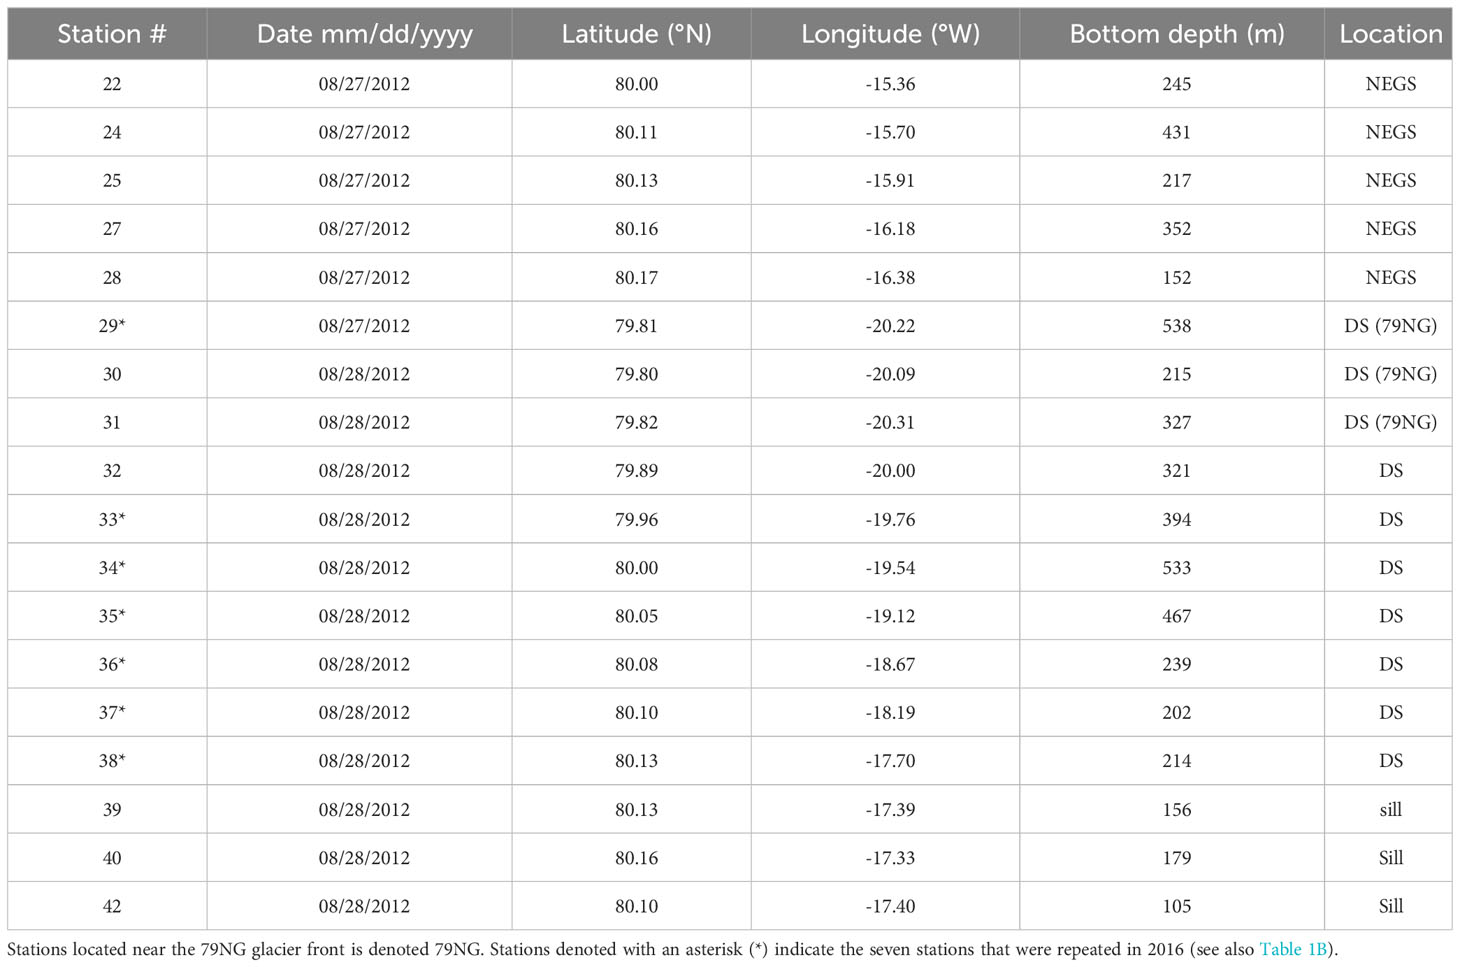
Table 1A Date, location and bottom depth for stations used in the study from 2012 in the fjord of Dijmphna Sound (DS), NE Greenland shelf (NEGS).
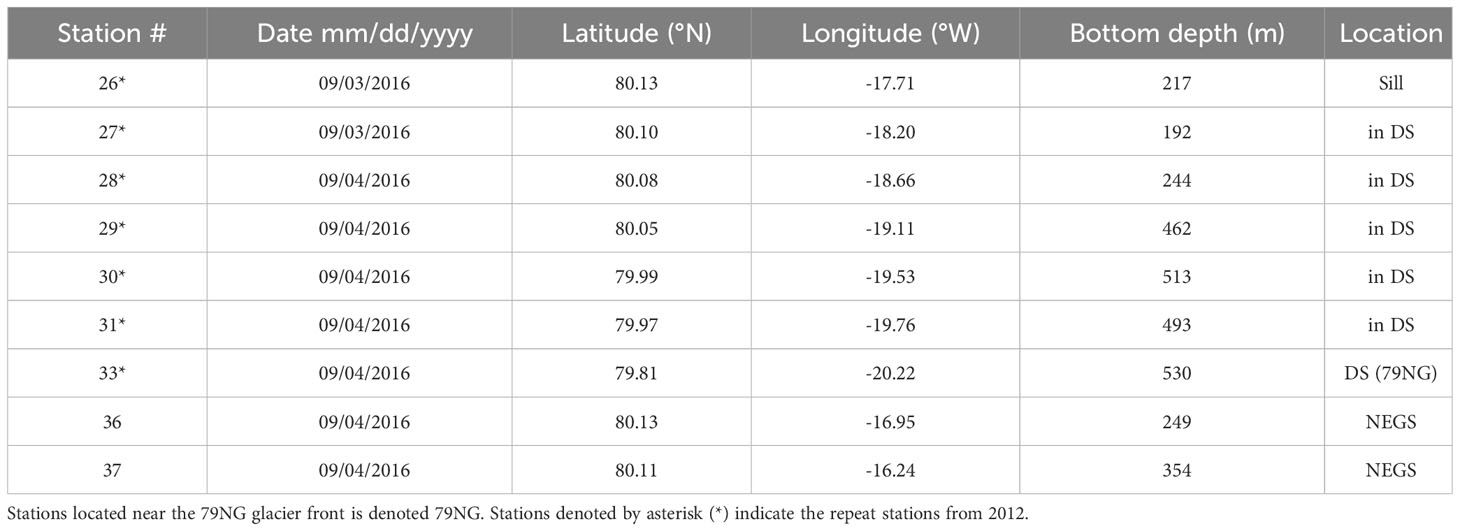
Table 1B Date, location and bottom depth for stations used in the study from 2016 in the fjord of Dijmphna Sound DS, NE Greenland shelf NEGS.
Water samples were collected from 8-L Niskin bottles mounted on a General Oceanics 12-bottle rosette equipped with a conductivity–temperature–depth sensor (CTD, Sea-Bird SBE 911plus) and a chlorophyll a fluorescence probe (WetLabs). Water samples were collected (at fixed depths) from the same Niskin bottles for analysis of salinity, water oxygen isotopic ratio (δ18O-H2O, hereafter referred to as δ18O), dissolved inorganic nutrients, and the carbonate system parameters total inorganic carbon (DIC) and total alkalinity (AT).
Samples for the analyses of DIC and AT were collected in 250-mL borosilicate bottles following standard sampling protocols (Dickson et al., 2007). Samples for AT and DIC were unfiltered. Upon collection, samples were stored in the dark at 4°CC until analysis onboard within 5 to 12 h, so no preservative HgCl2 was needed. In 2012 and 2016, DIC was determined onboard by coulometric titration (Johnson et al., 1985) using a Versatile Instrument for the Determination of Total inorganic carbon and titration Alkalinity (VINDTA 3C, Marianda, Germany) and AT using potentiometric titration with 0.05 M HCl acid and NaCl (35 g L−1), to have similar ion strength as the samples, on a Metrohm titration system following the methods described by Mattsdotter-Bjørk et al. (2014) and Dickson et al. (2007). Additional seawater samples were taken for post-cruise analyses for AT using a Versatile Instrument for the Determination of Titration Alkalinity (VINDTA 3S, Marianda, Germany). The precision was ±2 µmol kg−1 for AT and ±2 µmol kg−1 for DIC, based on replicates of Certified Reference Material (CRM) regardless of instrumentation. The accuracies of AT and DIC were controlled against CRM (batch no. 117) supplied by A. Dickson (San Diego, USA) by applying a correction factor to the measured values based on the ratio between the certified value and the measured CRM values. The correction factors were 1.001 ± 0.002 and 1.060 ± 0.002 for AT and DIC, respectively.
The samples for determination of inorganic nutrients (nitrate, phosphate, silicic acid) were collected in acid-washed polyethylene bottles and frozen at −20°C until laboratory analyses using an autoanalyzer (Skalar) following the approach of Hansen and Koroleff (1999). The detection limit was 0.06 mmol m−3 for phosphate ([PO43−]), 0.2 mmol m−3 for nitrate ([NO3−]) (only in 2012), and 0.3 mmol m−3 for silicic acid ([Si(OH)4]) concentrations. In 2016, parts of the nitrate data had large uncertainty (>3σ), which are not included in the manuscript. δ18O samples were collected in 40-mL glass vials. Upon sample collection, vials were tightly closed and sealed with Parafilm®. Measurements in 2012 were done ashore at the G.G. Hatch Stable Isotope Laboratory (University of Ottawa, Canada) using isotope ratio mass spectrometry and Vienna Standard Mean Ocean Water (V-SMOW). The analytical precision was ±0.05‰ (Epstein and Mayeda, 1953). In 2016, δ18O was measured at National Environment Research Council Isotope Geosciences Facility at the British Geological Survey (Keyworth, UK) using a dual-inlet mass spectrometer. Analytical reproducibility was <0.05‰ based on duplicate analyses against V-SMOW. Salinity (on the practical salinity scale, dimensionless) samples were measured onboard using an Autosal® salinometer (Dauphinee and Klein, 1975) with the precision of ±0.003 (Dodd et al., 2012).
The concentrations of AT and DIC, inorganic nutrients (phosphate and silicic acid), salinity, and temperature were used as input parameters in a CO2-chemical speciation model (CO2SYS program, Pierrot et al., 2006) to calculate the full carbonate system including in situ pHT, fCO2, [CO32−], ΩCa, and ΩAr. The calculations were performed using the total hydrogen ion scale and the hydrogen sulfate ([HSO4−]) dissociation constant of Dickson (1990). We used the carbonate system dissolution constants from Mehrbach et al. (1973) refit by Dickson and Millero (1987). The solubility constants for CaCO3 are estimated according to Mucci (1983), where [Ca2+] is proportional to the salinity (10.28 × S/35 µmol kg−1). The carbonate system constants were chosen for comparison of ΩAr between previous values in the same region. However, studies have shown that there may be other constants that are more suitable for the colder and lower-salinity water found in this study. Ultimately, the choice of constants relies on several factors such as the input pair (here AT and DIC), the target variable (here ΩAr), the research question, and the seawater properties as demonstrated in many intercomparison studies (e.g., Chierici et al., 2004; Orr et al., 2018; Sulpis et al., 2020). Orr et al. (2018) found that a pair of AT and DIC gave the lowest combined standard uncertainty in the calculated [CO32−], which resulted in a corresponding uncertainty of ±0.0286 in the calculated ΩAr in the CO2SYS excel version. The estimate of the temperature and salinity dependence of the constants (K1 and K2) for carbonic acids should be suitable for the polar water properties. For example, for fresher and colder (T<0°CC) polar water, the constants of Roy et al. (1993) were shown to be more suitable (Chierici and Fransson, 2009). Orr et al. (2018) also demonstrated that most of the uncertainty is related to K1 when fCO2 is the target variable and in K2 for estimates of ΩAr. This is due to the smaller temperature dependence in ΩAr than for gas solubility (e.g., fCO2) (Orr et al., 2018; Sulpis et al., 2020). These types of studies are normally performed by internal consistency using three sets of measured carbonate system variables, for example, AT, DIC, and pHT (Chierici and Fransson, 2009). To overcome the lack of a third carbonate system variable in this study, we investigated the difference (ΔΩArMEAS-L) between ΩAr calculated from Lueker et al. (2000) (ΩArL) and the ones used here (ΔArMEAS) based on Dickson and Millero (1987) (Figure S1A). The mean and standard deviation of ΔΩArMEAS-L was −0.004 ± 0.001, ranging between −0.006 and −0.002 (Figure S1B). The largest ΔΩArMEAS-L of −0.006 was found at −1.5°CC (Figure S1B). This uncertainty is of the same magnitude as the uncertainty in ΩAr derived from the analytical precision in AT and DIC of ±0.001 and one magnitude smaller (third decimal) than the findings in Orr et al. (2018), hence having an insignificant impact on the results.
To investigate the local effects of freshwater addition on ΩAr, the freshwater content (meteoric and sea-ice meltwater) (FWTOT) was calculated based on a reference (REF) seawater (SWREF) located at the boundary between SL and CHL with a salinity (SREF) of 32.5, at 50 m, and the measured salinity of the water sample (SMEAS).
AT, S, and T were used to investigate the freshwater endmembers. Linear regressions of AT vs. S for the different water layers give the AT freshwater endmember (ATFWEM) at the intercept at zero (y-axis) salinity, for SL and CHL in the DS and the NEGS.
Fractions of meteoric water (FGM) and sea-ice meltwater (FSIM) were estimated in the SL using the relationships between salinity and δ18O, and endmember values for glacial meltwater in the SL (GM), sea-ice meltwater (SIM), and SWREF (Table 2), following Equations 3–5 (Macdonald et al., 1999; Chierici et al., 2011).
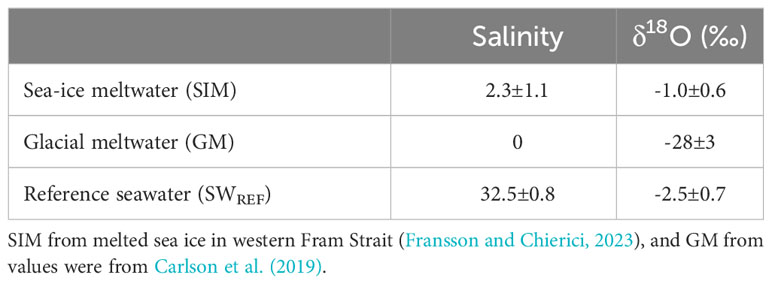
Table 2 End-member parameter values for salinity and δ18O for sea-ice meltwater (SIM), glacial meltwater (GM) and reference seawater (SWREF). SWREF values were from this study.
The impact of freshening (ΔXFW) and inorganic carbon drawdown by PP (ΔXBIO) on concentrations of DIC, AT, and PO43- (depicted as X here) was partitioned using the approach described in Fransson et al. (2001); Fransson et al. (2004), where the reference concentrations (XREF) were assumed not to be affected by summer freshening and PP. First, ΔXFW was estimated by multiplying FWTOT for each sample in the upper 50 m with the AT, DIC, and PO43− in the SWREF (XREF) according to Equation 6. Secondly, freshwater-corrected X was calculated by subtracting ΔXFW with XREF (Equation 7). These XFW values were used in CO2SYS (Section 3.2.1) to calculate freshwater corrected ΩAr (ΩArFW).
XBIO and ΔXBIO were calculated using the change in [PO43] converted to carbon drawdown (ΔDICBIO) using Redfield (Redfield et al., 1963) stoichiometry C:P = 106/1 (Equation 8A, 8B) as a proxy for PP. [PO43] was used to avoid potential artefacts resulting from external nitrogen sources such as atmospheric nitrogen deposition. The variability in C:P ratios and consequences for the DICBIO are discussed (see Section 5.2).
The AT values are affected only to a minor extent by PP. However, by the assimilation of NO3− and hydrogen ions for the formation of protein during photosynthesis, the AT increases and was corrected by 1 µmol kg−1 per one unit of NO3− change (ATBIO). ATBIO and DICBIO were used as input variables CO2SYS (Section 3.2.1) to obtain values of ΩAr and other carbonate system parameters that were affected only by biological CO2 drawdown (ΩArBIO) as for ΩArFW. The resulting net effects on ΩAr of either freshwater addition (ΔΩArFW) or biological CO2 drawdown (ΔΩArBIO) in the DS and on the NEGS were estimated as the difference between ΩAr in the SWREF (ΩArREF) and the ΩArFW and ΩArBIO, respectively (Equation 9A, 9B, 9C).
To investigate the role of other processes (ΔXDIFF), ΔXBIO and ΔXFW were subtracted from the DICREF and ATREF to obtain XCORR (Equation 10), which was compared with the measured AT and DIC (XMEAS) according to Equation 11. A positive ΔXDIFF suggests a net addition of [CO32−] possibly from the contribution of bedrock-derived carbonic minerals in the glacial drainage water.
where XGLAC is the concentration of AT at zero S (i.e., intercept) in the linear regression between AT and S. ΔATGLAC is the change due to effects of glacial drainage water. The supply of [CO32] results in AT changes with 1 mol and DIC with 2 mol. ΔDICREST is the residual (Equation 13), which consists of processes that are not considered in Equations 9 to 12, such as air-sea CO2 exchange.
All calculated variables derived from Equations 11 to 13 were depth-integrated (trapezoid) in the SL.
The semiconservative tracer N* (mmol m−3) identifies deviations from conservative behavior between nitrogen and PO43 concentrations according to Equation 14 (Deutsch et al., 2001). A deficit in NO3− relative to PO43− is a signature of denitrification or anammox and results in negative N* values. On the Arctic shelves, the CHL is influenced by mineralization of organic matter close to surface sediments at low oxygen (and low pHT, high CO2) conditions, which imparts a negative N* signature to this layer (Anderson et al., 2013). This can be used to trace the CHL originating from the Arctic Ocean and shelves.
In 2012, the salinity of the SL was the lowest, extending down to a salinity of around 24, whereas the lowest salinity in SL in 2016 was around 27 (Figure 2A). The warmest and freshest SL was found in DS in 2012 (Figure 2B). This coincided with the lowest δ18O values of less than −6‰ (Figure 2C). In 2012, the CHL, the potential temperature (θ), and salinity properties were generally similar between the NEGS and the DS. However, the minimum θ was observed on the NEGS in 2016, whereas the DS was warmer in the DS in the same year (Figures 2A, B). δ18O values also clearly differed between the water layers, where the lowest δ18O was found in the SL in 2012 (Figure 2C), increasing to the CHL with δ18O values between −3 and −1‰. The AW contained the largest δ18O values (~0.5‰) and was similar in both years and areas (Figure 2C).
Vertical and horizontal patterns in the variables were similar between the 2 years except for more distinct gradients in the SL in 2012 (Figures 3A-F). The effect of summer warming and freshening in SL was largest in 2012 (T = +2°C) and extended down to 40 m at the 79NG front (Figures 3A, C). Below the SL, the CHL had near-freezing temperatures (T<0°C) with a salinity of approximately 32.5 in both 2012 and 2016 (Figures 3C, D). Below CHL, relatively high S and T water extended to the bottom, which indicated the influence of AW (Figures 3A-D). δ18O values increased with depth, and toward the sill (−0.4‰) to the NEGS, and varied between the 2 years, with lowest values near the 79NG front down to −8.6‰ and −5‰ in 2012 and 2016, respectively (Figures 3E, F and Table S1).
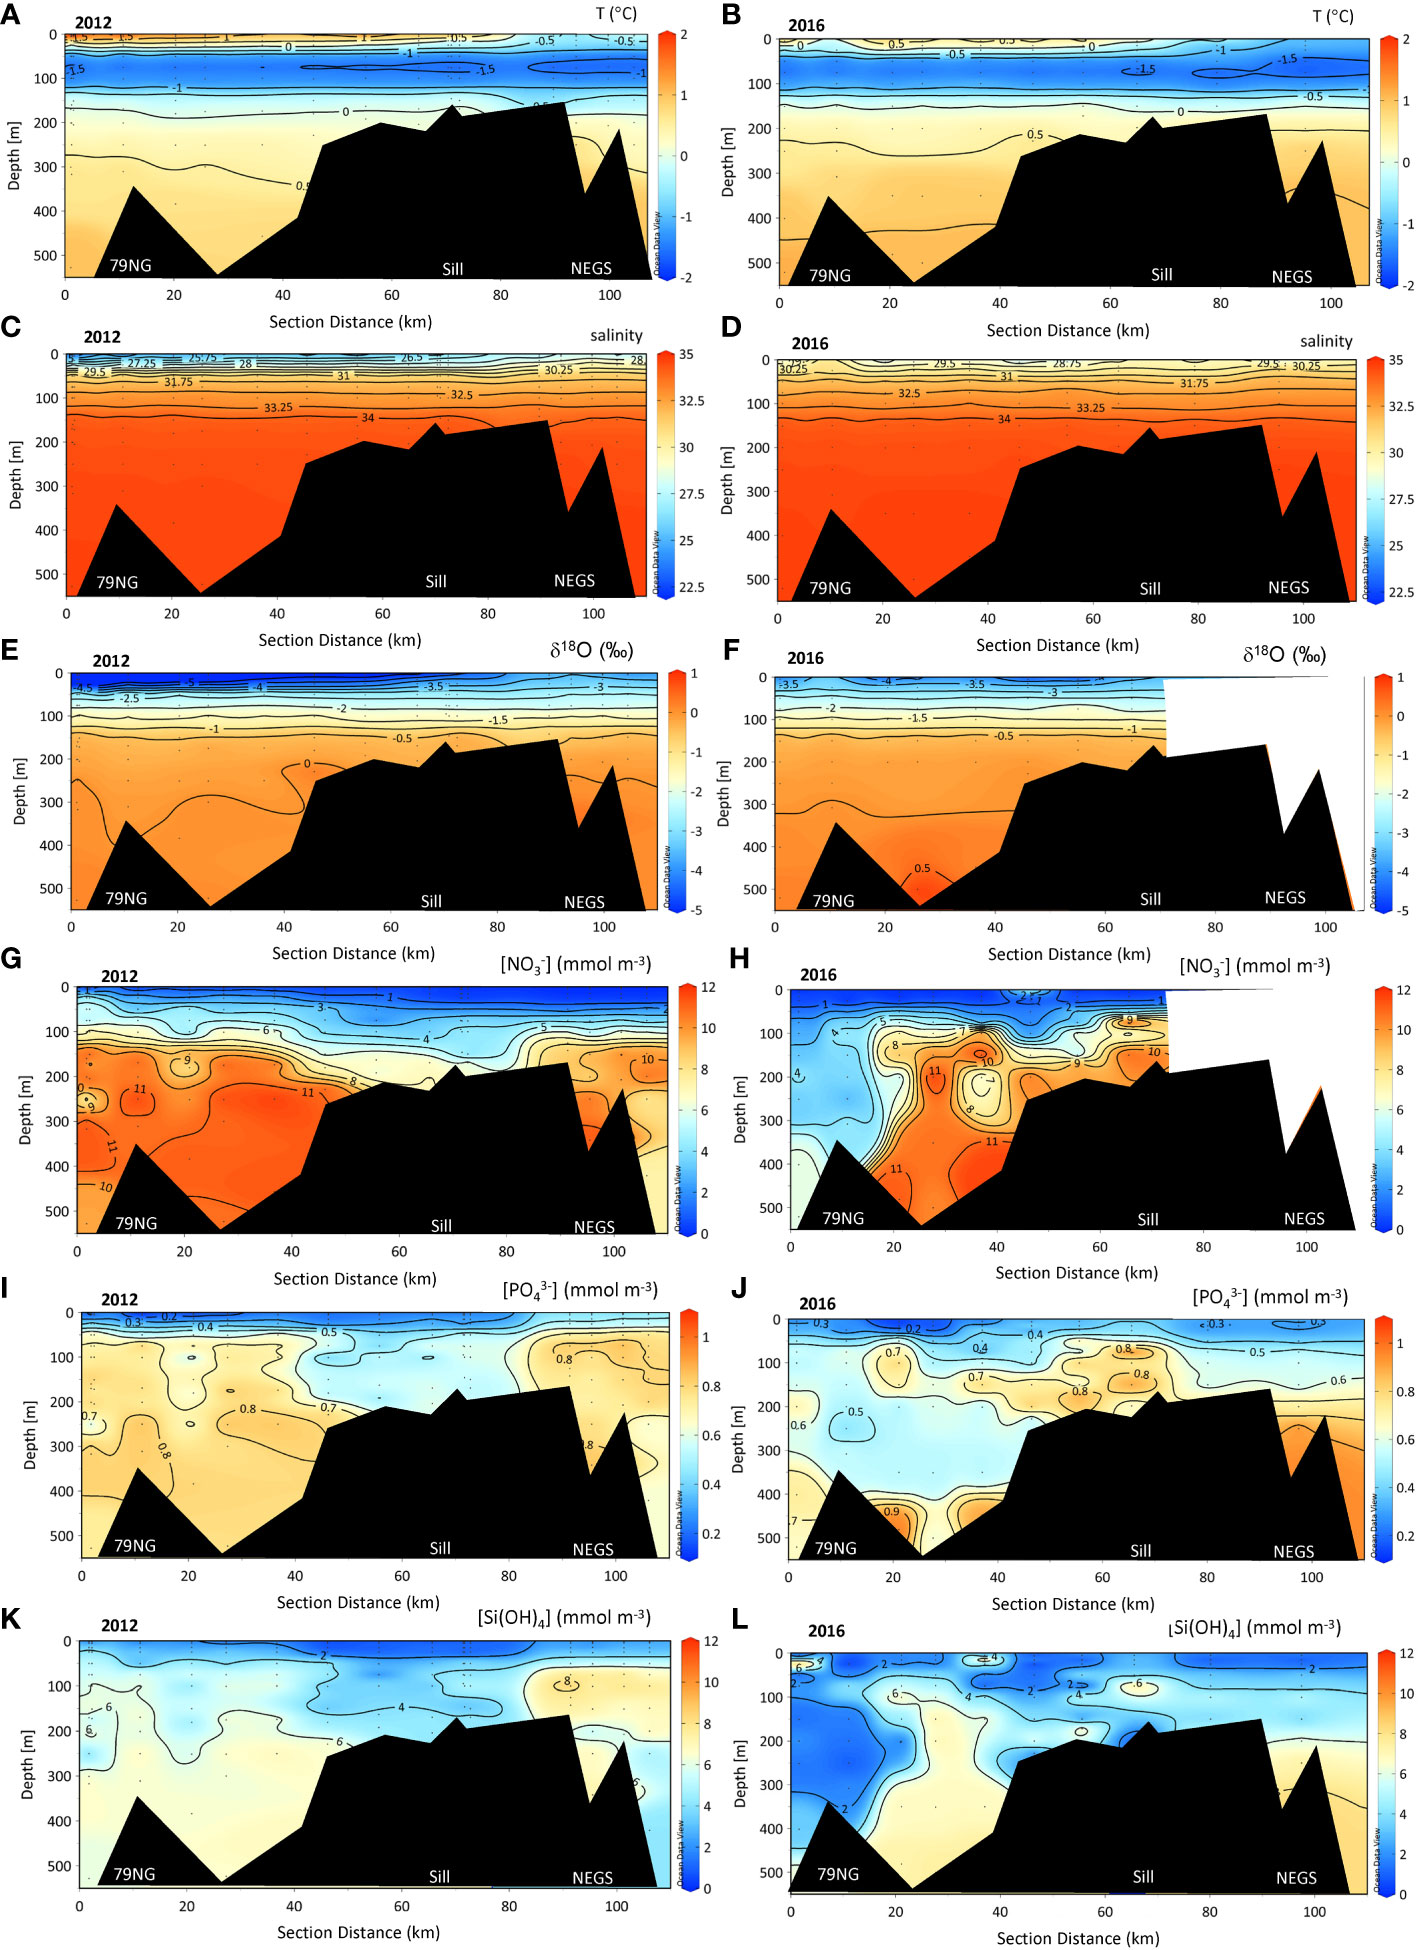
Figure 3 Section plots in the water column of temperature (T, °C), practical salinity (S), δ18O (‰), nitrate ([NO3-]), mmol m−3, phosphate ([PO43-]), mmol m−3, and silicic acid ([Si(OH)4], mmol m−3, z-axis) concentrations from the 79NG front (distance 0 km) in Dijmphna Sound (DS) to the Northeast Greenland shelf (NEGS) in 2012 (A, C, E, G, I, K) and 2016 (B, D, F, H, J, L). The white shaded area in (F) and (H) indicates no data. The bottom depths at stations near the sill (2012: #39, 40, 42, 2016: #26) were between 105 and 159 m and located between 60 to 70 km from the glacier front (79NG front).
[NO3−] was depleted in the SL and [PO43−] varied between near depletion and 0.63 mmol m−3 and [Si(OH)4] varied between near depletion and 2 mmol m−3 in both years near the 79NG front and the outer (stations) of DS and NEGS (Figures 3G–L and Table S1). Maximum concentrations of [NO3−] and [PO43−] of 13 mmol m−3 and 1 mmol m−3, respectively, were found in the AW in DS and NEGS (Figures 3G, H and Table S1).
AT and DIC values were lowest in the SL, gradually increasing with depth (Figures 4A-D). The lowest AT and DIC values in both years were observed near the 79NG front, increasing toward the sill and NEGS (Figures 4A–D and Table S1). Large DIC values >2,160 µmol kg-1 were observed below 200 m to the bottom in the DS and on the NEGS, most evident in 2016 (Figure 4D). In both years, fCO2 was undersaturated relative to atmospheric values (~415 µatm, Ny-Ålesund Zeppelin station) in the whole water column (Figures 4E, F). In 2012, the lowest fCO2 of 138 µatm was found in the SL at the 79NG front compared with the lowest fCO2 of 269 µatm in 2016 in SL (Figures 4E, F, Table S1). Generally, the surface fCO2 increased from the 79NG front toward the sill and further onto the NEGS, especially in 2012. The large differences in fCO2 were also reflected in the variability of pHT, where the highest pHT of 8.37 was observed in 2012 by the 79NG front and the corresponding pHT in 2016 of 8.16 (Figures 4G, H and Table S1).
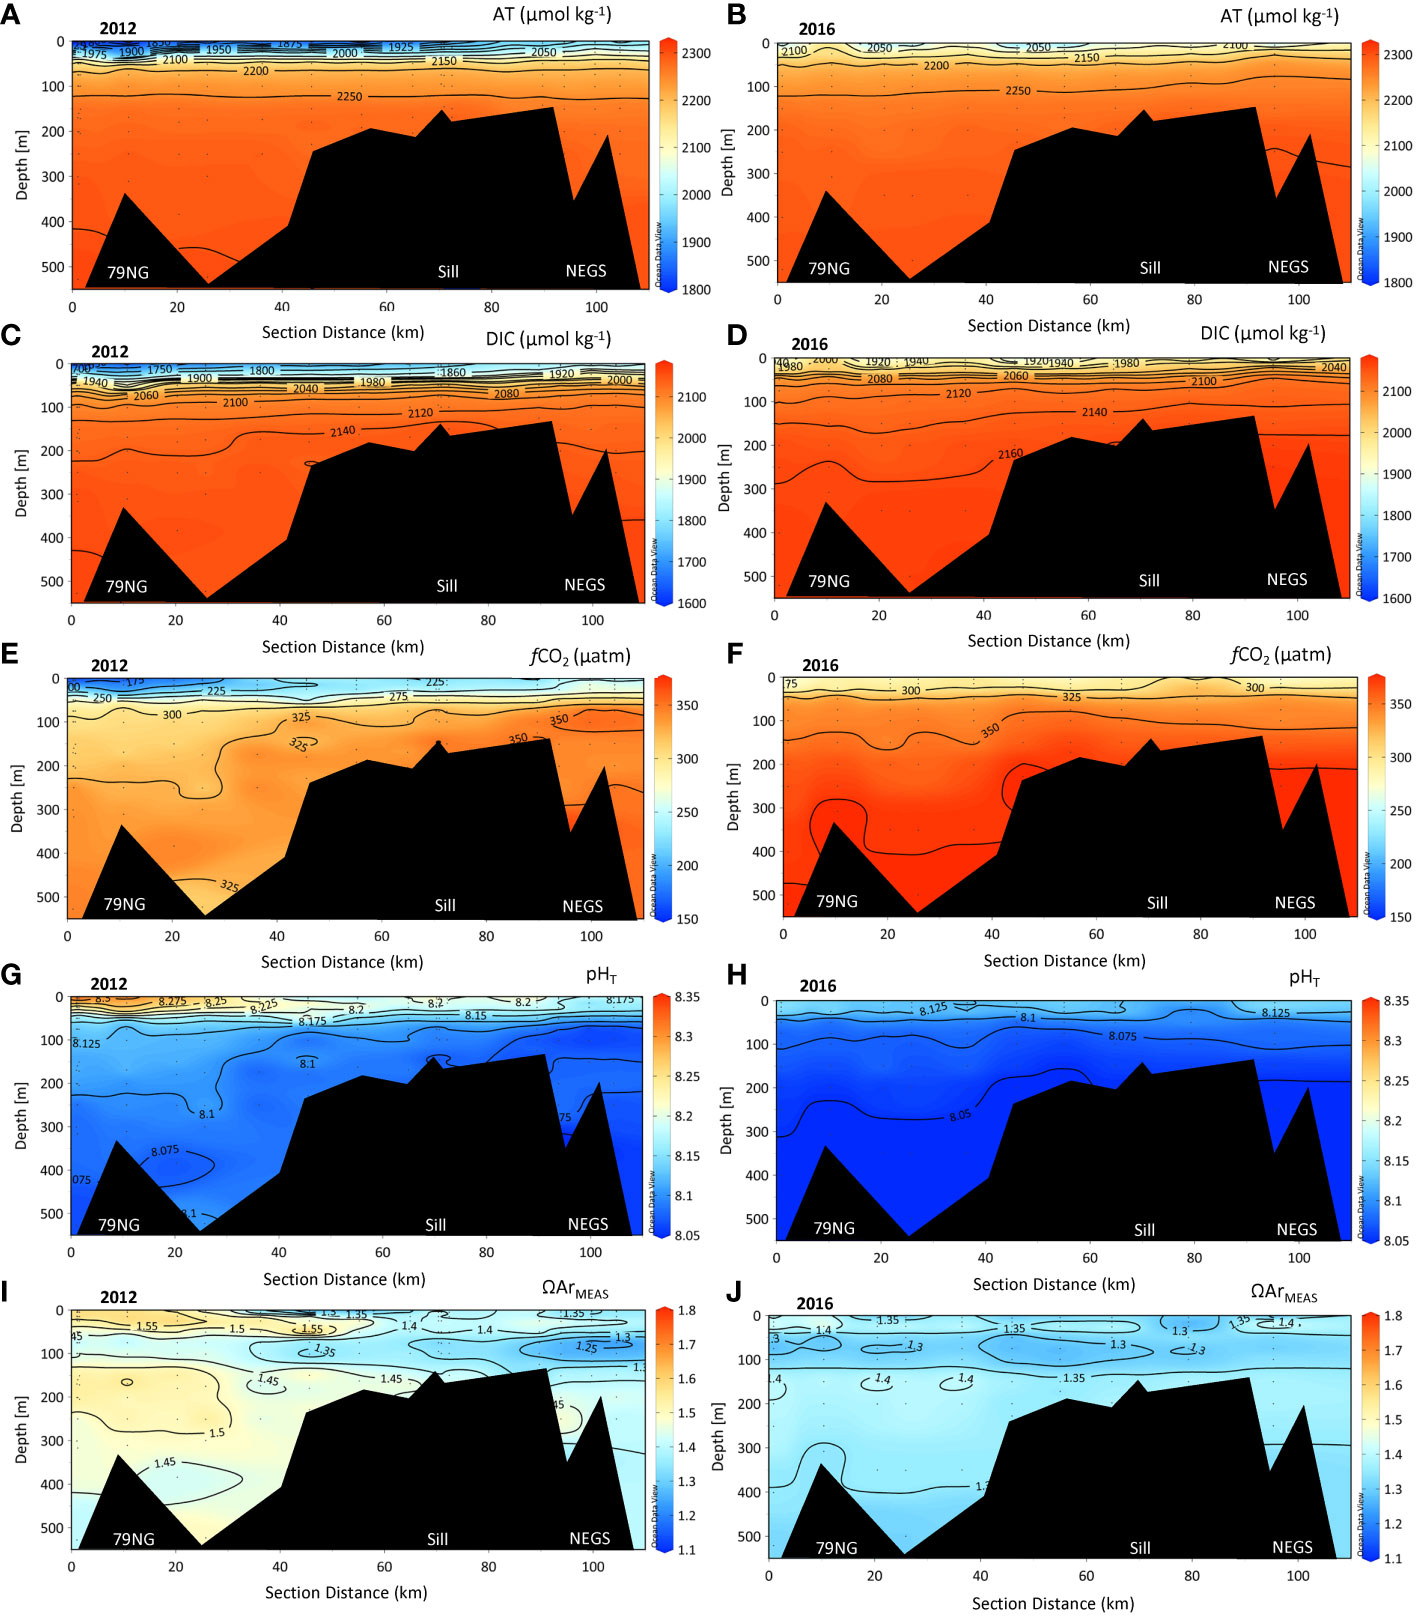
Figure 4 Section plots of chemical parameters in the water column of total alkalinity (AT, µmol kg−1), total dissolved inorganic carbon (DIC, µmol kg−1), pHT, fugacity of carbon dioxide (fCO2, µatm), and aragonite saturation (ΩArMEAS), from the 79NG front (distance 0 km) in Dijmphna Sound (DS) to the Northeast Greenland shelf (NEGS) in 2012 (A, C, E, G, I) and 2016 (B, D, F, H, J). The bottom depths at stations near the sill (2012: #39, 40, 42, 2016: #26) were between 105 and 159 m and located between 60 and 70 km from the glacier front (79NG front).
The ΩAr values (Figures 4I, J) and ΩCa (i.e., calcite, Table S1, around one unit higher relative to ΩAr) were highest in the relatively fresh surface at the 79NG front in both years, particularly evident in 2012 (Figure 4J and Table S1). In 2012, ΩAr varied in the water column between 1.13 in DS and 1.75 in the SL near the 79NG. In the SL on the NEGS, ΩAr was 1.22–1.53 (Figure 4I and Table S1). In 2016, ΩAr varied less throughout the water column than in 2012 and ranged between 1.23 and 1.44 (Figure 4J and Table S1). The CHL had the lowest ΩAr values (<1.15) in the DS and at the 79NG front and were similar in both years (Figure 4J).
There was a large difference in FGM and FSIM in SL between the 2 years (Figures 5A-D). In 2012, the largest FGM (>0.2) was found at the 79NG front and was insignificant on the NEGS (Figure 5A). FSIM was largest at the outer DS and on the NEGS (FSIM >0.1, Figure 5C). In 2016, FGM was lower than 0.1 (Figure 5B) and FSIM was<0.06 (Figure 5D).
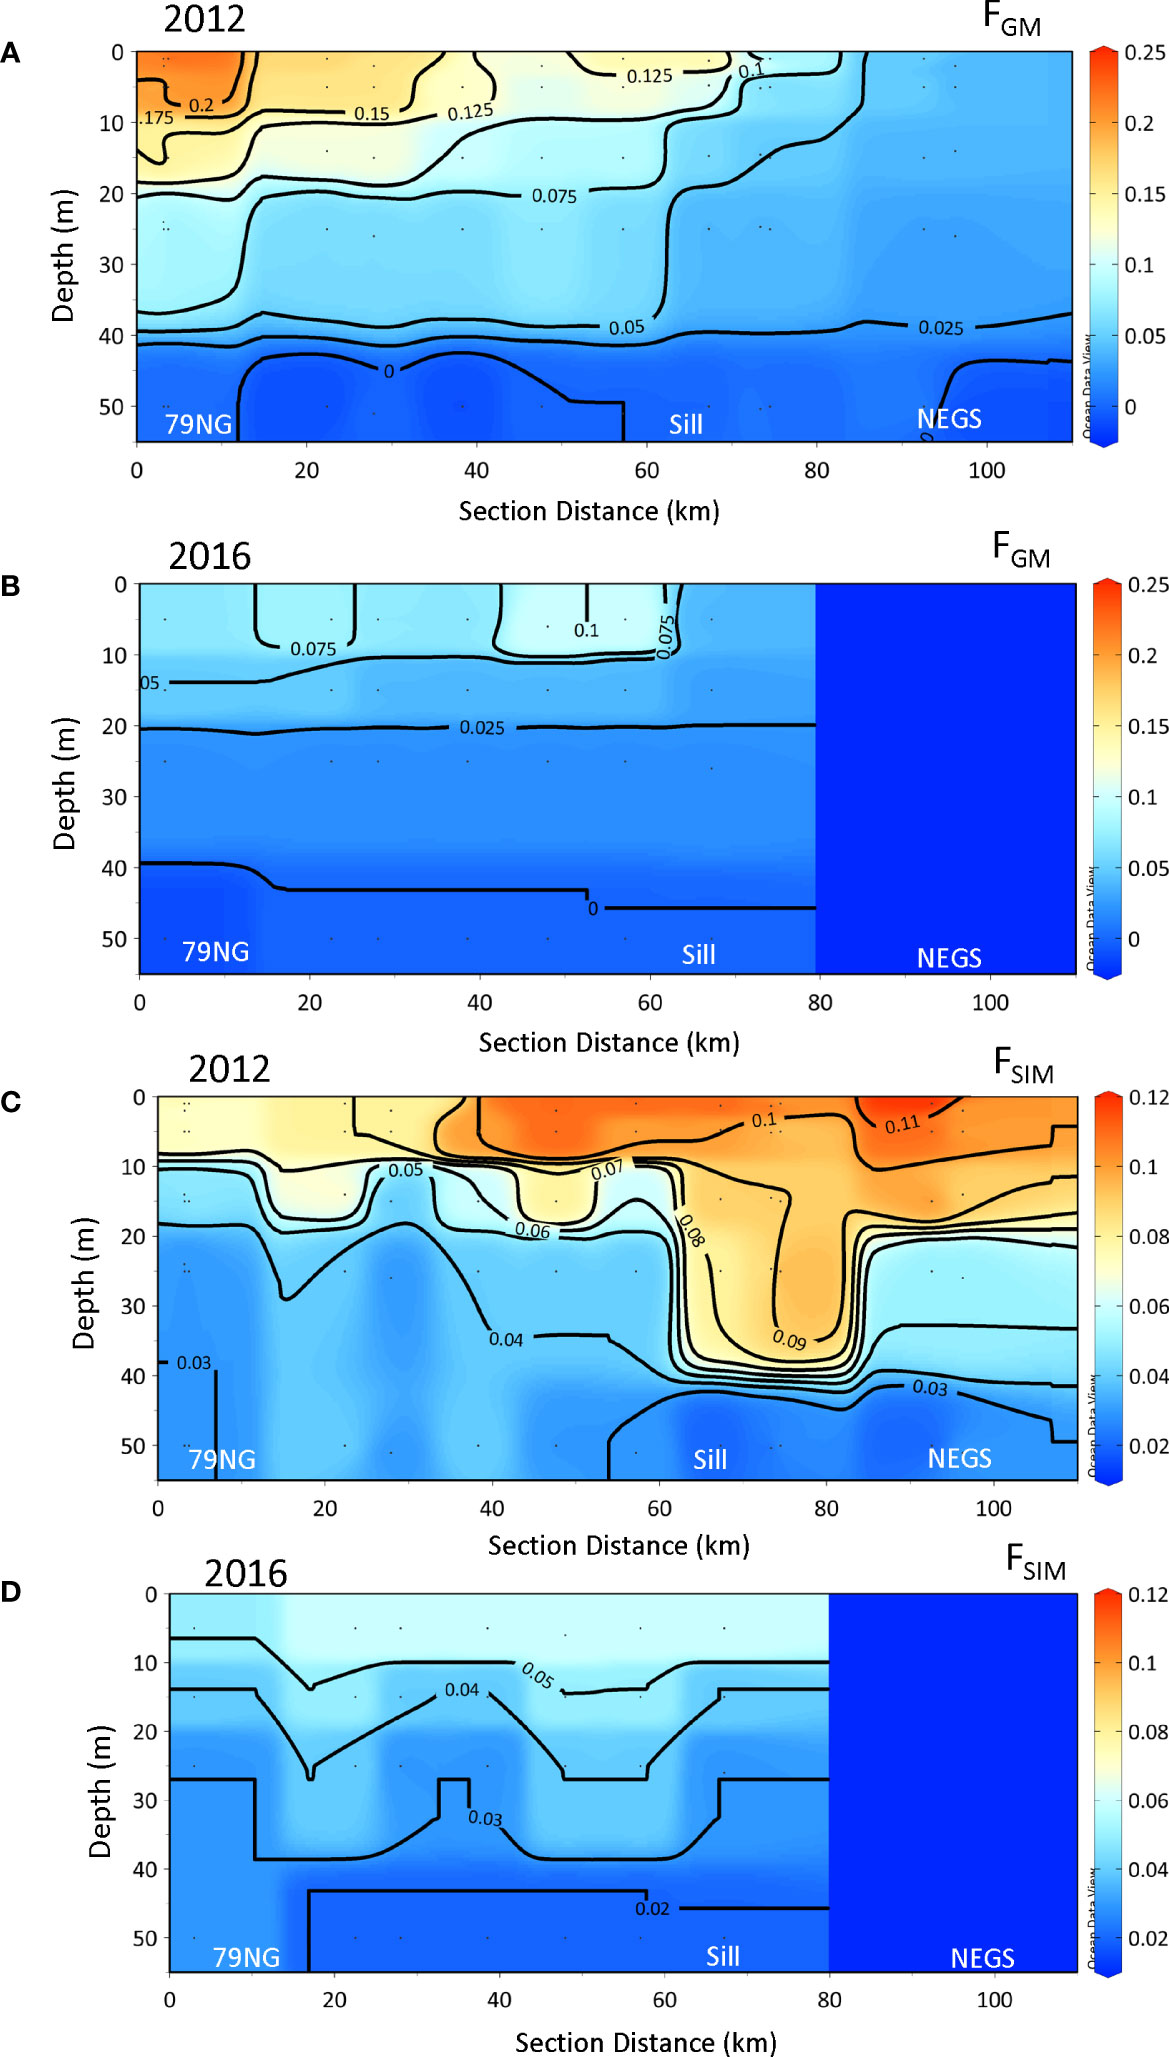
Figure 5 The distribution of glacial meltwater fractions (FGM) and sea-ice meltwater fractions (FSIM) in 2012 (A, C) and in 2016 (B, D) from the 79NG front (distance 0 km) in Dijmphna Sound (DS) to the Northeast Greenland shelf (NEGS). The dark-blue area on the NEGS in 2016 indicates no data.
In SL in DS in 2012 and 2016, the ATFWEM values were 467 ± 18 µmol kg−1 (n = 48) and 411 ± 14 µmol kg−1 (n = 30), respectively (Figure 6A). On the NEGS, ATFWEM in SL in both years (not shown) were lower than in DS, with an ATFWEM of 299 ± 15 µmol kg−1 in 2012 (n = 29) and 336 ± 12 µmol kg−1 (n = 8) in 2016. The ATFWEM 2016 values on the NEGS were based on eight values so they should be taken with caution.
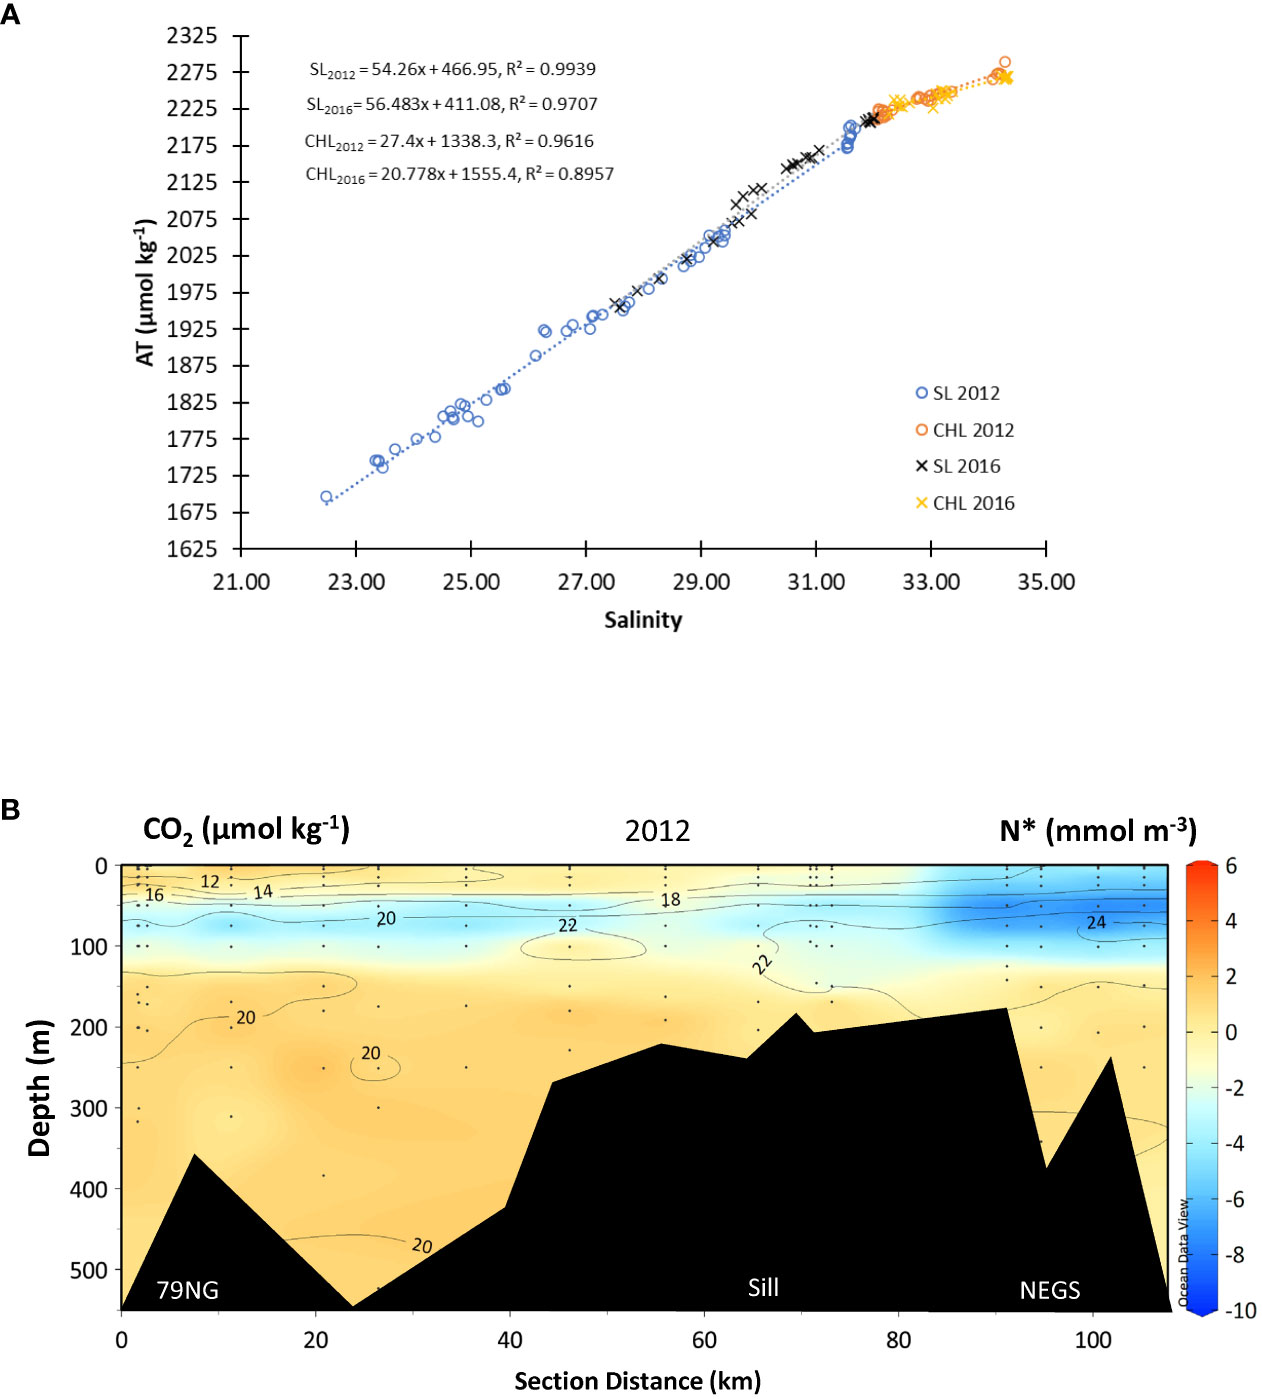
Figure 6 Linear relationships between (A) total alkalinity (AT, µmol kg−1) and practical salinity to derive AT in freshwater end members (ATFWEM, intercept at y-axis) in two layers for the 2 years; surface layer (SL<50 m, in 2012, blue open circles, ATSL2012 = 54.289xS + 467, R2 = 0.99, n = 55), in 2016, black cross, ATSL2016 = 46.48xS + 411.08, R2 = 0.97, n = 29; in cold halocline layer (CHL) (2012, orange open circles, ATCHL2012 = 27.4xS + 1338, R2 = 0.96, n = 29), in 2016, yellow cross, ATCHL2016 = 20.78xS + 1555, R2 = 0.90, n = 24). R2 denotes the coefficient of determination. Linear relationship on the NEGS (not shown in figure) as follows: ATSL2012 = 59.885xS + 299.31, R² = 0.977; ATSL2016 = 59.646xS + 330.32, R² = 0.9766, ATCHL2012 = 26.043xS + 1376.3, R² = 0.9151, ATCHL2016 = 16.875xS + 1696.7, R² = 0.9452. The variability (B) of the semiconservative tracer N* (color bar, mmol m−3) overlaid with values and contours of carbon dioxide concentration (CO2, µmol kg−1) from the 79NG front to the NEGS in 2012.
The ATFWEM values were 1,338 ± 6 µmol kg−1 (n = 33) and 1,555 ± 6 µmol kg−1 (n = 24) in 2012 and 2016, correspondingly, in the CHL in DS. On the NEGS, the CHL ATFWEM were 1,361 ± 6 µmol kg−1 (in 2012, n = 21) and 1,686 ± 3 µmol kg−1 (in 2016, n = 6), hence higher in 2016 but estimated with limited number of data points, which may bias the ATFWEM estimate.
N* in SL and in the AW was positive and negative in the CHL (Figure 6B). The most negative N* of −10 µmol L−1) coincided with the highest CO2 concentration (>24 µmol kg−1) observed in the CHL, most pronounced on the NEGS (Figure 6B). This indicates that the CHL contained water with a deficit of [NO3−] relative to [PO43−] as a result of denitrification.
The ΩArFW (decreasing ΩAr) and ΩArBIO (increasing ΩAr) had almost counteracting effects on ΩArMEAS with increased FWTOT (Equation 2; Figures 7A, B). It is clear that both ΩArFW and ΩArBIO had a large impact counteracting each other (Figures 7A, B). ΩArFW had a larger impact on ΩArMEAS than ΩArBIO in both years, and most evident in 2016. In 2012, most of the ΩArFW was compensated by ΩArBIO, whereas in 2016, ΩArFW dominated. There were clear differences between the 2 years in ΔΩArFW, in both magnitude and the distribution in the water column along the section (Figures 8A, B). The largest decrease (negative) of approximately 0.4 in ΩAr caused by freshening was observed in 2012 in the SL near the 79NG front (Figure 8A). However, unexpectedly, this was where the highest ΩArMEAS was observed (Figure 4I), concurrently with the largest ΔΩArFW, indicating that ΔΩArBIO compensated the negative effects of ΔΩArFW, as observed also in Figure 7A. In 2012, the ΔΩArFW effect was three times higher than in 2016 where SL was less stratified than was observed in 2012 (Figure 8B). In 2012, the largest ΩAr increase due to ΔΩArBIO of up to 0.6 was, similar to ΔΩArFW, found at the 79NG front (Figure 8C). In 2016, high ΔΩArBIO values of 0.5 and 0.3 were only found at two stations around 20 km and 60 km from the 79NG front, respectively (Figure 8D). On the NEGS, the increase in ΩArMEAS by ΔΩArBIO was at most 0.3 in 2012 and 0.1 in 2016 (Figure 8D).
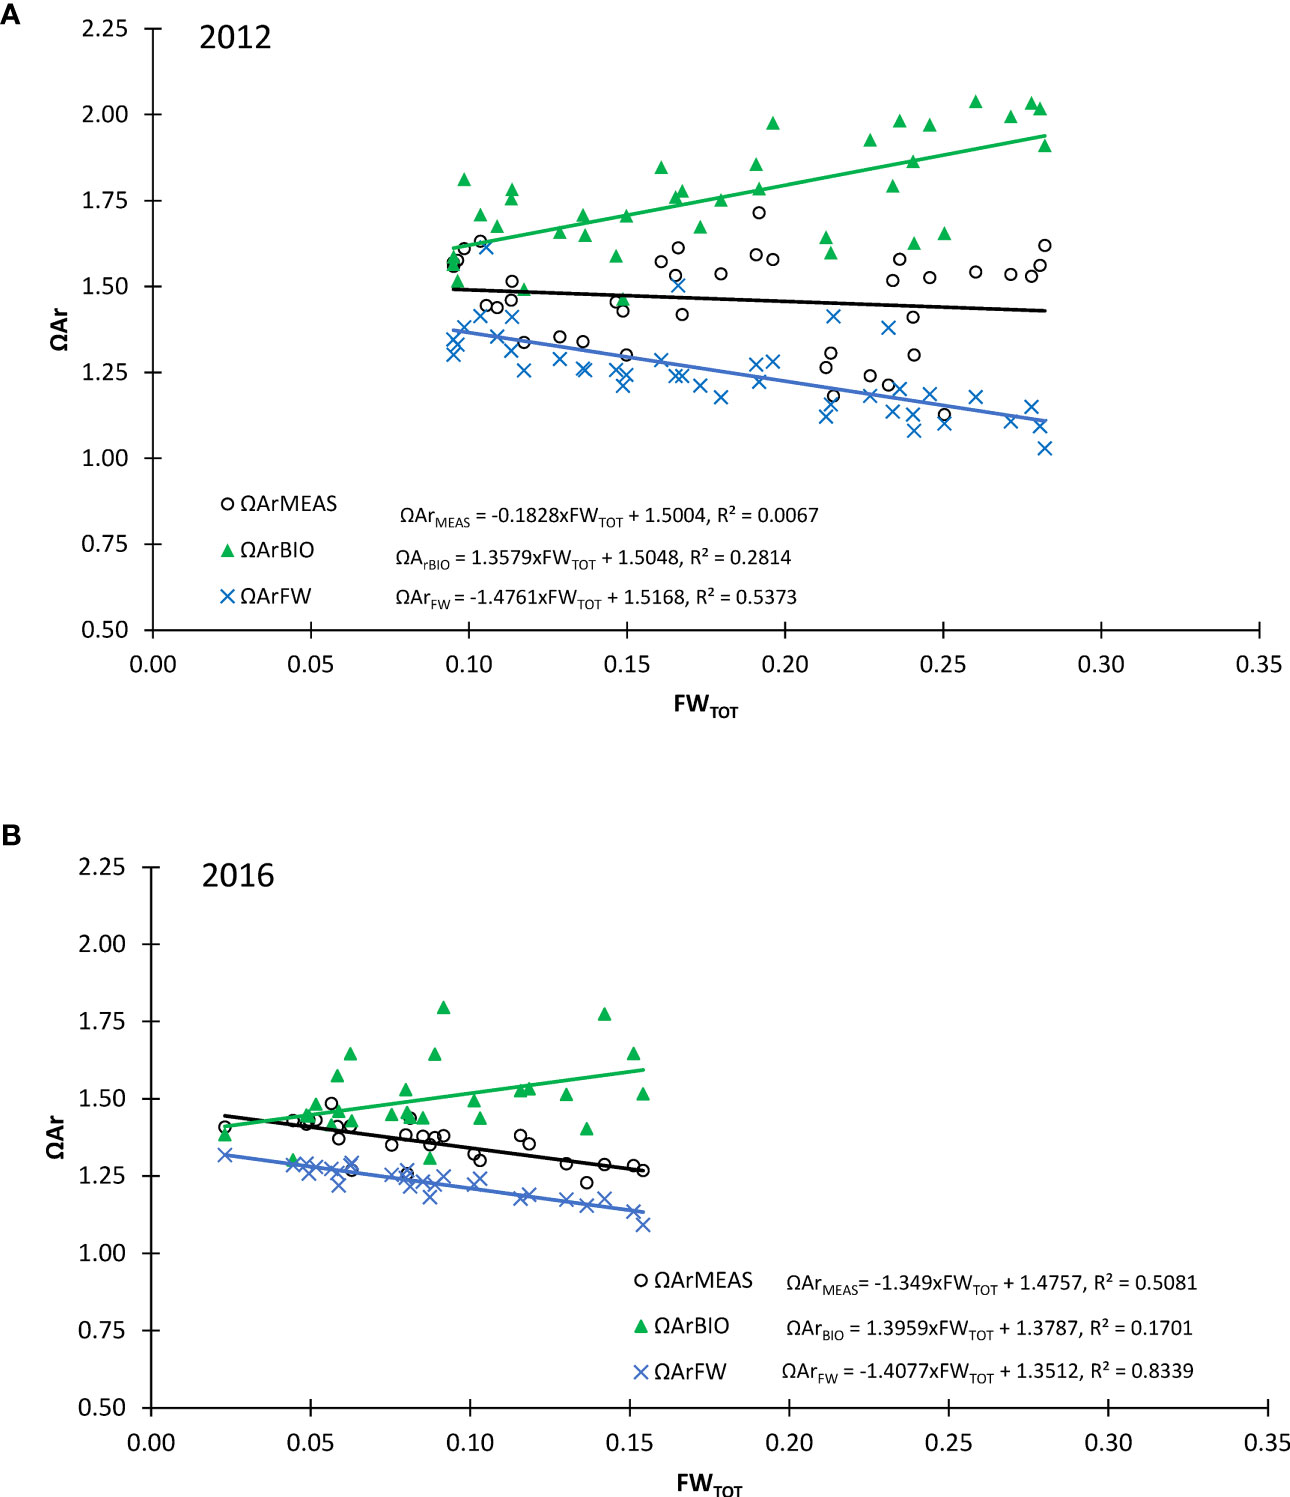
Figure 7 Aragonite saturation (ΩAr, y-axis) against total freshwater content (FWTOT, x-axis) obtained from AT and DIC (ΩArMEAS, black open circles, black regression line), the aragonite saturation due to the freshwater effect (ΩArFW, blue crosses, blue regression line), and the aragonite saturation due to the effect of biological CO2 drawdown (ΩArBIO, green pyramids, green regression line) for (A) 2012 and (B) 2016. Results of linear regression are shown in the legend and are for 2012: (ΩArBIO = 1.3579x FWTOT + 1.5048, R² = 0.2814; ΩArFW = −1.4761x FWTOT + 1.5168, R² = 0.5373; ΩArMEAS = −0.1828x FWTOT + 1.5004, R² = 0.0067) and for 2016: (ΩArBIO = 1.3959x FWTOT + 1.3787, R² = 0.1701; ΩArMEAS = −1.349x FWTOT + 1.4757, R² = 0.5081; ΩArFW = −1.4077x FWTOT + 1.3512, R² = 0.8339).
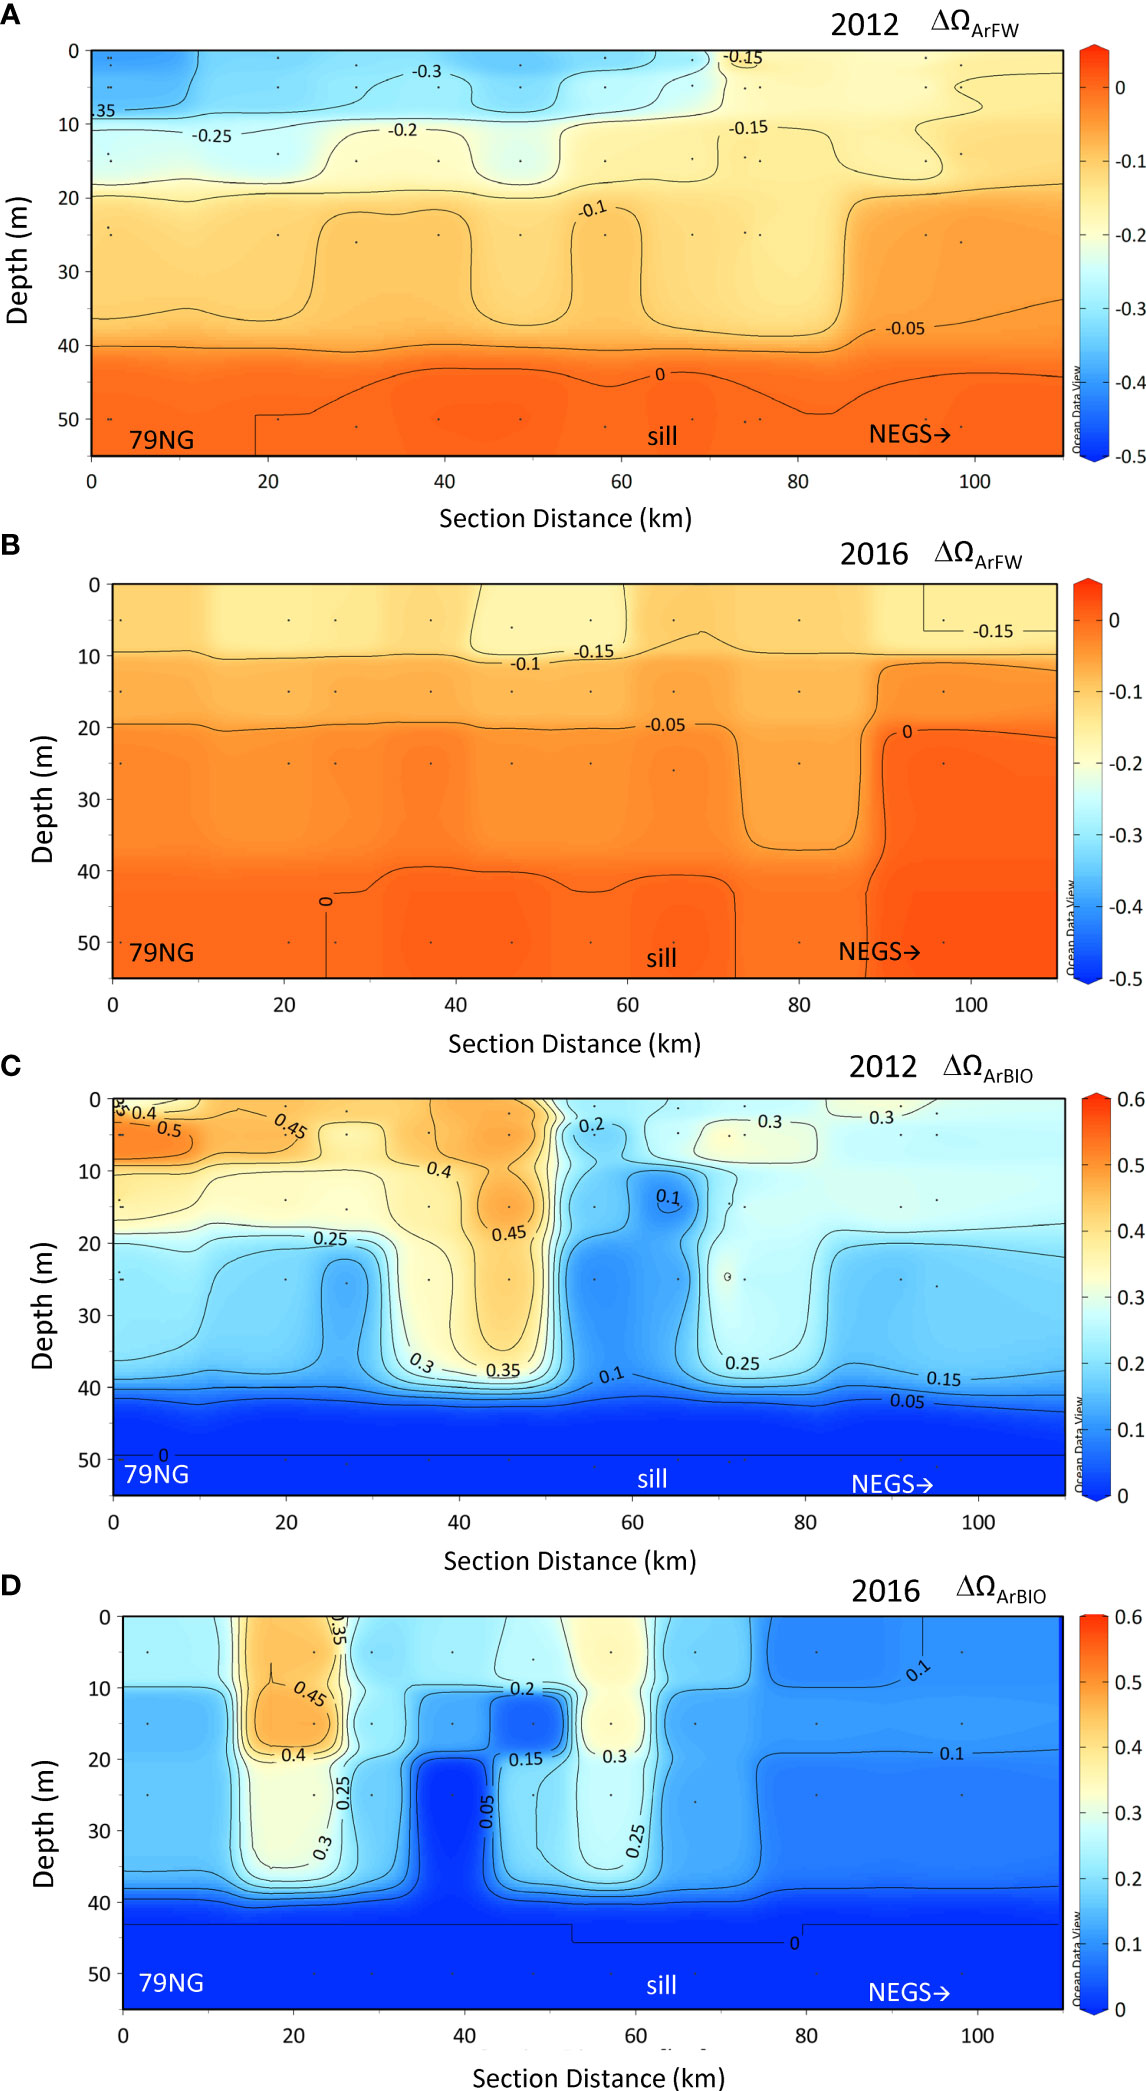
Figure 8 Change in ΔΩAr due to freshwater (ΔΩArFW) and biological CO2 drawdown (ΔΩArBIO) in 2012 (A, C) and in 2016 (B, D) in the upper 50 m. Positive values denote ΩAr increase and negative values indicate a decrease in ΩAr compared with the reference water ΩArREF.
The integrated ΔATDIFF and ΔDICDIFF (Equation 11) were generally positive (gain) in both years (Figures 9A, B) and in 2012 twice as large as in 2016. The positive ΔATDIFF and ΔDICDIFF suggested a net addition of AT or DIC. Near the 79NG front, the ΔATDIFF and ΔATGLAC (Equation 12) were almost of the same magnitude in both 2012 and 2016, suggesting that most of the ΔATDIFF can be explained by glacial water-transported carbonate minerals or sea-ice-derived ikaite (Figures 9A, B). In DS, sill, and on the NEGS, ΔATDIFF and ΔATGLAC clearly differed up to 1.5 mol C m-2, particularly observed in 2012 (Figure 9A), implying other effects than dissolved carbonate minerals. The ΔDICGLAC explained around half of the ΔDICDIFF at 79NG and in the DS in 2012.
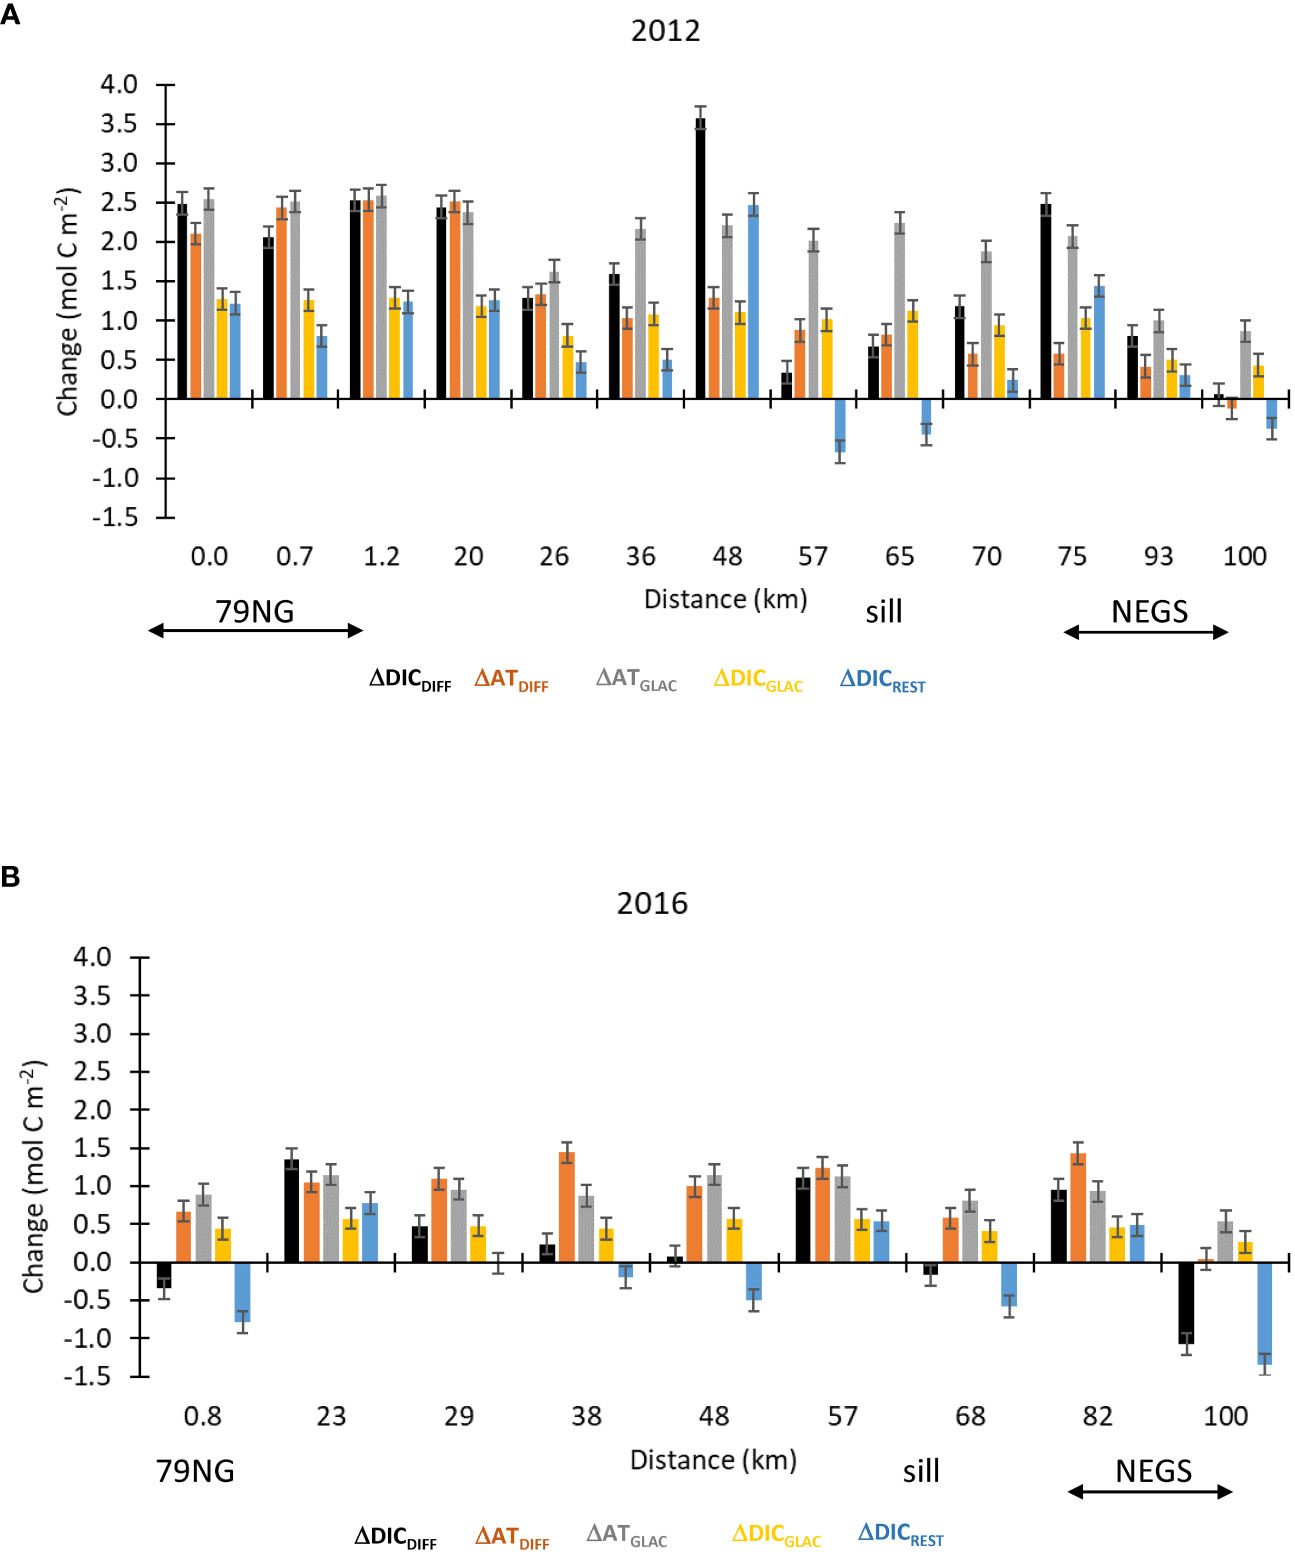
Figure 9 The integrated (trapezoidal) change in AT and DIC (mol C m−2) in the surface layer (SL) from the 79NG front to the Northeast Greenland shelf (NEGS) shown as ΔDICDIFF (black), ΔATDIFF (orange), ΔATGLAC (gray), ΔDICGLAC (yellow), and DICREST (blue) in (A) 2012 and (B) in 2016. Positive values denote a gain and negative values denotes a loss of AT or DIC. The error bars indicate the uncertainty based on cumulative error from the analytical precision in the measured parameters ( ± 0.14 mol C m−2).
In 2012, the ΔDICREST (Equation 13) was generally positive, with a maximum of 2.5 mol C m−2 suggesting a DIC gain from ocean CO2 uptake (Figure 9A). In 2016, the ΔDICREST varied between being a loss of DIC (ocean CO2 source) near the 79NG front and sill and a DIC gain (ocean CO2 uptake) in the DS (Figure 9B).
The [CO32−] related to salinity (S) in DS were generally 10–20 µmol kg−1 higher in 2012 than those in 2016 (Figure 10A). In 2016, the DS values were similar to those on the NEGS (Figure 10A). This suggests that the waters in the DS in 2016 were more influenced by water from the NEGS than in 2012. In 2016, the low AT:S (<70) at high δ18O (>−4‰) in the DS indicated more seawater influence (AT:S of 67; Fransson et al., 2020), as was also observed on the NEGS (Figure 10B). In 2012 in DS, the AT:S was up to 75.5 at a δ18O of −9‰, confirming carbonate minerals contributing to AT in the meltwater (Figure 10B).
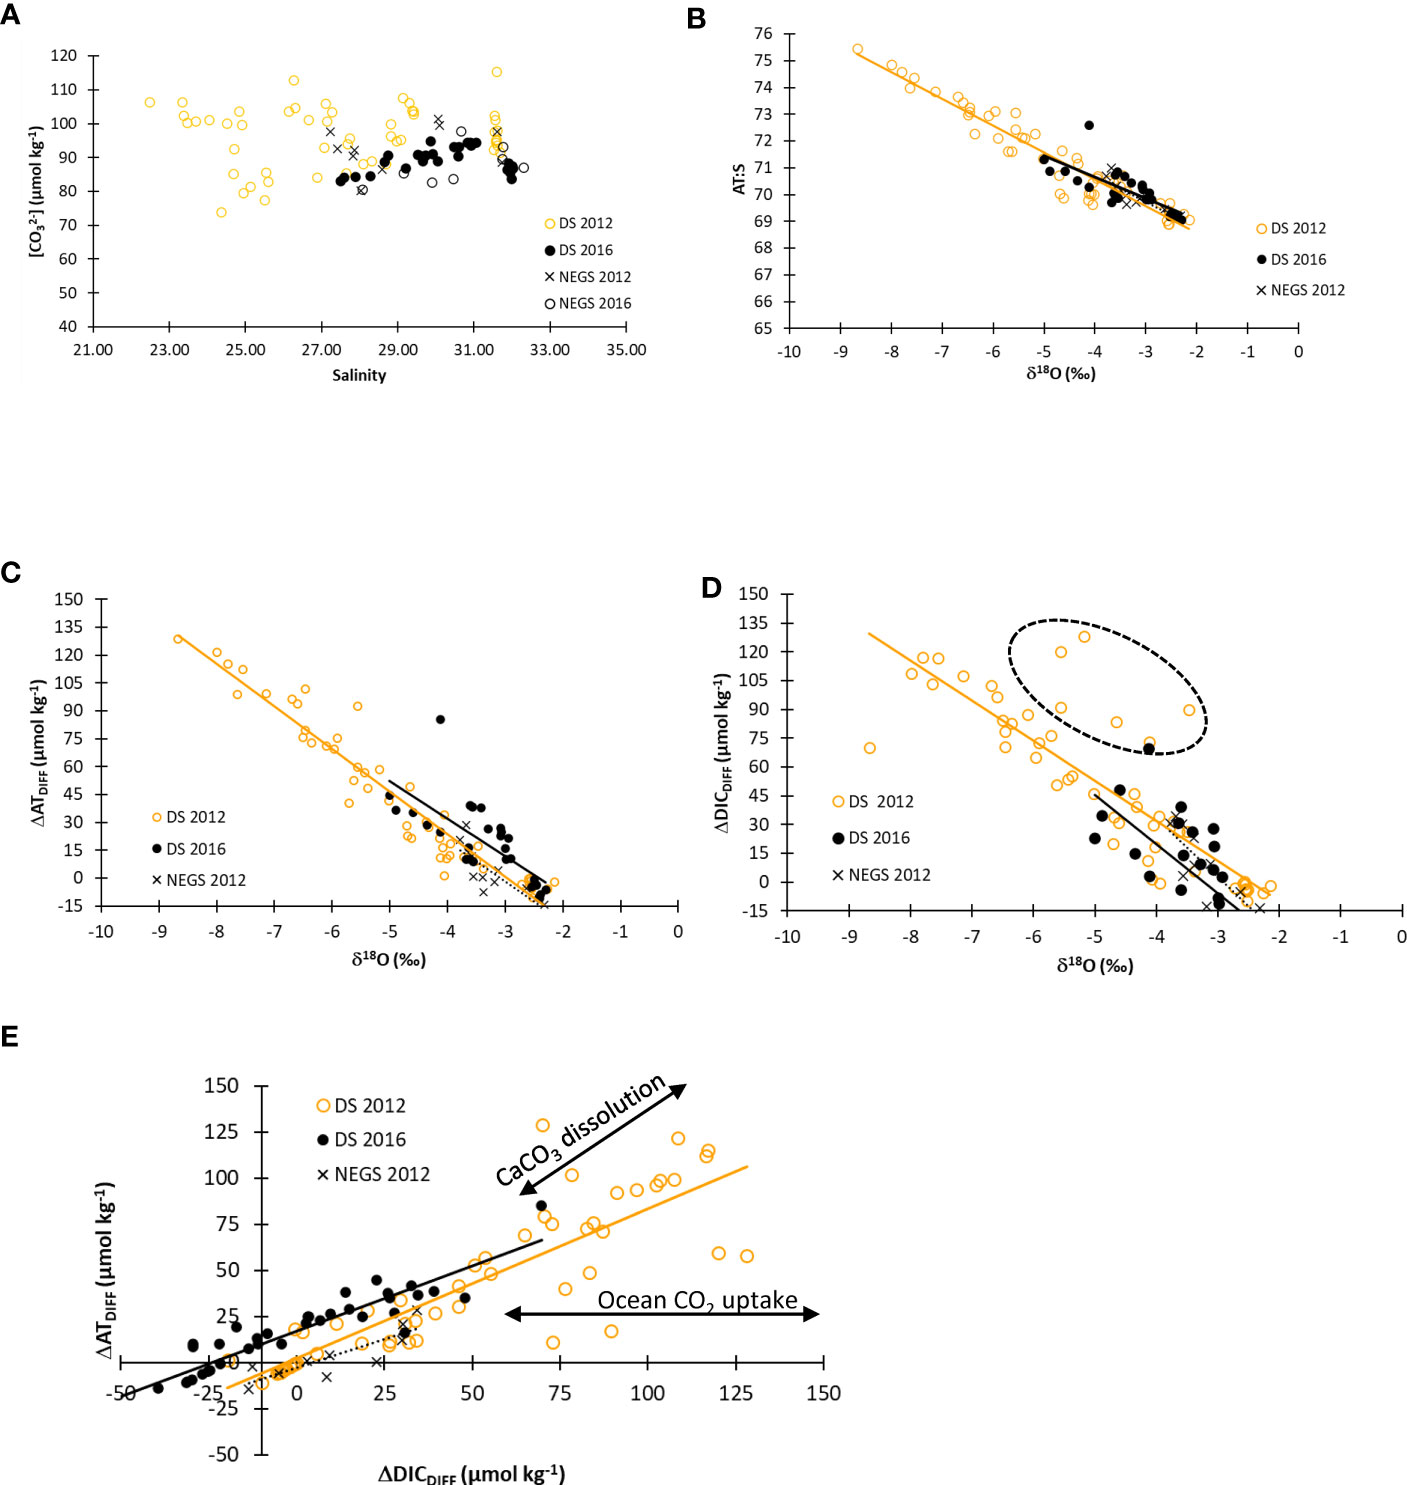
Figure 10 (A) Carbonate ion concentration ([CO32−], µmol kg−1) versus practical salinity for Dijmphna Sound (DS) in 2012 (DS 2012, yellow open circles) and in 2016 (DS 2016, closed black circles), and on the Northeast Greenland shelf (NEGS) in 2012 (NEGS 2012, black cross) and in 2016 (NEGS 2016, black open circles). (B) Salinity and total alkalinity ratio (AT:S, y-axis) versus δ18O (‰, x-axis). (C) ΔATDIFF (µmol kg−1) versus δ18O (‰, x-axis). (D) ΔDICDIFF (µmol kg−1) versus δ18O (‰, x-axis). (E) ΔATDIFF (µmol kg−1, y-axis) versus ΔDICDIFF (µmol kg−1, x-axis). The dashed ovals on (D) show data points deviating from the regression line. For symbol references see (A). Figures (B–D) show regression lines to indicate deviations and refer to the following, DS 2012 (yellow); DS 2016 (black); and NEGS 2012 (black dashed). Black arrows in (E) denote the effect of calcium carbonate (CaCO3) dissolution and air-sea CO2 exchange on ΔATDIFF and ΔDICDIFF.
Relations between ΔATDIFF and δ18O and between ΔDICDIFF and δ18O showed increasing ΔATDIFF and ΔDICDIFF with decreasing δ18O (Figures 10C, D). Deviations from the linear relation at ΔATDIFF vs. ΔDICDIFF indicated that processes resulted in both a loss and a gain, such as air-sea CO2 exchange and CaCO3 dissolution/precipitation (Figure 10E). ΔATDIFF values above the regression line indicated the contribution of [CO32−], adding to AT of up to 70 µmol kg−1 (Figure 10E). ΔDICDIFF values below the regression line indicated ocean CO2 uptake (increasing DIC but not AT) from the atmosphere up to 50 µmol kg−1 (Figure 10E).
Spitsbergen and southern Greenland fjords are experiencing changes in ocean chemistry due to freshening from glacial meltwater and sea-ice melt (e.g., Fransson et al., 2015; Fransson et al., 2016; Ericson et al., 2019a; Cantoni et al., 2020; Fransson et al., 2020; Henson et al., 2022), which results in lower ΩAr (e.g., Chierici and Fransson, 2009; Azetsu-Scott et al., 2010; Sejr et al., 2011; Azetsu-Scott et al., 2014) and threatens the productivity and biodiversity in these fjords. In our study, both glacial water and sea-ice melt in SL resulted in decreased ΩAr, pHT, and decreased buffering capacity in both years. The DS was affected by a marine-terminating glacier, with particularly large FGM observed in the SL near the 79NG front in 2012. This could be caused by the reported extreme melt that occurred on the GrIS in 2012 (Nghiem et al., 2012). On the NEGS and in DS in 2016, the freshwater in the SL was mostly derived from sea-ice melt.
In our study, ΩAr in the SL in DS was oversaturated (ΩAr >1) and varied between 1.13 and 1.63 in 2012 and between 1.27 and 1.43 in 2016 (Table S2). Henson et al. (2022) found large ΩAr variability including corrosive conditions in the surface at times in both the eastern side (ΩAr 0.7–3.1) and western (ΩAr 0.3–3.1) side of Greenland. In the high-latitude Cumberland Sound, Canada, Turk et al. (2016) reported ΩAr ranging from 1.9 in the surface to 1.4 in the subsurface waters. In Kongsfjorden, ΩAr was always >1, with the lowest ΩAr in the inner part of the fjord due to glacial meltwater (Fransson et al., 2016; Cantoni et al., 2020). The combined effect of freshwater dilution and atmospheric CO2 absorption in Kongsfjorden decreased ΩAr to values down to 1.07 that negatively can affect marine calcifiers (Cantoni et al., 2020). We observed the lowest AT in the warmest and freshest water in 2012, as a signal of surface warming and dilution by glacial meltwater. In 2012, the largest glacial meltwater (79NG front, Figure 5A) resulted in the largest increase in ΔΩArBIO and highest ΩArMEAS and pHT as well as the largest decrease in ΔΩArFW (Figure 8). We found that PP compensated for decreased ΩAr by 0.6–0.9 due to freshwater dilution. This implied that meltwater resulted in beneficial conditions for PP in the SL, perhaps due to stratification resulting in increased availability of inorganic nutrients. This is similar to the stratification meltwater-induced spring blooms observed at the sea-ice edge on the Arctic shelves (e.g., Chierici et al., 2019). This contrasted with the situation in 2016 when DS was less stratified and well mixed with water derived from the NEGS where ΔΩArBIO did not fully compensate for the freshwater dilution by sea-ice meltwater (FSIM). Impacts on ΩAr due to freshwater and compensations due to biological CO2 drawdown were also reported in several West Spitsbergen (Svalbard) fjords; in Kongsfjorden, Fransson et al. (2016) found that glacial water in the inner part of Kongsfjorden decreased ΩAr by 0.7 and that PP compensated for freshwater dilution effects. Ericson et al. (2019a) found that PP resulted in the largest ΩAr increase of 0.9, observed in Tempelfjorden in June–August 2015–2017, which compensated for the decrease in ΩAr due to freshening from dilution of ions due to glacial meltwater. In other Greenland fjords and West Spitsbergen fjords, similar observations were made. Henson et al. (2022) found that ΩAr was mainly controlled by PP on the western side of Greenland whereas meltwater dilution of AT controlled the eastern side of Greenland. In the Godthåbfjorden (Greenland), Meire et al. (2015) found that the decreasing effects of AT dilution may be compensated by photosynthesis in productive Greenland fjords. However, in the absence of significant biological activity, diluted AT may lead to reduced ΩAr and corrosive conditions.
On the West Spitsbergen shelf, calcium carbonate dissolution contributed to a DIC increase of between 0.1 and 0.55 mol C m−2 in the upper 50 m from January to August based on a similar method as here (Chierici et al., 2019). This is similar to the ΔDICGLAC values in the NEGS (both years) and in DS in 2016, and around half the size as the ΔDICGLAC at the 79NG front and DS in 2012 (Figure 9A). One explanation to the twice as high contribution of carbonate minerals in 2012 at the 79NG front and in DS is the relatively larger influence of glacial meltwater, which plays a minor role on the West Spitsbergen shelf and NEGS. Chierici et al. (2019) explained that most of the CaCO3 contribution was from advected CaCO3 shells and from sea-ice meltwater ikaite dissolution.
The ΔATGLAC varied between 2.6 mol C m−2 at the 79NG front and 0.9 mol C m−2 on the NEGS (Figure 9A) in our study. Correspondingly in 2016, the ΔATGLAC varied between 0.5 mol C m−2 (NEGS) and 1.2 mol C m−2 in the DS (Figure 9B). In 2012 in DS, the relation between AT:S and δ18O showed that δ18O values lower than −2‰ (−3 to −9‰) corresponded to AT:S between 70 and 75.5 (Figure 10B), which has also been observed in Tempelfjorden near the glacier front (Fransson et al., 2015; Fransson et al., 2020).
ATFWEM in SL on the NEGS was (299−336 µmol kg-1), which was lower than in DS (411–467 µmol kg−1). Sea-ice meltwater in our study area had an AT value of around 150 µmol kg−1, measured in melted sea ice in western Fram Strait (Fransson and Chierici, 2023). This could potentially be another source of buffering ions as observed in West Spitsbergen fjords such as Tempelfjorden (Fransson et al., 2015; Fransson et al., 2020) and on the West Spitsbergen shelf (Chierici et al., 2019).
The Arctic rivers contribute substantially to AT in CHL with reported AT values of Arctic rivers varying between 1,000 and 1,500 µmol kg−1 (e.g., Cooper et al., 2008; Fransson et al., 2001). This is within the range of ATFWEM estimated in the CHL waters of DS and NEGS of around 1,340–1,555 µmol kg−1 and 1,360–1,690 µmol kg−1, respectively. This agrees well with the fact that Arctic rivers are a major freshwater source in the CHL, as evident from other tracers such as DOM (Stedmon et al., 2015) and the most negative N* (−10 µmol L−1; Figure 5B; Equation 14) and the highest CO2 concentration (>24 µmol kg−1) (Figure 5B), from mineralized organic carbon in the CHL (Figure 5B). This is consistent with the findings by Anderson et al. (2013), which further support the origin of CHL from the Arctic shelves.
ΔDICREST (Equation 13) indicated the contribution of air-sea CO2 exchange to the DIC change, where the positive values in large parts in DS in 2012 denoted a gain in DIC due to ocean CO2 uptake (Figure 9A). In 2012, the ΔDICREST was maximum 2.5 mol C m−2 (Figure 9A). Chierici et al. (2019) found that the ocean acted as a CO2 sink of up to 2.1 mol C m−2 with an average of 1 mol C m−2 on the West Spitsbergen shelf in August. However, by the end of August, the ocean showed a CO2 loss to the atmosphere of around 0.7 mol C m−2 (Chierici et al., 2019). In our study, we find a loss of up to 1.5 mol C m−2 on the NEGS in 2016 (Figure 9B). In Tempelfjorden, there was estimated an ocean CO2 sink of 0.8 mol C m−2 in the upper 20 m (Fransson et al., 2015).
Both years had surface fCO2 values that were lower than the atmospheric CO2 level of 415 µatm (Ny-Ålesund, Zeppelin Mountain), most pronounced in 2012 where fCO2 was as low as around 140 µatm at the 79NG front and around 250 µatm on the NEGS (Figure 4E). In 2016, fCO2 was around 275−300 µatm throughout the section (Figure 4F). Undersaturated surface fCO2 was caused by both PP and meltwater and resulted in a capacity to take up atmospheric CO2, particularly in 2012. Meire et al. (2015) also found surface fCO2 (i.e., pCO2 in their study) values in August between 100 µatm and 120 µatm at the inner fjord near the GrIS, which is similar to our values in 2012 at 79NG front. Meire et al. (2015) explained the low fCO2 caused by high glacial meltwater input and PP during the summer months. In Tempelfjorden (W. Spitsbergen), the lowest surface fCO2 was 140 µatm in summer (Ericson et al., 2019a), similar to our study in 2012. In Young Sound, NE Greenland, an annual ocean CO2 uptake of 2.7 mol CO2 m−2 yr−1 was estimated by Sejr et al. (2011), which was similar to the estimated CO2 uptake in Adventfjorden, West Spitsbergen, by Ericson et al. (2019b). These studies were based on seasonal in situ fCO2 observations and thus a different time scale than in our method. We used an integrated approach of drivers in the upper 50 m based on concentrations in a reference water; hence, it is difficult for direct comparison of the results. However, using our data (fCO2, S, T) in the surface water (upper 15 m), the atmospheric level of 415 µatm, and the mean August wind speed of 7 m s−1 by Wanninkhof (2014) flux formulation, we obtained a mean monthly ocean CO2 sink of 0.9 ± 0.2 mol C m−2 in 2012 and 0.6 ± 0.1 mol C m−2 in 2016. Assuming 3 months of open water for air-sea exchange, this means 2.7 and 1.8 mol C m−2 for 2012 and 2016, respectively. Similar estimates were conducted for Tempelfjorden, where the ocean CO2 sink corresponded to 0.11 mol m−2 month−1 and 0.8 mol C m−2 for the open water period (Fransson et al., 2015). This calculation shows the potential for our area to act as a CO2 sink caused by both freshening and PP.
Contribution of organic acids to AT in coastal areas, fjords, and estuaries usually results in high AT at low salinities (Liang et al., 2020). Organic acids are mainly found in waters with high dissolved organic matter. To have a significant influence on AT, the concentrations of acids must be >10 µmol kg−1, and this has been observed in bays with restricted seawater exchange and large anthropogenic influence (e.g., Liang et al., 2020) and in culture studies and highly productive coastal sites with high inorganic [NO3−] (70 mol kg−1; Ko et al., 2016) and dissolved organic carbon (DOC; up to 10 times seawater concentrations). In our study, there was little organic matter supplied by local runoff (Stedmon et al., 2015) and low-turbidity surface water (Granskog et al., in review) and we could not observe any clear deviations based on the AT-S relationship (Figure 6A). Moreover, the largest deviation from ΔAT-ΔDIC relationship was observed in the ΔDIC and not in the ΔAT values (Figures 10C, D). This implies that there is no clear evidence of organic acids/bases that can influence AT values to a significant degree. Other studies from Greenland show that the DOC concentrations in the glacial runoff from the GrIS were low and at most 15 µmol L−1 (<1 mg L−1) and the DOC originated from river runoff (Paulsen et al., 2017). In the DS and NEGS, there are no river runoff; thus, the DOC concentration was likely too low to have any significant effects on AT in our study.
Carbonate minerals in the SL water samples, derived from the bedrock (e.g., calcite, dolomite) or sea ice (e.g., ikaite), can be dissolved during analyses. This can give an increase in AT relative to S, and we investigated the deviation (excess AT) in the AT–S relationship (Figure 10E). On a few occasions in our study, we observed deviation in AT from S coinciding with a positive ATGLAC (Figure 9) particularly evident near the 79NG front, which is considered in our approach.
The effect of different C:P ratios on ΔDICBIO is directly proportional to the change in the ratio. Studies have shown large C:P variability connected to temporal and spatial variability, physical and chemical processes, and the stage and type of bloom (Anderson and Sarmiento, 1994; Tanioka et al., 2022). There are few estimates of C:P ratios on the Arctic shelves and fjords partly because most of the estimates on DICBIO use C:N ratio (Chierici et al., 2011; Frigstad et al., 2014; Jones et al., 2020). Frigstad et al. (2014) showed that the C:N ratio ranged from 6.4 to 8.8 due to regional differences. Since the change is proportional to the change in the ratio (Treguer et al., 1990), this would cause a change in DICBIO between 3% and 25%. This agrees with the relative change to DICBIO caused by the reported C:P variability of ±14 (Anderson and Sarmiento, 1994) and ±25 (Tanioka et al., 2022), which translates to a 13% to 24% change in DICBIO.
Ongoing warming and increased meltwater due to climate change will impact drivers and OA. Recently, melting of glacial ice has been reported due to the increasing presence and warming of Atlantic water (Atlantification) by marine-terminating glaciers in northeast Greenland fjords (Straneo et al., 2010; de Steur et al., 2014; Gjelstrup et al., 2022), which will further accelerate glacier melt in the GrIS. In June 2020, the Spalte Gletcher drastically split off from the 79NG and has essentially disappeared (https://eng.geus.dk/about/news/news-archive/2020/september/glacier), which in future can have implications for the hydrography and biogeochemistry in the DS. Moreover, recent findings report on a shoaling of AW (de Steur et al., 2023), so Atlantification may play a greater role in the future. Melting of sea ice on the NEGS could also increase due to the intrusion of warmer AW. Less sea ice will create both more freshwater and more open water for potentially higher CO2 uptake by the ocean. In a scenario of (1) increased freshwater leading to stronger surface water stratification, such as the situation in 2012, PP will be stimulated in a more stratified SL. Interestingly, in our study near the sill, ΔDICREST changed from the largest positive value (CO2 uptake from atmosphere) to a negative value (ocean CO2 source) in both years (Figure 9). This was also the same location where ΔΩArBIO changed from high to low values in 2012 (Figure 8C), which can be an effect of decreased stratification in SL resulting in lower ΔΩArBIO. However, at some point, stratification may limit the renewal of inorganic nutrients resulting in less compensatory effect in ΩAr by PP. Another scenario of (2) subglacial melting due to Atlantification will cause upwelling and bring nutrient-rich water to the surface that will stimulate PP and compensate and increase ΩAr. On the other hand, AW is also rich in DIC as well as AT, which can promote further ocean CO2 uptake.
Another possibility, similar to the situation in 2016, is when NEGS water was prominent in DS with relatively low ΩAr (<1.4) in SL and down to<1.2 in the CHL. Since this water was mixed in the water column, calcifying organisms have less possibility to escape unfavorable ΩAr conditions, as was discussed in Fransson et al. (2016). Moreover, autumn mixing also brings high CO2 and low ΩAr subsurface CHL waters to the surface as found in the Canadian Arctic Archipelago (Chierici et al., 2011). This is also a critical time for juveniles of some species of calcifying organisms, such as shelled butterfly snails (Limacina helicina). Projections of the change of OA state by increased meltwater showed that by accounting only for the effect of freshening, the projected undersaturation level (ΩAr<1) was found at FWTOT of 0.35 and corrosive ΩAr conditions would have been the case without the counteracting biological effect (Figure 7).
Increased glacial melt of the GrIS was measured as the increased net ablation of 2.2 m + 17% (anomaly) between January and August 2022 measured at Kronprins Christian Land station on northeast Greenland (Moon et al., 2022). The net ablation was even larger in the southeast Greenland, of 4.3 m + 21% (anomaly, at Tasiliq), indicating increased GrIS runoff. Assuming increased net ablation of the GrIS in the northeast Greenland as in the southern Greenland, surface freshening with increasingly corrosive conditions would occur earlier, as was found in the Greenland fjords by Henson et al. (2022). In 2012, an extremely high loss of GrIS due to surface melt was discovered by Nghiem et al. (2012). With the future warming and increased meltwater, our results on the higher FGM in 2012 than in 2016 and effects on ΩAr can possibly be indicative of future conditions under continued warming.
In this study, we found that the combined effects of glacial and sea-ice meltwater dilution resulted in enhanced ocean acidification in the Dijmphna Sound and Northeast Greenland shelf. However, in summer low aragonite saturation state was compensated by biological CO2 drawdown, most evident at the 79NG front in 2012. This was potentially caused by meltwater-induced surface stratification leading to favorable conditions for phytoplankton blooms. Surface waters were undersaturated in fCO2 relative to the atmospheric fCO2 level with relatively large undersaturation near the 79NG calving front, suggesting a large potential for uptake of atmospheric CO2 during the ice-free season. The low fCO2 was mainly a result of a combination of biological CO2 uptake and dilution due to freshwater. However, so far, there is limited knowledge about seasonal and interannual variability of the drivers and the effects on the ocean acidification in North Greenland fjords. Another observational challenge is the different characteristics in sill depth, bedrock composition, sea-ice cover, and biogeochemistry of fjords and coastal systems.
In a future climate of warming and freshening from increased supply of glacial meltwater and subglacial meltwater, the negative effect (lowering ΩAr) on ΩAr may surpass the positive effect (increases ΩAr) due to primary production causing a net ΩAr decrease. Apart from biological processes and freshening, other processes such as physical upwelling of CO2-rich subsurface waters also decrease ΩAr. These processes will become affected in a case of warming, increased freshwater addition, and changes in sea-ice cover and extent, which will all impose feedbacks on ocean acidification.
Changes in carbonate chemistry toward more corrosive ΩAr conditions have been observed in the Arctic Ocean and on the ice shelves, related to the loss of sea ice and increased ocean CO2 uptake (Qi et al., 2022). Polar water is transported southward downstream along the East Greenland coast, which could also affect the carbonate system, ocean acidification status, and CO2 uptake in other Greenland fjords and on the shelf. Greenland (Arctic) fjords are already facing dramatic changes from global warming, such as increased runoff from glacier melt. To assess the net impact of ongoing ocean acidification in the climate-sensitive Arctic shelves and fjords, it is necessary to understand the complex interplay of these processes in a changing climate.
The raw data supporting the conclusions of this article will be made available by the authors upon request.
AF: Conceptualization, Investigation, Formal analysis, Funding acquisition Data curation, Writing – original draft review and editing. MC: Conceptualization, Investigation, Formal analysis, Funding acquisition Data curation, Writing – original draft review and editing. MG: Investigation, – review and editing. PD: Investigation, Data curation. CS: Investigation, Data curation, -review and editing. All authors contributed to the article and approved the submitted version.
This work was supported by the Fram Centre Ocean Acidification Flagship at the FRAM - High North Research Centre for Climate and the Environment, and the European Union’s Horizon 2020 research and innovation program under grant agreement no. 820989 (project COMFORT), the Ministry of Climate and Environment, and the Ministry of Trade, Industry and Fisheries, Norway.
We are grateful for the support onboard the R/V Lance with Captain and crew for technical and logistic support during the two expeditions. We also thank the Norwegian Polar Institute logistics in Longyearbyen for logistic support and safety training. We are grateful for the constructive comments from reviewers that greatly improved the manuscript. Data will be publicly available at Norwegian Polar Data Centre at the time of publication.
The authors declare that the research was conducted in the absence of any commercial or financial relationships that could be construed as a potential conflict of interest.
All claims expressed in this article are solely those of the authors and do not necessarily represent those of their affiliated organizations, or those of the publisher, the editors and the reviewers. Any product that may be evaluated in this article, or claim that may be made by its manufacturer, is not guaranteed or endorsed by the publisher.
The Supplementary Material for this article can be found online at: https://www.frontiersin.org/articles/10.3389/fmars.2023.1155126/full#supplementary-material
Supplementary Figure 1 | The ΩAr values (A) and (B) the difference between ΩAr calculated from the carbonic constants K1 and K2 estimated by Dickson and Millero (1987), ΩArMEAS, (blue dots) and the ones derived from Lueker et al. (2000), ΩArL (yellow cross) versus temperature (°C). The dashed black line in (B) shows the mean difference (-0.004) between the ΩArMEAS and the ΩArL (ΔΩArMD-L).
Anderson L. A., Sarmiento J. L. (1994). Redfield ratios of remineralization determined by nutrient data analysis. Glob. Biogeochem. Cycles 8, 65–80. doi: 10.1029/93GB03318
Anderson L. G., Andersson P. S., Björk G., Jones E. P., Jutterström S., Wåhlström I. (2013). Source and formation of the upper halocline of the Arctic Ocean. J. Geophys. Res. Oceans 118, 410–421. doi: 10.1029/2012JC008291
Apollonio S. (1973). Glaciers and nutrients in Arctic seas. Science 180, 491–493. doi: 10.1126/science.180.4085.491
Azetsu-Scott K., Clarke A., Falkner K., Hamilton J., Jones E. P., Lee C., et al. (2010). Calcium carbonate saturation states in the waters of the Canadian Arctic Archipelago and the Labrador Sea. J. Geophys. Res. 115, C11. doi: 10.1029/2009JC005917
Azetsu-Scott K., Starr M., Mei Z.-P., Granskog M. (2014). Low calcium carbonate saturation state in an Arctic inland sea having large and varying fluvial inputs: The Hudson Bay system. J. Geophys. Res. 119 (9), 6210–6220. doi: 10.1002/2014JC009948
Bednaršek N., Naish K. A., Feely R. A., Hauri C., Kimoto K., Hermann A. J., et al. (2021). Integrated assessment of ocean acidification risks to pteropods in the northern high latitudes: regional comparison of exposure, sensitivity and adaptive capacity. Front. Mar. Sci. 8. doi: 10.3389/fmars.2021.671497
Bhatia M. P., Kujawinski E. B., Das S. B., Breier C. F., Henderson P. B., Charette M. A. (2013). Greenland meltwater as a significant and potentially bioavailable source of iron to the ocean. Nat. Geosci. 6 (4), 274–278. doi: 10.1038/ngeo1746
Cantoni C., Hopwood M. J., Clarke J. S., Chiggiato J., Achterberg E. P., Cozzi S. (2020). Glacial drivers of marine biogeochemistry indicate a future shift to more corrosive conditions in an Arctic Fjord. J. Geophys. Res. Biogeosci. 125, (11). doi: 10.1029/2020JG005633
Carlson D. F., Pasma J., Jacobsen M. E., Hansen M. H., Thomsen S. (2019). Retrieval of ice samples using the ice drone. Front. Earth Sci. 7. doi: 10.3389/feart.2019.00287
Chierici M., Fransson A. (2009). Calcium carbonate saturation in the surface water of the Arctic Ocean: undersaturation in freshwater influenced shelves. Biogeosciences 6, 2421–2432. doi: 10.5194/bg-6-2421-2009
Chierici M., Fransson A. (2018). “Arctic chemical oceanography at the edge: focus on carbonate chemistry,” in At the Edge. Ed. Wassmann P. (Stamsund, Norway: Orkana forlag), 343, ISBN: ISBN:978-82-8104-299-5.
Chierici M., Fransson A., Lansard B., Miller L. A., Mucci A., Shadwick E., et al. (2011). Impact of biogeochemical processes and environmental factors on the calcium carbonate saturation state in the Circumpolar Flaw Lead in the Amundsen Gulf, Arctic Ocean. J. Geophys. Res. 116, C00G09. doi: 10.1029/2011JC007184
Chierici M., Fransson A., Turner D., Pakhomov E. A., Froneman P. W. (2004). Variability in pH, fCO2, oxygen and flux of CO2 in the surface water along a transect in the Atlantic sector of the Southern Ocean. Deep-Sea Res. II 51, 2773–2787. doi: 10.1016/j.dsr2.2001.03.002
Chierici M., Vernet M., Fransson A., Børsheim Y. (2019). Net community production and carbon exchange from winter to summer in the Atlantic Water inflow to the Arctic Ocean. Front. Mar. Sci 6. doi: 10.3389/fmars.2019.00528
Cooper L. W., McClelland J. W., Holmes R. M., Raymond P. A., Gibson J. J., Guay C. K., et al. (2008). Flow-weighted values of runoff tracers (δ18O, DOC, Ba, alkalinity) from the six largest Arctic rivers. J. Geophys. Res. 35. doi: 10.1029/2008GL035007
Dauphinee T. M., Klein H. P. (1975). A new automated laboratory salinometer. Sea Technol. 16, 23–25.
de Steur L., Hansen E., Mauritzen C., Beszczynska-Möller A., Fahrbach E. (2014). Impact of recirculation on the East Greenland Current in Fram Strait: Results from moored current meter measurements between 1997 and 2009. Deep Sea Res. Part I: Oceanogr. Res. Pap. 92, 26–40. doi: 10.1016/j.dsr.2014.05.018
de Steur L., Sumata H., Divine D., Granskog M. A., Pavlova O. (2023). Upper ocean warming and sea ice reduction in the East Greenland Current from 2003 to 2019. Commun. Earth Environ. 4, 261. doi: 10.1038/s43247-023-00913-3
Deutsch C., Gruber N., Key R. M., Sarmiento J. L., Ganachaud A. (2001). Denitrification and N2 fixation in the Pacific Ocean. Glob. Biogeochem. Cycles 15, 483–506. doi: 10.1029/2000GB001291
Dickson A. G. (1990). Standard potential of the (AgCl(s) + 1/2H2 (g) =Ag (s) + HCl(aq)) cell and the dissociation constant of bisulfate ion in synthetic sea water from 273.15 to 318.15 K. J. Chem. Thermodyn. 22, 113–127. doi: 10.1016/0021-9614(90)90074-Z
Dickson A. G., Millero F. J. (1987). A comparison of the equilibrium constants for the dissociation of carbonic acid in seawater media. Deep-Sea Res. I 34 (10), 1733–1743. doi: 10.1016/0198-0149(87)90021-5
Dickson A. G., Sabine C. L., Christian J. R. (Eds.) (2007). Guide to Best Practices for Ocean CO2 Measurements Vol. 3 (Sidney, BC, Canada: PICES Special Publication). 191 pp.
Dodd P. A., Rabe B., Hansen E., Falck E., Mackensen A., Rohling E., et al. (2012). The freshwater composition of the Fram Strait outflow derived from a decade of tracer measurements: composition of the Fram Strait outflow. J. Geophys. Res. Oceans 117 (C110005). doi: 10.1029/2012JC008011
Epstein S., Mayeda T. (1953). Variations of 18O content of waters from natural sources. Geochim. Cosmochim. Acta 4, 213–224. doi: 10.1016/0016-7037(53)90051-9
Ericson Y., Chierici M., Falck E., Fransson A. I., Jones E. M., Kristiansen S. (2019b). Seasonal dynamics of the marine CO2 system in Adventfjorden, a West Spitsbergen fjord. Polar Res. 38, 3345. doi: 10.33265/polar.v38.3345
Ericson Y., Falck E., Chierici M., Fransson A., Kristiansen S. (2019a). Marine CO2 system variability in a high arctic tidewater-glacier fjord system, Tempelfjorden, Svalbard. Continental Shelf Res. 181, 1–13. doi: 10.1016/j.csr.2019.04.013
Fransson A., Chierici M. (2023). Chemical variables in sea ice in summers 2012 and 2016 in Fram Strait [Data set] (Norwegian Polar Institute). doi: 10.21334/npolar.2023.a3040349
Fransson A., Chierici M., Anderson L. G., Bussman I., Jones E. P., Swift J. H. (2001). The importance of shelf processes for the modification of chemical constituents in the waters of the eastern Arctic Ocean: implication for carbon fluxes. Cont. Shelf Res. 21, 225–242. doi: 10.1016/S0278-4343(00)00088-1
Fransson A., Chierici M., Anderson L. G., David R. (2004). Transformation of carbon and oxygen in the surface layer of the eastern Atlantic sector of the Southern Ocean. Deep-Sea Res. II 51 (22-24), 2757–2772. doi: 10.1016/j.dsr2.2001.12.001
Fransson A., Chierici M., Nojiri Y. (2009). New insights into the spatial variability of the surface water CO2 in varying sea ice conditions in the Arctic Ocean. Cont. Shelf Res. 29, 1317–1328. doi: 10.1016/j.csr.2009.03.008
Fransson A., Chierici M., Nomura D., Granskog M. A., Kristiansen S., Martma T., et al. (2015). Effect of glacial drainage water on the CO2 system and ocean acidification state in an Arctic tidewater-glacier fjord during two contrasting years. J. Geophys. Res. Oceans 120. doi: 10.1002/2014JC010320
Fransson A., Chierici M., Nomura D., Granskog M. A., Kristiansen S., Martma T., et al (2020). Influence of glacial water and carbonate minerals on wintertime sea-ice biogeochemistry and the CO2 system in an Arctic fjord in Svalbard. Ann. Glaciol. 61 (83), 320–340. doi: 10.1017/aog.2020.52
Fransson A., Chierici M., Hop H., Findlay H., Wold A., Kristiansen S. (2016). Late winter-to-summer change in ocean acidification state in Kongsfjorden, with implications for calcifying organisms. Polar Biol. , 1–17. doi: 10.1007/s00300-016-1955-5
Frigstad H., Andersen T., Bellerby R. G. J., Silyakova A., Hessen D. O. (2014). Variation in the seston C:N ratio of the Arctic Ocean and pan-Arctic shelves. J. Mar. Sys. 129, 214–2230. doi: 10.1016/j.jmarsys.2013.06.004
Gjelstrup V. B. C., Sejr M. K., de Steur L., Christiansen J. S., Granskog M. A., Koch B. P., et al. (2022). Vertical redistribution of principle water masses on the Northeast Greenland Shelf. Nat. Comm. 13, 7660. doi: 10.1038/s41467-022-35413-z
Halbach L., Vihtakari M. P., Duarte P., Everett A., Granskog M.A., Hop H., et al. (2019). Tidewater glaciers and bedrock characteristics control the phytoplankton growth environment in an Arctic fjord. Front. Mar. Sci. 6. doi: 10.3389/fmars.2019.00254
Hansen H. P., Koroleff F. (1999). Determination of nutrients, in Methods of Seawater Analysis. 3rd ed. Eds. Grasshoff K., Kremling K., Ehrhardt M. (Weinheim, Germany: Wiley-VCH), 159–228. doi: 10.1002/9783527613984.ch10
Henson H. C., Holding J. M., Meire L., Rysgaard S., Stedmon C. A., Stuart-Lee A., et al. (2022). Coastal freshening drives acidification state in Greenland fjords. Sci. Total Environ. 855 (2023), 158962. doi: 10.1016/j.scitotenv.2022.158962
Hopwood M. J., Carroll D., Dunse T., Hodson A., Holding J. M., Iriarte J. L. (2020). Review Article: How does glacier discharge affect marine biogeochemistry and primary production in the Arctic? Cryosphere 14, 1347–1383. doi: 10.5194/tc-14-1347-2020
Jones E., Renner A., Chierici M., Wiedmann I., Biuw M., Lødemel H. H. (2020). Seasonal dynamics of carbonate chemistry, nutrients and CO2 uptake in a sub-Arctic fjord. Elementa Sci. Anth. 8 (1), 41. doi: 10.1525/elementa.438
Johnson K.M., King A.E., McN Sieburth J. (1985). Coulometric TCO2 analyses for marine studies; an introduction. Marine Chemistry 16 (1), 61–82.
Joughin I., Fahnestock M., MacAyeal D., Bamber J. L., Gogineni P. (2001). Observation and analysis of ice flow in the largest Greenland ice stream. J. Geophys. Res. 106 (D24), 34021–34034. doi: 10.1029/2001JD900087
Khan S. A., Kjær K. H., Bevis M., Bamber J. L., Wahr J., Kjeldsen K. K., et al. (2014). Sustain mass loss of the northeast Greenland ice sheet triggered by regional warming. Nat. Climate Change 4, 292–299. doi: 10.1038/NCLIMATE2161
Ko Y. H., Lee K., Eom K. H., Han I. S. (2016). Organic alkalinity produced by phytoplankton and its effect on the computation of ocean carbon parameters. Limnol. Oceanogr. 61, 1462–1471. doi: 10.1002/LNO.10309
Krisch S., Hopwood M. J., Schaffer J., Al-Hashem A., Höfer J., Rutgers van der Loeff M. M., et al. (2021). The 79°N Glacier cavity modulates subglacial iron export to the NE Greenland Shelf. Nat. Commun. 12 (1), 3030. doi: 10.1038/s41467-021-23093-0
Liang H., Lyu L.-N., Sun C., Ding H., Wurgaft E., Yang G.-P. (2020). Low-molecular-weight organic acids as important factors impacting seawater acidification: A case study in the Jiaozhou Bay, China. Sci. Total Environ. 727 (2020), 138458. doi: 10.1016/j.scitotenv.2020.138458
Lueker T. J., Dickson A. G., Keeling C. D. (2000). Ocean pCO2 calculated from dissolved inorganic carbon, alkalinity, and equations for K1 and K2: validation based on laboratory measurements of CO2 in gas and seawater at equilibrium. Mar. Chem. 70, 105–119. doi: 10.1016/S0304-4203(00)00022-0
Lydersen C., Assmy P., Falk-Petersen S., Kohler J., Kovacs K. M., Reigstad M., et al. (2014). The importance of tidewater glaciers for marine mammals and seabirds in Svalbard, Norway. J. Mar. Sys. 129, 452–471. doi: 10.1016/j.jmarsys.2013.09.006
Macdonald R. W., Carmack E. C., McLaughlin F. A., Falkner K. K., Swift J. T. (1999). Connections among ice, runoff and atmospheric forcing in the Beaufort Gyre. Geophys. Res. Lett. 26, 2223–2226. doi: 10.1029/1999GL900508
Manno C., Bednaršek N., Tarling G. A., Peck V. L., Comeau S., Adhikari D., et al. (2017). Shelled pteropods in peril: Assessing vulnerability in a high CO2 ocean. Earth-Science Rev. 169, 132–145. doi: 10.1016/j.earscirev.2017.04.005
Mattsdotter-Bjørk M., Fransson A., Torstensson A., Chierici M. (2014). Ocean acidification state in western Antarctic surface waters: controls and interannual variability. Biogeosciences 11, 57–73. doi: 10.5194/bg-11-57-2014
Mayer C., Reeh N., Jung-Rothenhäusler F., Huybrechts P., Oerter H. (2000). The subglacial cavity and implied dynamics under Nioghalvfjerdsfjorden Glacier, NE-Greenland. Geophys. Res. Lett. 27 (15), 2289–2292. doi: 10.1029/2000GL011514
Mehrbach C., Culberson C. H., Hawley J. E., Pytkowicz R. M. (1973). Measurement of the apparent dissociation constants of carbonic acid in seawater at atmospheric pressure. Limnol. Oceanogr. 18 (6), 897–907. doi: 10.4319/lo.1973.18.6.0897
Meire L., Søgaard D. H., Mortensen J., Meysman F. J. R., Soetaert K., Arendt K. E., et al. (2015). Glacial meltwater and primary production as drivers for strong CO2 uptake in fjord and coastal waters adjacent to the Greenland Ice Sheet. Biogeosciences 12 (8), 2347–2363. doi: 10.5194/bg-12-2347-2015
Moon T.A., Mankoff K.D., Fausto R.S., Fettweis X., Loomis B.D., Mote T.L., et al (2022). Greenland Ice Sheet, Arctic Report Card Druckenmiller M.L., Thoman R.L., Moon T.A. doi: 10.25923/c430-hb50
Mucci A. (1983). The solubility of calcite and aragonite in seawater at various salinities, temperatures and at one atmosphere pressure. Am. J. Sci. 283, 781–799. doi: 10.2475/ajs.283.7.780
Nghiem S. V., Hall D. K., Mote T. L., Tedesco M., Albert M. R., Keegan K., et al. (2012). The extreme melt across the Greenland ice sheet in 2012. Geophys. Res. Lett. 39, L20502. doi: 10.1029/2012GL053611
Niemi A., Bednaršek N., Michel C., Feely R. A., Williams W., Azetsu-Scott K., et al. (2021). Biological impact of ocean acidification in the Canadian Arctic: widespread severe pteropod shell dissolution in Amundsen Gulf. Front. Mar. Sci. 8. doi: 10.3389/fmars.2021.600184
Orr J. C., Epitalon J.-M., Dickson A. G., Gattuso J.-P. (2018). Routine uncertainty propagation for the marine carbon dioxide system. Mar. Chem. 207, 84–107. doi: 10.1016/j.marchem.2018.10.006
Paulsen M. L., Nielsen S. E. B., Müller O., Møller E. F., Stedmon C. A., Juul-Pedersen T., et al. (2017). Carbon bioavailability in a high arctic fjord influenced by glacial meltwater, NE Greenland. Front. Mar. Sci. 4. doi: 10.3389/fmars.2017.00176
Pierrot D., Lewis E., Wallace D. W. R. (2006). MS Excel Program developed for CO2 system calculations (Oak Ridge, Tennessee: Carbon Dioxide Information Analysis Center, Oak Ridge National Laboratory, U.S. Department of Energy).
Qi D., Ouyang Z., Chen L., Wu Y., Lei R., Chen B., et al. (2022). Climate change drives rapid decadal acidification in the Arctic Ocean from 1994 to 2020. Science 377, 1544–1550. doi: 10.1126/science.abo0383
Redfield A., Ketchum B. H., Richards F. A. (1963). “The influence of organisms on the composition of sea water,” in The Sea, vol. 2 . Ed. Hill M. N. (New York, USA: Interscience), 26–77.
Rignot E., Box J. E., Burgess E., Hanna E. (2008). Mass balance of the Greenland ice sheet from 1958 to 2007. Geophys. Res. Lett. 35, L20502. doi: 10.1029/2008GL035417
Rignot E., Koppes M., Velicogna I. (2010). Rapid submarine melting of the calving faces of West Greenland glaciers. Nat. Geosci. 3, 187–191. doi: 10.1038/ngeo765
Roy R. N., Roy L. N., Vogel K. M., Porter-Moore C., Pearson T., Good C. E., et al. (1993). The dissociation constants of carbonic acid in seawater at salinities 5 to 45 and temperatures 0 to 45C. Mar. Chem. 44, 249–267. doi: 10.1016/0304-4203(93)90207-5
Rysgaard S. S., Glud R. N., K. Lennert K., Cooper M., Halden N., Leakey R. J. G. (2012). Ikaite crystals in melting sea ice-implications for pCO2 and pH levels in Arctic surface waters. Cryosphere 6, 901–908. doi: 10.5194/tc-6-901-2012
Sejr M. K., Krause-Jensen D., Rysgaard S., Sørensen L. L., Christensen P. B., Glud R. N. (2011). Air–sea flux of CO2 in arctic coastal waters influenced by glacial melt water and sea ice. Tellus 63B, 815–822. doi: 10.1111/j.1600-0889.2011.00540.x
Spalding C., Finnegan S., Fischer W. W. (2017). Energetic costs of calcification under ocean acidification. Global Biogeochem. Cycles 31, 866–877. doi: 10.1002/2016GB005597
Stedmon C. A., Granskog M. A., Dodd P. A. (2015). An approach to estimate the freshwater contribution from glacial melt and precipitation in East Greenland shelf waters using colored dissolved organic matter (CDOM). J. Geophys. Res. Oceans 120, 1107–1117. doi: 10.1002/2014JC010501
Straneo F., Hamilton G. S., Sutherland D. A., Stearns L. A., Davidson F., Hammill M. O., et al. (2010). Rapid circulation of warm subtropical waters in a major glacial fjord in East Greenland. Nat. Geosci. 3, 182–186. doi: 10.1038/NGEO764
Sulpis O., Lauvset S. K., Hagens M. (2020). Current estimates of K1* and K2* appear inconsistent with measured CO2 system parameters in cold oceanic regions. Ocean Sci. 16, 847–862. doi: 10.5194/os-16-847-2020
Tanioka T., Garcia C. A., Larkin A. A., Garcia N. S., Fagan A. J., Martiny A. C. (2022). Global patterns and predictors of C:N:P in marine ecosystems. 2022. Commun. Earth Environ. 3, 271. doi: 10.1038/s43247-022-00603-6
Thomsen H. H., Reeh N., Olesen O. B., Bøggild C. E., Starzer W., Weidick A., et al. (1997). The Nioghalvfjerdsfjorden glacier project, North-East Greenland: a study of ice sheet response to climatic change. Geol. Greenland Survey Bull. GEUS 176, 95–103. doi: 10.34194/GGUB.V176.5073
Treguer P., Nelson D. M., Gueneley S., Zeyons C., Morvan J., Buma A. (1990). The distribution of biogenic and lithogenic silica and the composition of particulate organic matter in the Scotia Sea and the Drake Passage during autumn 1987. Deep-Sea Res. 37, 833–851. doi: 10.1016/0198-0149(90)90009-K
Turk D., Bedard J. M., Burt W. J., Vagle S., Thomas H., Azetsu-Scott K., et al. (2016). Inorganic carbon in a high latitude estuary-fjord system in Canada’s eastern Arctic Estuar. Coast. Shelf Sci. 178 (2016), 137–147. doi: 10.1016/j.ecss.2016.06.006
von Albedyll L., Schaffer J., Kanzow T. (2021). Ocean variability at Greenland’s largest glacier tongue linked to continental shelf circulation. J. Geophys. Res. Oceans 126, 1-15, e2020JC017080. doi: 10.1029/2020JC017080
Wanninkhof R. (2014). Relationship between wind speed and gas exchange over the ocean revisited. Limnol. Oceanogr. Methods 12, 351–362. doi: 10.4319/lom.2014.12.351
Keywords: Dijmphna Sound, Nioghalvfjerdsbræ, Arctic fjord, total alkalinity, biogeochemical processes, polar water, nutrients, aragonite saturation
Citation: Fransson A, Chierici M, Granskog MA, Dodd PA and Stedmon CA (2023) Impacts of glacial and sea-ice meltwater, primary production, and ocean CO2 uptake on ocean acidification state of waters by the 79 North Glacier and northeast Greenland shelf. Front. Mar. Sci. 10:1155126. doi: 10.3389/fmars.2023.1155126
Received: 31 January 2023; Accepted: 16 August 2023;
Published: 20 October 2023.
Edited by:
Michele Giani, National Institute of Oceanography and Experimental Geophysics, ItalyReviewed by:
Gianmarco Ingrosso, National Research Council (CNR), ItalyCopyright © 2023 Fransson, Chierici, Granskog, Dodd and Stedmon. This is an open-access article distributed under the terms of the Creative Commons Attribution License (CC BY). The use, distribution or reproduction in other forums is permitted, provided the original author(s) and the copyright owner(s) are credited and that the original publication in this journal is cited, in accordance with accepted academic practice. No use, distribution or reproduction is permitted which does not comply with these terms.
*Correspondence: Agneta Fransson, YWduZXRhLmZyYW5zc29uQG5wb2xhci5ubw==
Disclaimer: All claims expressed in this article are solely those of the authors and do not necessarily represent those of their affiliated organizations, or those of the publisher, the editors and the reviewers. Any product that may be evaluated in this article or claim that may be made by its manufacturer is not guaranteed or endorsed by the publisher.
Research integrity at Frontiers
Learn more about the work of our research integrity team to safeguard the quality of each article we publish.