
95% of researchers rate our articles as excellent or good
Learn more about the work of our research integrity team to safeguard the quality of each article we publish.
Find out more
ORIGINAL RESEARCH article
Front. Mar. Sci. , 31 March 2023
Sec. Marine Conservation and Sustainability
Volume 10 - 2023 | https://doi.org/10.3389/fmars.2023.1154689
 Richard S. Nemeth1*
 Elizabeth Kadison1Jonathan Jossart2
 Mahmood Shivji3
 Bradley M. Wetherbee4Jordan K. Matley5
Nassau grouper (Epinephelus striatus, Serranidae) were one of the most important fishery species in the Caribbean, but are now listed as critically endangered. Population collapse in most places occurred primarily by fishers targeting their spawning aggregation sites, where thousands of fish gathered during full moon periods from December to April. Identifying management options for protecting this vulnerable period is crucial for their survival. In the US Virgin Islands, we tagged 24 Nassau grouper with acoustic transmitters at a fish spawning aggregation (FSA) site called the Grammanik Bank, a 1.5 km2, marine protected area (MPA) closed each year from February to April. We tracked their movements over a seven-year period and found that the small MPA protected Nassau grouper only 65% of time during the spawning season. Nassau grouper arrived at the FSA from January to May, with a peak in March, and made daily roundtrip migrations (1-25 km) from the FSA site. Females swam twice as far as males, while males were more sedentary and remained longer (22 d) at the FSA than females (9 d); behavioural characteristics that may cause differential bycatch mortality among sexes. We also found nearly half of all fish were temporary residents within 5 km of the FSA site for 2 to 6 months after the spawning season. This mismatch of MPA size and timing of closed season provided the impetus for developing new guidelines for protection. The large acoustic array allowed us to calculate spatially relevant areas useful for conservation including courtship arena (1.2 km2), staging area (4.7 km2) and primary migration pathways (9.6 km2) used by Nassau grouper during spawning season. To improve conservation goals of this endangered species, increasing the Grammanik Bank seasonal closure to five months and its size to 6.4 km2 would increase protection to >96%. These spatial and temporal changes to existing management regulations incorporate the best available data to improve conservation goals by reducing potential bycatch mortality, eliminating disturbance of spawning fish, and protecting critical spawning habitat for Nassau grouper. These guidelines may also be applied more broadly to other Nassau grouper FSA sites located on large insular or continental shelfs areas throughout the Caribbean.
Fish spawning aggregations (FSA) are unique life history events that occur at specific places and times. Over 200 species of fish from 44 families are known to form FSAs (Russell et al., 2014). This diversity of species shows a range of behaviors, with some fish making frequent short trips to nearby spawning sites (i.e. resident spawners), while others migrate long distances to spawning sites a few times a year (i.e. transient spawners) (Domeier and Colin, 1997; Claydon, 2004; Nemeth, 2009).
When FSAs are targeted by fishers, the aggregating species are extremely vulnerable to exploitation due to their predictability in space and time (Olsen and LaPlace, 1978; Aguilar-Perera, 2006; Hughes et al., 2020). The removal of large numbers of reproductive individuals at a FSA site can dramatically affect local population abundance (Beets and Friedlander, 1999; Nemeth, 2005). Short-term economic benefits for fishers however, have come at a severe cost, resulting in the decline and loss of nearly half of all known FSAs around tropical regions of the world (Sadovy de Mitcheson et al., 2008). Groupers in particular are at risk, with 50% of all species that form spawning aggregations listed as threatened (IUCN 2006), mainly due to unregulated fishing at FSA sites (Sadovy de Mitcheson et al., 2013; Russell et al., 2014).
In the Caribbean, most grouper spawning aggregations have been severely depleted or extirpated (Olsen and LaPlace, 1978; Sadovy, 1994; Beets and Friedlander, 1999; Sala et al., 2001). Seasonal and permanent fisheries closures around fish spawning areas and market closures during spawning seasons can be effective ways of protecting spawning fish during this vulnerable life history event (Sadovy, 1994; Sluka et al., 1997; Bohnsack, 1998; Sadovy de Mitcheson, 2016). Although the approximate locations and timing of many spawning aggregations are known, species- and site-specific migration pathways and movement patterns of fish around their spawning aggregation sites are largely unknown. Such information is very useful for effective management where, in many cases, fishery closed areas or other protective measures could be implemented in efforts to better manage stocks. Management actions based on sound science and stakeholder engagement provide clear conservation benefits as well as encouraging fisher and other user group compliance (Crisafulli et al., 2018; Giakoumi et al., 2018).
Recent studies using acoustic telemetry, a technique in which fish are tagged with ultrasonic transmitters and tracked using underwater acoustic receivers, have illustrated considerable variation in timing and residency at spawning aggregation sites for a diversity of marine and estuarine species including snappers (Biggs and Nemeth, 2016; Feeley et al., 2018), groupers (Semmens et al., 2007; Starr et al., 2007; Nanami et al., 2014; Rhodes et al., 2014; Rowell et al., 2015; Mourier et al., 2019; Blincow et al., 2020), queen triggerfish (Balistes vetula, Balistidae) (Bryan et al., 2019), Atlantic cod (Gadus morhau, Gadidae) (Siceloff and Howell, 2013; Zemeckis et al., 2014; Zemeckis et al., 2019), common snook (Centropomus undecimalis, Centropomidae) (Lowerre-Barbieri et al., 2014; Boucek et al., 2017), and seatrout (Cynocion nebulosus, Sciaenidae) (Boucek et al., 2017; Zarada et al., 2019). Within the family Lutjanidae, for example, cubera snapper (Lutjanus cyanopterus, Lutjanidae) in the United States Virgin Islands (USVI) have a distinct five-month spawning season, while at the same FSA site, dog snapper (L. jocu, Lutjanidae) aggregate to spawn every month of the year (Biggs and Nemeth, 2016).
Space use by fish at spawning aggregation sites is also highly variable among species (Heyman and Kjerfve, 2008), and is an important component to marine area management. Nemeth (2012) proposed a series of generalized, activity spaces for species that form transient spawning aggregations. At smaller scales, these activity spaces include the core spawning site or location of gamete release (< 1 km2); the courtship arena, a larger area surrounding the spawning site where courtship occurs (< 10 km2); and the staging area, occupied by fish between spawning events (10-100 km2). At the largest spatial scales the functional migration area (100-1000 km2), includes the home ranges and migration pathways of reproductively active adults using a specific FSA site; and the catchment area, which includes all functional migration areas combined, can be used by management to define a subpopulation or fish stock (Nemeth, 2012). Empirical evidence of these spatial components has emerged for a number of fish families including snappers (Biggs and Nemeth, 2016; Feeley et al., 2018), groupers (Nemeth., 2005; Nemeth, 2012; Rhodes et al., 2012) and triggerfish (Bryan et al., 2019). Understanding the inter- and intra-specific similarities and differences in reproductive behaviors relative to marine managed areas is useful for evaluating and implementing effective conservation measures (Grüss et al., 2014). This is particularly important for sites that host multiple aggregating species that differ in their vulnerability to fishing (Kadison et al., 2006; Nemeth et al., 2006; Heyman and Kjerfve, 2008; Rhodes et al., 2014).
The Nassau grouper (Epinephelus striatus, Serranidae) was once prolific, but populations have collapsed throughout the greater Caribbean region (Olsen and LaPlace, 1978; Sala et al., 2001; Aguilar-Perera, 2006; Claro et al., 2009) with very few areas showing signs of recovery (Nemeth et al., 2006; Waterhouse et al., 2020). The rarity of this iconic species throughout most of its range has made research difficult. Nassau grouper were listed by the International Union for Conservation of Nature as Threatened in 1996 (IUCN, 1996), Endangered in 2003 (Cornish & Eklund, 2003), Critically Endangered in 2018 (Sadovy et al., 2018) and listed as Threatened in 2016 by U. S. Endangered Species Act (Federal Register, 2016-15101). In the United States, Nassau grouper have been fully protected in federal waters since 1992 (Albins et al., 2009) and received protection in Territorial waters surrounding the USVI in 2006 (Virgin Islands Rules and Regulations, 2021).
Acoustic telemetry studies have provided unique insights into the movement and migration patterns of Nassau grouper in Belize (Starr et al., 2007), Bahamas (Dahlgren et al., 2016; Stump et al., 2017), Cayman Islands (Semmens et al., 2007; Blincow et al., 2020) and US Virgin Islands (Rowell et al., 2015), but spatially-explicit information that can guide management and conservation efforts at spawning aggregation sites is limited. In the United States Virgin Islands, the 1.5 km2 Grammanik Bank seasonal closed area was established in 2006 to protect a newly discovered Nassau grouper spawning aggregation site (Nemeth et al., 2006). The Grammanik Bank boundaries were determined based on underwater visual surveys of abundance and distribution patterns of Nassau grouper and other aggregating species and implemented with the support of commercial fishers and other community partners (Nemeth et al., 2006). Although early biological assessments showed a positive population response by Nassau grouper (Kadison et al., 2006), we questioned if the size and timing of the seasonal closed area was appropriate to maximize recovery potential of this endangered species. We used acoustic telemetry to provide a more comprehensive analysis of the spatial and temporal movement patterns of Nassau grouper around the Grammanik Bank spawning aggregation site. We show how behavioral patterns of movement can inform the design of biologically–relevant boundaries and timing of seasonal closures but also how our results can be used broadly for marine managed areas whose goals are to protect transient fish spawning aggregations.
The Grammanik Bank (GB) is a seasonal fishery closed area (1.5 km2, 1 February to 30 April) located 16 km south of St. Thomas, US Virgin Islands and 3 km east of the Red Hind Bank Marine Conservation District (MCD) (Figure 1). The MCD is a 41 km2 protected area where fishing is prohibited year-round. Nassau grouper were extirpated from a large spawning aggregation site within the MCD in the 1970’s (Olsen and LaPlace, 1978), but were found aggregating at the Grammanik Bank in 2003 (Nemeth et al., 2006) (Figure 1). The GB boundaries were originally determined using underwater visual surveys of fish abundance and distribution patterns and the GB was officially established in 2006 with support and consultation of commercial fishers (Nemeth et al., 2006; Kadison et al., 2010). Benthic habitats within both protected areas are 30 m to 50 m deep and consist of mesophotic coral reefs dominated by Orbicella spp. (Armstrong et al., 2006; Herzlieb et al., 2006; Smith et al., 2010) and at 80 m depth a narrow but well-developed fringing reef of Agaricia undata (Agariciidae) (Smith et al., 2019). The Grammanik Bank is located on a shelf-edge promontory, a common geomorphological feature used by many species as FSA sites (Kobara and Heyman, 2008; Heyman and Kobara, 2012), and is described in Nemeth et al. (2020).
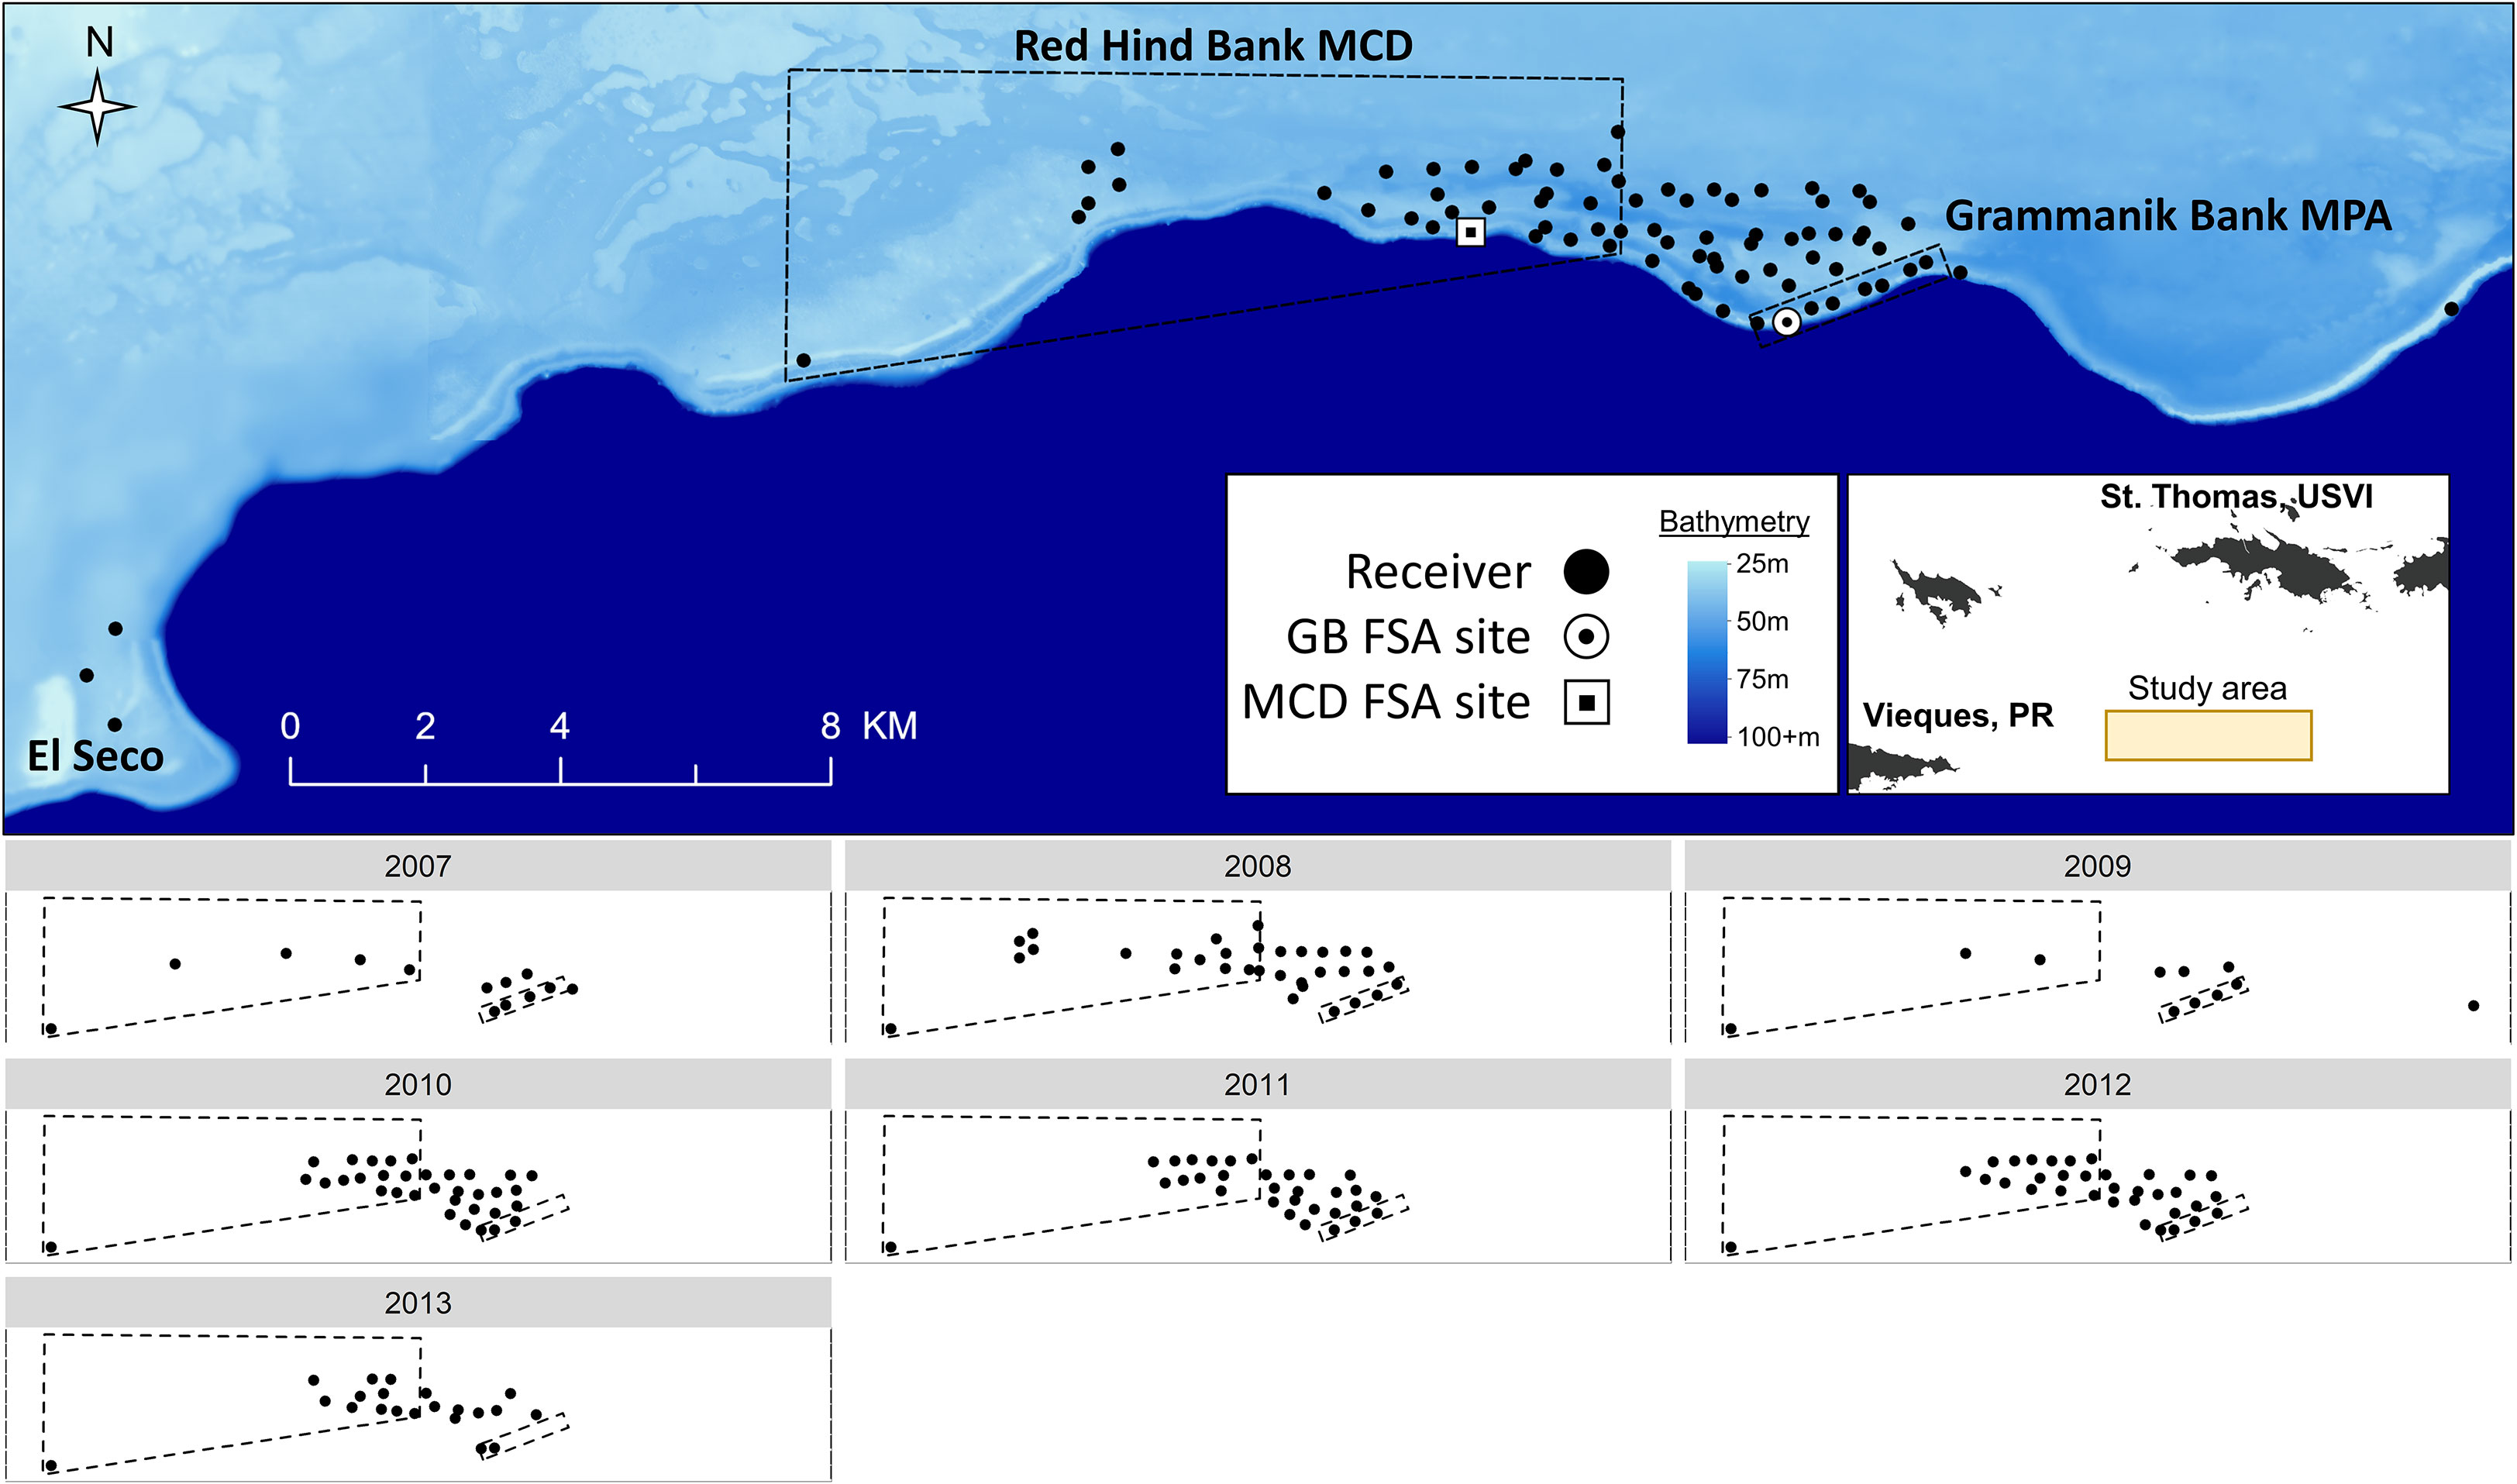
Figure 1 Acoustic receiver array used to track grouper movements at fish spawning aggregation (FSA) sites around the Grammanik Bank (GB) marine protected area (MPA) and Red Hind Bank Marine Conservation District (MCD), located 16 km south of St. Thomas, USVI. The upper panel shows the acoustic array for all years combined (2007 to 2013) situated on the Puerto Rican shelf (light blue) and adjacent to the 4000m deep Virgin Islands trough (dark blue). The lower panels show acoustic arrays for each year separately. The inset map shows location of primary study area indicated in lower panels and Vieques, Puerto Rico (PR) where three receivers detected a Nassau grouper at El Seco Reef (see upper panel).
Acoustic telemetry was used from 2007 to 2013 to document spatial and temporal patterns of movement and migration of Nassau grouper around the Grammanik Bank FSA (Figure 1). The acoustic array was expanded in size from 13 stations to 77 stations as more receivers and movement information became available, allowing us to identify courtship arena, staging areas, and migration pathways, and to determine if the historic spawning site within the MCD was still visited by migrating Nassau grouper. Acoustic receivers (Vemco VR2 and VR2W 69 kHz) were attached to polypropylene lines 10 to 15 m off the seafloor pointing downwards. Receivers were downloaded and batteries replaced every 8 to 12 months while divers performed routine biofouling removal on the mooring lines. Range testing of the receiver array is described in Jossart et al. (2017) who estimated 80% detection range for V16 transmitters was 308 m.
Nassau groupers were caught during the spawning season on or near the Grammanik Bank from 2007 to 2010 using Antillean-style fish traps baited with squid. Once on board the vessel, all fish were treated with care and were held in 100 l tubs of recirculating seawater and their over-expanded swim bladders were deflated with a sterilized hypodermic needle (14-gauge, 2.54 cm). The majority (97%) of Nassau grouper survived and were released, and most mortality (3%) was caused by barotrauma from being brought up from deep water. Each fish was measured for total length (TL) and fork length (FL) to nearest mm, sexed using a non-invasive portable ultrasound (Pie Medical Scanner, with a 3.5-5.0 Hz linear probe) following Whiteman et al. (2005), and tagged with dart tag (Floy FT-1-94) in the dorsal musculature. Fish were turned up-side-down to induce tonic immobility without anesthetics and immersed in seawater while a V16-4H (A69-1303) or V16P-4H (A69-1107 pressure) transmitter, coated in an antibiotic cream, was surgically implanted in the body cavity through a two cm incision. The incision was closed with chromatic gut or silk sutures. All surgical tools were sterilized between surgeries with iodine or 70% alcohol. Each tagged fish was transported to the reef in a mesh bag by divers, released near the collection site, and watched for several minutes to ensure recovery and prevent predation.
Acoustic telemetry data was processed and analyzed in R ver. 3.4.3 (R Foundation for Statistical Computing, Vienna, Austria). Raw detections were filtered to remove erroneous data that may have been collected from post-surgical behaviour, false detections, or dead animals (e.g., from predation). The first 24 hours of detections after the animal was released were removed to account for post-surgery recovery (Farmer and Ault, 2011). Detection profiles were explored to identify whether individuals died or expelled transmitters (Klinard and Matley, 2020). Detection data was examined for constant depth values of pressure tags over time, and if detections were limited to a specific area for prolonged time periods (i.e., months). In both cases these data were considered erroneous, and the affected portion of time was excluded from analyses. Additionally, if tagged individuals were rarely detected (e.g., left the array) and did not have a minimum of 25 total detections or were detected for less than 7 days they were removed from the dataset (n=2; Table 1).
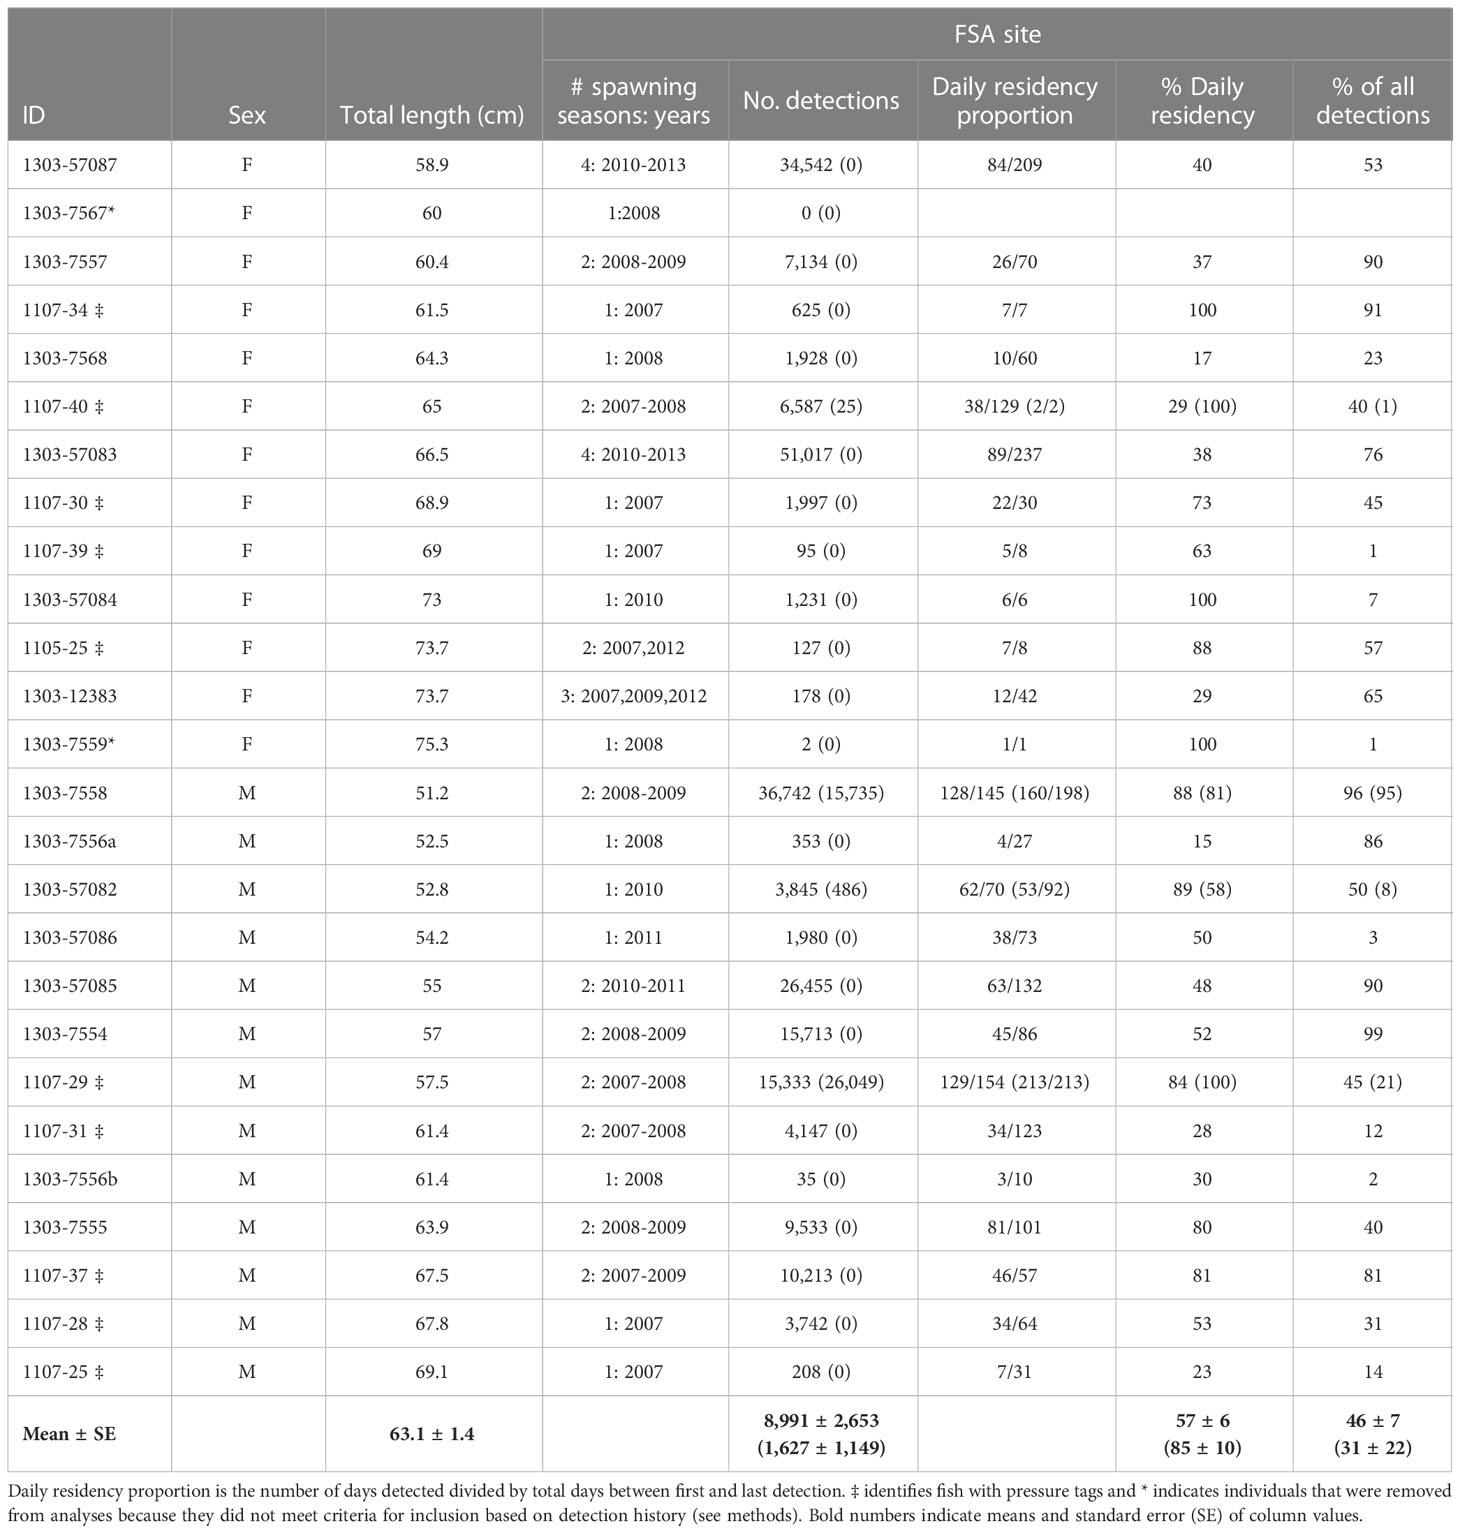
Table 1 Detection history (after data filtering) and residency summary of female (F) and male (M) Nassau grouper (n=26) detected at the Grammanik Bank fish spawning aggregation site (station 009) in the US Virgin Islands, segregated by spawning season (Dec 15 – May 15; no brackets) and non-spawning season (May 16 – Dec 14; in brackets) between 2007-2013.
Based on preliminary analysis of acoustic telemetry data, as well as previous research (Rowell et al., 2015), detections between December 15th and May 15th in any year were considered to be within the spawning season for Nassau grouper. This resulted in five possible lunar-based spawning periods during each spawning season. The location of the Grammanik Bank FSA site was designated at receiver station ‘009’ based on diver surveys and remote camera observations independent of this study (Nemeth et al., 2006; Kadison et al., 2010; Nemeth et al., 2020). Detections at (or near) this site were predicted to reflect spawning-related behavior (e.g., staging, courtship, and spawning).
Nine individuals displayed temporary residence within the larger array based on the continued presence of detections at specific locations (temporary residency sites) outside of spawning periods (Table 2). Detections within temporary residency sites were removed from analyses pertaining to spawning migrations and space use around the FSA to ensure they did not bias the interpretation of spawning-related behaviour but were retained for further residency site explorations and summary detection histories. Each temporary residency site was typically at the extreme margin of detection from the FSA site receiver, so detections incorporating movements between resident sites and the FSA site were not affected. However, data from three individuals (IDs 1107-29, 1303-7558, and 1303-57082) were removed from analyses relating to spawning migration behavior because they remained resident near the FSA site receiver and spawning vs non-spawning movements could not be distinguished (Table 2).
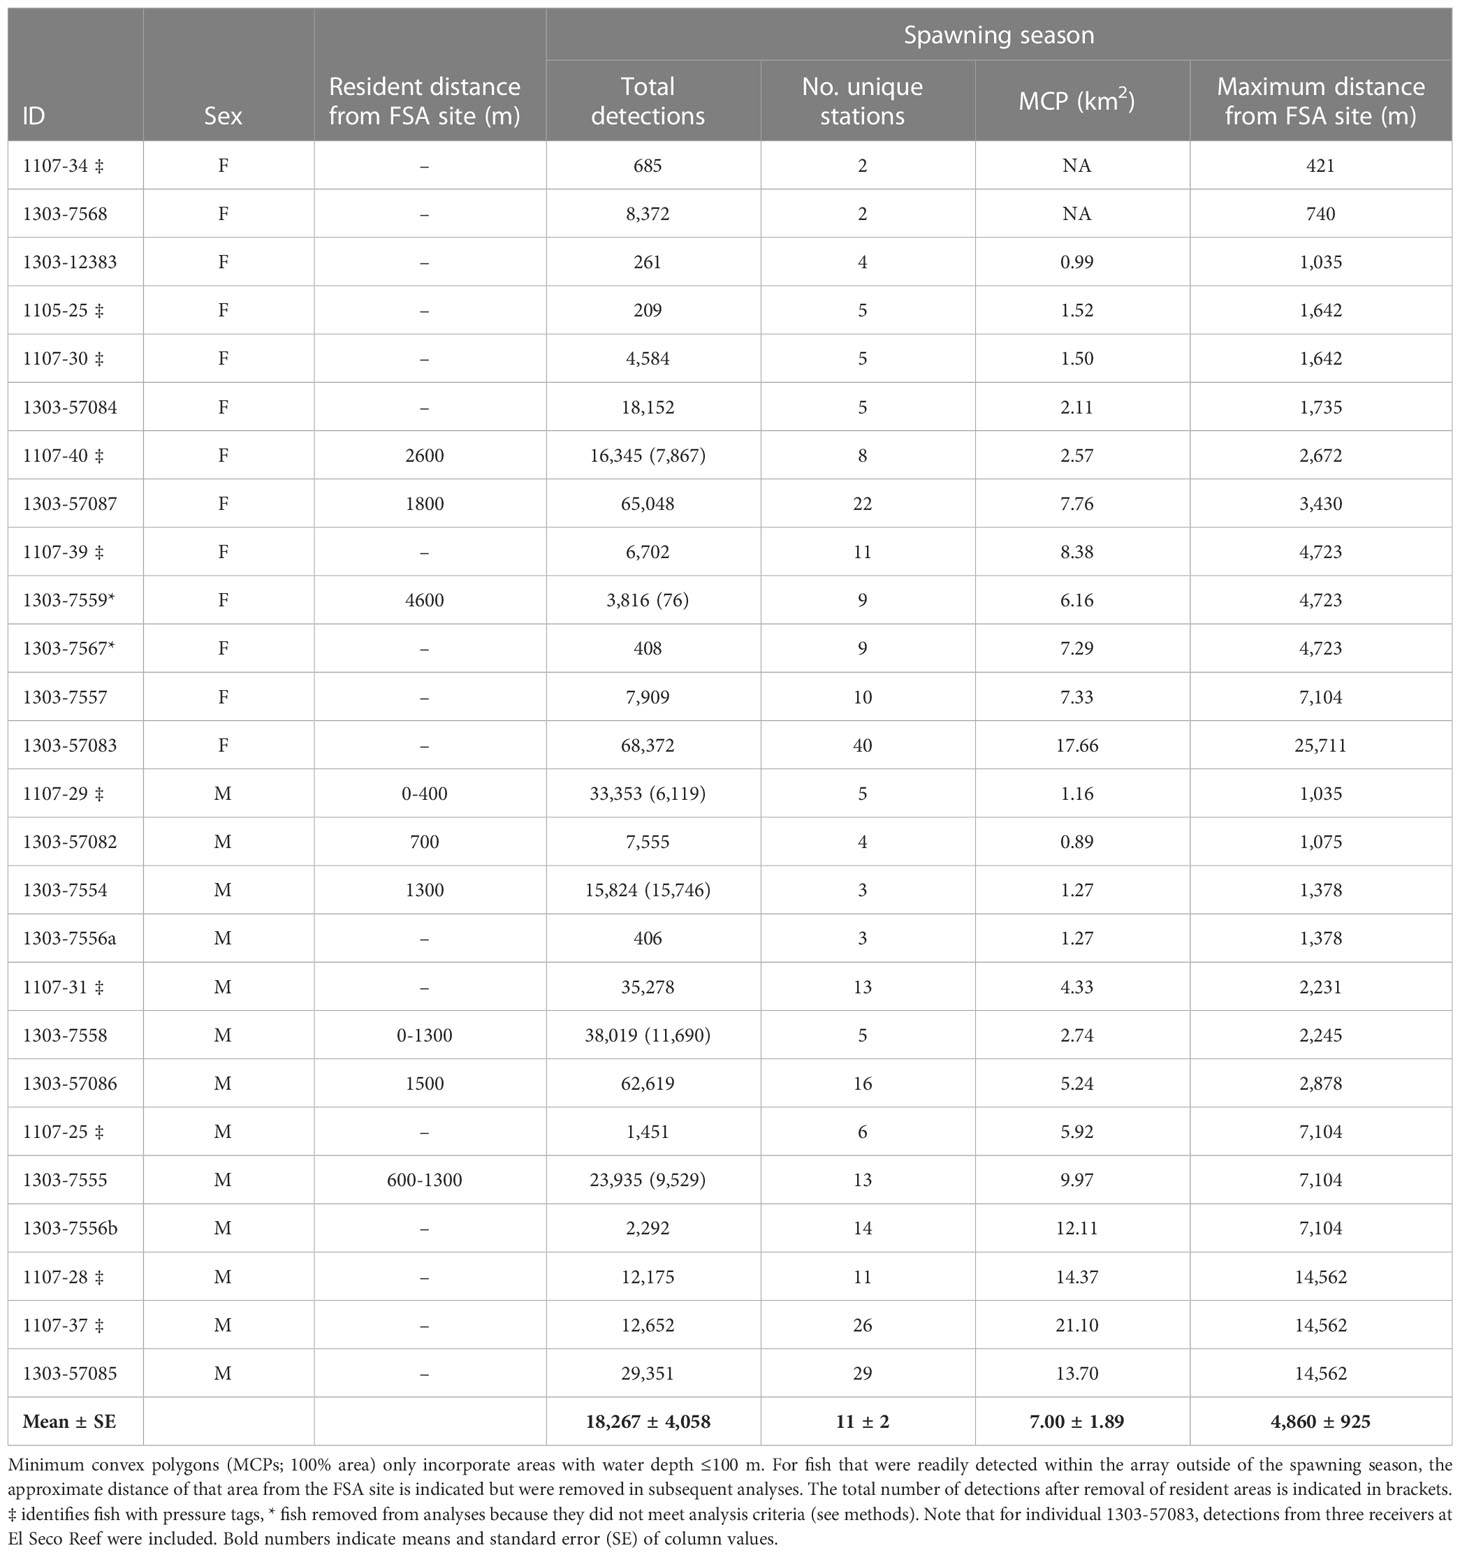
Table 2 Detection and space use summary (after data filtering) of female (F) and male (M) tagged Nassau grouper throughout the study area during the spawning season (Dec 15 – May 15) between 2007-2013. dash (-) indicates fish was non-resident around FSA site and not applicable (NA) indicates MCP could not be calculated because fish was only detected on two stations.
Residency time at the spawning site (station 009) was determined at a daily interval (i.e., minimum of 2 detections day-1 to reduce any effect of false positive detections). Spawning site residency (number of days detected) of female and male Nassau grouper was calculated for each lunar period and compared using analysis of variance (ANOVA). Spawning season residency was calculated as the number of days present divided by the total number of days between the first and last detection during spawning seasons. The date (relative to the full moon) and time of day of arrival/departure at the spawning site were investigated during each spawning period (i.e., five possible arrivals/departures each spawning season). Each new lunar period was considered to begin at the first detection following a minimum of 10 days without any detections to ensure the individual had left the spawning site. Similarly, the last detection during a spawning period ended when no detection occurred for that individual within the following 10 days. This approach was necessary to differentiate between arrivals/departures of individuals that remained near the spawning site throughout the spawning season. Arrivals were not included during the period that an individual was tagged since capture took place within the array area after the fish had ‘arrived’.
A generalized additive mixed-effect model (GAMM) approach was used to explore the influence of biological and environmental parameters on the presence of Nassau grouper at the FSA site during the spawning season. Presence/absence of each individual at the FSA site was determined hourly (i.e., minimum of two detections) and was used as the response variable (binomial distribution – ‘logit’ link). The explanatory variables investigated were Days After Full Moon (DAFM), sex, water temperature at the FSA site (U22-001 HOBO® Water Temp Pro v2; Onset Computer Corporation, Bourne, MA; n=1 at ~30m deep), and hour of day. Several candidate models (e.g., with and without smoothers or interaction terms) were investigated using the ‘gam’ function in the mgcv R package (Wood, 2011) prior to selecting the best fitting model based on the lowest AIC using the ‘compareML’ function from the itsadug R package (van Rij et al., 2017). Individual ID was designated as random smooths (e.g., bs=‘fs’) given the repeated observations for each individual and cyclic cubic regression splines (e.g., bs=‘cc’) were used in candidate models when data was circular (i.e., hour of day and DAFM). An autocorrelation structure (5th order) was also added to the final model to incorporate serially auto-correlated data. To check for multi-collinearity among explanatory variables, variance inflation factors (VIF function in the ‘AED’ R package; Zuur et al., 2012) were used; VIFs <3 were deemed to not have any issues with multi-collinearity. Exploratory residual plots were used to verify homogeneity of variance.
Because Nassau grouper once formed aggregations within the MCD (Olsen and LaPlace, 1978) and are known to revisit extirpated FSA sites (Heppel et al., 2013; Stump et al., 2017), we determined the relative importance of the extant and historic FSA sites located within the two MPAs (i.e., Grammanik Bank and MCD, respectively). During the spawning season, a selectivity index was used to quantify the proportion of detections within and outside Grammanik Bank and MCD FSA sites relative to the receiver coverage in each area. Chesson’s selectivity index (α) was used following:
where ri is the proportion of detections within each iteration (i) of FSA site designation (i.e., MCD, Grammanik Bank, no FSA site) and pi is the proportional area of receiver coverage at each FSA site designation (i). The historic FSA site within the MCD was delineated as any receiver location within 1,500 m of station 139 (presumed historic site; Figure 1). The Grammanik Bank FSA site incorporated all receivers within the Grammanik Bank MPA. Selectivity indexes were calculated for each individual during the spawning season, and due to changing receiver configurations they were estimated separately for each year. The proportion of detections at each FSA site designation was based on hourly detections in which the location/designation was associated with the receiver that had the most detections each hour (for each individual). A conservative detection range of 200 m (estimate of 75% detection efficiency) around each receiver was used to estimate receiver coverage in each FSA site designation, with overlapping ranges between receivers only counted once.
Spatial networks (e.g., Whoriskey et al., 2019) were used to compare commonly used pathways of Nassau grouper within the study area during the spawning season between years. To ensure singular transmissions detected on multiple receivers were not included, detections were grouped by the transmitter ping interval and only the station with the most detections was selected. Receiver-clock drift can lead to erroneous groupings however the effect was deemed minimal because distances between receivers (>500 m) were larger than expected detection ranges (~300 m). Edges (or receiver-to-receiver pathways) were quantified for each individual (each spawning season) based on the number of consecutive movements between receivers. Edge values for each receiver-to-receiver pathway were then standardized across individuals and spawning seasons by dividing the sum of edge values by the number of individuals detected in the array each spawning season. Within-spawning season comparisons of standardized networks (i.e., correlations between edge matrices) were made between males and females using a Mantel test (spearman rank correlation; vegan R package; Oksanen et al., 2018). Nodes (receiver locations) were quantified based on the number of pathways departing from and arriving to each receiver and were standardized as described above. Networks were completed using the igraph R package (Csardi and Nepusz, 2006) and were plotted to visualize common movement pathways.
Space use of tagged Nassau grouper (n=24) was analyzed over the seven years (2007-2013) to enhance spatial planning and determine the efficacy of the existing and recommended Grammanik Bank seasonal closed area boundaries. Two approaches were used to estimate spatially relevant areas during the spawning season. In the first approach, minimum convex polygons (MCPs; i.e., home range for each resident fish and functional migration area for migrants) and kernel density estimates (KDEs; i.e., activity space) were calculated using the adehabitatHR (Calenge, 2006) R package. Values were estimated for each tagged fish during the spawning season, as well as for all individuals pooled to evaluate highly utilized areas at a population-level. For these calculations, average positions (i.e., 30-min mean locations; Simpfendorfer et al., 2002) were used instead of raw detections. The MCPs incorporated 100% of positions and included a 200 m radius buffer around each receiver to account for receiver detection range, while 50% and 95% kernal utilization distributions (KUDs) were used for the KDEs (grid resolution = 100 m2, h-smoothing parameter = 150). For both methods, areas were constrained by depth contours no deeper than 100 m based on expected maximum depth-use of Nassau grouper and maximum limits of pressure sensors. These metrics were also calculated and plotted for individuals with temporary resident sites within the study area after the spawning season. For the second approach, the overlapping areas of all Nassau grouper were calculated in ArcGIS and binned into defined zones relevant to reproductive behaviours of species that form spawning aggregations, including spawning site, courtship arena, staging area, migration pathways, and functional migration area (Nemeth, 2012). The area for each of these zones was calculated and the frequency of detections within each of these zones was then used to estimate average percent time spent at the FSA site and within the boundaries of the Grammanik Bank seasonal closed area during spawning season.The relationships between fish length for males and females were analyzed for MCP and maximum migration distance from the GB FSA site using regression.
Depth-use patterns were investigated relative to four time periods (dawn ± 1hr, mid-day ± 5hr, dusk ± 1hr, mid-night ± 5hr) and calculated using the maptools (Bivand and Lewin-Koh, 2018) R package based on US Naval Observatory values. A linear mixed effects model tested whether the following variables influenced depth-use: sex, time periods, lunar phase (eight phases; lunar R package; Lazaridis, 2014), and water temperature at the spawning site. Measurements of location and depth-use were grouped every 30-min (see Simpfendorfer et al., 2002) and analysis only included mean 30-min positions located <1 km from the FSA site during each lunar spawning period. (i.e., time between first and last detection). Each individual/spawning period combination was treated as a random variable, and a first-order correlation structure was built into the model to further control for auto-correlation. Over-dispersion and homogeneity of residuals met assumptions for Gaussian distribution within the model. Tukey’s HSD tested for differences among categorical variables when significant using the multcomp R package (Hothorn et al., 2008).
A total of 26 Nassau grouper were tagged with internal acoustic transmitters at the Grammanik Bank between February and April of 2007 (n = 11), 2008 (n = 9), and 2010 (n = 6). Detections occurred over seven years (2007 to 2013) depending on when fish were tagged (Table 1). Total length of females was significantly larger than males (67.4 cm ± 5.76 s.d. vs. 59.0 cm ± 6.21 s.e., F 1,22 = 11.26, p < 0.003). All individuals except two (IDs A69-1303-7567 and A69-1303-7559) met guidelines for inclusion in analyses (i.e., ≥25 total detections and ≥7 days of detections) and none were deemed to have died within the array.
Tagged Nassau grouper were present at the FSA site from one to four spawning seasons (mean 1.7 ± 0.88 s.d.) with an average daily residency of ~57% (range = 15% -100%, Table 1). Most multi-year spawners visited in consecutive years except one female (ID 1303-12383) and two males (IDs 1107-37, 1303-57086), which skipped years (Table 1). Within a spawning season, fish visited the aggregation site on average two months per year (range one to four months or lunar periods), with no difference between males and females. Fish arrived at the FSA the week after the full moon from mid-January to early May, with a seasonal peak in presence in March (Figure 2, 2007-2013). Average daily residency time at the FSA was 17 d (± 2.3 s.e.), with males (22.4 d ±3.65 s.e., range = 2 - 88 d) remaining significantly longer (F1,59 = 9.04, p < 0.004) than females (9.3 d ±1.14 s.e., range = 2 - 33 d).
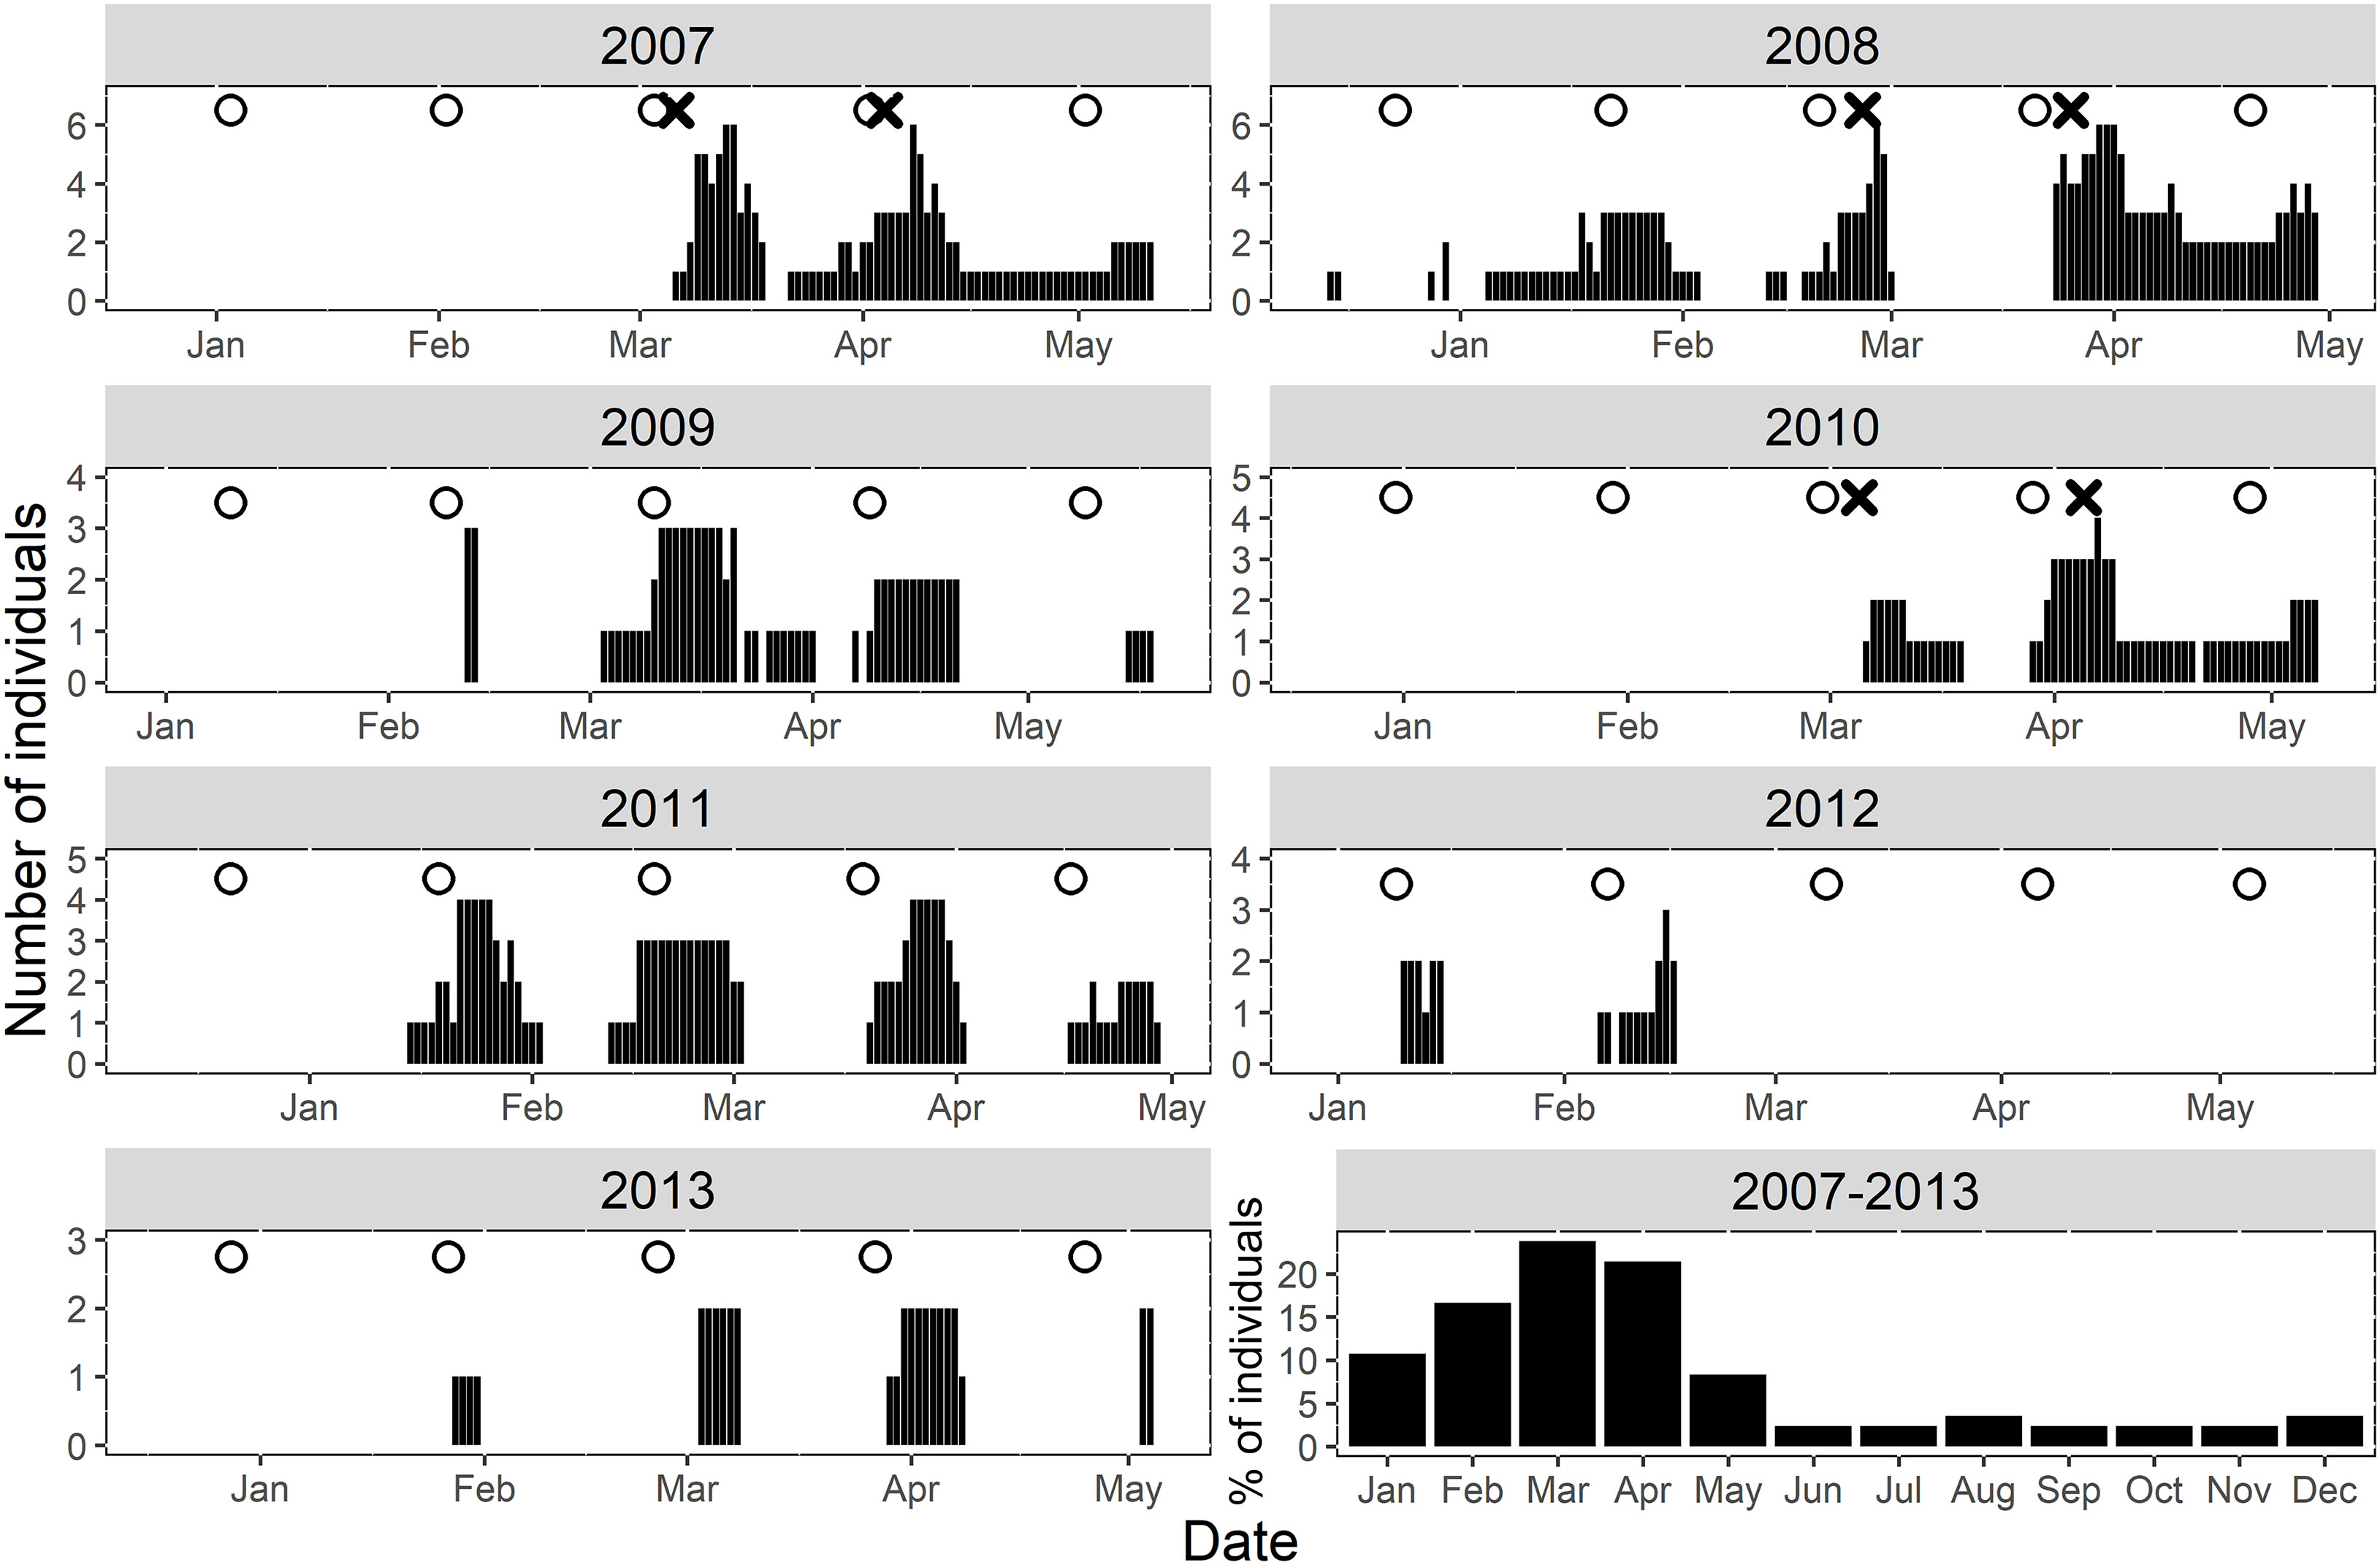
Figure 2 Daily summary of Nassau grouper presence (black lines) at the FSA site within the Grammanik Bank array during seven-year study. White circles indicate the date of full moons during spawning season and the ‘X’ represents fish tagging release dates. The bottom right plot summarizes the relative proportion of individuals at the FSA site monthly throughout the entire study period.
Across all years, Nassau grouper showed consistent patterns in their monthly time of arrival and departure from the FSA site on days relative to the full moon (Figure 3A) and time of day (Figure 3B). Tagged groupers arrived on the full moon in March, but slightly later in the lunar cycle in February and April (2 - 3 DAFM), and even later in January and May (5 - 6 DAFM) (Figure 3A). Departures were more consistent and fluctuated from about six to nine DAFM (Figure 3A). Most fish arrived at the FSA site between 12:00 – 14:00, but time of departure occurred about two hours earlier each month of the spawning season (i.e., 11:30 in January to 04:00 in May; Figure 3B).
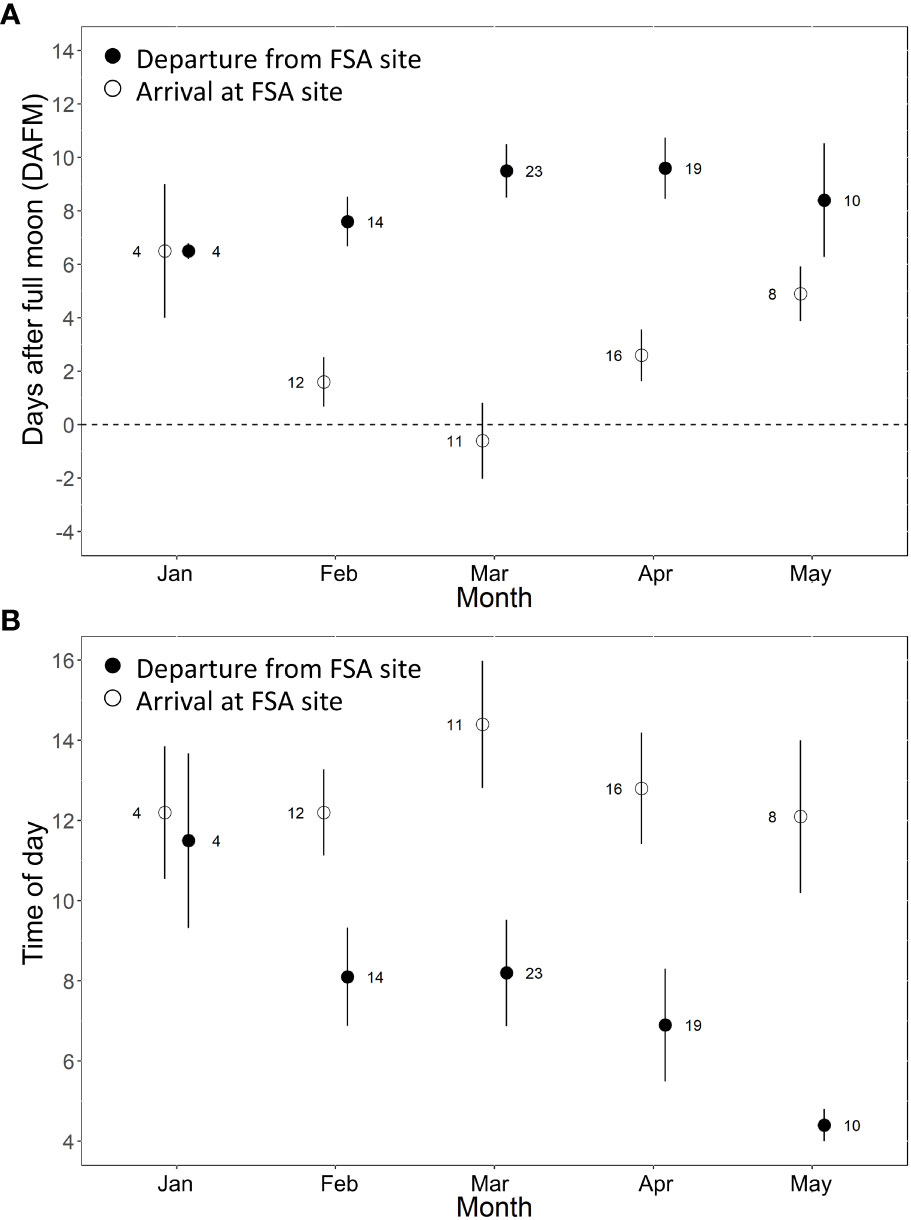
Figure 3 Mean (± s.e.) arrival and departure of Nassau grouper at the FSA site grouped across spawning seasons relative to (A) the number of days after full moon (DAFM) and (B) the time of day (2-hour bins). Each spawning season consisted of five possible arrival/departure periods for each individual (i.e., five full moons between Dec 15 – May 15). Males and females are combined because there were no statistical differences between sex.
Differences in presence at the FSA site were associated with hour of day and DAFM (GAMM, p<0.001; Figure 4; Table S1). Water temperature was initially included as an explanatory variable during data exploration; however, it was not included in the final models because temperature at the FSA site only changed by ~2.5°C (25.4-28.0°C) across all years and monthly values were variable across years. Consequently, temperature effects on the presence of Nassau grouper at the FSA site were confounded by the limited range as well as the inter-annual variation that appeared to be independent of tagged grouper visiting the FSA site. Model fit was better when sex was incorporated; for example, females were more likely to be absent from the FSA site prior to full moon (DAFM < 0; Figure 4A) based on effect sizes than males (Figure 4B). Nevertheless, the overall trends between sexes were similar. Generally, the presence of Nassau grouper at the FSA site began increasing around the full moon (i.e., DAFM=0) and was highest ~5-9 DAFM; afterwards presence decreased quickly (Figures 4A, B). Despite a smaller effects size, this pattern was also evident when hour of day was included as an interaction term with DAFM, resulting in the greater presence between ~0-10 DAFM and ~16:00-20:00 (Figures 4C, D). Hourly differences between sexes were more apparent during lunar periods when fish commonly aggregated at the FSA site (0-10 DAFM), which consisted of cyclical patterns of daily movement where male and female Nassau grouper would depart the FSA site a few hours after midnight and reach a maximum distance from the FSA site between 07:00 to 10:00 in the morning before returning to the FSA site in late afternoon (Figure 5). These daily movement patterns represented fish swimming to individual staging areas surrounding the FSA site (Table 3). During these daily movements, there was a significant difference in distance from the FSA site between sexes in some years (2008, 2011; RM-ANOVA: p<0.001; Figure 5) where females swam more than twice as far as males, as well as when all years were combined (F1,23, p<0.001). In other years (2007, 2009, and 2010), distance from the FSA site was similar (RM-ANOVA: p>0.05; Figure 5).
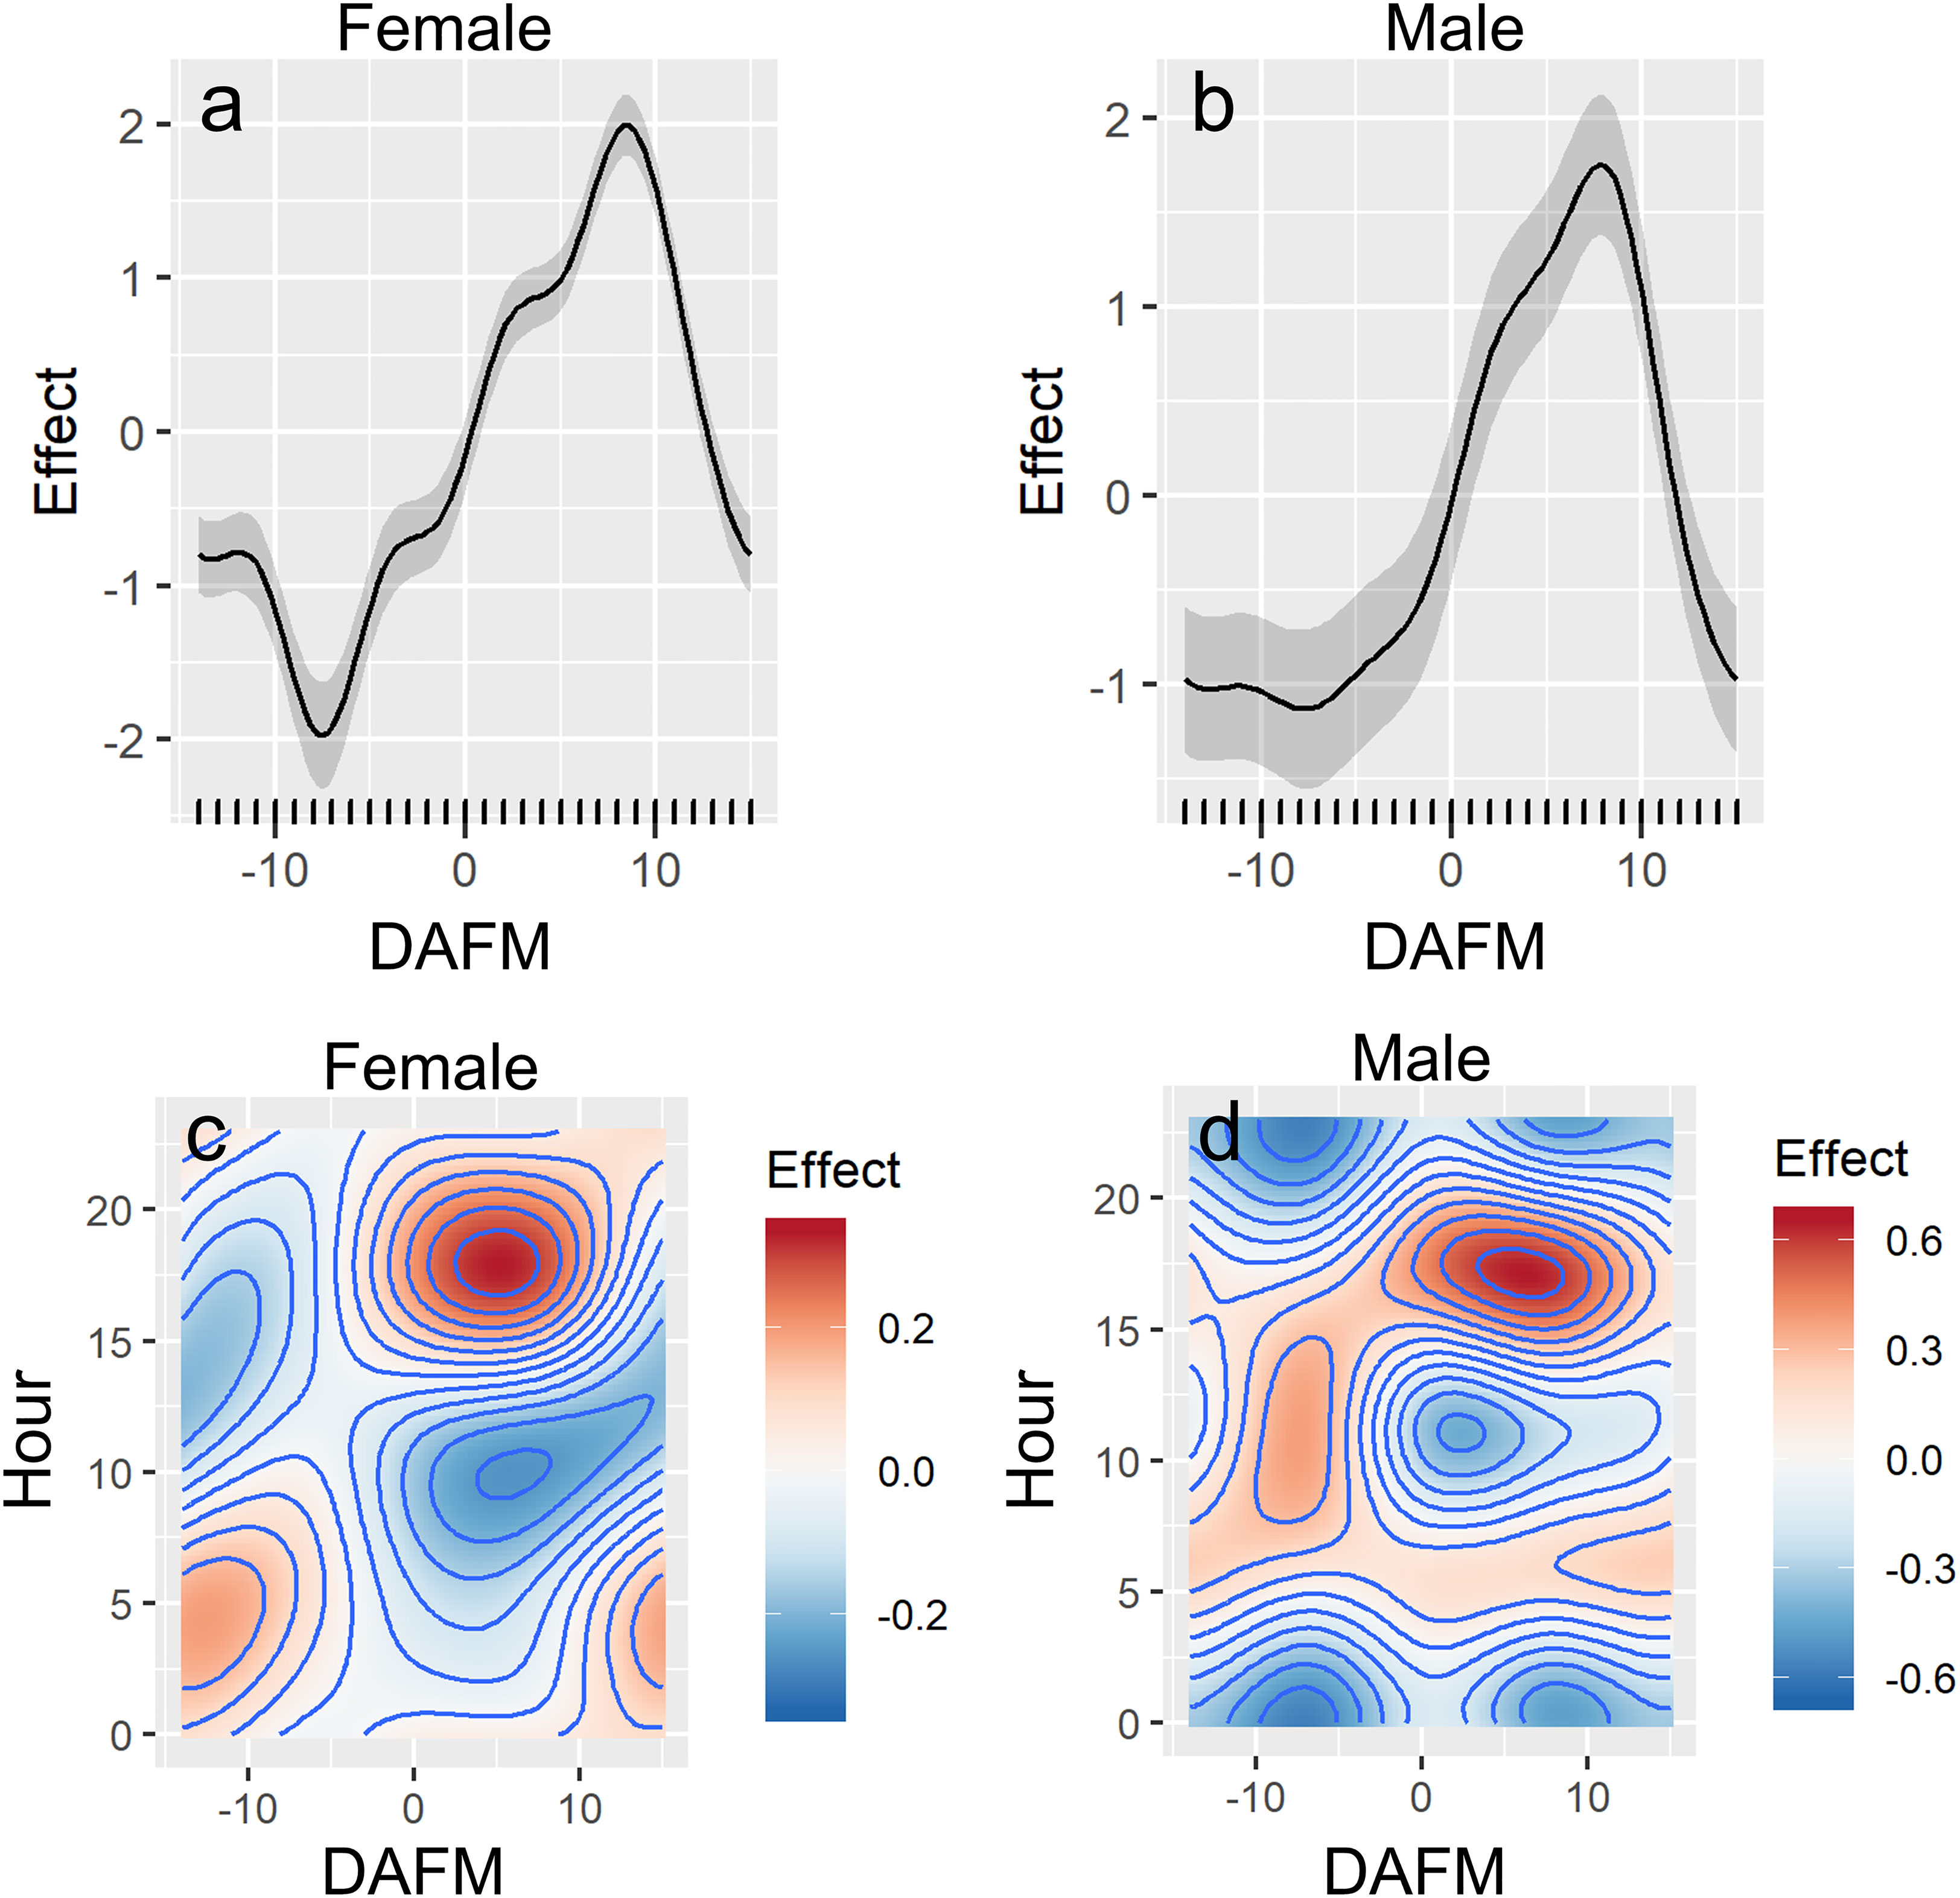
Figure 4 Partial effects plots from final generalized additive mixed-effects model (GAMMs; see Table S1) showing the influence of days after full moon (DAFM), and hour of day, on presence of female (A, C) and male (B, D) Nassau grouper at the FSA site.
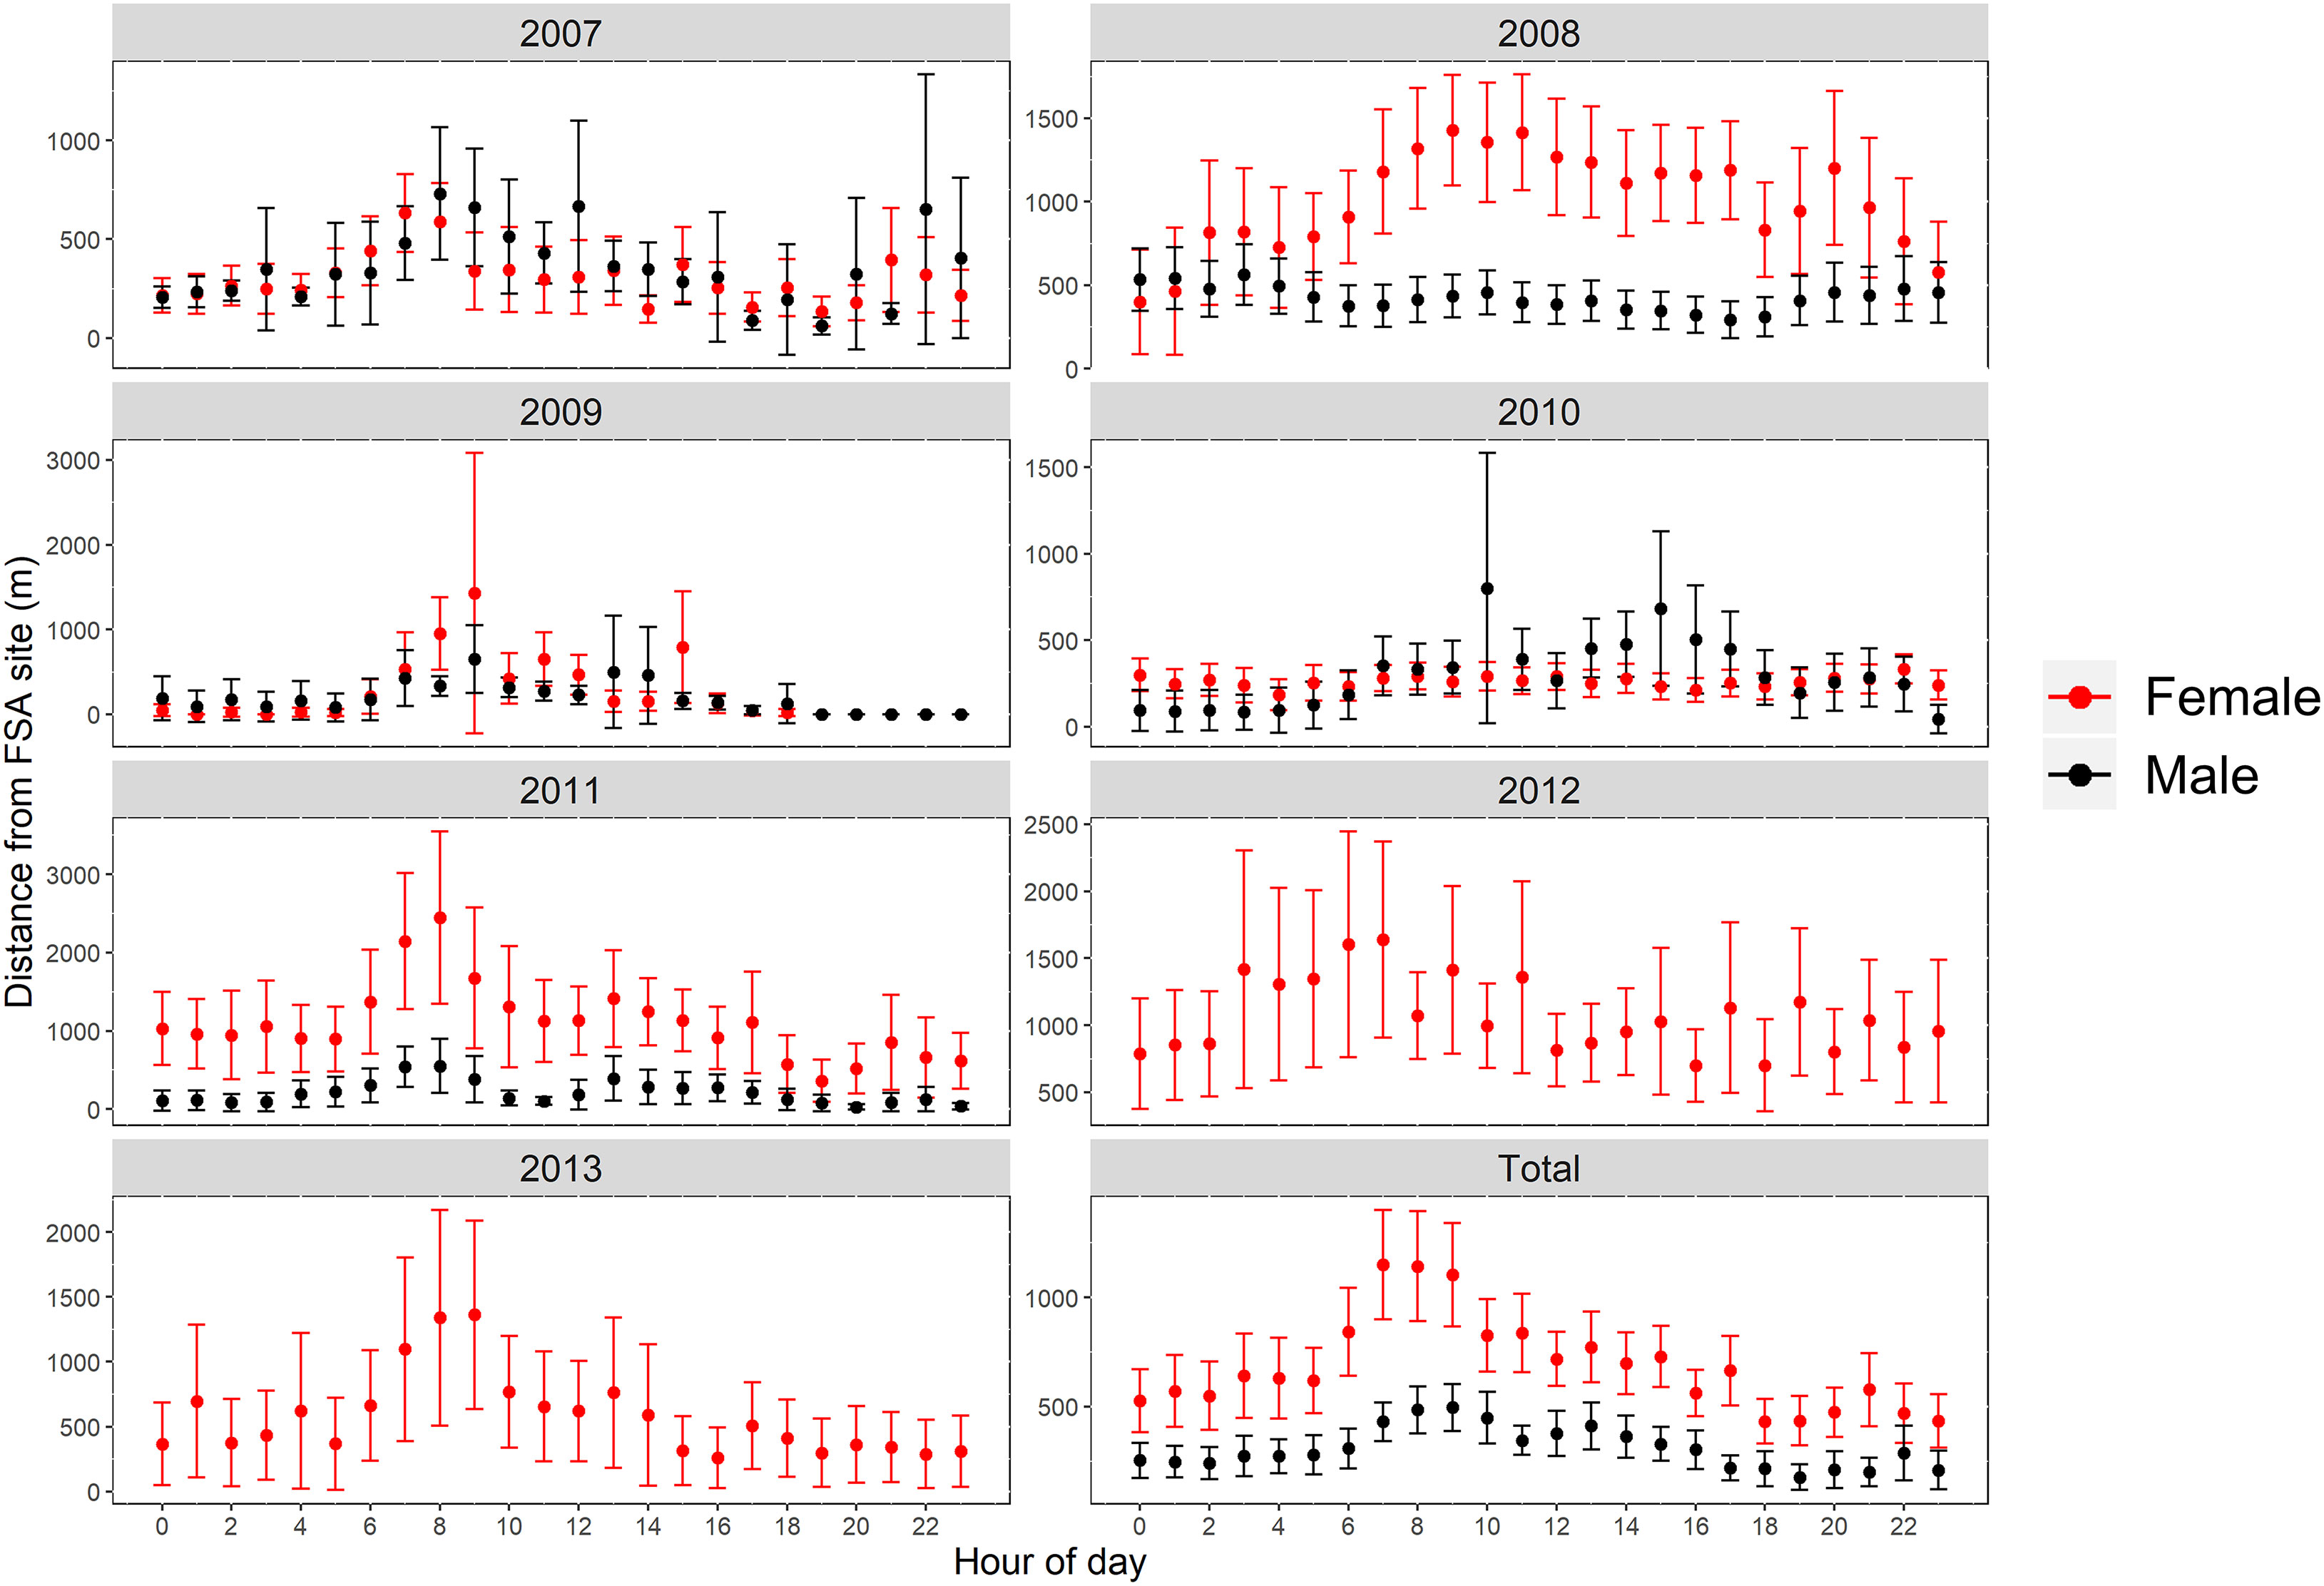
Figure 5 Distance (mean ± s.e.) from FSA site by hour of day for female and male Nassau grouper for each year that fish were detected (2007 to 2013) and for all years combined (Total) during spawning season and between 0-10 days after full moon.

Table 3 Distribution of Nassau grouper staging areas and resident sites around Grammanik Bank FSA.
Movement patterns of Nassau grouper during the spawning season showed strong selectivity for the Grammanik Bank with mean selectivity index values among individuals >0.66 (i.e., positive selection cut-off was >0.33; ~72% of detections) every spawning season (Figure 6). Although half of the tagged Nassau groupers (12 of 24) were detected within 500 m of the historic spawning aggregation site, selectivity for the historic MCD FSA site was negative (selectivity index <0.05 across all years; ~2% of detections), as was selectivity outside both FSA sites (~26% of detections), except in 2010 when it was neutral (selectivity index ~0.33; Figure 6).
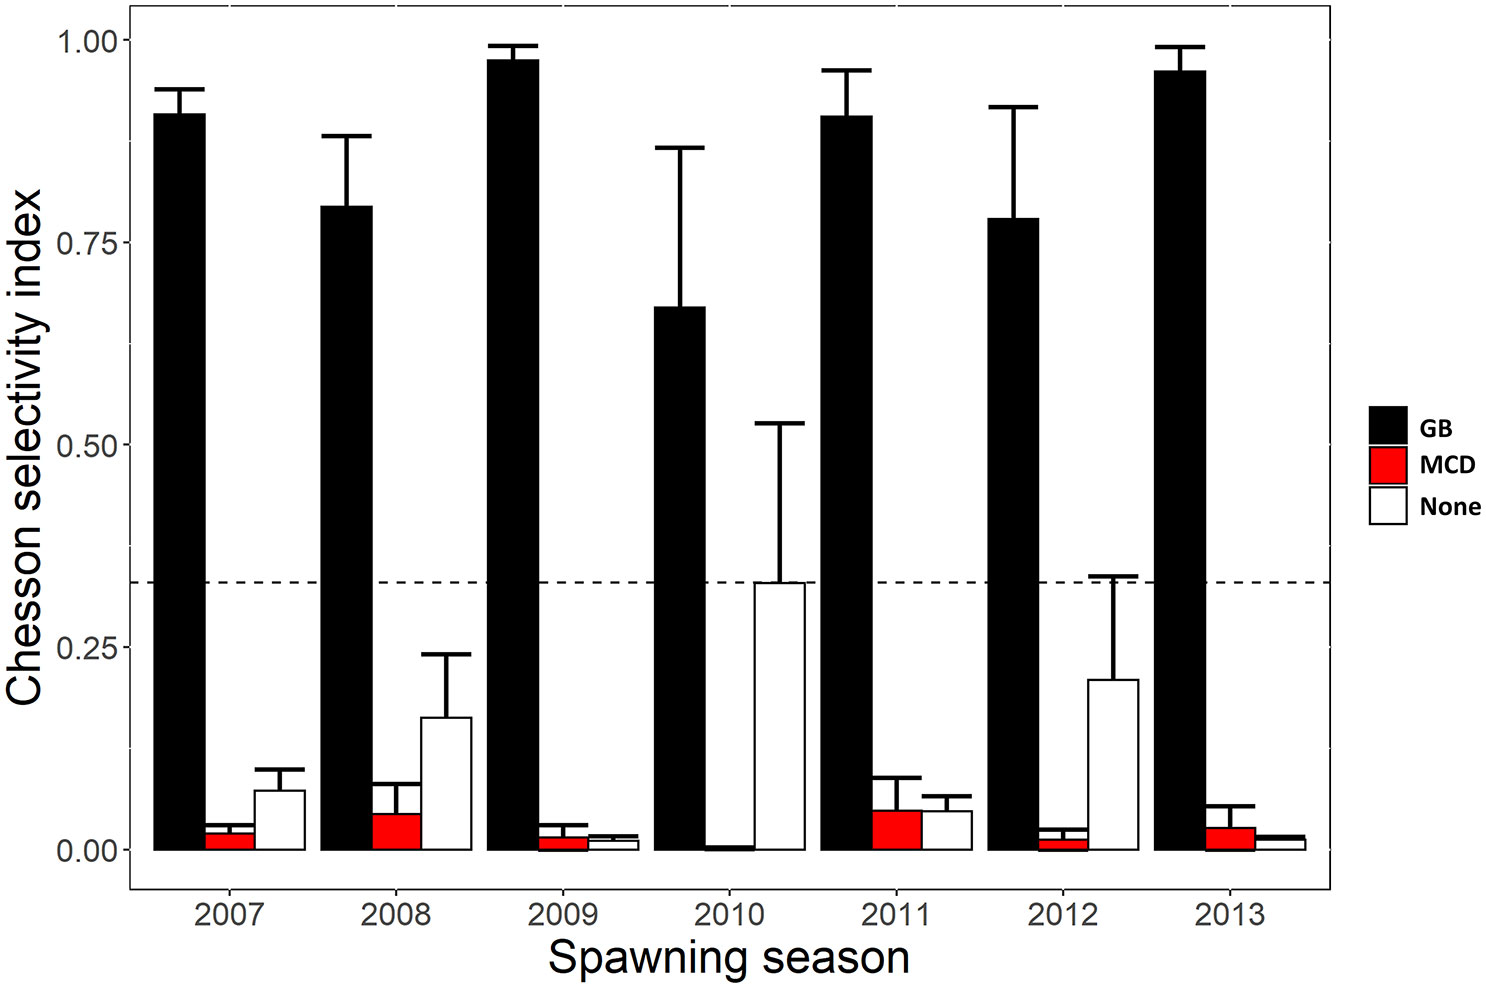
Figure 6 Yearly Chesson selectivity index values representing positive or negative selection for the area used by each Nassau grouper at Grammanik Bank (GB) FSA site, historic FSA site in MCD (MCD) and outside these areas during the spawning season. Index values were standardized using the receiver coverage in each area. The bar values represent the mean index value (mean ± s.e.) across individuals each year and location. Index values above the dotted horizontal line represent positive affinity for that area, whereas values below indicate negative affinity.
Despite the significant differences in distances moved away from the FSA site by males and females, movement networks between males and females were similar across years when at least two individuals of each sex were present (Mantel r-statistic: 0.649, 0.280, 0.436, 0.721 for 2007, 2008, 2010, 2011, respectively; p ≤0.001). Node sizes and movement pathways were largest at or immediately around the FSA site (Figure 7) highlighting the importance of habitats around the FSA site for Nassau grouper. Sizes of nodes adjacent to this area were typically larger than more distant nodes (Figure 7). Diverse pathways were common indicating broad use of the area independent of the FSA site. Several higher density pathways between the Grammanik Bank FSA site and the area close to the historic MCD FSA site highlight these common pathways (Figure 7). A majority (14 of 24, 58%) of fish entered (or left) the MCD, contributing to the large node sizes within the MCD (Figure 7). These migrating groupers made two to three trips a year (2.6 ± 2.2 s.d., range: 1-7 trips) between the eastern boundary of the MCD and the Grammanik Bank FSA with an average travel time of about 11 hours (± 16.7 s.d., range: 1.25-72 hours) to make the 3 km journey.
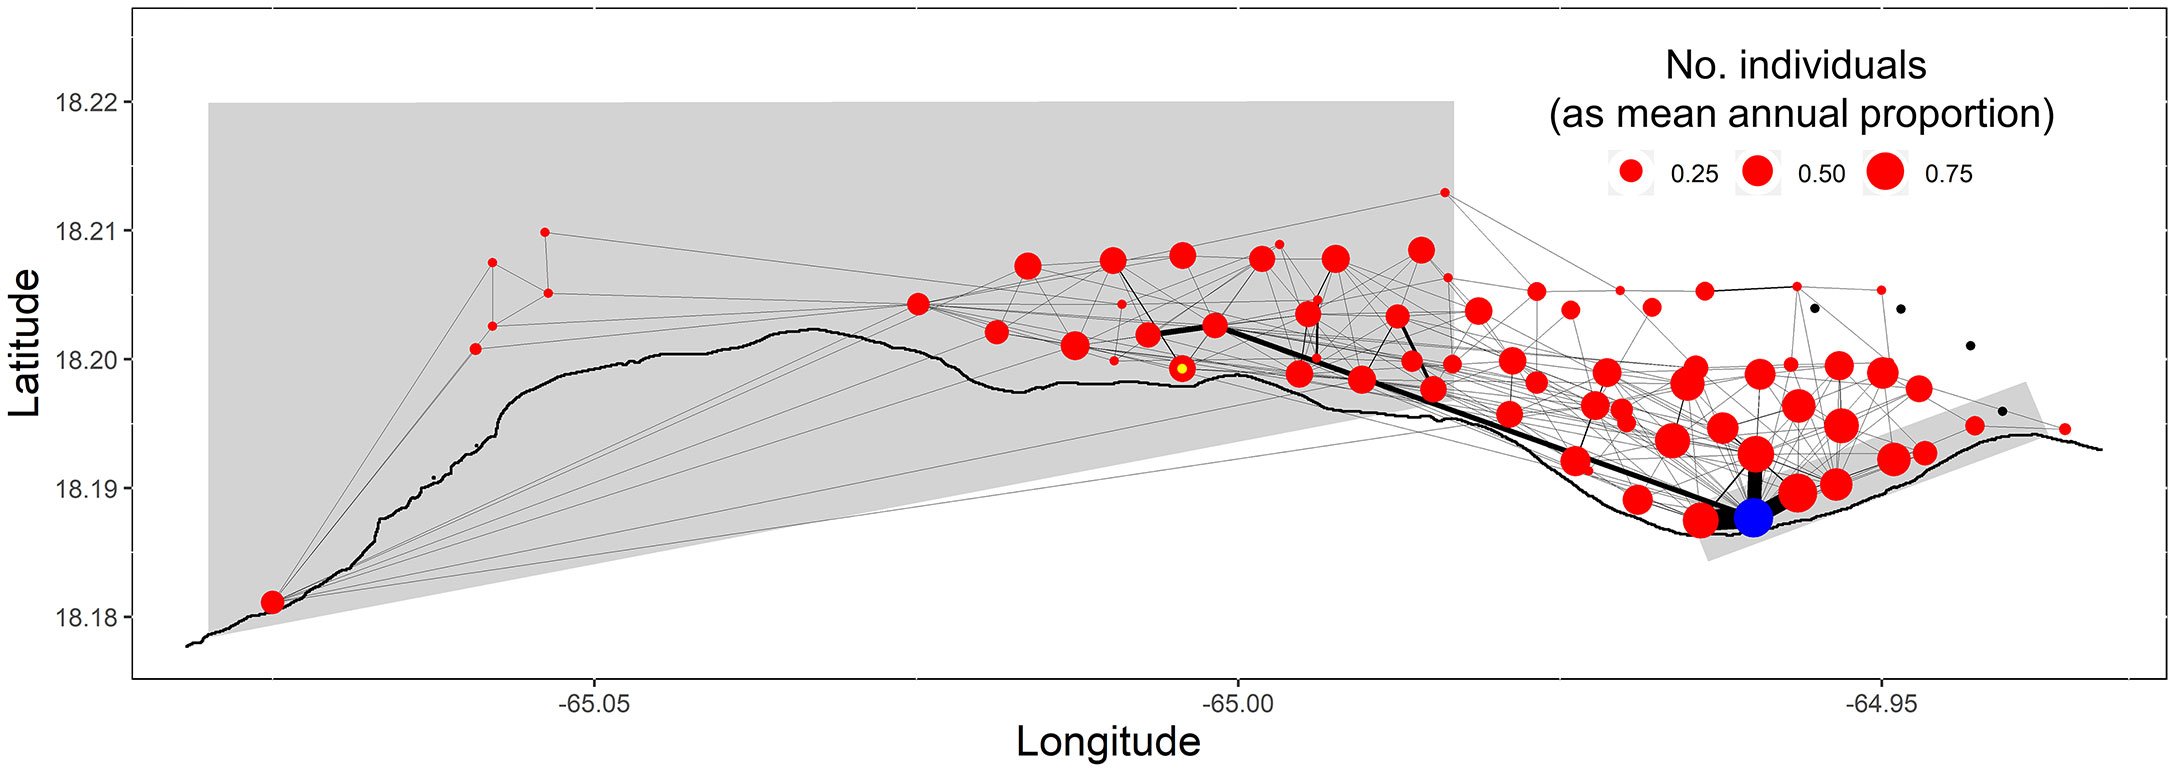
Figure 7 Spatial network of Nassau grouper movements during each spawning season. Receiver locations (i.e., nodes) are coloured red, except the Grammanik Bank FSA site (blue), the presumed historic, extirpated Marine Conservation District FSA site (yellow inner circle), and stations with no detections (black). The thickness of pathways between receivers (i.e., edges) corresponds to the relative number of movements between these locations and the size of nodes corresponds to the number of individuals detected at each station.
Spatial analysis identified both staging areas and temporary residence areas within the acoustic array for many of the tagged Nassau grouper (Table 3). Staging areas were locations where groupers spent a few hours, days or weeks during the spawning season (January to May) but departed before the next lunar spawning period. The majority (87%) of staging areas were less than 3 km from the FSA site (Table 3) indicating that these fish occupied areas outside of either marine protected area. In contrast to individuals occupying staging areas, temporary residents remained near the FSA for two to six months (June to December) following the spawning season but eventually departed these sites before the next spawning season. Nine (38%) Nassau grouper displayed temporary residency within 5 km of the FSA site (Table 3; Figure 8), with some individuals living close to each other (i.e. IDs 7554, 7555 and 7558; Figure 8). Minimum convex polygons (MCP) of temporary resident fish outside the spawning season averaged 4.9 km2 ± 1.75 s.e. (ranged = 1.2 km2 to 17.7 km2) (Figure 8) and was not significantly different from MCP during the spawning season (mean 4.2 km2 ± 1.75 s.e.) (Table 2). Temporary resident areas during non-spawning season for 50% and 95% KUDs averaged 0.14 km2 ± 0.02 s.e. and 0.94 km2 ± 0.18 s.e., respectively (Figure 8). For all fish combined, space use during the spawning season ranged from 0.89 km2 to 21.10 km2 and averaged 7 km2 ± 1.89 s.e. (Table 2) and was not significantly different between males and females (two-tailed T-test: p=0.38). Migration distances, whose values were limited by the receiver array each year (Figure 1), ranged from less than one km to > 25 km (minimum linear distance) with no difference between males and females (Table 2). Males showed a positive relationship between total length and maximum migration distance (y = 0.0012x + 53.89, ANOVA: F1,11 = 14.94, p<0.004, R2 = 0.51) and MCP size (y = 0.09285x + 53.98, ANOVA: F1,11 = 9.29, p<0.03, R2 = 0.62), but not females. The longest migration distance was 25.7 km (51.4 km roundtrip) completed by fish 57083 (Table 2) every month for three to four months of the spawning season from 2011 to 2013.
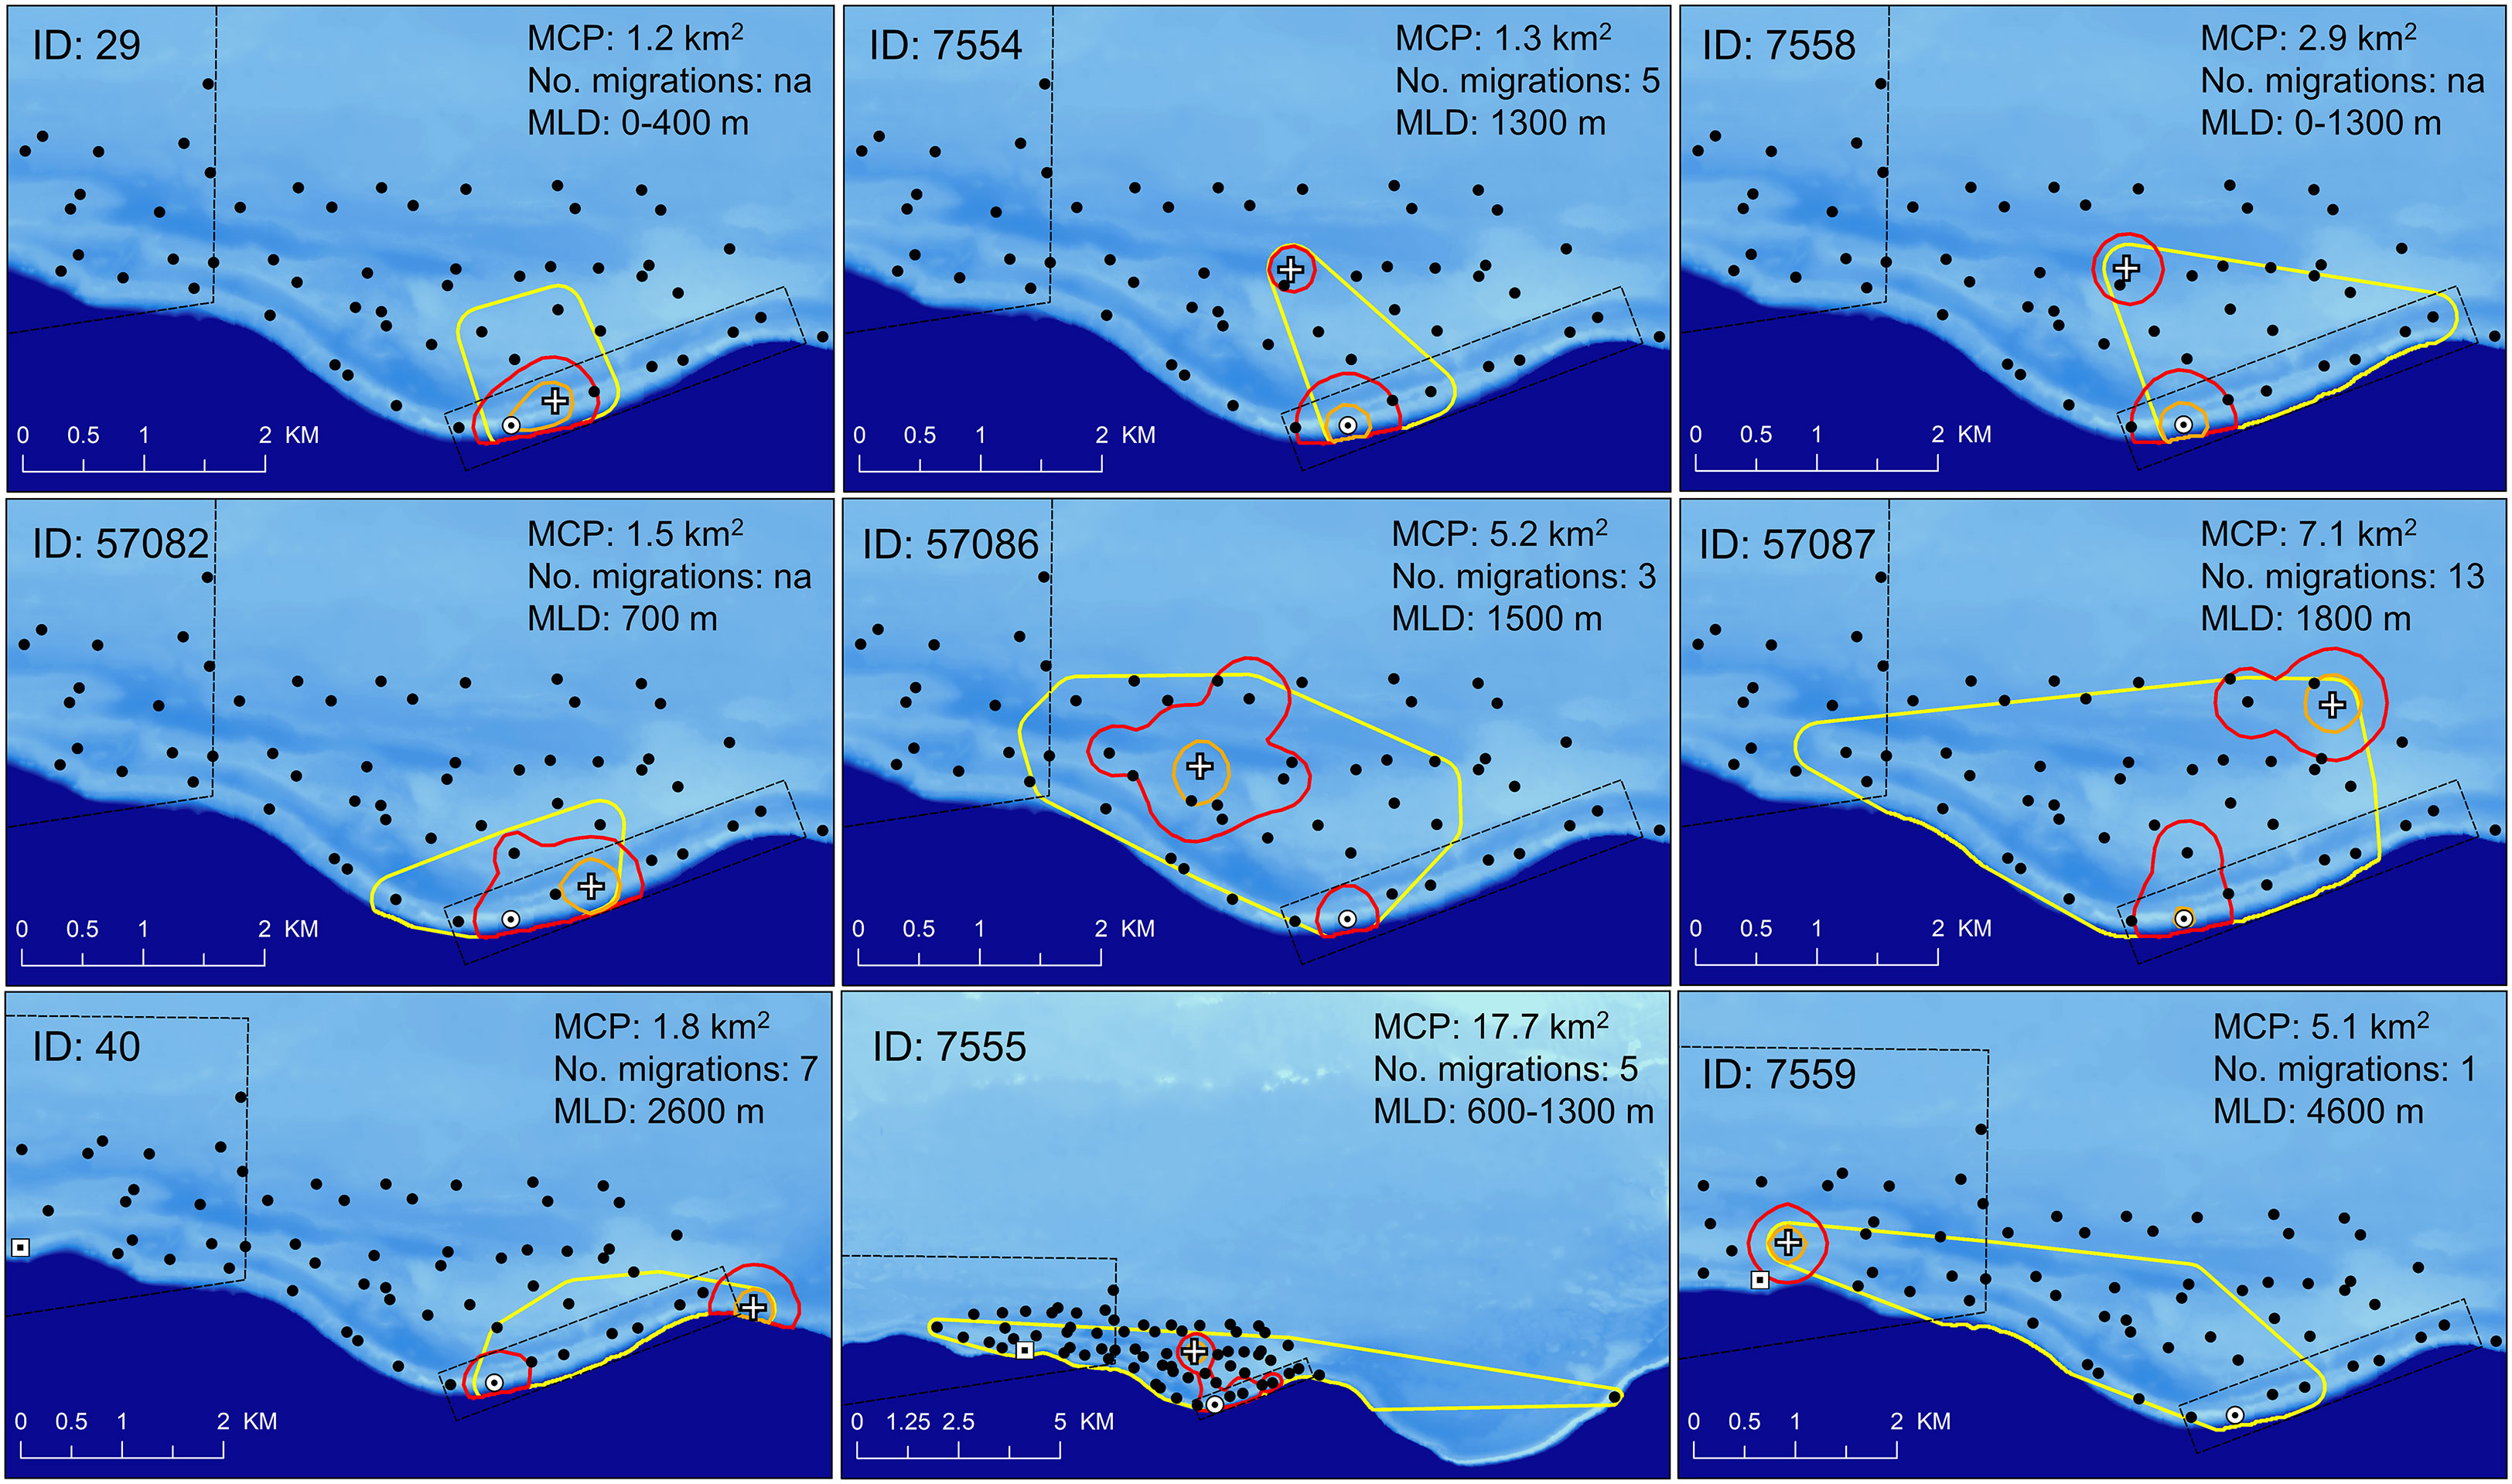
Figure 8 Map of insular shelf (light blue – 25 m to 100 m depth) and Virgin Trough (dark blue >100 m to 4000 m depth) showing area usage for nine resident Nassau grouper identified within the acoustic array. Temporary resident fish were identified based on continued presence at specific locations within the study area and outside of spawning periods. Areas include minimum convex polygon (MCP, yellow polygon), 95% (red polygon) and 50% (orange polygon) KUDs, temporary resident site (white cross). Marine Conservation District (large black polygon), Grammanik Bank closed area (small black rectangle) and locations of extant (white circle with black dot) and historic (white square with black dot) Nassau grouper spawning aggregation sites. Legend indicates MCP area, number of migrations each fish made from home site to FSA and minimum linear distance (MLD) from home site to Grammanik Bank FSA. Female fish are ID: 40, 7559, 57087.
Spatially-relevant areas at the population level (all fish combined) were calculated and defined for Nassau grouper. The KDE analysis showed that minimum functional migration area (i.e. MCP), 95% and 50% KUDs for all fish combined during the spawning period was 27.39 km2, 4.24 km2 and 0.19 km2, respectively. This approach accurately identified the core courtship arena and location of the spawning aggregation site (50% KUD) but provided a fragmented activity area influenced by fish occupying staging areas and temporary residence sites (Figure 9A). The MCP analysis produced less precise, but more biologically relevant results applicable for spatial management of the spawning population. The area used by >95% of all tagged Nassau groupers represented the larger courtship arena (Figure 9B, red area), where high densities of Nassau grouper were counted and their courtship behaviors and spawning colorations were observed during SCUBA diving surveys. The area used by 75% - 95% and 50% - 75% of all tagged fish represented both primary staging area and temporary resident sites (Figure 9B, orange and yellow areas). The MCP analysis also identified the primary migration corridor and the minimum functional migration area for the spawning population (Figure 9B), which was limited by the extent of the acoustic array.
We also calculated that Nassau grouper were located within the 1.5 km2 seasonally protected Grammanik Bank only about 65% of time. The remaining time was spent actively migrating to and from the FSA site, staging areas and temporary resident sites on a daily basis (Figures 7, 8). By adjusting the Grammanik Bank boundaries to more closely match spatial patterns of movement, we calculated that a 6.4 km2 area would encompass Nassau grouper 96% of the time during the spawning season (Figure 9B, blue polygon) and a more conservative boundary of 10.5 km2 would encompass over 99% of Nassau grouper movement outside the Grammanik Bank and MCD closed areas (Figure 9B blue dashed polygon).
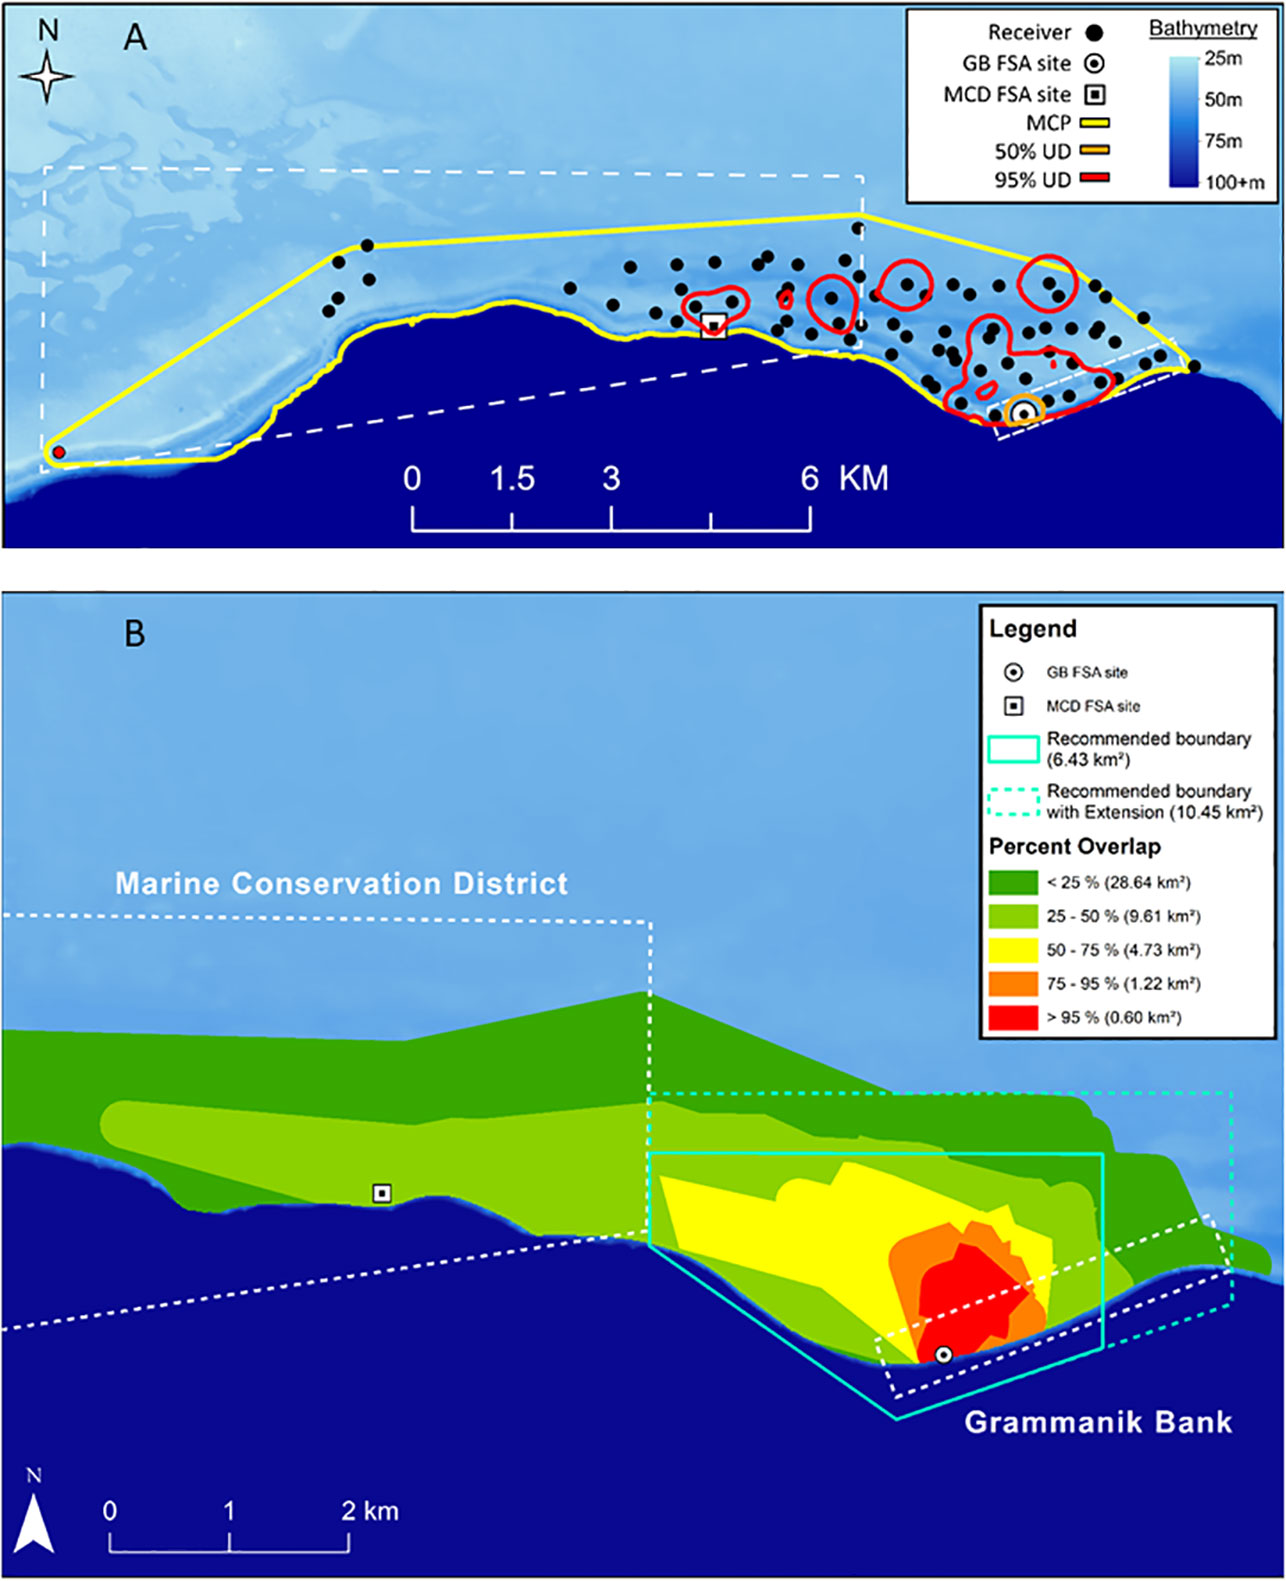
Figure 9 Maps showing two approaches for determining space use by Nassau grouper (n=24) in and around Grammanik Bank seasonal closed area and Marine Conservation District (dashed white lines) for years 2007 to 2013. Polygons for Nassau grouper during spawning season show: (A) KUD analysis for 100% MCP (yellow), 95% KUD (red) which includes mostly temporary resident sites and 50% KUD (orange) which includes courtship arena and is centered on the GB spawning aggregation site (receiver station 009) and; (B) Overlap analysis of MCP showing percent of tagged Nassau grouper using different areas which represent spawning site and courtship arena (red), staging area (orange and yellow), primary migration corridor (light green) and minimum functional migration area (dark green) which is defined by extent of acoustic array. Teal polygon indicates minimum proposed MPA boundaries that encompass 96% of tagged Nassau grouper movements during spawning season within the staging area (solid teal line) and dashed teal line includes 99% of Nassau grouper spawning-related movements within Grammanik Bank and unprotected waters.
Depth-use by Nassau grouper during the spawning season at the FSA site was associated with moon phase (F3,5339 = 21.7, p<0.001) and time of day (F7,5339 = 2.8, p=0.007), but not water temperature or sex. Mean depth throughout the spawning season was 42.8 m ± 4.32 s.e. (range 22.2 m to 80.4 m). Nassau grouper descended to the deepest depths 6 to 11 DAFM (Figure 10A). The timing of these depth movements (Figure 10A) corresponded to when Nassau grouper were most abundant on the FSA site (Figures 4A, B). Deep movements were most common during dusk and typically did not fall far outside the last quarter moon phase margins (Figure 10B). Post hoc comparisons indicated that depth-use was similar during night and dawn, otherwise all levels were different with dusk showing highest depth-use followed by days after full moon (Figure 10B). For moon phase comparisons, only the last quarter period was deeper than the waning crescent moon phase, however there was an evident increase and decrease in depth-use leading up to and following the last quarter moon phase, respectively (Figure 10B). These patterns were seen in individual depth-use plots where higher depth-use mainly occurred on either side of the last quarter moon period during the day or at dusk (Figures 10C–E).
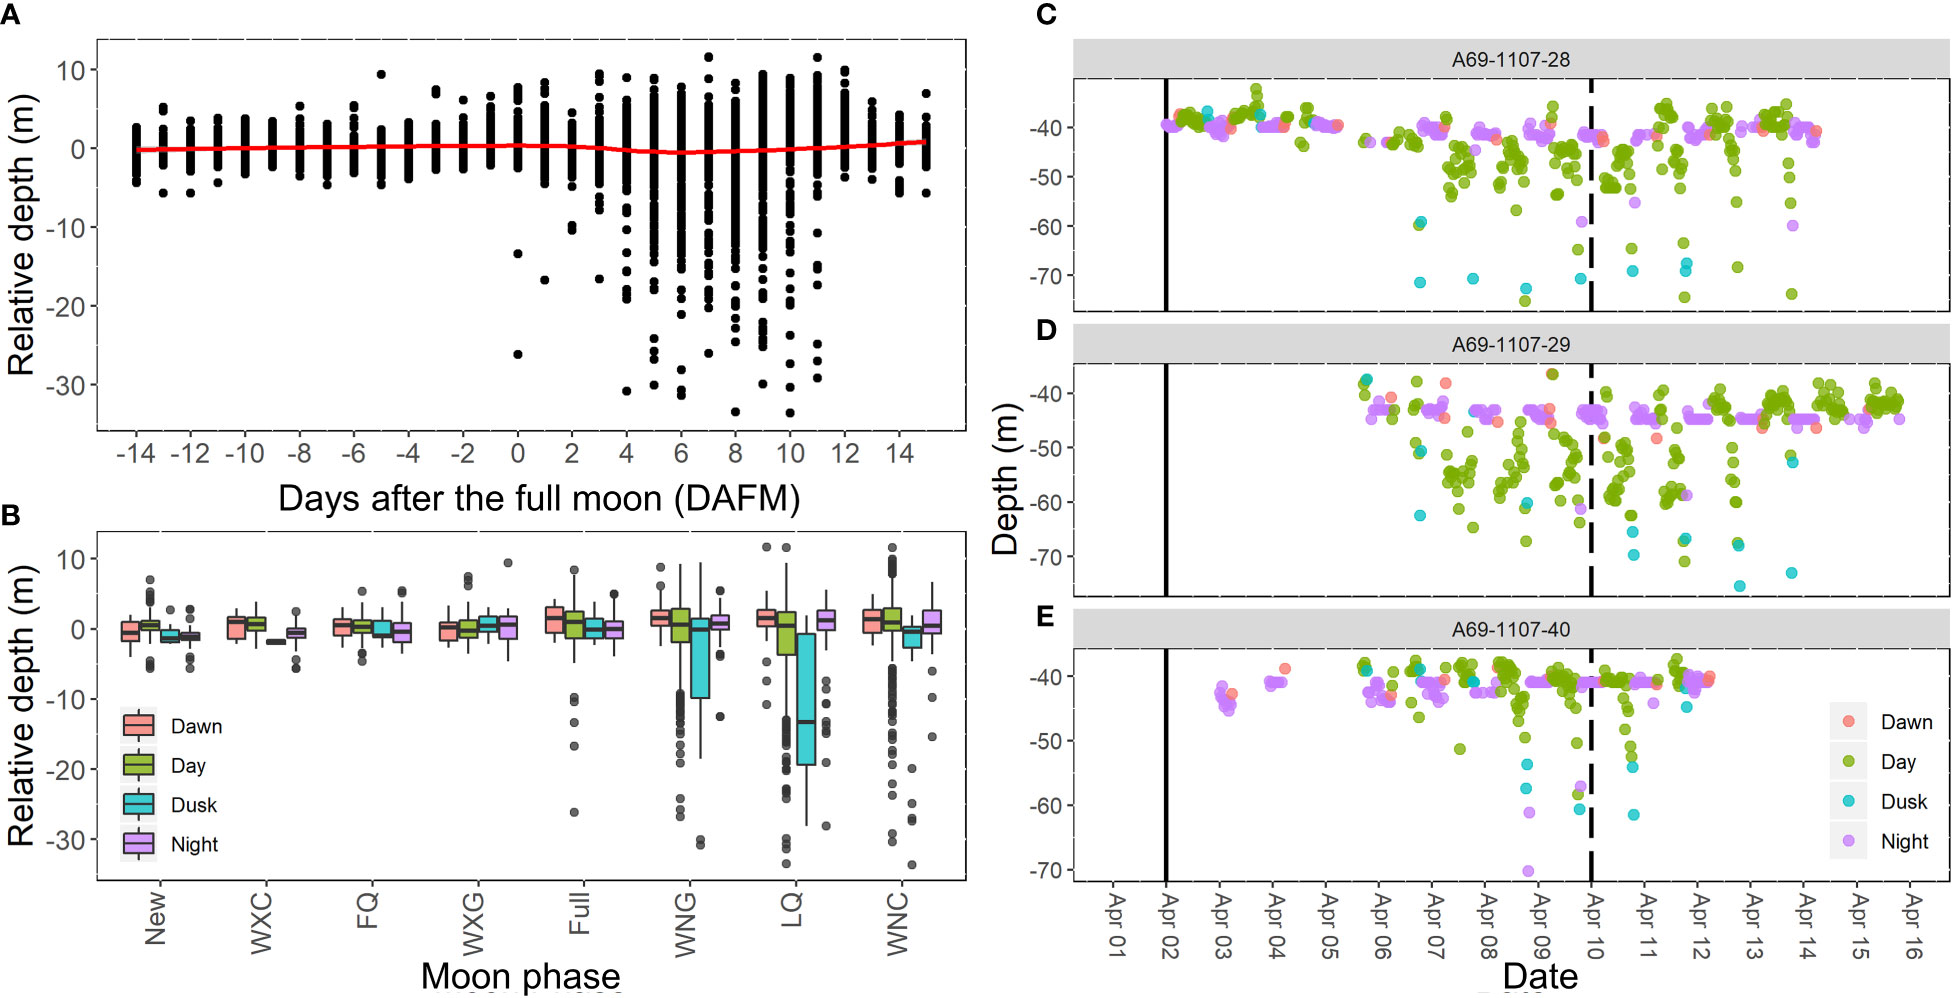
Figure 10 Relative depth of Nassau grouper during spawning at FSA site as influenced by (A) days after the full moon (DAFM) and (B) time periods during different moon phases. Mean depth during spawning season was 42.8 m ± 4.32 SD. Plots (C–E) demonstrate diel patterns of depth use of three individuals from April 2007. Solid vertical line indicates the date of the full moon and the dashed vertical line indicates the last quarter moon phase. Moon phase labels WXC, FQ, WXG, WNG, LQ, and WNC correspond to waxing crescent, first quarter, waxing gibbous, waning gibbous, last quarter, and waning crescent, respectively.
Acoustic telemetry over a seven-year period provided insights into the spatial and temporal patterns of movement of the endangered Nassau grouper around the Grammanik Bank spawning aggregation site. We found that the 1.5 km2 Grammanik Bank 3-month seasonal closed area (1 February to 30 April) only partly protects Nassau grouper, both spatially and temporally, during the spawning season. Although the majority of fish were present during the closed season (Nemeth et al., 2006; Kadison et al., 2010), results from this acoustic tracking study found that Nassau grouper are exposed to potential fishing mortality for at least one month before (January) and one month after (May) the closed season. During the spawning season, the timing of arrival and departure is strongly influenced by the lunar cycle, and a full moon in early January or late April will result in groupers aggregating outside the closed season in late January and early May, respectively. Although the Nassau grouper is fully protected as a species in the United States (Albins et al., 2009), these gaps in temporal boundaries expose Nassau grouper to potential bycatch of fishers targeting the area for other species. For example, commercial and recreational fishers and charter boats commonly target yellowfin grouper (Mycteroperca venenosa, Serranidae) around the Grammanik Bank (grammanik is the local name for yellowfin grouper in USVI), as well as red hind (Epinephelus guttatus, Serranidae), yellowtail snapper (Ocyurus chrysurus, Lutjanidae), queen triggerfish (Balistes vetula, Ballistidae), mutton snapper (Lutjanus analis, Lutjanidae) and other reef fish species. In addition, fishing activity may disrupt courtship and spawning behaviors (Sadovy de Mitcheson and Erisman, 2012; Nemeth et al., 2020).
The small size of the Grammanik Bank seasonal closed area also increased the vulnerability of aggregating Nassau groupers due to their extensive daily movements to and from the FSA site, which carry them outside the protected area boundaries. The frequent large-scale movements may provide a potential mechanism to attract conspecifics to the FSA since they continue to produce courtship associated sounds (Schärer et al., 2012) up to 5 km away from the FSA site (Rowell et al., 2015). The increased vulnerability of this “Pied Piper” behavior, which is also found in M. venenosa, but not in most other aggregating grouper species that establish spawning territories (Nemeth., 2005; Rhodes et al., 2012; Rowell et al., 2015; Mourier et al., 2019), can be reduced by adjusting the protected area boundaries around FSA sites. We calculated that the current Grammanik Bank area (1.5 km2) only protected Nassau grouper 65% of time during the spawning season, while two newly proposed area boundaries of 6.4 km2 and 10.5 km2, based on Nassau grouper movement patterns, could increase protection to 95% and 99%, respectively. These data will help inform future management decisions that may enhance protection and accelerate recovery of the last remaining spawning site of Nassau grouper in the US Virgin Islands.
We investigated the potential for Nassau grouper to reoccupy an extirpated spawning aggregation site as suggested by previous studies (Heppel et al., 2013; Stump et al., 2017). For example, in the Cayman Islands, Nassau grouper were found to revisit an historic FSA site each day during the week of spawning, but departed the site and travelled to the opposite end of Cayman Brac to spawn at dusk (Heppel et al., 2013). Although Rowell et al. (2015) reported that 64% and 56% of Nassau tagged at the Grammanik Bank entered the MCD and passed nearby the historic FSA site (Olsen and LaPlace, 1978), respectively, a selectivity index analysis performed in this study found no evidence of tagged grouper regularly visiting the historic site. This finding is not surprising since there is considerable evidence that a spawning site can be extirpated by fishing and never recover (Olsen and LaPlace, 1978; Aguilar-Perera, 2006; Sadovy de Mitcheson et al., 2013; Cheung et al., 2013; Stump et al., 2017).
The current study elucidated sex-specific similarities and differences in movement patterns and key aspects of Nassau grouper spatial dynamics that fill gaps in understanding their reproductive behaviors. Male and female Nassau grouper showed consistent patterns in monthly arrival dates relative to the full moon but these varied from January to May by more than seven days for arrival dates and four days for departure dates. The result was a difference in residency on the FSA site for both sexes that ranged on average from one to nearly 11 days (see Figure 3). Variable patterns in monthly arrival and departure dates during the spawning season have been documented for Nassau grouper in Belize (Starr et al., 2007) and L. analis in the Dry Tortugas (Feeley et al., 2018). Nassau grouper also showed progressive trends in time of departure from the FSA site ranging from 11:30 in January to 04:00 in May. The progressive changes in departure dates and times during the spawning season shown by different aggregating species may be driven by environmental changes and warrants further investigation.
An extraordinary finding was the extent of movement by females around the FSA site that was two to three times greater than males. Males were more sedentary, were more likely to establish temporary residences (6 of 9 fish; Figure 8) and thus had longer cumulative residency at the FSA site than females (22 d vs 9 d respectively). These residency times are similar to Nassau grouper in Belize (Starr et al., 2007) but considerably longer than in the Bahamas, where Nassau grouper are reported to stay only one or two days on the FSAs but are gone from home sites 7 to 21 days as they travel 100’s of km to and from the FSA (Dahlgren et al., 2016; Stump et al., 2017). The gonochoristic Nassau grouper (Sadovy and Colin, 1995; Sadovy and Eklund, 1999) showed no sex-specific differences in timing of arrival or departure, a result also found by Starr et al. (2007). This is unlike protogynous aggregating groupers, in which males arrive earlier to establish territories and remain longer at FSA sites than females (Samoilys, 1997; Rhodes and Sadovy, 2002; Whiteman et al., 2005; Nemeth et al., 2007; Rhodes et al., 2012; Nemeth et al., 2020). This characteristic is believed to result in higher catch rates of protogynous males at FSA sites that may cause skewed sex ratios and sperm limitation during spawning (Coleman et al., 1996; AlonzoMangel., 2004; Brooks et al., 2008). The behavior of male and female Nassau grouper around the Grammanik Bank FSA complicates our understanding of sex-specific fishing mortality as seen in protogynous species. For example, male Nassau grouper had longer residency time at the Grammanik Bank because they were more sedentary and more likely to establish temporary resident sites than females. This behavior would make males more vulnerable to fishing mortality if no protected area existed but less vulnerable if within a protected area. Females, on the other hand, traveled much further than males on a daily basis, making them less vulnerable at the FSA site if no protection existed but more vulnerable to fishing mortality by swimming outside protected area boundaries.
The relatively large acoustic array used in this study provided key information on the spatial dynamics of Nassau groupers around the Grammanik Bank FSA site. We were able to identify staging areas used for a few days or weeks, and also temporary resident sites that were used for months after the spawning season but not year-round. Temporary resident areas for 50% and 95% KUDs during non-spawning season (0.14 km2 and 0.94 km2, respectively) were slightly smaller than reported by Keller et al. (2020) for Nassau grouper in the Florida Keys (0.20 km2 and 1.58 km2). Individual Nassau grouper showed relatively strong site fidelity to their staging area or temporary resident site that were used for several successive months and spawning seasons. Starr et al. (2007) also found 17% of Nassau grouper established temporary residence sites around the Belize FSA for up to 10 months.
Management of Nassau grouper has reached a critical point, where stocks have been greatly reduced throughout its historic range primarily through overfishing and loss of spawning aggregations and more decisive action is required (Aguilar-Perera, 2006; Sadovy de Mitcheson and Erisman, 2012; Kobara et al., 2013). For example, in the Cayman Islands the rapid decline of two Nassau grouper FSAs was reversed by establishing area and seasonal closures based on years of research (Waterhouse et al., 2020). Using acoustic telemetry we mapped the main migration pathways, primary staging areas and courtship arena for Nassau grouper at the Grammanik Bank (9.6 km2, 4.7 km2, and 1.2 km2, respectively; Figure 9B) and provided two options for conservation area boundaries (6.4 km2 and 10.5 km2) that can protect the majority of the spawning population. This approach is particularly relevant to Nassau grouper FSA sites located on large insular or continental shelfs areas (e.g. Bahamas, Belize, Cuba, Florida, Turks and Caicos). The spatial areas described above for the Grammanik Bank can also be applied more broadly to other regions or countries where data, resources or access to technology is limited (Kobara et al., 2013). This is particularly important in countries with limited fisheries management where Nassau grouper are being exploited at FSA sites, but populations are still relatively healthy or have high potential for recovery (Vo et al., 2014; Sherman et al., 2016). Identifying biologically-relevant spatial and temporal boundaries for fishery closed areas are likely to be more acceptable to fishers and can be tailored to match the status of local grouper populations. For example, in locations where a Nassau grouper FSA site experiences relatively little fishing, a 5 km2 protected area might be suitable for enclosing the courtship arena and adjacent staging areas. In locations where FSA sites have shown considerable decline and Nassau grouper population sustainability is threatened, a 10 km2 protected area would most likely encompass their staging areas, temporary resident sites and primary migration corridors. A precautionary approach is preferred where marine protected areas can be established on a temporary basis while additional spatial data are collected (Sadovy de Mitcheson, 2016; Waterhouse et al., 2020).
Spatial data can also be used in conjunction with seasonally-specific time periods that bracket the entire spawning season for a particular Caribbean region. At the Grammanik Bank, our spatial and temporal analyses indicated that expanding the MPA boundaries from 1.5 km2 to 6.4 km2 and expanding the closed season to 4 months (January 15 to May 15) or 5 months (January 1 to May 31) would maximize conservation and management objectives while minimizing impact on commercial fishing grounds. Extending the current boundaries further off the shelf edge would also protect the 70 m to 80 m deep Agaricia undata reefs (Smith et al., 2019) which are used by Nassau grouper on a daily basis at dusk during the spawning season. These recommended boundaries are specific for Nassau grouper and do not take into account movement patterns of other species that utilize the Grammanik Bank for spawning (Nemeth et al., 2006; Nemeth and Kadison, 2013; Rowell et al., 2015; Biggs and Nemeth, 2016; Nemeth et al., 2020). However, these management actions incorporate the best available research and would be expected to reduce potential bycatch and fishing mortality, eliminate disturbance of spawning and courtship behaviors at the spawning site (Nemeth et al., 2020), and protect critical spawning habitat for Nassau grouper. Applying management measures for the most vulnerable species, provides additional benefits to other less threatened species at multi-species FSA sites.
The raw data supporting the conclusions of this article will be made available by the authors, without undue reservation.
Ethical review and approval was not required for the animal study because this study was conducted before the University of the Virgin Islands had an IACUC review board, which was established in 2012.
RN, BW and MS provided original concept and funding for this research, RN and EK conducted majority of fieldwork and RN, JJ and JM provided data and statistical analysis and figure and table preparation. All authors contributed to the article and approved the submitted version.
Support for deploying and maintaining the acoustic array included Puerto Rico Sea Grant (#R-31-1-06), NOAA Saltonstall-Kennedy program (#NA09NMF4270068), the Virgin Islands Established Program to Stimulate Competitive Research (VI-EPSCoR #NSF-814417) and the Guy Harvey Research Institute, Nova Southeastern University. Also thanks to Lana Vento Charitable Trust which provided research dive equipment and materials for this project.
Special thanks are given to all the divers and field hands involved in catching and tagging fish, and deploying and maintaining the acoustic array used in this study, especially Elizabeth Whiteman, Steve Herzlieb, Jeremiah Blondeau, Jacqui Calnan, Robert Brewer, Leslie Henderson, Anne Tagini and Bryan Legare. Thanks to fishers Kenny Turbe and Bobby Vante for their expertise and conservation ethic. We are indebted to J. Martins for initial spatial analysis of this work and support staff (C. Joseph, R. Tonge, S. Prosterman) of the Center for Marine and Environmental Studies. This is contribution number 257 to the University of the Virgin Islands’ Center for Marine and Environmental Studies.
JJ was employed by Consolidated Safety Services, Inc.
The remaining authors declare that the research was conducted in the absence of any commercial or financial relationships that could be construed as a potential conflict of interest.
All claims expressed in this article are solely those of the authors and do not necessarily represent those of their affiliated organizations, or those of the publisher, the editors and the reviewers. Any product that may be evaluated in this article, or claim that may be made by its manufacturer, is not guaranteed or endorsed by the publisher.
The Supplementary Material for this article can be found online at: https://www.frontiersin.org/articles/10.3389/fmars.2023.1154689/full#supplementary-material
Aguilar-Perera A. (2006). Disappearance of a Nassau grouper spawning aggregation off southern Mexican Caribbean coast. Mar. Ecol. Prog. Ser. 327, 289–296. doi: 10.3354/meps327289
Albins M. A., Hixon M. A., Sadovy Y. (2009). Threatened fishes of the world: Epinephelus striatus (Bloch 1792) (Serranidae). Environ. Biol. Fishes 86, 309–310. doi: 10.1007/s10641-009-9512-5
Alonzo S. H., Mangel. M. (2004). The effects of size-selective fisheries on the stock dynamics of and sperm limitation in sex-changing fish. Fish. Bull. 102, 1–13.
Armstrong R. A., Singh H., Torres J., Nemeth R. S., Can A., Roman C., et al. (2006). Characterizing the deep insular shelf coral reef habitat of the hind bank marine conservation district (US virgin islands) using the seabed autonomous underwater vehicle. Cont. Shelf Res. 26, 194–205. doi: 10.1016/j.csr.2005.10.004
Beets J., Friedlander A. (1999). Evaluation of a conservation strategy: A spawning aggregation closure for red hind, Epinephelus guttatus, in the US virgin islands. Environ. Biol. Fishes 55, 91–98. doi: 10.1023/A:1007404421518
Biggs C. R., Nemeth R. S. (2016). Spatial and temporal patterns of movement of two snapper species in a multi-species spawning aggregation. Mar. Ecol. Prog. Ser. 558, 129–142. doi: 10.3354/meps11846
Bivand R., Lewin-Koh N. (2018). Maptools: Tools for handling spatial objects. R package, v. 0.9-4. Available at: http://CRAN.R-project.org/package=maptools.
Blincow K. M., Bush P. G., Heppell S. A., McCoy C. M., Johnson B., Pattengill-Semmens C. V., et al. (2020). Spatial ecology of Nassau grouper at home reef sites: Using acoustic telemetry to track a large, long-lived epinephelid across multiple years, (2005–2008). Mar. Ecol. Prog. Ser. 655, 199–214. doi: 10.3354/meps13516
Bohnsack J. A. (1998). Application of marine reserves to reef fisheries management. Aust. J. Ecol. 23, 298–304. doi: 10.1111/j.1442-9993.1998.tb00734.x
Boucek R. E., Leone E., Bickford J., Walters-Burnsed S., Lowerre-Barbieri S. (2017). More than just a spawning location: Examining fine scale space use of two estuarine fish species at a spawning aggregation site. Front. Mar. Sci. 4. doi: 10.3389/fmars.2017.00355
Brooks E. N., Shertzer K. W., Gedamke T., Vaughan D. S. (2008). Stock assessment of protogynous fish: Evaluating measures of spawning biomass used to estimate biological reference points. Fish. Bull. 106, 12–23.
Bryan D., Feeley M. W., Nemeth R. S., Pollock C., Ault J. S. (2019). Home range and spawning migration patterns of queen triggerfish (Balistes vetula) in st. Croix, USVI. Mar. Ecol. Prog. Ser. 616, 123–139. doi: 10.3354/meps12944
Calenge C. (2006). The package “adehabitat” for the r software: A tool for the analysis of space and habitat use by animals. Ecol. Model. 197 (3-4), 516–519. doi: 10.1016/j.ecolmodel.2006.03.017
Cheung W. W., Sadovy de Mitcheson Y., Braynen M. T., Gittens L. G. (2013). Are the last remaining Nassau grouper Epinephelus striatus fisheries sustainable? Status quo in the Bahamas. Endanger. Species Res. 20, 27–39. doi: 10.3354/ESR00472
Claro R., Sadovy de Mitcheson Y., Lindeman K. C., Garcia-Cagide A. R. (2009). Historical analysis of Cuban commercial fishing effort and the effects of management interventions on important reef fishes from 1960-2005. Fisheries Res. 99 (1), 7–16. doi: 10.1016/j.fishres.2009.04.004
Claydon J. (2004). Spawning aggregations of coral reef fishes: Characteristics, hypotheses, threats and management. Oceanogr. Mar. Biol.: Annu. Rev. 42, 265–302. doi: 10.1201/9780203507810-11
Coleman F. C., Koenig C. C., Collins L. A. (1996). Reproductive styles of shallow-water grouper (Pisces:Serranidae) in the eastern gulf of Mexico and the consequences of fishing spawning aggregations. Environ. Biol. Fishes 47, 129–141. doi: 10.1007/BF00005035
Cornish A., Eklund A. M. (2003). “Epinephelus striatus,” in The IUCN red list of threatened species, Version 2014.2. doi: 10.2305/IUCN.UK.2003.RLTS.T7862A12858266.en
Crisafulli B. M., Fairclough D. V., Keay I. S., Lewis P., How J. R., Ryan K. L., et al. (2018). Does a spatiotemporal closure to fishing Chrysophrys auratus (Sparidae) spawning aggregations also protect individuals during migration? Can. J. Fisheries Aquat. Sci. 1, 1171–1185. doi: 10.1139/cjfas-2017-0449
Csardi G., Nepusz T. (2006). The igraph software package for complex network research. InterJournal 1695 (5), 1–9. complex systems.
Dahlgren C. P., Buch K., Rechisky E., Hixon M. A. (2016). Multiyear tracking of Nassau grouper spawning migrations. Mar. Coast. Fisheries: Dynamics Management Ecosystem Sci. 8, 522–535. doi: 10.1080/19425120.2016.1223233
Domeier M. L., Colin P. L. (1997). Tropical reef fish spawning aggregations: Defined and reviewed. Bull. Mar. Sci. 60, 698–726.
Farmer N. A., Ault J. S. (2011). Grouper and snapper movements and habitat use in dry tortugas, Florida. Mar. Ecol. Prog. Ser. 433, 169–184. doi: 10.3354/meps09198
Federal Register (2016). Federal register, June 29, 2016-15101. National Oceanic and Atmospheric Administration, Department of Commerce, Vol. 81. 42268–42285.
Feeley M. W., Morley D., Acosta A., Barbera P., Hunt J., Switzer T., et al. (2018). Spawning migration movements of mutton snapper in tortugas, Florida: Spatial dynamics within a marine reserve network. Fisheries Res. 204, 209–223. doi: 10.1016/j.fishres.2018.02.020
Giakoumi S., McGowan J., Mills M., Beger M., Bustamante R. H., Charles A., et al. (2018). Revisiting “Success” and “Failure” of marine protected areas: A conservation scientist perspective. front. Mar. Sci. 5. doi: 10.3389/fmars.2018.00223
Grüss A., Kaplan D. M., Robinson J. (2014). Evaluation of the effectiveness of marine reserves for transient spawning aggregations in data limited situations. ICES J. Mar. Sci. 71, 435–449. doi: 10.1093/icesjms/fst028
Heppel S. A., Semmens B. X., Pattenfill-Semmens C., Bush P., Mccoy C., Johnson B. (2013). Behavior, hyperstability, and population declines of an aggregating marine fish. Proc. Gulf Caribbean Fisheries Institute 66, 379–380.
Herzlieb S., Kadison E., Blondeau J., Nemeth R. S. (2006). Comparative assessment of coral reef systems located along the insular platform of st. Thomas, US virgin islands and the relative effects of natural and human impacts. Proc. 10th Int. Coral Reef Conf. 4, 1144–1115.
Heyman W. D., Kjerfve B. (2008). Characterization of transient multi-species reef fish spawning aggregations at gladden spit, Belize. Bull. Mar. Sci. 83, 531–551.
Heyman W. D., Kobara S. (2012). “Geomorphology of reef fish spawning aggregations in Belize and the Cayman islands (Caribbean),” in Seafloor geomorphology as benthic habitat. Eds. Harris P. T., Baker E. K. (London: Elsevier), 388–396. doi: 10.1016/B978-0-12-385140-6.00026-8
Hothorn T., Bretz F., Westfall P. (2008). Simultaneous inference in general parametric models. Biometrical J.: J. Math. Methods Biosci. 50 (3), 346–363. doi: 10.1002/bimj.200810425
Hughes A. T., Hamilton R. J., Choat J. H., Rhodes K. L. (2020). Declining grouper spawning aggregations in Western province, Solomon islands, signal the need for a modified management approach. PLoS One 15 (3), e0230485. doi: 10.1371/journal.pone.0230485
IUCN (1996). IUCN red list of threatened animals. international union for conservation of nature and natural resources. Eds. Baille J., Groombridge B. (Washington, D.C., U.S.A: Co-published by lUCN, Gland, Switzerland and Cambridge U.K., and Conservation International), 452 pp. ISBN 2-8317-0335-2.
Jossart J., Nemeth R. S., Primack A., Stolz R. (2017). Extreme passive acoustic telemetry detection variability on a mesophotic coral reef, United States Virgin Islands. Mar. Biol. 164, 180. doi: 10.1007/s00227-017-3213-y
Kadison E., Nemeth R. S., Blondeau J., Smith T., Calnan J. (2010). Nassau Grouper (Epinephelus striatus) in st. Thomas, US virgin islands, with evidence for a spawning aggregation site recovery. Proceeding Gulf Caribbean Fisheries Institute 62, 273–279.
Kadison E., Nemeth R. S., Herzlieb S., Blondeau J. (2006). Temporal and spatial dynamics of Lutjanus cyanopterus and L. jocu (Pisces: Lutjanidae) spawning aggregations on a multi-species spawning site in the USVI. Rev. Biol. Trop. 54(suppl. 3), 69–78.
Keller J. A., Herbig J. L., Morley D., Wile A., Barbera P., Acosta A. (2020). Grouper tales: Use of acoustic telemetry to evaluate grouper movements at western dry rocks in the Florida keys. Mar. Coast. Fisheries: Dynamics Management Ecosystem Sci. 12, 290–307. doi: 10.1002/mcf2.10109
Klinard N. V., Matley J. K. (2020). Living until proven dead: addressing mortality in acoustic telemetry research. Rev. Fish Biol. Fisheries 30 (3), 485–499. doi: 10.1007/s11160-020-09613-z
Kobara S., Heyman W. D. (2008). Geomorphometric patterns of Nassau grouper (Epinephelus striatus) spawning aggregation sites in the Cayman islands. Mar. Geodesy 31, 231–245. doi: 10.1080/01490410802466397
Kobara S., Heyman W. D., Pittman S. J., Nemeth R. S. (2013). Biogeography of transient reef fish spawning aggregations in the Caribbean: A synthesis for future research and management. Oceanogr. Mar. Biol.: Annu. Rev. 51, 281–324. doi: 10.1201/b15406-6
Lazaridis E. (2014). Lunar: Lunar phase and distance, seasons and other environmental factors. R package, v 0.1-04. Available at: https://cran.r-project.org/web/packages/lunar/lunar.pdf.
Lowerre-Barbieri S., Villegas-Rıos D., Walters S., Bickford J., Cooper W., Muller R., et al. (2014). Spawning site selection and contingent behavior in common snook, Centropomus undecimalis. PLoS One 9 (7), e101809. doi: 10.1371/journal.pone.0101809
Mourier J., Ballesta L., Clua E. C., Planes S. (2019). Visitation patterns of camouflage groupers Epinephelus polyphekadion at a spawning aggregation in fakarava inferred by acoustic telemetry. Coral Reefs 38, 909–991. doi: 10.1007/s00338-019-01814-8
Nanami A., Kawabata Y., Sato T., Yamaguchi T., Kawabe R., Soyano K. (2014). Spawning migration and returning behavior of white-streaked grouper Epinephelus ongus determined by acoustic telemetry. Mar. Biol. 161, 669–680. doi: 10.1007/s00227-013-2369-3
Nemeth. R. S. (2005). Population characteristics of a recovering US virgin islands red hind spawning aggregation following protection. Mar. Ecol. Prog. Ser. 286, 81–97. doi: 10.3354/meps286081
Nemeth R. S. (2009). “Dynamics of reef fish and decapod crustacean spawning aggregations: Underlying mechanisms, habitat linkages and trophic interactions,” in Ecological connectivity among tropical coastal ecosystems. Ed. Nagelkerken I. (Dordrecht: Springer), 73–134.
Nemeth R. S. (2012). “Ecosystem aspects of species that aggregate to spawn,” in Reef fish spawning aggregations: Biology, research and management. Eds. Sadovy de Mitcheson Y., Colin P. L. (Dordrecht: Springer), 21–55.
Nemeth R. S., Blondeau J., Herzlieb S., Kadison E. (2007). Spatial and temporal patterns of red hind movement and migration at spawning aggregations in st. Thomas and st. Croix US virgin islands. Environ. Biol. Fishes 78, 365–381. doi: 10.1007/s10641-006-9161-x
Nemeth R. S., Kadison E. (2013). Temporal patterns and behavioral characteristics of aggregation formation and spawning in the Bermuda chub (Kyphosus sectatrix). Coral Reefs 32 (4), 1067–1076. doi: 10.1007/s00338-013-1050-0
Nemeth R. S., Kadison E., Brown Peterson N. J., Blondeau J. (2020). Reproductive biology and behavior associated with a spawning aggregation of the yellowfin grouper Mycteroperca venenosa. Bull. Mar. Sci. 96 (1), 31–56. doi: 10.5343/bms.2019.0028
Nemeth R. S., Kadison E., Herzlieb S. (2006). Status of a yellowfin (Mycteroperca venenosa) grouper spawning aggregation in the US virgin islands with notes on other species. Proc. Gulf Caribbean Fisheries Institute 57, 543–558.
Oksanen J., Kindt R., Simpson G. L., Oksanen M. J. (2018). Package ‘vegan3d’ 1–0. R package version. Available at: https://cran.r-project.org/web/packages/vegan/vegan.pdf.
Olsen D. A., LaPlace J. A. (1978). A study of virgin islands grouper fishery based on a breeding aggregation. Proc. Gulf Caribbean Fisheries Institute 131, 130–144.
Rhodes K. L., McIlwain J., Joseph E., Nemeth R. S. (2012). Reproductive movement, residency and fisheries vulnerability of brown-marbled grouper, Epinephelus fuscoguttatus (Forsskå). Coral Reefs 31, 443–453. doi: 10.1007/s00338-012-0875-2
Rhodes K. L., Nemeth R. S., Kadison E., Joseph E. (2014). Spatial, temporal and environmental dynamics of a multi-species epinephelid spawning aggregation in pohnpei, Micronesia. Coral Reefs 33, 765–775. doi: 10.1007/s00338-014-1172-z
Rhodes K. L., Sadovy Y. (2002). Temporal and spatial trends in spawning aggregations of camouflage grouper, Epinephelus polyphekadion, in pohnpei, Micronesia. Environ. Biol. Fishes 63, 27–39. doi: 10.1023/A:1013840621820
Rowell T. J., Nemeth R. S., Appeldoorn R. S., Schärer M. T. (2015). Fish sound production and acoustic telemetry reveal behaviors and spatial patterns associated with spawning aggregations of two Caribbean groupers. Mar. Ecol. Prog. Ser. 518, 239–254. doi: 10.3354/meps11060
Russell M. W., Sadovy de Mitcheson Y., Erisman B. E., Hamilton R., Luckhurst B. E., Nemeth R. S. (2014). Status report – world’s fish aggregations 2014. science and conservation of fish aggregations, California, USA. Int. Coral Reef Initiative, 1–12.
Sadovy Y. (1994). Grouper stocks of the western Atlantic: The need for management and management needs. Proc. Gulf Caribbean Fisheries Institute 43, 43–65.
Sadovy Y., Aguilar-Perera A., Sosa-Cordero E. (2018). Epinephelus striatus. IUCN Red List Threatened Species 2018, e.T7862A46909843. doi: 10.2305/IUCN.UK.2018-2.RLTS.T7862A46909843.en
Sadovy Y., Colin P. L. (1995). Sexual development and sexuality in the Nassau grouper, Epinephelus striatus, (Bloch) (Pisces: Serranidae). J. Fish Biol. 46, 961–972. doi: 10.1111/j.1095-8649.1995.tb01401.x
Sadovy Y., Eklund A. M. (1999). Synopsis of biological data on the Nassau grouper, Epinephelus striatus (Bloc) and the jewfish E. itajara (Lichtenstein 1822). NOAA Tech. Rep. NMFS 146. U.S. Dept. of Commerce, Seattle Washington. 1–65 pp.
Sadovy de Mitcheson Y. (2016). Mainstreaming fish spawning aggregations into fishery management calls for a precautionary approach. BioScience 66 (4), 1–12. doi: 10.1093/biosci/biw013
Sadovy de Mitcheson Y., Cornish A., Domeier M., Colin P. L., Russell M., Lindeman K. C. (2008). A global baseline for spawning aggregations of reef fishes. Conserv. Biol. 22 (5), 1233–1244. doi: 10.1111/j.1523-1739.2008.01020.x
Sadovy de Mitcheson Y., Craig M. T., Bertoncini A. A., Carpenter K. E., Cheung W. W., Choat J. H., et al. (2013). Fishing groupers towards extinction: a global assessment of threats and extinction risks in a billion dollar fishery. Fish Fisheries 14 (2), 119–136. doi: 10.1111/j.1467-2979.2011.00455.x
Sadovy de Mitcheson Y., Erisman B. (2012). “Fishery and biological implications of fishing spawning aggregations, and the social and economic importance of aggregating fishes,” in Reef fish spawning aggregations: Biology, research and management. Eds. Sadovy de Mitcheson Y., Colin P. L. (Dordrecht: Springer), 225–284.
Sala E., Ballesteros E., Starr R. M. (2001). Rapid decline of Nassau grouper spawning aggregations in Belize: Fishery management and conservation needs. Fisheries 26, 23–30. doi: 10.1577/1548-8446(2001)026<0023:RDONGS>2.0.CO;2
Samoilys M. A. (1997). Periodicity of spawning aggregations of coral trout (Plectropomous leopardus) on the great barrier reef. Mar. Ecol. Prog. Ser. 160, 149–159. doi: 10.3354/meps160149
Schärer M. T., Rowell T. J., Nemeth M. I., Appeldoorn R. S. (2012). Sound production associated with reproductive behavior of Nassau grouper Epinephelus striatus at spawning aggregations. Endanger. Species Res. 19, 29–38. doi: 10.3354/esr00457
Semmens B. X., Luke K. E., Bush P. G., Pattengill-Semmens C., Johnson B., Mccoy C., et al. (2007). Investigating the reproductive migration and spatial ecology of Nassau grouper (Epinephelus striatus) on little Cayman island using acoustic tags – an overview. Proc. Gulf Caribbean Fisheries Institute 58, 191–198.
Sherman K. D., Dahlgren C. P., Stevens J. R., Tyler C. R. (2016). Integrating population biology into conservation management for endangered Nassau grouper Epinephelus striatus. Mar. Ecol. Prog. Ser. 554, 263–280. doi: 10.3354/meps11771
Siceloff L., Howell W. H. (2013). Fine-scale temporal and spatial distributions of Atlantic cod (Gadus morhua) on a western gulf of Maine spawning ground. Fisheries Res. 141, 31–43. doi: 10.1016/j.fishres.2012.04.001
Simpfendorfer C. A., Heupel M. R., Hueter R. E. (2002). Estimation of short-term centers of activity from an array of omnidirectional hydrophones and its use in studying animal movements. Can. J. Fisheries Aquat. Sci. 59 (1), 23–32. doi: 10.1139/f01-191
Sluka R., Chiappone K. M., Sullivan K. M., Wright R. (1997). The benefits of a marine fishery reserve for Nassau grouper Epinephelus striatus in the central Bahamas. Proc. 8th Int. Coral Reef Symposium 2, 1961–1964.
Smith T., Blondeau J., Nemeth R. S., Pittman S., Calnan J., Kadison E., et al. (2010). Benthic structure and cryptic mortality in a Caribbean mesophotic coral reef bank system, the hind bank marine conservation district, U.S. virgin islands. Coral Reefs 29, 289–308. doi: 10.1007/s00338-009-0575-8
Smith T. B., Brandt M. E., Brandtneris V. W., Ennis R. S., Groves S. H., Habtes S., et al. (2019). “The united states virgin islands,” in Mesophotic coral ecosystems. coral reefs of the world. Eds. Loya Y., Puglise K., Bridge T. C. L. (Cham: Springer), 131–148. doi: 10.1007/978-3-319-92735-0_8
Starr R. M., Sala E., Ballesteros E., Zabala M. (2007). Spatial dynamics of the Nassau grouper Epinephelus striatus in a Caribbean atoll. Mar. Ecol. Prog. Ser. 343, 239–249. doi: 10.3354/meps06897
Stump K., Dahlgren C. P., Sherman K. D., Knapp C. R. (2017). Nassau Grouper migration patterns during full moon suggest collapsed historic fish spawning aggregation and evidence of an undocumented aggregation. Bull. Mar. Sci. 93, 375–389. doi: 10.5343/bms.2016.1042
van Rij J., Martijn W., Baayen R. H., van Rijn H. (2017). itsadug: Interpreting Time Series and Autocorrelated Data Using GAMMs. R package version 2.3. Available at: https://CRAN.R-project.org/package=itsadug.
Virgin Islands Rules and Regulations (2021). Commercial fishing: Title 12, chapter 9A, section, 316-14(e). United States Virgin Islands: Department of Planning and Natural Resources, Division of Fish and Wildlife.
Vo A.-T. E., Ashley M. C., Dikou A., Newman S. P. (2014). Fishery exploitation and stock assessment of the endangered Nassau grouper, Epinephelus striatus (Actinopterygii: Perciformes: Serranidae), in the Turks and Caicos Islands.. Acta Ichthyol. Piscat. 44 (2), 117–122. doi: 10.3750/AIP2014.44.2.05
Waterhouse L., Heppell S. A., Pattengill-Semmens C. V., McCoy C., Bush P., Johnson B. C., et al. (2020). Recovery of critically endangered Nassau grouper (Epinephelus striatus) in the Cayman islands following targeted conservation actions. Proc. Natl. Acad. Sci. 117, 1587–1595. doi: 10.1073/pnas.1917132117
Whiteman E. A., Jennings C. A., Nemeth R. S. (2005). Sex structure and potential female fecundity in an Epinephelus guttatus spawning aggregation: Applying ultrasonic imaging. J. Fish Biol. 66, 983–995. doi: 10.1111/j.1095-8649.2005.00653.x
Whoriskey K., Martins E., Auger-Methe M., Gutowsky L. F., Lennox R. J., Cooke S., et al. (2019). Current and emerging statistical techniques for aquatic telemetry data: A guide to analyzing spatially discrete animal detections. Methods Ecol. Evol. 10, 935–948. doi: 10.1111/2041-210x.13188
Wood S. N. (2011). Fast stable restricted maximum likelihood and marginal likelihood estimation of semiparametric generalized linear models. J. R. Stat. Society: Ser. B (Statistical Methodology) 73 (1), 3–36. doi: 10.1111/j.1467-9868.2010.00749.x
Zarada K., Walters Burnsed S., Bickford J., Ducharme-Barth N., Ahrens R. N., Lowerre-Barbieri S. (2019). Estimating site-specific spawning parameters for a spawning aggregation: A example with spotted seatrout. Mar. Ecol. Prog. Ser. 624, 117–129. doi: 10.3354/meps13016
Zemeckis D. R., Dean M. J., DeAngelis A. I., Van Parijs F. M., Hoffman W. S., Baumgartner Hatch L. T., et al. (2019). Identifying the distribution of Atlantic cod spawning using multiple fixed and glider-mounted acoustic technologies. ICES J. Mar. Sci. 76, 1610–1625. doi: 10.1093/icesjms/fsz064
Zemeckis D. R., Hoffman W. S., Dean M. J., Armstrong M. P., Cadrin S. X. (2014). Spawning site fidelity by Atlantic cod (Gadus morhua) in the gulf of Maine: implications for population structure and rebuilding. ICES J. Mar. Sci. 71, 1356–1365. doi: 10.1093/icesjms/fsu117
Keywords: acoustic telemetry, Nassau grouper, endangered species, fisheries management, marine protected areas, fisheries conservation, fish spawning aggregation (FSA)
Citation: Nemeth RS, Kadison E, Jossart J, Shivji M, Wetherbee BM and Matley JK (2023) Acoustic telemetry provides insights for improving conservation and management at a spawning aggregation site of the endangered Nassau grouper (Epinephelus striatus). Front. Mar. Sci. 10:1154689. doi: 10.3389/fmars.2023.1154689
Received: 31 January 2023; Accepted: 27 February 2023;
Published: 31 March 2023.
Edited by:
Nathan Knott, NSW Government, AustraliaCopyright © 2023 Nemeth, Kadison, Jossart, Shivji, Wetherbee and Matley. This is an open-access article distributed under the terms of the Creative Commons Attribution License (CC BY). The use, distribution or reproduction in other forums is permitted, provided the original author(s) and the copyright owner(s) are credited and that the original publication in this journal is cited, in accordance with accepted academic practice. No use, distribution or reproduction is permitted which does not comply with these terms.
*Correspondence: Richard S. Nemeth, cm5lbWV0aEB1dmkuZWR1
Disclaimer: All claims expressed in this article are solely those of the authors and do not necessarily represent those of their affiliated organizations, or those of the publisher, the editors and the reviewers. Any product that may be evaluated in this article or claim that may be made by its manufacturer is not guaranteed or endorsed by the publisher.
Research integrity at Frontiers
Learn more about the work of our research integrity team to safeguard the quality of each article we publish.