 Young Geul Yoon
 Dong-Gyun Han
 Jee Woong Choi
95% of researchers rate our articles as excellent or good
Learn more about the work of our research integrity team to safeguard the quality of each article we publish.
Find out more
ORIGINAL RESEARCH article
Front. Mar. Sci. , 14 July 2023
Sec. Ocean Observation
Volume 10 - 2023 | https://doi.org/10.3389/fmars.2023.1153843
This article is part of the Research Topic Noise and Vibrations in Offshore Wind Farms and Their Impact on Aquatic Species View all 10 articles
As interest in the development of renewable energy increases, a large number of offshore wind farms are being built worldwide. Accordingly, the potential impacts of underwater operational noise on marine ecosystems have become an issue, and thus it is necessary to understand the mechanisms and acoustic characteristics of underwater operational noise for the environmental impact assessment. For this paper, underwater noise was measured for about 10 days near a 3-MW wind turbine off the southwest coast of Korea, and the acoustic characteristics of the operational noise and its relationship with rotor speed were investigated. The tonal frequencies of the underwater operational noise varied with rotor speed, and particularly the peak level at a frequency of ~198 Hz increased by ~20 dB or more at the rated rotor speed. Additional experiments were conducted to determine the relationship between underwater noise and wind turbine tower vibration, and finally, the underwater noise correlated highly with the tower vibration acceleration signal, wind speed, and rotor speed, with correlation coefficients of 0.95 or higher.
Offshore wind power is playing an increasingly important role in the transition to sustainable green energy (Cranmer and Baker, 2020; Stöber and Thomsen, 2021; Popper et al., 2022). Offshore wind power has many advantages, such as stronger wind conditions than onshore, virtually no restrictions on the scale, limited visual pollution, and no noise issues for onshore residents (Bilgili et al., 2011; Oh et al., 2012). However, one major environmental issue caused by offshore wind power is underwater noise generated during the whole life cycle of a wind farm, from positioning and site surveys through construction, operation, and decommissioning (Tougaard et al., 2009; Kastelein et al., 2017; Mooney et al., 2020; Galparsoro et al., 2022). Underwater noise from each of these phases has the potential to negatively impact aquatic life in several ways (Pangerc et al., 2016; Mooney et al., 2020; Tougaard et al., 2020; Han and Choi, 2022; Popper et al., 2022). Recently, several studies have been reported on the effects of environmental changes caused by the construction and operation of offshore wind farms on the marine ecosystem (Vaissière et al., 2014; Hall et al., 2020). Of these, most studies reported negative impacts from offshore wind farms, mostly related to birds, marine mammals, and ecosystem structure (Galparsoro et al., 2022). On the other hand, positive effects related to reef effects on fish and macroinvertebrates were less reported (Wilhelmsson et al., 2006; Bergström et al., 2013; Bray et al., 2016; Dannheim et al., 2020; Galparsoro et al., 2022).
Since pile-driving noise has an extremely high sound pressure level, studies on underwater noise have mostly focused on pile-driving noise generated during construction (Reinhall and Dahl, 2011; Dahl et al., 2015; Tsouvalas, 2020; Han and Choi, 2022). On the other hand, the underwater noise generated during wind turbine operation is relatively lower than that generated during pile installation, and thus fewer studies have examined its effects on marine ecosystems (Madsen et al., 2006; Thomsen et al., 2006; Gill et al., 2012; Thomsen et al., 2015; Mooney et al., 2020; Tougaard et al., 2020; Stöber and Thomsen, 2021). However, advances in offshore wind power technology enable the construction of taller wind turbines with larger blades. This can increase the mechanical forces acting on the gears and bearings, which increases underwater noise during operation (Marmo et al., 2013; Mooney et al., 2020; Tougaard et al., 2020; Stöber and Thomsen, 2021). In fact, it has been reported that the operational noise tends to increase in noise level with a nominal power of 13.6 dB/decade (Tougaard et al., 2020).
The operational noise mainly originates from vibrations caused by the movement of the various mechanical parts of a wind-turbine nacelle. The mechanical vibrations, which are generated continuously during turbine operation, are transmitted downward through the tower and radiate into the water (Tougaard et al., 2009; Amaral et al., 2020; Tougaard et al., 2020). It was reported that operational noise consists of tonal components with frequencies lower than 1 kHz, which typically correspond to the gear mesh frequencies of the gearbox and their harmonics (Pangerc et al., 2016; Tougaard et al., 2020). The gear mesh frequency is determined by multiplying the number of teeth by the rotational speed of the gear, and the properties of operational noise depend on the specifications of the gear and the turbine operation parameters.
A few studies have been conducted to quantify operational noise, but only Pangerc et al. (2016) have investigated operational noise over a wide range of operational conditions. In this study, we report the acoustic properties of underwater noise generated by a jacket-type wind turbine during operation based on measurements performed over 10 days at a wind-speed range from 0 to 20 m/s. The measured underwater noise is converted into a power spectral density (PSD) to analyze the frequencies and levels of the peak components relative to the wind speed and rotor speed. In addition, we investigated the correlation between underwater operational noise and the tower vibration acceleration signal of the wind turbine by simultaneously measuring those two signals for an additional 24 hours.
The underwater operational noise from the offshore wind turbine at the Southwest Offshore Wind Farm off the southwest coast of Korea (Figure 1) was measured twice. This wind farm contains 20 3-MW wind turbines: 19 with jacket-type foundations and 1 with a suction-type foundation. Underwater operational noise was first measured from turbine #16, located on the northernmost edge of the wind farm, for about 10 days, from February 24 to March 5, 2021. The bathymetry in the wind farm was relatively flat. The nominal water depth at the measurement site was 12 m, but it was measured to fluctuate up to ±3.6 m due to the tidal difference during the measurement period.
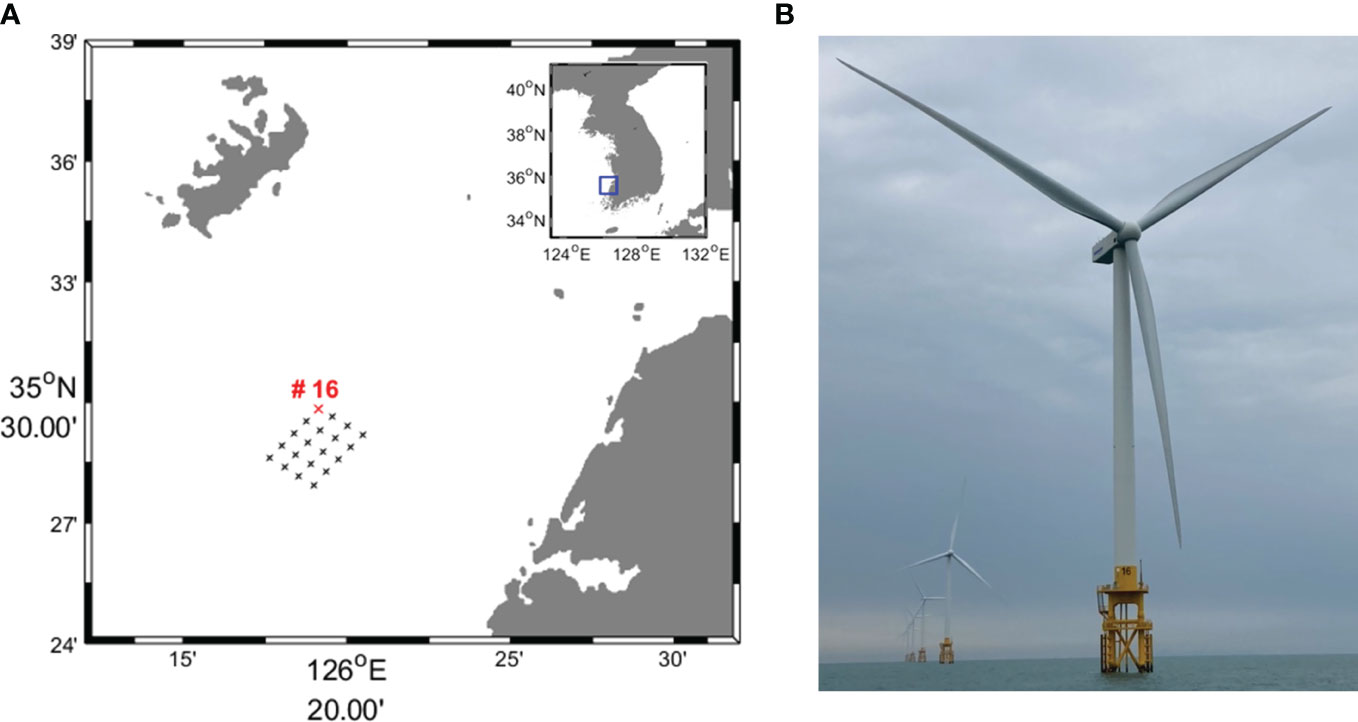
Figure 1 (A) Location of the Southwest Offshore Wind Farm, consisting of 20 offshore wind turbines (cross). The red cross indicates the location of turbine #16. (B) Photograph of wind turbine #16.
Acoustic data were received at a sampling frequency of 96 kHz using a self-recording hydrophone (SM3M, Wildlife Acoustics, USA) that was moored about 4 m above the seabed. The recorder was installed approximately 70 m away from turbine #16 (35° 29′ 53.13″N 126° 19′ 7.80″E) in the north direction of the wind farm where there are no other wind turbines to avoid noise interference from other wind turbines. The receiving voltage sensitivity of the hydrophone (standard, High Tech Inc., USA) was –164.4 5 dB re 1 V/µPa over the frequency band from 2 Hz to 48 kHz. A depth recorder (U20-001-03, Onset, USA) was installed on the hydrophone frame to monitor the deployment depth.
The acoustic data received for about 10 days were divided into time segments of 597 seconds, with a time interval of 3 seconds between each time segment. From each segment, 1,193 PSDs in dB re 1 μPa2/Hz using Welch’s method (Welch, 1967) with 1 second, 50% overlapping, and a Hanning window was calculated. And then the PSDs were intensity-averaged to represent the PSD for 10 minutes. The receiving voltage sensitivity of the hydrophone was then corrected. Among all the intensity-averaged PSDs, those estimated to contain noise other than the operational noise of offshore wind turbine, such as ship noise, were removed. Therefore, 1,095 PSDs were finally used for operational noise analysis. In addition, to investigate the correlation between the pressure level of operational turbine noise and the rotor speed of the wind turbine, the band pressure levels were estimated, which can be obtained by summing the PSDs estimated over the frequency band of interest (Yang et al., 2018). The frequency band of 60 to 500 Hz was selected in our case. A detailed description will be given in section 3.1.
The 10-minute averaged wind speed and rotor speed of the wind turbine during acoustic measurements were obtained from the supervisory control and data acquisition (SCADA) system attached to the wind turbine and provided by the Korea Offshore Wind Power Co., Ltd. The cut-in speed of the wind turbine was 3 m/s, the cut-out speed to protect the wind turbine from damage was 20 m/s, and the rated wind speed was 10 m/s. At or above the rated wind speed, the rotor speed is fixed at 10.7 rpm, producing a nominal maximum power output of 3 MW.
As mentioned in the Introduction, the operational noise is reported to be caused by tower vibration, which was not measured directly from the tower during the first measurement window. Therefore, a second measurement of underwater operational noise was performed along with tower vibration measurement at approximately the same location (35° 29′ 53.08″N 126° 19′ 8.18″E) as the first measurement. The configuration and settings for the acoustic receiver system were the same as for the first measurement. On November 17, 2021, tower vibration was measured for 24 hours, beginning at 14:00 local time, using a vibrometer system, consisting of a miniature triaxial IEPE accelerometer (141A100, YMC Piezotronics Inc, China) and a data acquisition system (DT9837A, Data Translation Inc, USA) that was mounted on the inner wall of the tower. The frequency range of the accelerometer provided by the manufacturer was 0.5 to 5,000 Hz with ±10% accuracy. However, to accommodate the maximum file size, the vibration acceleration signal was digitized at a sampling frequency of 1 kHz and saved in a text file format during the 24-hour vibration data acquisition. The magnitude of the triaxial acceleration signals was calculated as the square root of the sum of the squares of the three-direction components (Vähä-Ypyä et al., 2015) and then was short-time Fourier transformed with 1-second Hamming windows to obtain the spectrogram.
A comparison between wind speed and rotor speed during the first measurement period is shown in Figure 2A. The wind speeds varied between 0.6 and 19.8 m/s over 9 days 5 hours. The wind turbine started operating at the cut-in wind speed (3 m/s) with a rotor speed of about 6.4 rpm. The rotor speed was maintained at ~6.4 rpm until the wind speed increased to about 4.8 m/s. After that, the rotor speed increased as the wind speed increased, but it was fixed at about 10.7 rpm from a wind speed of ~8 m/s, which is 2 m/s lower than the designed rated wind speed. Wind speeds between 3 and 8 m/s correlated highly with rotor speeds between 6.4 and 10.7 rpm, with an r-value of 0.88. The reason for the difference between the designed and measured rated wind speeds might be that the wind speed measured by the SCADA system was lower than the actual wind speed due to disturbance from the blades during turbine operation.
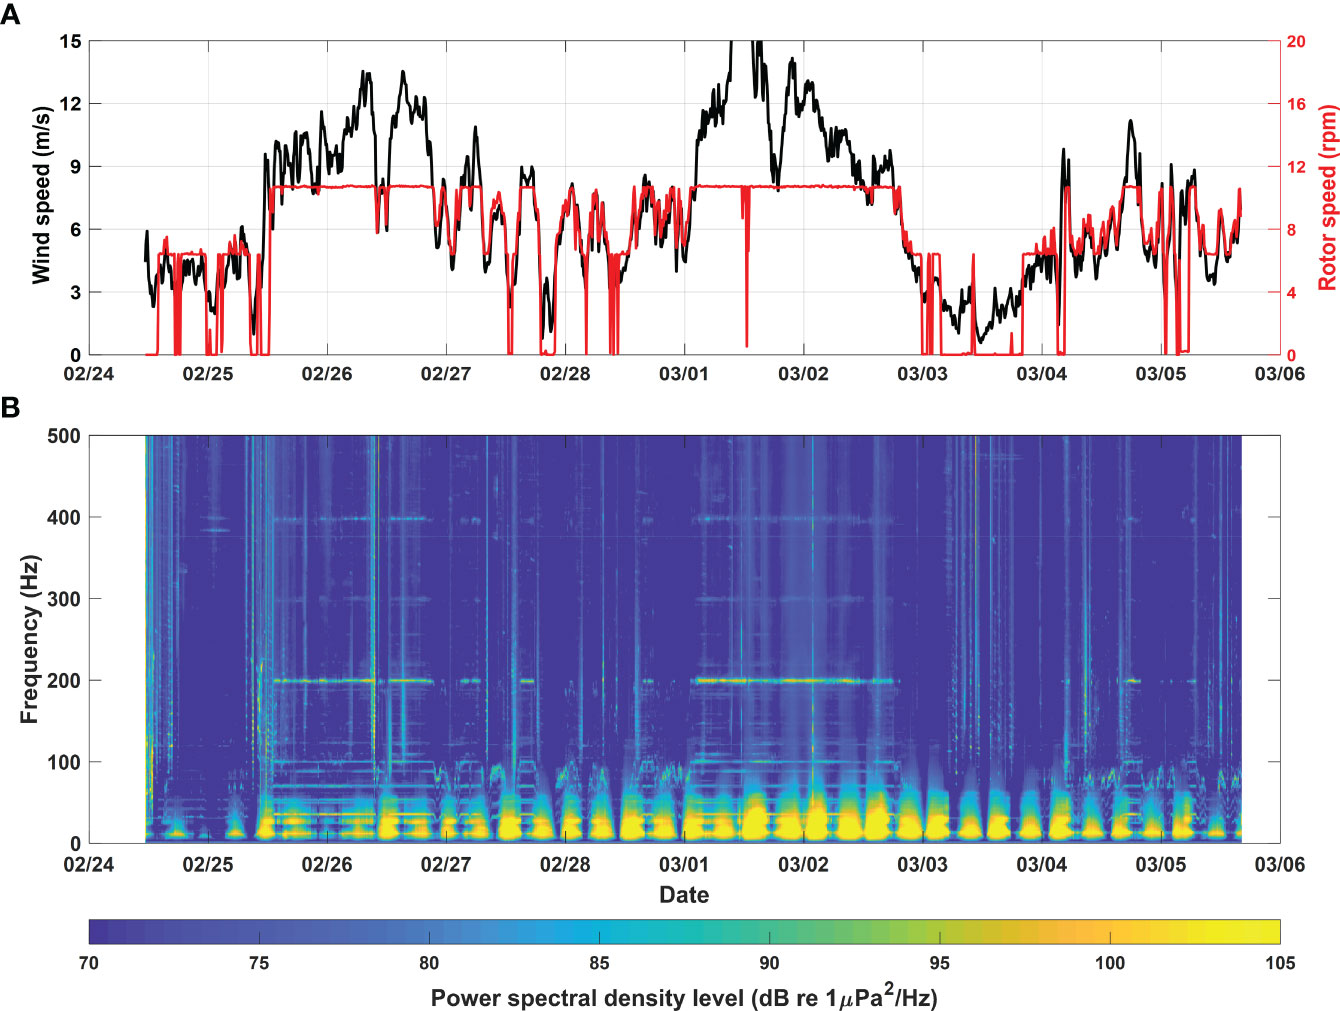
Figure 2 (A) Comparison of wind speed and rotor speed during the first measurement window. (B) Spectrogram of underwater noise measured approximately 70 m from wind turbine #16 over a period of approximately 10 days.
To investigate the correlation between underwater operational noise and wind speed and rotor speed, the intensity-averaged PSD estimated per 10 minutes is assumed to represent the PSD of the 10-minute averaged wind turbine rotor speed during acoustic measurements. Therefore, the 10-minute averaged rotor speed is referred to as simply the rotor speed. Figure 2B shows the spectrogram of underwater noise obtained using the PSDs estimated during the 9 days 5 hours of the first measurement window. Because the dominant tonal components of underwater noise caused by turbine operation occurred mostly at frequencies below 500 Hz, the spectrogram is shown up to 500 Hz. The wind speed and rotor speed at the same time as the spectrogram are shown in Figure 2A. A strong tonal component was observed at a frequency of ~99 Hz, along with its harmonics at 198, 297, and 396 Hz, when the wind speed was higher than the rated wind speed (approximately 8 m/s) and the rotor speed was constant at ~10.7 rpm. Interestingly, the tone at ~198 Hz had the strongest energy. In addition, several tonal components were observed at frequencies below 100 Hz. Those tonal components were observed even below the rated wind speed, varied with time, and showed a high correlation with wind and rotor speed variations. Tonal components caused by operational noise appeared to occur even below 60 Hz, but they were mostly masked by background noise with a semi-diurnal cycle coincident with the tidal variation measured by the depth recorder. The low-frequency noise below ~60 Hz was estimated to be flow noise caused by the tidal current in the region, which is beyond the scope of this paper because it has no correlation with the operational noise.
Figure 3 shows the average PSDs of each of the seven stages divided by 1-rpm intervals over the rotor speed range from 5.5 to 10.5 rpm. These are the averages of PSDs from at least 10 hours at each stage, with about 82 hours at the last stage. The first stage corresponds to rotor speeds below 5.5 rpm, and in most cases, was 0 rpm because the rotor was not running. The second stage contains the rotor speed of 6.4 rpm, which occurred at wind speed ranges from 3 to 4.8 m/s. The seventh stage corresponds to a rotor speed higher than 10.5 rpm. Cases with a rated rotor speed of 10.7 rpm that occurred when the measured wind speed was higher than ~8 m/s are included in the seventh stage. Noteworthy features were observed in the frequency range of ~65 to 100 Hz when the rotor was running. From the third stage, corresponding to a rotor speed between 6.5 and 7.5 rpm, the peak frequency in this frequency band tended to shift from ~70 to 99 Hz as rotor speed increased. Another feature is the strong tone generated at ~198 Hz when the rotor speed reached its rated speed, as shown in Figure 2. The PSD at ~198 Hz showed the highest level (~94.6 dB re 1 μPa2/Hz) in the last stage including the rated rotor speed, but it decreased to ~78.0 dB re 1 μPa2/Hz in the sixth stage, when the rotor speed was between 9.5 and 10.5 rpm. In the subsequent lower stages, the PSD converged to that of the surrounding frequency bands. The strong PSD level at ~198 Hz seems to be the second harmonic component of the tone observed at ~99 Hz, as discussed in Figure 2B. The third and fourth harmonic components were observed at frequencies of ~297 and ~396 Hz, respectively, at the last stage, but their PSD levels were much weaker than that at 198 Hz. These harmonic components are presumed to be the gear mesh frequency of the gearbox and its harmonics, and a detailed discussion will be given in section 4.
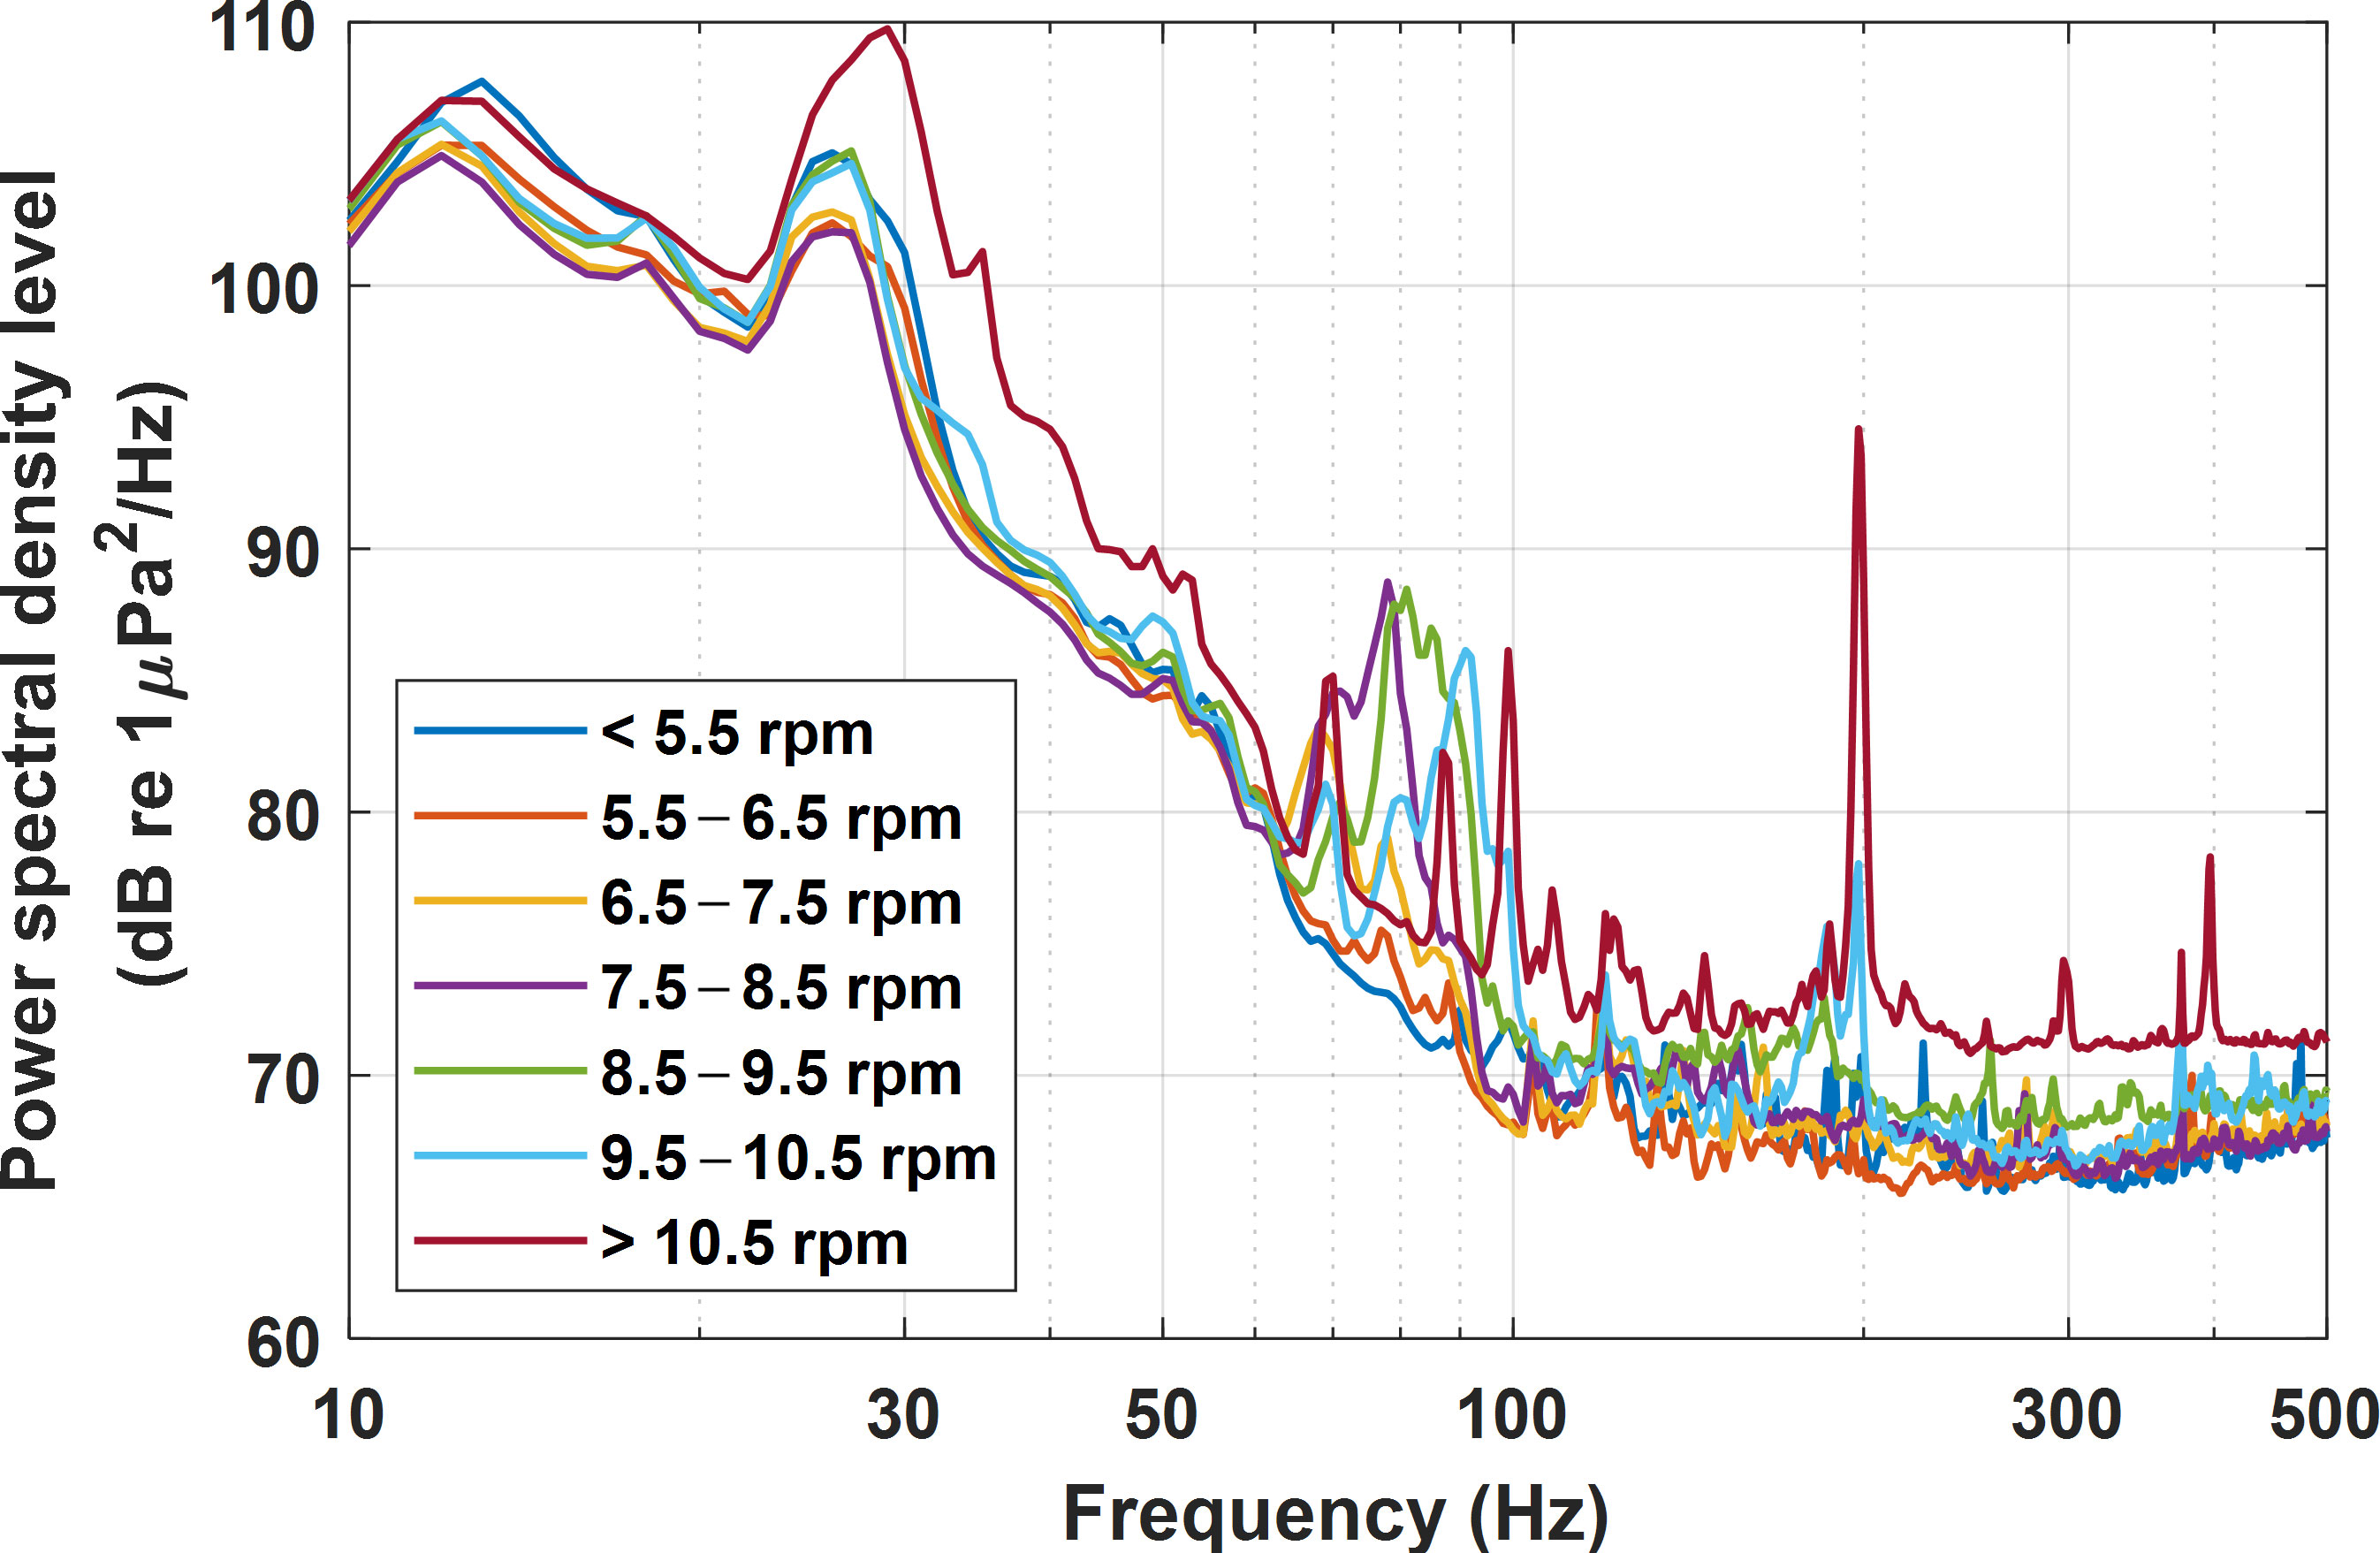
Figure 3 Average power spectral densities in seven stages divided at 1-rpm intervals across the measured rotor-speed range.
We next investigated the correlation between the band pressure level of operational turbine noise and rotor speed to determine the energy change in operational noise with rotor speed. As mentioned above, because the operational noise seems to be masked by strong tidal current noise at frequencies below 60 Hz, we obtained the band pressure level by summing the PSDs in the frequency band of 60 to 500 Hz. Figure 4 shows the band pressure levels as a function of rotor speed. Overall, the band pressure level tends to increase with rotor speed in the range from 6.4 to 10.7 rpm. However, the increase rate shows a large difference around 8 rpm. That is, the pressure level increases with a slope of ~3.1 dB/rpm below ~ 8 rpm but is nearly constant after that. As shown in Figure 3, the main energy of the operational turbine noise was dominated by peaks in the 70−100 Hz frequency range, with a strong tone occurring at ~198 Hz. In addition, the peak level in the 70−100 Hz frequency range increased with rotor speed, but from the fourth stage, which corresponds to the rotor speed range from 7.5 to 8.5 rpm, the peak level did not increase with rotor speed but tended to decrease slightly, shifting only the peak frequency upward. This effect seems to be the cause of the slope difference shown in Figure 4. After reaching the rated rotor speed, the peak frequency no longer increases at ~ 99 Hz. From that point, it and its harmonic components contribute to the energy increase in operational turbine noise.
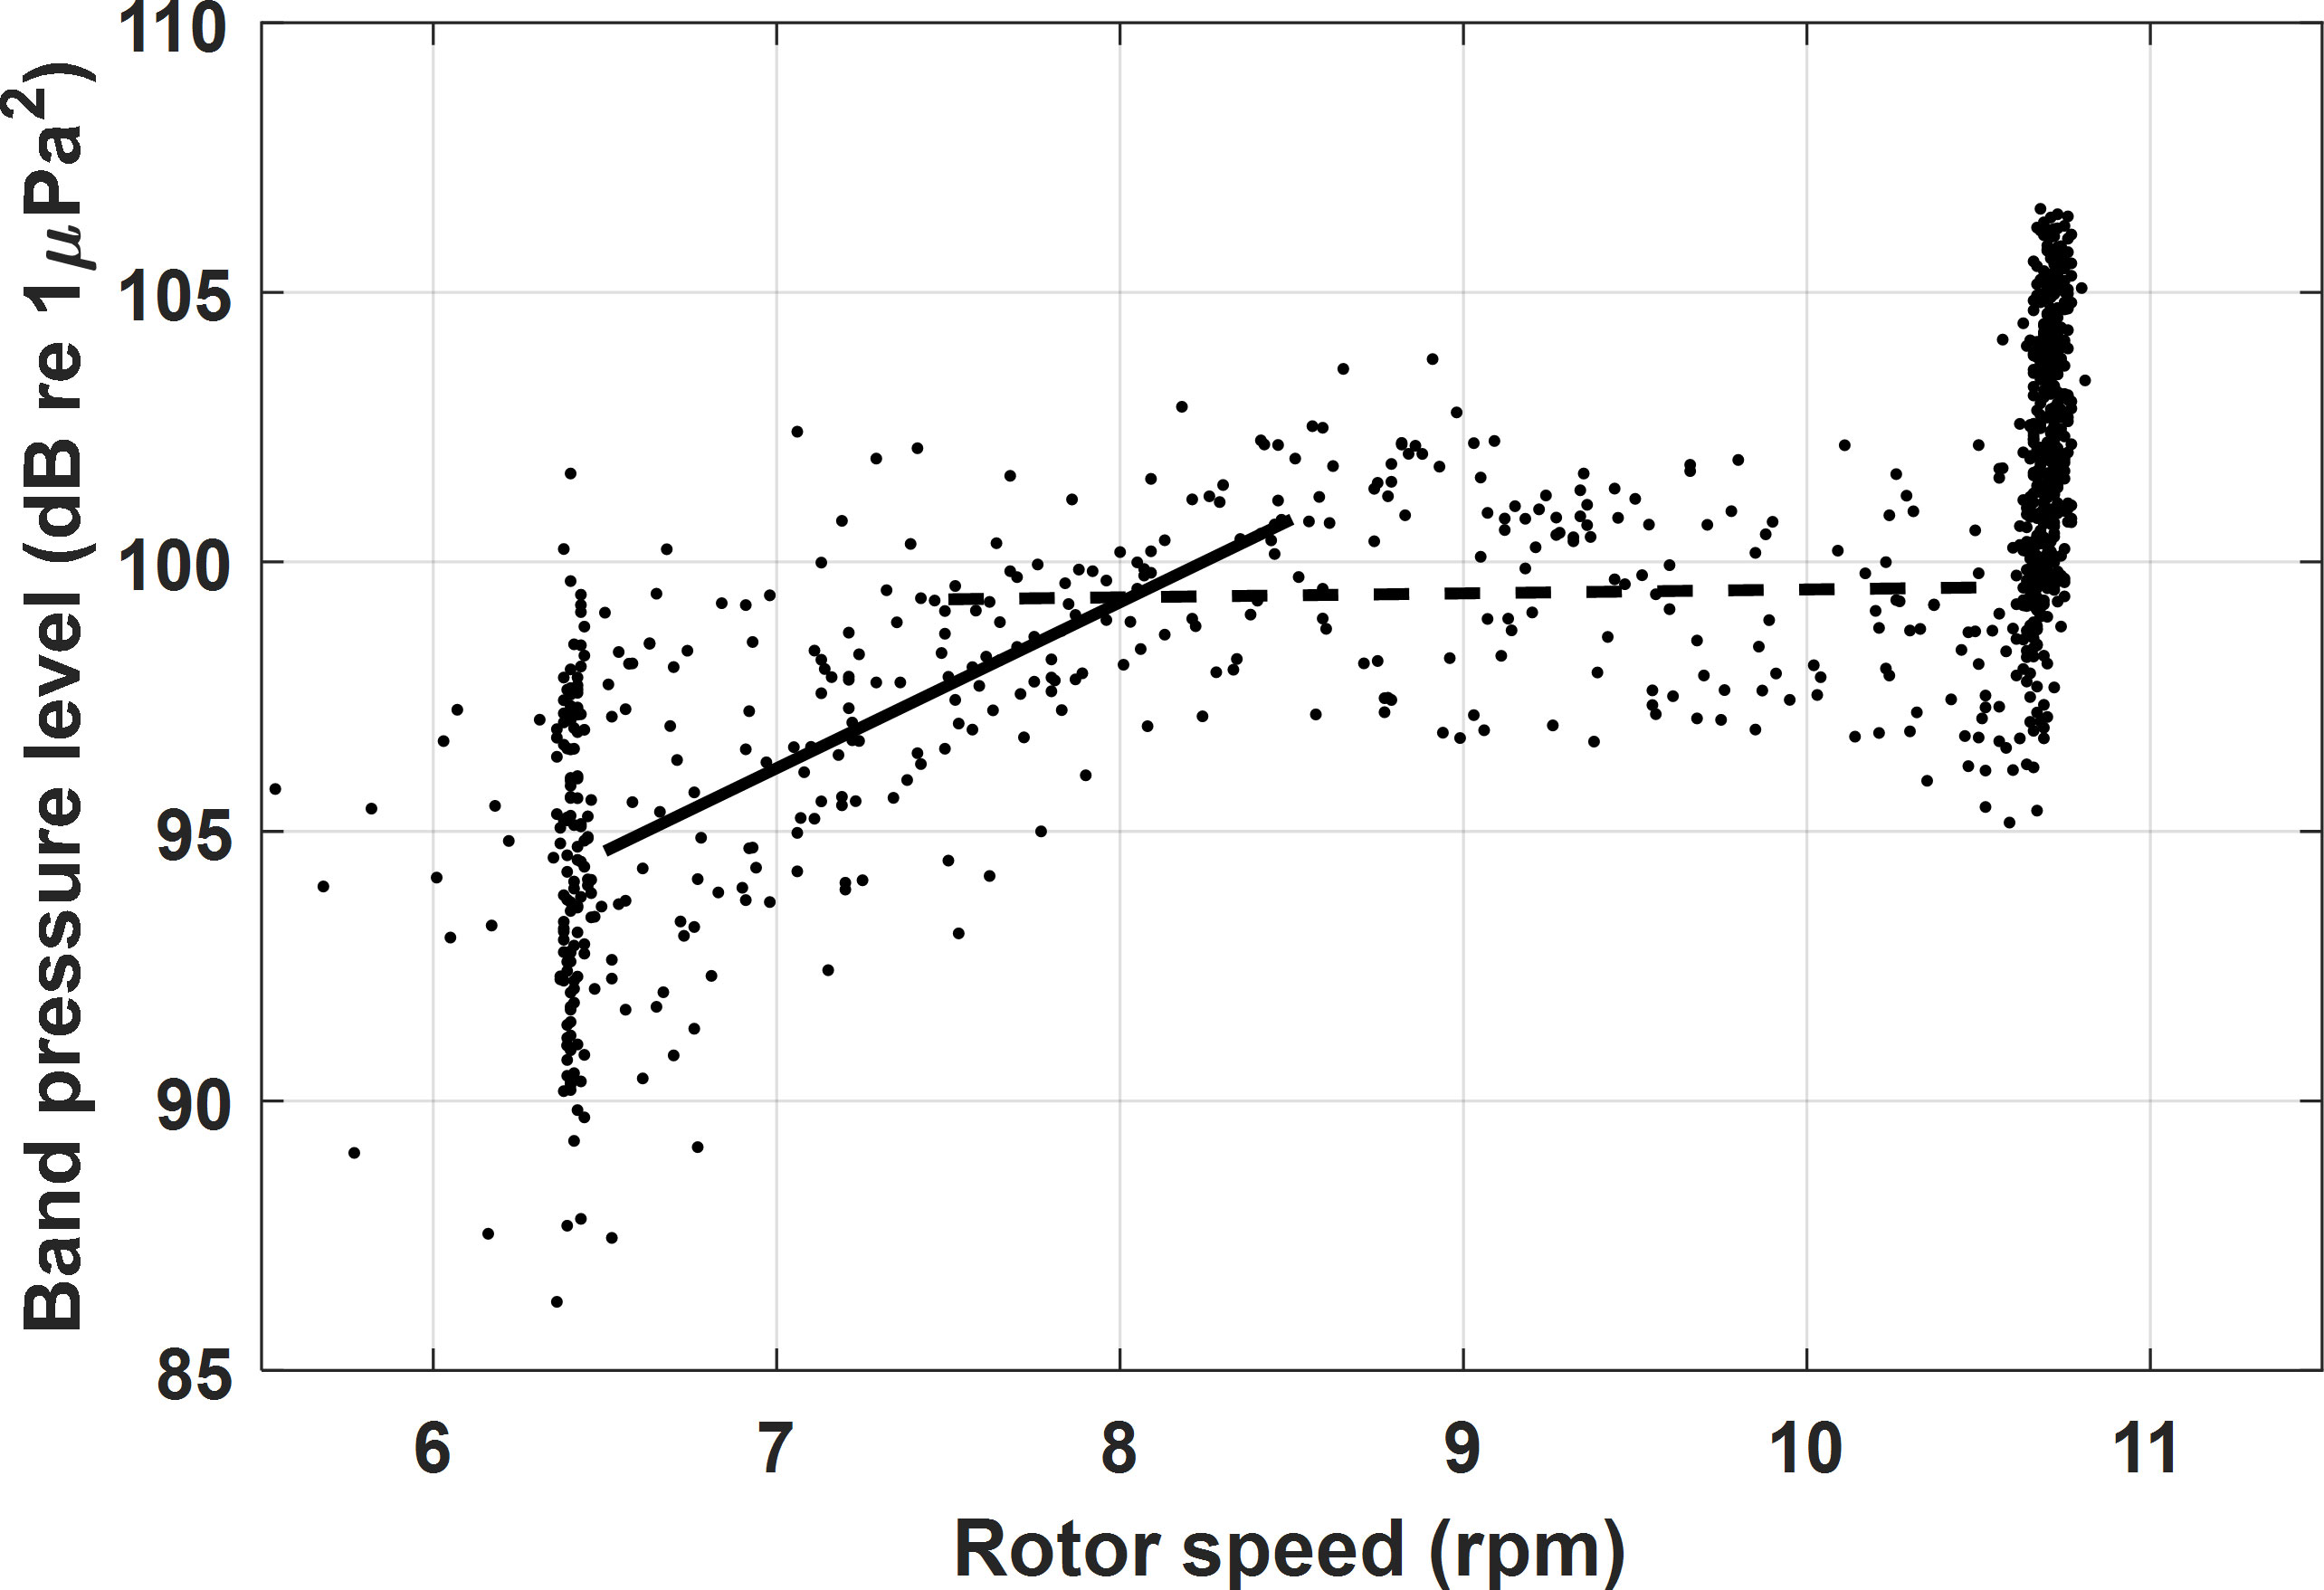
Figure 4 Band pressure levels of underwater operational noise measured during the first measurement window, shown as a function of rotor speed. The band pressure level was obtained by summing the PSDs in the frequency band from 60 to 500 Hz. Solid and dashed lines indicate slopes of ~3.1 and ~0.1 dB/rpm, respectively.
Because we did not measure tower vibration during the first measurement window, a second measurement of underwater operational noise was conducted along with tower vibration measurement for 24 hours. However, in the vibration acceleration signals during those 24 hours, data with a meaningful signal-to-noise level were collected only when the rotor speed was higher than about 8 rpm, which occurred only during the last 6 hours.
The tower vibration of the wind turbine is reported to be caused by various sources, such as the wind loads on the rotor blades and tower, the inertial forces of the rotating parts, the natural frequencies of various components, and the mechanical forces in the power transmission system including the gear meshing process (Escaler and Mebraki, 2018; Awada et al., 2021). Figure 5 shows spectrograms of the underwater operational noise and vibration acceleration signals from the tower for 6 hours, along with the wind and rotor speeds during the same time. The spectral levels of underwater operational noise and tower vibration were intensity-averaged every minute, whereas the wind and rotor speeds in Figure 5 are 10-minute averaged values. Since the flow noise was dominated at frequencies below 60 Hz, the comparison was carried out at frequencies higher than 60 Hz. During the 6-hour measurement period, the wind speed and rotor speed tended to increase in the ranges of 5.7−7.5 m/s and 8.1−10.6 rpm, respectively. Unfortunately, the second measurement window did not contain any conditions above the rated wind speed. Therefore, it was not possible to measure the harmonic characteristics of underwater operational noise generated above the rated rotor speed. Interestingly, the frequencies of the dominant tower vibration acceleration signal and underwater operational noise were both in a range from ~72 to 100 Hz; overall, their frequency shifts correlated highly with each other and with wind speed and rotor speed, all with r-values higher than 0.95. These results imply that underwater noise during turbine operation was caused by tower vibration that was itself caused by rotor operation. The peak frequencies of both signals appear to be associated with the gear mesh frequency of the gearbox, which will be discussed in Section 4.

Figure 5 (A) Comparison of wind speed and rotor speed for 6 hours beginning at 08:00 local time on November 18, 2021. (B, C) Spectrograms of the underwater operational turbine noise and vibration acceleration signals from the wind turbine tower, respectively, measured during the same time.
For the underwater operational noise shown in Figure 5B, the dominant energy occurred around 80 Hz, which corresponds to relatively low rotor speeds, below ~9 rpm, that occurred before about 11:10. Those results are consistent with the results from the first measurement window presented in Figure 3. On the other hand, in the vibration acceleration signals shown in Figure 5C, the highest energy occurred between ~95 and 100 Hz, after 11:30, when the rotor speed was ~10 rpm. The reason for the opposite trend in the magnitude of underwater operational noise and the tower acceleration signal could be the uncertainty of the receiving sensitivity associated with the frequency of the accelerometer.
The purpose of this study was to investigate the properties of underwater operational noise from offshore wind turbines according to wind speed variation as part of a preliminary investigation to evaluate the effects of underwater noise from offshore wind farms on marine ecosystems. All measurements were performed on a 3-MW jacket-type wind turbine in the Southwest Offshore Wind Farm off the southwest coast of Korea. During the measurement period, the wind turbine started operating with a rotor speed of ~6.4 rpm at a cut-in wind speed of 3 m/s, and the rotor speed was kept constant until the wind speed reached ~4.8 m/s. Then, the rotor speed increased linearly with wind speed, with a correlation coefficient r of 0.88, until it was fixed at ~10.7 rpm when the wind speed was ~8 m/s or higher. The wind speed measured by the SCADA system attached to the wind turbine might have been underestimated by ~20% due to disturbances caused by the blades during turbine operation.
Between rotor speeds of 6.4 and 10.7 rpm, which correspond to the cut-in rotor speed and the rated rotor speed, respectively, the frequencies of the dominant peaks below ~ 99 Hz shifted in the positive frequency direction with wind speed and rotor speed. In addition, the band pressure level for the frequency band from 60 to 500 Hz tended to increase with rotor speed. However, the increase rate was very small above a rotor speed of ~8 rpm because the peak level in the 70−100 Hz frequency range did not increase with rotor speed; only the peak frequency shifted upward. On the other hand, when the wind speed was higher than the rated wind speed, the rotor speed was held constant at ~10.7 rpm. In that case, multiple tones were observed in the PSD. A strong tonal component at ~ 99 Hz and its harmonics especially contributed to the increased energy of operational turbine noise. In the second window, we measured the underwater noise and tower vibration of the wind turbine simultaneously for wind conditions below the rated wind speed. The frequencies of the dominant tower vibration acceleration signal and underwater operational noise both varied within the range from ~72 to 100 Hz, and their frequency shifts were highly correlated with each other and with wind speed and rotor speed.
The acoustic properties of underwater operational noise correlated highly with wind speed, rotor speed, and tower vibration. However, it was difficult to investigate underwater noise at frequencies below 60 Hz because it was masked by flow noise from tidal currents. Figure 6A shows a spectrogram for the period from 18:00 on February 28 to 09:00 on March 1, obtained using 1-minute intensity-averaged PDSs. During that period, the wind speed varied from ~4.0 to 13.5 m/s. Consequently, the rotor speed changed from ~6.8 to 10.7 rpm; after 01:10 on March 1, the rotor was maintained at the rated speed of 10.7 rpm. Two periods with minimal flow noise and different wind speeds were selected for this investigation: 23:14 on February 28 and 04:44 on March 1, which are indicated by arrows T1 and T2, respectively, in Figure 6A. The rotor speed around T1 was less than the rated rotor speed, and that around T2 was the rated rotor speed. Interestingly, several tonal components can be observed at frequencies below 60 Hz during those two times.
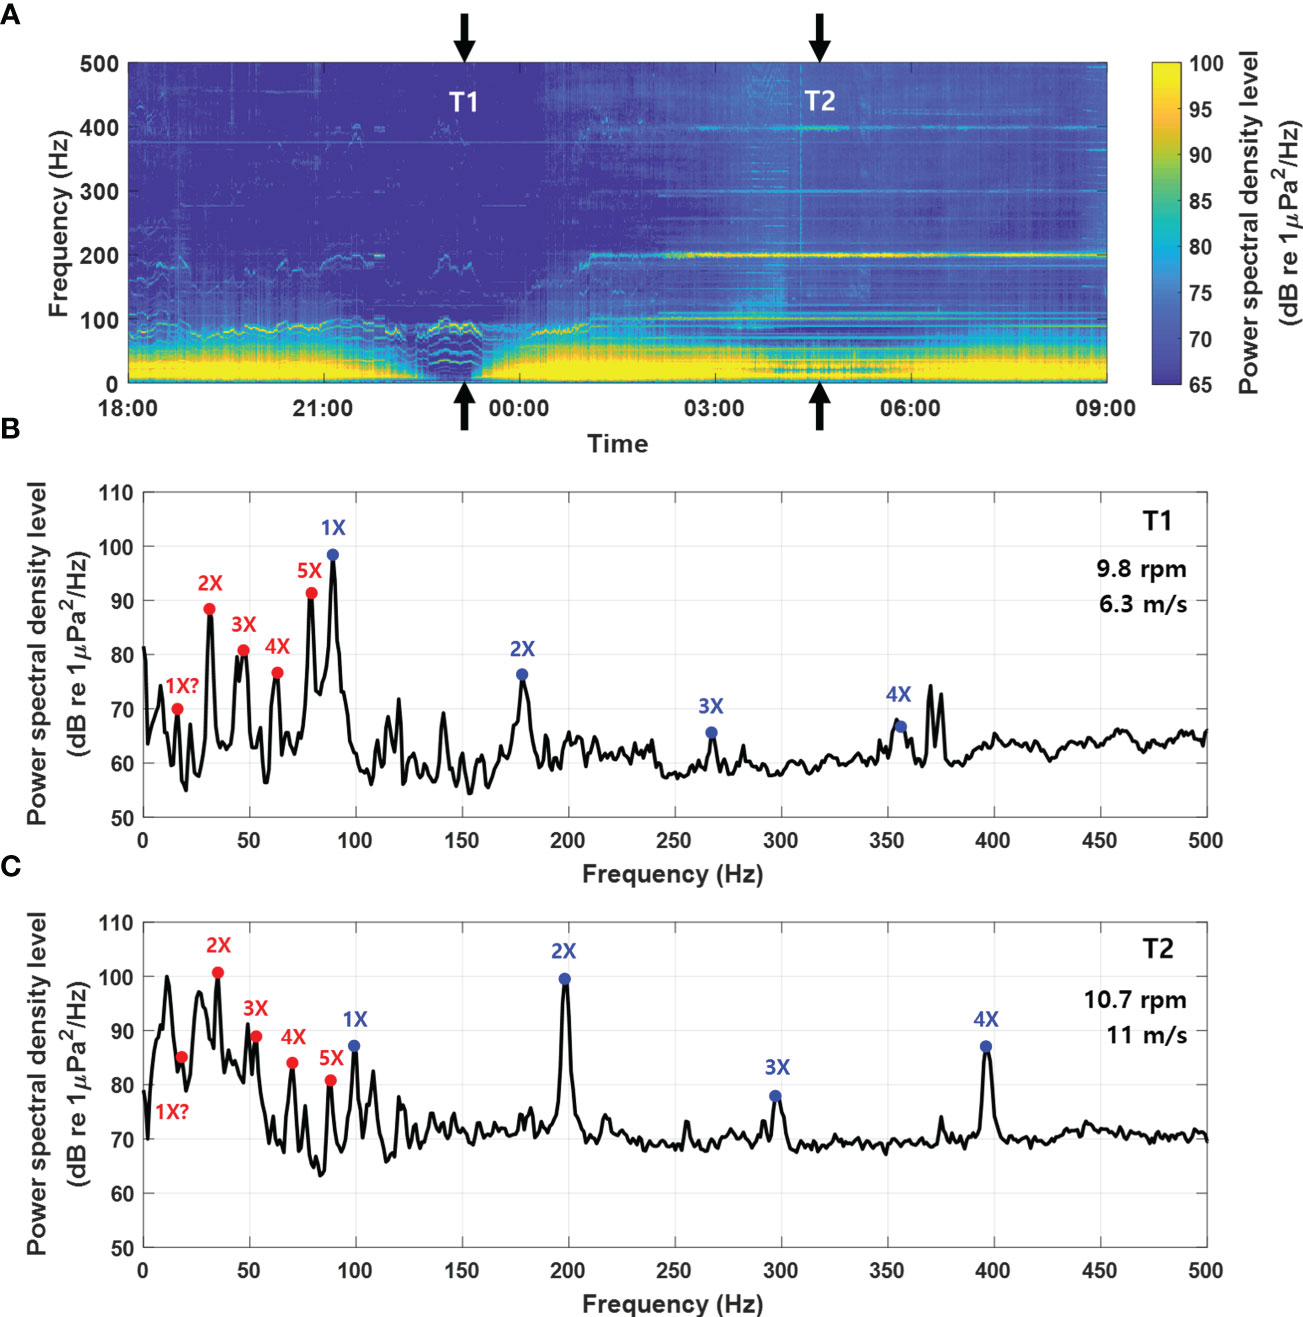
Figure 6 (A) Spectrogram for the 15 hours between 18:00 on February 28 and 09:00 on March 1, 2021. (B) PSD for underwater operational noise measured at T1, when the wind and rotor speeds were 6.3 m/s and 9.8 rpm, respectively. (C) PSD at T2, when the wind and rotor speeds were 11.0 m/s and 10.7 rpm, respectively. The red and blue dots indicate two gear mesh frequencies and their harmonics.
Figure 6B shows the PSD for the underwater noise measured at T1, when the wind and rotor speeds were 6.3 m/s and 9.8 rpm, respectively. Two harmonic components were observed. One component has a first peak frequency of 89 Hz, and its first harmonic is observed at 178 Hz, marked with a blue 1X and 2X, respectively, in Figure 6B. The second and third harmonics could then be expected to exist at 267 and 356 Hz, respectively; relatively weak harmonic components were observed around 267 and 356 Hz, marked with 3X and 4X, respectively, in the spectrogram. These are followed by two relatively strong peaks at 370 and 375 Hz that represent an unknown noise that appears to be system noise. As mentioned in the Introduction, the gear mesh frequency is determined by multiplying the number of teeth on the gear by the shaft rotational speed. From this observation, the number of teeth on the corresponding gear is estimated to be approximately 545. The first peak of the second harmonic, marked with a red 2X in Figure 6B, was observed at about 32 Hz. However, the subsequent three peaks were observed at a frequency interval of about 16 Hz. Because harmonic components exist at multiples of the first peak frequency, a 16-Hz interval would indicate that the first peak exists at 16 Hz and not 32 Hz. In fact, a relatively small peak, marked with a red 1X in the spectrogram, does exist at ~16 Hz. The number of teeth on another gear can then be estimated to be about 98.
The spectrogram at the rated rotor speed of 10.7 rpm is shown in Figure 6C, which corresponds to T2. As reported above, the first peak of the harmonics at the rated rotor speed occurred at 99 Hz, which is marked with a blue 1X, and its three harmonics were observed at frequencies that are multiples of 99 Hz. In this case, the number of gear teeth was estimated to be about 555, which is a difference of 10 from the 545 estimated when the rotor speed was 9.8 rpm. At T2, the dominant peak at the lowest frequency was observed at 35 Hz, which is marked with a red 2X in Figure 6C. Among the peaks distributed between this peak and that at 99 Hz were three harmonic components with a frequency interval of ~18 Hz. The first peak frequency can then be estimated to be 18 Hz using the same method described above. A weak peak might be present at 18 Hz on the spectrogram, but it is difficult to accurately identify. The number of gear teeth would be estimated to be about 101 using 18 Hz as the gear mesh frequency and a rotor speed of 10.7 rpm. For the two cases shown here, the number of gear teeth estimated using the rotor speeds and gear mesh frequencies differed slightly. That difference might be caused by discrepancies between the actual instantaneous rotor speeds and our calculations because the rotor speeds used here were values averaged over 10 minutes. Unfortunately, the manufacturer did not provide the exact specification of the gearbox, including number of teeth.
The underwater operational noise of a wind turbine was measured over wide ranges of wind speeds and rotor speeds, and its acoustic properties have been presented in this paper. However, the results of this paper are limited to underwater noise generated by a 3-MW jacket-type wind turbine in a specific area off the southwest coast of Korea. Further studies are needed to characterize the properties of underwater operational noise generated by wind turbines of other types and sizes and to determine how it is spatially distributed in regions with different geoacoustic properties.
The original contributions presented in the study are included in the article/supplementary material. Further inquiries can be directed to the corresponding author.
YY, D-GH, and JC contributed to conception and design of the study. YY performed data collection and analysis. YY and D-GH wrote the primary writing. JC contributed to the supervision and validation of the measurement. All authors contributed to manuscript revision, read, and approved the submitted version.
This work was partly supported by Korea Institute of Energy Technology Evaluation and Planning (KETEP) grant funded by the Korea government (MOTIE) (20203030020080, Environmental Impact Analysis on the Offshore Wind Farm and Database System Development) and National Research Foundation of Korea (NRF) grant funded by the Korea government (MSIT) (2020R1A2C2007772).
Author Dong-Gyun Han has founded Oceansounds Inc. since submitting this manuscript.
The remaining authors declare that the research was conducted in the absence of any commercial or financial relationships that could beconstrued as a potential conflict of interest.
All claims expressed in this article are solely those of the authors and do not necessarily represent those of their affiliated organizations, or those of the publisher, the editors and the reviewers. Any product that may be evaluated in this article, or claim that may be made by its manufacturer, is not guaranteed or endorsed by the publisher.
Amaral J. L., Vigness-Raposa K., Miller J. H., Potty G. R., Newhall A., Lin Y.-T. (2020). The underwater sound from offshore wind farms. Acoust. Today 16, 13–21. doi: 10.1121/at.2020.16.2.13
Awada A., Younes R., Ilinca A. (2021). Review of vibration control methods for wind turbines. Energies 14 (11), 3058. doi: 10.3390/en14113058
Bergström L., Sundqvist F., Bergström U. (2013). Effects of an offshore wind farm on temporal and spatial patterns in the demersal fish community. Mar. Ecol. Prog. Ser. 485, 199–210. doi: 10.3354/meps10344
Bilgili M., Yasar A., Simsek E. (2011). Offshore wind power development in Europe and its comparison with onshore counterpart. Renew. Sustain. Energy Rev. 15, 905–915. doi: 10.1016/j.rser.2010.11.006
Bray L., Reizopoulou S., Voukouvalas E., Soukissian T., Alomar C., Vázquez-Luis M., et al. (2016). Expected effects of offshore wind farms on Mediterranean marine life. J. Mar. Sci. Eng. 4, 18. doi: 10.3390/jmse4010018
Cranmer A., Baker E. (2020). The global climate value of offshore wind energy. Environ. Res. Lett. 15, 054003. doi: 10.1088/1748-9326/ab7667
Dahl P. H., de Jong C. A. F., Popper A. N. (2015). The underwater sound field from impact pile driving and its potential effects on marine life. Acoust. Today 11, 18–25.
Dannheim J., Bergström L., Birchenough S. N. R., Brzana R., Boon A. R., Coolen J. W. P., et al. (2020). Benthic effects of offshore renewables: identification of knowledge gaps and urgently needed research. ICES J. Mar. Sci. 77, 1092–1108. doi: 10.1093/icesjms/fsz018
Escaler X., Mebraki T. (2018). Full-scale wind turbine vibration signature analysis. Machines 6, 63. doi: 10.3390/machines6040063
Galparsoro I., Menchaca I., Garmendia J. M., Borja Á., Maldonado A. D., Iglesias G., et al. (2022). Reviewing the ecological impacts of offshore wind farms. NPJ Ocean Sustainability 1, 1. doi: 10.1038/s44183-022-00003-5
Gill A. B., Bartlett M., Thomsen F. (2012). Potential interactions between diadromous fishes of U.K. conservation importance and electromagnetic fields and subsea noise from marine renewable energy developments. J. Fish Biol. 81 (2), 664–695. doi: 10.1111/j.1095-8649.2012.03374.x.
Hall R., João E., Knapp C. W. (2020). Environmental impacts of decommissioning: onshore versus offshore wind farms. Environ. Impact Assess Rev. 83, 106404. doi: 10.1016/j.eiar.2020.106404
Han D. G., Choi J. W. (2022). Measurements and spatial distribution simulation of impact pile driving underwater noise generated during the construction of offshore wind power plant off the southwest coast of Korea. Front. Mar. Sci. 8, 1978. doi: 10.3389/fmars.2021.654991
Kastelein R. A., Jennings N., Kommeren A., Helder-Hoek L., Schop J. (2017). Acoustic dose-behavioral response relationship in sea bass (Dicentrarchus labrax) exposed to playbacks of pile driving sounds. Mar. Environ. Res. 130, 315–324. doi: 10.1016/j.marenvres.2017.08.010
Madsen P. T., Wahlberg M., Tougaard J., Lucke K., Tyack P. (2006). Wind turbine underwater noise and marine mammals: implications of current knowledge and data needs. Mar. Ecol. Prog. Ser. 309, 279–295. doi: 10.3354/meps309279
Marmo B., Roberts I., Buckingham M. P., King S., Booth C. (2013). Modelling of noise effects of operational offshore wind turbines including noise transmission through various foundation types. Scot. Mar. Freshw. Sci. 4, 100. doi: 10.7489/1521-1.
Mooney T. A., Andersson M. H., Stanley J. (2020). Acoustic impacts of offshore wind energy on fishery resources: an evolving source and varied effects across a wind farm’s lifetime. Oceanography 33, 82–95. doi: 10.5670/oceanog.2020.408
Oh K. Y., Kim J. Y., Lee J. K., Ryu M. S., Lee J. S. (2012). An assessment of wind energy potential at the demonstration offshore wind farm in Korea. Energy 46, 555–563. doi: 10.1016/j.energy.2012.07.056
Pangerc T., Theobald P. D., Wang L. S., Robinson S. P., Lepper P. A. (2016). Measurement and characterisation of radiated underwater sound from a 3.6 MW monopile wind turbine. J. Acoust. Soc Am. 140, 2913–2922. doi: 10.1121/1.4964824
Popper A. N., Hice-Dunton L., Jenkins E., Higgs D. M., Krebs J., Mooney T. A., et al. (2022). Offshore wind energy development: research priorities for sound and vibration effects on fishes and aquatic invertebrates. J. Acoust. Soc Am. 151, 205–215. doi: 10.1121/10.0009237
Reinhall P. G., Dahl P. H. (2011). Underwater mach wave radiation from impact pile driving: theory and observation. J. Acoust. Soc Am. 130, 1209–1216. doi: 10.1121/1.3614540
Stöber U., Thomsen F. (2021). How could operational underwater sound from future offshore wind turbines impact marine life? J. Acoust. Soc Am. 149, 1791–1795. doi: 10.1121/10.0003760
Thomsen F., Gill A., Kosecka M., Andersson M., Andre M., Degraer S., et al. (2015). MaRVEN–environmental impacts of noise, vibrations and electromagnetic emissions from marine renewable energy. Final Study Report No. RTD-KI-NA-27-738-EN-N.
Thomsen F., Ludemann K., Kafemann R., Piper W. (2006). Effects of offshore wind farm noise on marine mammals and fish. Biola Hamburg: Germany behalf COWRIE Ltd 62, 1–62.
Tougaard J., Henriksen O. D., Miller L. A. (2009). Underwater noise from three types of offshore wind turbines: estimation of impact zones for harbor porpoises and harbor seals. J. Acoust. Soc Am. 125, 3766–3773. doi: 10.1121/1.3117444
Tougaard J., Hermannsen L., Madsen P. T. (2020). How loud is the underwater noise from operating offshore wind turbines? J. Acoust. Soc Am. 148, 2885–2893. doi: 10.1121/10.0002453
Tsouvalas A. (2020). Underwater noise emission due to offshore pile installation: a review. Energies 13, 3037. doi: 10.3390/en13123037
Vähä-Ypyä H., Vasankari T., Husu P., Mänttäri A., Vuorimaa T., Suni J., et al. (2015). Validation of cut-points for evaluating the intensity of physical activity with accelerometry-based mean amplitude deviation (MAD). PloS One 10 (8), e0134813. doi: 10.1371/journal.pone.0134813
Vaissière A. C., Levrel H., Pioch S., Carlier A. (2014). Biodiversity offsets for offshore wind farm projects: the current situation in Europe. Mar. Policy 48, 172–183. doi: 10.1016/j.marpol.2014.03.023
Welch P. D. (1967). The use of fast Fourier transform for the estimation of power spectra: a method based on time averaging over short, modified periodograms. Audio Electroacous IEEE Trans. 15, 70–73. doi: 10.1109/TAU.1967.1161901
Wilhelmsson D., Malm T., Öhman M. C. (2006). The influence of offshore windpower on demersal fish. ICES J. Mar. Sci. 63, 775–784. doi: 10.1016/j.icesjms.2006.02.001
Keywords: offshore wind turbine, underwater noise, operational noise, tower vibration, wind speed, rotor speed, acoustic characteristics
Citation: Yoon YG, Han D-G and Choi JW (2023) Measurements of underwater operational noise caused by offshore wind turbine off the southwest coast of Korea. Front. Mar. Sci. 10:1153843. doi: 10.3389/fmars.2023.1153843
Received: 30 January 2023; Accepted: 22 June 2023;
Published: 14 July 2023.
Edited by:
Apostolos Tsouvalas, Delft University of Technology, NetherlandsReviewed by:
Giuseppa Buscaino, National Research Council (CNR), ItalyCopyright © 2023 Yoon, Han and Choi. This is an open-access article distributed under the terms of the Creative Commons Attribution License (CC BY). The use, distribution or reproduction in other forums is permitted, provided the original author(s) and the copyright owner(s) are credited and that the original publication in this journal is cited, in accordance with accepted academic practice. No use, distribution or reproduction is permitted which does not comply with these terms.
*Correspondence: Jee Woong Choi, Y2hvaWp3QGhhbnlhbmcuYWMua3I=
†Present address: Dong-Gyun Han, Oceansounds Inc., Ansan, Republic of Korea
Disclaimer: All claims expressed in this article are solely those of the authors and do not necessarily represent those of their affiliated organizations, or those of the publisher, the editors and the reviewers. Any product that may be evaluated in this article or claim that may be made by its manufacturer is not guaranteed or endorsed by the publisher.
Research integrity at Frontiers
Learn more about the work of our research integrity team to safeguard the quality of each article we publish.