 Bror F. Jönsson
 Gemma Kulk
 Shubha Sathyendranath
- 1Earth Observation Science & Applications, Plymouth Marine Laboratory, Plymouth, United Kingdom
- 2National Centre for Earth Observation, Plymouth Marine Laboratory, Plymouth, United Kingdom
Whereas the vertical transport of biomass from productive surface waters to the deep ocean (the biological pump) is a critical component of the global carbon cycle, its magnitude and variability is poorly understood. Global-scale estimates of ocean carbon export vary widely, ranging from ∼5 to ∼20 Gt C y – 1 due to uncertainties in methods and unclear definitions. Satellite-derived properties such as phytoplankton biomass, sea surface temperature, and light attenuation at depth provide information about the oceanic ecosystem with unprecedented coverage and resolution in time and space. These products have been the basis of an intense effort over several decades to constrain different biogeochemical production rates and fluxes in the ocean. One critical challenge in this effort has been to estimate the magnitude of the biological pump from satellite-derived properties by establishing how much of the primary production is exported out of the euphotic zone, a flux that is called export production. Here we present a review of existing algorithms for estimating export production from satellite-derived properties, available in-situ datasets that can be used for testing the algorithms, and earlier evaluations of the proposed algorithms. The satellite-derived products used in the algorithm evaluation are all based largely on the Ocean Colour Climate Change Initiative (OC-CCI) products, and carbon products derived from them. The different resources are combined in a meta-analysis.
1 Introduction
The recirculation of major nutrients and carbon in the ocean is strongly controlled by the vertical export of particulate organic matter from the surface ocean to the ocean’s interior (Figure 1 and e.g. Falkowski et al., 1998; Sabine et al., 2004; Honjo et al., 2008; Siegel et al., 2022). Marine phytoplankton transform CO2 to organic carbon via photosynthesis with light as the energy source (Eppley, 1972; Geider et al., 1998), a critical biological process that is the foundation of most marine ecosystems (Sarmiento and Bender, 1994; Pauly and Christensen, 1995). The resulting chemical energy bound as organic carbon is used in marine food webs to build other types of biomass and as energy for autotrophic and heterotrophic organisms. While the carbon fixation by phytoplankton (or Primary Production, PP) in marine ecosystems is of vital significance (e.g. Platt et al., 1989; Pauly and Christensen, 1995; Fasham, 2003; Marinov et al., 2008; Chavez et al., 2011), there has been a longstanding debate about how to quantify its magnitude (Platt et al., 1989; Quay and Karl, 2010; Duarte et al., 2013; Williams et al., 2013). Methods to observe or infer different components of primary production have been developed (Bender et al., 1987; Cullen, 2001; Fasham, 2003) that are valid over varying spatial and temporal domains (Balch et al., 2022), and there are significant differences in how different researchers define biological production (Williams, 1993; Cullen, 2001). Most of the biomass generated by PP in the euphotic (sunlit) zone is consumed by heterotrophs and remineralized in the upper ocean. The remaining part is called Net Community Production (NCP) and if aggregated over sufficiently large temporal and spatial scales, they equate to Export Production (EP). Organic carbon resulting from EP is transported to deeper waters by, among other pathways, the downward vertical flux of Particulate or Dissolved Organic Carbon (POC, DOC), often referred to as the “biological pump” (BCP, Volk and Hoffert, 1985). See Siegel et al. (2022) for an exhaustive discussion about the Biological Carbon Pump (BCP) and other processes that sequester carbon from the surface ocean to deeper waters. As with PP, the understanding of the magnitude and spatiotemporal variability of the biological pump remains limited (Burd et al., 2010; Britten and Primeau, 2016).
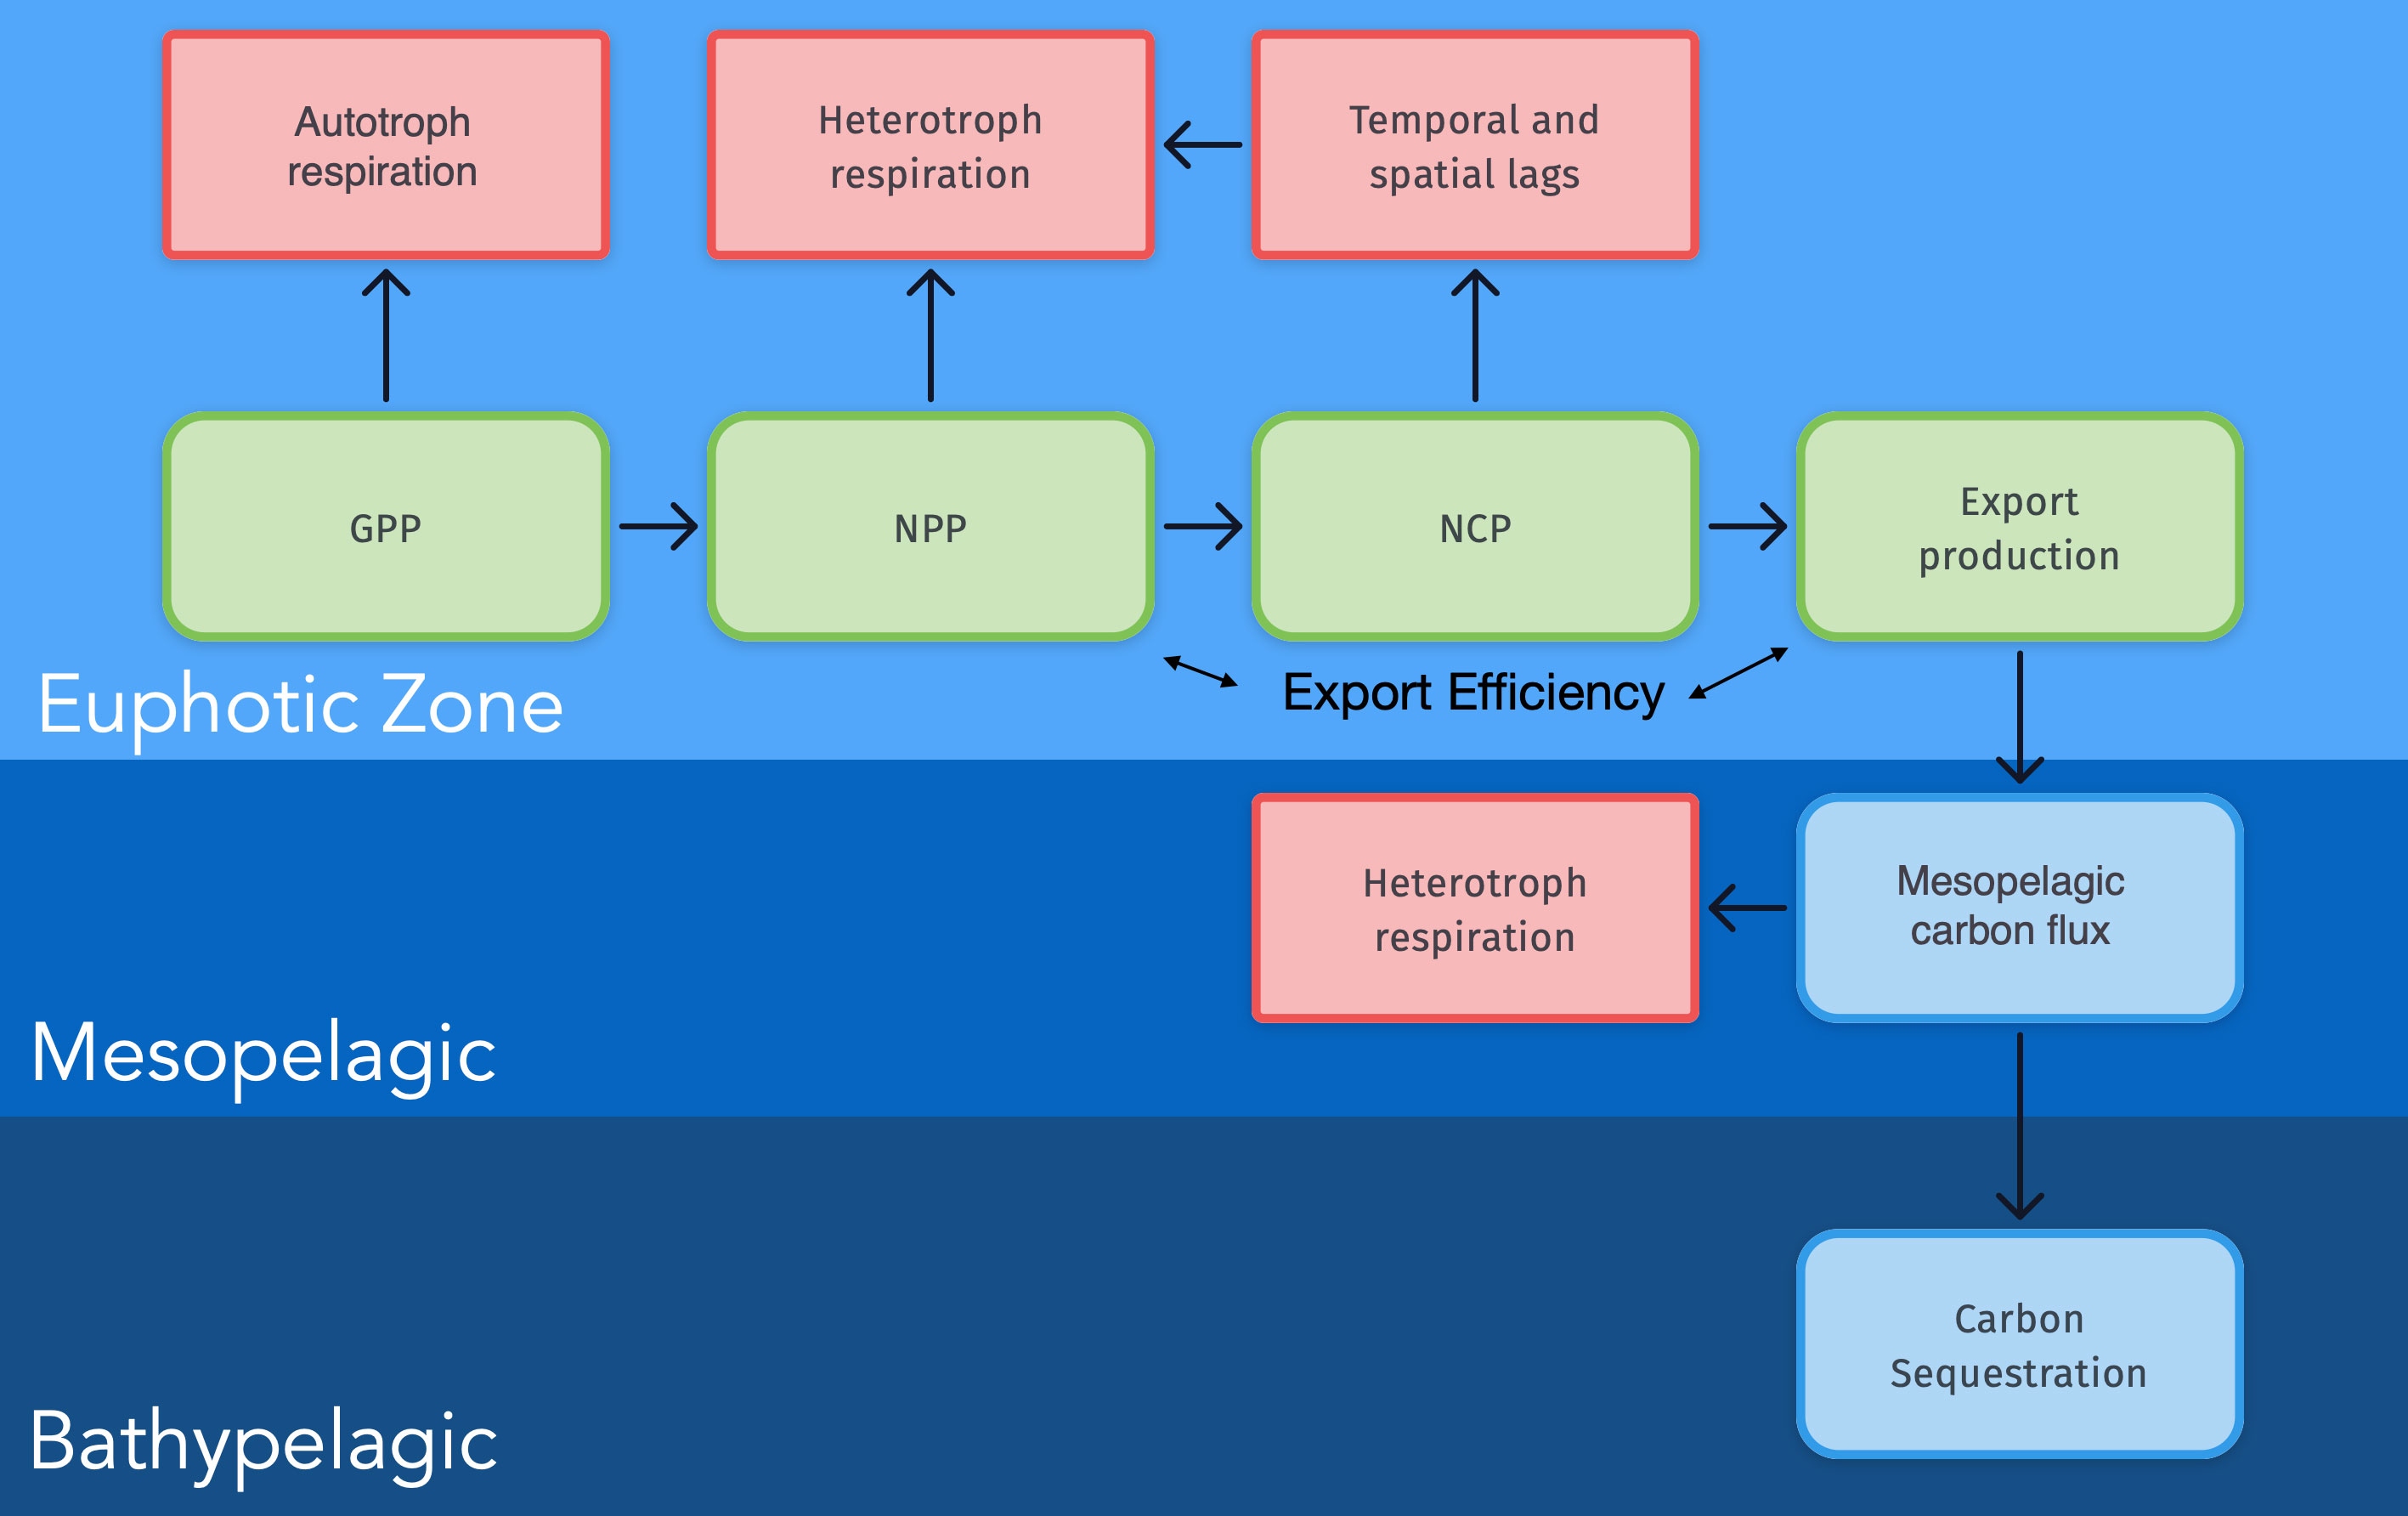
Figure 1 Conceptual model of the relationships between different terms describing carbon fluxes in the Ocean. Each term is defined in the text and Table 1.
Satellite-based ocean color products have provided an unprecedented resource to study ocean biogeochemistry and biological oceanography with high spatiotemporal resolution and coverage (Groom et al., 2019; McClain et al., 2022) and significant effort has been allocated to also assess the biological pump from space with limited success (Siegel et al., 2022). One critical challenge has been to quantify community respiration (Westberry et al., 2012) and to establish the ratio of PP that is exported out from the euphotic zone (Britten and Primeau, 2016; Siegel et al., 2016; Siegel et al., 2022). The large uncertainties associated with satellite-based EP products has led to global-scale estimates of ocean carbon export that vary from ∼ 5 to 20 Gt C y– 1 (Dunne et al., 2007; Henson et al., 2011; Laws et al., 2011; Siegel et al., 2016; Siegel et al., 2022).
1.1 Fluxes and relationships
The main approach to estimate EP from remotely sensed products is based on empirical correlations identified from regression analysis of in-situ observations of vertical POC fluxes in combination with properties that can be derived from satellite (e.g. Stukel et al., 2015). This method has so far generated algorithms with arguably limited ability to predict EP (e.g. Stukel et al., 2015; Palevsky et al., 2016). The many challenges to estimate export fluxes from satellite-derived properties are further complicated by differences and inconsistencies in how EP and export fluxes are defined and quantified. We will describe the most common definitions in the following sections and summarize them in Table 1.
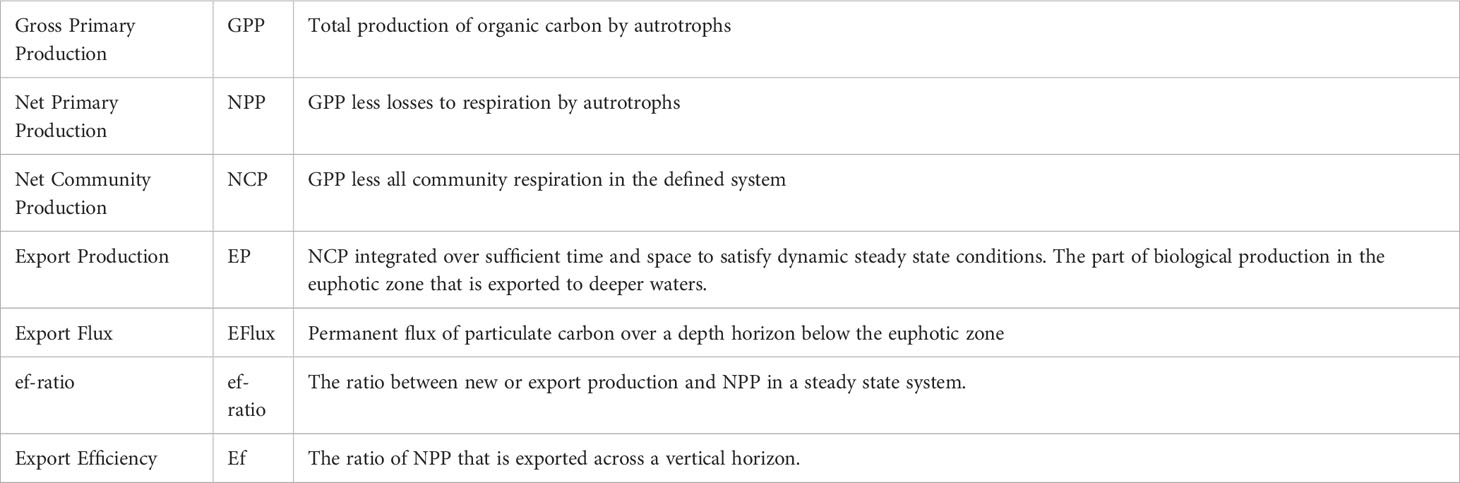
Table 1 Different terms associated with Biological Production that are relevant for algorithm development.
1.1.1 Gross primary production
GPP is the total rate of carbon production by autotrophic organisms before correction for losses due to excretion or respiration, or in other words the gross conversion of inorganic carbon to its organic state (Cullen, 2001; Fasham, 2003) by autotrophs. GPP can in theory be derived from first principles (e.g. Lawrenz et al., 2013, and references).
1.1.2 Net primary production
NPP is the net rate at which autotrophic organisms assimilate carbon. This is normally defined as GPP minus the fraction used by primary producers for cellular respiration and maintenance. (Bender et al., 1987; Platt et al., 1989; Williams, 1993; Behrenfeld and Falkowski, 1997; Cullen, 2001; Fasham, 2003). NPP is also the portion of carbon fixation from photosynthesis that is available to heterotrophic organisms in the ecosystem (Chavez et al., 2011). NPP has primarily been measured in-situ using the 14C method developed by Nielsen (1952), where collected samples are incubated with a known amount of radioactive 14C-bicarbonate that labels the dissolved inorganic carbon pool (e.g. Platt and Jassby, 1976; Bender et al., 1987; Cullen, 2001; Fasham, 2003). Other approaches to estimate NPP are based on measuring changes of O2 in light-dark incubations and different isotopic methods (e.g. 18O 13C, Bender et al., 1987; Cullen, 2001; Chavez et al., 2011). Typically, the shorter the duration of the incubation method (of order 1 hour), the more the measurement is considered to approach GPP. Longer incubations (order 10 hours) lead to estimates of NPP.
One major development has been the ability to estimate PP from satellite-derived properties (e.g. Eppley et al., 1985; Platt et al., 1988; Sathyendranath et al., 1991; Behrenfeld and Falkowski, 1997; Friedrichs et al., 2009), providing depth-integrated estimates with unprecedented spatial resolution and coverage. Note that, in principle, the method of Platt and Sathyendranath, based on short (1-2h) photosynthesis-irradiance experiment, may be considered to estimate GPP, whereas the method of Behrenfeld and colleagues, based on in situ incubation of one day, approaches NPP. A common approach to quantify PP in the surface ocean from satellite derived properties is based on a concept where stocks of carbon biomass or chlorophyll are combined with auxiliary properties to estimate rates of photosynthesis (e.g. Platt et al., 1988; Behrenfeld and Falkowski, 1997; Arrigo et al., 1998; Westberry et al., 2008). Another approach is to use Inherent Optical Properties (IOPs) to estimate NPP by combining satellite-based proxies for energy absorption in the water column with inferences of the efficiency when absorbed energy is converted into carbon biomass (Antoine et al., 1996; Lee et al., 1996; Smyth et al., 2005; Silsbe et al., 2016).
1.1.3 Net community production
NCP represents the net increase of biomass or carbon in the ecosystem of interest, or NPP minus community respiration of all heterotrophs (Williams, 1993; Cullen, 2001; Fasham, 2003). NCP estimates must be constrained to a defined domain in time and space to be of practical use. A method that aggregates results over the mixed layer can provide diametrically different results for a specific region compared with one that includes the part of the photic zone below the base of the mixed layer or parts of the mesopelagic. Likewise, NCP over short timescales should be interpreted very differently than annual averages (Fasham, 2003).
1.1.4 Export production
Export Production (EP, Laws, 1991) is the net production of organic carbon above a specified horizon and is assumed to be equivalent with NCP when the system is in steady-state and all temporal lags are accounted for. EP is an important property for the global carbon cycle by constraining the sequestration of organic carbon to deeper waters. EP is by definition only valid over significantly longer timescales than any processes directly controlling production and respiration. Hence, it is not possible to directly convert In-situ measurements of mixed layer NCP to EP since the newly-produced biomass might be consumed before it can be exported to the aphotic zone. It is also not yet possible to derive mechanistic relationships between EP satellite-based products. EP serves as the upper bound for transport of POC from the euphotic zone to the bathypelgic (e.g. Platt et al., 1989; Siegel et al., 2016; Siegel et al., 2022).
1.1.5 Export flux
If EP reflects the aggregated production of carbon above a depth horizon available for export to deeper waters, Eflux represents the direct or indirect measurement of this transport. Eflux is defined as the flux of material over a depth horizon and normally quantified via sediment traps (Dunne et al., 2005; Buesseler et al., 2007) or by measuring the reduction of particle-reactive 234Th in comparison to its longer-lived parent 238U in the water column (e.g. Bisson et al., 2018, and references therein). The 234Th method determines the downward flux of POC by integrating the deficit of 234Th in the upper water column and couples it to the POC/234Th ratio in sinking particles. Samples can be collected with much higher vertical resolution than traps, allowing for the estimation of POC flux at or very near Zeu without the need for a common reference depth. In contrast to EP, Eflux can be estimated across any temporal or spatial scale. Factors controlling the regional, temporal, and depth variations of POC/234Th ratios are however poorly understood (Puigcorbe et al., 2020). Other sources of uncertainty arise from neglecting physical processes and the necessary assumption of steady state in the Th isotope system (Buesseler et al., 2006).
1.1.6 Export efficiency
The fraction of PP that is exported out of the euphotic zone (EP/NPP) can be described as the carbon export efficiency (Ef). This is a non-dimensional ratio that describes how inefficient the ecosystem is in retaining carbon in the upper layer of the ocean. The more efficient the pelagic ecosystem is, the more inefficient the carbon export is, to the point where all carbon is recycled, and no carbon will be exported (Buesseler, 1998).
1.1.7 e-ratio
A special case of Ef is the e-ratio, or the flux of particulate organic carbon at the base of the euphotic zone divided by NPP, (Murray et al., 1996).
1.1.8 f-ratio
Eppley and Peterson (1979) characterized export efficiency as the ratio of New to Total photosynthetic production, or the f-ratio. This idea is based on the concept of distinguishing NPP driven by nitrogen compounds originating from different processes in the ecosystem. New production is fueled by nutrients (usually NO3 –) recently introduced to the euphotic zone (either from deeper waters or via lateral processes) (Dugdale and Goering, 1967) in contrast to production from rapidly recycled compounds such as ammonium. Export production would then be equal to New production if the system is in a steady state and all transformations between ammonium and NO3 – occur outside the euphotic zone (Laws et al., 2011).
The f-ratio was originally believed to be significant by being directly related to Ef, but this interpretation relied on the assumption that nitrification mainly occur below the euphotic zone, something that more recent measurements have questioned (Dore and Karl, 1996; Yool et al., 2007). Platt et al. (1989) also suggested that elevated new production is directly driven by perturbations in the physical forcing which challenges a necessary assumption of steady state.
1.1.9 ef-ratio
Laws et al. (2000) combined the e- and f-ratios to an ef-ratio based on the assumption that new production should balance export production if a system is in steady-state. This ratio makes it possible to combine measurements of new and export production.
1.1.10 pe-ratio
A more precise definition of the e-ratio is the pe-ratio, or “the ratio between the export of rapidly sinking particulate matter (particle export) and the total production of organic matter by photosynthesis (primary production)” (Murray et al., 1996; Dunne et al., 2005). The pe-ratio shows similar spatial patterns as the f-ratio on global scales, especially when identifying eutrophic and oligotrophic regions.
1.2 Structure of the review
With this review we have aimed to assess how different published algorithms that use satellite-derived properties to calculate EP perform. Our approach has been to leverage already existing evaluation studies where different models have been compared with each other, and only directly compare algorithms or validation datasets when no existing information is available. Earlier studies evaluating EP algorithms each use slightly varying approaches and were often conducted to compare newly developed algorithms with already existing ones. We address these differences by performing a kind of meta-analysis where different evaluations and validation datasets are compared together with the respective algorithms. We have followed the guidelines for systematic reviews prescribed in Khan et al. (2003) when applicable.
The review begins with a brief description of existing EP algorithms, followed by a presentation of different datasets that can be useful for the evaluation satellite-based EP algorithms. Next, we discuss earlier studies that evaluates EP algorithms, including our own comparison where we use the Dunne et al. (2005); Bisson et al. (2018), and Mouw et al. (2016a) datasets to assess the different EP algorithms. Finally, we discuss the different evaluations and provide a recommendation about which algorithm to use.
2 Export production algorithms
A number of different approaches to constrain and scale EP using different satellite derived properties have been proposed over the years. Most algorithms are developed to provide some kind of export efficiency ratio that then can be scaled with PP estimates to generate properties that are comparable to observations of EP. It is not well defined if either satellite-derived PP products or EP algorithms are assuming that the biological production is defined as GPP, NPP, or something in between, while this is not always clear from in-situ measurements either (Balch et al., 2022). As a result, we use the term PP to designate primary production without specifying if it is GPP or NPP. All relationships except for those of Betzer et al. (1984); Pace et al. (1987), and the re-parametrization of Siegel et al. (2014) by Stukel et al. (2015) are designed to provide global estimates of EP. Terms used in the the algorithms are summarized in Table 2.
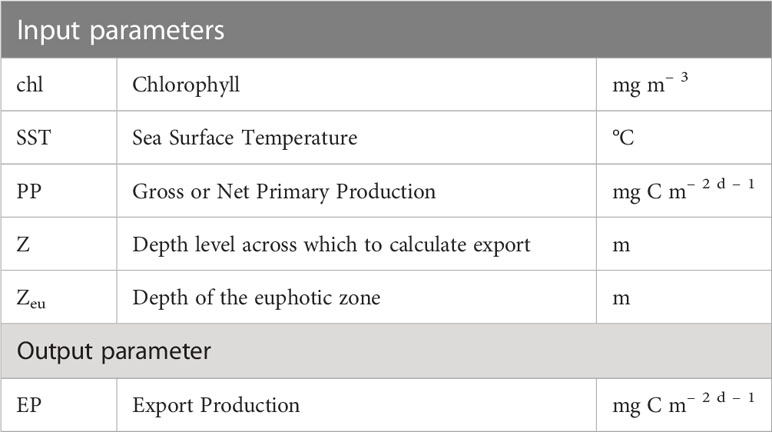
Table 2 Input and output parameters for the different algorithms.
2.1 Eppley and Peterson, 1979
Eppley and Peterson (1979)’s seminal paper is to our knowledge the first study that suggested a quantitative relationship between PP and EP. They base their algorithm solely on PP, with two different scaling factors if the magnitude of PP is above or below 200 mg C m-2 d-1.
2.2 Suess, 1980
Suess (1980) uses one scaling factor for PP and adds a depth dependency as to predict organic carbon flux at any depth across a depth horizon below the base on the euphotic zone. The algorithm was derived from sediment trap data.
2.3 Betzer et al., 1984
The Betzer et al. (1984) relationship was derived from on 14C based PP and POC flux observations using a free-drifting sediment trap at 900 m. The trap was deployed at four locations between 12°N and 6°S at 153°W in the Pacific Ocean.
2.4 Pace et al., 1987
Pace et al. (1987) expanded on Suess (1980) by including the vertical flux of both POC and particulate organic nitrogen (PON) based on in-situ observations from the Vertical Transport and Exchange (VERTEX) program in the north-east Pacific Ocean.
2.5 Baines et al., 1994
The algorithm of Baines et al. (1994) is derived from a relationship between the e-ratio, PP, Efluxes, and the depth of the euphotic zone. All three variables are independently predicted from Chl with an R2 of 0.54 – 0.90.
2.6 Laws et al., 2000
This algorithm is based on a relationship between Ef, SST, and the f-ratio derived from data in Table 3 of Laws et al. (2000). We use the equation as described by Henson et al. (2011).
2.7 Dunne et al., 2005
Dunne et al. (2005) is based on trap and 234Th observations together with PP from incubations at different depths, SST, Zeu, and Chl. Ef is constrained to fall between 0.04 and 0.72 (Dunne et al., 2005; Stukel et al., 2015).
2.8 Henson et al., 2011
The Henson et al. (2011) model is parameterized to estimate export at the 100 m depth horizon. (Henson et al., 2011; Stukel et al., 2015).
2.9 Laws et al., 2011
The algorithms in Laws et al. (2011) is a further development of Laws et al., 2000. They introduce two relationships: which is equation 2 in in Laws et al. (2011), and
Equation 12 is based on contours in Figure 2 of Laws et al. (2000) and evaluated in Stukel et al. (2015), both equations 12 and 13 are evaluated in Li and Cassar (2016).
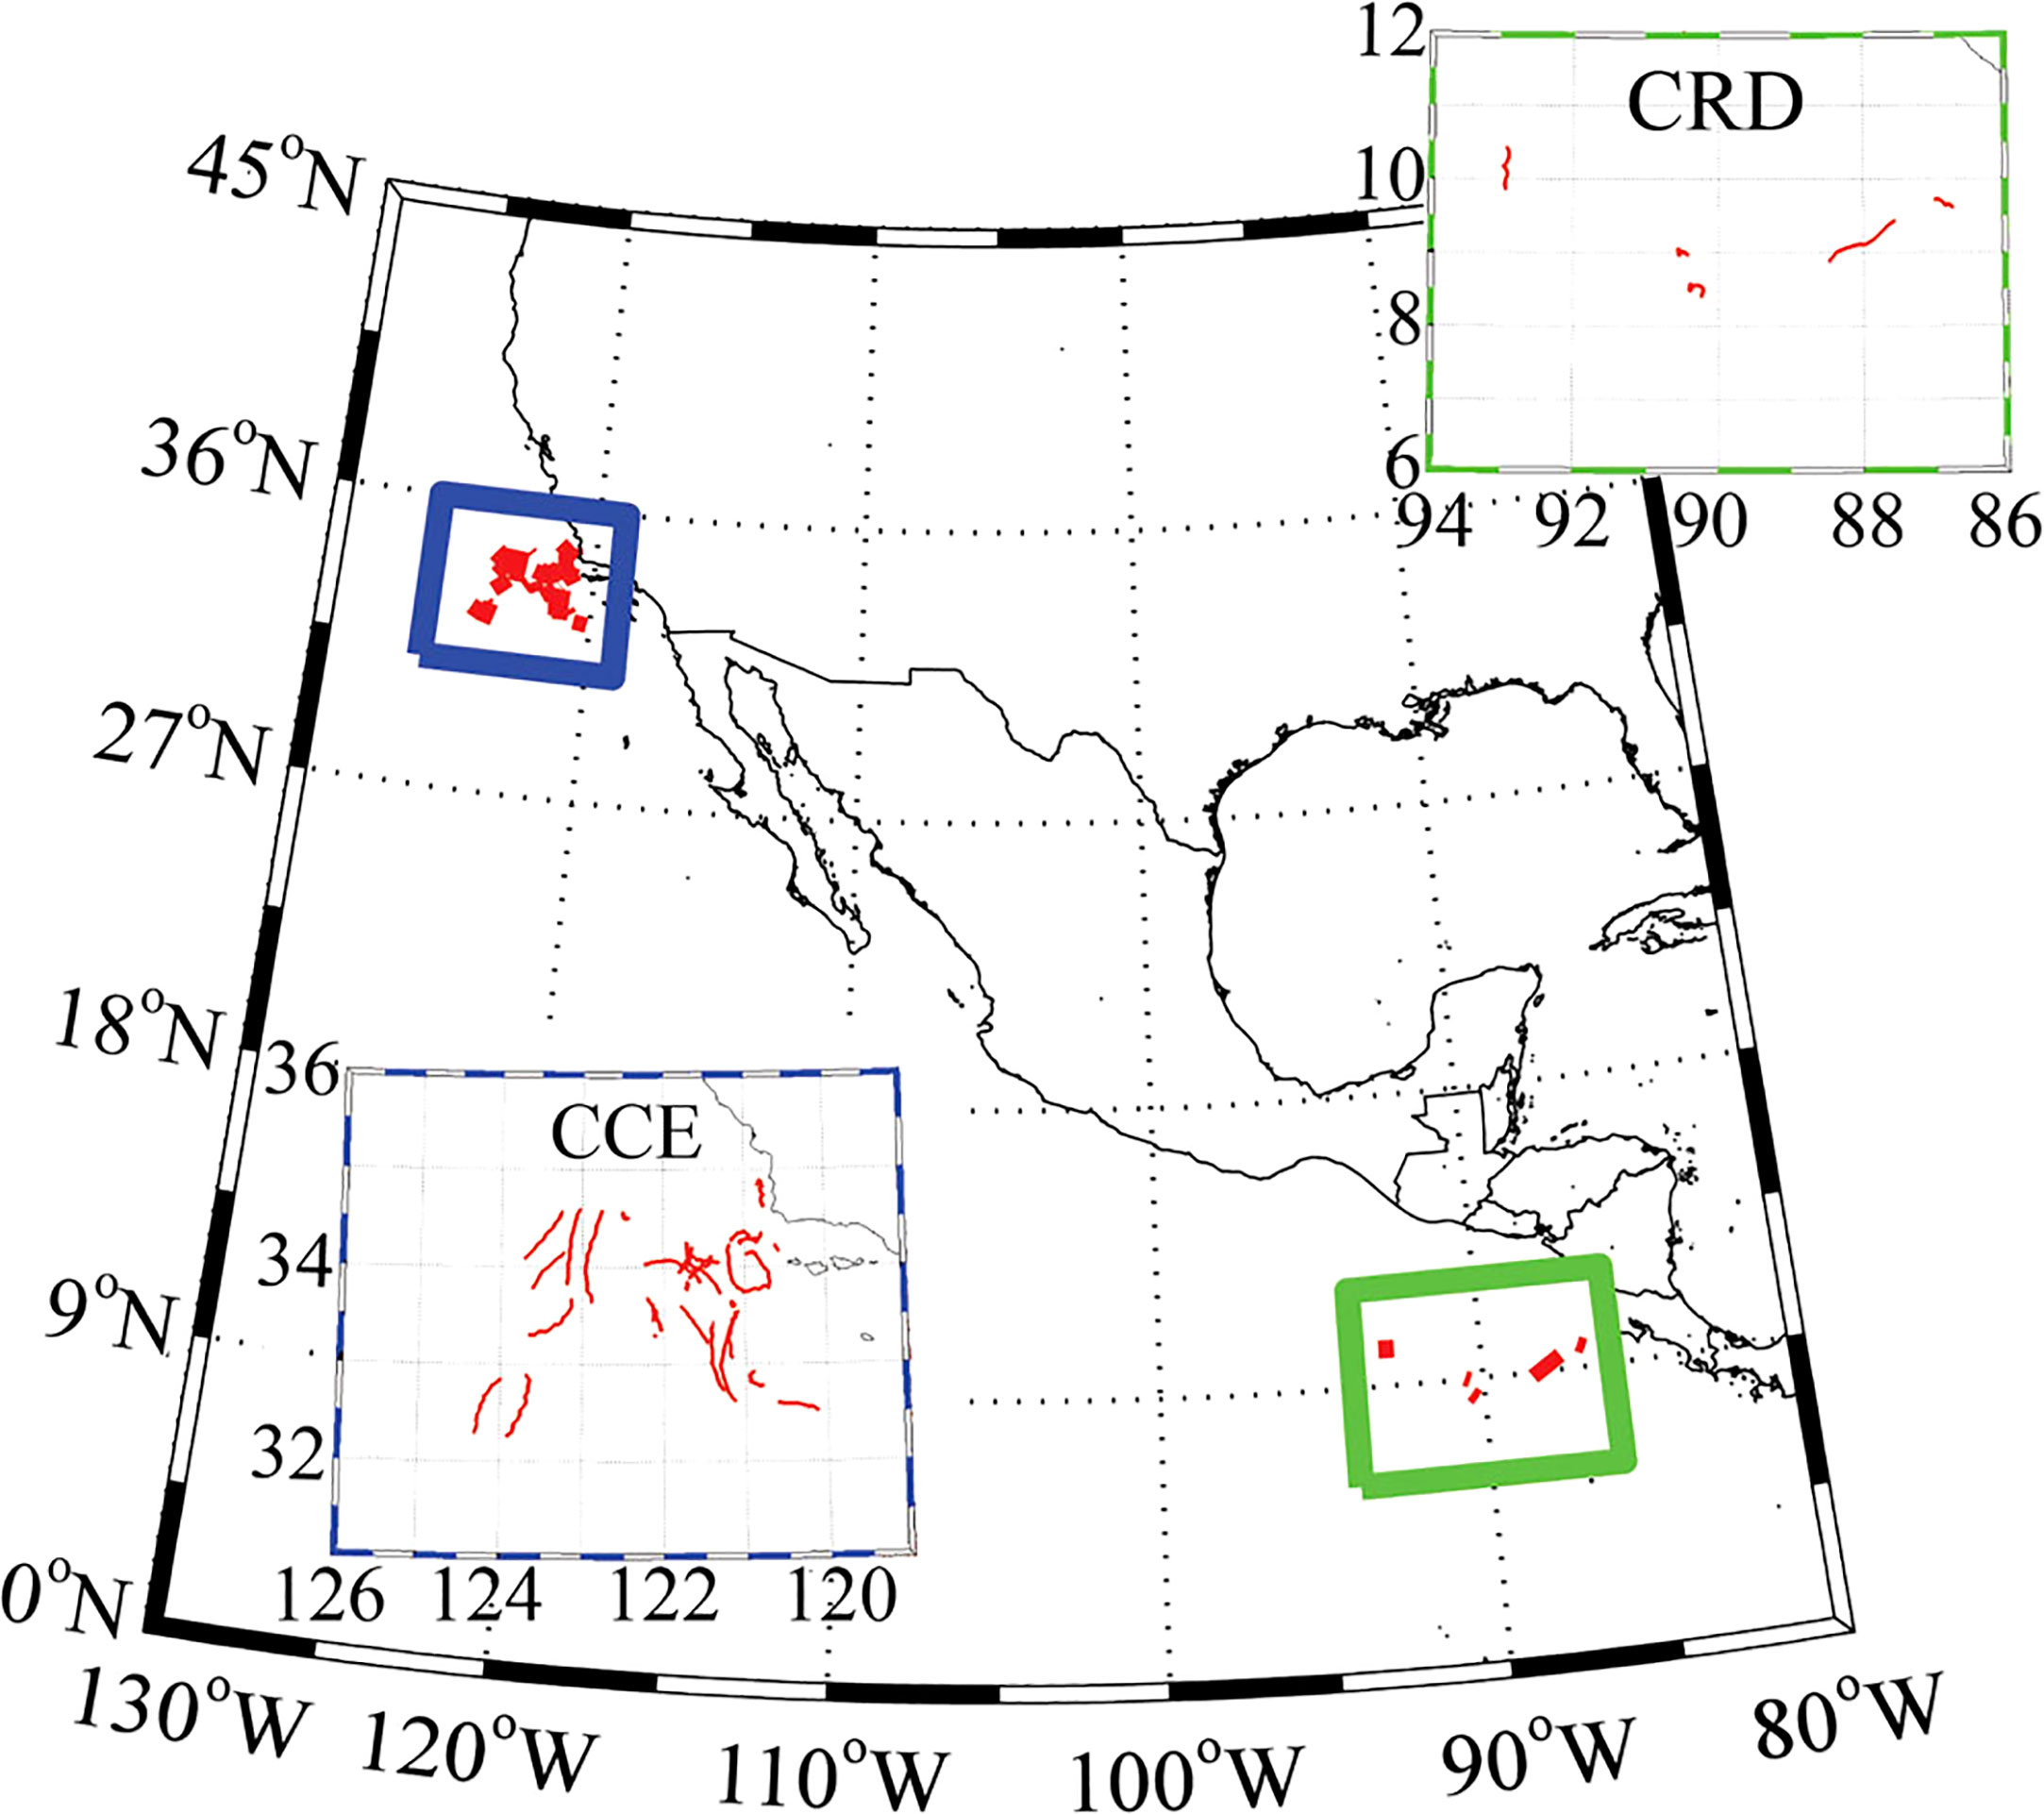
Figure 2 Lagrangian experiment locations in the Stukel et al. (2015) study. CCE drifter tracks (blue box, upper right). CRD drifter tracks (green box, lower left). Image from Stukel et al. (2015).
2.10 Westberry et al., 2012
Westberry et al. (2012) uses a number of empirical relationships between PP and respiration (R) to assess NCP and EP. Part of their analysis is to generate regional PP-R relationships by dividing available observations into broad latitudinal zones with different nutrient dynamics.
2.11 Siegel et al., 2014
Siegel et al. (2014) algorithm divides EP is to different size classes based on the assumed ability to assess the community structure of phytoplankton assemblages via satellite-derived properties. The different terms are specified as follows: AlgEP is the total vertical flux of sinking algal cells and aggregates and FecEP is the total vertical flux of sinking fecal material released from zooplankton grazers. is the fraction of microphytoplankton production that sinks out of the base of the euphotic zone (assumed by Siegel et al. (2014) to be 0.1) and PPM is the PP of microphytoplankton. and are the fractions of grazing on microphytoplankton and smaller (<20 m) phytoplankton, respectively, that contribute to fecal matter export from the euphotic zone (assumed by Siegel et al. (2014) to be 0.3 and 0.1, respectively). GM and GS are the grazing rates on microphytoplankton and small phytoplankton and are derived from phytoplankton mass balance budgets.
2.12 Li & Cassar, 2016
The Li and Cassar (2016) model was developed using a Genetic Programing approach to statistically optimize the Laws et al. (2000) and Henson et al. (2011) relationships using O2/Ar-based NCP estimates.
3 In situ data for evaluation
The Dunne et al. (2005) compilation of in-situ pe-ratios is based on 122 field observations from approximately 40 oceanographic studies with global distribution. The dataset includes estimates of PP, Chl a, New Production, nutrients, oxygen or carbon based estimates of EP, particle export estimates based on sinking flux from sediment traps and/or 234Th, and the carbon-to-chlorophyll ratio. Physical parameters include mixed layer temperature and the depth of the euphotic zone (minimum of the 1% light level or sampling zone), The data coverage is presented in Figure 3. They find that, In general, pe-ratios are high (>0.4) in the Polar regions, moderate (0.3–0.4) in coastal regions and open ocean regions supporting phytoplankton blooms, and low (0.05–0.2) elsewhere. The data can be accessed as supplementary information to the Dunne et al. (2005) publication.
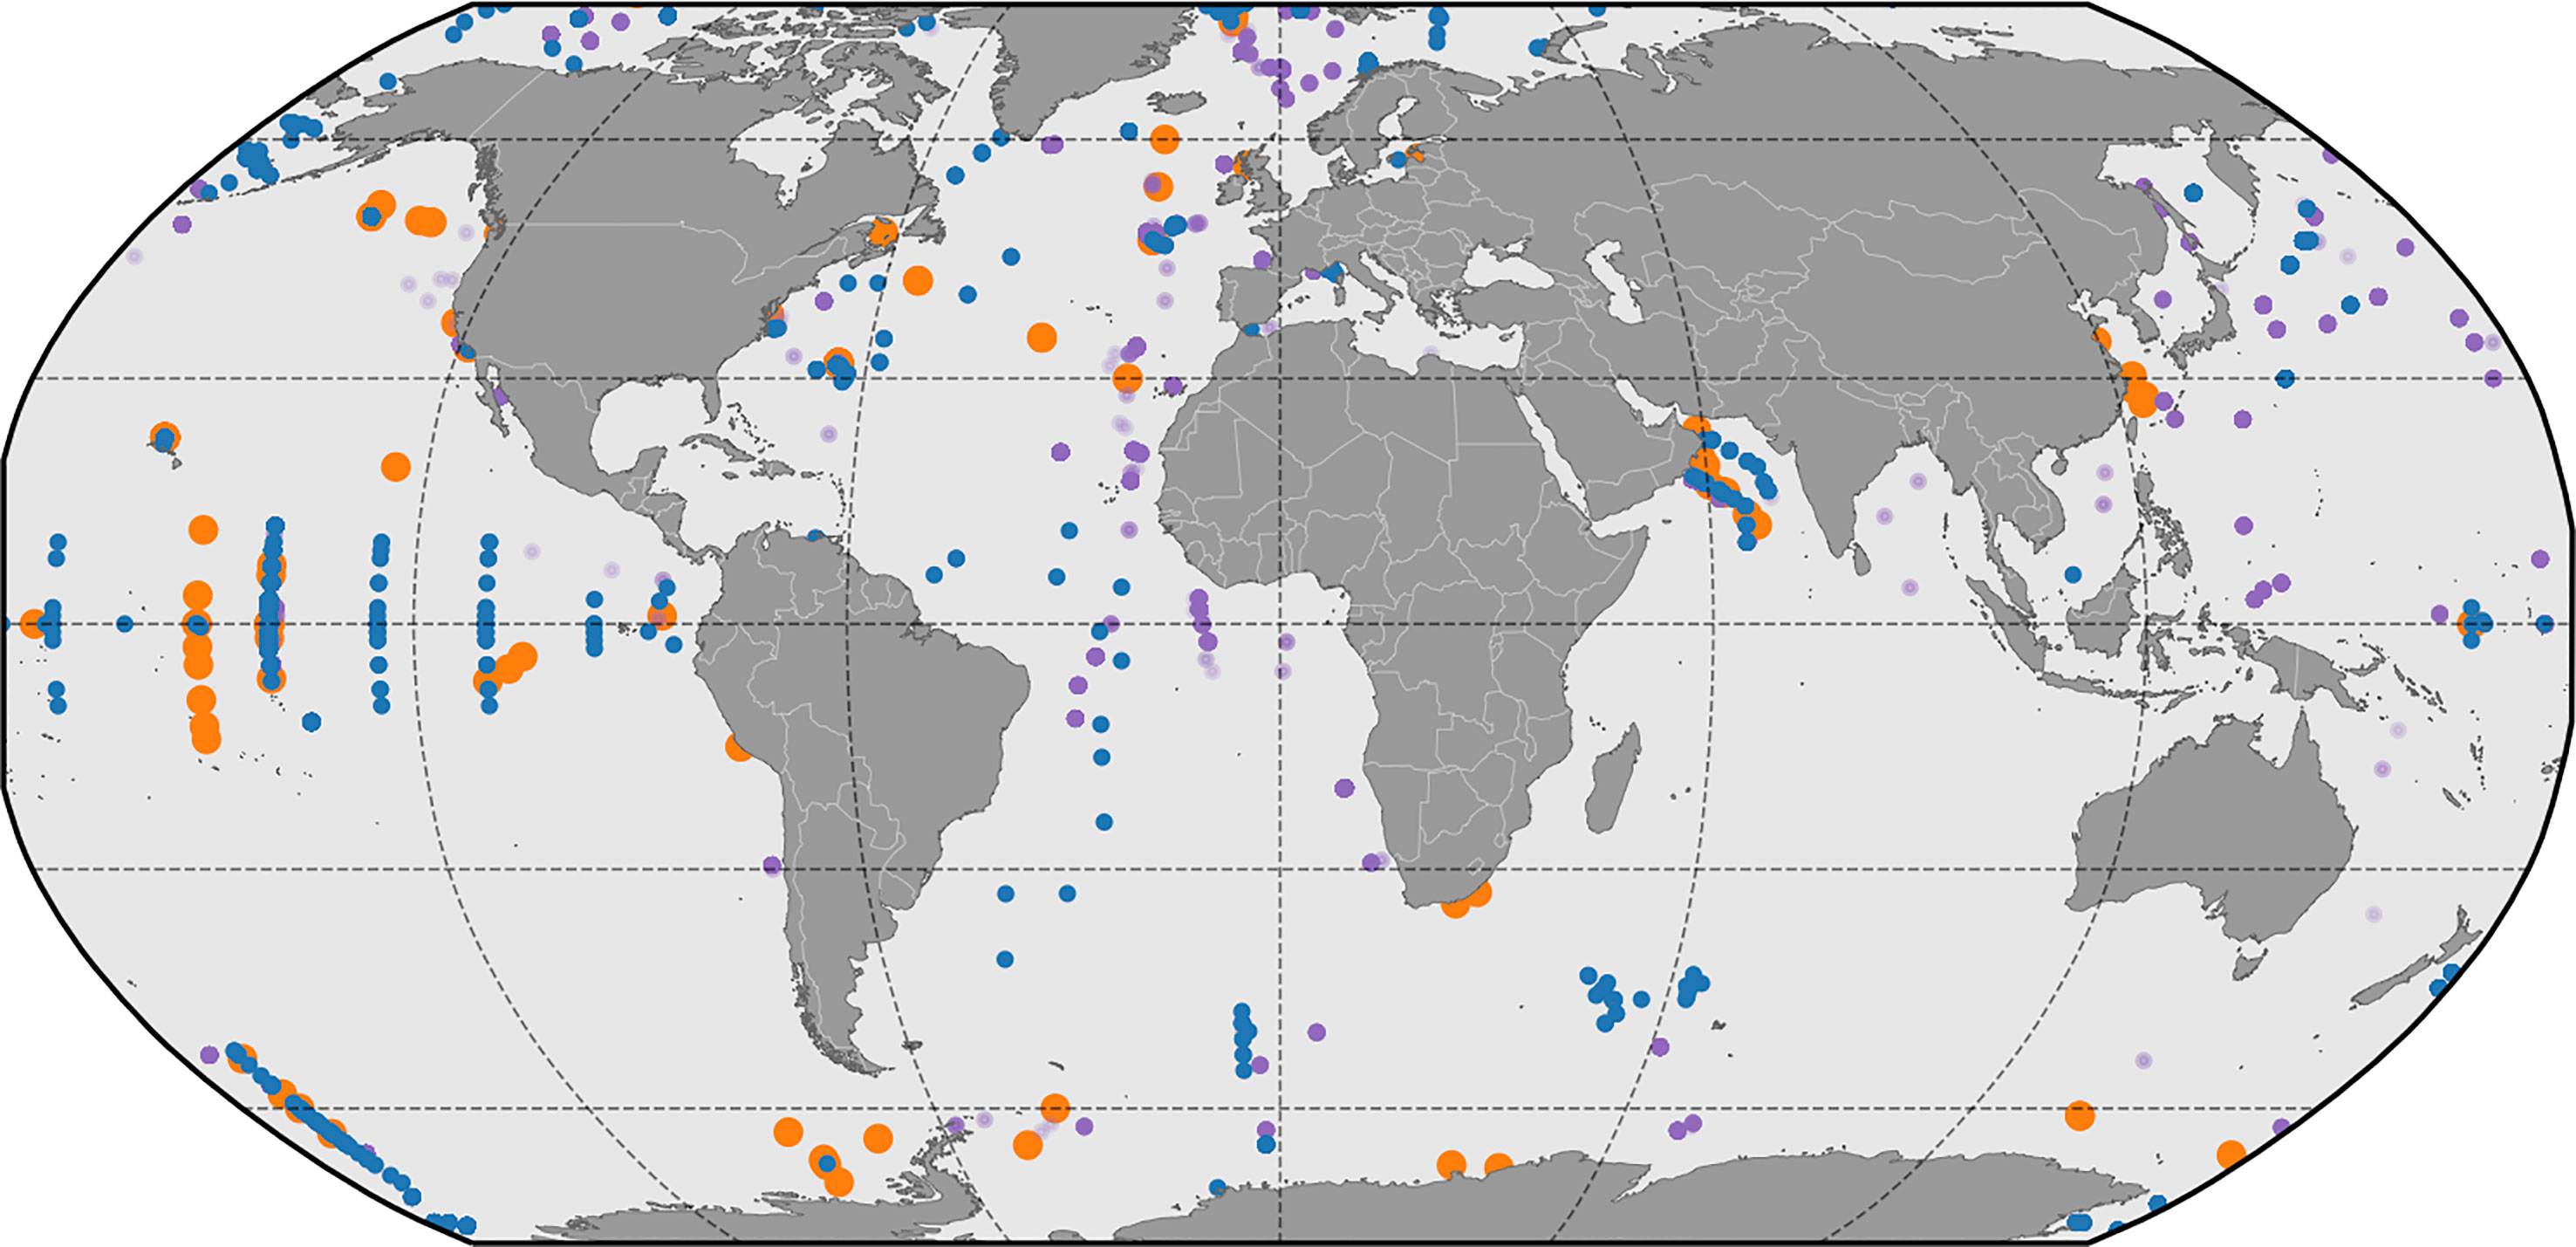
Figure 3 Locations of in-situ POC flux observations presented in Dunne et al. (2005), (orange markers), Bisson et al. (2018), (green markers) and Mouw et al. (2016a); Mouw et al. (2016b), blue markers for observations shallower than 200 meters, purple for observations deeper than 200 meters).
The Stukel et al. (2015) datasets are based on 32 Lagrangian process studies where shallow-drifting sediment traps were combined with 238U-234 Th measurements to quantify EP (Buesseler et al., 2007). These Lagrangian studies where conducted between 2 and 5 days either within in the California Current Ecosystem (CCE) Long Term Ecological Research (LTER) or the Costa Rica Dome (CRD) FLUx and Zinc Experiments (FLUZiE) programs. Drifters were drogued at 15 m depth and tracked by satellite with either experimental incubation bottles or VERTEX-style sediment traps attached below (Stukel et al., 2013). This experimental setup allowed for simultaneous measurement of carbon export, food web processes (PP, protozoan grazing, mesozooplankton grazing, size-spectra of phytoplankton community), and net changes of in-situ Chl. The datasets consist of observations from 7 cruises (Figure 2) and can be located via the acknowledgments section of Stukel et al. (2015) or as supplementary information to the publication.
The Li and Cassar (2016) algorithm development and evaluation used a global dataset of mixed layer O2/Ar based NCP estimates either from discrete samples analyzed in the lab or continuous underway measurements (Reuer et al., 2007; Cassar et al., 2009; Jönsson et al., 2013). NCP can be derived from O2/Ar measurements by assuming a mass balance of biological O2 in the mixed layer. Oxygen saturation at the ocean surface is influenced by biological (i.e., PP) and physical processes (e.g., bubble injection and temperature changes). Ar and O2 have similar temperature dependencies (Craig and Hayward, 1987). Combined with their similar solubilities, they have almost equivalent responses to processes such as temperature or air pressure change and bubble-mediated gas exchange. As such, oxygen concentration due to physical processes can be accounted for with measurements of the O2/Ar saturation state.
The dataset contains observations from 1999 to 2009 (n = 689,566) averaged to a 0.083° × 0.083° grid, yielding n=14,795 samples with a mean coefficient of variation (CV) of 0.12 per gridcell (Figure 4). The O2/Ar super saturation is converted to an NCP proxy using QSCAT/NCEP blended wind speeds (Reuer et al., 2007). Samples with negative NCP are removed due to potential biases associated with vertical mixing of O2-undersaturated waters (Reuer et al., 2007; Jönsson et al., 2013). Note that positive NCP values may also be biased by vertical mixing where vertical mixing brings O2-undersaturated water to the surface and the estimates should be regarded as lower bounds on the true NCP. Conversely, positive biases in NCP could occur in regions with high biological O2 below the mixed layer (e.g., deep chlorophyll maximum). Because of these uncertainties, O2/Ar NCP data below 1.0 mmol O2 m2 d – 1 are removed from the dataset. Additional uncertainties and biases (e.g., gas exchange parameterization and lack of steady state in biological O2 in the mixed layer) are further discussed in Jönsson et al. (2013). Data access is described in Li and Cassar (2016).
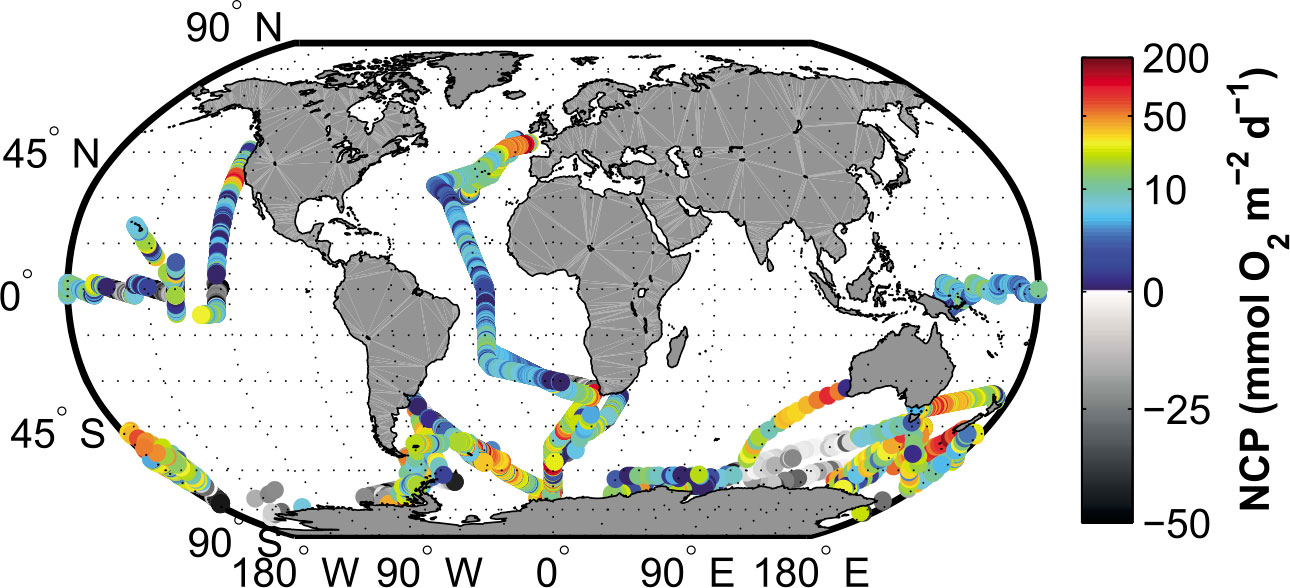
Figure 4 Global map of O2/Ar measurements from Li and Cassar (2016). Samples with positive values are color coded. Samples with negative values are shown using a gray scale. Image from Li and Cassar (2016).
The Mouw et al. (2016a) dataset consists of Particulate Organic Carbon (POC) flux estimated from sediment traps and 234Th compiled across the global ocean including six long-term time series locations. The data set contains 15,792 individual POC flux estimates at 674 unique locations collected between 1976 and 2012 (Figure 3). Where available, the flux of other minerals is also reported. Of the observations across the globe, 85% are concentrated in the Northern Hemisphere, time series sites accounts for 36% of the data, while 71% of the data are measured at ≥500 m with the most common deployment depths between 1000 and 1500 m. The dataset is archived in the PANGAEA data repository (Mouw et al., 2016b).
The Bisson et al. (2018) dataset is based on observations from sediment traps at depths less than 200 meters and 234Th measurements converted to POC flux at Zeu. The data is selected to represent different sampling methodologies and spatiotemporal scales, and totals 1,719 observations from 1984 to 2014.
The Puigcorbe et al. (2020) dataset does not include POC flux observations but POC/234Th ratios that can be indirectly used to constrain EP and evaluate EP models. The collection contains of 9,318 measurements with a global coverage collected between 1989 and 2018 from the surface to > 5500 m, and divided into three size fractions (∼< 0.7 µm, ∼ 1–50 µm, ∼> 50 µm). The data has an uneven distribution with some areas highly sampled (e.g., China Sea, Bermuda Atlantic Time Series station) while others regions are sparsely covered (the south-eastern Atlantic, the south Pacific, and the south Indian Oceans). The dataset is archived in the PANGAEA data repository (Puigcorbe, 2019).
Ceballos-Romero et al. (2022) provide a comprehensive dataset of234Th measurements sampled across the global ocean between 1967 and 2018. The compilation includes a total of 56 631 data points together with appropriate metadata including geographic location, date, and sample depth. When available, water temperature, salinity, 238U (over 18 200 data points), and particulate organic nitrogen is included. Data source and method information (including 238U and 234Th) is also detailed along with valuable information for future data analysis such as bloom stage and steady-/non-steady-state conditions at the sampling moment. While not directly applicable in this study, this dataset provides a valuable resource for future EP algorithm development and evaluation.
4 Algorithm evaluations
The instrumental Dunne et al. (2005) study provided not only relationships between PP or Chl and EP that are widely used in ecosystem modeling, but also comparisons of a variety of empirical parameterizations with the data synthesis described in section 3.1. The observed pe-ratios were combined with in-situ observations of mixed layer temperature, depth-integrated chlorophyll, depth-integrated PP, new production, particle export, depth of the euphotic zone (minimum of the 1% light level or sampling zone), and the carbon-to-chlorophyll ratio. They found that the Eppley and Peterson (1979), (Figure 5A) algorithm has the lowest coefficient of determination (9%), which they attributed to the parameterization relying on the integral of PP alone. The Baines et al. (1994), (Figure 5B) algorithm added euphotic zone depth in addition to the depth-integral of PP and was able to account for a higher fraction of the variance (38%), while not improving the relative uncertainty (64%). A different approach was used by Baines et al. (1994), (Figure 5C) where chlorophyll concentrations were utilized as the predictive variable. Their parameterization was able to account for a slightly higher variance (40%) while also decreasing the relative uncertainty (46%), but showed a strong bias to low values at higher pe-ratios. Dunne et al. (2005) found that the Laws et al. (2000), (Figure 5D) algorithm succeeded in reproducing large-scale structures in the data and accounted for nearly half of the variance (47%), while decreasing the relative error to 43%. The major shortcoming of this algorithm was in reproducing variability in pe-ratios at high temperatures. Dunne et al. (2005) suggested that “a weaker temperature dependence for phytoplankton and bacterial metabolism than for zooplankton metabolism” accounts for this misfit.
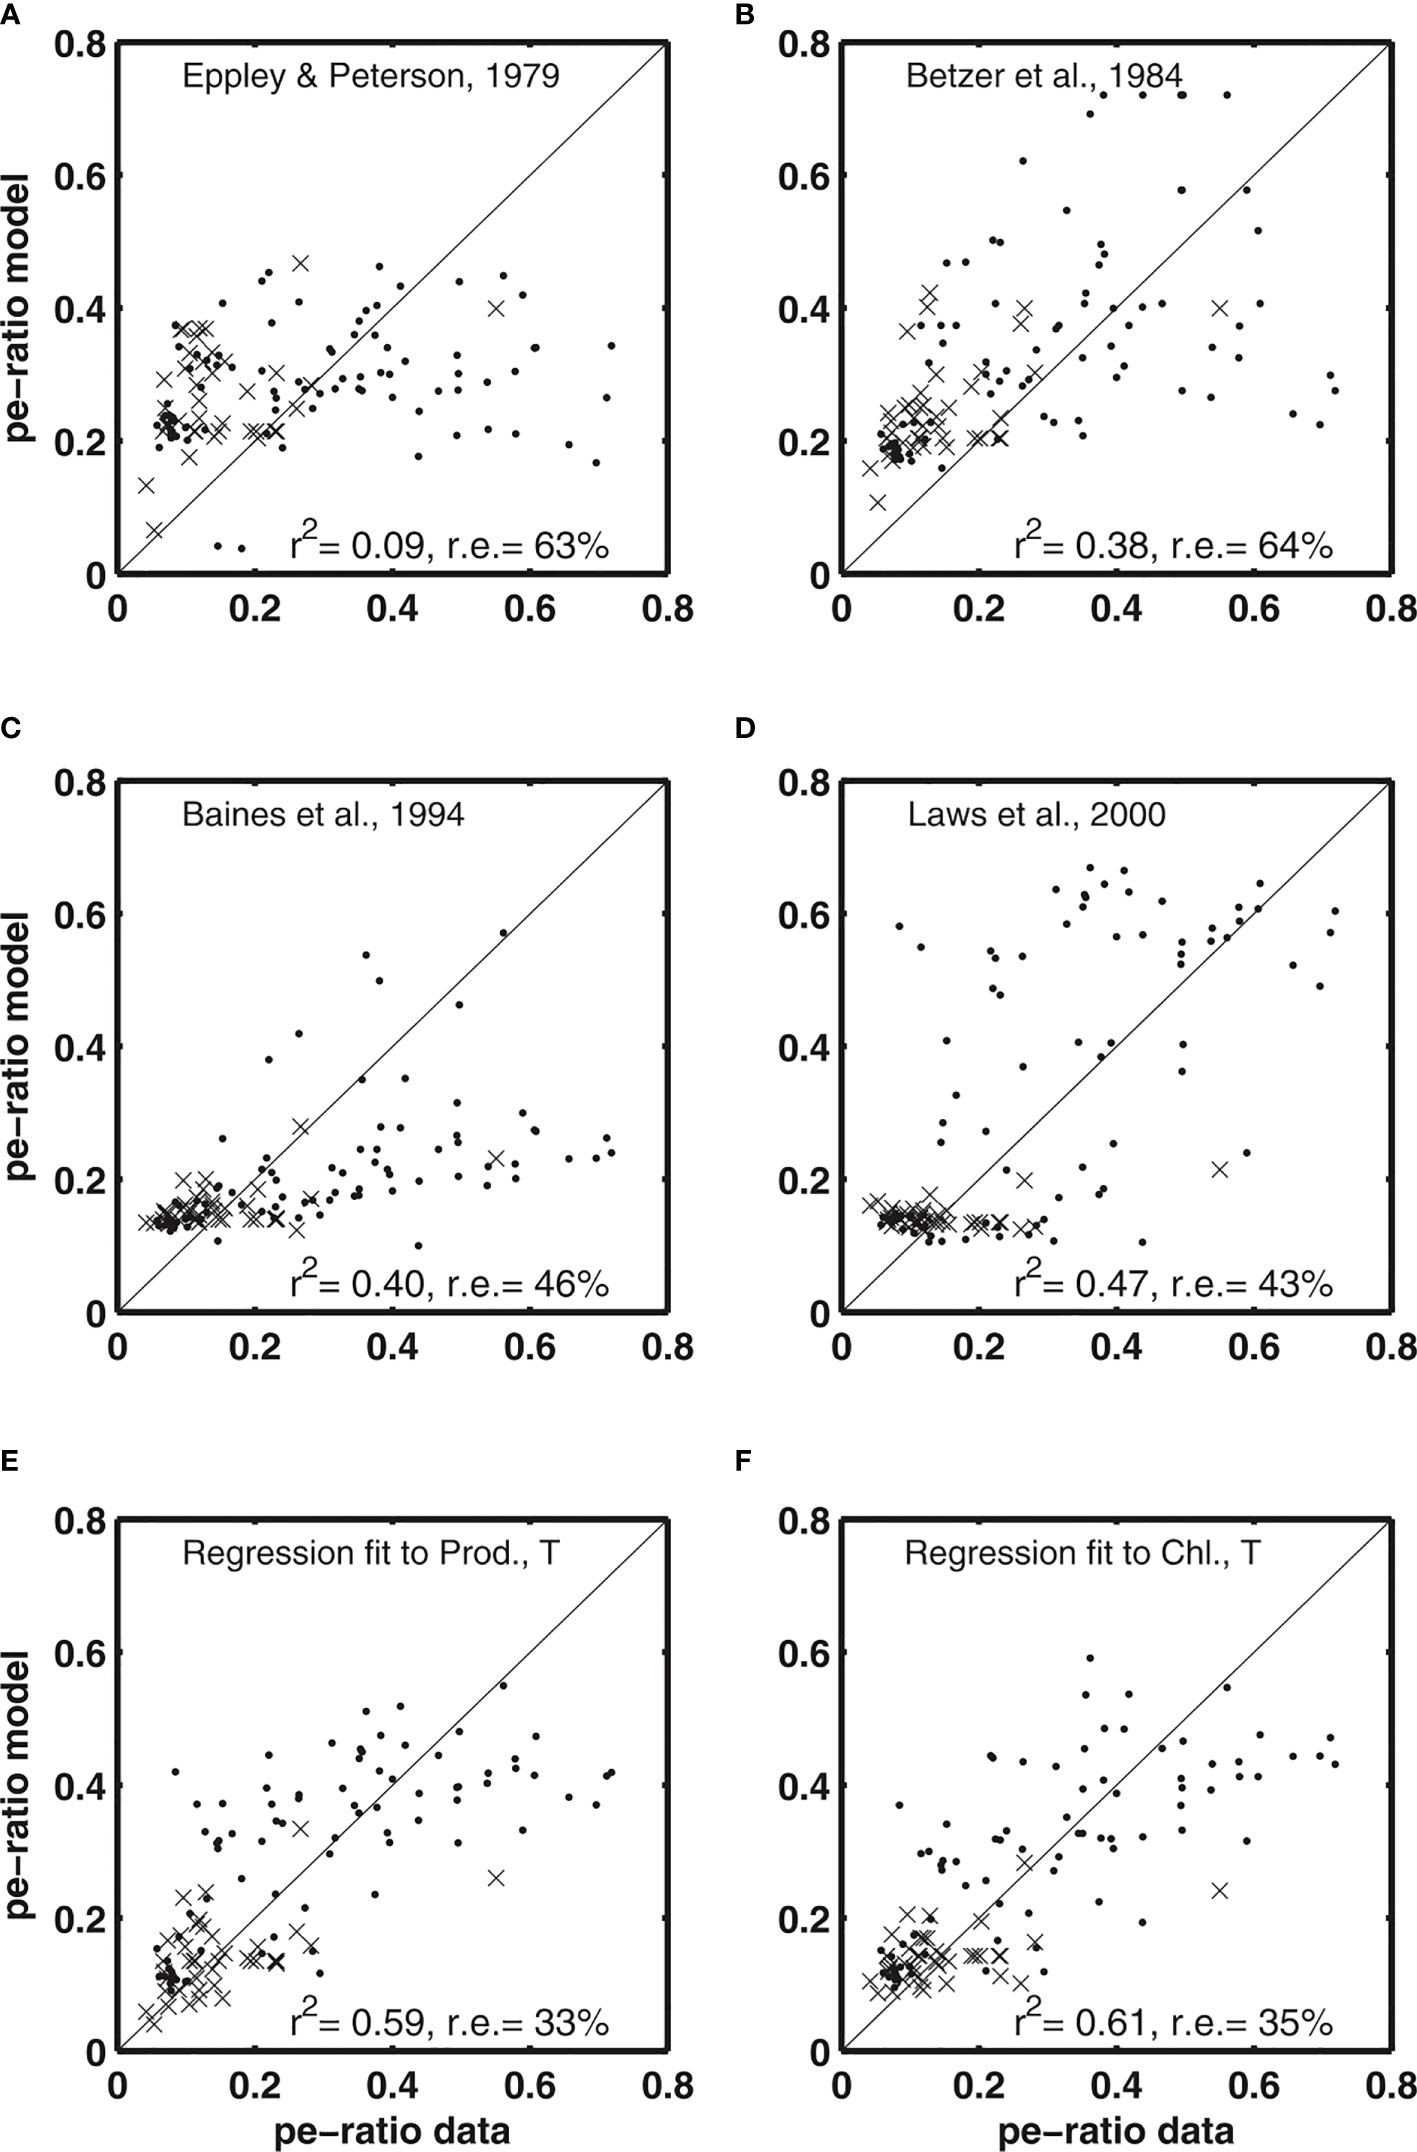
Figure 5 Comparison of particle export ratio estimates by Dunne et al. (2005) of various models described in section 2 using data described in section 3.1. Panels (A-D) show results based on algorithms described in sections 2.1, 2.3, 2.5, and 2.6, and panels (E, F) the two algorithms described in section 2.7. Symbols are grouped by temperature into less than 14°C (crosses) and greater than 14°C (dots). Image from Dunne et al. (2005).
The algorithm developed by Dunne et al. (2005), (Figures 5E, F) provided a reasonable fit to the compiled dataset of observations, with an R2 of 58% and a relative uncertainty of 33%. The algorithm had low skill in areas with the highest pe-ratios and sites with a combination of very high pe-ratios and low to moderate PP. This discrepancy if compensated for using biomass instead of PP improved R2 to 61% with a relatively low relative error (35%). Dunne et al. (2005) explained this improvement with biomass integrating ecosystem processes better over time than PP.
Li and Cassar (2016) evaluated a number of algorithms described in section 2 by matching O2/Ar- derived NCP observations (see section 3.3) with satellite derived 8-day 0.083° × 0.083° SeaWiFS Chl and PAR, VGPM NPP, and AVHRR SST. The standard SeaWiFS Chl algorithm was shown to underestimate [Chl] by a factor of 2 to 3 in the Southern Ocean at the time when Li and Cassar (2016) conducted the evaluation (Kahru and Mitchell, 2010) and were improved by using a blending scheme presented by Kahru and Mitchell (2010). VGPM NPP was based on the recalculated Chl data product. Phytoplankton size composition was derived using Li et al. (2013) and VGPM NPP for the algorithm developed by Siegel et al. (2014), together with the other parameters as presented in Siegel et al. (2014). See Li and Cassar (2016) for more detailed descriptions of the data sources.
Li and Cassar (2016) used the satellite-derived data to calculate export production for the Eppley and Peterson (1979); Betzer et al. (1984); Baines et al. (1994); Laws et al. (2000); Dunne et al. (2005); Laws et al. (2011); Westberry et al. (2012), and Siegel et al. (2014) algorithms. They also used the data together with observed O2/Ar- NCP to develop the Li and Cassar (2016) algorithm. The main assumption here was that the O2/Ar-NCP is a valid proxy for EP. One could expect Li and Cassar (2016) to outperform the other algorithms since the observational dataset was used to train the algorithm, but this was not the case (Figure 6). Instead, all EP predicting algorithms showed surprisingly similar results. Eppley & Peterson (1979); Betzer et al. (1984), and Baines et al. (1994) showed almost identical distributions in the regressions against observations with R2s between 0.58 and 0.65. The algorithms of Eppley & Peterson (1979) and Betzer et al. (1984) in particular tended to overestimate low NCP values. The different Laws et al. (2000); Laws et al. (2011) algorithms all provided a smaller spread around the 1:1 line and a slightly better R2 (0.64-0.7). The algorithms of Laws et al. (2000) also overestimated low NCP, while the algorithm of Laws et al. (2011); (Equation 12 and 13) showed symmetrical distributions. The Dunne et al. (2005) algorithm, on the other hand, tended to underestimate NCP. This tendency was even greater for Westberry et al. (2012) and Siegel et al. (2014), which also showed among the lowest R2s (0.62 and 0.55, respectively). This is particularly surprising for the algorithm of Westberry et al. (2012), which was developed using a framework that was based on the assumption of NCP being a good general proxy for EP. The two algorithms developed by Li and Cassar (2016) showed, as expected, a good skill in predicting O2/Ar-NCP. Their Support Vector Regression (SVR) approach had the highest R2, but seemed to have a floor where values below a certain threshold were not being predicted. This could be a consequence of how the SVR was configured. The fact that all approaches showed similar and relatively good skills in predicting O2/Ar- NCP and EP is surprising, as the various algorithms model different components of the biological pump.
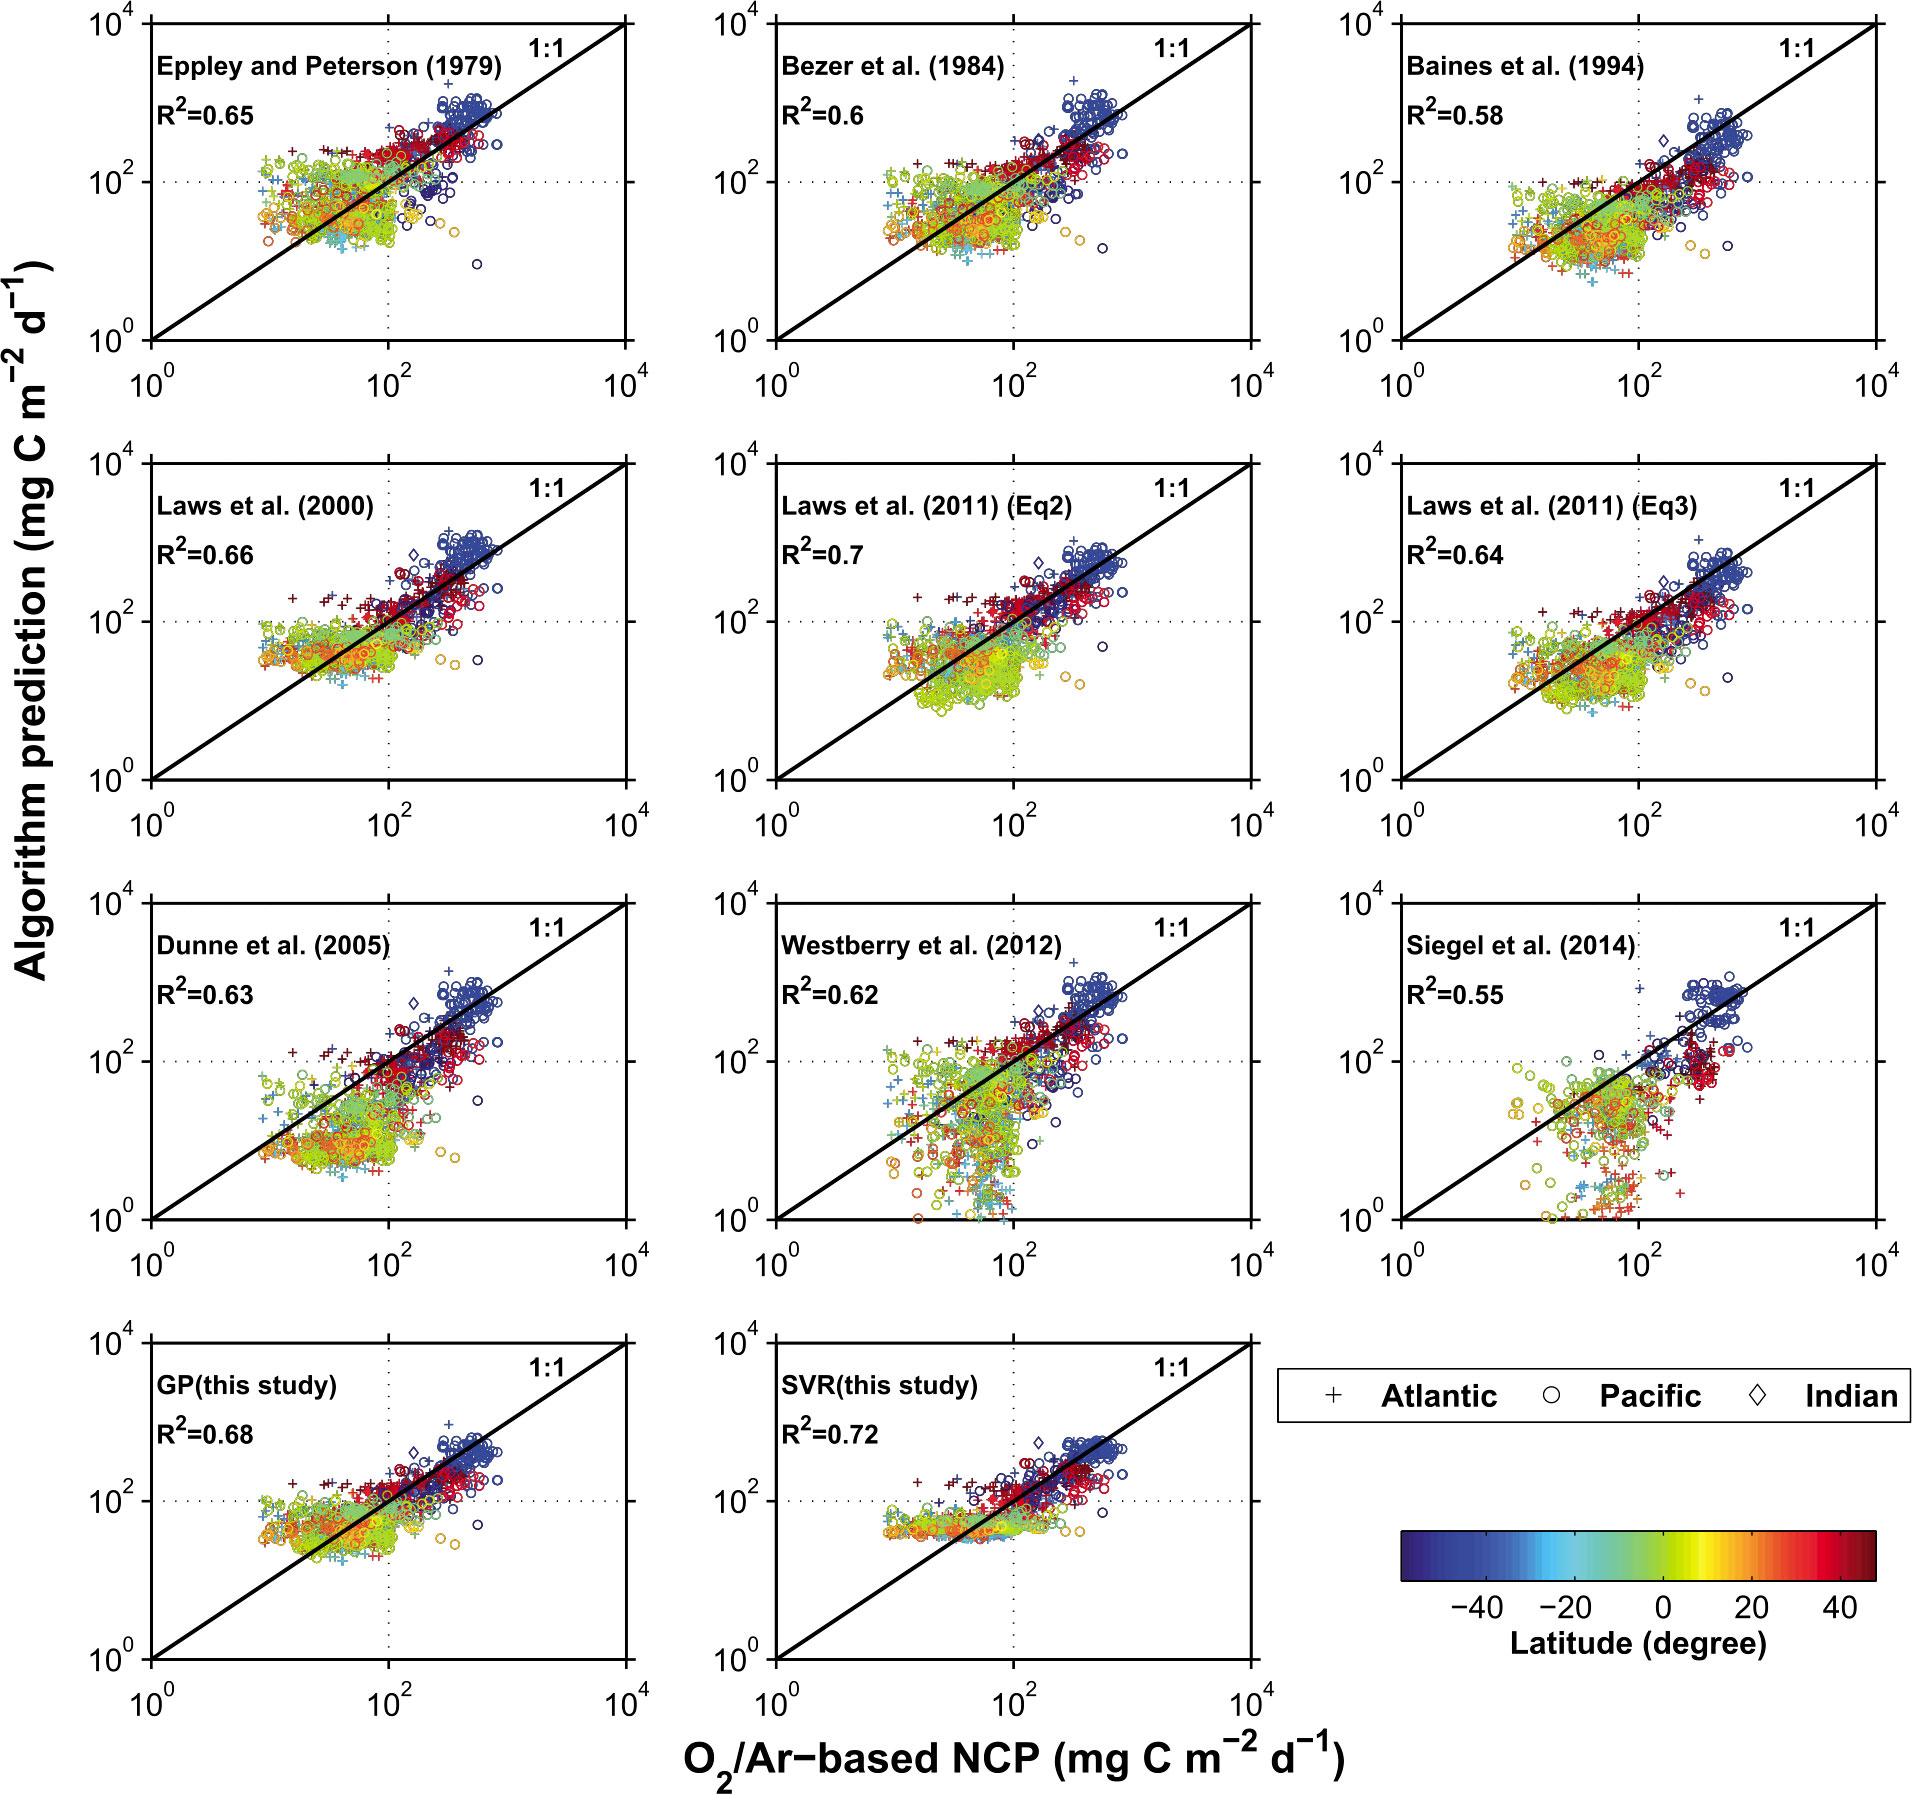
Figure 6 Comparison of satellite algorithms of carbon export production by Li and Cassar (2016). O2/Ar-derived NCP was converted to C using a stoichiometry of O2/C=1.4 (Laws, 1991). Samples with O2/Ar-NCP estimates<1.0 mmol O2 m2 d-1 were excluded. Phytoplankton size composition was derived using Li et al. (2013) and VGPM NPP for the algorithm developed by Siegel et al. (2014), together with the other parameters as presented in Siegel et al. (2014). Image from Li and Cassar (2016).
The Stukel et al. (2015) EP algorithm comparison is based on a Lagrangian approach where in-situ rates of NPP, EP and auxiliary parameters were observed concurrently in a water mass. They do this by compiling results from Lagrangian process studies in the North Eastern Pacific Ocean (see Stukel et al., 2015, and section 3.2 for details). One main advantage of this approach is the ability to disentangle errors associated with inaccuracies of remote sensing products (e.g., PP, Chl, and SST) and errors associated with the model used to estimate EP. Their intention was not to conduct a definitive comparison of competing satellite algorithms, but rather to begin a process that assess and hopefully improves the different assumptions and parameterizations in current satellite algorithms, especially Siegel et al. (2014).
Satellite algorithms for EP are generally designed to predict export at either Zeu or 100 meters. While the observations used by Stukel et al. (2015) were within 30 m of Zeu, they scaled all data to Zeu using the ambient PAR at the depth of sampling. All EP algorithms were evaluated using in-situ input properties (e.g., SST, Chl, PP) as the goal was not to assess the corresponding satellite products. All water column rates and standing stock measurements were depth integrated, except when models made explicit reference to sea surface values, for methodological reasons. Stukel et al. (2015) noted that Dunne et al. (2005) and Laws et al. (2011) are parametrized to predict total EP including active transport by diel vertically migrating organisms and passive export of DOC, leading to a positive bias since sediment traps and 234Th only measure POC fluxes. Stukel et al. (2013) estimated that the active transport by diel migration is about 19% of the total sinking flux in the CCE region, providing a lower constraint on this bias.
Figure 7 shows the resulting comparisons between satellite algorithms and in-situ measurements. At a first look, it seems that no algorithm performed significantly better or worse than any other. Dunne et al. (2005) and Siegel et al. (2014) had R2 coefficients of determination of 0.37, whereas the R2 for Henson et al. (2011) and Laws et al. (2011) were 0.27. Stukel et al. (2015) re-parameterized Siegel et al. (2014) using their in-situ observations and improved the R2 to 0.38. It should be noted that all algorithms have been developed and parameterized to function in a global setting in all physical, chemical, and biological settings. This study Stukel et al. (2015) performed a comparison in one specific region with a small subset of ecosystem dynamics and conditions.
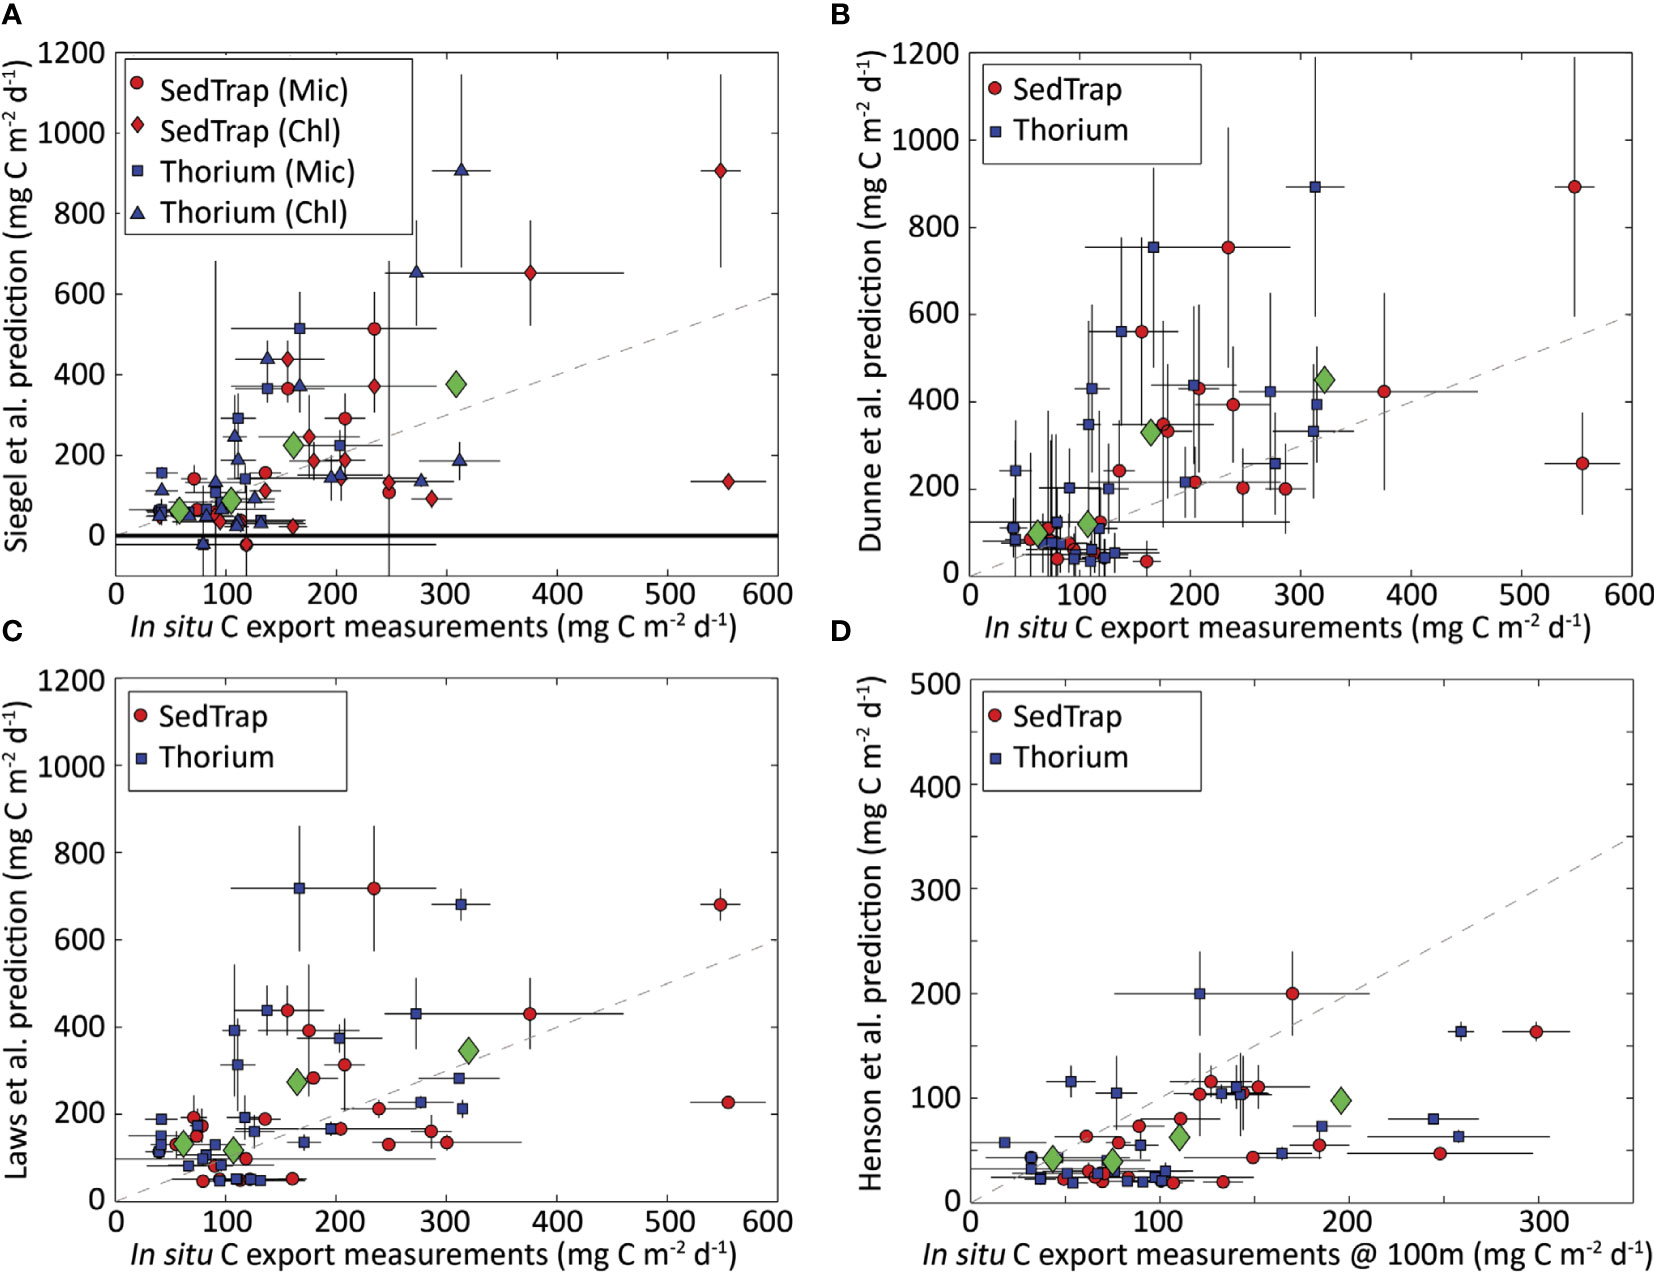
Figure 7 Comparison between satellite algorithms and in-situ measurements by Stukel et al. (2015). (A) Siegel et al. (2014) vs sediment-trap-(circles and diamonds) and 234Th-derived (squares and triangles) measurements. Circles and squares are based on results using microscopy to determine the fraction of microphytoplankton. (B–D) Dunne et al. (2005); Laws et al. (2011), and Henson et al. (2011) algorithms, respectively, with circles showing sediment trap data and squares showing 234Th data. All panels show export normalized to the base of the Zeu, except panel D, which shows export at 100m. Green diamonds show arithmetic mean of predicted and measured export for each quartile of the measurements (35-85, 85-125, 125-205, and 205-560 mg C m-2 d-1 for base of Zeu; 18-65, 65-89, 89-140, and 140-300 mg C m-2 d-1 for 100m). Dashed lines depict a 1:1 relationship. Error bars show one standard error (for in-situ measurements) and propagation of measurement standard error through satellite algorithms (for predictions). Image from Stukel et al. (2015).
Puigcorbe et al. (2017) compared Dunne et al. (2005); Laws et al. (2011), and Henson et al. (2011) using PP estimates from three different satellite-derived primary production models and a regional dataset of POC fluxes based on 234Th from the North Western Atlantic Ocean. They found that Dunne et al. (2005) and Laws et al. (2011) were closest to the observations but showed a 3-fold difference and no clear trends. Henson et al. (2011) consistently provided lower export estimates than the observations. Their explanation is that a stronger dependency on temperature by Henson et al. (2011) leads to low export fluxes (¡ 2 mmol C m−2 d −1) throughout the study area. They also observe a significant overestimation of EP by Dunne et al. (2005) in their equatorial domain and that Laws et al. (2011) seems to underestimate EP both in the northern half of their oligotrophic domain and at several riverine stations.
5 Evaluating the different EP models using three in situ databases
The evaluations described so far are all promoting a new algorithm (Dunne et al., 2005; Li and Cassar, 2016) or re-parameterizing an existing algorithm (Stukel et al., 2015). While the different approaches are thorough and the results consistent between the three studies, we believe it worthwhile to evaluate the different algorithms from a neutral starting point. For this, we use the published dataset of POC fluxes by Dunne et al. (2005); Mouw et al. (2016a); Mouw et al. (2016b), and Bisson et al. (2018). We matched the Mouw et al. (2016a); Mouw et al. (2016b) and Bisson et al. (2018) data with monthly satellite-derived SST from the Group for High Resolution Sea Surface Temperature/Operational Sea Surface Temperature and Ice Analysis (UKMO, 2005, GHRSST/OSTIA), Chl and Kd490 from Ocean Colour Climate Change Initiative (Sathyendranath, 2021, OC-CCI), and PP from the Biological Pump and Carbon Exchange Processes project (Kulk et al., 2021, BICEP). It should be noted that different satellite-based PP products vary considerably (Bisson et al., 2018; Siegel et al., 2022), which can affect the calculated EP estimates Bisson et al. (2018). We found, however, that different PP products had only a limited influence on the skill of the EP algorithms evaluated in this study and we therefore chose to only present results based on one PP product.
We begin by calculating global EP flux estimates averaged over the years 1998–2020 for all algorithms using the earlier mentions satellite-derived products (all values presented in Table 3). The flux estimates are between 1 and 140 Gt C y−1, a much larger range of uncertainty than normally presented for EP. If only algorithms with one of the top three skills scores in any of our evaluations (red colors in Tables 3, 4, 5) are included, the range is 1–9 Gt C y−1, This result is more in line with earlier published estimates (Dunne et al., 2007; Henson et al., 2011; Laws et al., 2011; Siegel et al., 2016; Siegel et al., 2022).
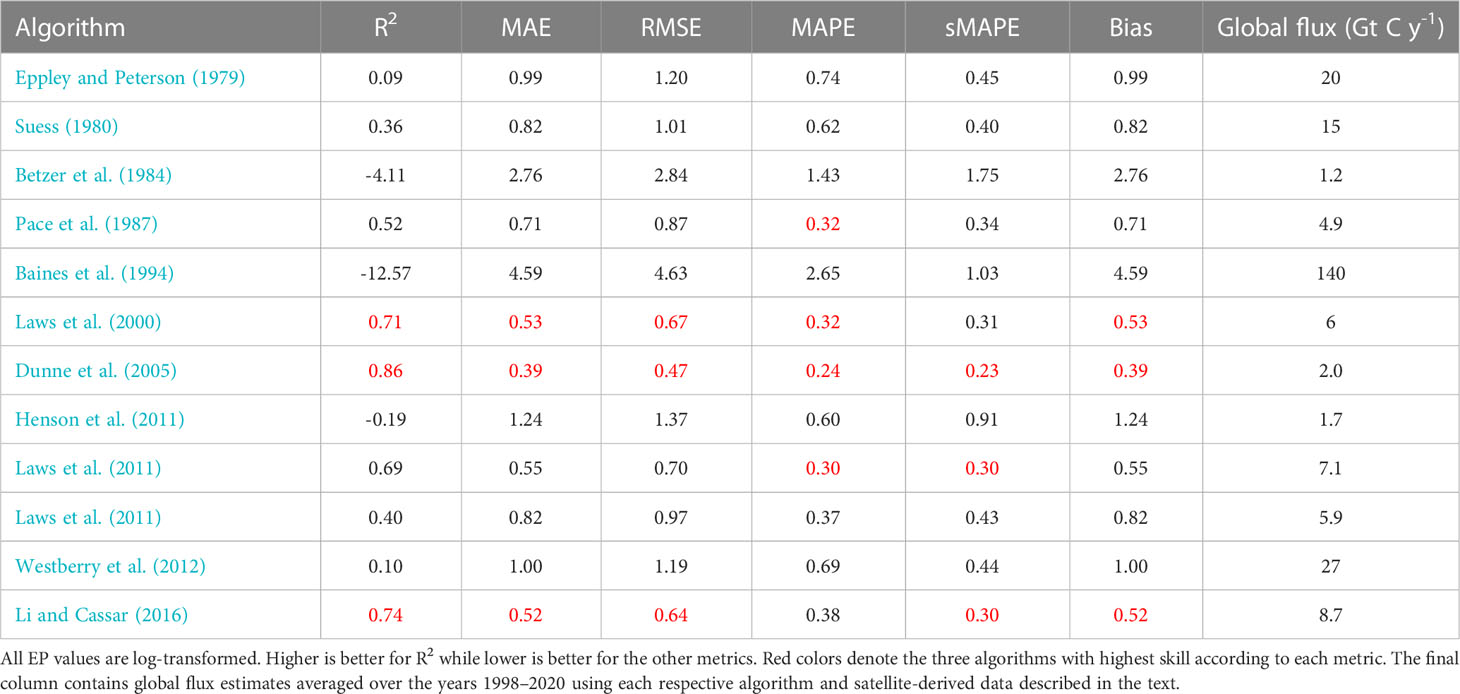
Table 3 Performance metrics for different export production models evaluated using the Dunne et al. (2005) dataset.
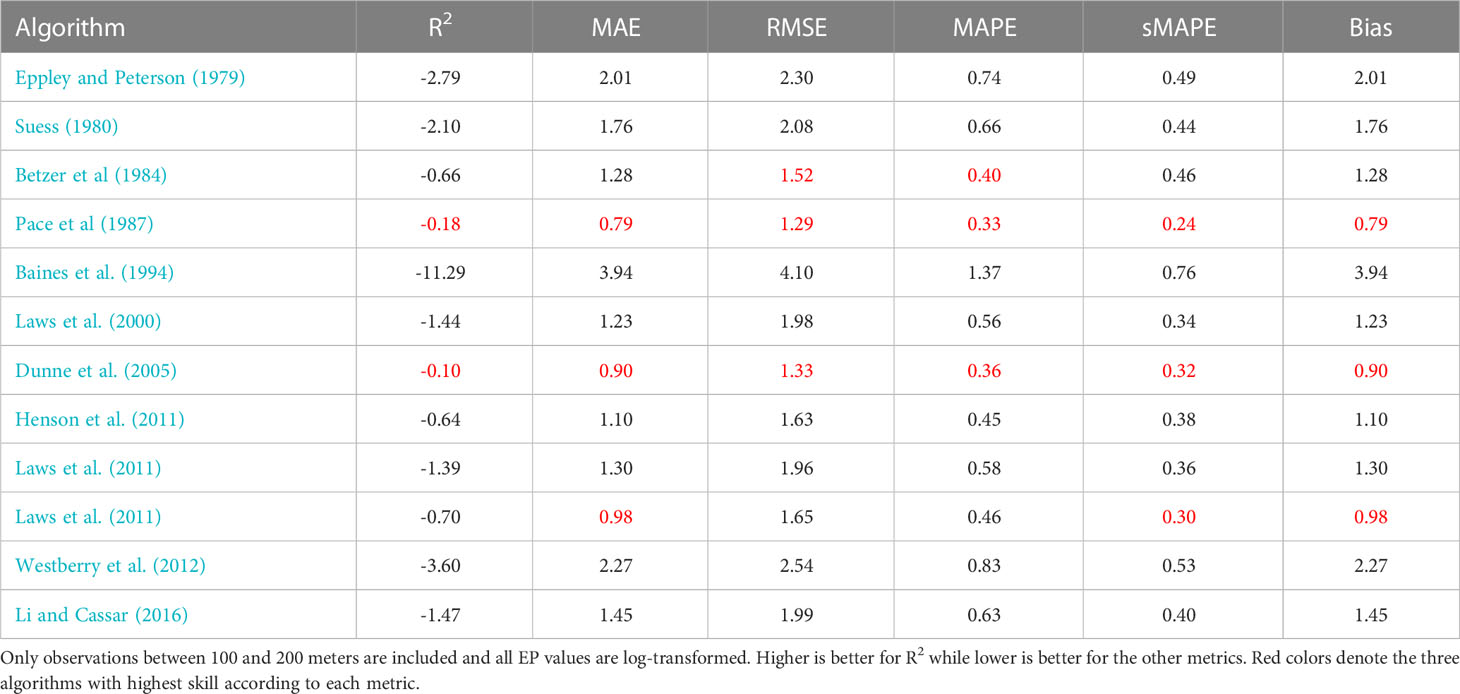
Table 4 Performance metrics for different export production models evaluated using the Mouw et al. (2016a); Mouw et al. (2016b) dataset.
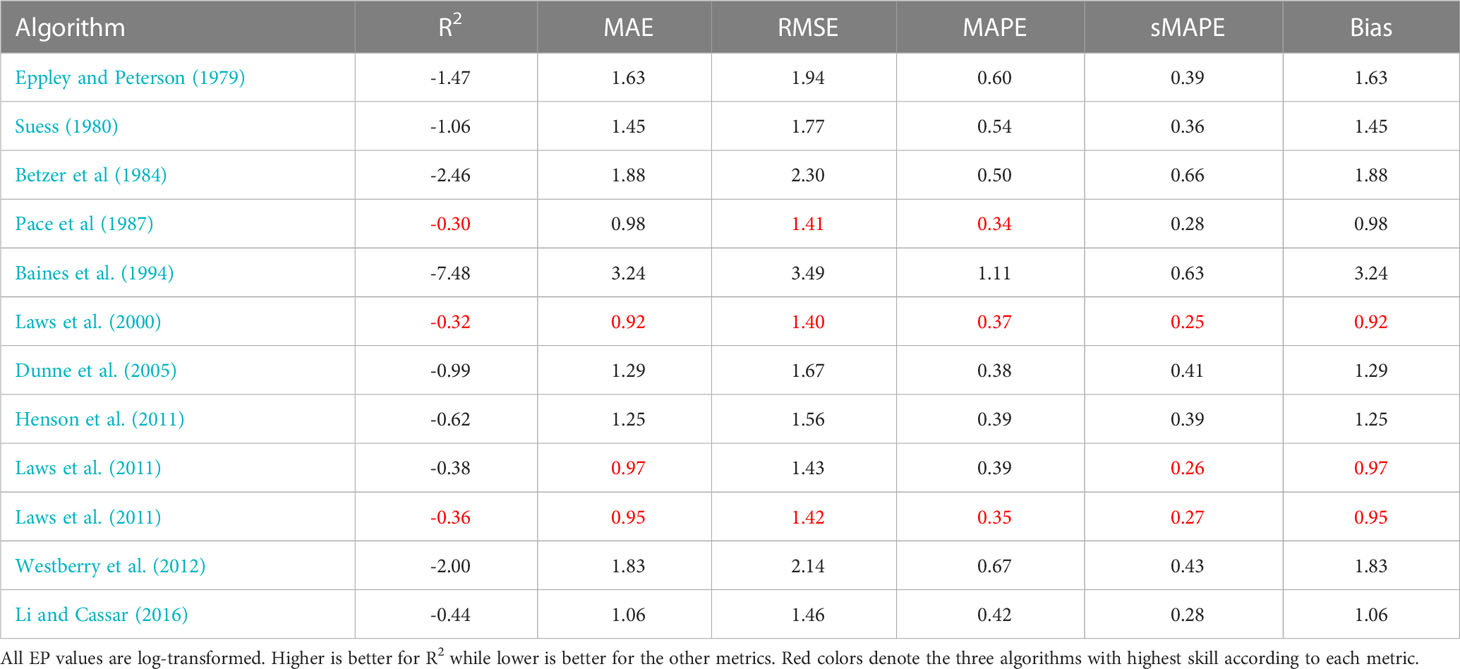
Table 5 Performance metrics for different Export Production models evaluated using the Bisson et al. (2018) dataset.
Dunne et al. (2005) does not report any information about sampling dates, which means that we are not able to match satellite-derived properties to the dataset. Instead, we rely on properties included in the dataset (n=125), all which we believe to be based on in-situ observations. There is 487 satellite matchups for Mouw et al. (2016b) observations between 100 and 200 meter, and 1,058 matchups for Bisson et al. (2018). All observations used in the comparisons are shown in Figure 3. The three datasets covers similar regions, but do not necessarily include the same observations. This is to be expected since our use of the Mouw et al. (2016b) and Bisson et al. (2018) datasets are limited to the time of ocean color satellite coverage (1998 to present) whereas the Dunne et al. (2005) dataset has a cutoff some years before publication. Bisson et al. (2018) have several long transects included that are not part of Mouw et al. (2016b).
When visually comparing in-situ POC fluxes with predicted EP calculated using the Dunne et al. (2005); Laws et al. (2000), and Li and Cassar (2016) algorithms (Figures 8–10) we see similar patterns. Comparing the Dunne et al. (2005) algorithm in its corresponding in-situ dataset results, as expected, in the same correlation as reported by the paper. A more interesting finding is that the two other algorithms have similarly good skill in predicting EP. The main exception is a slight offset from the 1:1 line by Li and Cassar (2016). When using in-situ POC flux from Mouw et al. (2016b) dataset together with matched satellite properties, we see quite different results where neither observations from deep waters (purple markers) nor data from shallow water at less than 200 m depth (blue markers) are predicted particularly well. The main issue seems to be that low observed values are not predicted as low values by the algorithm, which results in EP being significantly overestimated compared to observations. Here, the relationship between POC flux and EP based on the Dunne et al. (2005) dataset could arguably act as an upper constraint when applying the algorithms to the Mouw et al. (2016b) dataset. We find a less coherent pattern when in-situ POC flux from Bisson et al. (2018) is plotted against EP from the three algorithms. The distribution of values in Bisson et al. (2018) is trending higher than Mouw et al. (2016b), but EP predicted by Dunne et al. (2005) falls within the same range for both in-situ datasets, leading to a notable underestimation by the algorithm. This pattern can be found for Li and Cassar (2016), but is less pronounced, whereas Laws et al. (2000) generates EP predictions that are quite symmetrically distributed around the 1:1 line. Figures for the other algorithms can be found in the Supplementary Materials.
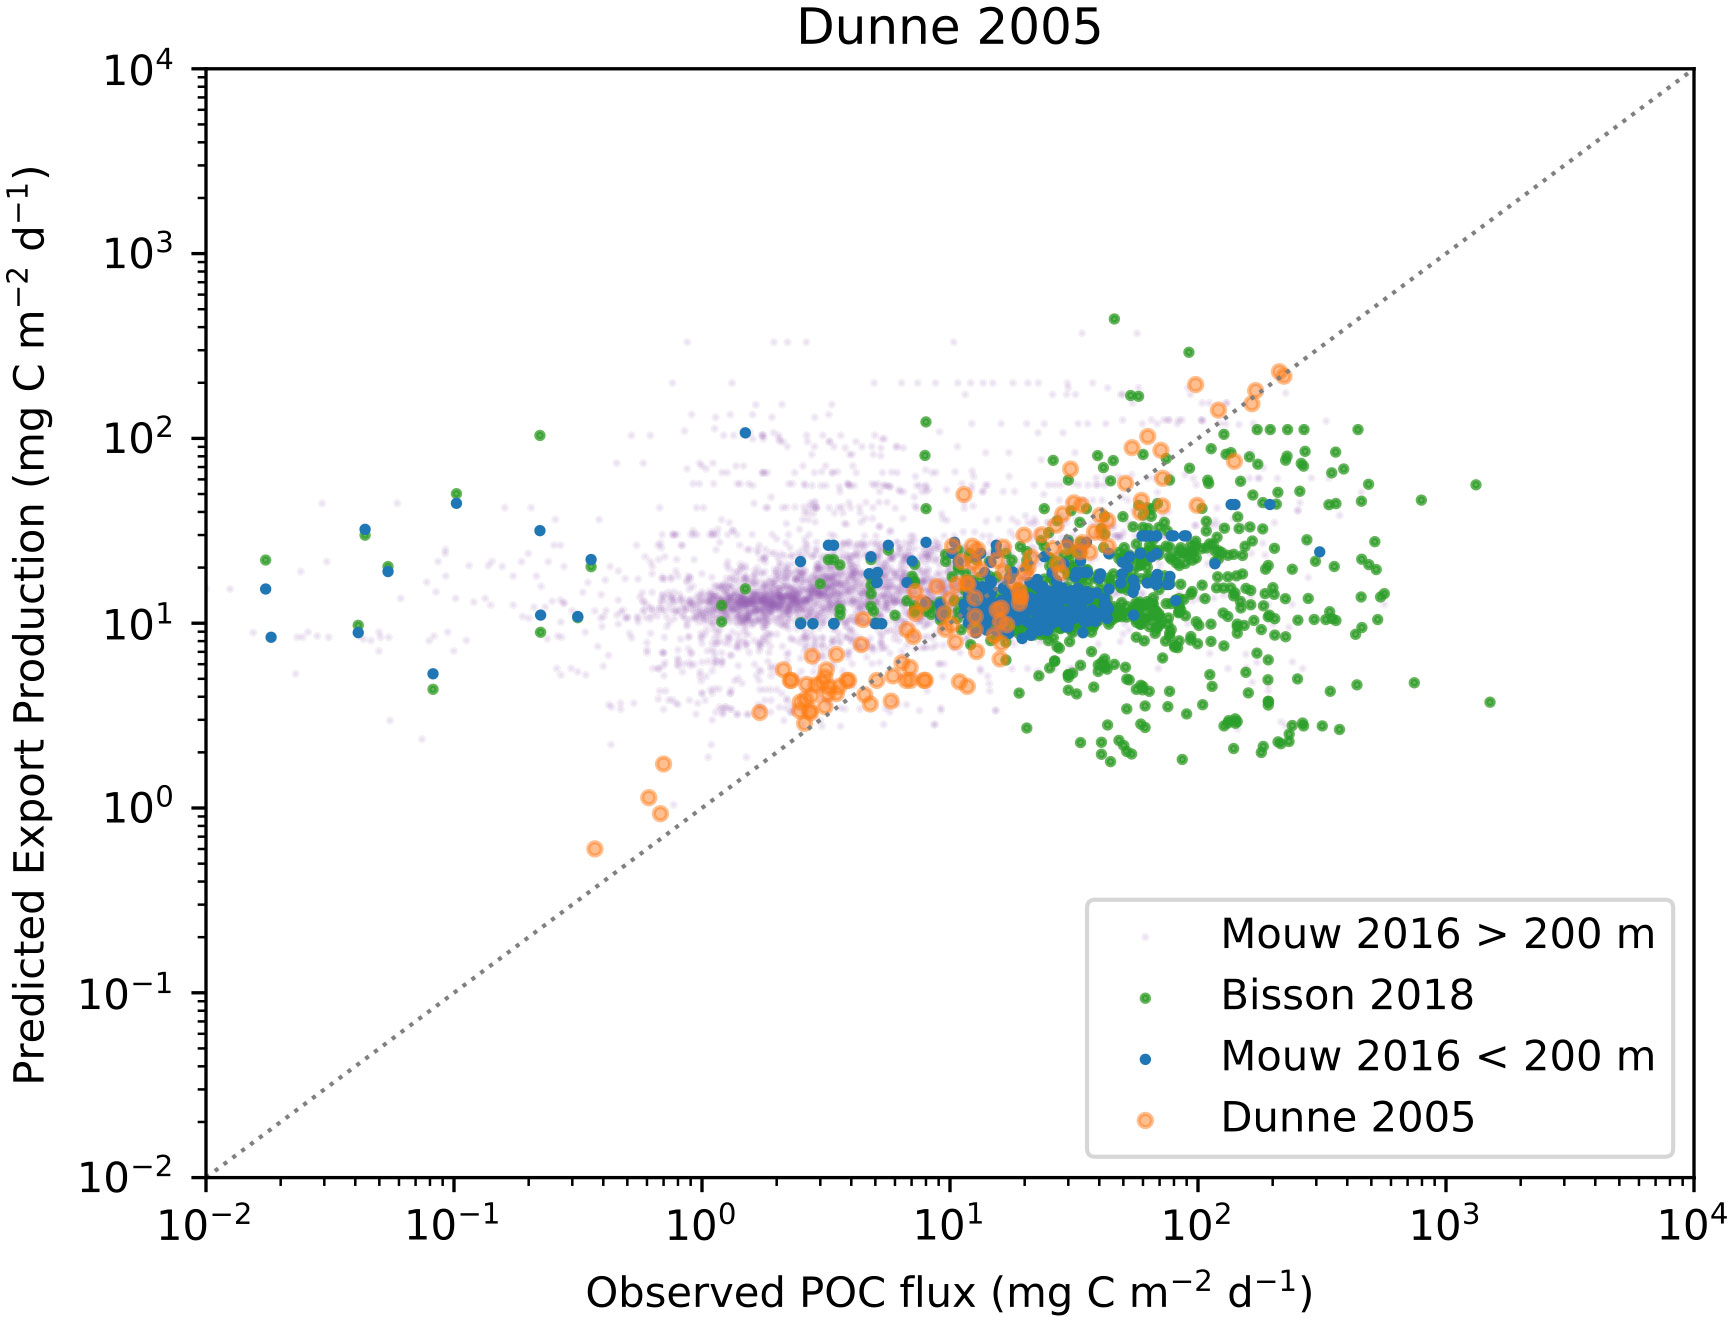
Figure 8 Observed POC flux and EP calculated using the Dunne et al. (2005) algorithm. In-situ observations are from Dunne et al. (2005), orange markers) Mouw et al. (2016a); Mouw et al. (2016b), (blue markers for observations shallower than 200 meters and purple for observations deeper than 200 meters), and Bisson et al. (2018), (green markers).
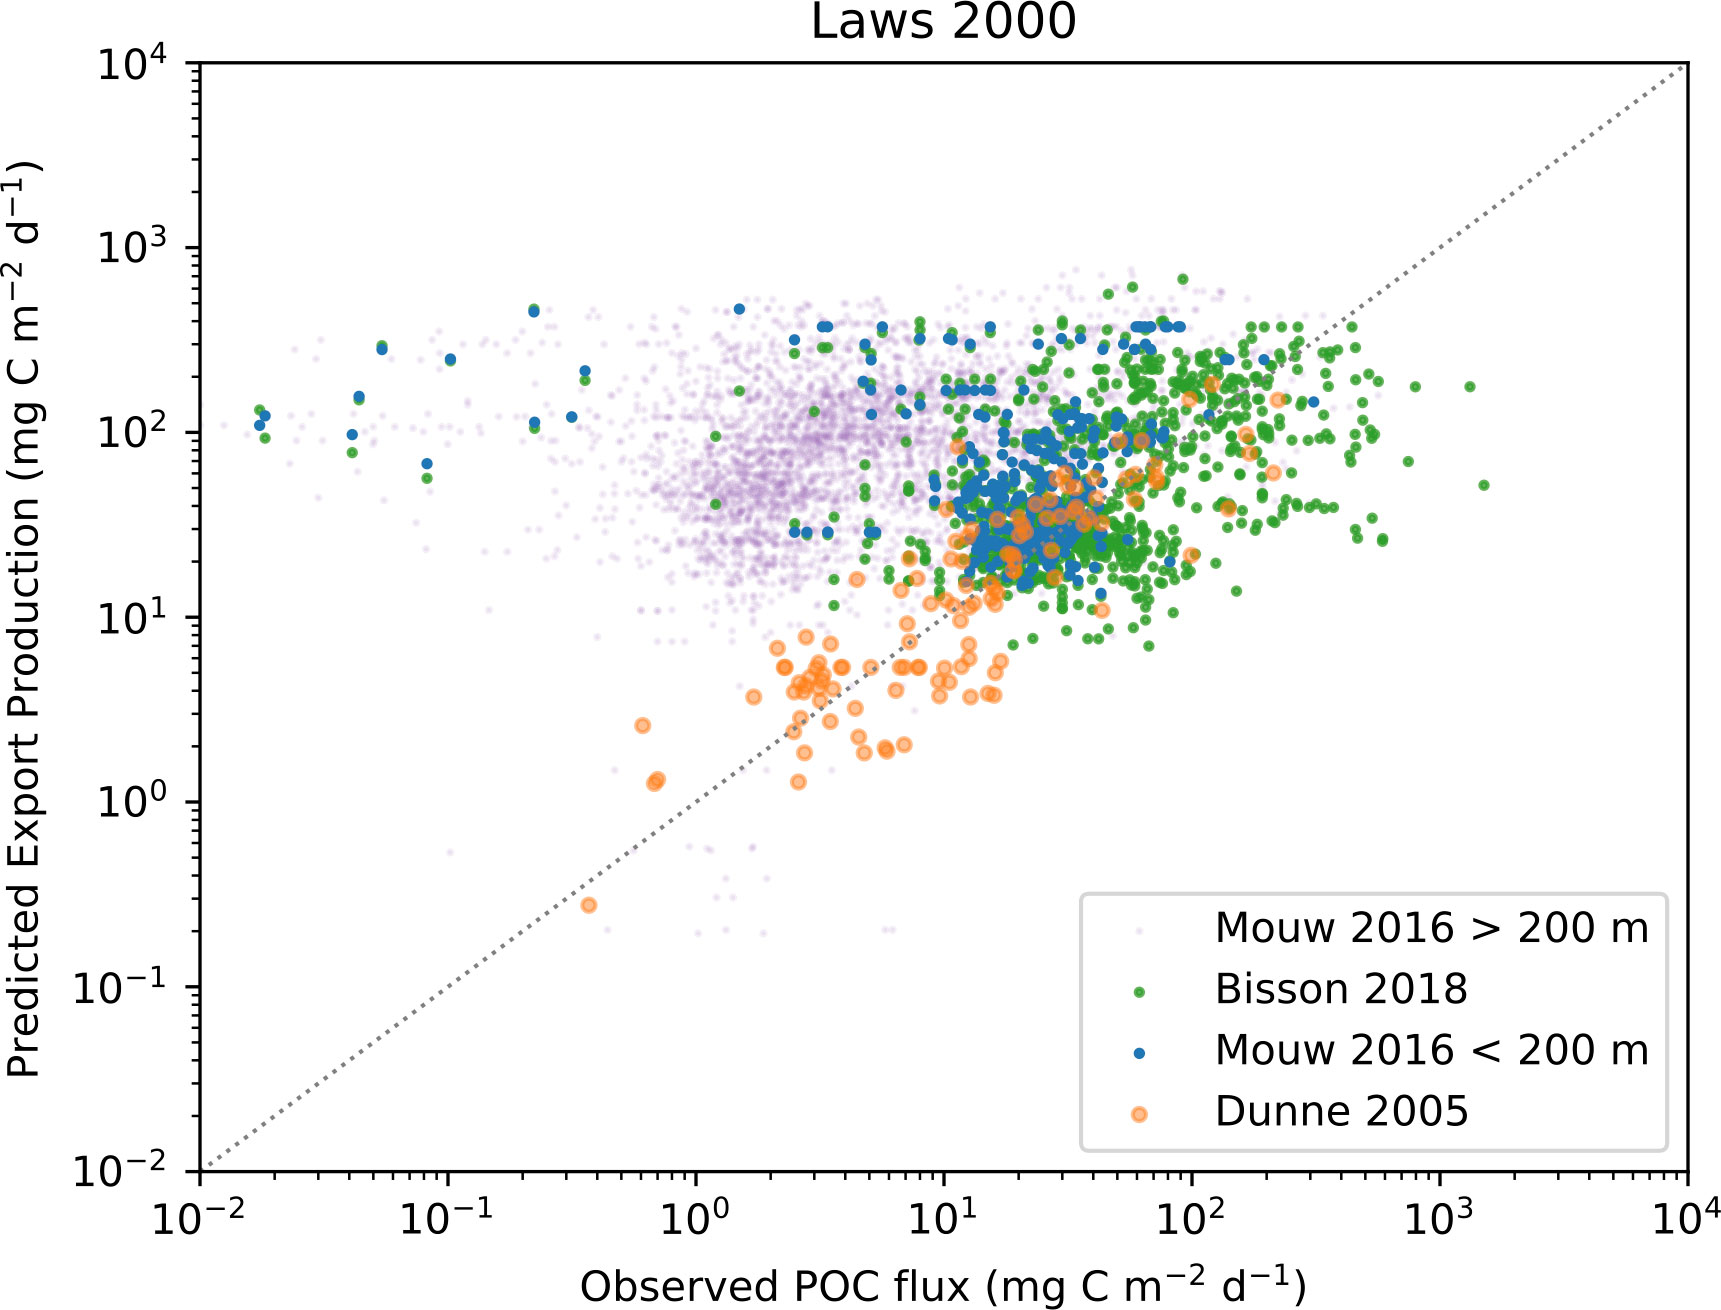
Figure 9 Observed POC flux and EP calculated using the Laws et al. (2000) algorithm. In-situ observations are from Dunne et al. (2005), (orange markers) Mouw et al. (2016a); Mouw et al. (2016b), (blue markers for observations shallower than 200 meters and purple for observations deeper than 200 meters), and Bisson et al. (2018), (green markers).
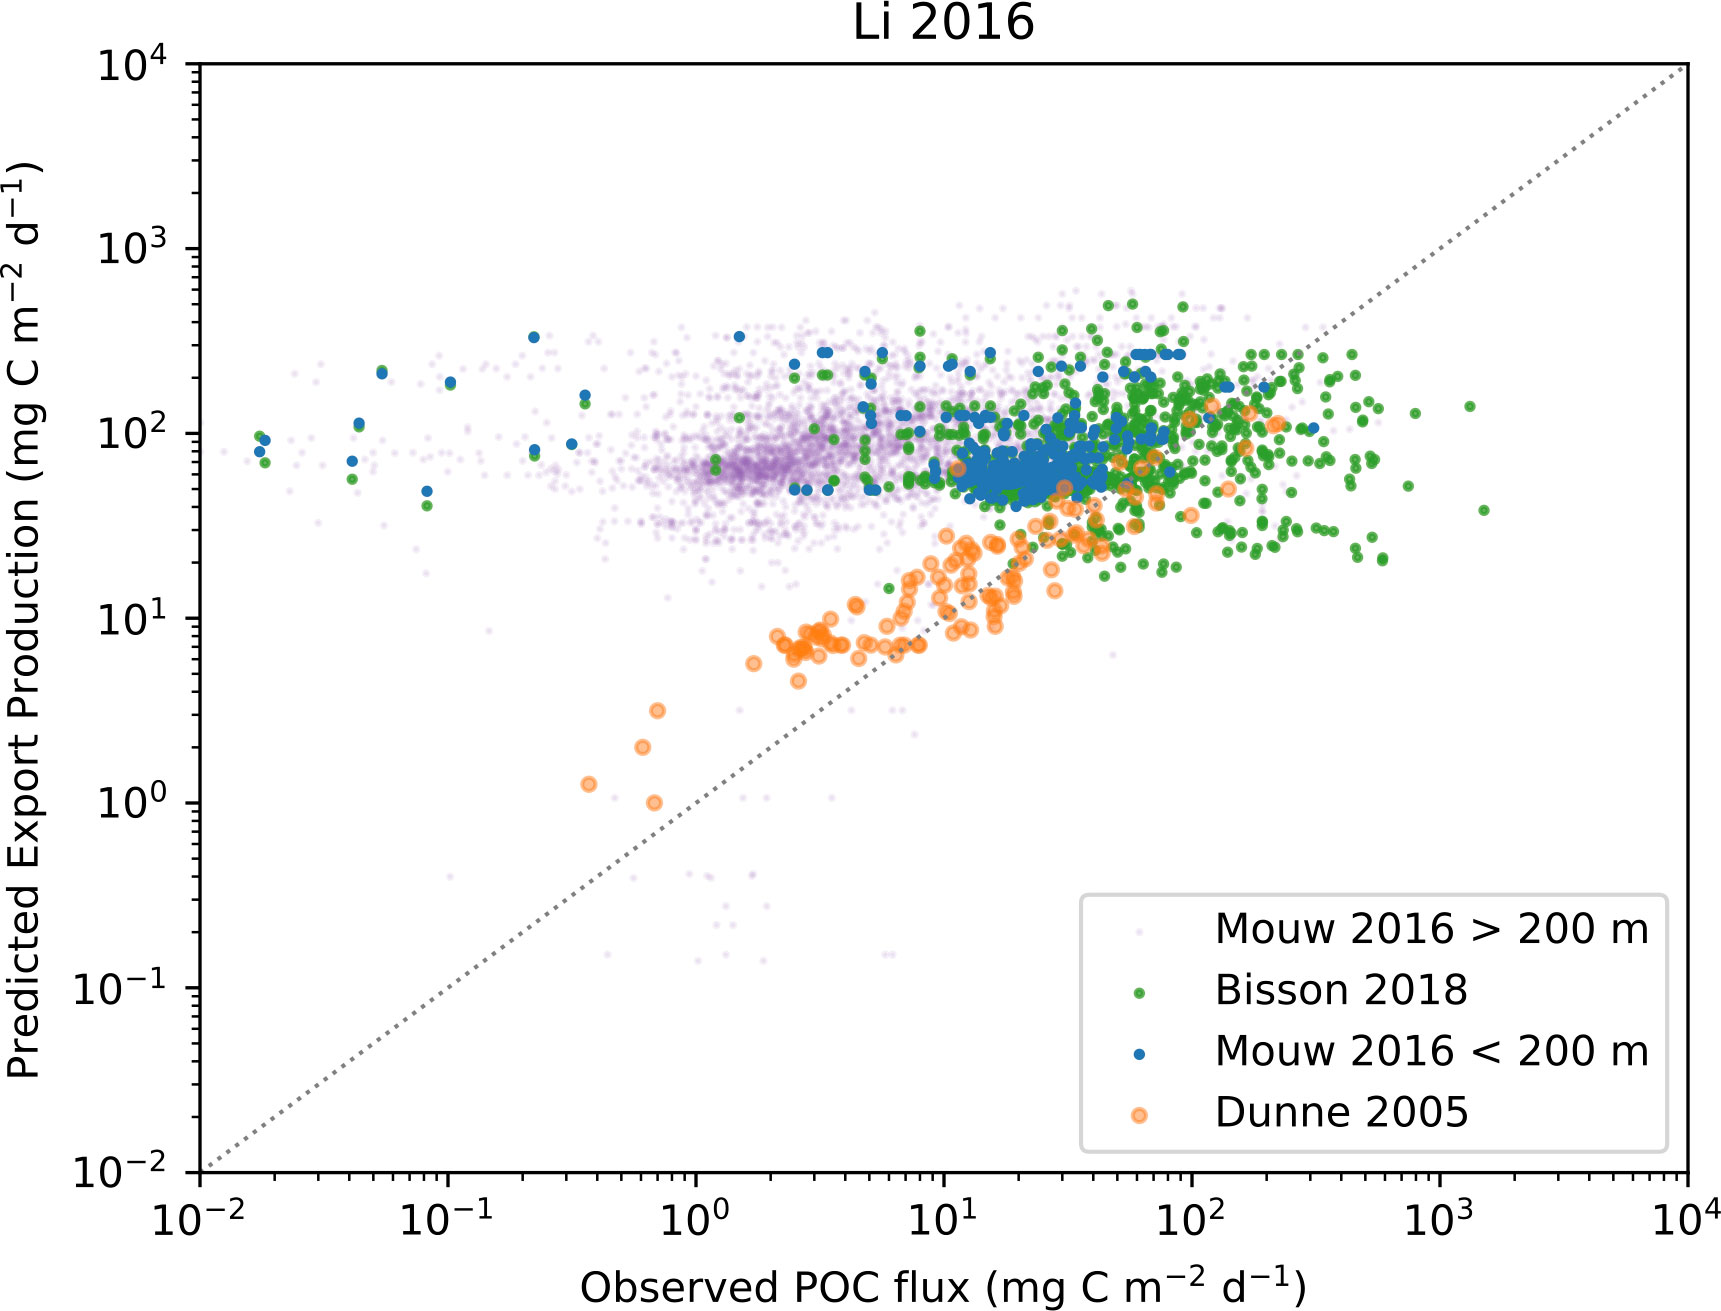
Figure 10 Observed POC flux and EP calculated using the Li and Cassar (2016) algorithm. In-situ observations are from Dunne et al. (2005), (orange markers) Mouw et al. (2016a); Mouw et al. (2016b), (blue markers for observations shallower than 200 meters and purple for observations deeper than 200 meters), and Bisson et al. (2018), (green markers).
Finally, we compare log transformed predictions of EP from the different satellite-based models to in-situ observations of POC flux using a number of metrics: coefficient of determination (R2, Wright, 1921), Mean Absolute Error (MAE, Chicco et al., 2021), Root Mean Square Error (RMSE, Nevitt and Hancock, 2000), Mean Absolute Percent Error (MAPE, Myttenaere et al., 2016), symmetric Mean Absolute Percentage Error (sMAPE Makridakis, 1993), and Bias. Please see Chicco et al. (2021) and Seegers et al. (2018) for a more detailed discussion about each metric and their utility. All values are presented in Tables 3–5. We find that most models have limited to very limited skill when evaluated with R2 against the Mouw et al. (2016b) or Bisson et al. (2018) datasets, whereas several models perform better with Dunne et al. (2005); Li and Cassar (2016), and Laws et al. (2000) at the top, when comparing predicted EP to in-situ POC fluxes in Dunne et al. (2005) dataset using in-situ properties only. These results are in accordance with the earlier presented visual comparisons. The other metrics show similar patterns.
6 Discussion and conclusions
The EP algorithms described here assume different definitions of export efficiency, are based on different products for deriving PP from satellite products (who themselves have different assumptions about PP), and are developed using different in-situ datasets. Still, the skill of predicting export production is surprisingly similar among the different algorithms. Both the Dunne et al. (2005) and Li and Cassar (2016) algorithm evaluations showed that their own model provides the best results, which is not too surprising since they were developed using the evaluation data. The advantage is, however, modest for Dunne et al. (2005) and insignificant for Li and Cassar (2016). The Stukel et al. (2015) evaluation used a Lagrangian in-situ dataset collected with the Siegel et al. (2014) algorithm in mind and performed a re-parameterization of said algorithm, but only achieved a modest improvement in skill measured as R2. The authors argued that other statistical methods are more useful to evaluate EP algorithms and Siegel et al. (2014) showed a larger improvement by those metrics.
There is only a slight correlation between how complex an algorithm is and how well it performs. Siegel et al. (2014) is arguably the most complex approach and showed good results in the Stukel et al. (2015) study, but was performing rather poorly in Li and Cassar (2016). The simplest approach is by Eppley and Peterson (1979), which is the only algorithm evaluated that uses PP as the sole independent input feature. It performed worse than other algorithms in Dunne et al. (2005) but reasonably well in Li and Cassar (2016). This might suggest that SST is a more important factor when estimating carbon fluxes at depth than EP from the euphotic zone.
We find that using the Mouw et al. (2016b) dataset together with satellite-derived properties provide a poor correlation between observed POC flux and predicted EP for the Dunne et al. (2005) algorithm, the reason for this is not entirely clear. Some possible explanations are problems with the satellite-derived products used or differences in how the Dunne et al. (2005) and Mouw et al. (2016b) datasets represent the global ocean. Another possible reason is (we assume) that all properties used in the Dunne et al. (2005) dataset are specifically sampled in connection to the POC flux observations. One could expect a better connection between surface processes and thermocline fluxes when observed over appropriate temporal and spatial scales. This suggestion would also explain the good correlations found by Stukel et al. (2015) and Li and Cassar (2016), the latter by not relying of thermocline fluxes in the evaluation.
A future step to better understand the contrasting results seen in this study is to re-evaluate all models with all available datasets. It is a reasonable assumption that empirical relationships between available satellite-derived products and EP differ significantly between different regions of the ocean (Sathyendranath et al., 1991; Stukel et al., 2015; Britten and Primeau, 2016; Li and Cassar, 2016). Recent syntheses of in-situ observations within the BICEP and EXPORTS projects have created the potential to re-parametrize existing algorithms and to perform new regression analyses on regional scales. An alternative promising approach to estimate EP from space is to use satellite-derived properties for data assimilation in biogeochemical models. Two recent examples are studies by DeVries and Weber (2017) and Nowicki et al. (2022) where they quantify the biological pump by using satellite and oceanographic tracer observations to constrain rates and patterns of organic matter production, export, and remineralization in an inverse model framework.
Author contributions
BJ: Conceptualization, design of the work, literature review, draft, and revision of the text. GK: Conceptualization and revision of the text. SS: Funding and conceptualization. All authors contributed to the article and approved the submitted version.
Funding
Funding for this work was provided by the European Space Agency project "Biological Pump and Carbon Exchange Processes (BICEP)" and by the Simons Collaboration on Computational Biogeochemical Modeling of Marine Ecosystems (CBIOMES) (549947 SS). Additional support from the National Centre for Earth Observations of the UK is acknowledged.
Conflict of interest
The authors declare that the research was conducted in the absence of any commercial or financial relationships that could be construed as a potential conflict of interest.
Publisher’s note
All claims expressed in this article are solely those of the authors and do not necessarily represent those of their affiliated organizations, or those of the publisher, the editors and the reviewers. Any product that may be evaluated in this article, or claim that may be made by its manufacturer, is not guaranteed or endorsed by the publisher.
Supplementary material
The Supplementary Material for this article can be found online at: https://www.frontiersin.org/articles/10.3389/fmars.2023.1149938/full#supplementary-material
References
Antoine D., Andre J.-M., Morel A. (1996). Oceanic primary production: 2. estimation at global scale from satellite (coastal zone color scanner) chlorophyll. Global Biogeochemical Cycles 10, 57–69. doi: 10.1029/95GB02832
Arrigo K. R., Worthen D., Schnell A., Lizotte M. (1998). Primary production in southern ocean waters. J. Of Geophysical Research-Oceans 103, 15587–15600. doi: 10.1029/98JC00930
Baines S. B., Pace M. L., Karl D. M. (1994). Why does the relationship between sinking flux and planktonic primary production differ between lakes and oceans? Limnology Oceanography 39, 213–226. doi: 10.4319/lo.1994.39.2.0213
Balch W. M., Carranza M., Cetinic I., Chaves J., Duhamel S., Fassbender A., et al. (2022). Ioccg ocean optics and biogeochemistry protocols for satellite ocean colour sensor validation volume 7.0. aquatic primary productivity field protocols for satellite validation and model synthesis. Dartmouth, NS, Canada: International Ocean Colour Coordinating Group (IOCCG), Vol. volume 7.0. doi: 10.25607/OBP-1835
Behrenfeld M. J., Falkowski P. G. (1997). A consumer’s guide to phytoplankton primary productivity models. Limnology And Oceanography 42, 1479–1491. doi: 10.4319/lo.1997.42.7.1479
Bender M. L., Grande K., Johnson K. S., Marra J., Williams P. J. L. B., Sieburth J., et al. (1987). A comparison of 4 methods for determining planktonic community production. Limnology And Oceanography 32, 1085–1098. doi: 10.4319/lo.1987.32.5.1085
Betzer P. R., Showers W. J., Laws E. A., Winn C. D., DiTullio G. R., Kroopnick P. M. (1984). Primary productivity and particle fluxes on a transect of the equator at 153 ° w in the pacific ocean. Deep Sea Research Part A. Oceanographic Res. Papers 31, 1–11. doi: 10.1016/0198-0149(84)90068-2
Bisson K. M., Siegel D. A., DeVries T., Cael B. B., Buesseler K. O. (2018). How data set characteristics influence ocean carbon export models. Global Biogeochemical Cycles 32, 1312–1328. doi: 10.1029/2018gb005934
Britten G. L., Primeau F. W. (2016). Biome-specific scaling of ocean productivity, temperature, and carbon export efficiency. Geophysical Res. Lett. 43, 5210–5216. doi: 10.1002/2016gl068778
Buesseler K. O. (1998). The decoupling of production and particulate export in the surface ocean. Global Biogeochemical Cycles 12, 297–310. doi: 10.1029/97GB03366
Buesseler K. O., Antia A. N., Chen M., Fowler S. W., Gardner W. D., Gustafsson O., et al. (2007). An assessment of the use of sediment traps for estimating upper ocean particle fluxes. J. Mar. Res. 65, 345–416. doi: 10.1357/002224007781567621
Buesseler K., Benitez-Nelson C., Moran S., Burd A., Charette M., Cochran J., et al. (2006). An assessment of particulate organic carbon to thorium-234 ratios in the ocean and their impact on the application of 234th as a poc flux proxy. Mar. Chem. 100, 213–233. doi: 10.1016/j.marchem.2005.10.013
Burd A. B., Hansell D. A., Steinberg D. K., Anderson T. R., Arístegui J., Baltar F., et al. (2010). Assessing the apparent imbalance between geochemical and biochemical indicators of meso- and bathypelagic biological activity: What the heck is wrong with present calculations of carbon budgets? Deep Sea Res. Part II: Topical Stud. Oceanography 57, 1557–1571. doi: 10.1016/j.dsr2.2010.02.022
Cassar N., Barnett B. A., Bender M. L., Kaiser J., Hamme R. C., Tilbrook B. (2009). Continuous high-frequency dissolved o2/ar measurements by equilibrator inlet mass spectrometry. Analytical Chem. 81, 1855–1864. doi: 10.1021/ac802300u
Ceballos-Romero E., Buesseler K. O., Villa-Alfageme M. (2022). Revisiting five decades of 234th data: a comprehensive global oceanic compilation. Earth System Sci. Data 14, 2639–2679. doi: 10.5194/essd-14-2639-2022
Chavez F. P., Messie M., Pennington J. T. (2011). Marine primary production in relation to climate variability and change. Annu. Rev. Mar. Sci. 3, 227–260. doi: 10.1146/annurev.marine.010908.163917
Chicco D., Warrens M. J., Jurman G. (2021). The coefficient of determination r-squared is more informative than smape, mae, mape, mse and rmse in regression analysis evaluation. PeerJ Comput. Sci. 7, e623. doi: 10.7717/peerj-cs.623
Craig H. C., Hayward T. (1987). Oxygen supersaturation in the ocean - biological versus physical contributions. Science 235, 199–202. doi: 10.1126/science.235.4785.199
Cullen J. J. (2001). “Primary production methods,” in Encyclopedia of Ocean Sciences (Cambridge, Massachusetts: Elsevier), 2277–2284. doi: 10.1006/rwos.2001.0203
DeVries T., Weber T. (2017). The export and fate of organic matter in the ocean: New constraints from combining satellite and oceanographic tracer observations. Global Biogeochemical Cycles 31, 535–555. doi: 10.1002/2016gb005551
Dore J. E., Karl D. M. (1996). Nitrification in the euphotic zone as a source for nitrite, nitrate, and nitrous oxide at station aloha. Limnology Oceanography 41, 1619–1628. doi: 10.4319/lo.1996.41.8.1619
Duarte C. M., Regaudie-De-Gioux A., Arrieta J. M., Delgado-Huertas A., Agusti S. (2013). The oligotrophic ocean is heterotrophic. Ann Rev Mar Sci 5, 551–569. doi: 10.1146/annurev-marine-121211-172337
Dugdale R. C., Goering J. J. (1967). Uptake of new and regenerated forms of nitrogen in primary productivity. Limnology Oceanography 12, 196–206. doi: 10.4319/lo.1967.12.2.0196
Dunne J. P., Armstrong R. A., Gnanadesikan A., Sarmiento J. L. (2005). Empirical and mechanistic models for the particle export ratio. Global Biogeochemical Cycles 19, n/a–n/a. doi: 10.1029/2004gb002390
Dunne J. P., Sarmiento J. L., Gnanadesikan A. (2007). A synthesis of global particle export from the surface ocean and cycling through the ocean interior and on the seafloor. Global Biogeochemical Cycles 21, GB4006. doi: 10.1029/2006GB002907
Eppley R. W., Peterson B. J. (1979). Particulate organic matter flux and planktonic new production in the deep ocean. Nature 282, 677–680. doi: 10.1038/282677a0
Eppley R. W., Stewart E., Abbott M. R., Heyman U. (1985). Estimating ocean primary production from satellite chlorophyll. Introduction to regional differences and statistics for the Southern California Bight. J. Of Plankton Res. 7, 57–70. doi: 10.1093/plankt/7.1.57
Falkowski P. G., Barber R. T., Smetacek V. (1998). Biogeochemical controls and feedbacks on ocean primary production. Science 281, 200–206. doi: 10.1126/science.281.5374.200
Fasham M. J. R. (Ed.) (2003). “Ocean biogeochemistry,” in The Role of the Ocean Carbon Cycle in Global Change (Berlin, Heidelberg: Springer Berlin Heidelberg). doi: 10.1007/978-3-642-55844-3
Friedrichs M. A. M., Carr M.-E., Barber R. T., Scardi M., Antoine D., Armstrong R. A., et al. (2009). Assessing the uncertainties of model estimates of primary productivity in the tropical Pacific Ocean. J. Mar. Syst. 76, 113–133. doi: 10.1016/j.jmarsys.2008.05.010
Geider R. J., MacIntyre H., Kana T. M. (1998). A dynamic regulatory model of phytoplanktonic acclimation to light, nutrients, and temperature. Limnology And Oceanography 43, 679–694. doi: 10.4319/lo.1998.43.4.0679
Groom S., Sathyendranath S., Ban Y., Bernard S., Brewin R., Brotas V., et al. (2019). Satellite ocean colour: Current status and future perspective. Front. Mar. Sci. 6. doi: 10.3389/fmars.2019.00485
Henson S. A., Sanders R., Madsen E., Morris P. J., Moigne F. L., Quartly G. D. (2011). A reduced estimate of the strength of the ocean’s biological carbon pump. Geophysical Res. Lett. 38, n/a–n/a. doi: 10.1029/2011gl046735
Honjo S., Manganini S. J., Krishfield R. A., Francois R. (2008). Particulate organic carbon fluxes to the ocean interior and factors controlling the biological pump: A synthesis of global sediment trap programs since 1983. Prog. Oceanography 76, 217–285. doi: 10.1016/j.pocean.2007.11.003
Jonsson B. F., Dunne J. P., Bender M. L. (2013). Evaluation of the Southern Ocean O 2/Ar-based NCP estimates in a model framework. J. Of Geophysical Research-Biogeosciences 118, 385–399. doi: 10.1002/jgrg.20032
Kahru M., Mitchell B. G. (2010). Blending of ocean colour algorithms applied to the Southern Ocean. Remote Sens. Lett. 1, 119–124. doi: 10.1080/01431160903547940
Khan K. S., Kunz R., Kleijnen J., Antes G. (2003). Five steps to conducting a systematic review. J. R. Soc. Med. 96, 118–121. doi: 10.1177/014107680309600304
Kulk G., Platt T., Dingle J., Jackson T., Jonsson B., Bouman H., et al. (2021). Computation record.: Computation of marine phytoplankton primary production. Dataset.
Lawrenz E., Silsbe G., Capuzzo E., Ylostalo P., Forster R. M., Simis S. G. H., et al. (2013). Predicting the electron requirement for carbon fixation in seas and oceans. PloS One 8, e58137. doi: 10.1371/journal.pone.0058137
Laws E. A. (1991). Photosynthetic quotients, new production and net community production in the open ocean. Deep Sea Res. Part A. Oceanographic Res. Papers 38, 143–167. doi: 10.1016/0198-0149(91)90059-o
Laws E. A., D’Sa E., Naik P. (2011). Simple equations to estimate ratios of new or export production to total production from satellite-derived estimates of sea surface temperature and primary production. Limnology Oceanography: Methods 9, 593–601. doi: 10.4319/lom.2011.9.593
Laws E. A., Falkowski P. G., Smith W. O., Ducklow H., McCarthy J. J. (2000). Temperature effects on export production in the open ocean. Global Biogeochemical Cycles 14, 1231–1246. doi: 10.1029/1999gb001229
Lee Z. P., Carder K. L., Marra J., Steward R. G., Perry M. J. (1996). Estimating primary production at depth from remote sensing. Appl. Optics 35, 463. doi: 10.1364/ao.35.000463
Li Z., Cassar N. (2016). Satellite estimates of net community production based on o2/ar observations and comparison to other estimates. Global Biogeochemical Cycles 30, 735–752. doi: 10.1002/2015gb005314
Li Z., Li L., Song K., Cassar N. (2013). Estimation of phytoplankton size fractions based on spectral features of remote sensing ocean color data. J. Geophysical Research: Oceans 118, 1445–1458. doi: 10.1002/jgrc.20137
Makridakis S. (1993). Accuracy measures: theoretical and practical concerns. Int. J. Forecasting 9, 527–529. doi: 10.1016/0169-2070(93)90079-3
Marinov I., Follows M. J., Gnanadesikan A., Sarmiento J. L., Slater R. D. (2008). How does ocean biology affect atmospheric pCO(2)? Theory and models. J. Geophyiscal Res. 113, C07032. doi: 10.1029/2007JC004598
McClain C. R., Franz B. A., Werdell P. J. (2022). Genesis and evolution of nasa’s satellite ocean color program. Front. Remote Sens. 3. doi: 10.3389/frsen.2022.938006
Mouw C. B., Barnett A., McKinley G. A., Gloege L., Pilcher D. (2016a). Global ocean particulate organic carbon flux merged with satellite parameters. Earth System Sci. Data 8, 531–541. doi: 10.5194/essd-8-531-2016
Mouw C. B., Barnett A., McKinley G. A., Gloege L., Pilcher D. (2016b). Global ocean particulate organic carbon flux merged with satellite parameters. Earth system Sci. Data 8 (2), 531–541. doi: 10.1594/PANGAEA.855600. Datasetsupplement to: Mouw, colleen b; 638 barnett, audrey; mckinley, galen a; gloege, lucas; pilcher, darren (2016).
Murray J. W., Young J., Newton J., Dunne J., Chapin T., Paul B., et al. (1996). Export flux of particulate organic carbon from the central equatorial Pacific determined using a combined drifting trap-234Th approach. Deep Sea Res. Part II: Topical Stud. Oceanography 43, 1095–1132. doi: 10.1016/0967-0645(96)00036-7
Myttenaere A. d., Golden B., Grand B. L., Rossi F. (2016). Mean absolute percentage error for regression models. Neurocomputing 192, 38–48. doi: 10.1016/j.neucom.2015.12.114
Nevitt J., Hancock G. R. (2000). Improving the root mean square error of approximation for nonnormal conditions in structural equation modeling. J. Exp. Educ. 68, 251–268. doi: 10.1080/00220970009600095
Nielsen E. S. (1952). The use of radio-active carbon (C14) for measuring organic production in the sea. ICES J. Mar. Science: J. du Conseil 18, 117–140. doi: 10.1093/icesjms/18.2.117
Nowicki M., DeVries T., Siegel D. A. (2022). Quantifying the carbon export and sequestration pathways of the ocean’s biological carbon pump. Global Biogeochemical Cycles 36, e2021GB007083. doi: 10.1029/2021gb007083
Pace M. L., Knauer G. A., Karl D. M., Martin J. H. (1987). Primary production, new production and vertical flux in the eastern pacific ocean. Nature 325, 803–804. doi: 10.1038/325803a0
Palevsky H. I., Quay P. D., Nicholson D. P. (2016). Discrepant estimates of primary and export production from satellite algorithms, a biogeochemical model, and geochemical tracer measurements in the north pacific ocean. Geophysical Res. Lett. 43, 8645–8653. doi: 10.1002/2016gl070226
Pauly D., Christensen V. (1995). Primary production required to sustain global fisheries. Nat. (News Views) 374, 255–257. doi: 10.1038/374255a0
Platt T., Harrison W., Lewis M. R., Li W., Sathyendranath S., SMITH R. E., et al. (1989). Biological production of the oceans: the case for a consensus. Mar. Ecol. - Prog. Ser. 52, 77–88. doi: 10.3354/meps052077
Platt T., Jassby A. D. (1976). The relationship between photosynthesis and light for natural assemblages 666 of coastal marine phytoplankton1. J. Phycology 12, 421–430. doi: 10.1111/j.1529-8817.1976
Platt T., Sathyendranath S., Caverhill C. M., Lewis M. R. (1988). Ocean primary production and available light: further algorithms for remote sensing. Deep Sea Research Part A. Oceanographic Res. Papers 35, 855–879. doi: 10.1016/0198-0149(88)90064-7
Puigcorbe V. (2019). Global database of oceanic particulate organic carbon to particulate 234 th 672 ratios. doi: 10.1594/PANGAEA.911424. Dataset.
Puigcorbe V., Masqu e P., Moigne F. A. C. L. (2020). Global database of ratios of particulate organic carbon to thorium-234 in the ocean: improving estimates of the biological carbon pump. Earth System Sci. Data 12, 1267–1285. doi: 10.5194/essd-12-1267-2020
Puigcorbe V., Roca-Martı M., Masque P., Benitez-Nelson C., Loeff M.R.v.d., Bracher A., et al. (2017). Latitudinal distributions of particulate carbon export across the north western atlantic ocean. Deep Sea Res. Part I: Oceanographic Res. Papers 129, 116–130. doi: 10.1016/j.dsr.2017.08.016
Quay P. D., Karl D. M. (2010). Measuring primary production rates in the ocean: Enigmatic results between incubation and non-incubation methods at Station ALOHA. Global. Biogeochemical Cycles 24, GB3014. doi: 10.1029/2009GB003665
Reuer M. K., Barnett B. A., Bender M. L., Falkowski P. G., Hendricks M. B. (2007). New estimates of southern ocean biological production rates from O2/ar ratios and the triple isotope composition of O2. Deep Sea Res. Part I: Oceanographic Res. Papers 54, 951–974. doi: 10.1016/j.dsr.2007.02.007
Sabine C. L., Feely R. A., Gruber N., Key R. M., Lee K., Bullister J. L., et al. (2004). The oceanic sink for anthropogenic co2. Science 305, 367–371. doi: 10.1126/science.1097403
Sarmiento J. L., Bender M. L. (1994). Carbon biogeochemistry and climate change. Photosynthesis Res. 39, 209–234. doi: 10.1007/BF00014585
Sathyendranath S. (2021). Esa ocean colour climate change initiative (ocean colour cci): Global chlorophyll-a data products gridded on a geographic projection, version 4.2. centre for environmental data analysis. Dataset 197.
Sathyendranath S., Platt T., Horne E. P. W., Harrison W. G., Ulloa O., Outerbridge R., et al. (1991). Estimation of new production in the ocean by compound remote sensing. Nature 353, 129–133. doi: 10.1038/353129a0
Seegers B. N., Stumpf R. P., Schaeffer B. A., Loftin K. A., Werdell P. J. (2018). Performance metrics for the assessment of satellite data products: an ocean color case study. Optics Express 26, 7404. doi: 10.1364/oe.26.007404
Siegel D. A., Buesseler K. O., Behrenfeld M. J., Benitez-Nelson C. R., Boss E., Brzezinski M. A., et al. (2016). Prediction of the export and fate of global ocean net primary production: The exports science plan. Front. Mar. Sci. 3, 18.1–18.28. doi: 10.3389/fmars.2016.00022
Siegel D. A., Buesseler K. O., Doney S. C., Sailley S. F., Behrenfeld M. J., Boyd P. W. (2014). Global assessment of ocean carbon export by combining satellite observations and food-web models. Global Biogeochemical Cycles 28, 181–196. doi: 10.1002/2013gb004743
Siegel D. A., DeVries T., Cetinic I., Bisson K. M. (2022). Quantifying the ocean’s biological pump and its carbon cycle impacts on global scales. Annu. Rev. Mar. Sci. 15. doi: 10.1146/annurev-marine-040722-115226
Silsbe G. M., Behrenfeld M. J., Halsey K. H., Milligan A. J., Westberry T. K. (2016). The CAFE model: A net production model for global ocean phytoplankton. Global Biogeochemical Cycles 30, 1756–1777. doi: 10.1002/2016gb005521
Smyth T. J., Tilstone G. H., Groom S. B. (2005). Integration of radiative transfer into satellite models of ocean primary production. J. Geophysical Res. 110, C10014. doi: 10.1029/2004jc002784
Stukel M. R., Kahru M., Benitez-Nelson C. R., Decima M., Goericke R., Landry M. R., et al. (2015). Using lagrangian-based process studies to test satellite algorithms of vertical carbon flux in the eastern north pacific ocean. J. Geophysical Research: Oceans 120, 7208–7202. doi: 10.1002/7222015jc011264
Stukel M., Ohman M., Benitez-Nelson C., Landry M. (2013). Contributions of mesozooplankton to vertical carbon export in a coastal upwelling system. Mar. Ecol. Prog. Ser. 491, 47–65. doi: 10.3354/meps10453
Suess E. (1980). Particulate organic carbon flux in the oceans—surface productivity and oxygen utilization. Nature 288, 260–263. doi: 10.1038/288260a0
UKMO (2005). Ghrsst level 4 ostia global foundation sea surface temperature analysis. doi: 10.5067/GHOST-4FK01. Dataset.
Volk T., Hoffert M. I. (1985). Ocean Carbon Pumps: Analysis of Relative Strengths and Efficiencies in Ocean-Driven Atmospheric CO2 Changes. In The Carbon Cycle and Atmospheric CO2: Natural Variations Archean to Present (eds. Sundquist E. T., Broecker W. S.). doi: 10.1029/GM032p0099
Westberry T. K., Behrenfeld M. J., Siegel D. A., Boss E. S. (2008). Carbon-based primary productivity modeling with vertically resolved photoacclimation. Global Biogeochemical Cycles 22, GB2024. doi: 10.1029/2007GB003078
Westberry T. K., Williams P. J., l. B., Behrenfeld M. J. (2012). Global net community production and the putative net heterotrophy of the oligotrophic oceans. Global Biogeochemical Cycles 26, n/a–n/a. doi: 10.1029/2011gb004094
Williams P. J. L. B. (1993). On the definition of plankton produktion terms. ICES Mar. Sci. Symp. (ICES), 9–19.
Williams P. J. L. B., Quay P. D., Westberry T. K., Behrenfeld M. J. (2013). The olig otrophic ocean is autotrophic. Annu. Rev. Mar. Sci. 5, 535–549. doi: 10.1146/annurev-marine-121211-172335
Keywords: carbon export, biological pump, satellite oceanography, ocean color, net community production, biogeochemistry, algorithms
Citation: Jönsson BF, Kulk G and Sathyendranath S (2023) Review of algorithms estimating export production from satellite derived properties. Front. Mar. Sci. 10:1149938. doi: 10.3389/fmars.2023.1149938
Received: 23 January 2023; Accepted: 06 July 2023;
Published: 21 August 2023.
Edited by:
Jeremy Werdell, National Aeronautics and Space Administration, United StatesReviewed by:
Monique Messié, Monterey Bay Aquarium Research Institute (MBARI), United StatesGreg M. Silsbe, University of Maryland, College Park, United States
Copyright © 2023 Jönsson, Kulk and Sathyendranath. This is an open-access article distributed under the terms of the Creative Commons Attribution License (CC BY). The use, distribution or reproduction in other forums is permitted, provided the original author(s) and the copyright owner(s) are credited and that the original publication in this journal is cited, in accordance with accepted academic practice. No use, distribution or reproduction is permitted which does not comply with these terms.
*Correspondence: Bror F. Jönsson, YnJqQHBtbC5hYy51aw==