 Min-Sun Lee
 Kyung-Ae Park
 Guebuem Kim
94% of researchers rate our articles as excellent or good
Learn more about the work of our research integrity team to safeguard the quality of each article we publish.
Find out more
ORIGINAL RESEARCH article
Front. Mar. Sci., 08 June 2023
Sec. Coastal Ocean Processes
Volume 10 - 2023 | https://doi.org/10.3389/fmars.2023.1149657
Despite the increasing numbers of red tide events in the pristine subtropical ocean, a paucity of previous observations has limited understanding of harmful algae in the seas around the Korean Peninsula. Therefore, using six years (2012–2017) of Geostationary Ocean Color Imager (GOCI) satellite data, we characterized the red tides around Jeju Island, a volcanic island located near the paths of the Jeju Warm Current and Tsushima Warm Current, using the Normalized Red Tide Index (NRTI) method. The seawater around Jeju Island has for a long time been considered to be very clear, with relatively low suspended particulate matter concentrations and few harmful algae. Nonetheless, the satellite-based NRTI detection method used in this study detected and supported the existence of red tides in the coastal region around Jeju Island. Analysis of the red tide distribution showed that red tide first began to appear near the western coast of Jeju Island, then developed in the northern and eastern coastal regions, and finally vanished in the eastern coastal region. The monthly averages of the NRTI demonstrated a bloom event from April to May in every year. Additional fall blooms were detected in August–September, particularly in 2013 and 2016. The NRTI revealed strong interannual variations. The longest blooms occurred in 2015, and the most comprehensive and strongest event occurred in the spring of 2016. The latter three years (2015–2017) had much higher NRTI than the former three years (2012–2014). The probability of red tide occurrence at a given point during the 6-year study period revealed spatial differences. Relatively high probability of 0.3–0.5 was determined along the northern coastal region, whereas low probability of less than 0.2 was found along the southern region. Ground truth data also showed more frequent observations and higher red tide cell densities along the northern coast. Changes in NRTI in spring are positively correlated with changes in ENSO indices in winter. This study is the first to use a satellite-based approach with a vast long-term satellite database to elucidate the existence and probability of red tides near Jeju Island. We anticipate that this study will provide a useful strategy for remote monitoring of harmful algal blooms over wide regions using optical data.
Red tides are natural oceanic disasters that affect coastal ecosystems, fisheries, and marine leisure activities (Kahru and Mitchell, 1998; Walsh et al., 2006; He et al., 2008; Jessup et al., 2009; Lee et al., 2020). They are the most common type of harmful algal bloom (HAB), caused by the proliferation of phytoplankton (mostly dinoflagellates and some diatoms), producing a red or brown color in the ocean (Schantz, 1975; Anderson, 1989; Hallegraeff, 1993; Lu and Hodgkiss, 2004). Some HABs produce toxins that poison shellfish, fish, and marine mammals. However, even without production of toxins, red tides can be harmful in many ways, such as causing hypothermia in sea birds by neutralizing their natural water repellency and insulation and suffocation of fish by physically attaching to gills (Kim et al., 1999; Jessup et al., 2009). In addition, oxygen depletion attributable to the decomposition of vast amounts of dead cells sometimes leads to mortality of benthic organisms, such as abalone and kelp forest (Anderson et al., 2002; Cosper et al., 2012; Gravinese et al., 2020; Low et al., 2021). In this case, it takes a long time for the ecosystem to recover.
The occurrence of HABs has been increasing globally (Anderson et al., 2012; Wells et al., 2015; Gobler et al., 2017; McKibben et al., 2017; Brunson et al., 2018). Potential causes of the increasing red tide events are climate change, other anthropogenic impacts, and rapid changes in the marine environment. For example, a Karenia brevis bloom occurred to the west of Florida in 2017 and persisted for more than a year. Such persistent red tide, which had not occurred before, resulted in massive mortality of marine wildlife and a ban on marine leisure activities. A recent study reported that anthropogenic forcing (N-enriched discharge) was the key factor in the red tide west of Florida (Medina et al., 2022). In addition, Tasmania in Australia has suffered from shellfish toxin-producing red tides. A recent study revealed a link between climate change and the occurrence of red tides in pelagic areas (Trainer et al., 2020). In Chile, the most damaging aquaculture lethality occurred during two sequential red tides in 2016. The first was a Pseudochattonella verruculosa bloom induced by abnormally warm water temperature and strong water column stratification. Furthermore, an enormous amount (40,000 tons) of salmon died due to the occurrence of the red tide. Disposal of dead salmon provoked the second Alexandrium catenella bloom, which produced paralytic shellfish toxins. These red tides spread 2,000 km along the coast, killing more salmon and many bivalves. The economic loss due to salmon death was severe enough to reach 800 million USD (Armijo et al., 2020; Mardones et al., 2021). Such devastating damage has been observed and reported continuously worldwide.
Satellite remote sensing has been actively utilized to monitor red tide events globally. There are three different types of approaches in this field: 1) detecting the presence/absence of red tides, 2) inferring intensity or spatial pattern from proxy parameters such as chlorophyll-a, fluorescence line height, and sea surface temperature, and 3) quantifying red tide intensity as an index. A previous study using the Geostationary Ocean Color Imager (GOCI) revealed the limitations of the first two approaches in Korean water and suggested a new index called the Normalized Red Tide Index (NRTI) (Lee et al., 2021). The NRTI method was developed based on the spectral characteristics of red tides, showing two peaks over the visible wavelengths (550 nm and 680 nm). This red tide index showed a highly positive relationship with red tide cell density (major species: Margalefidinium polykrikoides) irrespective of environment, such as highly turbid coastal water or optically clear offshore water.
Recently, red tides have occurred frequently in the southern coastal region of the Korean Peninsula. Jeju Island, located southwest of the Korean Peninsula with a zonal width of 73 km and meridional length of 31 km, is a representative volcanic island in East Asia (Kim et al., 2003; Brenna et al., 2012). The seawater properties around Jeju Island have been affected by the Tsushima Warm Current (Moriyasu, 1972; Park et al., 2018) and by diluted water from the Yangtze River (Changjiang River) (Figure 1). The seawater around Jeju Island, with low suspended particulate matter (SPM), is known to have relatively clear optical properties, as evidenced by numerous satellite images. The environment of Jeju Island, as a pristine area in the seas around Korea over the past decades, has been considered a region free from red tides. However, red tides have recently become an urgent issue on Jeju Island because of a growing number of red tide observations according to the public news in 2020. The red tide surrounding Jeju Island has not been observed intensively, and only a few observations, rather than regular monitoring, have been made. With the paucity of observations in this area, satellite remote sensing with long-term accumulated data can be very useful for tracking temporal changes and spatial characteristics. Jeju Island is mostly cloudy, making it difficult to obtain clear satellite images. However, GOCI, scanning eight times a day over the area, has consistently provided high-resolution ocean color data (Ryu et al., 2012). According to a report of the National Institute of Fisheries Science, 2019 (Yoon et al., 1991), previous observations have shown that red tide species (e.g., Mesodinium rubrum, red Noctilluca sp.) are occasionally found in the coastal waters around Jeju Island. These species show two typical spectral peaks, as with M. polykrikoides species (Stæhr and Cullen, 2003; Guzmán et al., 2016; Shaju et al., 2018). The NRTI method based on spectral peaks has the potential to be a suitable tool for studying red tides around Jeju Island.
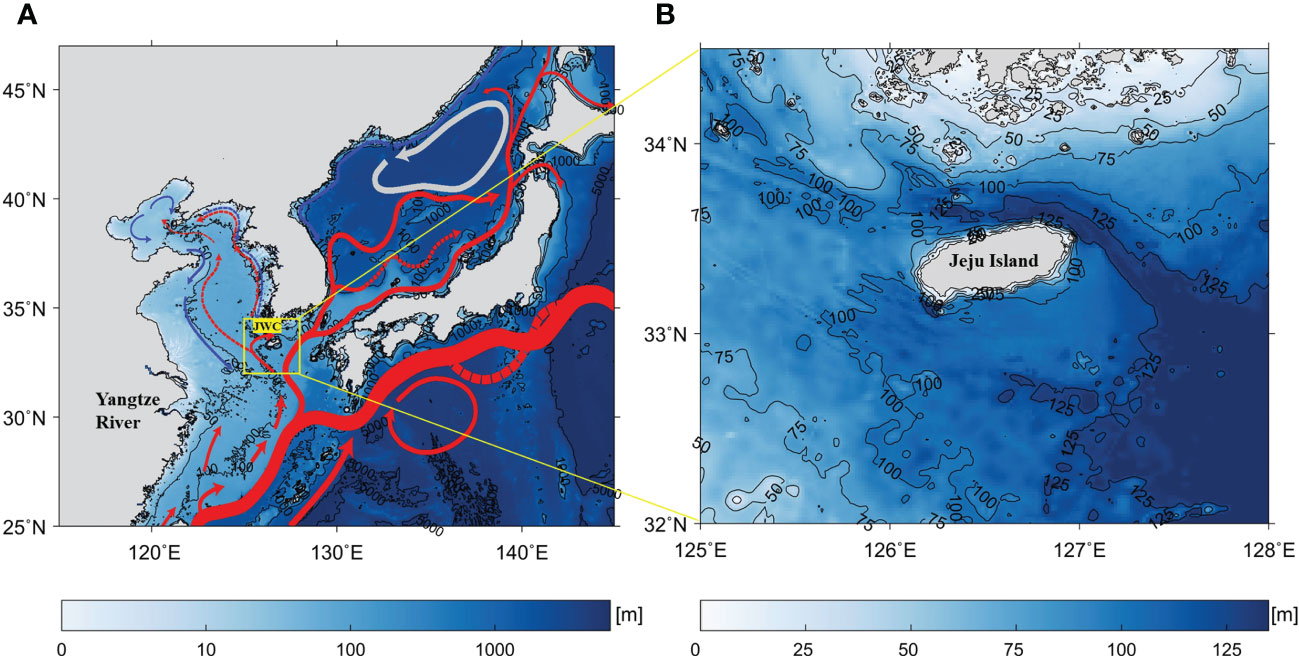
Figure 1 (A) A schematic diagram of oceanic currents over bathymetry (m) in the seas around Korean peninsula (Park et al., 2019), where JWC inside the yellow box stands for the Jeju Warm Current and (B) the study area around Jeju Island enlarged from (A).
This study aimed to investigate whether red tides occur in the seas around Jeju Island using satellite data and understand their temporal variability. To achieve these goals, we conducted analyses to 1) comprehend the coastal environment of Jeju Island by analyzing SPM, 2) apply the NRTI method to GOCI data, 3) understand the temporal and spatial characteristics of red tide index variations, 4) estimate the probability of red tide occurrence from space, and 5) compare spatial patterns with previous observation results.
GOCI, onboard the Communication, Ocean, and Meteorological Satellite (COMS), observed the seas around the Korean Peninsula (24.75–47.25° N, 113.40–146.60° E), including the seas adjacent to China, Japan, Taiwan, and Russia with 500 m × 500 m spatial resolution and a high temporal sampling capability of 8 times per day from 9:00 AM to 4:00 PM (KST, Korean Standard Time) from June 2010 to March 2021 (Figure 1A). It had six visible (412, 443, 490, 555, 660, and 680 nm) and two near-infrared (745 and 865 nm) channels with a bandwidth of 20 nm (Ryu et al., 2012). This study utilized 2,190 images of the level-2 atmospherically corrected remote sensing reflectance (Rrs) (version 2.0) product from the Korea Ocean Satellite Center (KOSC) from 2012 to 2017. The focus of the research area was centered on Jeju Island within 33.0–33.8° N, 125.8–127.3° E (Figure 1B).
The NIFS has made numerous observations of red tides over the past few decades and has reported detailed information on the locations, times, and spatial extents of the red tides, as well as the red tide cell density. The NIFS has reported red tide species and cell densities along the coast of the Korean Peninsula over the two decades since 2006 (https://www.nifs.go.kr/board/actionRedtideInfoList.do). The record contains information on red tides acquired from ship cruises, aircraft, and land observations (Figure 2). Because Jeju Island is known for its clear seawater, in situ observations of red tide phenomena offshore from Jeju Island have hardly been made. Therefore, previous studies did not cover all areas off the coast of Jeju Island, and only seven red tides were observed by the NIFS. We surveyed previous literature containing red tide observations on the Jeju Island coast to confirm the results of this study.
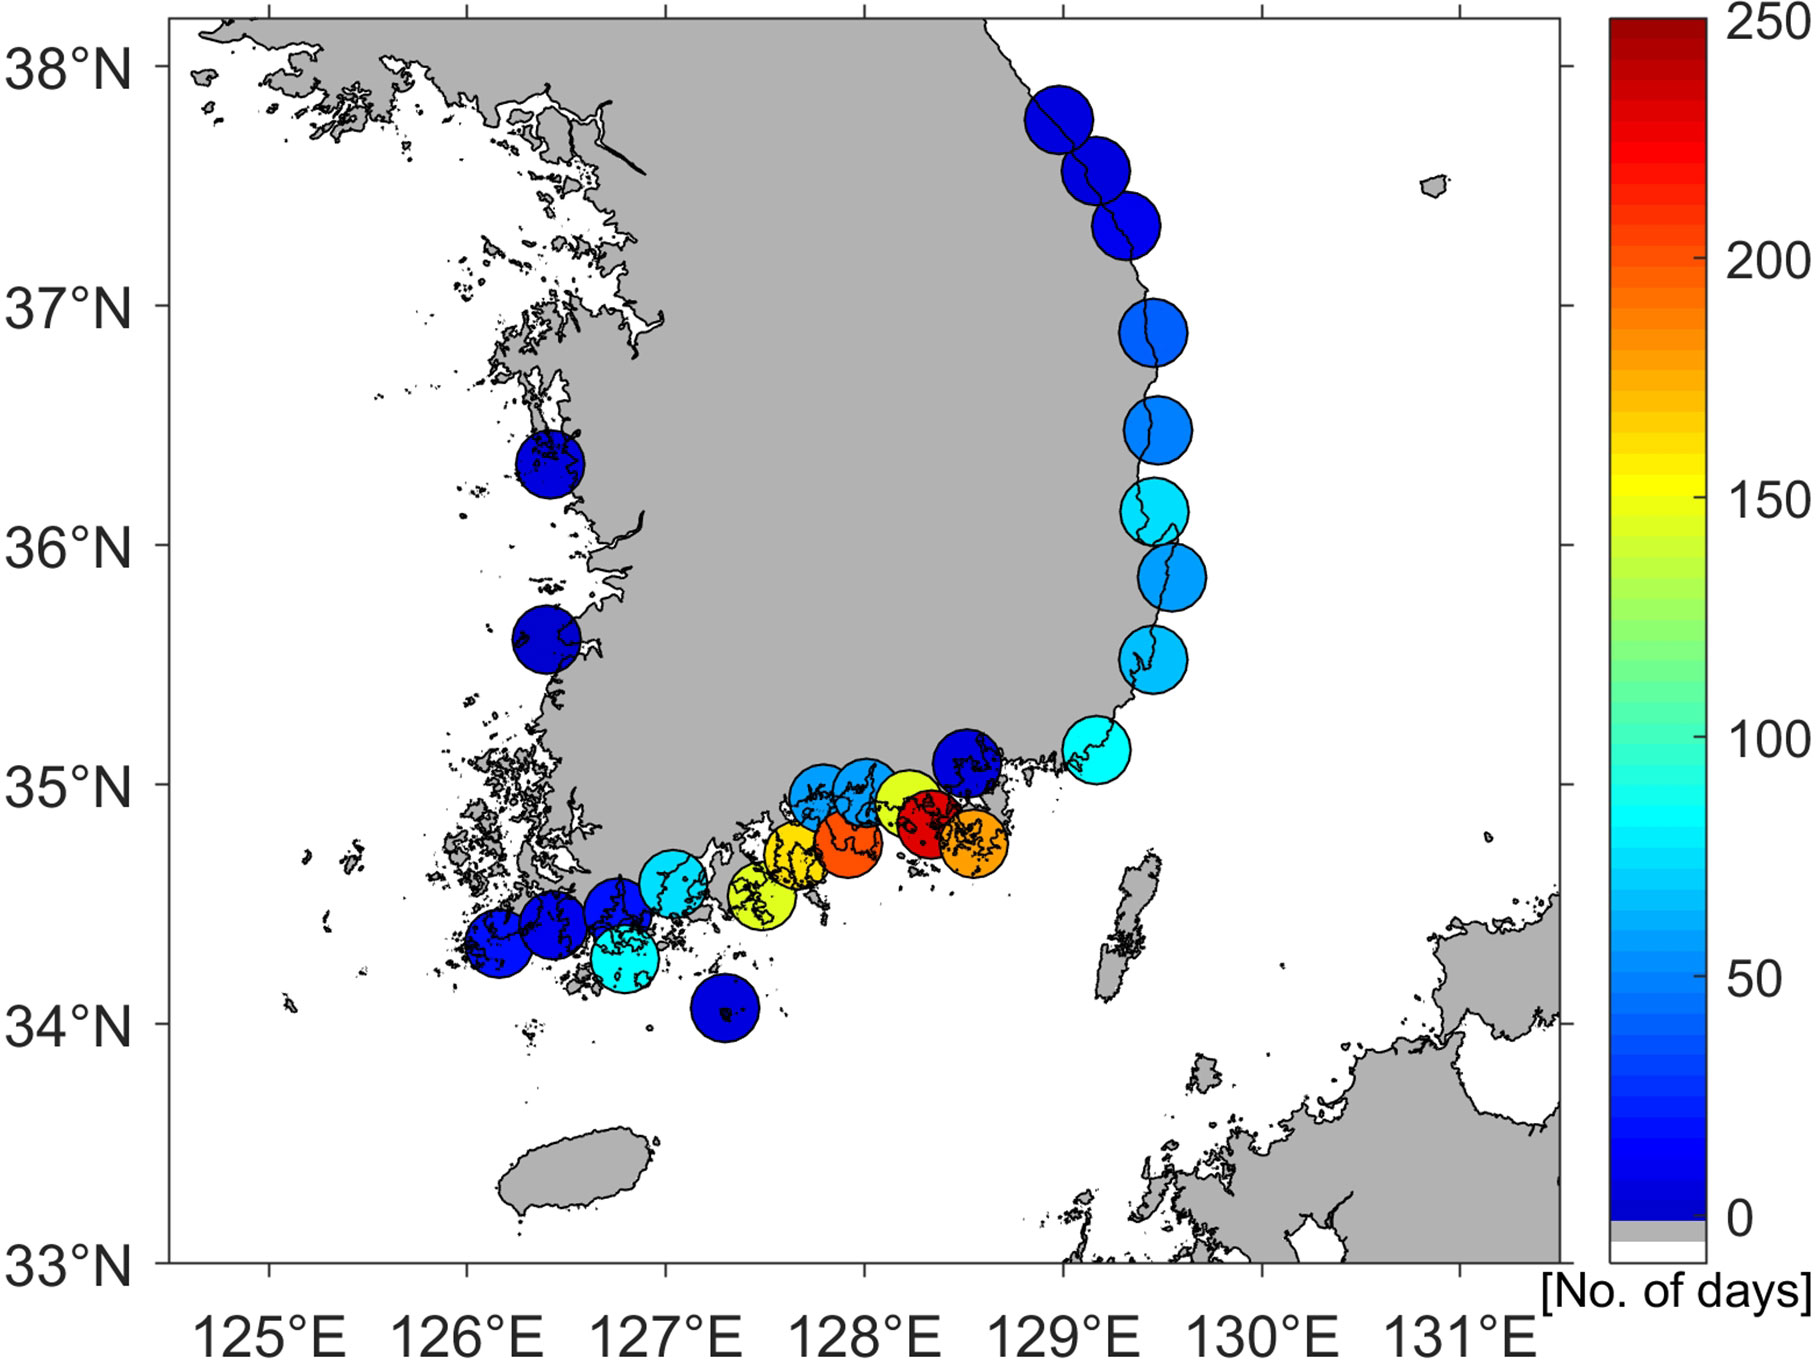
Figure 2 Occurrence days of red tides over the decade from 2006 to 2016. The colors represent the observation numbers in days.
To determine whether the results of this satellite-based study are appropriate, we collected as much literature as possible on the red tides in the study area for comparison. We collected three different types of red tide observation records of Jeju University (Yoon et al., 1991), the NIFS, and interviews (Jeju University and NIFS) in a public television documentary (Table 1). Most recently, Jeju University and the NIFS reported red tide events caused by Mesodinium rubrum (>3000 cells/ml), Noctiluca scintillans, and Gymnodinium mikimotoi. According to a 1991 Jeju University report, many different species of red tide organisms were observed in 1989. The species included M. rubrum, N. scintillans, and G. mikimotoi, as well as species of Ceratium, Prorocentrum, Skeletonema, Heterosigma, and others, which were frequently observed on the southern coast of the Korean Peninsula.
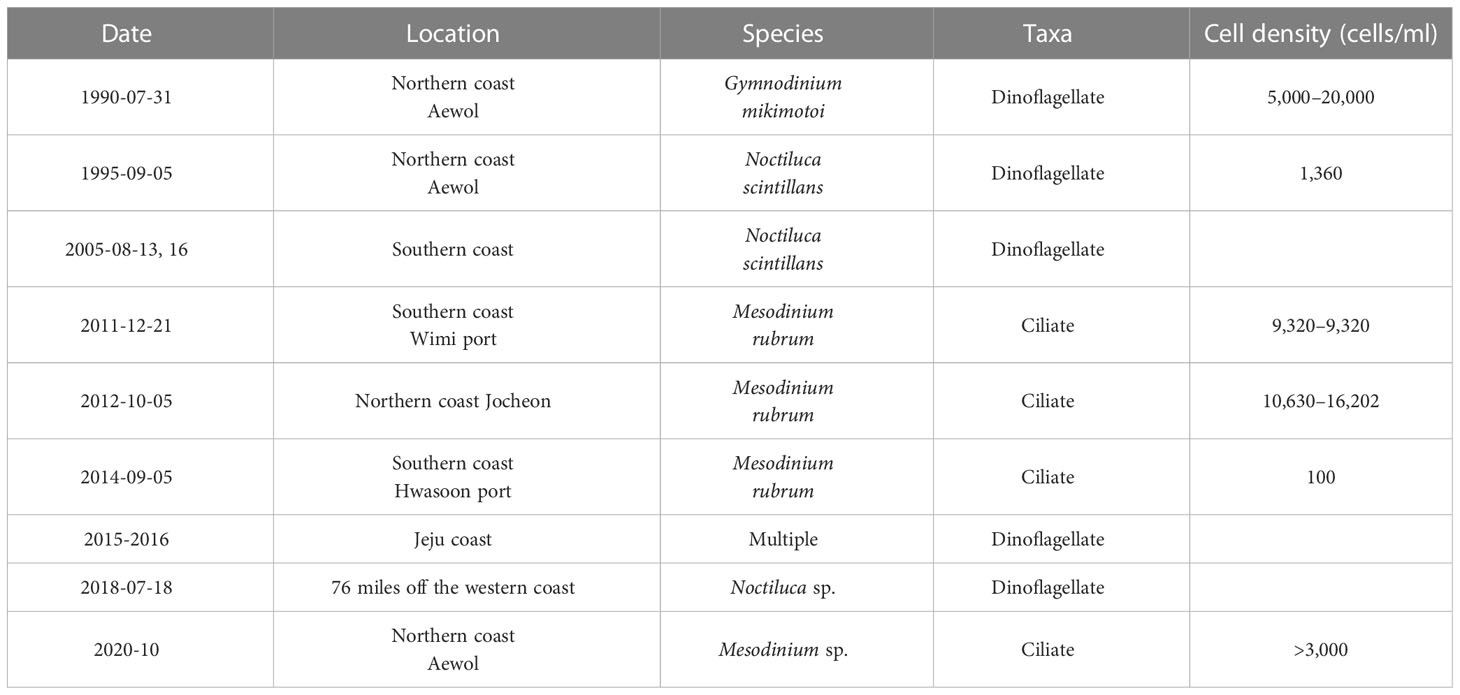
Table 1 Information of red tide occurrences (date, place, species, taxa, and cell density) near the coast of Jeju Island reported in previous studies https://www.nifs.go.kr/board/actionRedtideInfoList.do).
The NRTI is a proxy for red tide intensity developed for GOCI data based on in situ spectral measurements (Lee et al., 2021). The in situ spectral measurements indicated unique spectral shapes with bimodal peaks at 550 nm and 680 nm during the red tide bloom period (Figure 3). As red tide density increases, the height of each peak also increases (Kahru and Mitchell, 1998; Cannizzaro et al., 2008; Kim et al., 2016). The index is composed of the product of the heights of the two spectral peaks. The red and blue lines in Figure 3A show how the peak heights are defined. The peak height is calculated as follows:
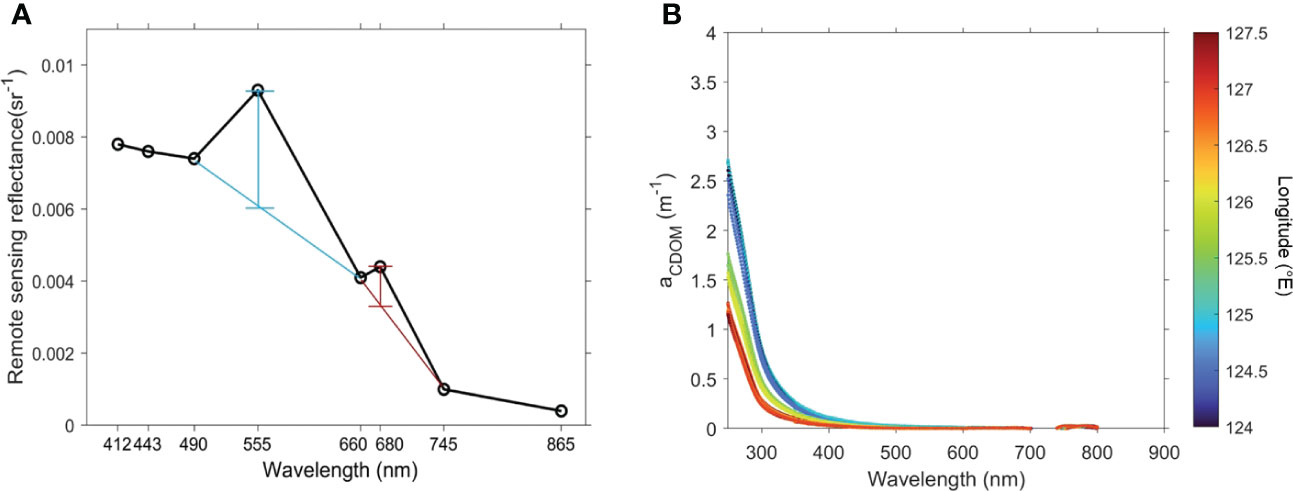
Figure 3 (A) Remote sensing reflectance at GOCI spectral bands during red tide bloom in the southern coastal region of the Korean Peninsula. The result shows bimodality with specific two peaks. Red and blue lines show the peak heights used in the red tide index algorithm. (B) Absorption spectrum of CDOM along 33°N at 124-127°E during the GEO-CAPE GOCI Cruise in April 2011, with color representing the longitude of each station near Jeju Island.
where P555 (P680) represents the height of the first (second) peak in the spectrum (Figure 3A).
Prior to implementing the NRTI method on the GOCI data, a meticulous preprocessing step was conducted. Specifically, the GOCI SPM data was employed to identify and exclude pixel locations exhibiting abnormally high SPM values resulting from diverse factors, including moisture, cloud edges, thin clouds, sensor peculiarities, failures in atmospheric correction, and other potential sources (Lee et al., 2019). A negative was regarded as a failure of atmospheric correction and was removed before the following procedure. At each step of the peak height calculation, the values of three consecutive channels were used, as shown in (1) and (2). Negative P555 and P680 values were regarded as indicating no red tide. To equalize the impact of the peaks on the NRTI value, the peak heights were normalized by dividing them by the of the shortest wavelength among the three channels in each peak. In the case of clear water, the values of P555 and P680 can potentially be extremely high after dividing them by extremely low . In this case, we followed the modification by implementing thresholds (Th1=0.001 and Th2=0.001) (Figure 4). Additional normalization with spectral differences between Rrs555 and Rrs745 was performed to consider different ranges by different atmospheric correction schemes and satellite sensors (4). Further details are provided by Lee et al. (2021).
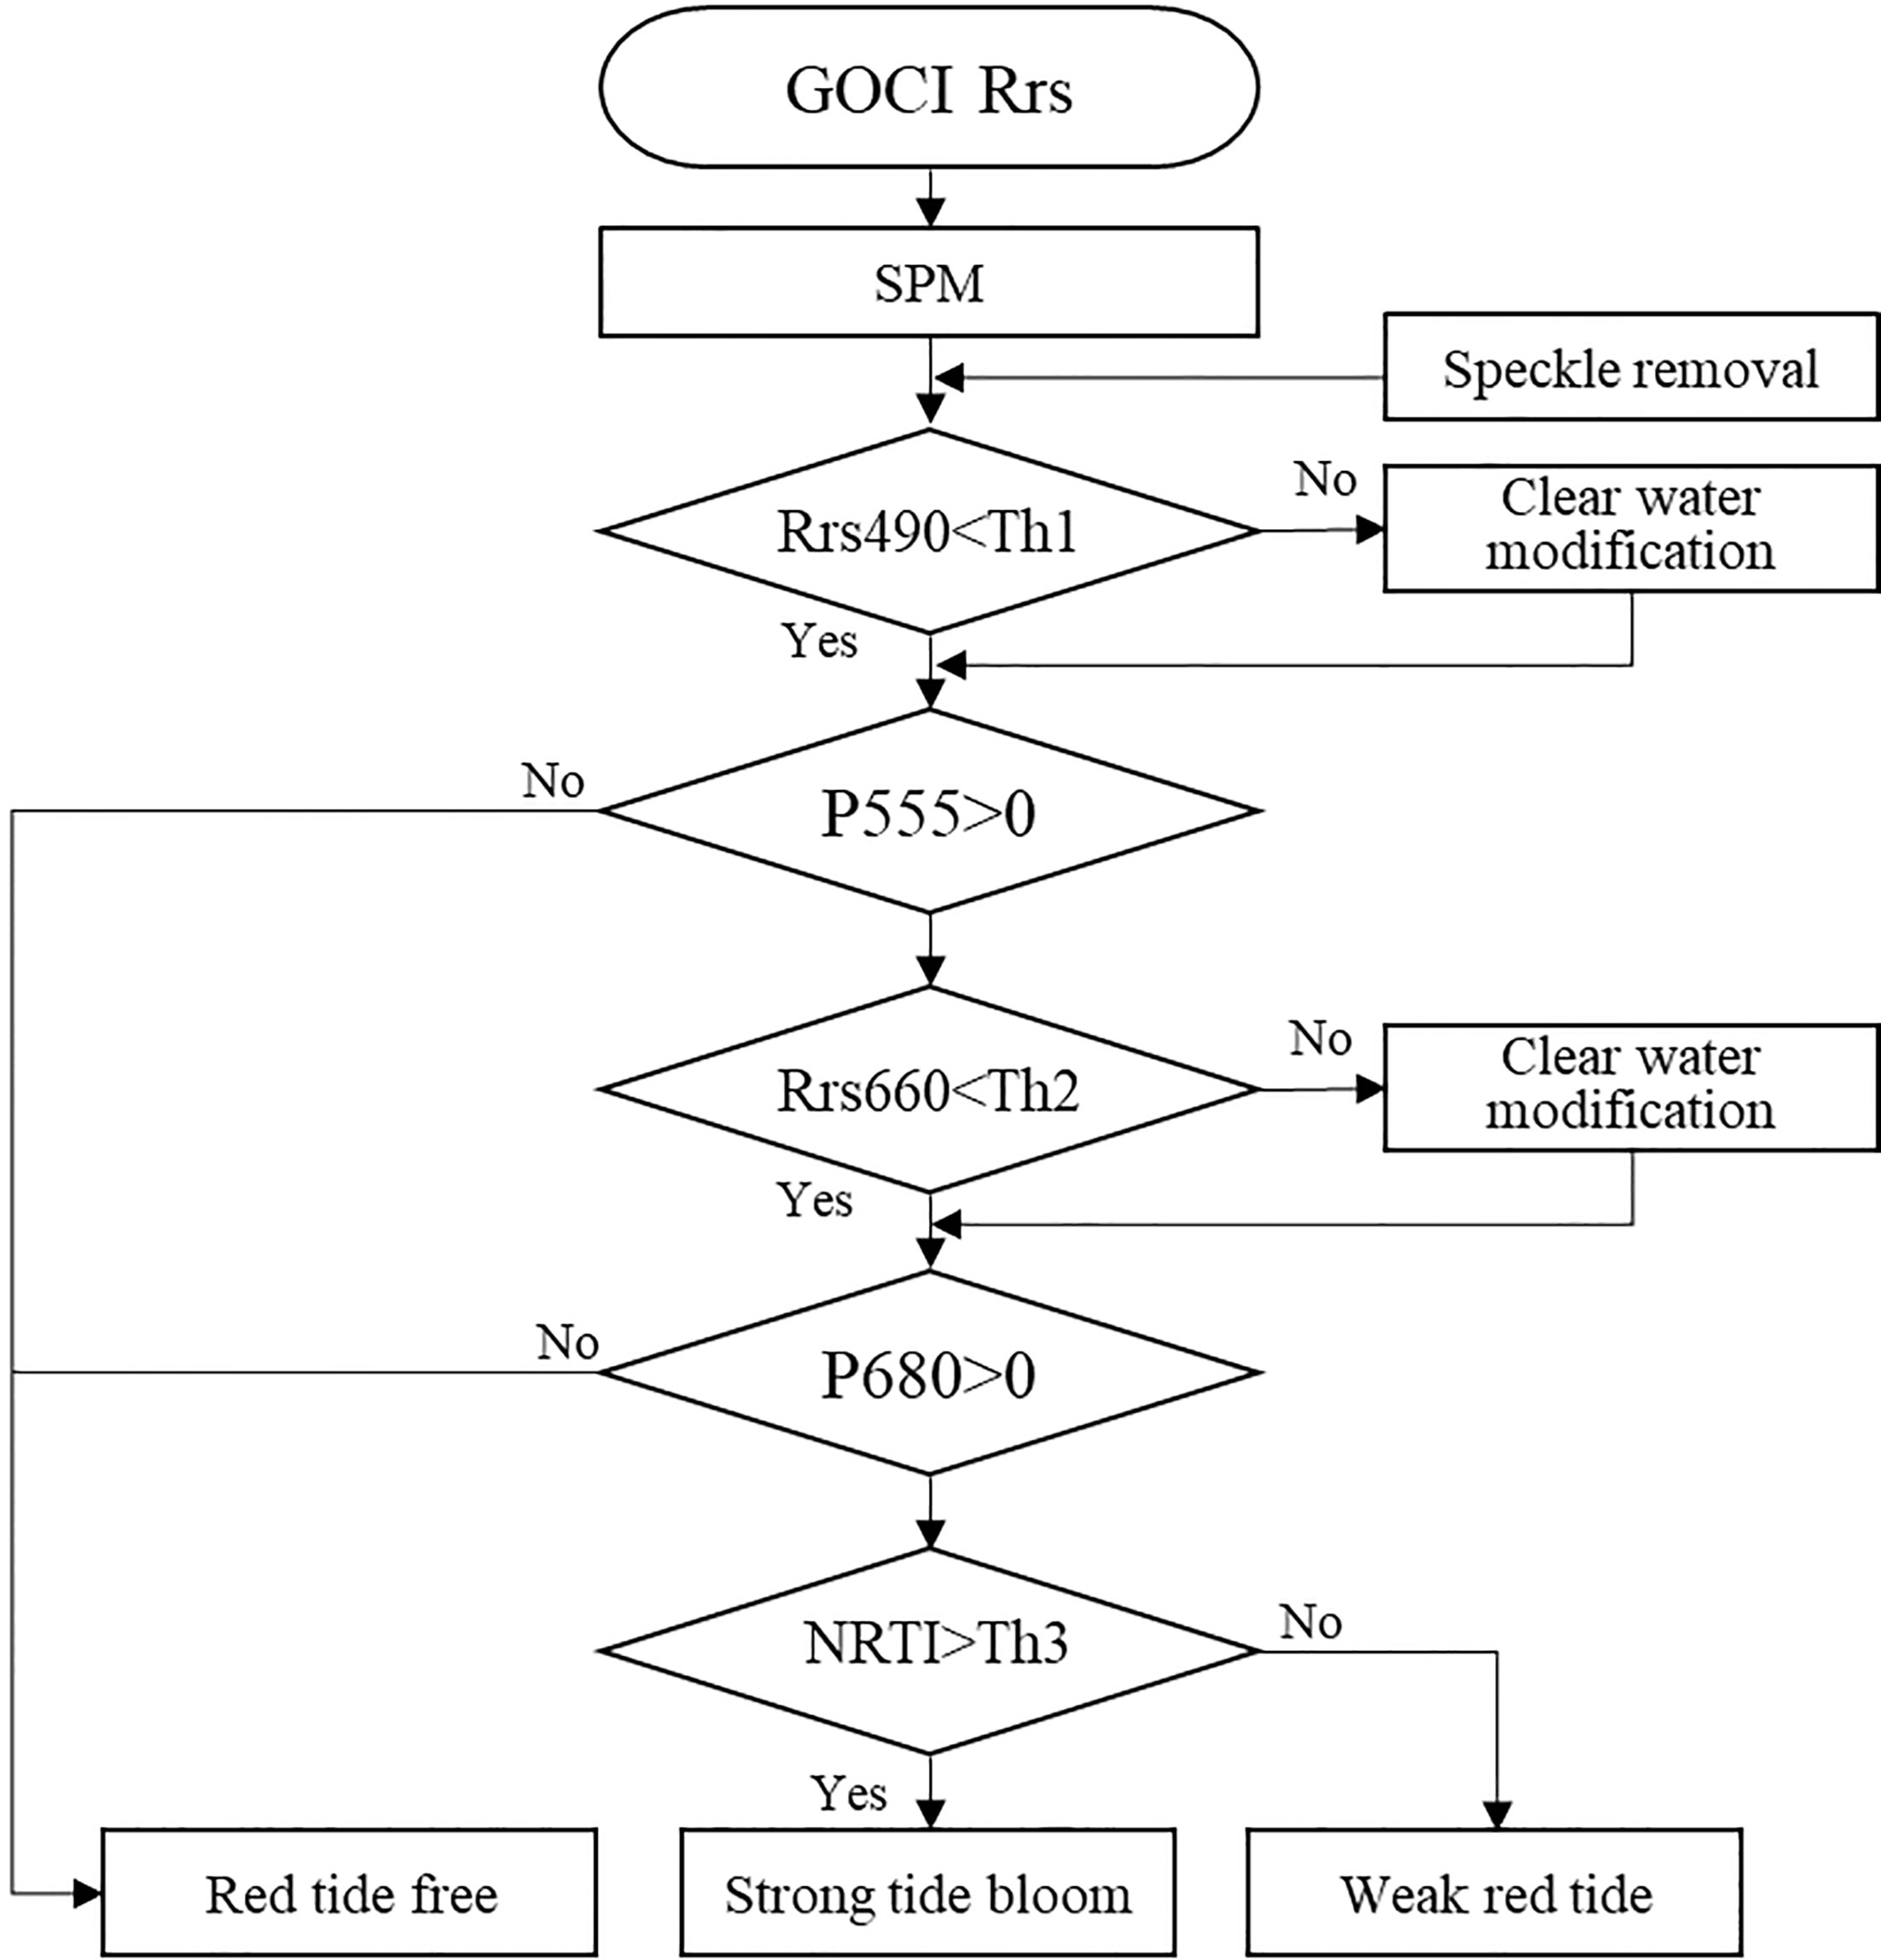
Figure 4 Flow chart of red tide detection procedure including preprocessing of Rrs (remote sensing reflectance) data, quality control, calculation of each peak (P555 and P680), and making the decision of red tide bloom, where Th1 and Th2 are thresholds (Lee et al., 2021). Th3 is a threshold to decide strong or weak bloom.
Investigating the influence of the Colored Dissolved Organic Matter (CDOM) in seawater on the calculation of red tide index, we analyzed the absorption coefficient spectra of CDOM across different wavelengths. Figure 3B illustrates the CDOM absorption coefficient spectra obtained during the GEO-CAPE GOCI observation period in April 2011, covering the observation points from 33°N to 124-127°E with colors indicating longitude values. From west (blue line) to east (red line), i.e. closer to Jeju Island, CDOM absorption dramatically decreases, indicating reduced CDOM influence. Our findings indicate that the majority of CDOM absorption occurred at shorter wavelengths (300-400 nm), whereas absorption at longer wavelengths (greater than 490 nm), which are relevant for NRTI, was nearly absent (Figure 3B). These observed CDOM absorption spectra exhibit a typical spectral shape. Consequently, the influence of CDOM on NRTI is expected to be negligible.
The Jeju region is characterized by consistently low SPM concentrations throughout the year. Figure 5A presents a GOCI RGB composite image on 5 April 2011, where the area around the Yangtze River exhibits high turbidity due to river discharge, and the southwestern coast of the Korean Peninsula appears turbid due to strong tidal currents. To estimate SPM from reflectance data, the GOCI Data Processing System (GDPS) suggests two types of SPM algorithms: the Yellow Sea Large Marine Ecosystem Ocean Color Work Group (YOC) algorithm and the Case II algorithm, based on three bands at 490 nm, 555 nm, and 660 nm (Siswanto et al., 2011; Min et al., 2012). Detailed validation results of the SPM retrievals are presented in Siswanto et al. (2011). The coefficients of the YOC SPM in Equation (5) were derived empirically using in situ measurements in the GOCI region in the seas around the Korean Peninsula, as follows:
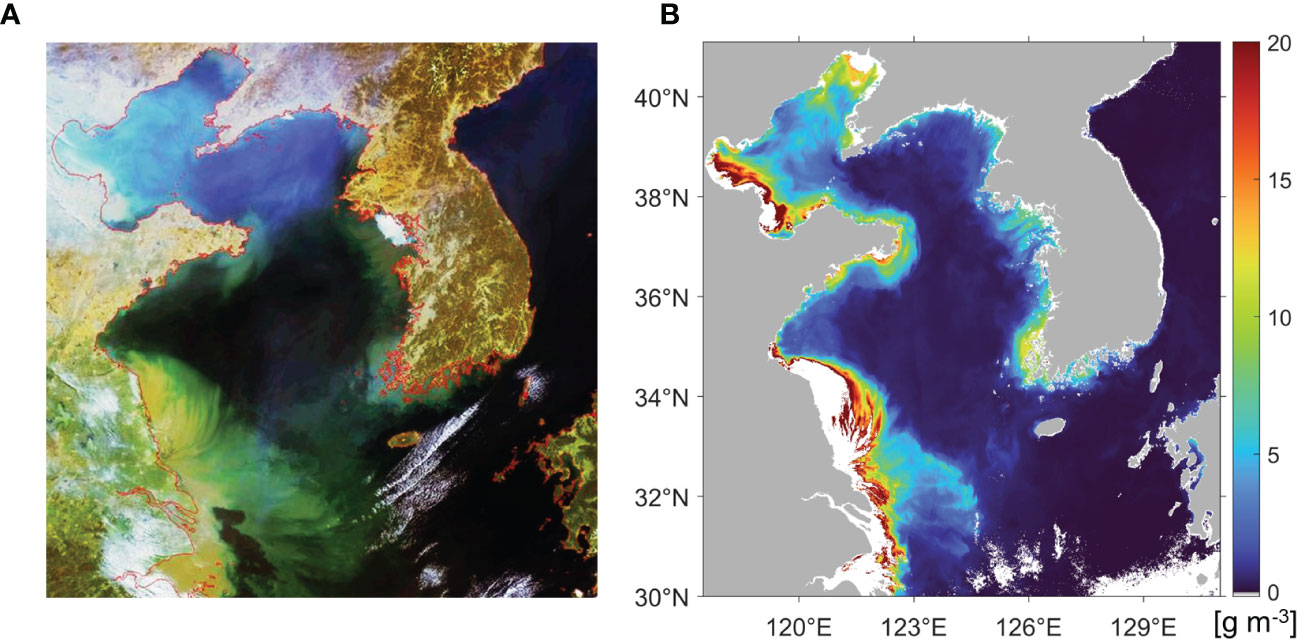
Figure 5 (A) An example of true color image of GOCI on a clear day (April 5, 2011) and (B) one-day composite of SPM estimated by YOC SPM algorithm (Siswanto et al., 2011) on October 2, 2015. The white color indicates an extremely turbid area or cloud-masked area.
The annual mean SPM was calculated to examine whether the seawater around Jeju Island was clear or turbid. The overall SPM concentration values in the offshore regions were relatively low, less than 1 g m-3 (Figure 5B). As evident in Figure 5B of the SPM concentration image, the sea waters surrounding Jeju Island exhibit markedly lower SPM concentrations compared to the southwestern coast of the Korean Peninsula and the Yangtze River estuary.
In the vicinity of Jeju Island, the SPM values exhibit significantly lower levels (SPM< 0.8 g m-3) compared to the adjacent areas near the Yangtze River, coastal regions of China, and the southwestern coast of the Korean Peninsula, where SPM ranges from 10 to 20 g m-3. The spatial distribution of SPM variations near the coastal areas of Jeju Island demonstrates remarkably subtle differences even at very small SPM concentrations (Figure 6). The SPM of the northern coast was higher than the SPM of the southern coast in most years. The interannual variations showed that the SPM values of the northern onshore regions were higher than those in the southern coastal area (~0.5 g m-3) in 2014 and 2017. The SPM concentration in the onshore region surrounding Jeju Island reached its highest level in 2016. The spatial distribution revealed that SPM values in the coastal region around Jeju Island were very small compared to those in the highly turbid waters from the Yangtze River and near the southwestern coast of the Korean Peninsula. Therefore, the environment surrounding Jeju Island has clear optical conditions with relatively low SPM values (~0.5 g m-3), distinguishing it from the turbid areas.
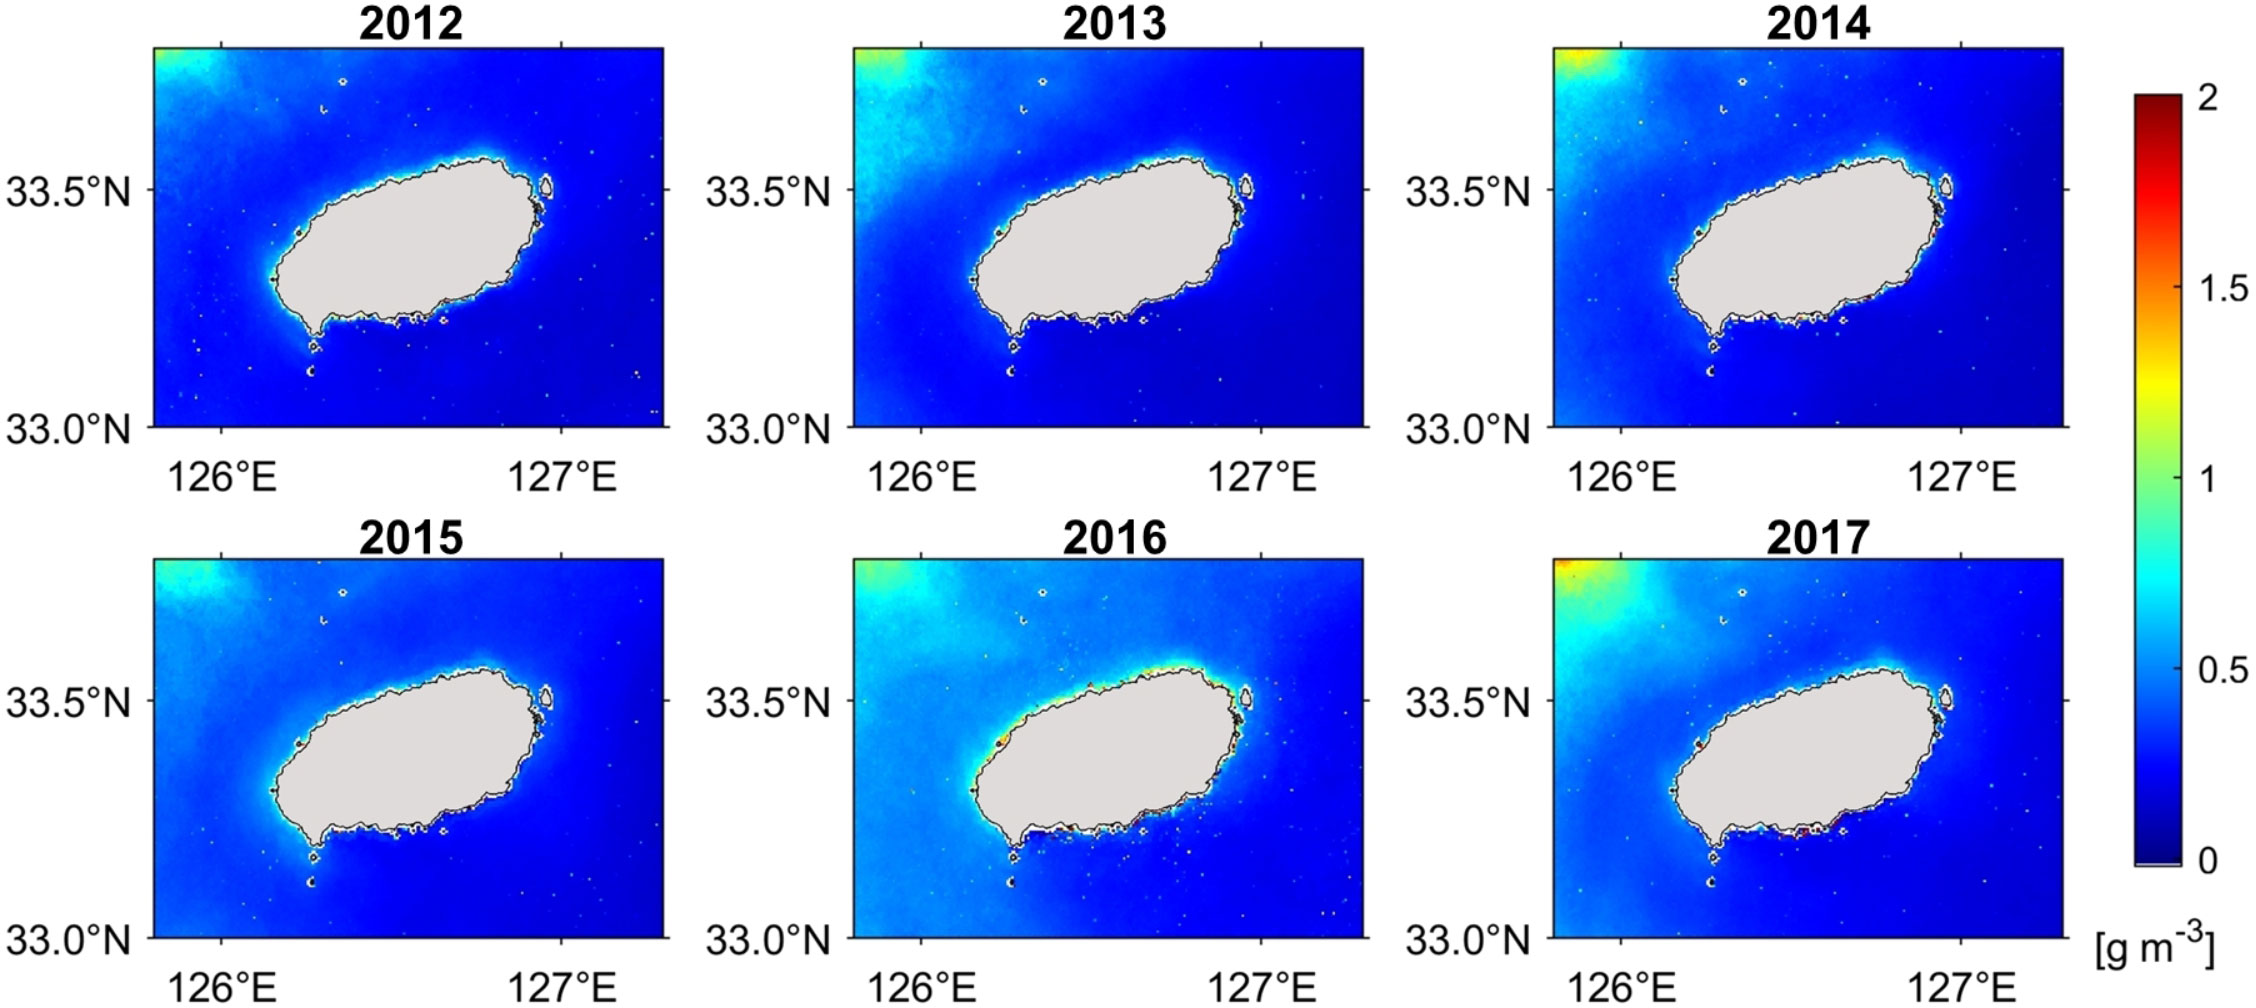
Figure 6 Spatial distribution of annually averaged suspended particulate matter (g m-3) around Jeju Island from 2012 to 2017.
Using the calculated NRTI, we examined the variation of red tides around Jeju Island. We investigated the NRTI data for the six years from 2012 to 2017 and found an extreme case of red tide in 2016. The red tide in 2016 was the only case with a wide distribution that extended even to the south. Therefore, we selected the red tide events that occurred in 2016 to investigate the spatial distribution and temporal evolution of the red tide. Figure 7 shows the daily NRTI for the two most distinctive cases of red tide, which occurred in the spring and late summer of 2016. The daily representative NRTI was taken as the median of the NRTI values for eight daytime observations at every hour. The colors in Figure 7 indicate the NRTI values on the logarithmic scale of NRTI+1, by which we avoided zeros in the log by adding the number 1. Figure 7A shows the daily NRTI distributions, except for some days with high cloud cover, in April and May 2016. In spring, a high NRTI of more than 100 was observed in the northern and eastern areas for more than 20 days (Figure 7A). These high signals first appeared in the western offshore region in late April, congregated along the northern coast, and then appeared at the eastern coast from May 12. The duration of the red tide from appearance to disappearance was approximately 20 days. The highest NRTI, corresponding to >7,000 cells/ml according to the density retrieval algorithm (Lee et al., 2021), appeared in the image for May 17. However, red tides were barely visible on May 16, and there were no remarkable NRTI values. This seems to have been caused by the passing of many clouds on that day and the abundant water vapor near the clouds, which might have increased the uncertainty of the atmospheric correction procedure. The GOCI cloud removal algorithm tends to be strong enough to remove shoreline regions during the data processing of a series of atmospheric or land-proximal calibrations. This case suggests that both offshore and onshore regions around Jeju Island are vulnerable to red tides in spring and have a high possibility of harmful algal blooms.
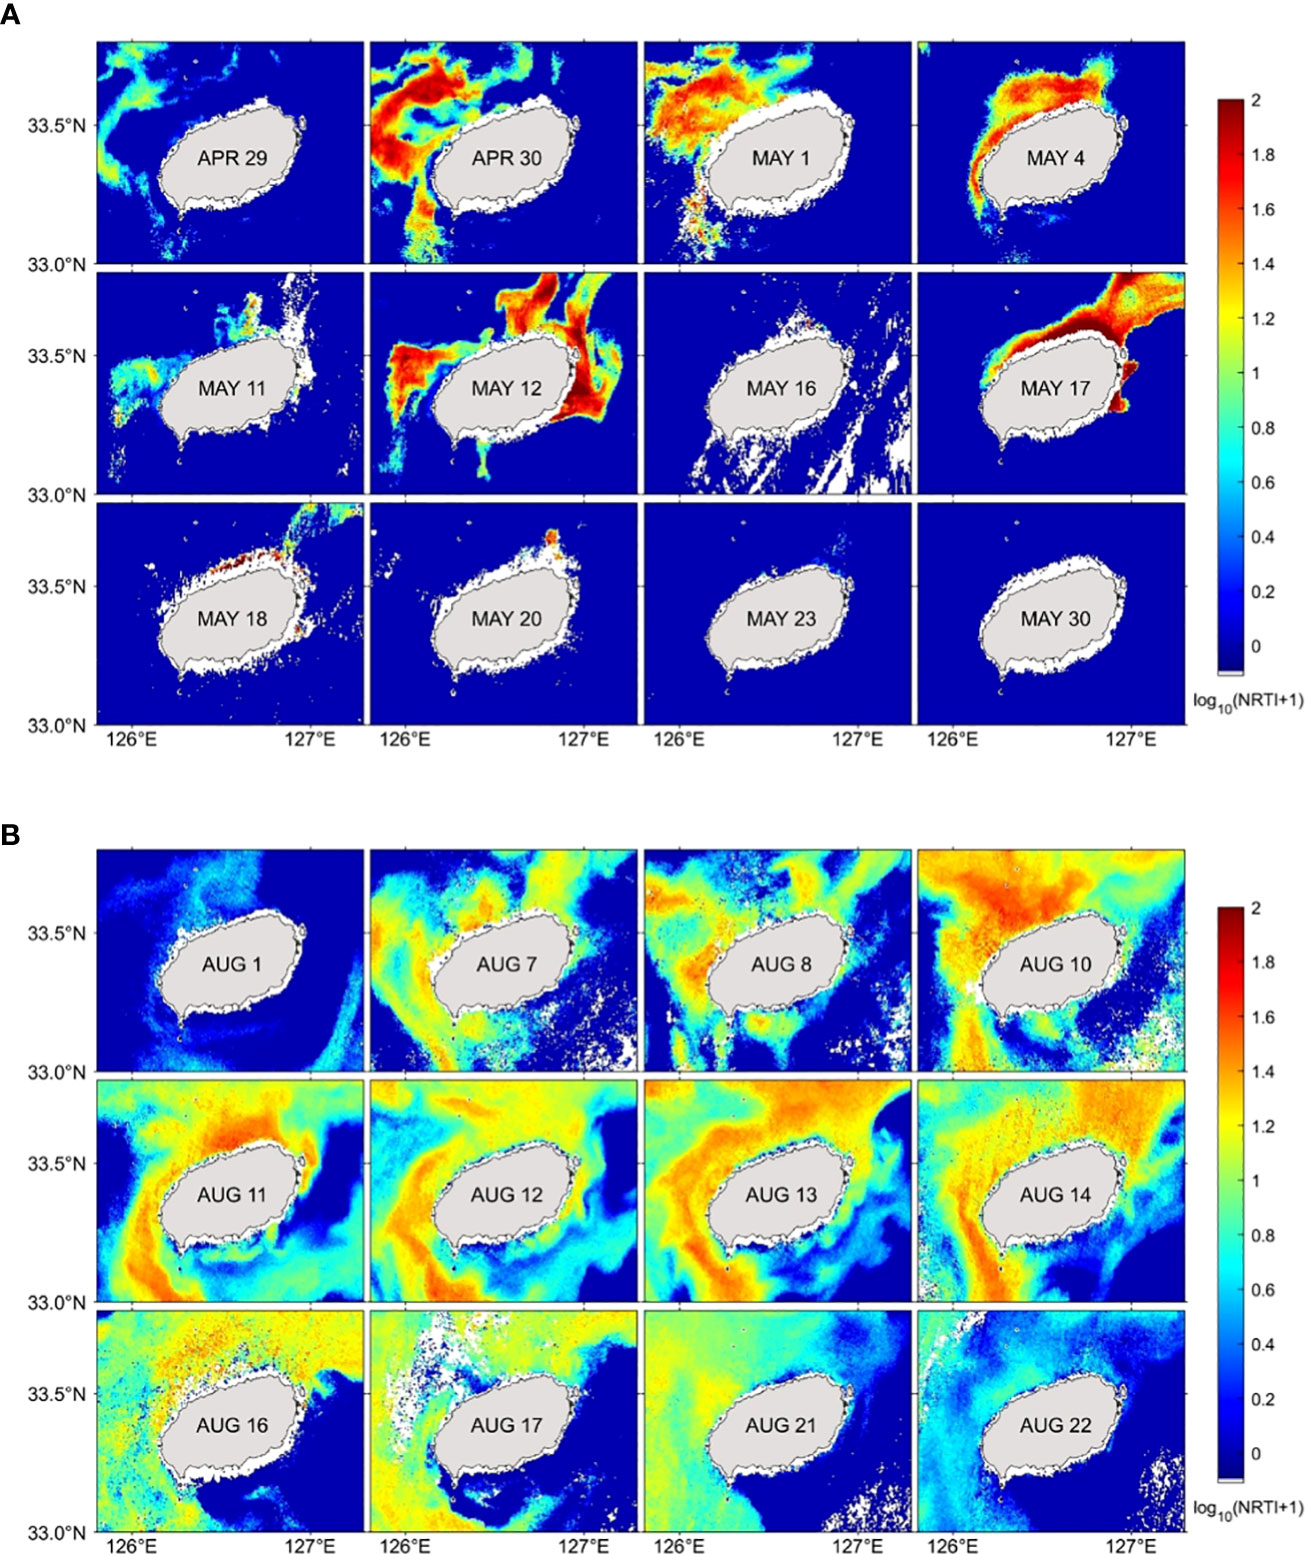
Figure 7 Spatial distribution of red tide index in (A) spring and (B) summer of 2016. Colors represent the red tide index in logarithmic scale (log10NRTI+1).
Specific red tide events were observed during the summer of 2016 (Figure 7B). In this case, the NRTI values were lower than 100, much smaller than those in spring. However, the red tide spatial coverage extended widely along the western and northern coastal regions of Jeju Island. According to Lee et al. (2021), the cell intensity of the red tide at this time was approximately 6,000 cells/ml. This bloom lasted approximately 15 days, a duration similar to that of the first case in spring (Figure 7A). During this period, the high signal of the red tide appeared and persisted along the western coast (Figure 7B). The temporal phase lag between the western and northern regions indicates the possibility of red tide advection from the northwestern coastal region to the northeastern coastal region. Most of the southeastern area showed the lowest NRTI values during the entire time, as was also the case in spring. The spatial patterns are likely parallel to the iso-depth lines along the island. As mentioned in Lee et al. (2021), a strong red tide bloom occurred along the southern and eastern coastal regions of the Korean Peninsula in 2013. However, there were no dominant red tides in the coastal region surrounding the Korean Peninsula in 2016, despite the high red tide blooms in the coastal region of Jeju Island. This implies the possibility that the red tide of Jeju Island was not directly linked to the mainland of the Korean Peninsula because of the large separating distance of approximately 50 km. In 2016, red tide blooms appeared more strongly and clearly in spring than in summer.
To comprehend the interannual variation of red tides in the region, fundamental features at a given location, such as the annual mean, standard deviation (STD), and maximum daily median NRTI, were derived for each year from 2012 to 2017 (Figure 8). All of the variables exhibited dominant year-to-year variations, which were most apparent in the northern coastal region and the northwestern offshore region. The signal in the northwestern offshore was strong, but it did not occur commonly. In 2013, a red tide appeared along the northern side of Jeju Island, as shown by the mean pattern of the NRTI. However, the highest red tide signal was observed in 2016 when a red tide bloom appeared on the eastern coast. The spatial distribution of the maximum NRTI values demonstrated that red tide events were concentrated along the northern and eastern coastal regions nearest to the shoreline in 2013 and 2016.
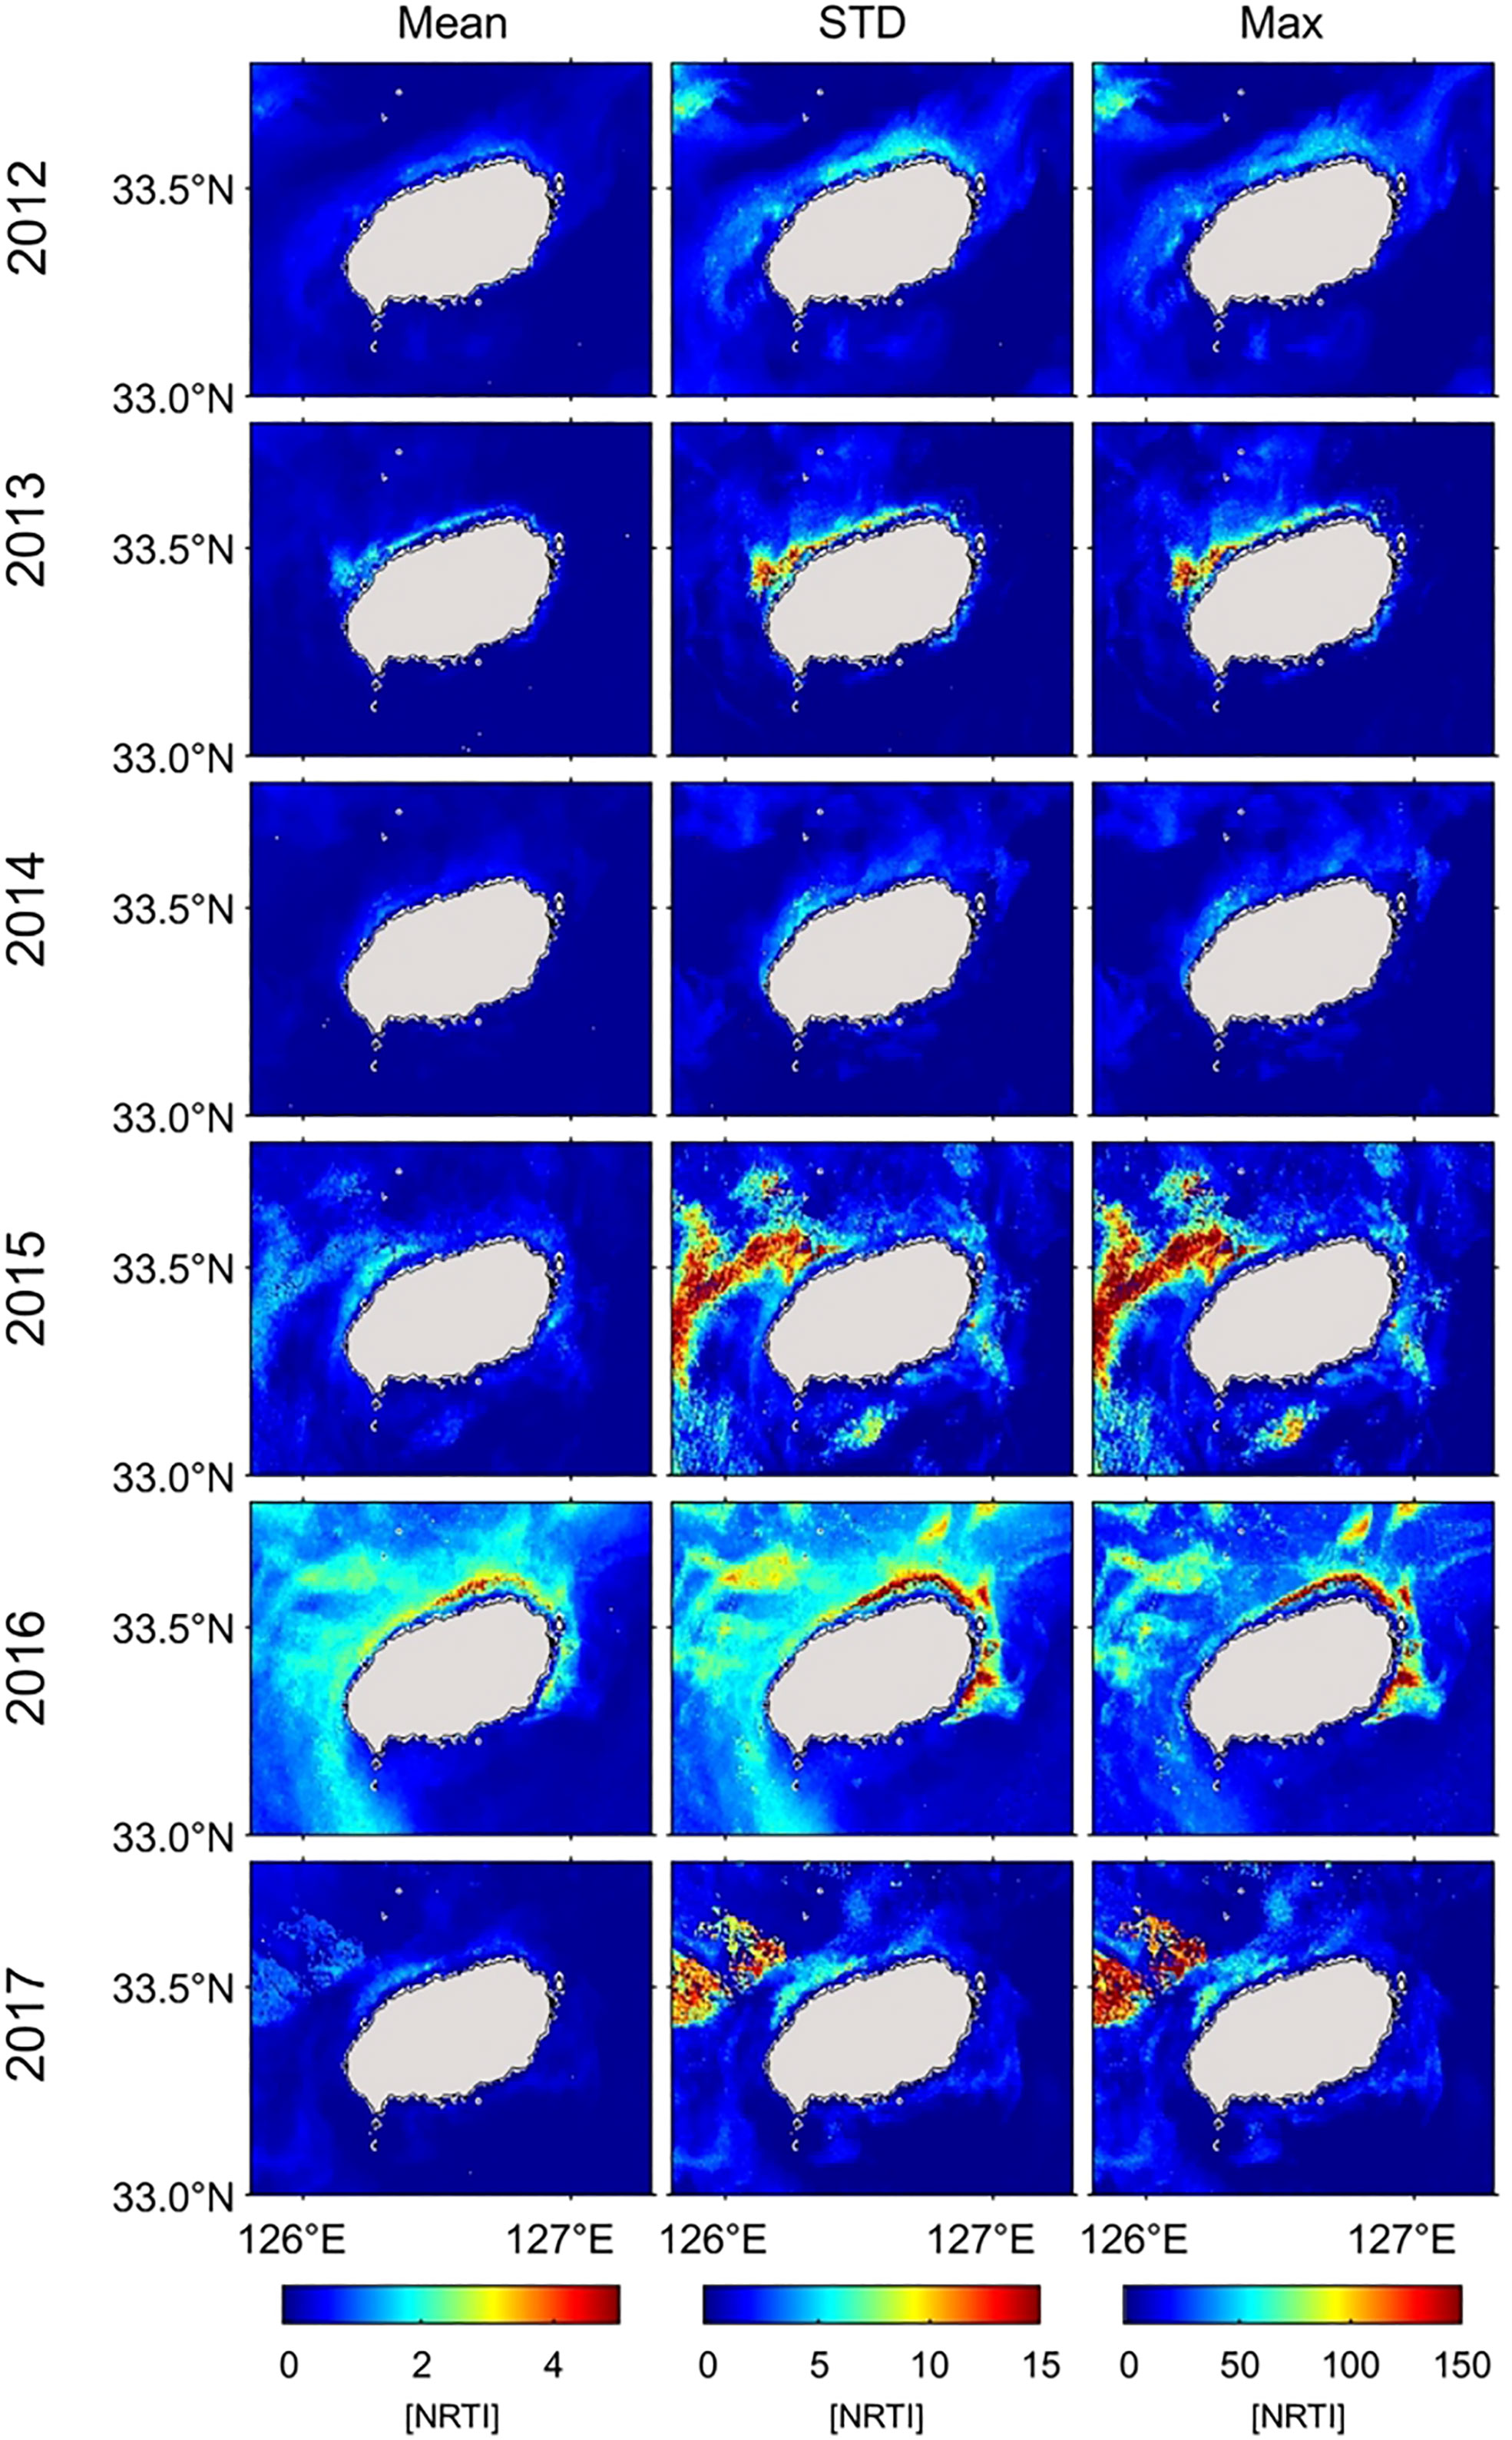
Figure 8 Spatial distribution of annual mean, standard deviation (STD), and maximum values of red tide index (NRTI) in each year from 2012 to 2017.
The earliest three years (2012–2014) had lower NRTI values than the latest three years (2015–2017) and high values occurred only on the northern coast. The latest three years had high STD and maximum values. In 2015 and 2017, high NRTI values appeared in the far-offshore regions, which was very different from the pattern in other years. The offshore high-red-tide patterns appeared similar in both years, but the pattern connected to the coast in only 2015.
To investigate any seasonality and interannual variability, we calculated the monthly variation in the NRTI for the study period (Figure 9). Overall, red tide intensity tended to appear strongly, with a high NRTI (>10), in April. In 2013, NRTI began to appear near the northern coast in April and reached its peak in May. The NRTI values were mostly low (approximately 5) in April 2014. In 2015, NRTI values were much higher than 12 in the western region, and the extent was the greatest among all other years. Red tide encircled the entire island in May and persisted until June, particularly in the northern and northeastern regions. As mentioned earlier, the NRTI values were strongest in May 2016. Most of the NRTI values peaked in April. However, in 2016, they appeared to be highest (~15) in May instead of April, which was typical of the other years. The northern red tide appeared to advect to the eastern coast of the island. The red tides were relatively weak during summer. However, in 2016, the NRTI values were higher (approximately 8) than those in the other years.
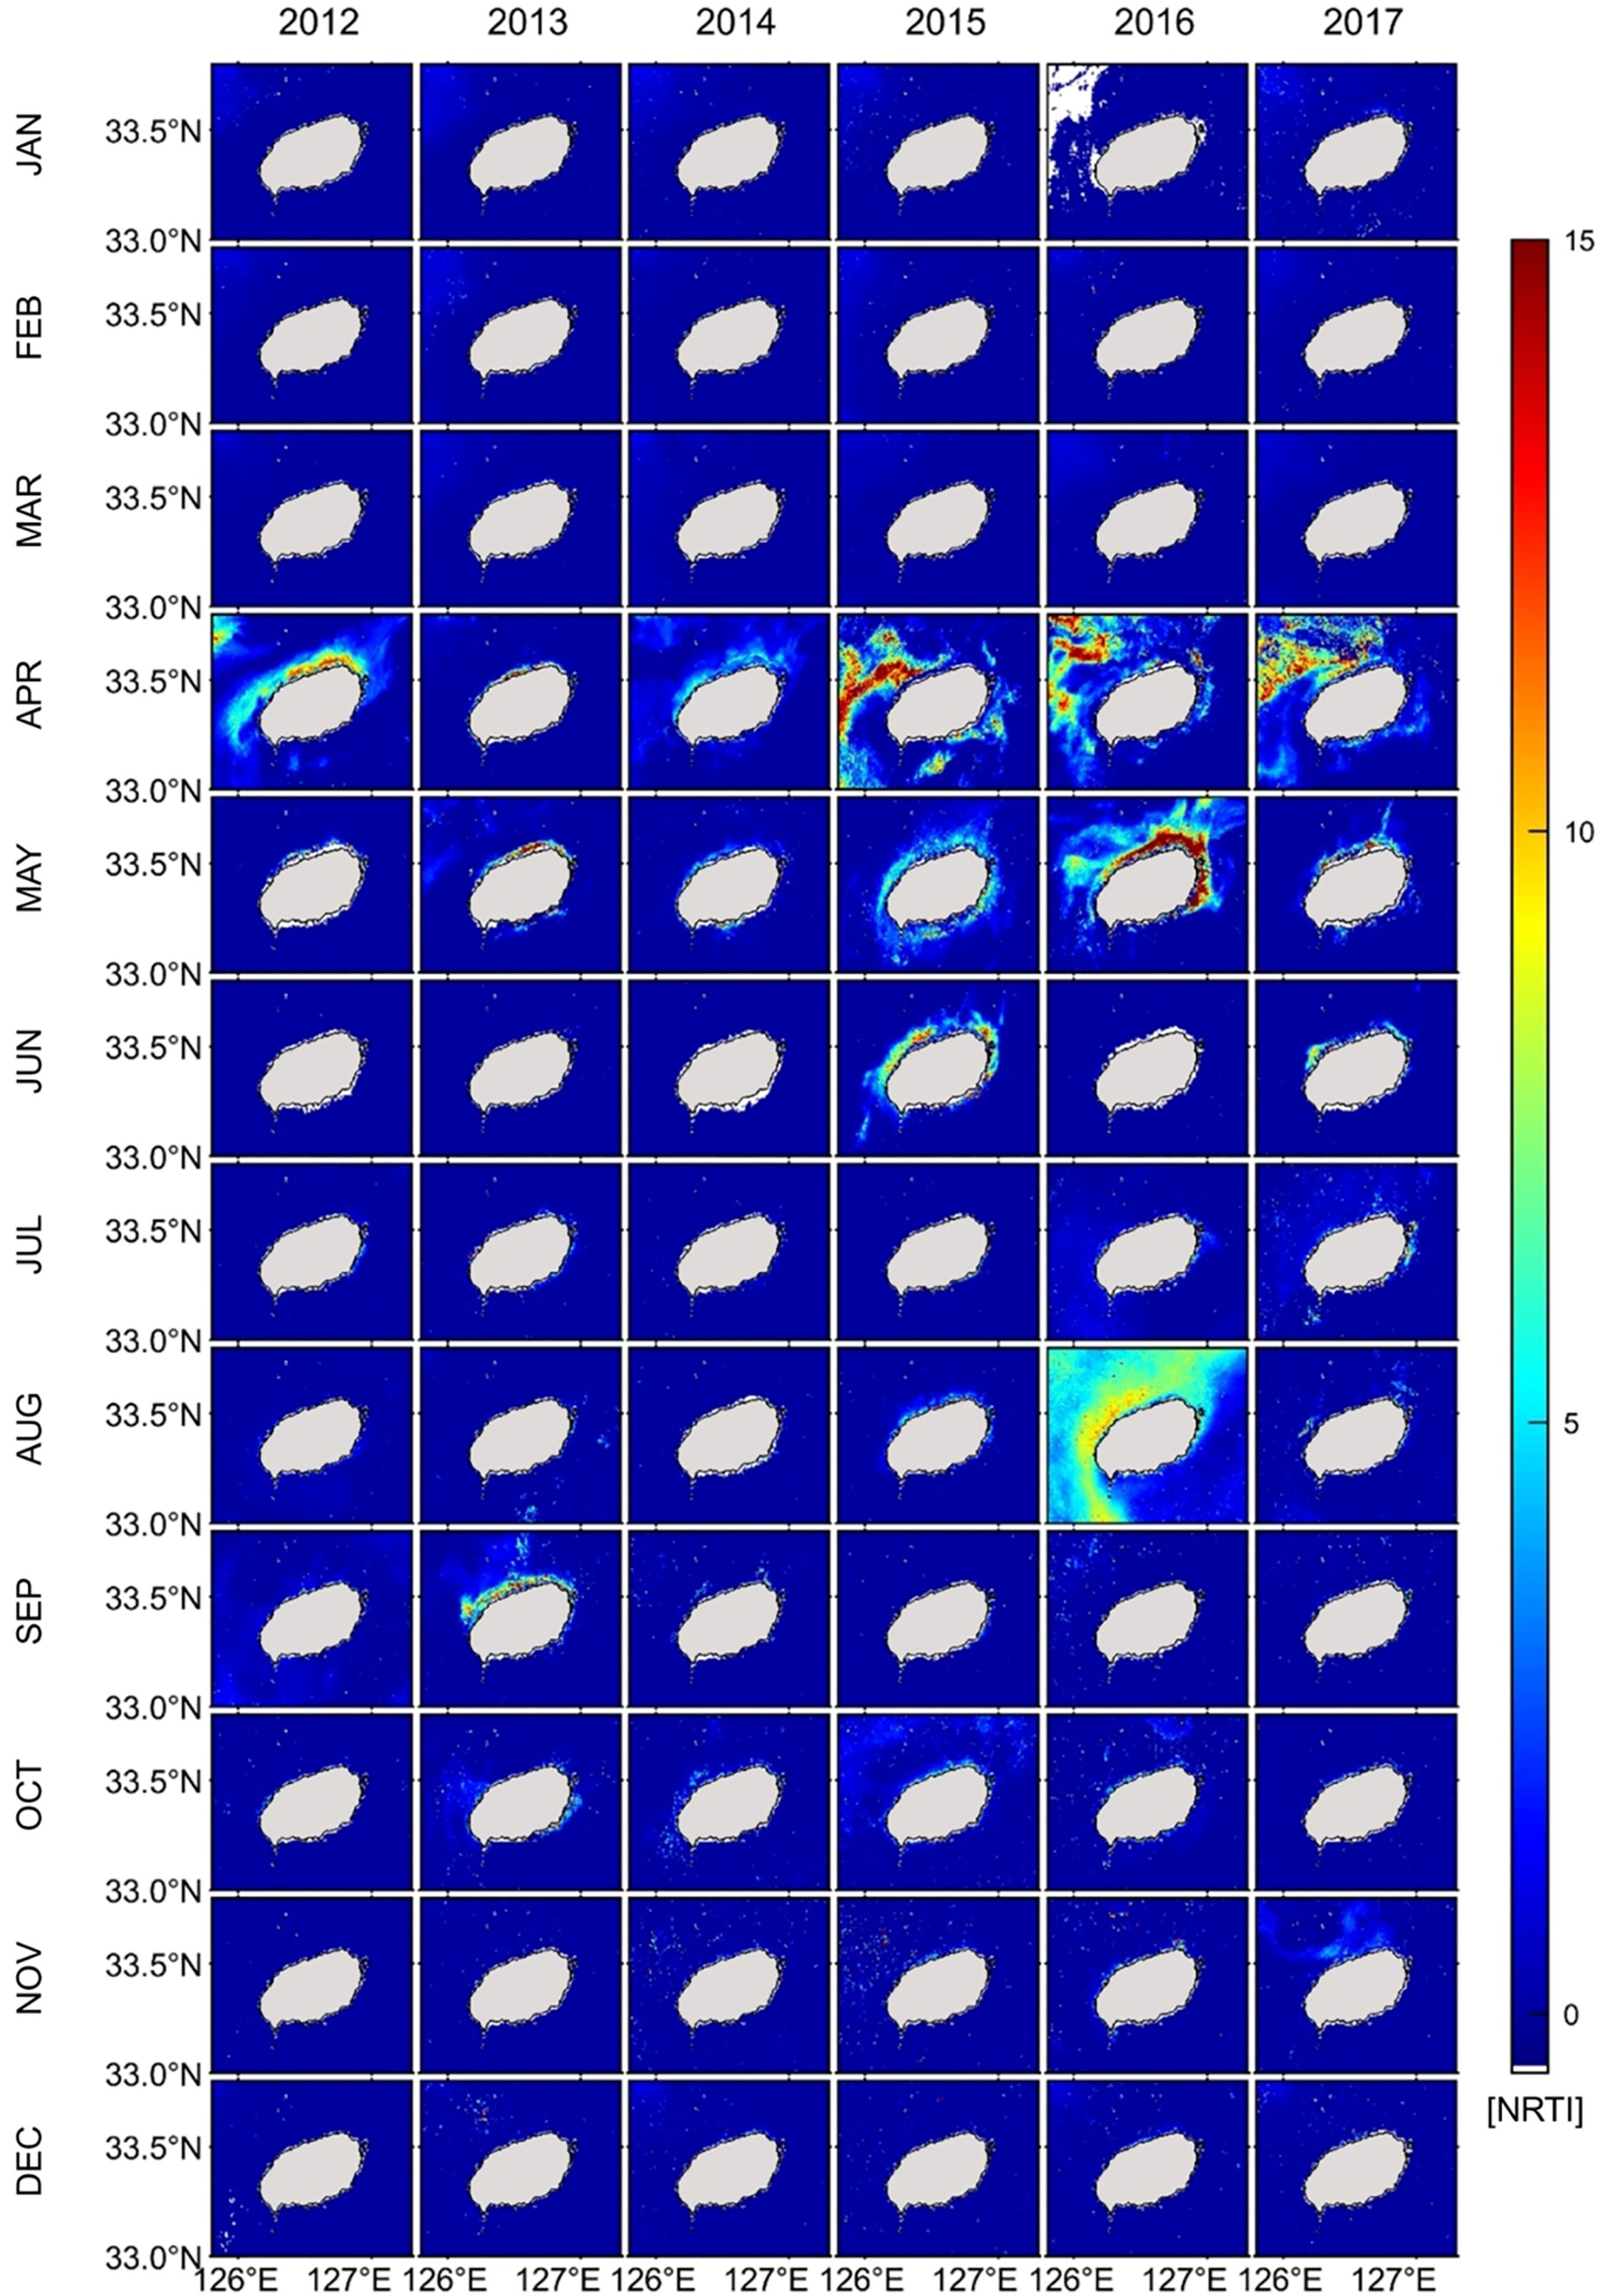
Figure 9 Monthly distribution of red tide index of each year from 2012 to 2017.
The common patterns throughout all years were characterized by high NRTI values concentrated at the northern coast with some partial linkage in the offshore region in April and no particular relation in other months. In winter and early spring (December to March), the NRTIs were the lowest annually, implying no red tide events in winter. The highest red tide blooms began in April to May, mostly in offshore regions, as shown in the latest three years, followed by onshore red tide blooms in May to June. May 2016 had the strongest coastal blooms, and the peak area was located on the northeastern coast. Although the NRTI magnitudes were much smaller than those in spring, late summer blooms were observed in August to September 2013 and 2016, but there were distinct differences in their spatial patterns. The 2016 late summer bloom pattern was not observed again during 2012–2017. The spatial patterns of August 2016 are likely associated with iso-depth, which is one of the most controlling factors of marine environments, similar to daily variation.
In the previous section, we presented the monthly and interannual variations of red tides around Jeju Island. To check where red tide has occurred frequently around Jeju Island, we obtained the red tide probability P based on the NRTI values for the six years using GOCI data from a simple formula:
where Ni is the number of days without cloud (Figure 10A) and M is the number of days with high NRTI values greater than a given threshold (Th3 = 0, 1, 10, 30, 100). A relatively smaller number of observations along the near-coastal region than in the offshore region is associated with the strong cloud-masking procedure of GDPS near land (Park et al., 2014). GOCI sea surface observations without clouds were constant along the coast. Figures 10B–F shows the probability (P) of red tide occurrence based on GOCI observations for the six years with NRTI values greater than 0, 1, 10, 30, and 100, respectively. High NRTIs (>10) in the study area were most frequently observed on the northern coast, where they reached up to 30 days. According to Lee et al. (2021), an NRTI of 10 (30) may indicate a cell density of more than 10,000 (15,000) cells/ml if the species is C. polykrikoides.
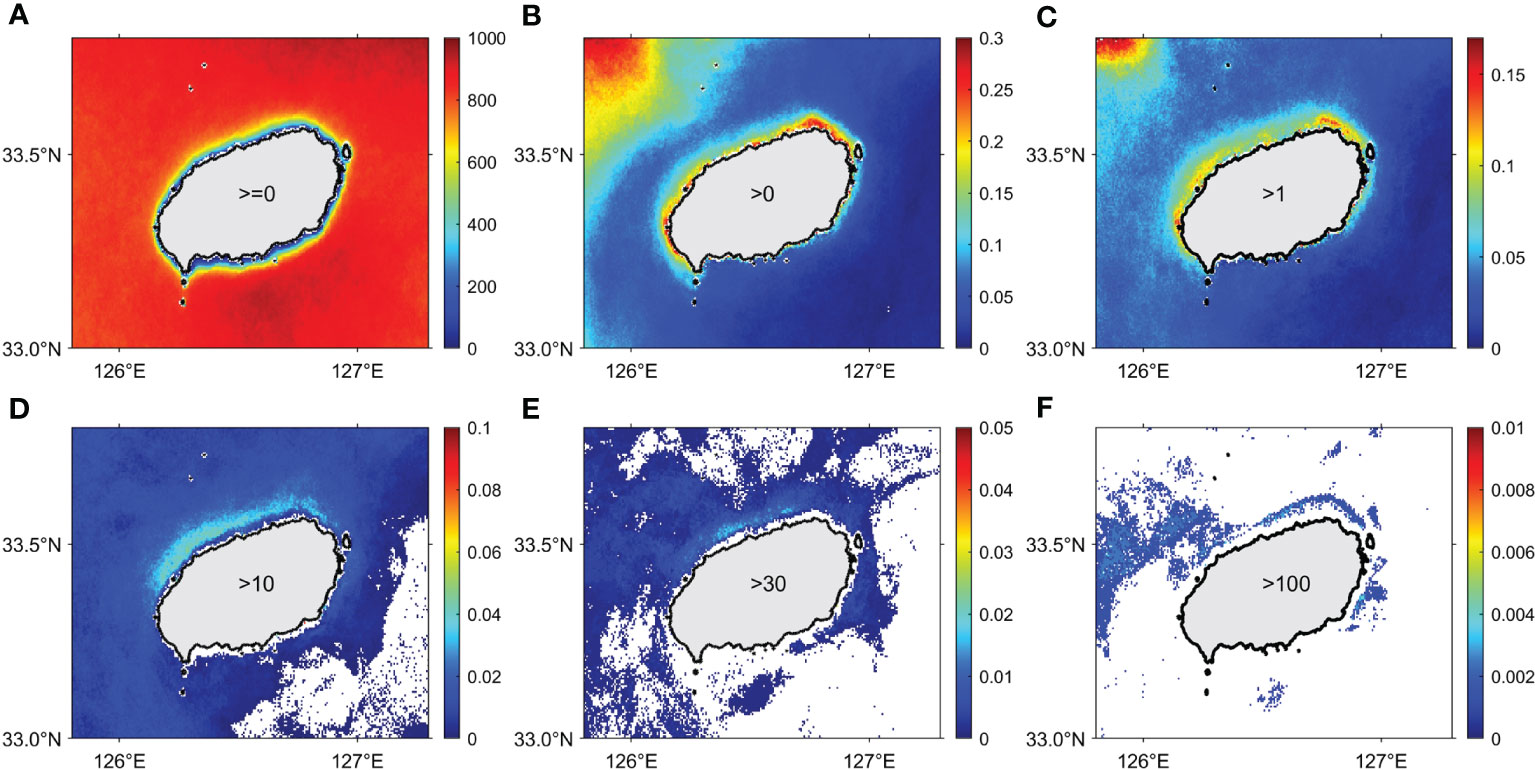
Figure 10 (A) Number of days during the 6 years (2012–2017) when GOCI captured the sea surface, (B–F) probability of NRTI being greater than (B) 0, (C) 1, (D) 10, (E) 30, and (F) 100.
As indicated in Figures 10B–F, the northern coastal regions showed a much higher probability than the southern coastal regions throughout the thresholds. In contrast to the northern and eastern regions with high probability, the southern region had very weak probability. As a result of the statistical analysis of a vast amount of satellite data, this study revealed that the seawaters around Jeju Island were not free from red tides but rather had frequent occurrences of them.
Because the waters around Jeju Island are relatively deep and optically clear, remarkable NRTI values were an unexpected result and could arouse some doubt. Most of the extremely devastating red tide events have been concentrated in the southern coastal region of the Korean Peninsula, far from Jeju Island. To ensure that such red tides have occurred before, we searched all literature and records on red tides near Jeju Island and summarized the reported red tide events, as shown in Table 1 (https://www.nifs.go.kr/board/actionRedtideInfoList.do). According to the literature survey, previous red tides occurred seven times from 1990 to 2020. The most frequent species were Mesodinium, but other species such as Noctiluca spp. and Karenia mikimotoi were observed sporadically. In a television documentary on water quality produced and broadcast in 2021, a researcher at Jeju National University reported red tide blooms caused by Mesodinium sp. The researcher reported several red tide events in the coastal area of Jeju Island. However, this has not been mentioned in NIFS red tide reports released over the past decades.
To visualize the locations and magnitudes of the red tide occurrences, we constructed a plot of all observations, shown as Figure 11. The colors represent the red tide cell density on a logarithmic scale, and the white circle indicates no density information. The four red tide events in the northern coastal regions had densities of 1,360–20,000 cells/ml. Additionally, two events occurred on the southern coast and one event was observed in the southwestern coastal region. An interesting red tide observation was made in the far-offshore southwestern region in 2018, as marked by the black circle in Figure 11A. This implies that the red tide phenomenon was not limited to onshore or near-coastal regions, but extended to regions far offshore. In addition, we digitized monthly red tide observations from 1990 along the coast of Jeju, as shown in Figure 11B (Yoon et al., 1991). The northwestern coastal regions showed the highest cell density, with different dominant species according to the NIFS report, including Chaetoceros spp. In this monthly observation, red tide cell density was generally higher along the northern coast than along the southern coast. Dominant species included Chaetoceros spp., Skeletonema costatum, and Heterosigma akashiwo, which were abundant on the northern coast. In addition to these species, other species, such as Prorocentrum triestinum, Karenia spp., Gyrodinium spp., Eutreptiella spp., and Mesodinium rubrum were observed during this period.
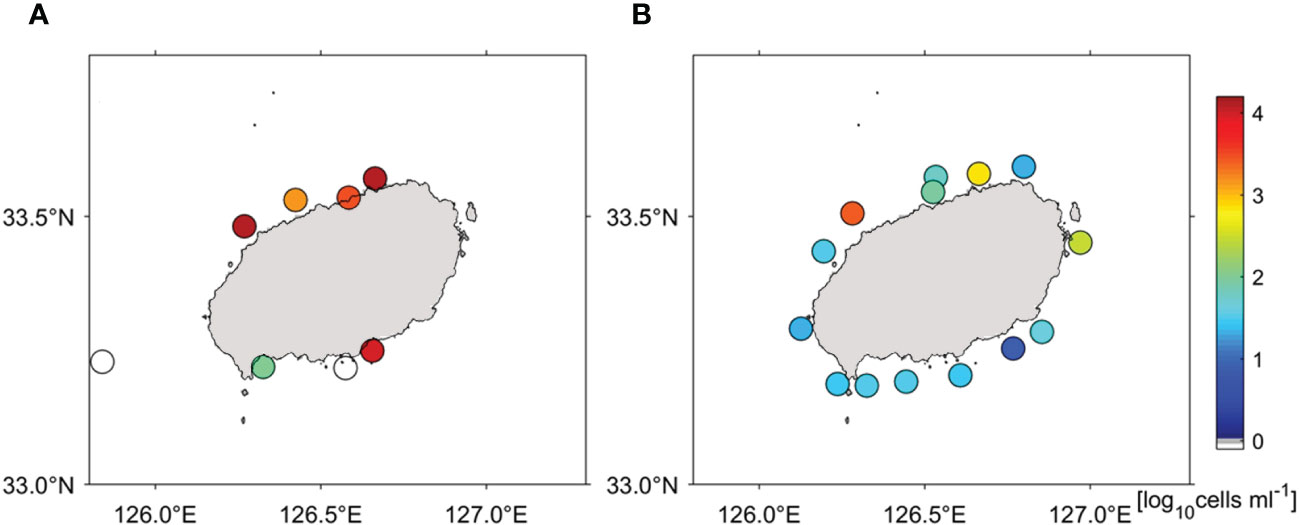
Figure 11 (A) Scatter plot of red tide density values observed in previous studies for the period from 1990 to 2020 and (B) the mean red tide density in summer and fall in 1990 (Yoon et al., 1991).
In this study, we constructed an hourly satellite red tide index database for six years and characterized the spatial pattern and temporal variability of red tides around Jeju Island. Red tide blooms appeared sporadically in late spring (April–June) of every year during the study period and in late summer (August–September) in 2013 and 2016. Strong year-to-year variations of the red tides were detected, with the longest bloom in 2015 and the most extensive bloom in the spring of 2016. Red tides were more intensive in the later three years (2015–2017) than in the earlier three years (2012–2014). Additionally, the northern coast of Jeju showed higher probability of red tide than the southern coast. Red tide bloom tended to start in the northwest, develop toward the northeast, and disappear in the east. According to the ground red tide observations, more events were observed on the northern coast than on the southern coast. The dominant species were Mesodinium spp. and Chaetoceros spp., which are known to show a spectral reflectance by multispectral satellites similar to that of M. polykrikoides. Analyses of the previous literature on red tides near Jeju Island revealed several species of red tides around the coast of the Island, as shown in Figure 12. Although there were no available GOCI data to compare with the measurements made before the launch of GOCI, the observational differences between the regions north and south of Jeju Island were consistent with our results based on the satellite approach.
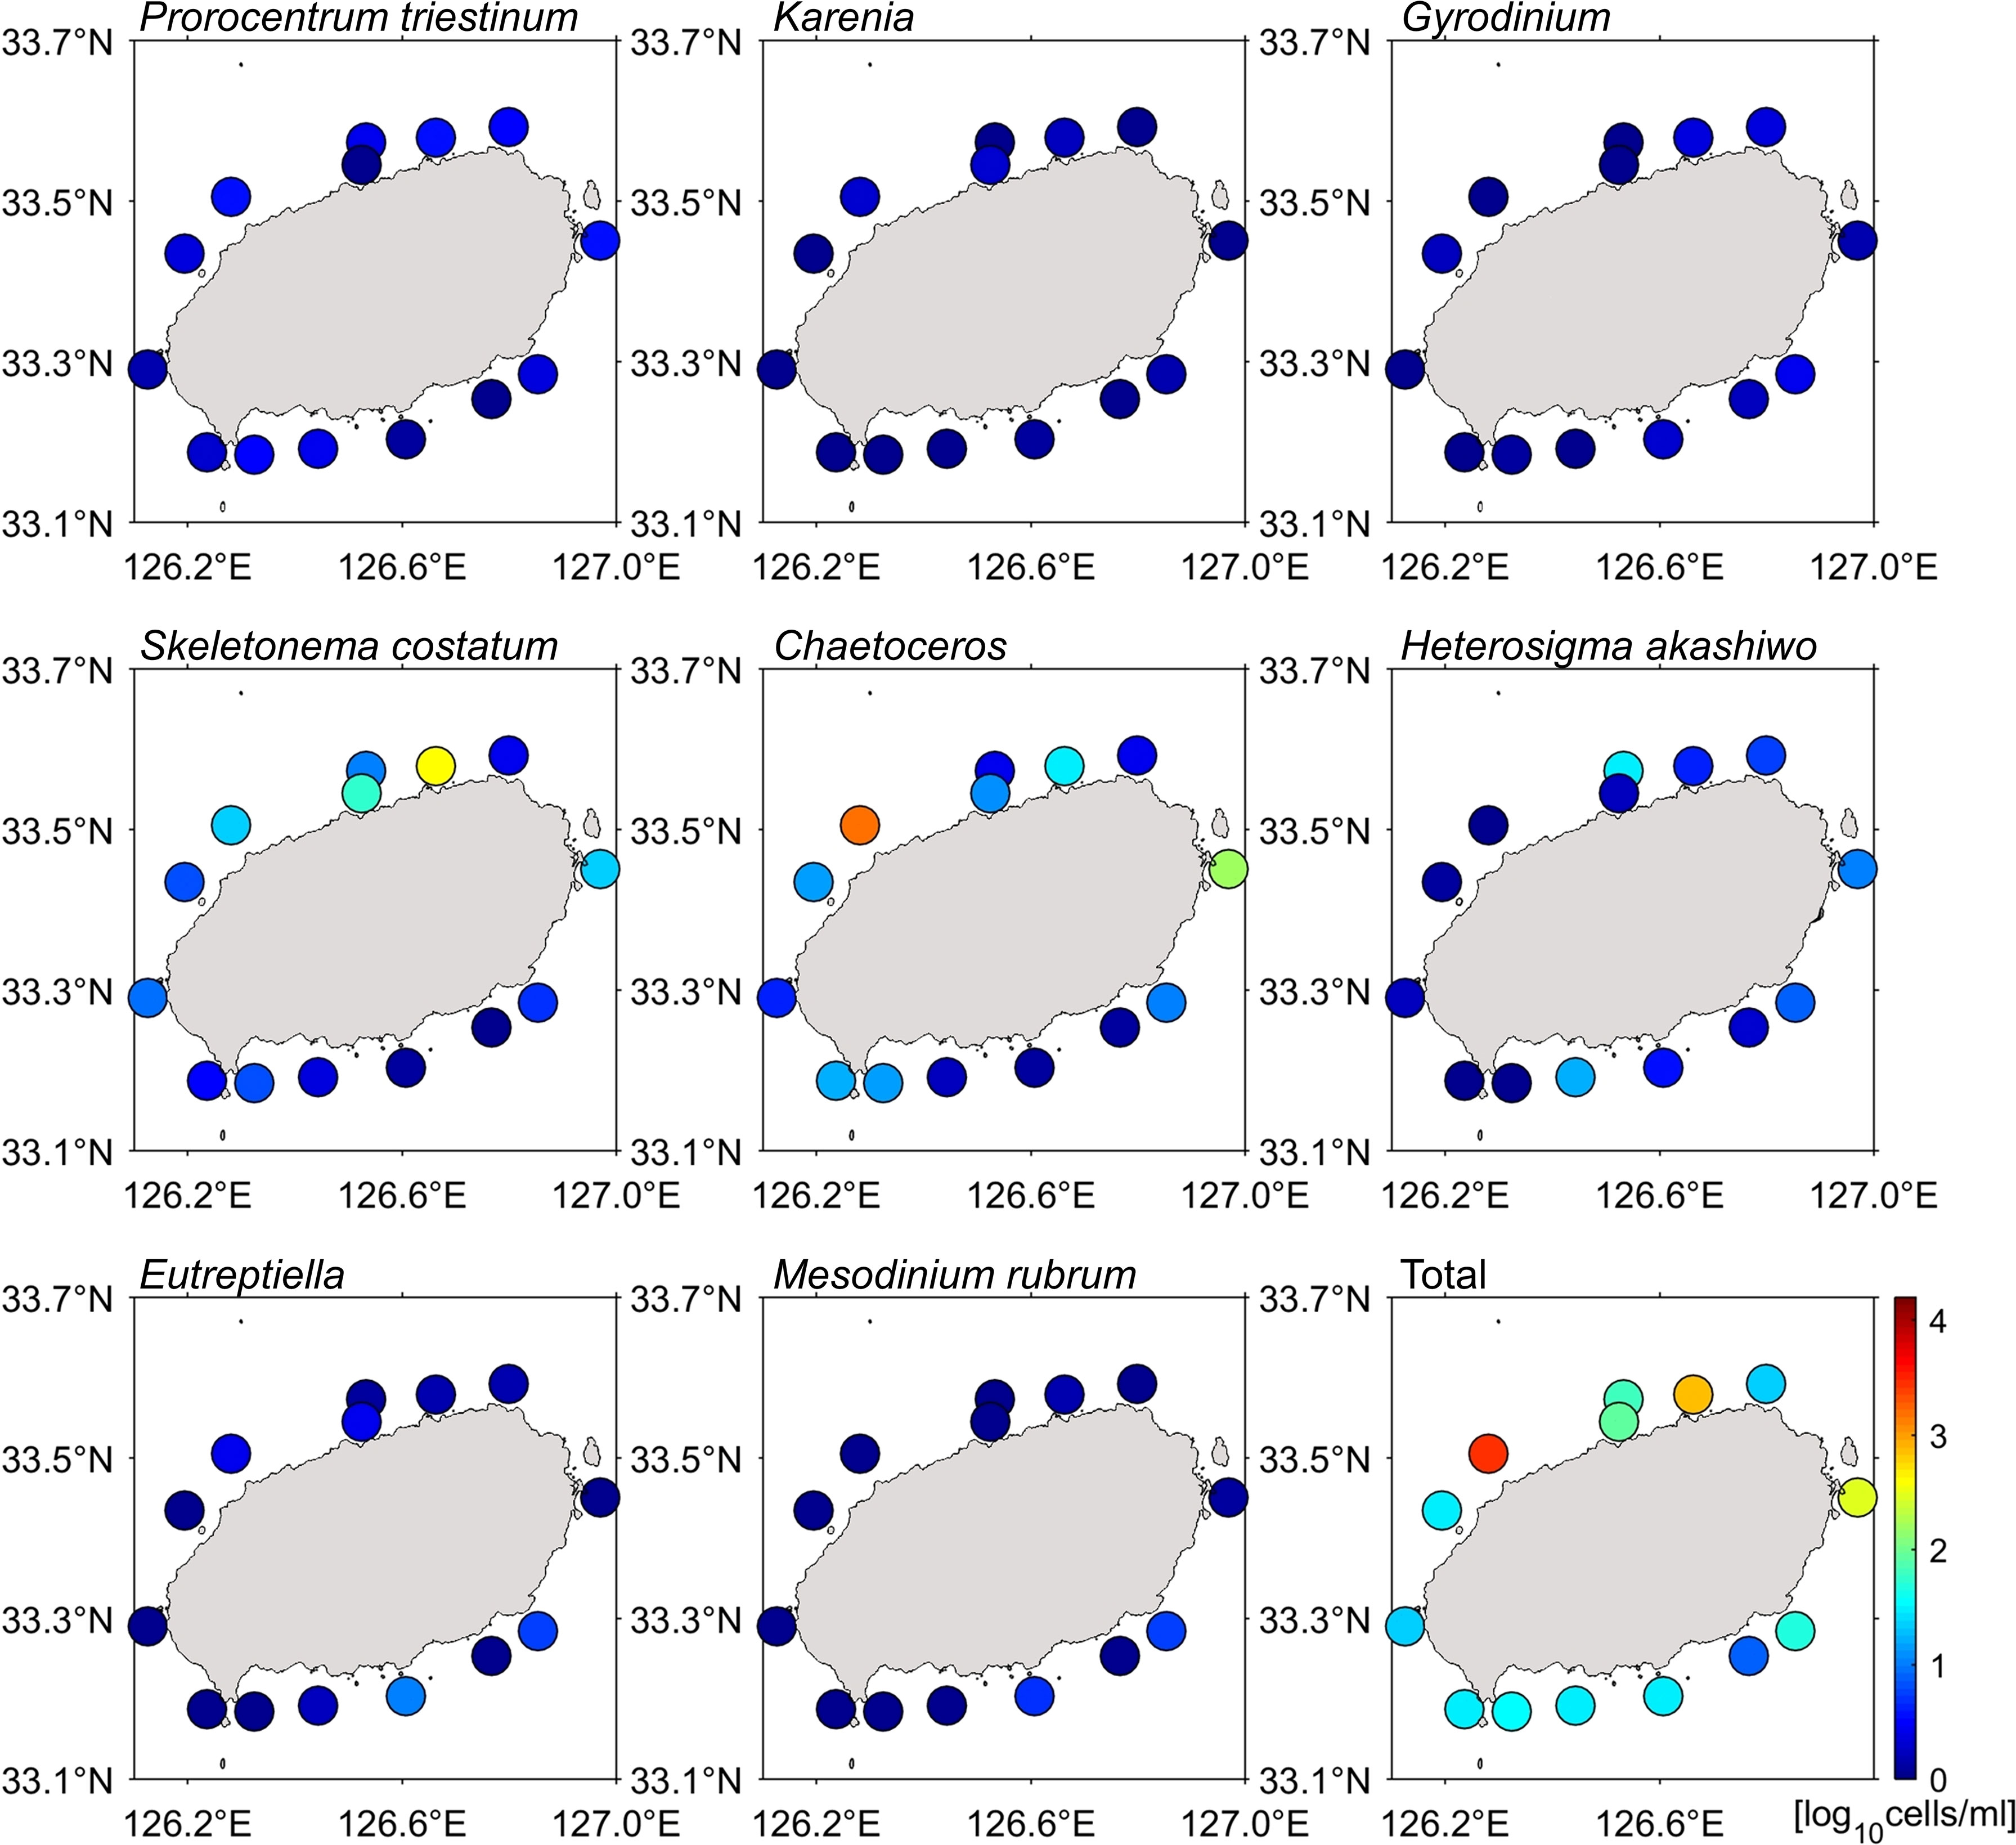
Figure 12 Scatter plots of red tide density values along the coast of Jeju Island reported in the previous literature (Yoon et al., 1991). The words within Jeju Island represent red tide species, and the final plot represents the red tide density of all species in logarithmic scale.
the northern coast of Jeju Island showed higher red tide probabilities than the southern coast. Thus, one of the other causes of difference could be a north–south distinction between oceanic and atmospheric environments. For example, annual precipitation in the northern and southern coastal regions of Jeju Island is 1,459.9 mm and 2,154.5 mm, respectively. In addition, the difference in number of groundwater spring sites between the northern coast and the southern coast (387 versus 269, respectively) could be related to the more dominant red tide in the northern region.
In addition, the oceanic environment associated with warm currents could be related to the occurrence of red tides. The low-salinity water from the Yangtze River along the coast of China moves to the east between the northern coast of Jeju Island and the southern coast of the Korean Peninsula, which affects the seawater environment in the coastal region of Jeju Island (Figure 1A). Moreover, the Jeju Warm Current flow near the northern coastal regions of Jeju. The effects of these two factors should be studied further to understand the north–south difference in red tide events. The waters around Jeju Island are exposed to a rapidly changing marine environment. Even in the offshore regions, the retrieved red tide index data demonstrated obvious blooms. These red tides around Jeju Island seem to be affected by various ocean–atmosphere–land interactions. Climate change and extreme weather events are likely to cause unexpected red tides.
Red tide intensity showed significantly different characteristics by year. Especially later three year (2015-2017) showed higher annual mean NRTI than prior three years (2012-2014). This tendency might be consistent with the case of Tasmania, Australia, which had weak dinoflagellates bloom (Alexandrium catenella) in 2013–2014 and strong ones in 2015–2017 (Trainer et al., 2020; Xie et al., 2021; Wakamatsu et al., 2022). In addition, red tide caused by extreme weather occurred in Chile in 2016 (Armijo et al., 2020; Mardones et al., 2021), and an unusual case (2016 late summer, Figure 7B) occurred on Jeju Island in the same year. Although it is not simple to reveal the linkage between the extreme events, 2015-2016 coincids with the strongest El Nino years since 2000. There are many imprints of climate variability on the marine environment, and satellite-observed phytoplankton growth data in the seas around Korea during extreme Arctic Oscillation (AO) and El Niño Southern Oscillation (ENSO) periods are required to study whether the red tide fluctuations at Jeju are also affected by climate change, as mentioned by Park et al. (2022).
Figure 13 shows NRTI and ENSO index (Niño 3.4, Rayner et al, 2003) variability for the Jeju Island region over the study period from 2011-2017 (Figures 13A, B). The year-to-year variabilities of both the NRTI in spring (May) (Figure 13C) and the annually averaged NRTI (Figure 13D) are strongly correlated to the January ENSO index variability from 2011-2017 (R2 = 0.9696, R2 = 0.9323, respectively). It is noted that the highest NRTI (~4) in May coincided with an extreme ENSO event (ENSO index~2.5) in 2016. ENSO intensity may influence oceanic and atmospheric processes, such as the warm water supply by the Jeju Warm Current, precipitation amount, and wind speed. Additional in-depth studies are needed in order to understand these physio-biogeochemical interactions.
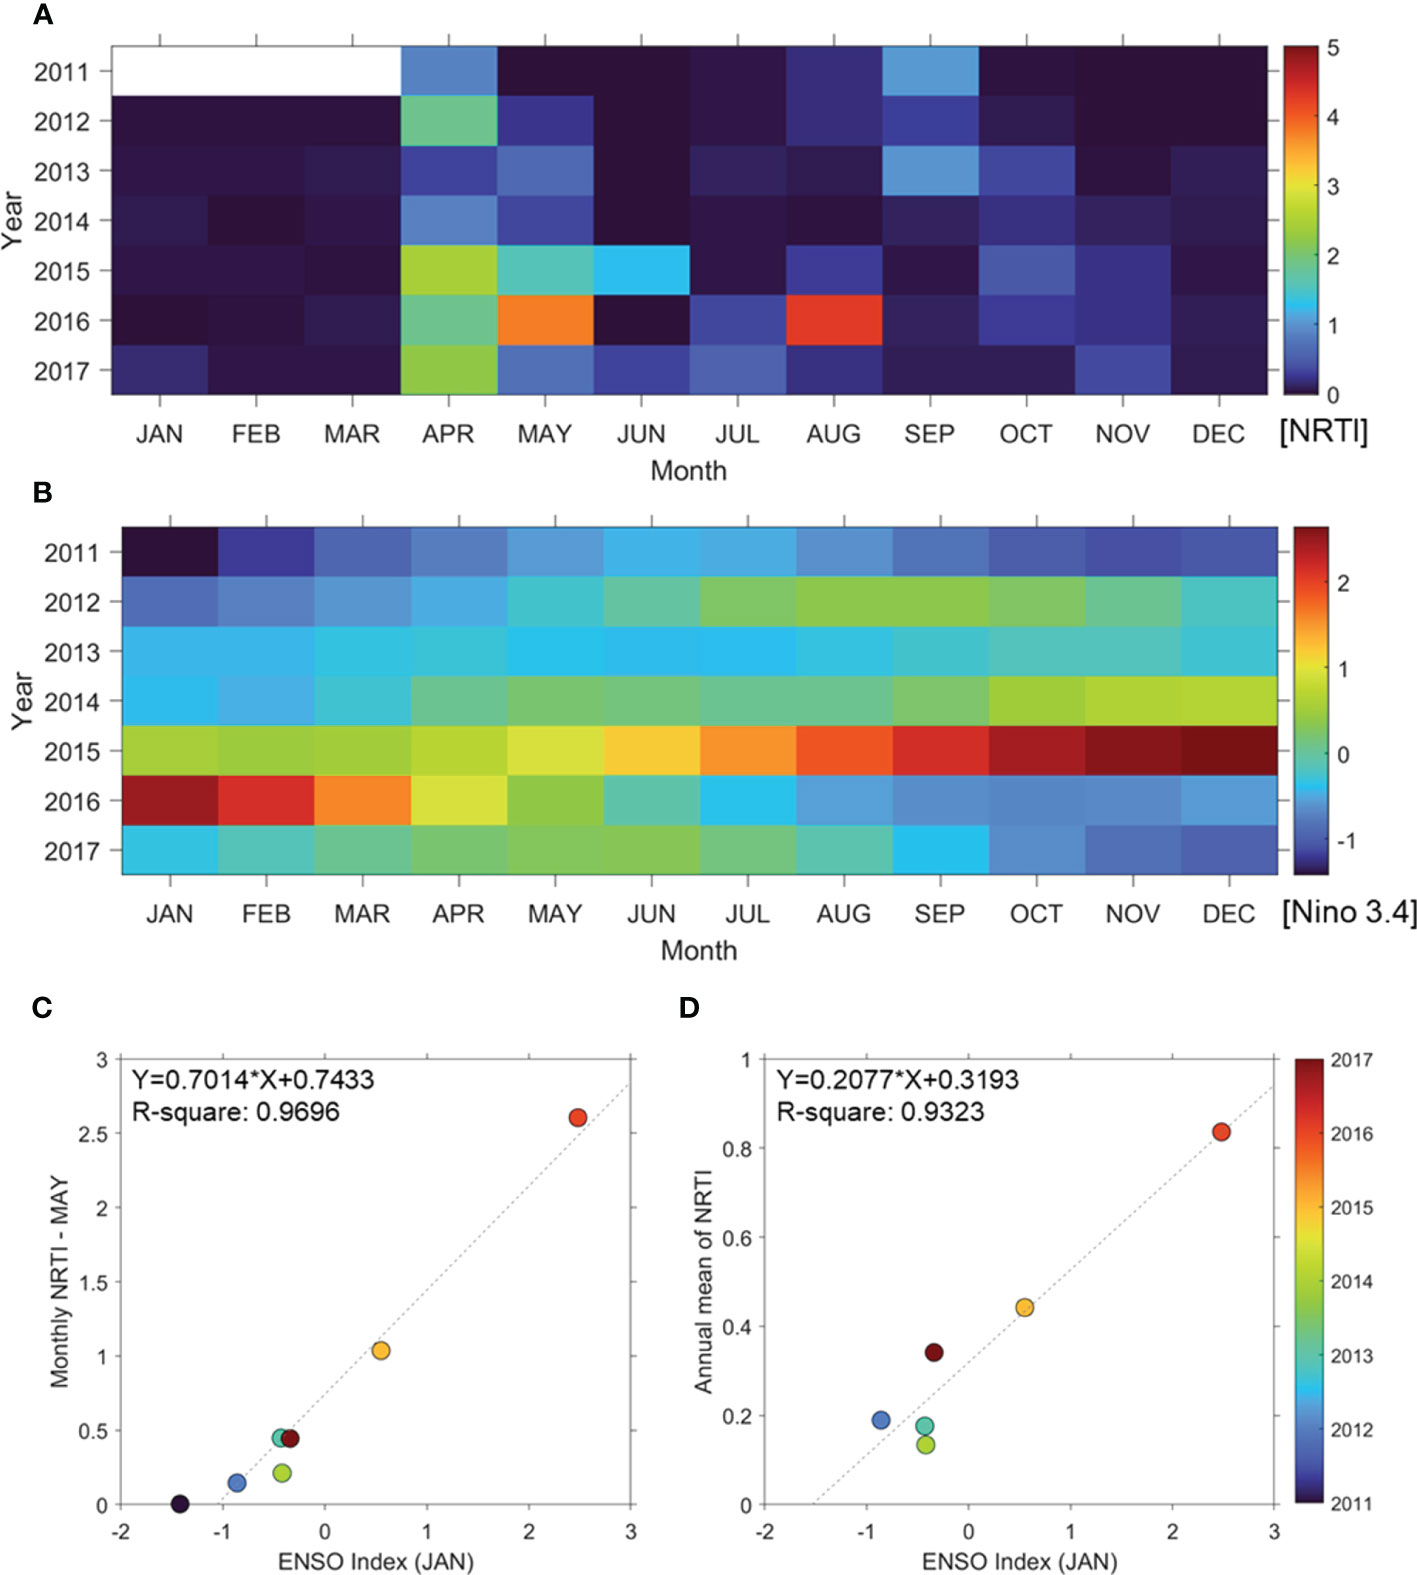
Figure 13 Interannual variations by month of (A) Jeju Island red tide index (NRTI) and (B) ENSO index (Nino 3.4), (C) May NRTI variability with respect to ENSO index variations in winter (January) from 2011-2017 and (D) annually averaged NRTI values with respect to ENSO index variations in winter (January) from 2011-2017. Dashed lines in (C, D) represent linearly least-squared fitted lines.
Various types of garbage and floating debris used by humans and discharged into the sea can also contribute to the occurrence of red tides. The population of the northern part of Jeju Island is 2.6 times larger than the population of the southern area (507,000 versus 190,000). Anthropogenic effects on the long-term statistics of red tide appearances are expected to be worthy of further study.
Researchers as well as local mass media are focusing on changes in red tide events and their sources. One potential cause of change is change in the groundwater that provides nutrients to the coastal area, because of the volcanic geological structure of Jeju Island (Hwang et al., 2005; Koh et al., 2006). The researchers and mass media considered that overuse of groundwater could effect change. Thus, it is necessary to understand the Jeju coastal water system in order to investigate the potential causes of red tides. Jeju Island is located in oligotrophic Kuroshio-branch water, in which nutrient concentrations are generally lower than 2 μM (Cho et al., 2019). However, the coastal waters of Jeju Island, which depend greatly on the nutrient supply from submarine groundwater discharge (Kim et al., 2011), are productive. Because Jeju Island is composed mainly of volcanic rocks, the seepage rates of groundwater (50–300 m yr-1) at the coast are among the highest in the world (Kim et al., 2003). Moreover, because of increases in human activities, including agriculture, aquaculture, livestock, and sewage, the concentration of dissolved inorganic nitrate (DIN) commonly exceeds 300 μM (Kim et al., 2011; Cho et al., 2019). Thus, mixing of coastal seawater with a small amount of fresh groundwater can cause coastal eutrophication in this DIN-limited environment. Along the shallow eastern coast of Jeju Island, green tides of Ulva spp., amounting to approximately 10,000 tons, have occurred every year since the early 2000s (Hwang et al., 2005; Kwon et al., 2017; Cho et al., 2019). Although the discharge of nutrients from the other coastlines is similar (Kim et al., 2011; Cho et al., 2019), these discharges are diluted rapidly by the deeper and more open geomorphologic characteristics that exist there. However, as observed in this study, all coastal areas of Jeju Island are potentially vulnerable to eutrophication, and thus red tides, depending on the environmental and ecological conditions.
The approach of this study is the first that characterizes red tide events in space and time using an enormous amount of long-term satellite data. In addition, we presented a method for monitoring harmful algal blooms in a pristine coastal region using a satellite remote sensing approach. Satellite red tide data will be useful for understanding the basic characteristics of the increasing red tide events. Although the dominant species are different from the target species of the NRTI, this study showed that NRTI variability could reflect variations in red tide intensity. NRTI-based red tide cell density can be practically useful for planning future proactive strategies to prevent possible harmful algal effects in advance. It is expected that satellite NRTI-based approach could inform the community earlier than extreme red tide bloom in some area and would be helpful for coastal management. As the number of channels of satellite ocean color sensors increases in the future, research on red tides will become more vigorous including diurnal variations of the red tide. Therefore, the fundamental concept of the NRTI in this study can be one potential method applicable to other satellite data and regions.
The datasets analyzed for this study can be found in the National Institute of Fisheries Science (https://www.nifs.go.kr/board/actionRedtideInfoList.do), Korea Ocean Satellite Center (https://kosc.kiost.ac.kr) and SeaWiFS Bio-optical Archive and Storage System (https://seabass.gsfc.nasa.gov/).
M-SL collected the data, analyzed the datasets, prepared all figures, and wrote the manuscript. K-AP conceptualized, organized, and wrote the manuscript. GK revised the manuscript. All authors contributed to the article and approved the submitted version.
This research was supported by the ‘Development of technology using analysis of ocean satellite images (20210046)’ funded by the Korea Institute of Marine Science & Technology Promotion (KIMST) and partly supported by Korea Institute of Marine Science & Technology Promotion (KIMST) (20220541), Korea.
The authors thank Korea Ocean Satellite Center (KOSC) for providing GOCI level-2 Rrs data.
The authors declare that the research was conducted in the absence of any commercial or financial relationships that could be construed as a potential conflict of interest.
All claims expressed in this article are solely those of the authors and do not necessarily represent those of their affiliated organizations, or those of the publisher, the editors and the reviewers. Any product that may be evaluated in this article, or claim that may be made by its manufacturer, is not guaranteed or endorsed by the publisher.
Anderson D. M., Cembella A. D., Hallegraeff G. M. (2012). Progress in understanding harmful algal blooms (HABs): paradigm shifts and new technologies for research, monitoring and management. Annu. Rev. Mar. Sci. 4, 143. doi: 10.1146/annurev-marine-120308-081121
Anderson D. M., Glibert P. M., Burkholder J. M. (2002). Harmful algal blooms and eutrophication: nutrient sources, composition, and consequences. Estuaries 25 (4), 704–726. doi: 10.1007/BF02804901
Armijo J., Oerder V., Auger P. A., Bravo A., Molina E. (2020). The 2016 red tide crisis in southern Chile: possible influence of the mass oceanic dumping of dead salmons. Mar. Pollut. Bull. 150, 110603. doi: 10.1016/j.marpolbul.2019.110603
Brenna M., Cronin S. J., Smith I. E., Sohn Y. K., Maas R. (2012). Spatio-temporal evolution of a dispersed magmatic system and its implications for volcano growth, jeju island volcanic field, Korea. Lithos 148, 337–352. doi: 10.1016/j.lithos.2012.06.021
Brunson J. K., McKinnie S. M., Chekan J. R., McCrow J. P., Miles Z. D., Bertrand E. M., et al. (2018). Biosynthesis of the neurotoxin domoic acid in a bloom-forming diatom. Science 361 (6409), 1356–1358. doi: 10.1126/science.aau0382
Cannizzaro J. P., Carder K. L., Chen F. R., Heil C. A., Vargo G. A. (2008). A novel technique for detection of the toxic dinoflagellate, Karenia brevis, in the gulf of Mexico from remotely sensed ocean color data. Continental Shelf Res. 28 (1), 137–158. doi: 10.1016/j.csr.2004.04.007
Cho H. M., Kim G., Shin K. H. (2019). Tracing nitrogen sources fueling coastal green tides off a volcanic island using radon and nitrogen isotopic tracers. Sci. Total Environ. 665, 913–919. doi: 10.1016/j.scitotenv.2019.02.212
Cosper E. M., Bricelj V. M., Carpenter E. J. (2012). Novel phytoplankton blooms: causes and impacts of recurrent brown tides and other unusual blooms Vol. 35 (Springer Science & Business Media).
Gobler C. J., Doherty O. M., Hattenrath-Lehmann T. K., Griffith A. W., Kang Y., Litaker R. W. (2017). Ocean warming since 1982 has expanded the niche of toxic algal blooms in the north Atlantic and north pacific oceans. Proc. Natl. Acad. Sci. 114 (19), 4975–4980. doi: 10.1073/pnas.1619575114
Gravinese P. M., Munley M. K., Kahmann G., Cole C., Lovko V., Blum P., et al. (2020). The effects of prolonged exposure to hypoxia and Florida red tide (Karenia brevis) on the survival and activity of stone crabs. Harmful algae 98, 101897. doi: 10.1016/j.hal.2020.101897
Guzmán L., Varela R., Muller-Karger F., Lorenzoni L. (2016). Bio-optical characteristics of a red tide induced by Mesodinium rubrum in the cariaco basin, Venezuela. J. Mar. Syst. 160, 17–25. doi: 10.1016/j.jmarsys.2016.03.015
Hallegraeff G. M. (1993). A review of harmful algal blooms and their apparent global increase. Phycologia 32 (2), 79–99. doi: 10.2216/i0031-8884-32-2-79.1
He R., McGillicuddy D. J. Jr., Keafer B. A., Anderson D. M. (2008). Historic 2005 toxic bloom of alexandrium fundyense in the western gulf of Maine: 2. coupled biophysical numerical modeling. J. Geophysical Research: Oceans 113 (C7). doi: 10.1029/2007JC004601
Hwang D. W., Lee Y. W., Kim G. (2005). Large Submarine groundwater discharge and benthic eutrophication in bangdu bay on volcanic jeju island, Korea. Limnology Oceanography 50 (5), 1393–1403. doi: 10.4319/lo.2005.50.5.1393
Jessup D. A., Miller M. A., Ryan J. P., Nevins H. M., Kerkering H. A., Mekebri A., et al. (2009). Mass stranding of marine birds caused by a surfactant-producing red tide. PloS One 4 (2), e4550. doi: 10.1371/journal.pone.0004550
Kahru M., Mitchell B. G. (1998). Spectral reflectance and absorption of a massive red tide off southern California. J. Geophysical Research: Oceans 103 (C10), 21601–21609. doi: 10.1029/98JC01945
Kim G., Kim J. S., Hwang D. W. (2011). Submarine groundwater discharge from oceanic islands standing in oligotrophic oceans: implications for global biological production and organic carbon fluxes. Limnology Oceanography 56 (2), 673–682. doi: 10.4319/lo.2011.56.2.0673
Kim C. S., Lee S. G., Lee C. K., Kim H. G., Jung J. (1999). Reactive oxygen species as causative agents in the ichthyotoxicity of the red tide dinoflagellate Cochlodinium polykrikoides. J. Plankton Res. 21 (11), 2105–2115. doi: 10.1093/plankt/21.11.2105
Kim G., Lee K. K., Park K. S., Hwang D. W., Yang H. S. (2003). Large Submarine groundwater discharge (SGD) from a volcanic island. Geophysical Res. Lett. 30 (21). doi: 10.1029/2003GL018378
Kim Y., Yoo S., Son Y. B. (2016). Optical discrimination of harmful Cochlodinium polykrikoides blooms in Korean coastal waters. Optics express 24 (22), A1471–A1488. doi: 10.1364/OE.24.0A1471
Koh D. C., Plummer L. N., Solomon D. K., Busenberg E., Kim Y. J., Chang H. W. (2006). Application of environmental tracers to mixing, evolution, and nitrate contamination of ground water in Jeju Island, Korea. Journal of Hydrology 327 (1-2), 258–275. doi: 10.1016/j.jhydrol.2005.11.021
Kwon H. K., Kang H., Oh Y. H., Park S. R., Kim G. (2017). Green tide development associated with submarine groundwater discharge in a coastal harbor, jeju, Korea. Sci. Rep. 7 (1), 1–9. doi: 10.1038/s41598-017-06711-0
Lee M. S., Park K. A., Chae J., Park J. E., Lee J. S., Lee J. H. (2020). Red tide detection using deep learning and high-spatial resolution optical satellite imagery. Int. J. Remote Sens. 41 (15), 5838–5860. doi: 10.1080/01431161.2019.1706011
Lee M. S., Park K. A., Micheli F. (2021). Derivation of red tide index and density using geostationary ocean color imager (GOCI) data. Remote Sens. 13 (2), 298. doi: 10.3390/rs13020298
Lee M. S., Park K. A., Moon J. E., Kim W., Park Y. J. (2019). Spatial and temporal characteristics and removal methodology of suspended particulate matter speckles from geostationary ocean color imager data. Int. J. Remote Sens. 40 (10), 3808–3834. doi: 10.1080/01431161.2018.1552818
Low N. H., Micheli F., Aguilar J. D., Arce D. R., Boch C. A., Bonilla J. C., Woodson C. B. (2021). Variable coastal hypoxia exposure and drivers across the southern California Current. Scientific reports 11 (1), 1–10. doi: 10.1038/s41598-021-89928-4
Lu S., Hodgkiss I. J. (2004). “Harmful algal bloom causative collected from Hong Kong waters,” in Asian Pacific phycology in the 21st century: prospects and challenges (Springer, Dordrecht), 231–238. doi: 10.1007/978-94-007-0944-7_30
Mardones J. I., Paredes J., Godoy M., Suarez R., Norambuena L., Vargas V., et al. (2021). Disentangling the environmental processes responsible for the world's largest farmed fish-killing harmful algal bloom: chil. Sci. Total Environ. 766, 144383. doi: 10.1016/j.scitotenv.2020.144383
McKibben S. M., Peterson W., Wood A. M., Trainer V. L., Hunter M., White A. E. (2017). Climatic regulation of the neurotoxin domoic acid. Proc. Natl. Acad. Sci. 114 (2), 239–244. doi: 10.1073/pnas.1606798114
Medina M., Kaplan D., Milbrandt E. C., Tomasko D., Huffaker R., Angelini C. (2022). Nitrogen-enriched discharges from a highly managed watershed intensify red tide (Karenia brevis) blooms in southwest Florida. Sci. Total Environ. 827, 154149. doi: 10.1016/j.scitotenv.2022.154149
Min J. E., Ryu J. H., Lee S., Son S. (2012). Monitoring of suspended sediment variation using landsat and MODIS in the saemangeum coastal area of Korea. Mar. pollut. Bull. 64 (2), 382–390. doi: 10.1016/j.marpolbul.2011.10.025
National Institute of Fisheries Science (2019). Monitoring, management and mitigation of red tide. annual report of NIFS on red tide of Korea (Busan, Korea: National Institute of Fisheries Science).
Park Y. J., Ahn Y. H., Han H. J., Yang H., Moon J. E., Ahn J. H., et al. (2014). GOCI level 2 ocean color products (GDPS 1.3) brief algorithm description. Ansan Republic Korea: Korea Ocean Satellite Center (KOSC), 24–40.
Park K. A., Lee M. S., Park J. E., Ullman D., Cornillon P. C., Park Y. J. (2018). Surface currents from hourly variations of suspended particulate matter from geostationary ocean color imager data. Int. J. Remote Sens. 39 (6), 1929–1949. doi: 10.1080/01431161.2017.1416699
Park K. A., Park J. E., Kang C. K. (2022). Satellite-observed chlorophyll-a concentration variability in the East Sea (Japan sea): seasonal cycle, long-term trend, and response to climate index. Front. Mar. Sci. 9, 354. doi: 10.3389/fmars.2022.807570
Park K. A., Park J. J., Park J. E., Choi B.-J., Lee S.-H., Byun D.-S., et al. (2019). “Interdisciplinary mathematics and sciences in schematic ocean current maps in the seas around Korea,” in Handbook of the mathematics of the arts and sciences. Ed. Sriraman B. (Springer, Cham). doi: 10.1007/978-3-319-70658-0_37-1
Rayner N. A., Parker D. E., Horton E. B, Folland C. K., Alexander L. V., Rowell D. P., Kent E. C., Kaplan A. (2003). Global analyses of sea surface temperature, sea ice, and night marine air temperature since the late nineteenth century. J. Geophys. Res. 108 (D14), 4407. doi: 10.1029/2002JD002670
Ryu J. H., Han H. J., Cho S., Park Y. J., Ahn Y. H. (2012). Overview of geostationary ocean color imager (GOCI) and GOCI data processing system (GDPS). Ocean Sci. J. 47 (3), 223–233. doi: 10.1007/s12601-012-0024-4
Schantz E. J. (1975). Poisonous red tide organisms. Environ. Lett. 9 (3), 225–237. doi: 10.1080/00139307509435851
Shaju S. S., Akula R. R., Jabir T. (2018). Characterization of light absorption coefficient of red Noctiluca scintillans bloom in the south Eastern Arabian Sea. Oceanologia 60 (3), 419–425. doi: 10.1016/j.oceano.2017.12.002
Siswanto E., Tang J., Yamaguchi H., Ahn Y. H., Ishizaka J., Yoo S., et al. (2011). Empirical ocean-color algorithms to retrieve chlorophyll-a, total suspended matter, and colored dissolved organic matter absorption coefficient in the yellow and East China seas. J. oceanography 67 (5), 627–650. doi: 10.1007/s10872-011-0062-z
Stæhr P. A., Cullen J. J. (2003). Detection of Karenia mikimotoi by spectral absorption signatures. J. Plankton Res. 25 (10), 1237–1249. doi: 10.1093/plankt/fbg083
Trainer V. L., Moore S. K., Hallegraeff G., Kudela R. M., Clement A., Mardones J. I., et al. (2020). Pelagic harmful algal blooms and climate change: lessons from nature’s experiments with extremes. Harmful algae 91, 101591. doi: 10.1016/j.hal.2019.03.009
Wakamatsu L., Britten G. L., Styles E. J., Fischer A. M. (2022). Chlorophyll-a and Sea surface temperature changes in relation to paralytic shellfish toxin production off the East coast of Tasmania, Australia. Remote Sens. 14 (3), 665. doi: 10.3390/rs14030665
Walsh J. J., Jolliff J. K., Darrow B. P., Lenes J. M., Milroy S. P., Remsen A. D. D. A., et al. (2006). Red tides in the gulf of Mexico: where, when, and why? J. Geophysical Research: Oceans 111 (C11). doi: 10.1029/2004JC002813
Wells M. L., Trainer V. L., Smayda T. J., Karlson B. S., Trick C. G., Kudela R. M., et al. (2015). Harmful algal blooms and climate change: learning from the past and present to forecast the future. Harmful algae 49, 68–93. doi: 10.1016/j.hal.2015.07.009
Xie H., Fischer A. M., Strutton P. G. (2021). Generalized linear models to assess environmental drivers of paralytic shellfish toxin blooms (Southeast Tasmania, Australia). Continental Shelf Res. 223, 104439. doi: 10.1016/j.csr.2021.104439
Keywords: red tide, Geostationary Ocean Color Imager (GOCI), ocean color, red tide index, Jeju Island
Citation: Lee M-S, Park K-A and Kim G (2023) Incidence of harmful algal blooms in pristine subtropical ocean: a satellite remote sensing approach (Jeju Island). Front. Mar. Sci. 10:1149657. doi: 10.3389/fmars.2023.1149657
Received: 22 January 2023; Accepted: 17 May 2023;
Published: 08 June 2023.
Edited by:
Atsushi Matsuoka, University of New Hampshire, United StatesReviewed by:
Andrew M. Fischer, University of Tasmania, AustraliaCopyright © 2023 Lee, Park and Kim. This is an open-access article distributed under the terms of the Creative Commons Attribution License (CC BY). The use, distribution or reproduction in other forums is permitted, provided the original author(s) and the copyright owner(s) are credited and that the original publication in this journal is cited, in accordance with accepted academic practice. No use, distribution or reproduction is permitted which does not comply with these terms.
*Correspondence: Kyung-Ae Park, a2FwYXJrQHNudS5hYy5rcg==
Disclaimer: All claims expressed in this article are solely those of the authors and do not necessarily represent those of their affiliated organizations, or those of the publisher, the editors and the reviewers. Any product that may be evaluated in this article or claim that may be made by its manufacturer is not guaranteed or endorsed by the publisher.
Research integrity at Frontiers
Learn more about the work of our research integrity team to safeguard the quality of each article we publish.