 James Murphy
 Andy Plater2*
- 1Geographic Data Science Lab, University of Liverpool, Liverpool, United Kingdom
- 2School of Environmental Sciences, University of Liverpool, Liverpool, United Kingdom
- 3R&D Department, CoastSense Ltd., Queens Dock Business Centre, Liverpool, United Kingdom
Intertidal areas experience a series of complex dynamic processes that affect beach morphology. Many of these processes are difficult to monitor, particularly due to the limited availability of high-resolution data. This study utilises high resolution radar-derived DEMs obtained through the temporal waterline method high resolution to perform a spatio-temporal analysis of beach morphology over the macrotidal nearshore of Rossall Beach, UK. Beach elevation changes are characterized, providing new insights into the morphological processes from fortnightly to seasonal time scales. The results of this analysis draw focus to the short-term variations in beach morphology and their contributions to long-term change. Observation of spatio-temporal variation displayed an intertidal system in a seasonal steady state equilibrium, somewhat dominated by elevation changes within the spring and summer months. Furthermore, the upper-intertidal zone displays evidence of continuing accretion. Though the analysis within this study is mostly explorative, it shows the potential of radar data for autonomous monitoring and spatio-temporal characterization of the coast. This enables coastal managers and stakeholders to build a long-term picture of the coastline, reducing vulnerability to coastal hazards and building resilience.
1 Introduction
Significant coastal erosion events can have severe implications for coastal ecosystems and communities. Removal of large volumes of sediment from beaches reduces the defensive capacity of the coast, leaving beaches and nearby coastal communities vulnerable to coastal hazards. 24% of sandy beaches around the world are eroding at rates that exceed 0.5m/yr (Luijendijk et al., 2018), leading to habitat loss and an array of socio-economic implications, such as damage to infrastructure and services and loss of life (Dunn et al, 2000). With sea level expected to rise as a result of climate change, with an estimated one billion people living within 10m of the high tide line (Kulp and Strauss, 2019), the impacts of coastal erosion are only going to be exacerbated (Vousdoukas et al., 2020). It is therefore imperative that coastal zones are managed as effectively as possible. The monitoring of coastal zones is an important factor in coastal management, allowing stakeholders to understand changes in the morphology of the beach, and intervene when necessary. Given the increasing availability of remote sensing technologies, monitoring beaches has become a significantly less laborious task, whereby sensors are able to obtain high spatial resolution measurements on the beach, at times almost constantly. The increasing temporal resolution in beach surveys means that complex hydrodynamic processes can be understood to a greater degree, including the significant changes that are often concurrent with storm events.
There are many studies that utilize remote sensing technologies for monitoring morphological variability along a coast (Bird et al., 2017; Pollard et al., 2019; Chu et al., 2020; Pucino et al., 2021). Typically, remote sensing applications can provide a large area of coverage at high resolutions, and can enable the identification of hotspots for sediment erosion and accretion (Luijendijk et al., 2018; Mentaschi et al., 2018; Pucino et al., 2021). This is particularly important for local beach management, where understanding the morphological response to environmental stimuli, such as storms and rising sea levels, is paramount to improving coastal resilience. Video footage has played a particularly prominent role in studying nearshore bar dynamics from storm-induced changes to seasonal variability (Roman-Rivera and Ellis, 2019). The ARGUS project, a long term optical coastal monitoring method, provides hourly images of the coastline and has contributed a great deal to the understanding of short-term coastal dynamics and bar characteristics (Holman and Stanley, 2007). However, systems utilizing video footage are limited during adverse weather conditions or in low visibility scenarios.
Monitoring shoreline change through the use of optical or SAR satellite imagery as a remote sensor has vastly improved global understanding of shoreline change and beach width with a spatial resolution of between 10-30m (Salameh et al., 2019; Turner et al., 2021). While this is useful for tracking shoreline change over large areas, this data typically does not directly contain a height element. However, topographic extraction from satellite observations is becoming increasingly prevalent, typically for long-term time series (Sagar et al., 2017; Vos et al., 2020). High resolution LiDAR (ODea et al., 2019) and UAV (Talavera et al., 2018; Pucino et al., 2021; Amodio et al., 2022) imagery is frequently used to capture elevations across beach environments. Observation of event-level morphological change through these methods has enabled a greater spatial and temporal understanding of beach response to storms (Scott et al., 2016; Burvingt et al., 2017; Harley et al., 2022).
High resolution data enables a powerful pixel-by-pixel analysis of elevation change over time. However, a limitation of many remote sensing methods is a poor temporal resolution (Peterson et al., 2003). Marine navigation radar for coastal observation has provided an alternative morphology monitoring method that succeeds in alleviating these limitations. X-band radar has been utilized for tracking shoreline positions and intertidal beach profiles (Takewaka, 2005; Bell et al., 2016), as well as tracking dynamic beach morphology over time (Galal and Takewaka, 2008). Radar-derived digital elevation models (DEMs) achieved using a temporal waterline radar method (Bell et al., 2016), have mapped intertidal areas over 4km to consistently monitor morphological change from event to seasonal time scales (Bird et al., 2017).
The analysis in this paper utilizes radar-derived DEMs to analyze spatio-temporal variability of intertidal beach systems at a high spatial and temporal resolution. Morphological changes can be monitored from event scale to seasonal using surveys that repeat at two-week intervals. These high resolution surveys can assist in identifying trends and patterns that are unseen or not immediately apparent using data with a low temporal resolution. In this study, we investigate morphological changes across the intertidal zone as a result of combined tide and wave processes that operate in combination but over contrasting length and time scales. While the study area is predominantly tide-dominated (macro- to hypertidal), it is also an open coast. Therefore, the influence of wave action is recognized, as evidenced by available wave measurements and their role in sediment transport. By employing high-resolution data obtained through fortnightly-averaged radar surveys, the study observes aggregated morphological changes in the intertidal zone during inter-storm periods and following storm events.
2 Materials and methods
2.1 Data collection and study site
The data that was used for this analysis were DEMs of Rossall beach on the Fylde coastline, in the North-West of England, UK. The Fylde coastline consists of mixed pebble/shingle and sand sediment and has a macrotidal regime. The mean spring tidal range is 8m with a mean wave direction of 245° - 270° over the study period. The area is largely sheltered from fetch by Ireland to the west, the Welsh coastline to the south and the Isle of Man to the northwest (Miles et al., 2019). Further hydrodynamic features of the Fylde coastline during the study period and subsequent quantitative analysis are presented in the results section.
Rossall beach is the location of a radar-based nearshore monitoring system deployed by Marlan Maritime Technologies Ltd. (Bird et al., 2019). The radar was deployed here (Figure 1) following the construction of a £63.2 million coastal defense scheme, featuring a lower rock revetment, an artificial berm, and a curved wave wall atop a concrete step revetment. The radar system deployed at Rossall is located along this sea-wall utilizing a pre-existing 12m CCTV column. The system is a GEM Elettronica SuperNET 2.2m radar antenna that is mounted onto the top of this column. One rotation takes approximately 3 seconds, during which the radar captures an image of the area within 6km of the antenna.
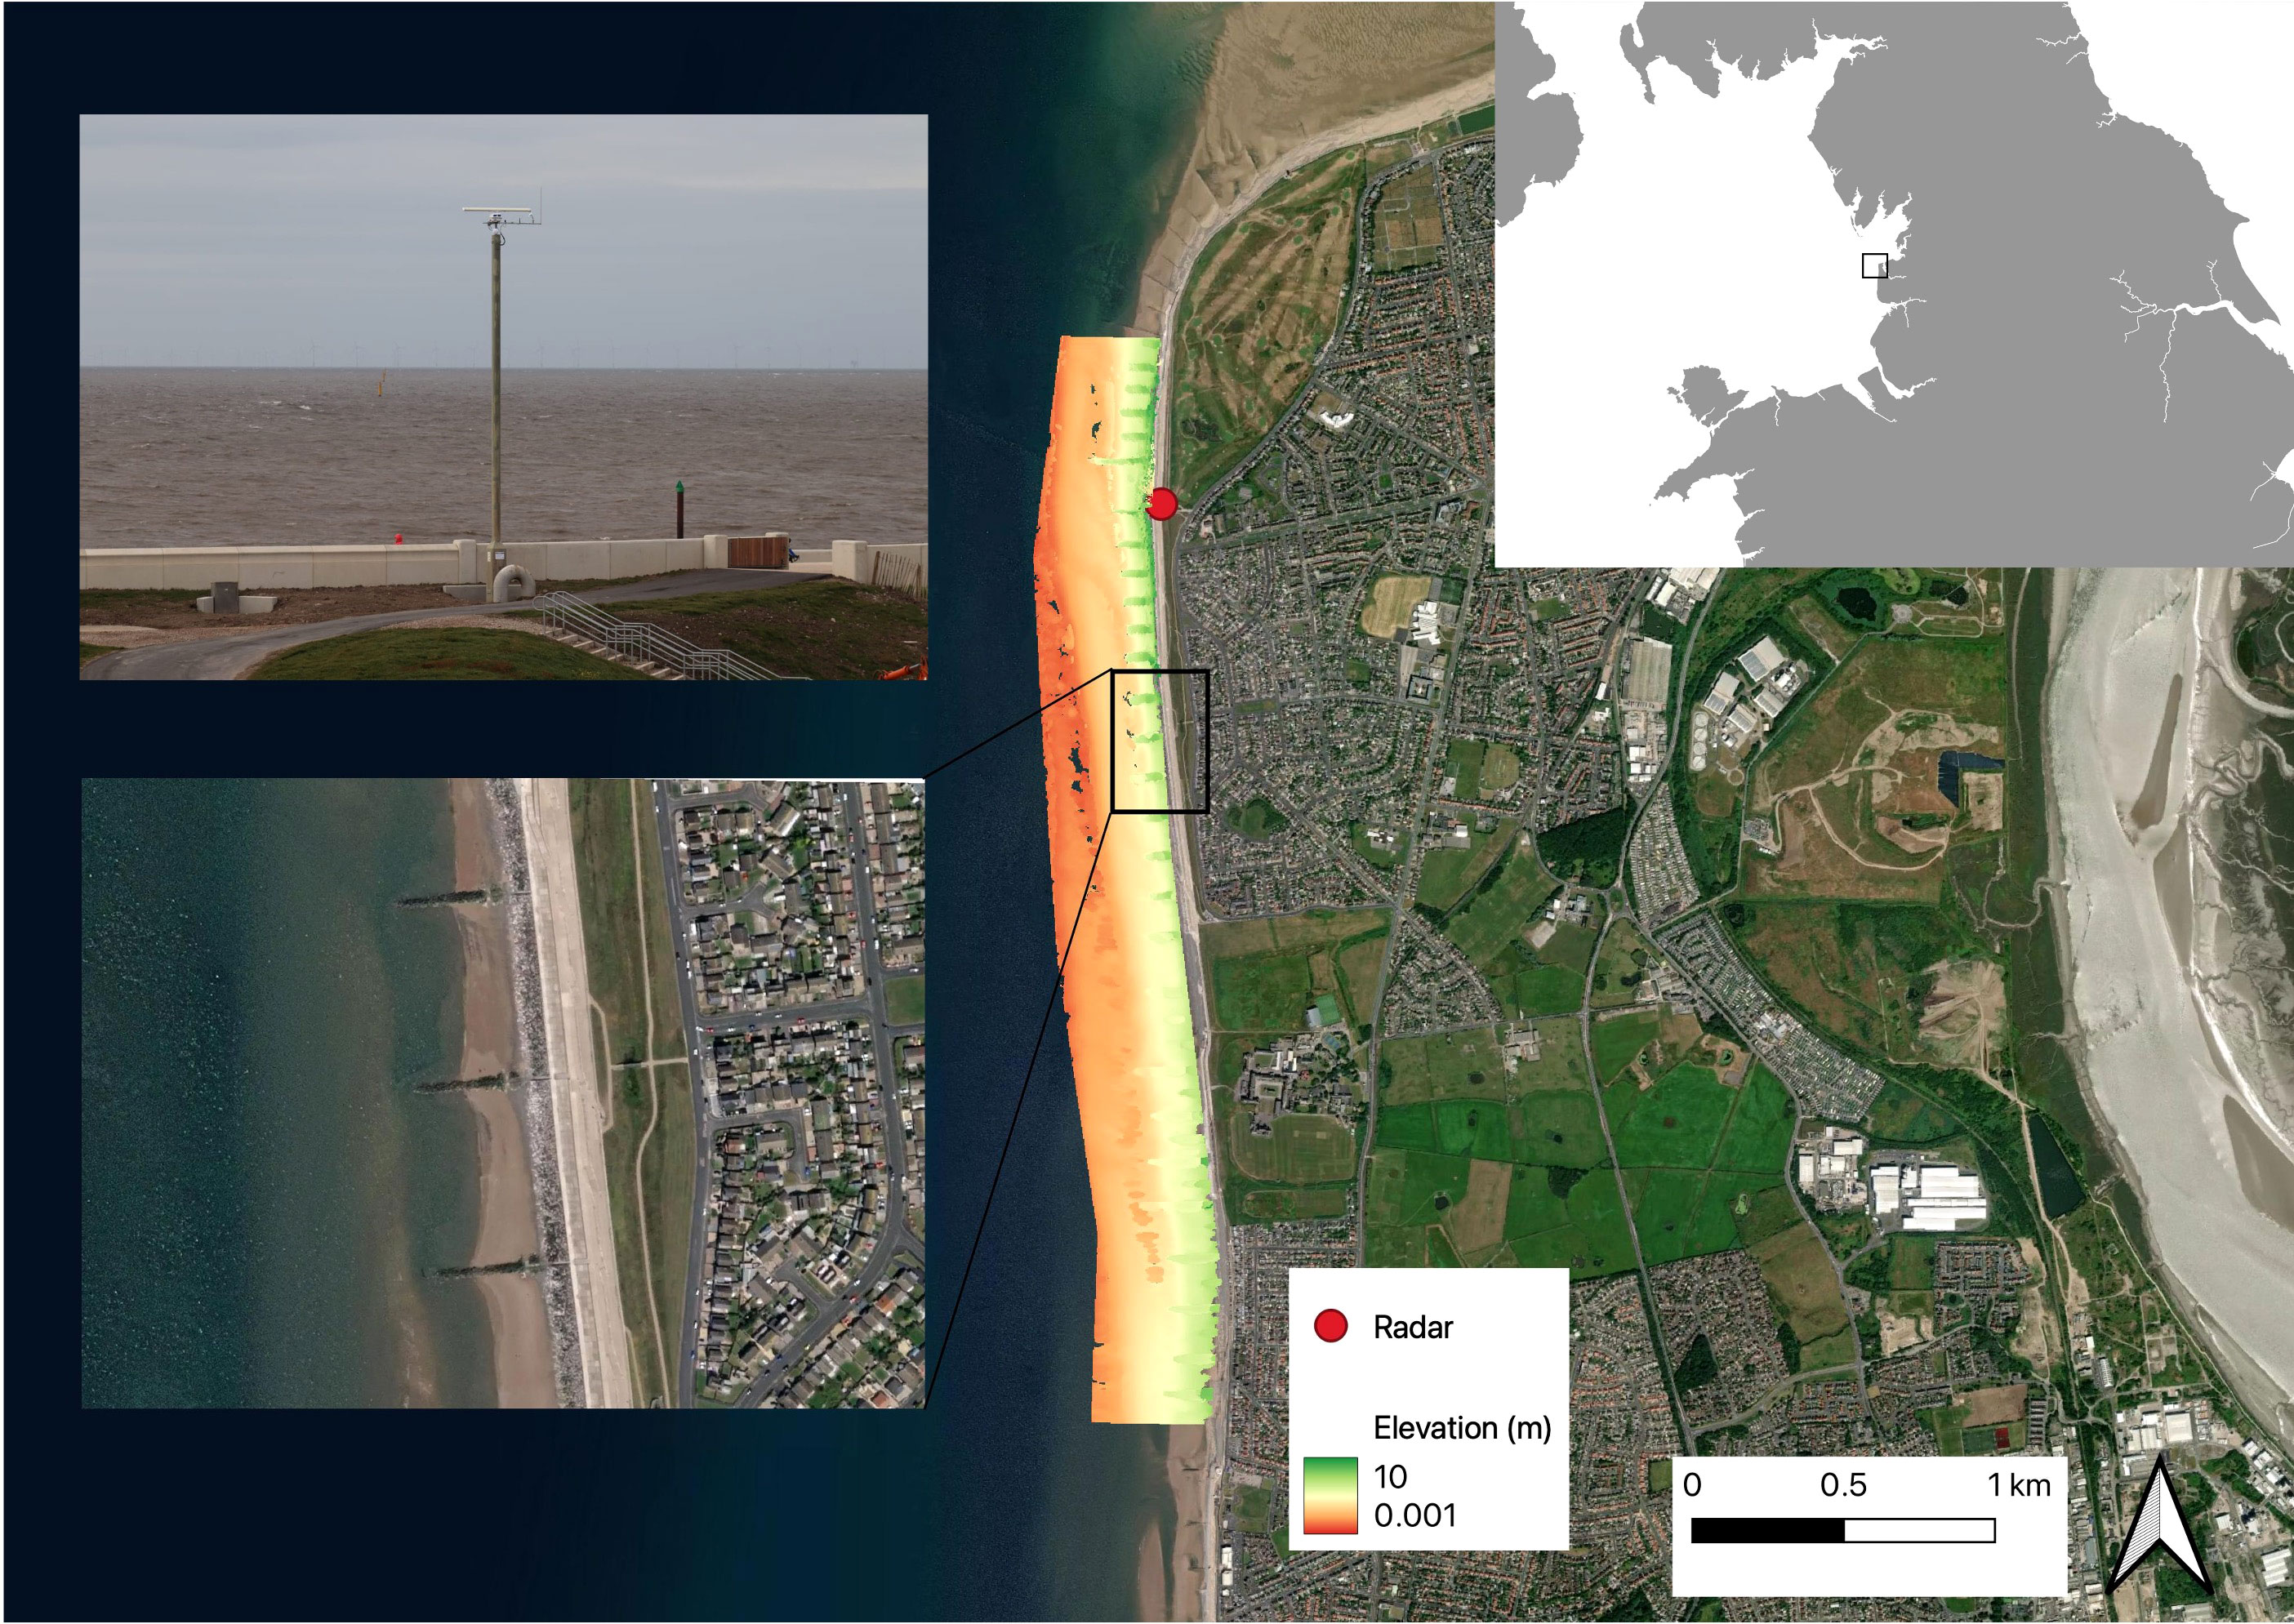
Figure 1 Rossall beach running along the Fylde coastline, overlayed with a radar-derived DEM of the study site. Radar location is displayed and picture of radar infrastructure included. (inset) rock groynes positioned orthogonal to the coastline. Basemap: mapbox.satellite (obtained through QuickMapServices QGIS plugin).
Rossall Beach and the surrounding area of Fleetwood has historically been very susceptible to coastal flooding (Prime et al., 2015). However, the construction of a seawall following severe floods in 1977, as well as the coastal defense scheme, has improved the resilience of the area considerably (Corbridge and Hawley, 2020). Large rock groynes are placed orthogonal to the shoreline at 100-130m intervals, to further protect these defenses. Rossall beach has received a large investment in coastal management and is in close proximity to homes and commercial property. This makes the area an appropriate case study for the monitoring of morphological change over time.
The pixel-based elevation values are derived from the radar imagery using the temporal waterline method outlined in Bell et al. (2016). This method estimates the elevation over the spatial extent by time-matching reliable tidal elevations with pixel-wise transitions between wet and dry areas of the beach. This information is collected over a two-week tidal cycle, capturing the full range of conditions between spring and neap tides within the intertidal zone. This enables the inclusion of any storm events within the constructed DEMs, which can then be referenced, and their impacts outlined appropriately. The result of this process is a time-averaged DEM of the intertidal zone and a corresponding map displaying the correlation coefficients of each pixel-based elevation. A poor correlation coefficient would indicate a low confidence in the derived elevation value for that pixel. A smoothing algorithm is used to remove elevations with low correlation coefficients using a threshold (Garcia, 2010; Bird et al., 2017), providing a means to improve the elevation estimates by removing outliers from the data.
Data validation was undertaken by measuring the differences between the waterline derived elevations and a LiDAR survey (Bird et al., 2017). Compared to the LiDAR surveys, radar is likely to overestimate elevation. Though a combination of physical factors likely contributes to this error, It is believed that the most likely and significant cause of error arises from differences between the nominal water line and the location of the shore break as captured by the radar. Previous work from Bell et al. (2016) provided an accuracy assessment of the radar-derived elevations by observing the determined elevations of multiple fixed rock targets over several surveys as control points. These fixed points displayed a relatively stable elevation over a period of 10 months. As a result, it is concluded that the elevation changes observed in sandy areas can be considered almost certainly genuine and utilization of elevation changes for intertidal monitoring can be conducted with some confidence.
The study site in Bell et al. (2016) and Bird et al. (2017) is the river Dee estuary, with the radar located on Hillbre island. Both the study site in these papers and the study site in this analysis (Rossall Beach) have large tidal ranges at similar scales, revealing a large expanse of intertidal area at low tide. This provides ample opportunity, in both cases, for high resolution intertidal monitoring. Both study sites can be referred to as macro-scale (covering multiple km), with uncertainties in radar-derived elevations likely being similar, given that the range of the radar is the same and therefore range-related biases will also be similar. In this case, it is the changes in elevations between surveys that are observed and characterized, with results showing that zones of the beach displaying similar morphological changes can be clustered using machine learning methods.
Whilst effective at imaging macrotidal environments given the extensive span of intertidal areas and the range of coverage provided by the radar, the temporal waterline method would be less suited to characterizing intertidal morphological changes in locations where a small tidal range is expected.
2.2 Data preparation
A total of 33 DEMs represented the study period between radar operational start date 1st October 2018 and 14th February 2020. This time period was deemed suitable for a robust multi-temporal case study. By incorporating data collected over this period, a substantial range of morphological change could be captured, including seasonal variations, storm events, and long-term trends. Following the removal of outliers and low correlation coefficients using the smoothing algorithm (Figure 2A), missing values in each of the DEMs were interpolated with a pixel-wise linear interpolation method using the temporal dimension (Figure 2B). Any pixels that were present for less than 50% of the study period were excluded from the interpolation process (Figure 2C). In order to obtain a more complete time series with real data, DEMs with more than 25% of missing data were removed from the dataset. This resulted in the removal of one DEM from the time series during December 2019.
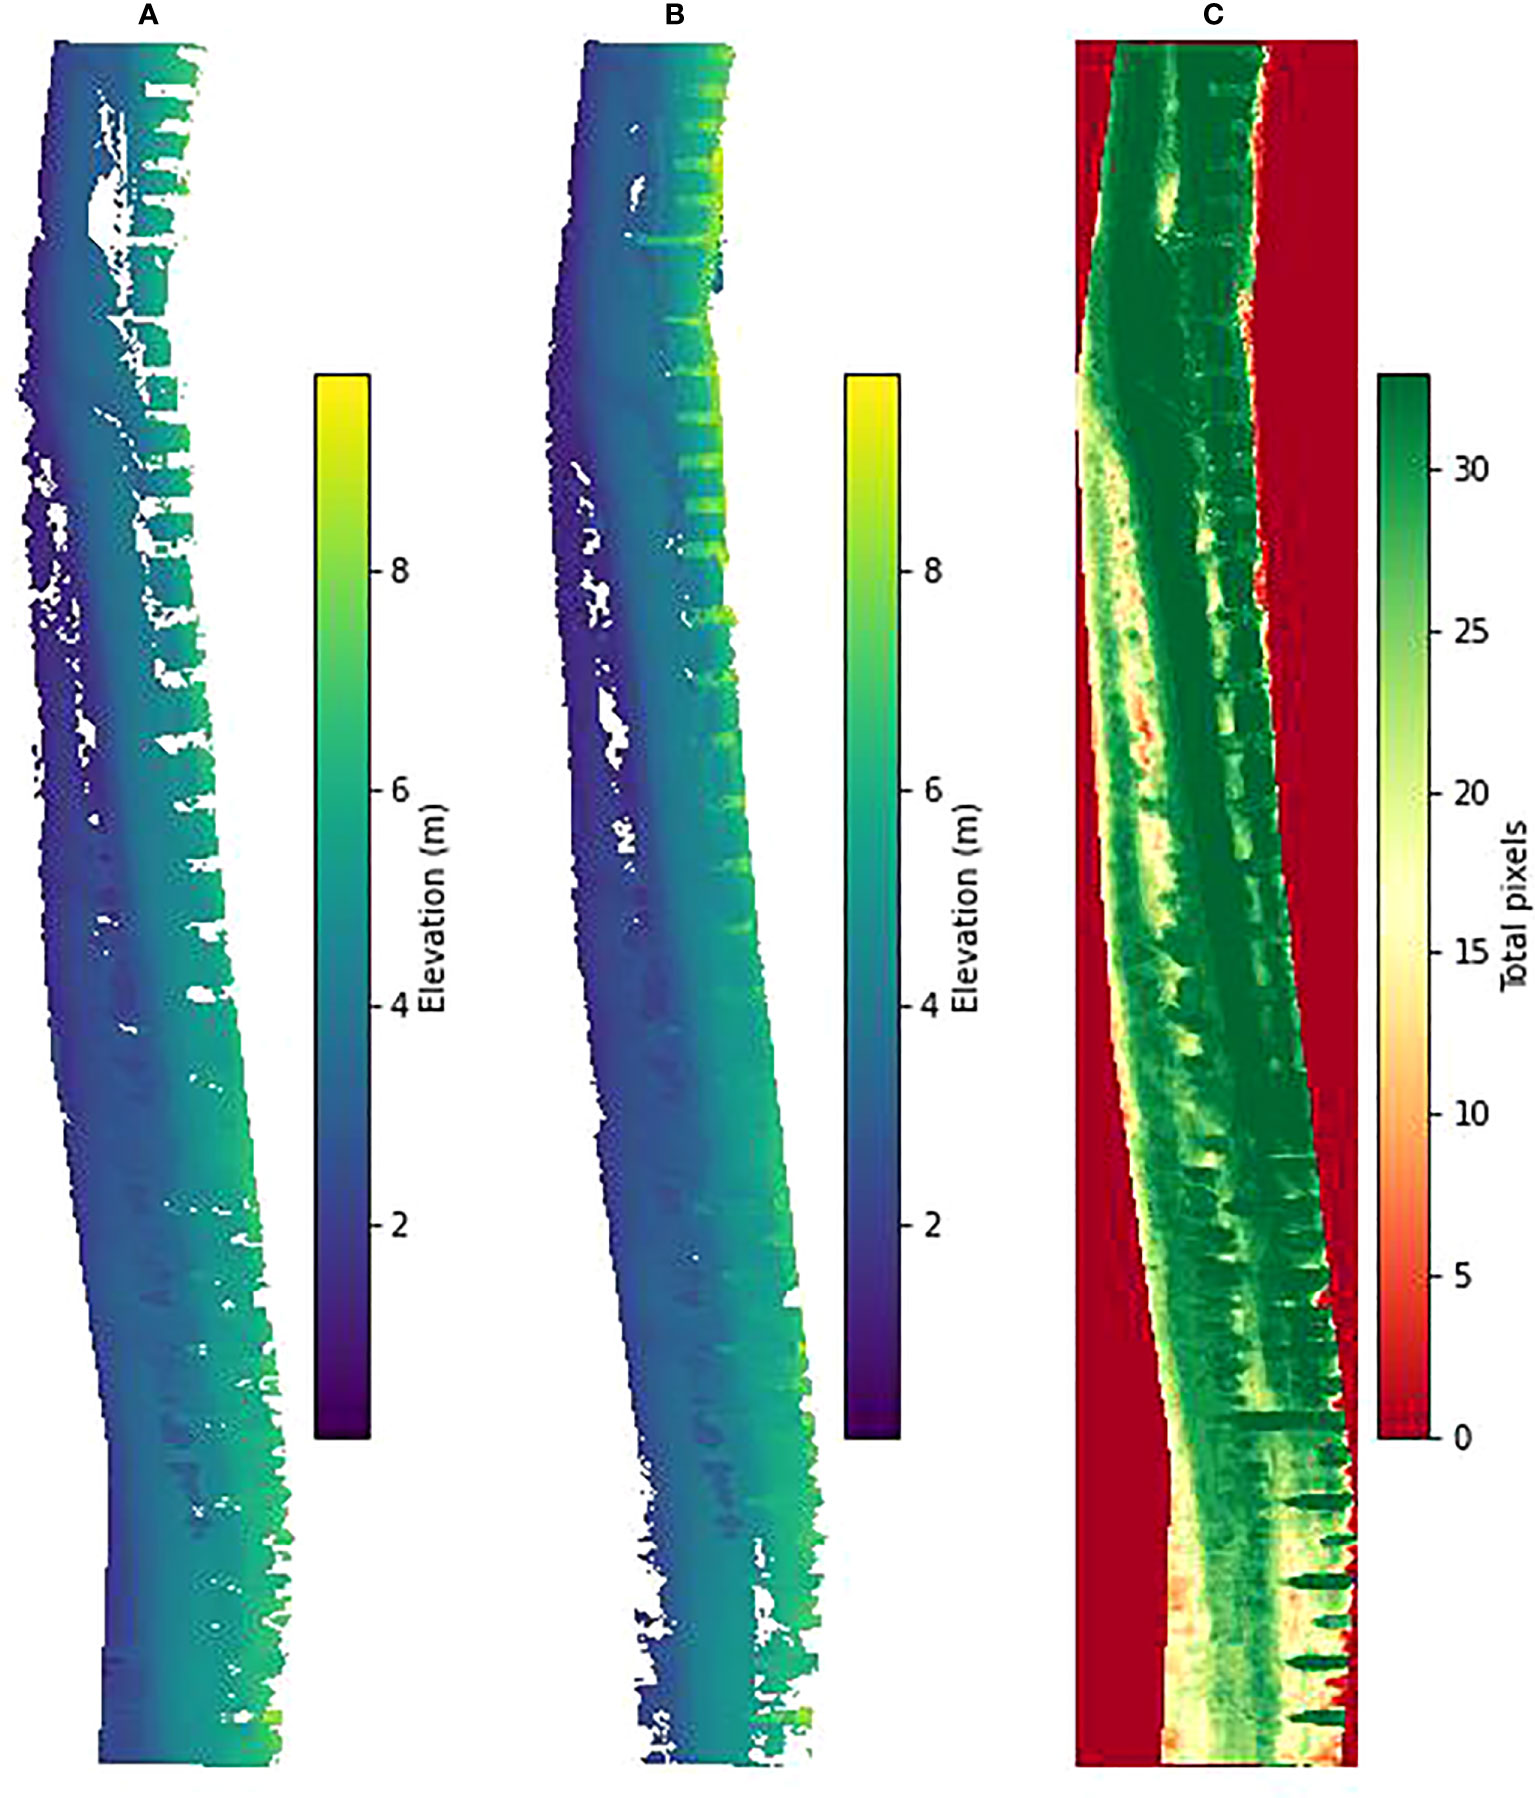
Figure 2 (A) Smoothed survey example DEM with outliers removed. (B) The gap-filled survey using linear interpolation over the temporal dimension. (C) The number of pixels present in each of the surveys during the study period. 0 indicates no pixels present in any of the surveys, 33 indicates pixels are present in all surveys. Areas of low elevation (to the west) represent the lower intertidal area.
The method used to display the changes in elevation was DEMs of difference (DoD) (Williams, 2012). DoDs are calculated by subtracting one DEM from another in order to calculate the amount of elevation change per pixel (Pollard et al., 2019; Hird et al., 2021). These DEMs must be the same horizontal and vertical resolutions, whereby a pixel in one DEM must represent the same spatial extent as a pixel in the same position in another DEM. In this instance, the preceding DEM was subtracted from every DEM in the time series. Negative pixel values within the resulting DoD represent erosion, whereas positive values represent accretion. This way, short-term morphological changes can be tracked and visualized over time. Additionally, long term trends can be captured with the advantage of also assessing this short-term variability. Gaps within the DoD are present when a pixel-wise subtraction cannot occur due to missing data.
This paper utilizes a temporal analysis approach that leverages Kernel Density Estimation (KDE) to plot the distribution of data. Higher points of the KDE curve signify a larger number of data points in that range, providing a clear understanding of the dominant changes occurring within the intertidal zone at Rossall. This information is especially relevant when observing pixel values to calculate elevation change. The shape and statistical features of these plots are used to reveal the temporal changes that occurred within the intertidal zone over the study period.
To assist in characterizing the spatial and temporal changes that occur across the intertidal zone over the study period, a K-means clustering algorithm is applied. K-means clustering is a type of unsupervised machine learning that takes data points that display similar attributes and cluster them into ‘k’ groups. The advantage of this for the characterization of morphological change is that complex spatial and temporal patterns can be classified into zones of similar behavior.
While the generation of DEMs requires the collection of tidal elevations over a two-week neap-spring tidal cycle, pre and post storm comparisons can be difficult to obtain. However, the storms that occur during the data collection process are reflected within the two-week average elevation shown in each DEM, which enables the effect of these storms on beach morphology to be analyzed. To capture the morphological effect of storms, this study utilized data collected from the UK Met Office and Met Eireann UK Storm Centre. The storms explored within this paper are named storm events that occurred during the study period. The duration and hydrodynamic features for each of these storms are analyzed within the results section. Wave data used is collected by the Cleveleys WaveRider buoy (53° 53.70’ N 003° 11.78’ W). Tidal elevation and Mean High Water Springs (MHWS) is collected from the nearest tide Gauge at Liverpool Gladstone Dock and obtained from the British Oceanographic Data Centre.
3 Results
Figure 3 displays beach surveys at two-week intervals from October 2018 to February 2020. A zoning diagram featuring 5 distinct sectors of interest is used as a point of reference. Firstly, it can be seen that there is clear spatial and temporal heterogeneity in morphological change across the beach. In sector 1, volumetric change is high over short periods, whereby it can be seen that concurrent surveys display erosive and accretional behavior for the same pixel. This can also be seen to some extent at the toe of the groynes in sector 4. Subsequent switching of sediment loss and sediment gain over a short time period in the same area could suggest disturbance-recovery phenomena. This high frequency variability in elevation change over time is predominantly focused seaward, towards the low tide mark. Sector 2 displays an exception to this, whereby the frequency of elevation change variability is low but the extent of change remains greater than surrounding regions.
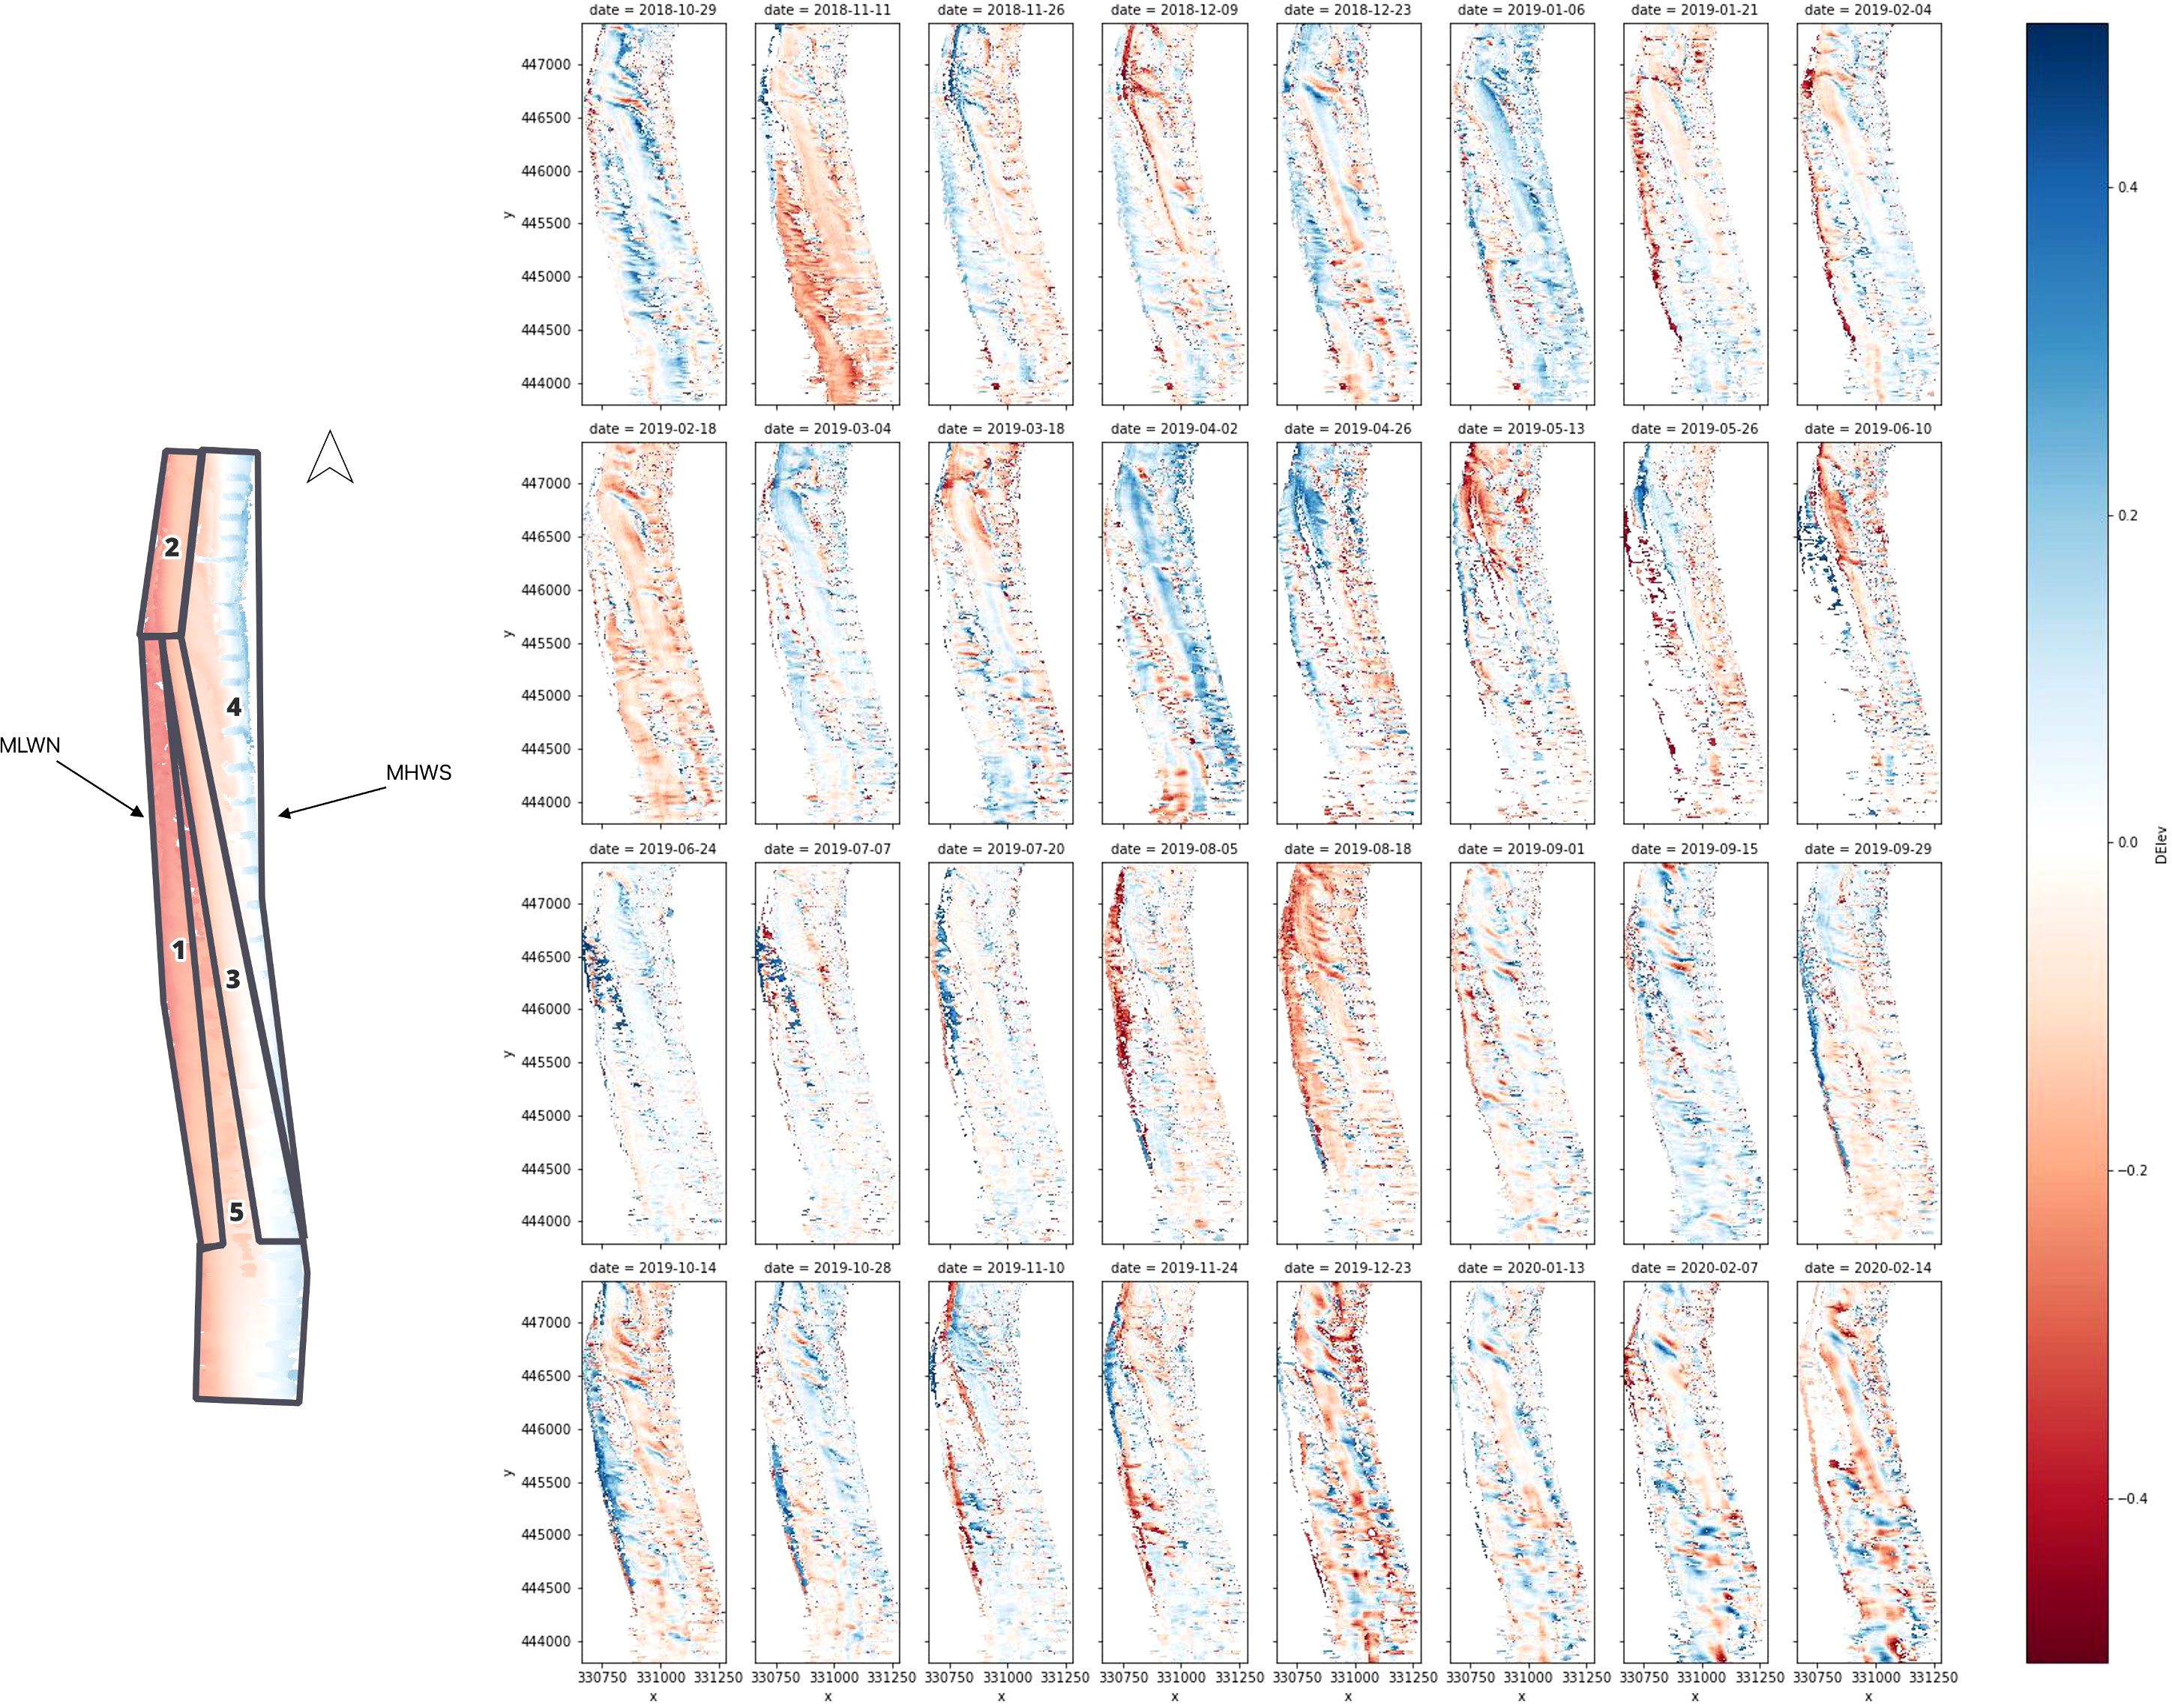
Figure 3 (left) Reference image breaking down the study area into segments of interest. MLWN and MHWS are also depicted. (Right) DEMs of difference (DoDs) in elevation between concurrent surveys within the time-series. Pixels with negative values represent erosion in that area. Pixels with positive values represent accretion. White pixels represent no change in elevation at that point or missing data.
Simultaneous erosion and accretion occurs rarely across the lower-intertidal zone over the study period. The center of the intertidal zone in sectors 3 and 5 see a high degree of stationarity, whereby the beach elevation changes very little for extended periods. This area experiences infrequent and spatially sporadic changes in elevation, which typically occurs in conjunction with greater changes in the upper and lower-intertidal zones. The upper intertidal zone in sector 4 generally experiences frequent low-magnitude changes. Interestingly, there is often a contrast between the elevation changes occurring immediately around the rock groynes and the spaces in-between, suggesting that elevation change within these areas is under the influence of localized effects.
There is a clear seasonal difference in elevation changes both spatially and in magnitude, though the intertidal zone closest to the low tide mark to the west displays more consistent high magnitude change throughout the study period. Notable changes in beach elevation lessen towards the center and eastern areas of the beach within the summer months (June-August), whereas larger elevation losses and gains are prominent across the entire beach across the Winter and Autumn surveys.
Figure 4 displays the Kernel Density Estimation (KDE) distributions for elevation change for each survey period. A left skewed distribution indicates erosion as a dominant process, whereas a right-skewed distribution indicates accretion. It can be seen that the distribution of elevation changes is centered closely around 0 between June – August. During this period most of the elevation changes across the beach are relatively small, indicative of no significant morphological change. Certain study periods present a KDE curve with a larger range, indicative of a greater spread of elevation changes for that period and therefore a greater degree of geomorphic change. This is particularly prevalent within the surveys in April and December. Generally, it is seen that periods of dominant erosion are followed by several periods of increased accretion, indicative of a period of beach recovery. The surveys taken on 11/11/2018 and 18/02/2019 show a clear deviation from surrounding surveys, whereby the mean value of elevation change is firmly negative. It is with certainty that these observations in particular display predominant and greater erosive behavior within the majority of the spatial extent. By observing both Figures 4, 5, one can discern the spatial extent of elevation change for any survey period whilst quantifying the magnitude.
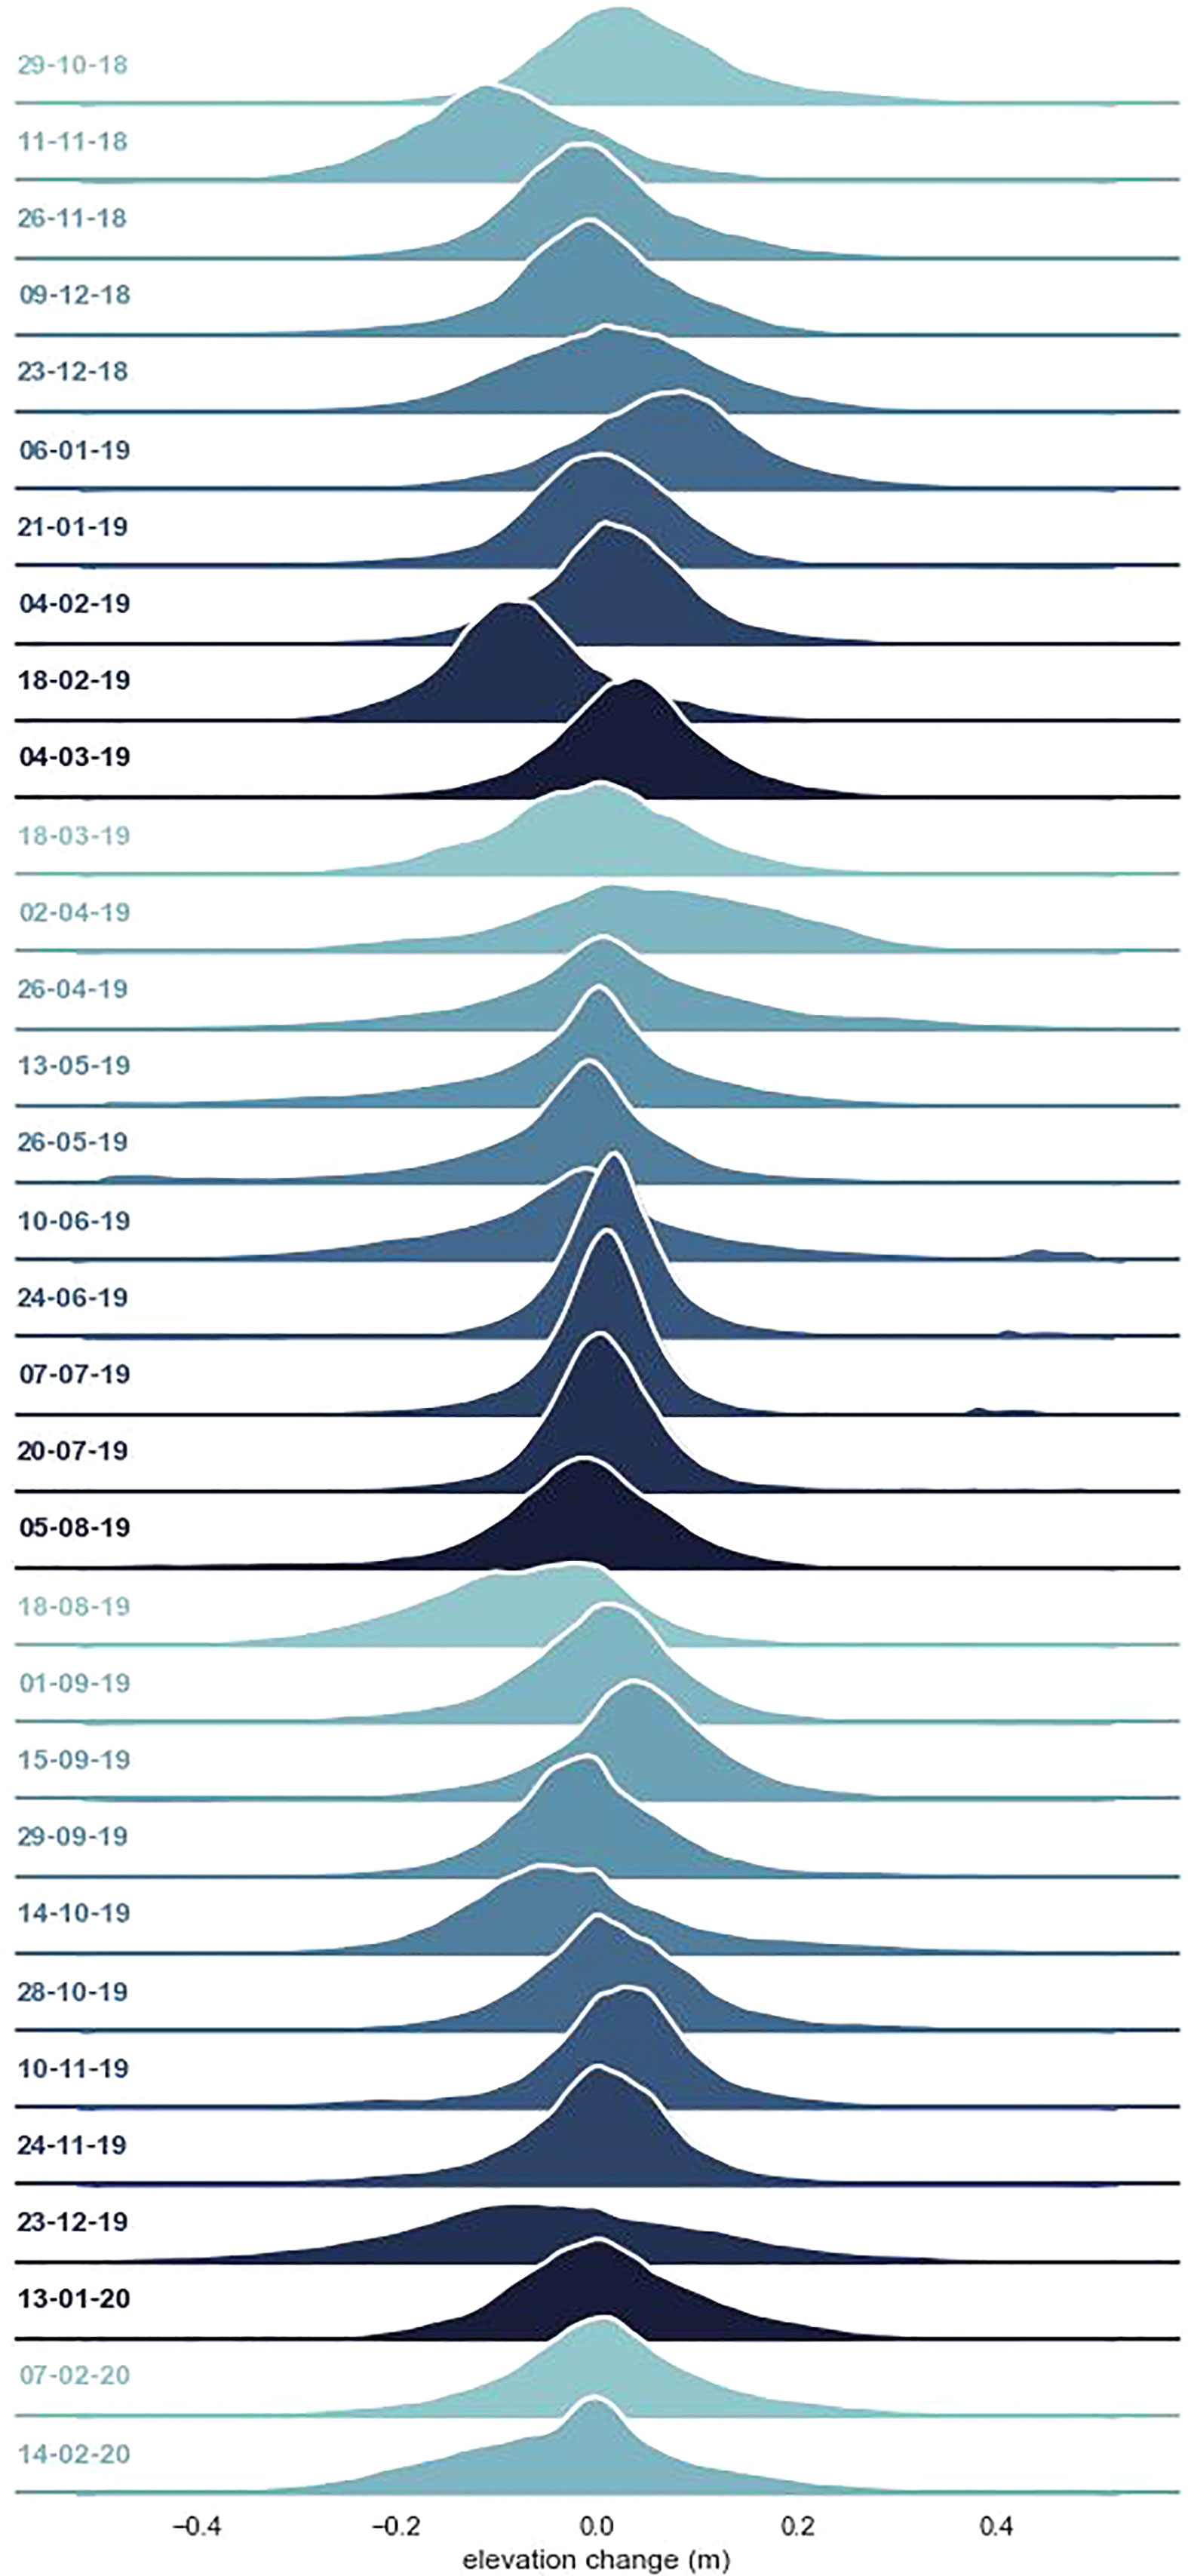
Figure 4 Distribution of the pixel values for elevation changes between concurrent surveys over the entire study location. Each row represents the entire spatial extent for a given date. Negative elevation change represents erosion, positive elevation change represents accretion.
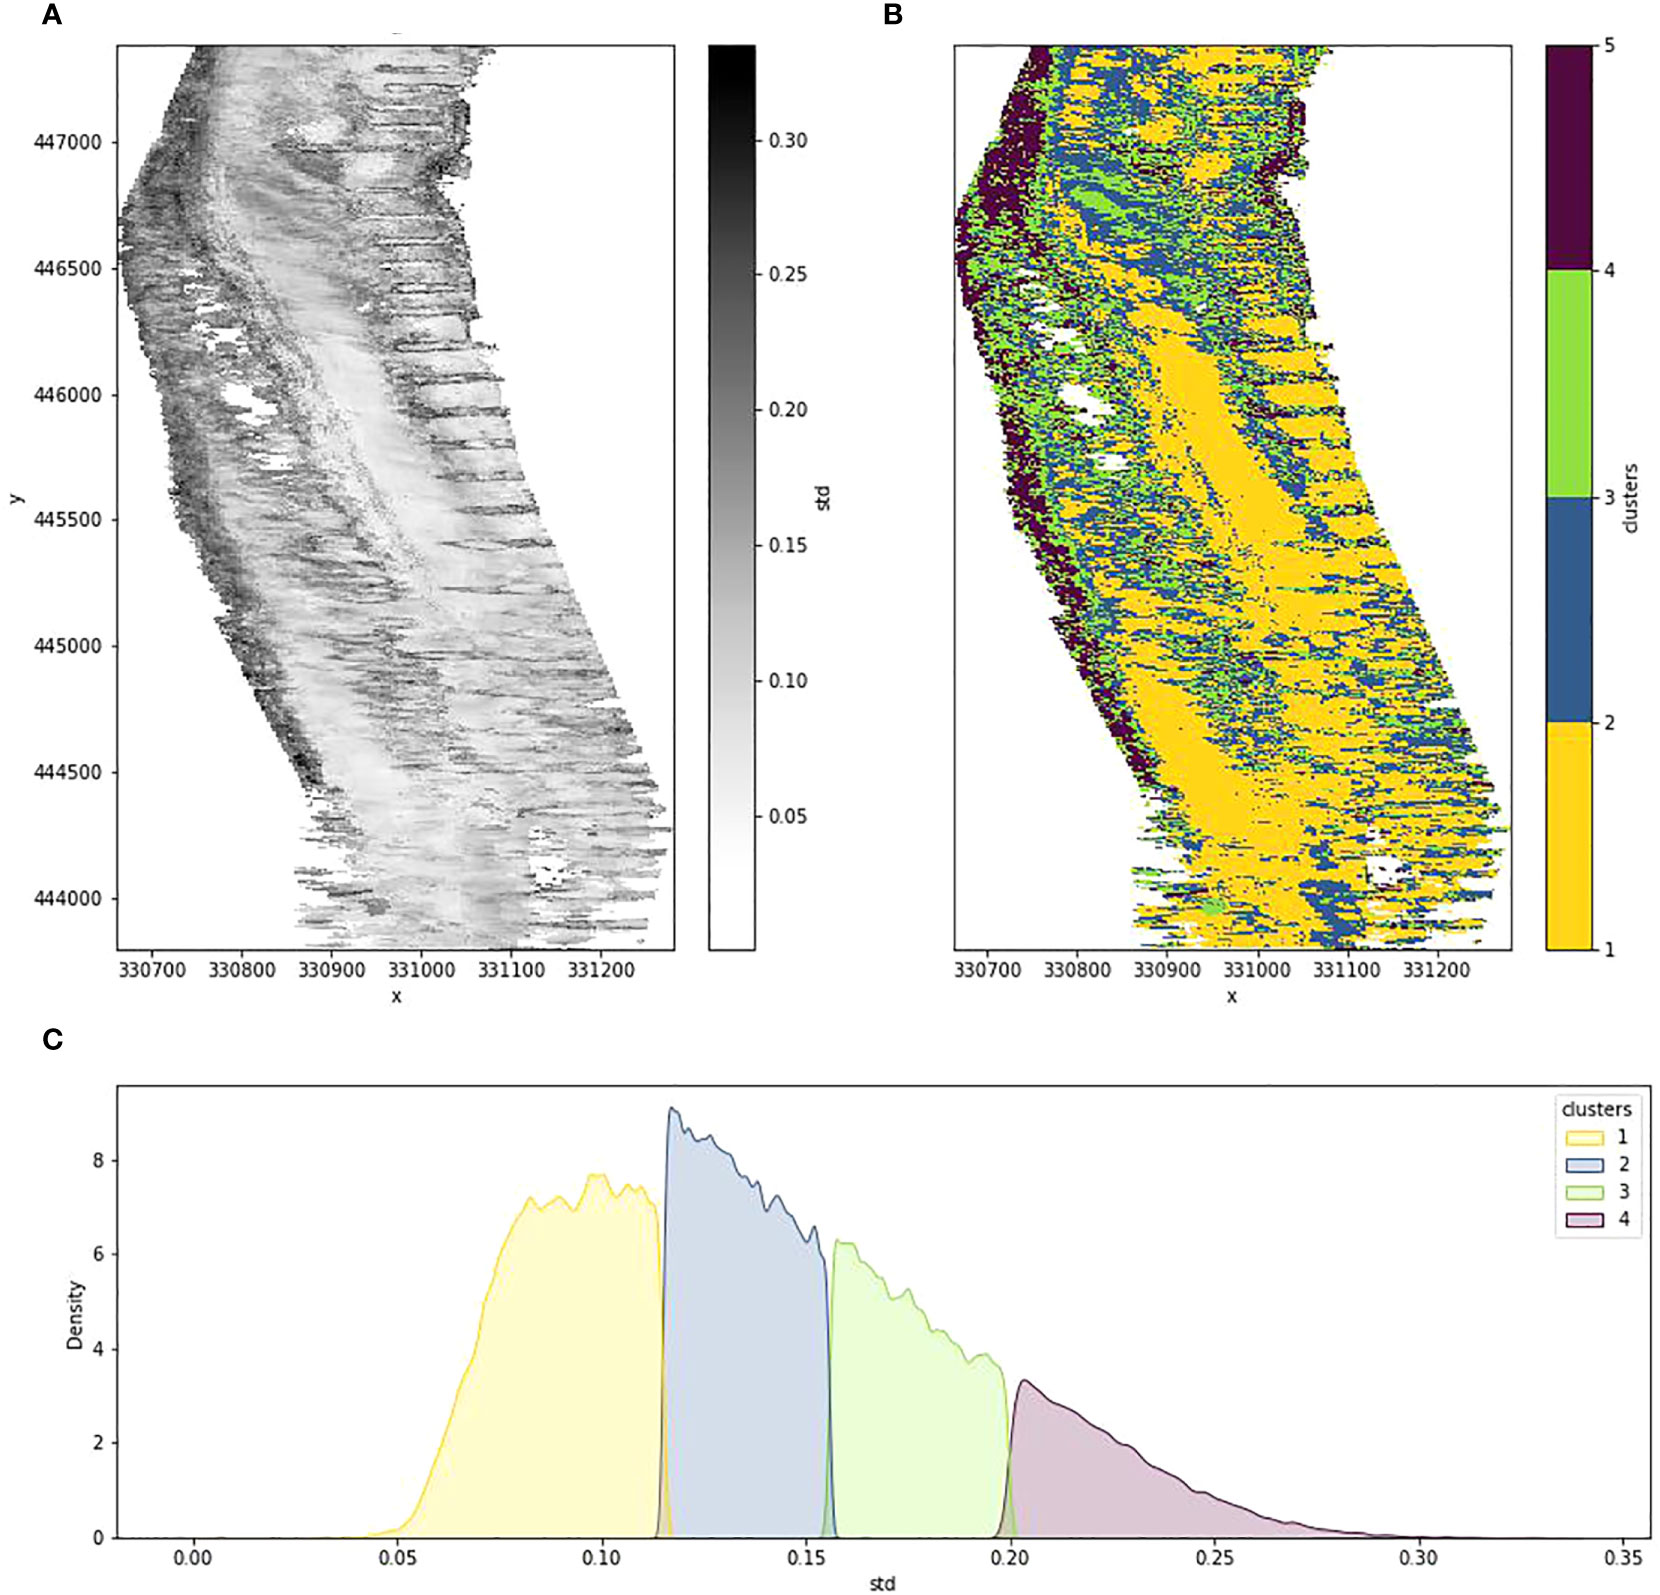
Figure 5 (A) The standard deviation of elevation change values for each pixel for each survey within the study period; (B) The result of a k-means clustering algorithm on the standard deviation of elevation change values for each pixel, featuring 4 clusters; (C) The frequency of pixels within each cluster.
3.1 Segmentation of coastal zones
In order to summarize the spatio-temporal patterns of beach change over time, the standard deviation of each of the pixel values over time was calculated. Figure 5A displays the spatial and temporal variance of elevation change over the study period. There is a clear spatial heterogeneity in the variance of elevation changes. To assist in characterizing the beach based on its variance in a simpler and more meaningful way, a k-means clustering algorithm was used to segment the image (Figure 5B). Conducting this image segmentation enables zones of the beach that exhibit similar morphological characteristics to be explored in further detail. Most notably, the variance in elevation change is greatest at the low-tide mark and immediately surrounding the groynes. Clusters of low-variance are present mostly at the center of the intertidal zone at the mid-tide mark, suggesting relative morphological stability in these areas over the study period. Low-variance clusters are also present in between groynes in the upper intertidal zone.
Figure 5C displays the frequency of pixels within each cluster and the associated standard deviations represented by each cluster. It is noted that, the greater the variance represented by the cluster, the fewer pixels within that cluster, meaning that much of the spatial extent of the beach does not experience a large variance in elevation changes throughout the study period.
Figure 6 displays the net sediment flux for each cluster during each survey period. Within this figure, the standard deviation represents the variance in net elevation change for that period. It is evident that there is significant variation in sediment flux across all clusters on a fortnightly basis. Notably, cluster 2 is the only cluster that displays net accretion over the entire study period, while all other clusters exhibit net erosion.
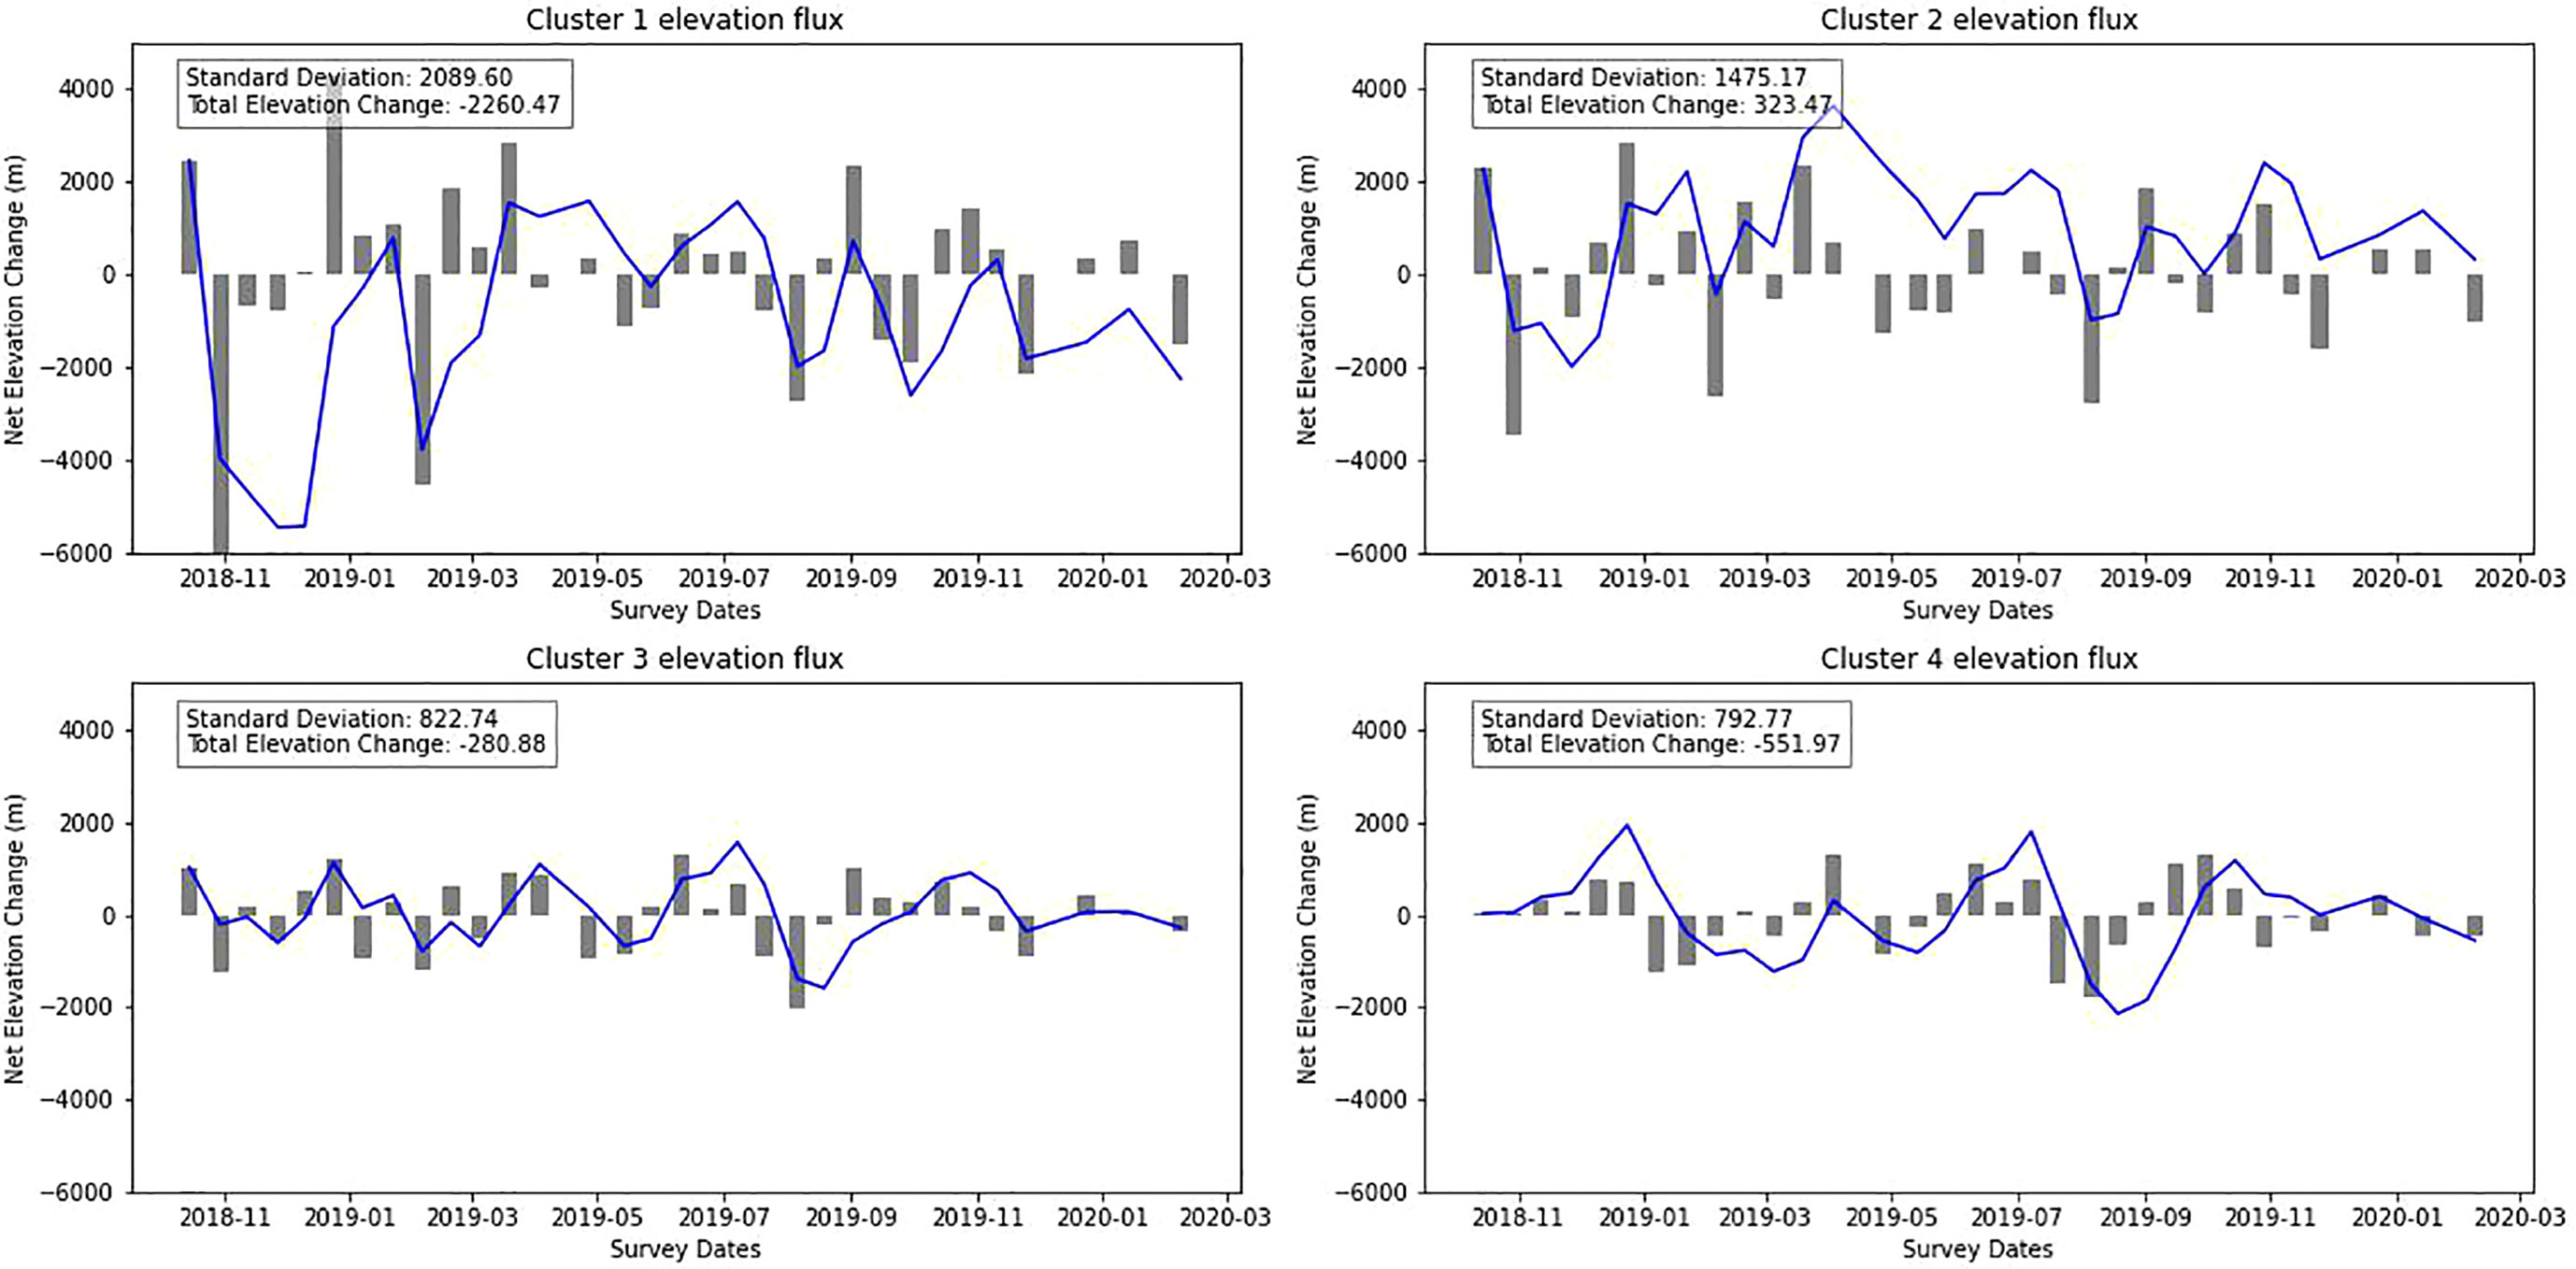
Figure 6 Net elevation change per survey, split by cluster. The cumulative sum of elevation change is represented by the solid blue line. Total elevation change over the study period and standard deviation of net elevation change per survey is provided.
Cluster 1, in particular, exhibits the greatest amount of erosion despite the pixels within this cluster displaying the least variation in elevation change. This suggests that although the pixel-wise fortnightly elevation change within cluster 1 is typically small in magnitude, it is predominantly erosional in nature. Interestingly, it is found that, for each survey period, as the pixel-wise variance in elevation change increases, the variance in net elevation decreases. In other words, areas that experience the greatest variance in elevation changes over the study period generally experience less extreme sediment loss or gain per survey.
Additionally, it is important to note that larger elevation changes within one cluster are not necessarily associated with greater changes in other clusters. While one cluster may experience net erosion, another may experience net accretion. This phenomenon may indicate inter-cluster sediment migration and the influence of multiple factors affecting sediment transport and deposition patterns within each area.
3.2 Seasonal variation
A monthly breakdown of dominant erosion/accretion process can be seen in Figure 7. The monthly elevation changes were calculated by taking the average of all pixel-wise elevation changes for every time-step within that month. Though the granularity and smaller-scale dynamics provided by the fortnightly time-steps is lost, the longer-term dominant erosive and accretional patterns can be seen. Prominent erosional and accretional behavior can still be seen in the hotspot areas to the west where the short-term variance is high, however there is no consistency in the dominant elevation change vector throughout the year. Greater changes in elevation can be seen within the Spring and Summer months, particularly in April and May where high-magnitude elevation changes can be seen across the entire beach area. Interestingly, the pattern of greater elevation changes overall in Spring and Summer appear to contrast with the short-term results of the fortnightly surveys. However, winter and autumn months still see substantial changes taking place across the entire spatial extent.
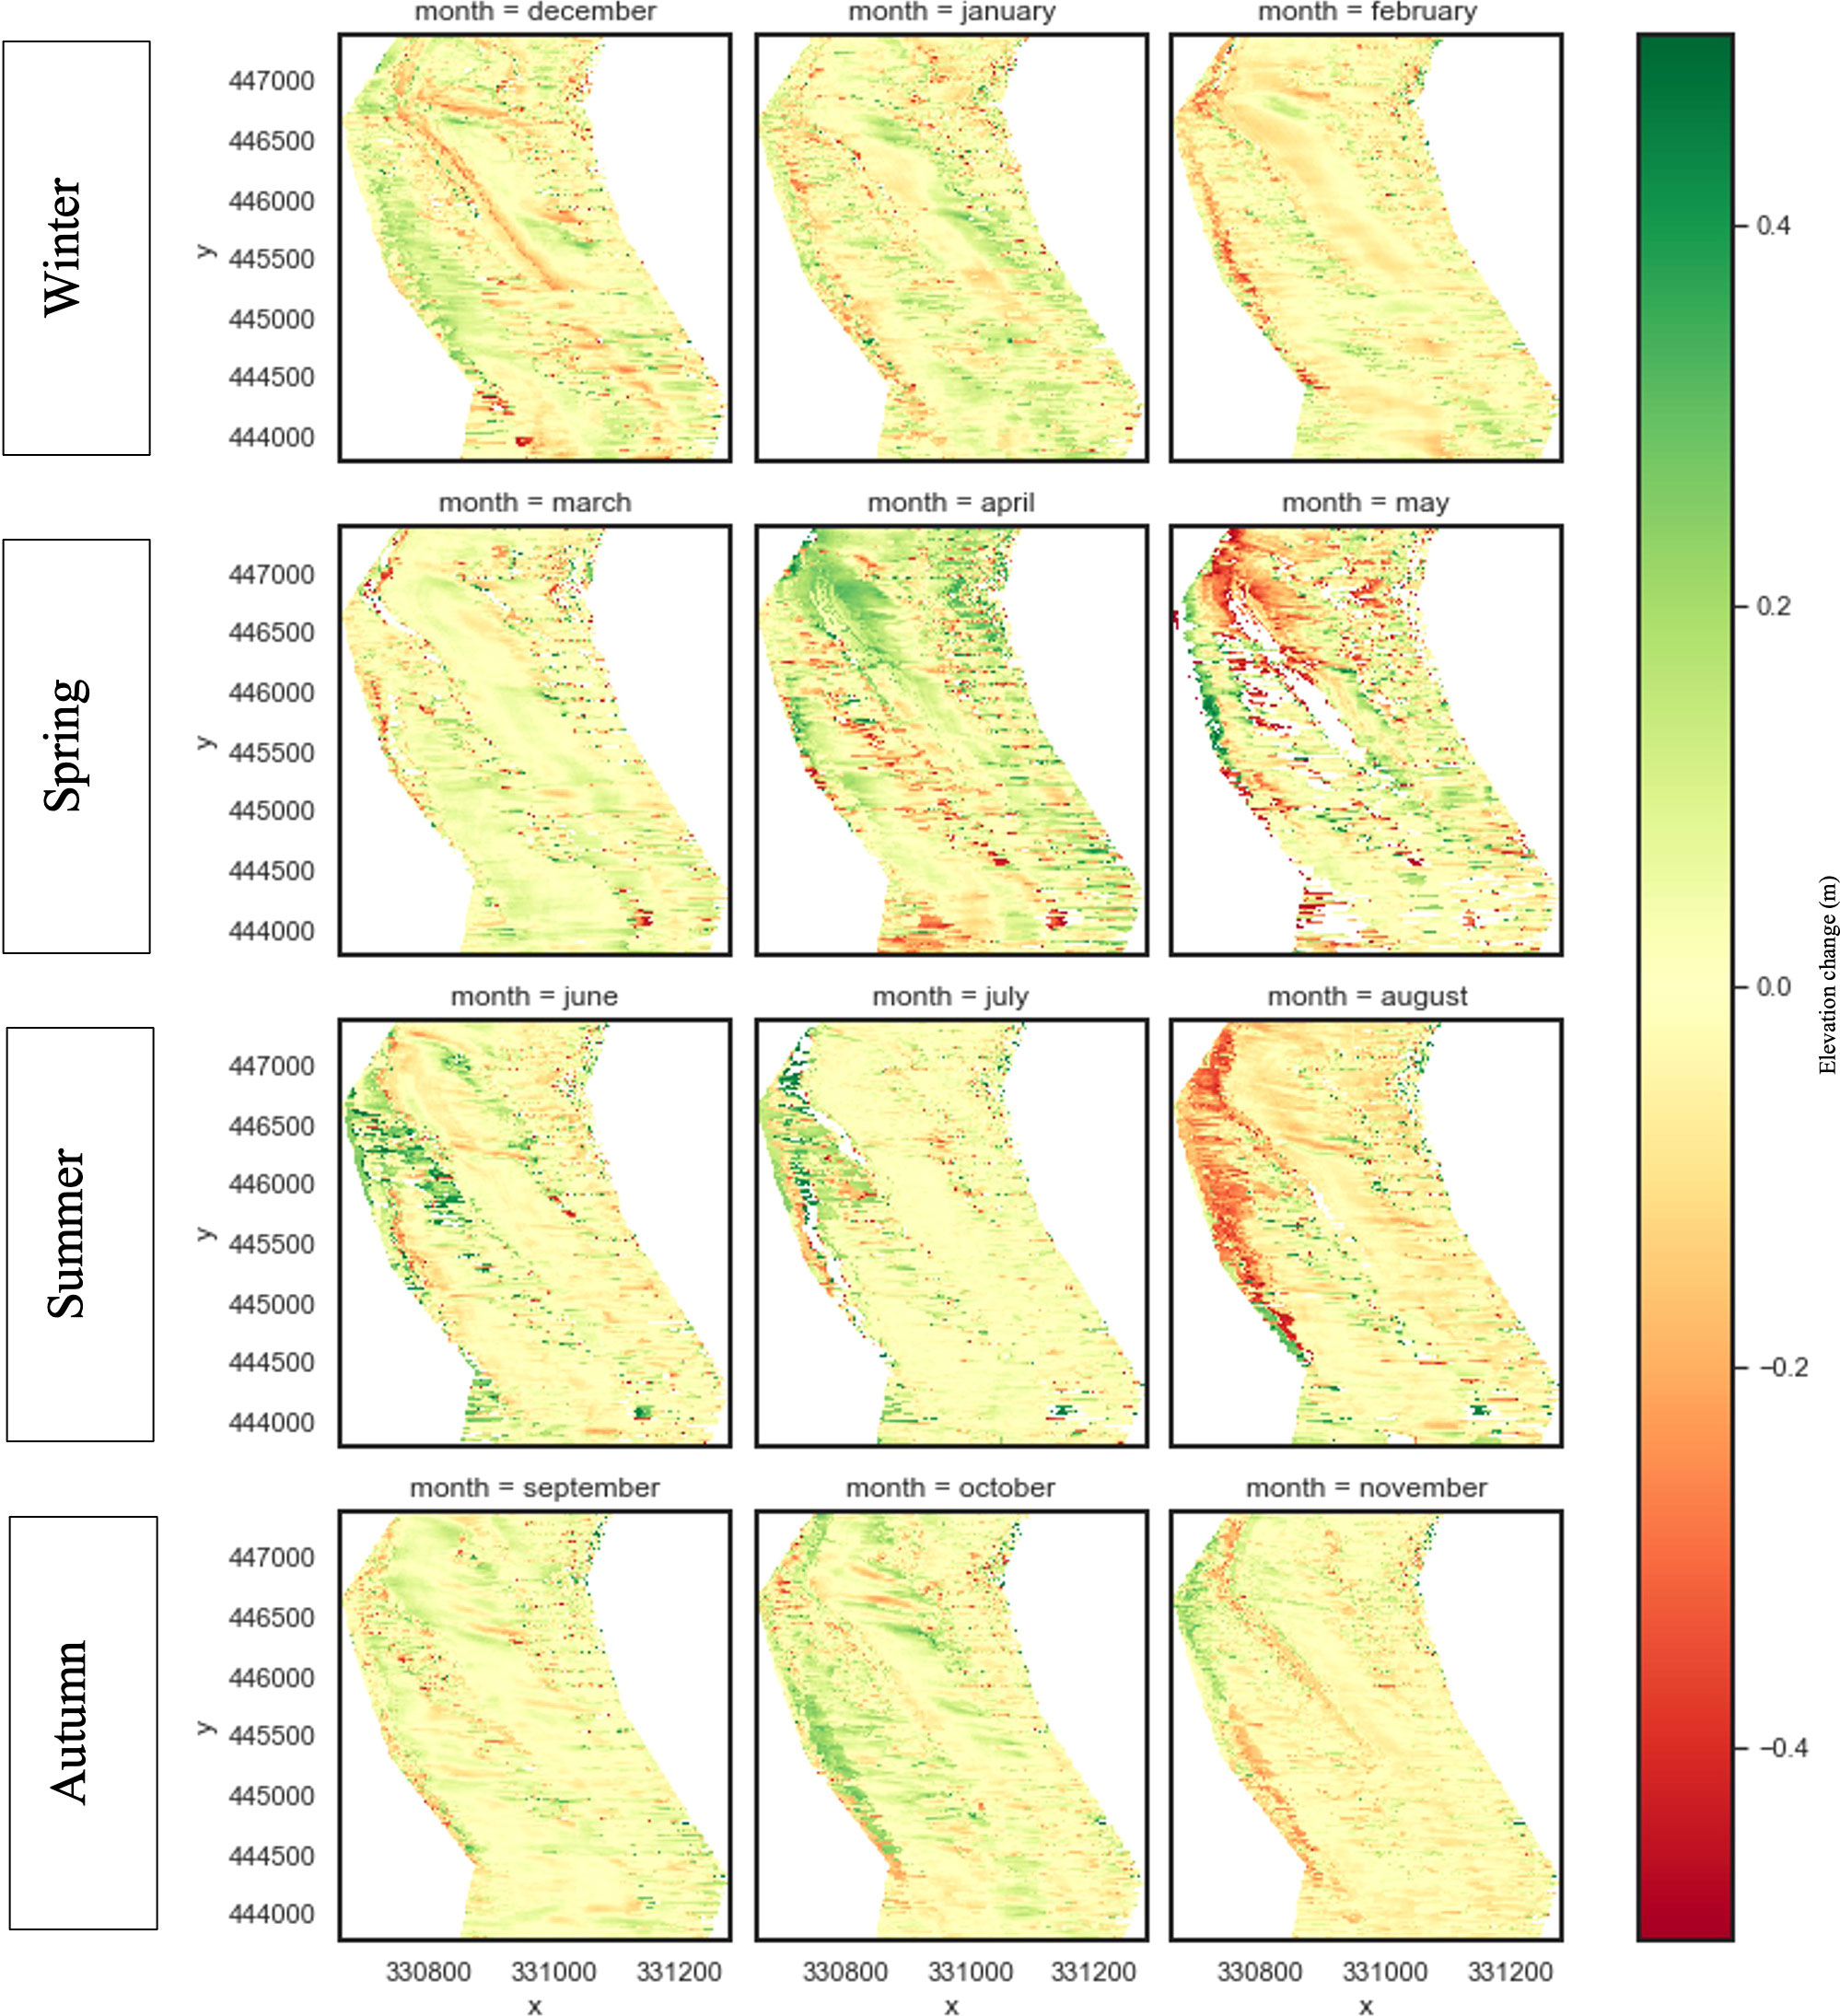
Figure 7 Facetplot displaying the average monthly elevation changes across the study site. The average pixel value is representative of the mean elevation change value for each of the pixels form the time series within that month. White areas represent no data/missing data.
An assessment of monthly elevation change collected over multiple years informs coastal managers and stakeholders of underlying spatial and temporal norms, aligning with traditional means for acquiring data on beach change. Further analysis of temporal trends such as seasonal variability can be visualized over the spatial extent of the cross-shore, providing further context for the magnitude of spatial variation, as shown in Figure 8. The elevation changes according to season are given by the different line types, with the residual change across these four seasons shown in black. Seasonal analysis of this temporal resolution displays that the beach elevation is in constant change along the cross-shore, both temporally and spatially. There are clear characteristic differences in the magnitude of elevation change between the low-tide mark, mid-tide mark and high tide mark. A greater degree of elevation change closer to the low water mark throughout the year results in both net accretion and net erosion in this area. Towards the mid-tide mark, the seasonal erosion and accretion is evident, however there is little to no net change in elevation in this area. This area of relative stability can be associated with zones of low variance, displayed in the standard deviation maps. An increase in the magnitude of elevation change seen towards the high-water mark is likely due to the large degree of sediment accumulation and erosion around the coastal groynes. This area experiences net accretion, suggesting that sediment on the upper beach has built up over the study period.
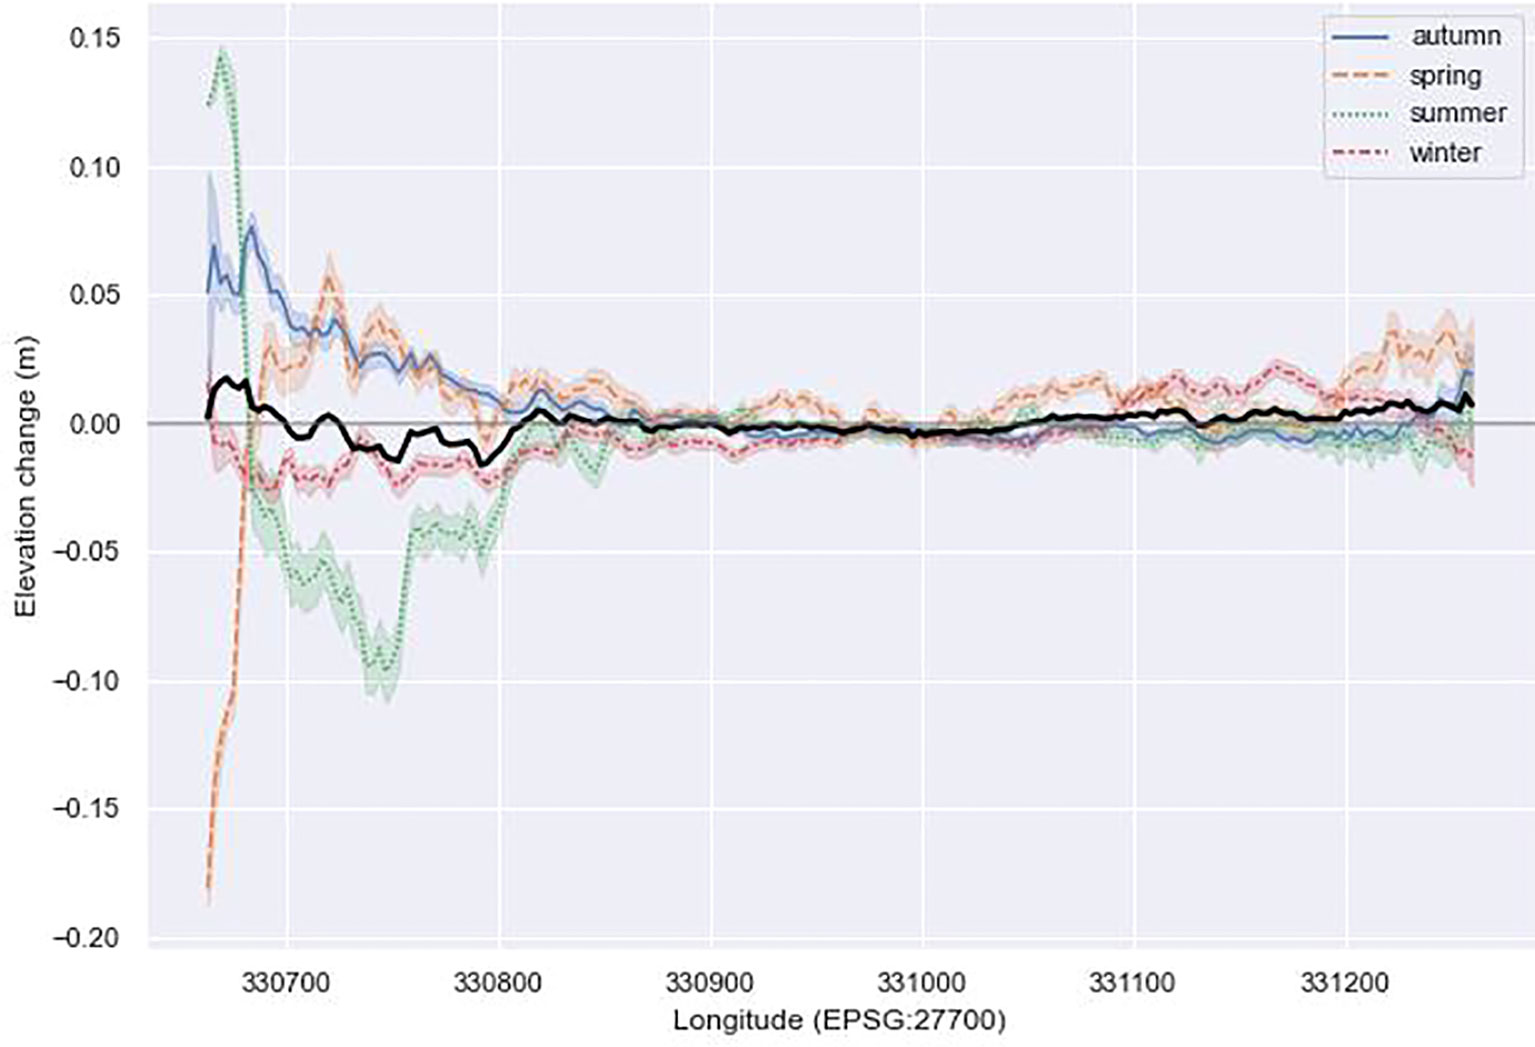
Figure 8 Average elevation changes across the survey cross section for each season. The lines for each season represent the alongshore average elevation change. Transparent area around the lines indicates the confidence intervals. Thick black line represents the elevation change residual, whereby a value close to 0 indicates little change occurred within this area.
The net sediment accretion for a given pixel across the cross-shore appears to balance out across seasons. This results in a residual that fluctuates close to 0, indicative of the system being in a steady state equilibrium. Infrequent snapshot transects are likely to reflect conditions that are only part of this naturally fluctuating process, thus indicating sediment loss/gain annually when this is not the case. As the time-series becomes extended over the automated collection of this data, annual seasonal patterns can be revealed with greater confidence.
3.3 Monitoring elevation changes resulting from stormy conditions
Inference from these characteristics to their impact on spatial beach geomorphology can be made by observing the hotspots of erosion (Figure 9A) and accretion (Figure 9B) between these storm events. It can be seen that erosion is a dominant process at the low-tide mark during storms, the exception to this is the survey that includes Storm Erik (Survey 2019-02-18), whereby accretion appears to be the dominant process across the majority of the spatial extent. There is little similarity between the spatial geomorphic effect of each of the storms, however elevation change hotspots are most prevalent around the groynes.

Figure 9 The spatial distribution of elevation change values for DoDs containing storm events. Each DoD corresponds to a Met Office named storm event occurring in the 2 weeks prior to the date shown. The DoDs highlight erosive (A) and accretive (B) behavior from storm events. Storm Atiyah is not included here as the associated survey was removed during the data processing stage.
Figure 10 provides an overview of the hydrodynamic features of Rossall beach, including storm events and net erosive/accretive study periods. It can be seen that surveys containing storm events typically experience net erosion. These events are also characterized by greater than average wave heights and periods, although this does not always result in net erosion across the intertidal zone.
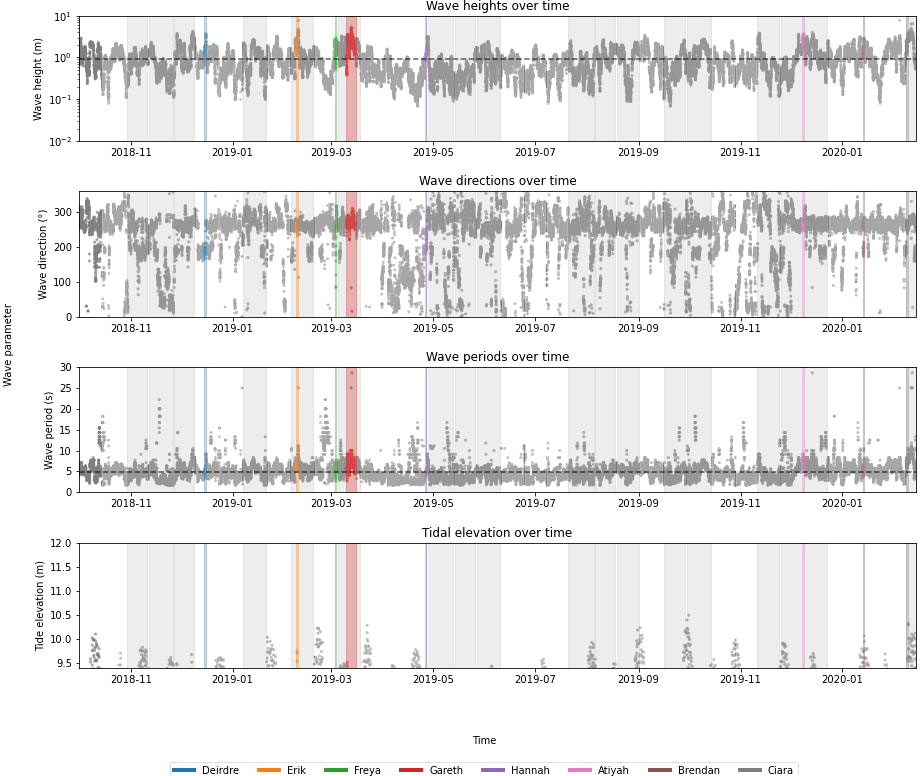
Figure 10 Hydrodynamic variability during the study period. Wave heights, wave direction, wave period and tide elevations over MHWS are shown. The horizontal dashed line represents the average value over the entire study period. Colored bands represent named storm events that occurred within the study period. Grey bands represent surveys that exhibited net erosion over the intertidal area. White bands represent surveys that exhibited net accretion.
The results show no obvious discernible seasonal patterns of net erosion or accretion across the intertidal zone. While periods with greater wave heights often correspond to erosive behavior, this is not always the case. Furthermore, the incidence of north and northeasterly wave directions and greater wave periods tends to be higher during net erosion periods.
The figure only displays tidal elevations exceeding MHWS, which captures instances where tidal impact is likely to have the greatest effect on beach morphology. Interestingly, the results demonstrate that tidal elevations exceeding MHWS can result in either net erosion or net accretion across the intertidal zone. For example, during storm Brendan, although the tidal elevation exceeded MHWS and greater than average wave heights and periods were observed, this period resulted in net accretion.
Figure 11 displays the spread of elevation change values between surveys with storm events compared to surveys where no storm events were present within the same month. Generally, it is seen elevation changes, both accretive and erosive, are extensively seen around storm events, indicating that a greater degree of morphological change occurs as a result of these storms. Given that the DEMs are derived from temporally averaged data, it is likely that each DoD is picking up morphological changes from the storm as well as subsequent recovery. However, it is clear that storm conditions do have a substantial effect on elevation change, as opposed to non-storm conditions. Interestingly, the difference between elevation changes appears to be reversed, whereby storms and non-storms display erosive and accretive behaviors oppositely within the same month. For example, typically, under non-storm conditions, February experiences a distribution of elevation changes that skews slightly towards accretive behavior. In a storm event period within February, the distribution of elevation change values skews toward erosive behavior. This pattern occurs for every month containing a storm event. During the study period only one survey was available for March, which featured a storm event. In this case the distribution of elevation change values could not be compared between storm and non-storm events.
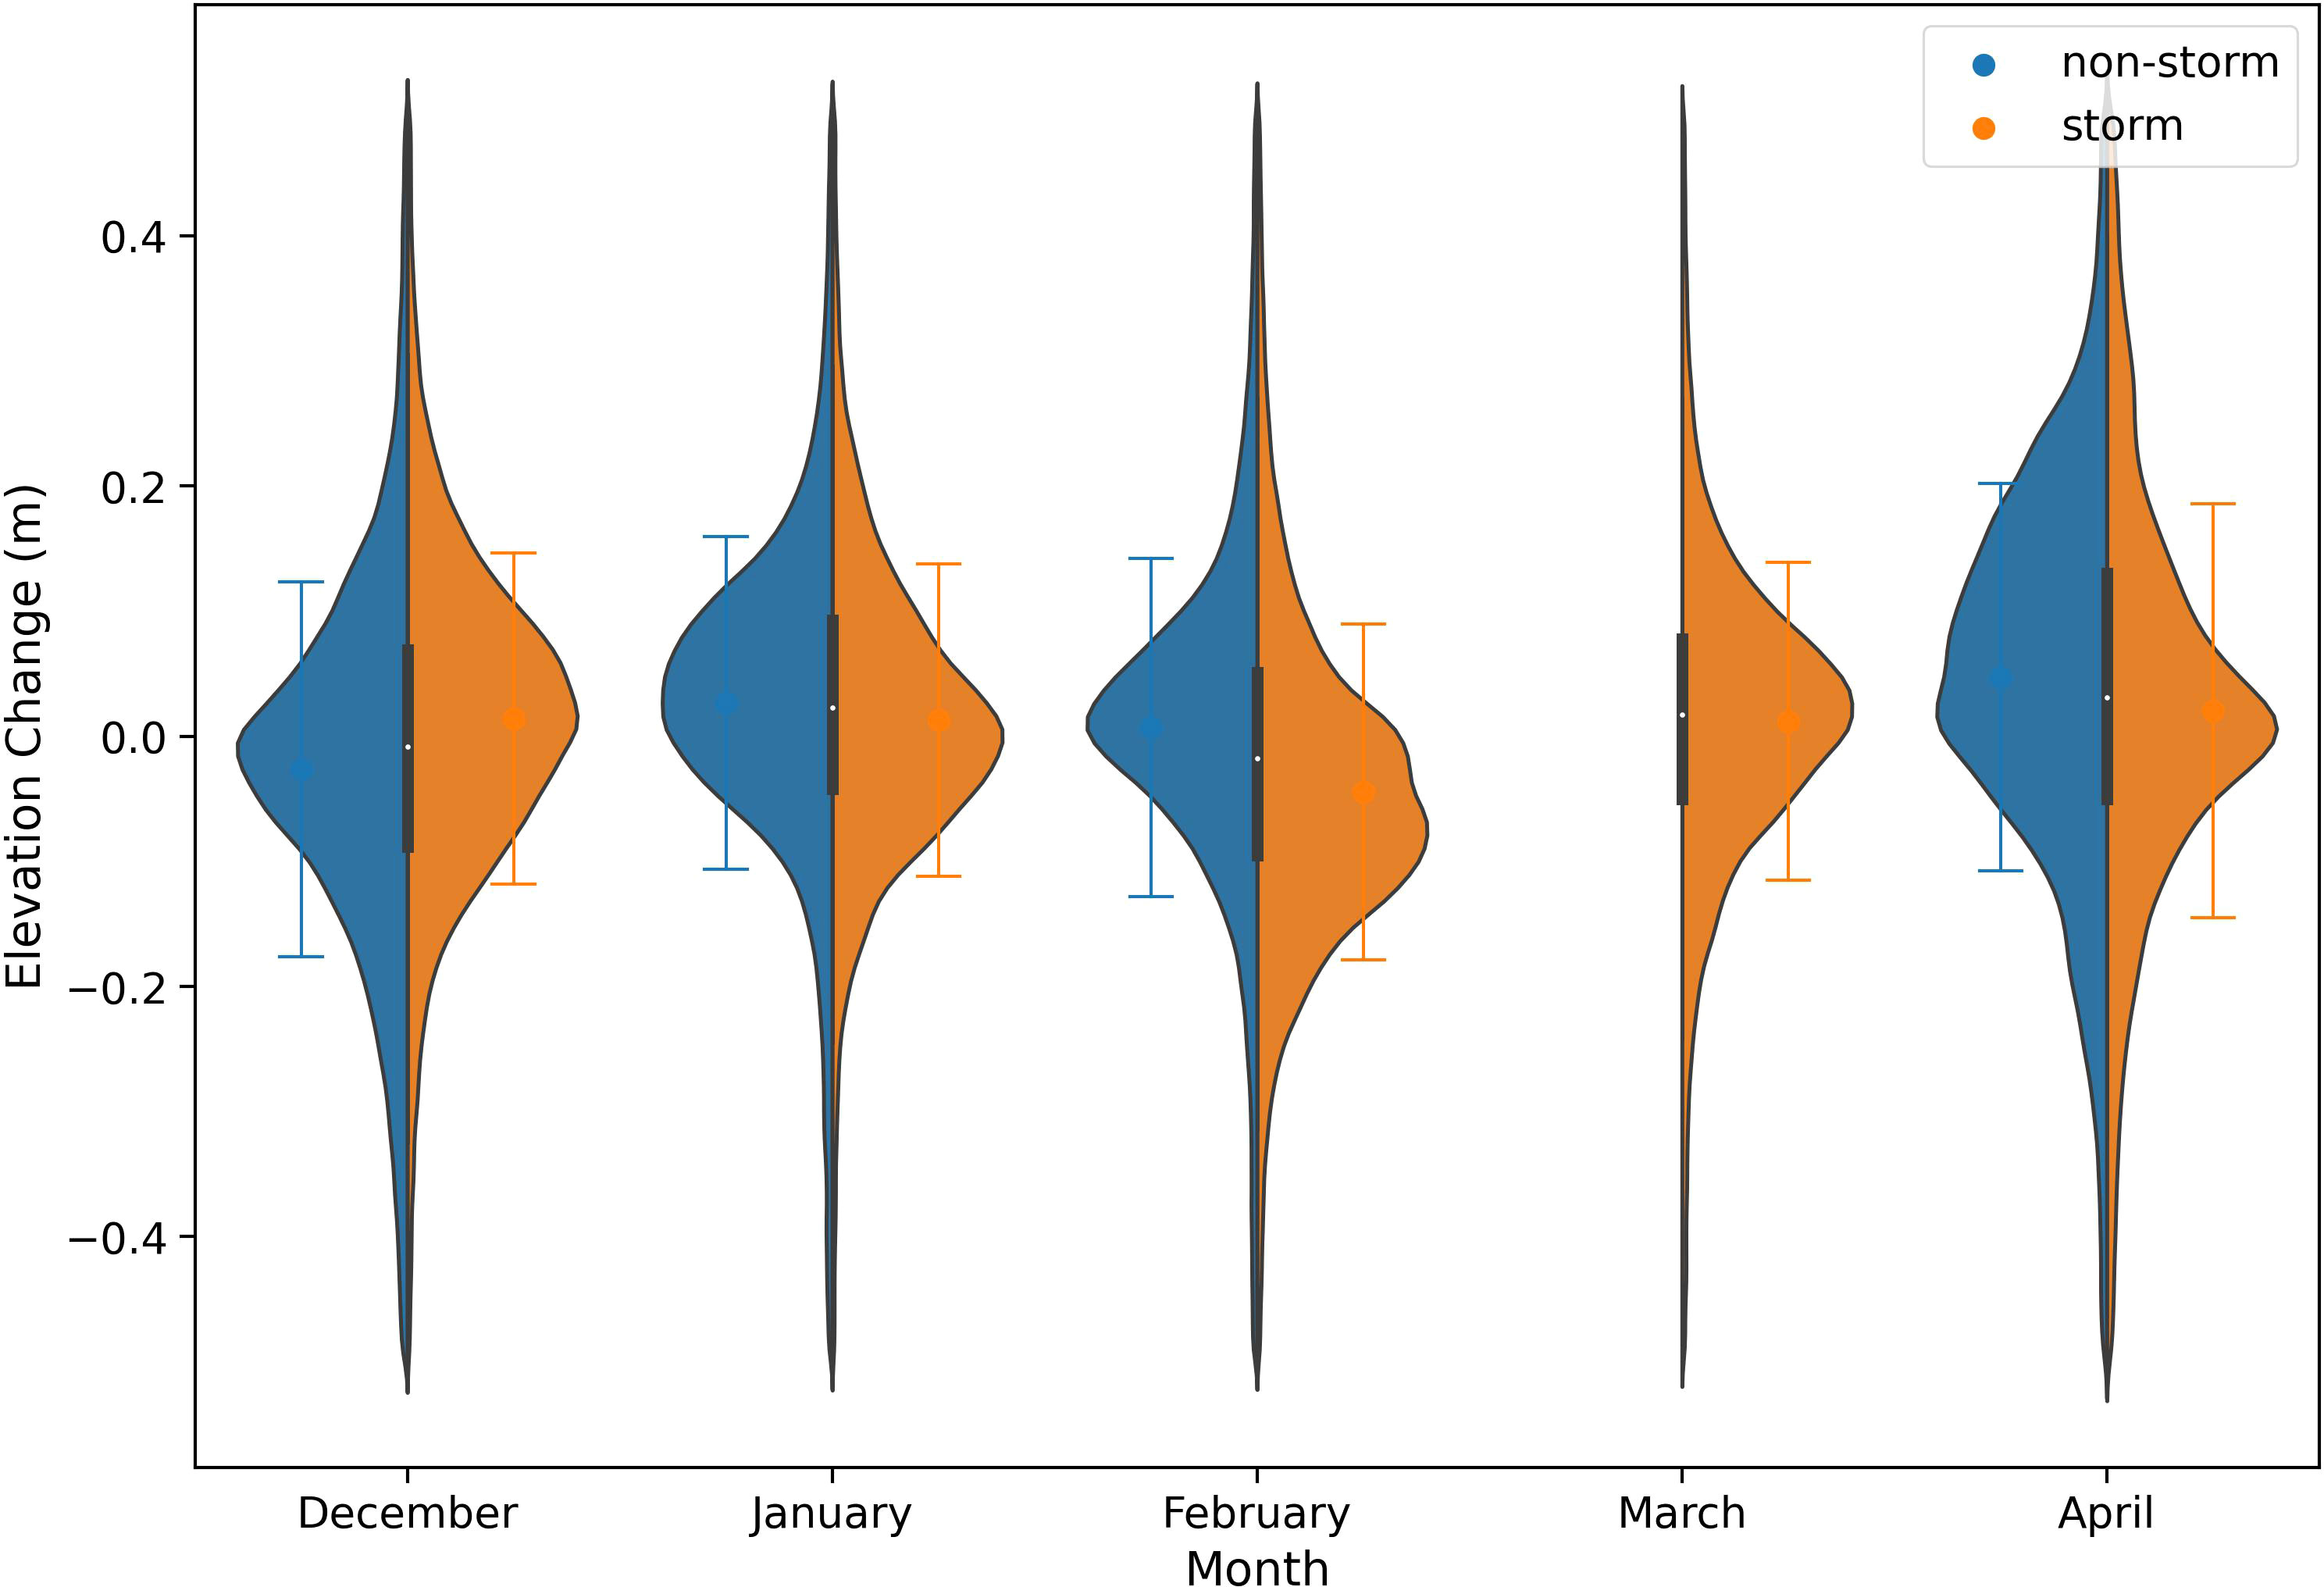
Figure 11 The frequency distributions of elevation change values from DoDs containing storm events and DoDs where no storm was present, as recorded by both storm and non-storm events from surveys within the same month. Confidence intervals display the standard deviation of mean elevation change.
4 Discussion
This study provides empirical evidence that quantitative analysis of elevation change can be used to infer the spatial and temporal characteristics of a beach profile. A novel combination of machine learning approaches and radar data is used to explore short- and long-term trends in coastal morphology for Rossall beach. Three-dimensional beach surveys with a temporal resolution of two weeks provide the means to monitor coastal dynamics from small-scale geomorphological movements to seasonal recovery. Monitoring the beach through these three-dimensional surveys is beneficial over traditional survey methods because it not only provides a more granular assessment of beach profile change, but also provides context on inter-beach movement of large-scale morphology, such as intertidal bars and other phenomena. Migratory or recovery dynamics like this may be missed or falsely picked up as significant sediment loss using data of lower temporal resolution or lower dimensionality (e.g. a 2 dimensional beach transect). The spatial and temporal variation in elevation has been classified into distinct clusters, highlighting areas of the beach with a greater magnitude of change over the study period.
4.1 Spatial variation
It is clear that the spatial variation of elevation change is largely heterogenous across the beach intertidal zone. By clustering the standard deviation of elevation change, distinct areas exhibiting different geomorphic characteristics have been identified. Generally, areas of the beach towards the low tide mark experience the greatest magnitude of elevation changes over the entire study period. Towards the mid-tide location there is generally little elevation change, particularly during the latter half of 2019. The upper-intertidal zone experiences substantial spatial heterogeneity, characterized by significant variations in standard deviations. This heterogeneity is evident in the distinct clusters observed, indicating different standard deviation patterns between and around the toe of the groynes. Groynes occasionally suffer from scour at the toe due to localized effects (Rajaratnam and Nwachukwu, 1983; Corbridge and Hawley, 2020). This localized scour can further contribute to the spatial heterogeneity observed in the upper-intertidal zone. Notably, the cluster that represents the lowest standard deviation of elevation changes contains the greatest number of pixels. This is indicative that, for a large spatial extent of the beach, the elevation changes are relatively small from survey to survey. This considerable spatial variability can be attributed to the influence of wave and tide dynamics affecting onshore and offshore sediment transport, whereby zones at the low tide mark experience near-constant wave forcing conditions (Plater and Grenville, 2010; Masselink, 2004).
There are a number of observations where a substantial degree of elevation change is present across the entirety of the beach, such as the period between October 2018 – May 2019, as well as early 2020. Generally, there is no dominant sediment process that affects the whole beach. Rather, smaller, and more localized patterns of erosion and accretion along the cross-shore can provide an evidence-base for how the intertidal zone responds to different environmental conditions. The morphological variability of intertidal landforms, such as bars, are spatially heterogenous, particularly between the lower and upper sections of the beach (Montreuil et al., 2020). This is reflected in the findings within this paper, displaying a greater variability of morphological change seaward, with lower variability in the upper intertidal zone.
Through the use of cluster analysis, zones of large-scale elevation change over the study period were identified. These zones can be referred to as elevation change ‘hotspots’ given that these areas experience the greatest rate of change relative to other clusters. Elevation change hotspots are not always cause for concern and may instead provide an insight on the local conditions contributing to geomorphic processes. For example, what looks like a significant erosion/accretion event in one area could be indicative of natural onshore intertidal bar migration or development (Masselink et al., 2006). Alternatively, episodes of accretion and erosion occurring in spatially contingent areas can represent processes of natural sediment disturbance and recovery, even during storm events (Zhang et al., 2005).
Miles et al. (2019) identified that multiple intertidal bars migrate onshore at different rates along the Fylde coast. Some of these bars are oriented at an oblique angle to the coast. These patterns can be seen through the high resolution radar data, represented by the non-uniformity in elevation changes parallel to the shoreline. The spatial heterogeneity displayed by the elevation change clusters, particularly from the low tide – mid tide mark, is further evidence of differing rates of onshore bar migration. Although the changing morphology and migration of intertidal bars is not the focus of this study, this analysis displays the potential to track fluctuations in these phenomena in the short-term – a current limitation of LiDAR data in the UK (Miles et al., 2012; 2019). Furthermore, in a monitoring programme using the Argus system, De Alegria Arzaburu et al. (2007) saw the rapid onshore movement of ridges and runnels over a single spring and neap tidal cycle. This can assist in explaining the spatially contiguous accretive and erosive patterns along the beach within concurrent surveys. Whilst the temporally averaged DEMs utilized in this methodology are likely unable to capture the evolution of these short-term processes, a more comprehensive understanding of beach dynamics can be achieved by harmonizing radar and optical data.
Masselink et al. (2006) highlights that sediment transport direction changes frequently during a single tidal cycle due to varying exposure to waves. The magnitude of this tide-dominated sediment transport can be exacerbated with larger tidal ranges and lower wave heights. Waves at the Fylde coast have a relatively low wave height due to sheltering effects from Ireland, Wales, and Isle of man to the west, south and northwest respectively (Corbridge and Hawley, 2020). Given its large tidal range, it can be suggested that much of the spatial variation in beach morphology seen in this analysis can be attributed to factors associated with tidal processes. The study also brings focus to areas of complex, short-term hydrodynamics across the intertidal zone. Obtaining an understanding of areas of the beach that frequently change and the magnitude of this change is incredibly useful for coastal decision making such as rapid erosion intervention.
Further improvements to the spatio-temporal characterization of beach zones are possible. It is recognized that the clusters within this study are not spatially constrained, and zones of similar variation across the entire intertidal zone have been clustered together for the purpose of identifying hotspots. It is likely that clusters are impacted by different factors that are relevant on the spatial scale but are not the focus of this study. Instead, this study displays the vast potential of radar derived DEMs for exploring previously unseen spatial and temporal dynamics in the intertidal zone.
4.2 Temporal variation
The radar produces a full intertidal beach survey every two weeks. The benefit of this is that small-scale changes can be captured and reflected across a substantial area within each survey. These changes are rarely picked up with data of lower resolutions, which often display changes based on two singular snapshots in time. The benefits of this high spatial and temporal resolution are supported by the findings of Pucino et al. (2021) whereby one can quantify the heterogenous nature of the nearshore, displaying that beach elevation changes can vary substantially both spatially and temporally - particularly in the lower intertidal zone. A contrast emerges between the magnitude of elevation change over the small-scale fortnightly period and the seasonal scale at Rossall. It is likely that fortnightly elevation change surveys are picking up an intrinsic disturbance-recovery system, given that the general temporal pattern appears to shift between erosive and accretive events. High magnitude elevation change could be indicative of consistent, uninterrupted seasonal disturbance and recovery both longshore and cross-shore as part of this dynamic annual pattern.
Notably, fortnightly changes reflect a shift from relatively low magnitude elevation changes in the summer months to changes of greater magnitude in the autumn and winter. However, observation of monthly and seasonal timescales displays elevation changes of greater magnitude within the spring and summer, with the dominant processes being erosional and accretional respectively. In particular, the elevation changes occurring during the spring and summer often contrast with one another along the entire cross-shore profile, almost to the degree of a mirror-image effect. This is somewhat true for winter and autumn elevation change, albeit to a lesser extent. This does not necessarily indicate that a greater degree of morphological change occurs within summer and spring. Instead, the greater elevation changes reflected within the monthly/seasonal surveys are likely indicative of slower beach recovery due to fewer stormy conditions and therefore a lower energy system. This also provides an insight into the characteristics of the intertidal zone during prolonged periods without storms.
Understanding seasonal trends for meso to macro-tidal beaches is imperative for effective coastal management. Seasonal patterns in beach morphology are such that equilibrium models are able to capture and predict changes in shoreline and sandbar behavior over multiple years with a good level of accuracy (Splinter et al., 2018). Whilst it is entirely appropriate to focus on tidal dynamics in driving the geomorphology of a multi-barred, macrotidal foreshore, it is also necessary to consider wave-driven morphological change across the upper part of the profile. Here, the observed migration and ‘welding’ of large-scale morphological features across the lower intertidal platform will give way to mesoscale change above the mid-tide level (approximately mean sea level) where tidal currents will likely be waning below their maximum velocities on the flood tide, and wave-dominated sediment movement will predominate in shallow water (Kroon and Masselink, 2002). Indeed, the net vector of sediment movement across the upper tidal flat will vary according to the prevailing tide and wave climate (Masselink and Turner, 1999). The morphological changes observed across the Rossall intertidal foreshore from the continuous radar survey are therefore the product of tide and wave interaction that varies in degree in space through time.
Though seasonal conditions from year to year can vary (for example, a more energetic winter in one year compared with another), annual cross shore dynamics and sediment budgets can be relatively similar (Biausque and Senechal, 2019). In order to test these phenomena with a high spatial resolution, further study would seek to compare seasonal morphological dynamics over several years. The temporal resolution of the data in this study would be beneficial for observing the small-scale dynamics that contribute to larger, inter-annual morphological change.
4.3 Storm event behavior
Monitoring the morphological impact of storms is of vital importance to coastal stakeholders. Storm events often yield large movements of sediment in a short period of time, often reducing the defensive capacity of a beach system. Through use of radar derived DEMs, the spatial and volumetric impacts of storm events and subsequent recovery has been captured and compared with non-storm periods. There is no overall predominant morphological process that occurs during the storms recorded at Rossall. No two storms appear to have similar spatial patterns across the beach, highlighting that the product of sediment movement is a series of complex and contextual hydrodynamics. In every case, there are substantially greater magnitude of erosion and accretion occurring across the beach. Interestingly, the presence of storm events appears to shift the dominant morphological processes that occur when no storm event is present, often having an opposite effect. This results in conditions brought about from storm events yielding a greater magnitude of beach accretion in the fortnightly survey than is seen when no storm is present. Given that the surveys display average elevations over the two-week period, it is likely that DEMs taken during storm events are also capturing rapid beach recovery (List et al., 2006; Dodet et al., 2019).
Typically, the morphological effect that storm events have on beach environments is difficult to capture. Given that the radar is stationary and weather independent, it can capture changes in elevation over two-week periods, even during storm conditions. This would be particularly useful for monitoring the morphological movement almost immediately before and after antecedent storms, a phenomenon that typically contributes to significant coastal erosion (Callaghan et al., 2008). Given that the waterline method captures the mean tidal elevation over a two-week tidal cycle, conditions immediately pre and post-storm can be difficult to obtain. The method instead excels at capturing the spatial influence of storm events, as the radar is still operational during these events. The ability to pick up the spatial and volumetric changes that occur under the influence of storm conditions provides an insight into the underlying drivers of morphological change over time. Further work on the hydrodynamic forces driving morphology at this site could reveal dominant sediment processes in combination with analyses such as those presented in this paper. Given the aim of this paper is to characterize beach behavior using an exploratory analysis of this data, a dedicated analysis of morphological storm response is beyond the scope of this paper. Future work seeks to focus on the capabilities of radar for capturing these phenomena.
Open-source DEM data is available for the study site via LiDAR surveys provided by the Environment Agency. However, surveys are taken only once per annum. This means that longer-term multi-year analysis can be completed on the intertidal zone, but little information can be inferred on the small-scale processes that occur within the year. Thus, the morphological effect and subsequent recovery of storms cannot be captured. The radar system at Rossall captures data autonomously every fortnight. Collection of this data over several years will enable a longitudinal study that can focus on beach dynamics in both the short and long term.
4.4 Equilibrium profiles
The seasonal variation in elevation change that is displayed within this study provides a spatio-temporal exploration of intertidal dynamics at Rossall beach. There is often contrasting geomorphic processes occurring over different seasons, almost to the extent where erosional change is often met with a mirroring value of accretional change in a different season, and vice versa. A similar geomorphic beach response was found by List et al. (2006), whereby erosion hotspots influenced by storm events exhibited a ‘mirror image’ recovery only days or weeks after the initial erosion event. For Rossall, this phenomenon occurs over seasonal timescales over the cross-shore. Annually there is little overall elevation change over the intertidal profile. This suggests that the intertidal zone is in a steady-state equilibrium, where little sediment is lost or gained over the year (Bruun, 1962; Davidson et al., 2013). Larger elevation changes in one season are often balanced by another, suggesting that high frequency spatio-temporal variability is embedded in no substantive overall net change. This behavior is somewhat represented by the standard deviation clusters, whereby high frequency variability in elevation change is not always associated with a greater net loss or gain in elevation. This dynamic geomorphic movement exacerbates the benefit of high-resolution data, by being able to capture the small-scale changes that contribute to large scale processes. This would be an asset for models that predict beach change, providing a comprehensive test or validation data set.
4.5 Value to coastal managers
The radar system at Rossall offers wide area coverage with a high temporal and spatial resolution. This wide coverage, as well as the automated monitoring at fortnightly periods, make this technique invaluable for monitoring short-term dynamics in beach morphology. Within the UK at the time of writing there are 5 dedicated operational radar systems collecting data from coastal sites in the northwest of England. Radar sites are Rossall, Cleveleys, Blackpool, Lytham, Crosby and New Brighton. Each system costs roughly the same as employing a mid-level full-time staff member at a local authority on an annual basis. These radar towers are designed to enable coastal managers to make more cost-effective choices and envisaged to be a cost-saving mechanism over the deployment life cycle.
The methodology for spatio-temporal analysis applied in this paper is applicable to DEMs taken from any beach, providing a versatile tool for understanding and characterizing event to seasonal changes in local beach topography. Tracking the changes in elevation provides an opportunity for coastal managers to observe areas of the beach that experience rapid erosion over short periods of time. This is particularly important around coastal structures, enabling a quantitative assessment of erosion, scour and bar migration over time. Long-term monitoring of these changes can assist in coastal management decision-making, such as implementing intervention strategies. For example, an allowance of over £2.5 million was made for 125,000m³ of nourishment over a ten-year period at Rossall beach. The data and methods used in this paper has the potential to optimize the nourishment process, targeting specific areas that experience net elevation loss. Furthermore, the observation of short-term morphological trends through spatio-temporal analysis can also assist in testing and validating models for beach change.
5 Conclusions
Short-term variability in morphological change can be monitored and tracked using radar-derived digital elevation models. Utilizing machine learning techniques and spatio-temporal analytics, this paper has conducted an exploratory analysis of intertidal morphology over time scales ranging from event level to seasonal. It was found that over individual spring/neap tidal cycles, the lower intertidal zone of Rossall beach experienced substantial variability in elevation change. Much of this variation occurred in spatially contingent areas, suggesting continuous disturbance and recovery dynamics of intertidal bars over the tidal cycle. Over the seasonal to annual time scale, this high frequency variability levelled out to little to no net change in elevation, indicative of a steady-state equilibrium across much of the intertidal zone. This pattern was most obvious around the center of the intertidal zone, which experienced longer periods of stationarity throughout the study period. The upper intertidal zone, featuring a series of coastal defenses including groynes, rock armor and a sea wall, experienced a general increase in elevation, suggesting that this section of the beach appears to be building up. Further research can be undertaken to investigate the specific morphological changes induced by hydrodynamic forces on structures like groynes, providing valuable insights into their efficacy against coastal hazards and the need for maintenance.
Through comparing the morphological implications of storm events with non-storm events, this study found that storms and their subsequent recovery often displayed an opposite morphological response to normal conditions within the same month. Storm events were associated with generally higher magnitude elevation changes, both accretional and erosional in nature. Hotspots for storm activity were typically concentrated around the lower-intertidal zone, which saw mostly erosion. There appeared to be no clear association between the spatial extent of storm-induced morphological change and wave heights alone. Further work would seek to introduce a greater variety of hydrological characteristics to understand associations between these and their impact on morphology over the spatial extent.
Data availability statement
The raw data supporting the conclusions of this article will be made available by the authors, without undue reservation.
Author contributions
JM: Conceptualization, analysis and manuscript writing. AP, CB, DA-B: Conceptualization, editing and feedback and supervision. All authors contributed to the article and approved the submitted version.
Funding
This work was supported by the Economic and Social Research Council (Grant no: ES/P000401/1)
Acknowledgments
The author would like to thank the team at Marlan Maritime Technologies Ltd. for providing the radar data and for the continued support during the research process. This study uses data from the National Tidal and Sea Level Facility, provided by the British Oceanographic Data Centre and funded by the Environment Agency.
Conflict of interest
Author CB was employed by the company CoastSense Ltd.
The remaining authors declare that the research was conducted in the absence of any commercial or financial relationships that could be construed as a potential conflict of interest.
Publisher’s note
All claims expressed in this article are solely those of the authors and do not necessarily represent those of their affiliated organizations, or those of the publisher, the editors and the reviewers. Any product that may be evaluated in this article, or claim that may be made by its manufacturer, is not guaranteed or endorsed by the publisher.
References
Amodio A. M., Di Paola G., Rosskopf C. M. (2022). Monitoring Coastal Vulnerability by Using DEMs Based on UAV Spatial Data. ISPRS Int. J. Geo-Information 11 (3). doi: 10.3390/ijgi11030155
Bell P. S., Bird C. O., Plater A. J. (2016). A temporal waterline approach to mapping intertidal areas using X-band marine radar. Coast. Eng. 107, 84–101. doi: 10.1016/j.coastaleng.2015.09.009
Biausque M., Senechal N. (2019). Seasonal morphological response of an open sandy beach to winter wave conditions: The example of Biscarrosse beach, SW France. Geomorphology 332, 157–169. doi: 10.1016/j.geomorph.2019.02.009
Bird C. O., Bell P. S., Plater A. J. (2017). Application of marine radar to monitoring seasonal and event-based changes in intertidal morphology. Geomorphology 285, 1–15. doi: 10.1016/j.geomorph.2017.02.002
Bird C. O., Sinclair A. J., Bell P. S., Phillips M. (2019). Autonomous monitoring of nearshore geomorphology and hydrodynamics to assist decision making in coastal management, using shore-based radar systems: A case study on the Fylde peninsula, UK. Coastal Management 2019: Joining forces to shape our future coasts (ICE Publishing), 201–211. doi: 10.1680/cm.65147.201
Bruun P. (1962). Sea-level rise as a cause of shore erosion. J. Waterways Harbors Division 88 (1), 117–130. doi: 10.1061/jwheau.0000252
Burvingt O., Masselink G., Russell P., Scott T. (2017). Classification of beach response to extreme storms. Geomorphology 295, 722–737. doi: 10.1016/j.geomorph.2017.07.022
Callaghan D. P., Nielsen P., Short A., Ranasinghe R. (2008). Statistical simulation of wave climate and extreme beach erosion. Coast. Eng. 55 (5), 375–390. doi: 10.1016/j.coastaleng.2007.12.003
Chu L., Oloo F., Sudmanns M., Tiede D., Hölbling D., Blaschke T., et al. (2020). Monitoring long-term shoreline dynamics and human activities in the Hangzhou Bay, China, combining daytime and nighttime EO data. Big Earth Data 4 (3), 242–264. doi: 10.1080/20964471.2020.1740491
Corbridge A., Hawley D. (2020). Holding the line: a case study of the physical geography and coastal management of the Fylde coast. Teach. Geogr. 45 (2), 56–58.
Davidson M. A., Splinter K. D., Turner I. L. (2013). A simple equilibrium model for predicting shoreline change. Coast. Eng. 73, 191–202. doi: 10.1016/j.coastaleng.2012.11.002
De Alegria Arzaburu A. R., Ilic S., Gunawardena Y. (2007). “A study of intertidal bar dynamics using the argus video system,” in Coastal Sediments 07 - Proceedings of 6th International Symposium on Coastal Engineering and Science of Coastal Sediment Processes New Orleans, Louisiana. doi: 10.1061/40926(239)146
Dodet G., Castelle B., Masselink G., Scott T., Davidson M., Floc'h F., et al. (2019). Beach recovery from extreme storm activity during the 2013/14 winter along the Atlantic coast of Europe. Earth Surface Processes Landforms 44 (1), 393–401. doi: 10.1002/esp.4500.hal-01870762
Dunn S., Friedman R., Baish S. (2000). Coastal Erosion: Evaluating the Risk. Environment: Sci. Policy Sustain. Dev. 42 (7), 36–45. doi: 10.1080/00139150009605749
Galal E. M., Takewaka S. (2008). Longshore migration of shoreline mega-cusps observed with x-band radar. Coast. Eng. J. 50 (3), 247–276. doi: 10.1142/S0578563408001818
Garcia D. (2010). Robust smoothing of gridded data in one and higher dimensions with missing values. Comput. Stat. Data Anal. 54 (4), 1167–1178. doi: 10.1016/j.csda.2009.09.020
Harley M. D., Masselink G., Ruiz de Alegría-Arzaburu A., Valiente N. G., Scott T. (2022). Single extreme storm sequence can offset decades of shoreline retreat projected to result from sea-level rise. Commun. Earth Environ. 3 (1), 1–11. doi: 10.1038/s43247-022-00437-2
Hird S., Stokes C., Masselink G. (2021). Emergent coastal behaviour results in extreme dune erosion decoupled from hydrodynamic forcing. Mar. Geology 442 (September), 106667. doi: 10.1016/j.margeo.2021.106667
Holman R. A., Stanley J. (2007). The history and technical capabilities of Argus. Coast. Eng. 54 (6–7), 477–491. doi: 10.1016/j.coastaleng.2007.01.003
Kroon A., Masselink G. (2002). Morphodynamics of intertidal bar morphology on a macrotidal beach under low-energy wave conditions, North Lincolnshire, England. Mar. Geology 190, 591–608. doi: 10.1016/S0025-3227(02)00475-9
Kulp S. A., Strauss B. H. (2019). New elevation data triple estimates of global vulnerability to sea-level rise and coastal flooding. Nat. Commun. 10 (1), 1–12. doi: 10.1038/s41467-019-12808-z
List J. H., Farris A. S., Sullivan C. (2006). Reversing storm hotspots on sandy beaches: Spatial and temporal characteristics. Mar. Geology 226 (3–4), 261–279. doi: 10.1016/j.margeo.2005.10.003
Luijendijk A., Hagenaars G., Ranasinghe R., Baart F., Donchyts G., Aarninkhof S. (2018). The State of the Worlds Beaches. Sci. Rep. 8 (1), 1–11. doi: 10.1038/s41598-018-24630-6
Masselink G. (2004). Formation and evolution of multiple intertidal bars on macrotidal beaches: application of a morphodynamic model. Coastal Engineering, 51(8-9), 713–730.
Masselink G., Turner I. L. (1999). “The effect of tides on beach morphodynamics,” in Handbook of Beach and Shoreface Morphodynamics. Ed. Short A. D. (Chichester: Wiley), 204–229.
Masselink G., Kroon A., Davidson-Arnott R. G. D. (2006). Morphodynamics of intertidal bars in wave-dominated coastal settings - A review. Geomorphology 73 (1–2), 33–49. doi: 10.1016/j.geomorph.2005.06.007
Mentaschi L., Vousdoukas M. I., Pekel J. F., Voukouvalas E., Feyen L. (2018). Global long-term observations of coastal erosion and accretion. Sci. Rep. 8 (1), 1–11. doi: 10.1038/s41598-018-30904-w
Miles A., Ilic S., James M., Whyatt D. (2012). Morphological Variability of Cleveleys Beach, UK at Multiannual Timescales Based on Airborne LiDAR Data in Whyatt D, Rowlingson B (eds). Proceedings of the GIS Research UK 20th Annual Conference: Volume 1 - Presentations (Lancaster: Lancaster University) 1, 263–268.
Miles A., Ilic S., Whyatt D., James M. R. (2019). Characterising beach intertidal bar systems using multi annual LiDAR data. Earth Surface Processes Landforms 44 (8), 1572–1583. doi: 10.1002/esp.4594
Montreuil A. L., Moelans R., Houthuys R., Bogaert P., Chen M. (2020). Characterization of intertidal bar morphodynamics using a bi-annual lidar dataset. Remote Sens. 12 (22), 1–14. doi: 10.3390/rs12223841
ODea A., Brodie K. L., Hartzell P. (2019). Continuous coastal monitoring with an automated terrestrial lidar scanner. J. Mar. Sci. Eng. 7 (2). doi: 10.3390/jmse7020037
Peterson D. L., Brass J. A., Smith W. H., Langford G., Wegener S., Dunagan S., et al. (2003). Platform options of free-flying satellites, UAVs or the International Space Station for remote sensing assessment of the littoral zone. Int. J. Remote Sens. 24 (13), 2785–2804. doi: 10.1080/0143116031000066963
Plater A. J., Grenville J. (2010). “Liverpool Bay: Linking the eastern Irish Sea to the Sefton Coast,” in Seftons Dynamic Coast. Eds. Worsley A. T., Lymbery G., Holden V. J. C., Newton M. (Ainsdale-on-Sea, Southport: Coastal Defence: Sefton MBC Technical Services Department), 28–54.
Pollard J. A., Brooks S. M., Spencer T. (2019). Harmonising topographic & remotely sensed datasets, a reference dataset for shoreline and beach change analysis. Sci. Data 6 (1), p.42. doi: 10.1038/s41597-019-0044-3
Prime T., Brown J. M., Plater A. J. (2015). Physical and economic impacts of sea-level rise and low probability flooding events on coastal communities. PloS One 10 (2), 1–28. doi: 10.1371/journal.pone.0117030
Pucino N., Kennedy D. M., Carvalho R. C., Allan B., Ierodiaconou D. (2021). Citizen science for monitoring seasonal-scale beach erosion and behaviour with aerial drones. Sci. Rep. 11 (1), 1–17. doi: 10.1038/s41598-021-83477-6
Rajaratnam N., Nwachukwu B. A. (1983). Erosion near groyne-like structures. J. Hydraulic Res. 21 (4), 277–287. doi: 10.1080/00221688309499434
Roman-Rivera M. A., Ellis J. T. (2019). A synthetic review of remote sensing applications to detect nearshore bars. Mar. Geology 408 (April 2018), 144–153. doi: 10.1016/j.margeo.2018.12.003
Sagar S., Roberts D., Bala B., Lymburner L. (2017). Extracting the intertidal extent and topography of the Australian coastline from a 28 year time series of Landsat observations. Remote Sens. Environ. 195, 153–169. doi: 10.1016/j.rse.2017.04.009
Salameh E., Frappart F., Almar R., Baptista P., Heygster G., Lubac B., et al. (2019). Monitoring beach topography and nearshore bathymetry using spaceborne remote sensing: a review. Remote Sens. 11 (19), 2212. doi: 10.3390/rs11192212
Scott T., Masselink G., OHare T., Saulter A., Poate T., Russell P., et al. (2016). The extreme 2013/2014 winter storms: Beach recovery along the southwest coast of England. Mar. Geology 382, 224–241. doi: 10.1016/j.margeo.2016.10.011
Splinter K. D., Gonzalez M. V. G., Oltman-Shay J., Rutten J., Holman R. (2018). Observations and modelling of shoreline and multiple sandbar behaviour on a high-energy meso-tidal beach. Continental Shelf Res. 159 (March), 33–45. doi: 10.1016/j.csr.2018.03.010
Takewaka S. (2005). Measurements of shoreline positions and intertidal foreshore slopes with X-band marine radar system. Coast. Eng. J. 47 (2–3), 91–107. doi: 10.1142/S0578563405001203
Talavera L., Del Río L., Benavente J., Barbero L., López-Ramírez J. A. (2018). UAS as tools for rapid detection of storm-induced morphodynamic changes at Camposoto beach, SW Spain. Int. J. Remote Sens. 39 (15–16), 5550–5567. doi: 10.1080/01431161.2018.1471549
Turner I. L., Harley M. D., Almar R., Bergsma E. W. J. (2021). Satellite optical imagery in Coastal Engineering. Coast. Eng. 167, 103919. doi: 10.1016/j.coastaleng.2021.103919
Vos K., Harley M. D., Splinter K. D., Walker A., Turner I. L. (2020). Beach Slopes From Satellite-Derived Shorelines. Geophysical Res. Lett. 47 (14), e2020GL088365. doi: 10.1029/2020GL088365
Vousdoukas M. I., Ranasinghe R., Mentaschi L., Plomaritis T. A., Athanasiou P., Luijendijk A., et al. (2020). Sandy coastlines under threat of erosion. Nat. Climate Change 10 (3), 260–263. doi: 10.1038/s41558-020-0697-0
Keywords: beach characterization, radar, remote sensing, spatio - temporal analysis, beach variability, machine learning
Citation: Murphy J, Plater A, Bird C and Arribas-Bel D (2023) Spatial-temporal variability: characterisation of a beach system using high resolution radar data. Front. Mar. Sci. 10:1142077. doi: 10.3389/fmars.2023.1142077
Received: 11 January 2023; Accepted: 05 July 2023;
Published: 24 July 2023.
Edited by:
Iacopo Carnacina, Liverpool John Moores University, United KingdomReviewed by:
Merrick Haller, Oregon State University, United StatesConstantinos Matsoukis, University of Stirling, United Kingdom
Copyright © 2023 Murphy, Plater, Bird and Arribas-Bel. This is an open-access article distributed under the terms of the Creative Commons Attribution License (CC BY). The use, distribution or reproduction in other forums is permitted, provided the original author(s) and the copyright owner(s) are credited and that the original publication in this journal is cited, in accordance with accepted academic practice. No use, distribution or reproduction is permitted which does not comply with these terms.
*Correspondence: James Murphy, amFtZXMubXVycGh5QGxpdmVycG9vbC5hYy51aw==; Andy Plater, Z2cwN0BsaXZlcnBvb2wuYWMudWs=; Cai Bird, Y2FpYkBtYXJsYW4tdGVjaC5jby51aw==; Daniel Arribas-Bel, ZC5hcnJpYmFzLWJlbEBsaXZlcnBvb2wuYWMudWs=