 Daria A. Zelenina
 Alexey A. Sergeev
 Anna I. Kositsina2
- 1Department of Molecular Genetics, Russian Federal Institute of Fisheries and Oceanography, Moscow, Russia
- 2Laboratory of Molecular Genetics, Kamchatka Branch of Russian Federal Institute of Fisheries and Oceanography, Petropavlovsk-Kamchatsky, Russia
- 3Department of Ichthyology, Moscow State University, Moscow, Russia
In this work, we studied the intraspecific polymorphism of pink salmon, Oncorhynchus gorbuscha (Walbaum, 1792), the least genetically explored species among Pacific salmon and one of the central fisheries objects in the Russian Far East. The most urgent task facing Russian fishery science is to determine the proportion of fish from the main reproduction areas in mixed stocks and, based on these data, predict the number of pink salmon returning to these regions for spawning. Due to the unique feature of the species, which evolved into two allochronous lineages, these lineages have been explored independently in parallel. We designed and used here two sets of outlier SNP markers, and this allowed us to reliably distinguish the most northern (Western Kamchatka and the Magadan coast) and the most southern (Iturup Island) regional stocks as well as intermediate stocks from Sakhalin Island and the Mainland coast in both even and odd lineages of pink salmon. In addition, in odd-year lineage, we discovered pronounced genetic differences between early-run and late-run spawners in Sakhalin Island and the proximity of this early spawning form to the mainland stocks. The created baseline covers the main areas of pink salmon reproduction in the Sea of Okhotsk basin and underlies the regional identification of pink salmon in mixed marine stocks.
1 Introduction
Pink salmon (Oncorhynchus gorbuscha, Walbaum, 1792) belongs to the Pacific salmon and therefore has many features typical for the genus Oncorhynchus. These traits include semelparity, anadromy, and philopatry (or homing), and a pronounced population structure due to homing behavior is a characteristic of this group of fish.
The range of pink salmon covers the northern part of the Pacific Rim and its coasts. It spawns in rivers from the Korean Peninsula to the Lena River in the Asian part of its range and from California to the Mackenzie River in North America (Heard, 1991). Pink salmon has a strictly two-year life cycle, the shortest among Pacific salmon. Because of this phenomenon, the species consists of two reproductively separate lineages: one of them spawns in even years and the other in odd years. According to various estimates, the species was divided into two allochronous groups from 0,9-1,1 million (Brykov et al., 1996) to 23,6 thousand (Churikov and Gharrett, 2002) years ago. During the years of independent evolution of these two lineages, various processes took place within each of them, and as a result, they markedly differ in some morphological (Glubokovskii and Zhivotovskii, 1986; Beacham et al., 1988), ecological (Gritsenko, 1981) and karyological (Gorshkova and Gorshkov, 1983) traits. According to mitochondrial (Sato and Urawa, 2017; Podlesnykh et al., 2020; Zelenina et al., 2022), nuclear (Salmenkova et al., 2006; Beacham et al., 2012) and genomic data (Tarpey et al., 2018; Christensen et al., 2021), the most significant intraspecific differences in pink salmon exist between the lineages. The latter statement gives grounds to conduct genetic assessments for each of them independently.
Studies of the population genetic structure of pink salmon began in the 1970s, and for a long time, they were based mainly on allozyme analysis (Aspinwall, 1974; Beacham et al., 1985; Hawkins et al., 2002). However, the development of molecular genetic techniques in recent decades brought them to a new level.
The studies were carried out using a wide range of DNA markers: various mtDNA fragments, microsatellites, genes of the major histocompatibility complex (Gordeeva, 2012), and mainly covered only limited areas of the species range. Thus, it was shown that the population structure of pink salmon is much weaker compared to other Pacific salmons, which is most likely due to the lowest level of homing in this species. A notable breakthrough in understanding the population structure of pink salmon and the pathways of the distribution of the species throughout its contemporary range has been achieved using next-generation sequencing approaches. First RAD sequencing of six North American pink salmon populations (three from each lineage) was performed in 2014 (Seeb et al., 2014), and three years later, eight Asian populations (four even and four odd) were added to this research (Tarpey et al., 2018). As a result, the second level of intra-species differences in hierarchical significance was revealed. Within each lineage, the populations were clustered by their origin, making it possible to trace phylogeographic patterns within the species. In each lineage, one of the groups was formed by populations originating from the Cascadian Pleistocene glacial refugium, while the second consisted of populations of Beringian origin (Figure 1).
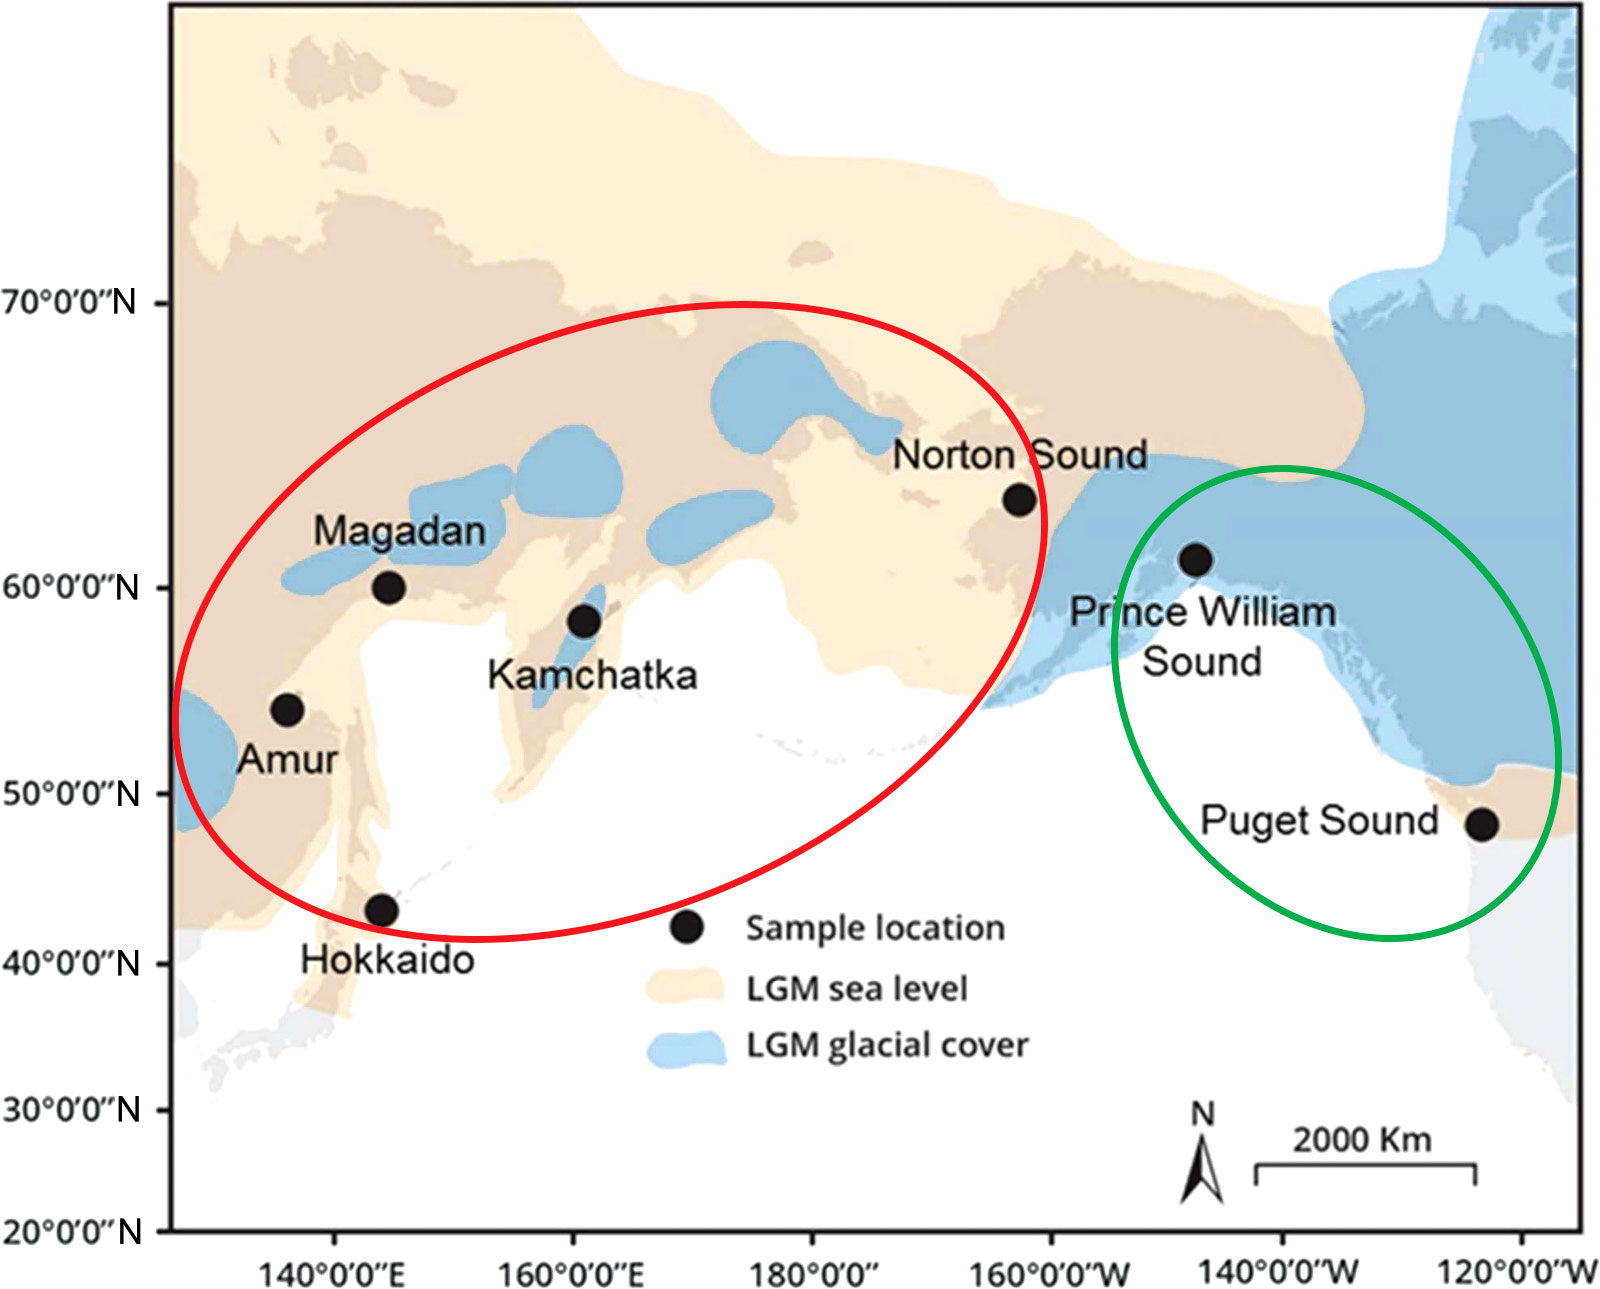
Figure 1 Map of the sampling localities from Tarpey et al. (2018). The description of the map is given in accordance with the paper mentioned above: “Map of the present-day coastline (grey) overlaid with the exposed land during lowered sea levels (120 to 130 m lower than present, orange) and glacial cover (blue) during the Last Glacial Maximum (LGM), approximately 18–26 thousand years ago”. Populations originating from the Beringian Refugium are marked with a red oval, while those from the Cascadian Refugium – are with a green oval.
As for this species’ more detailed population organization, a generally accepted understanding of this issue is still required. Studies based on the mitochondrial and microsatellite polymorphism analysis in Asian pink salmon did not allow for reliable discrimination of populations and regional complexes. From this point of view, great hope is placed on genomic research, making it possible to obtain many SNP markers. Of course, the putatively adaptive markers used in this study cannot be considered an ideal unbiased tool in population studies. However, they will make it possible to trace some of the patterns that determine the population structure of pink salmon.
Pink salmon is the most abundant species of the genus Oncorhynchus (according to Ruggerone and Irvine (2018), 67% of total pacific salmon abundance and 48% of total biomass) and a key object of fishery in the Russian Far East. However, despite a rich history of research, this species is the most mysterious among all Pacific salmon and, from a practical point of view, the most difficult when you want to forecast the amount of fish returning for spawning to a particular area. Thus, one of the main challenges for Russian fishery science is correctly assessing the number of pink salmons migrating to a definite region.
Of course, geneticists cannot predict the total number of returning fish: the overall forecast is based mainly on traditional ichthyological approaches. Our task is to calculate the proportion of salmon from the main reproduction areas in the total population. From this point of view, the most problematic area in the Russian Far East is the Sea of Okhotsk basin. At the end of the marine feeding period, pink salmon migrate for spawning to one of five reproduction regions: 1) West Kamchatka, 2) the Magadan area, 3) the Mainland Coast and the Amur River, 4) the Sakhalin Island and 5) the South Kuriles Islands. The success of the pink salmon fishing season in these areas depends on the accuracy of forecasts: when fishermen know the estimated number of fish coming to spawn in a particular area, they can prepare vessels and fishing gear in advance. The genetic surveys are based on the mixed stocks analysis. Therefore, to successfully solve this problem, we need a reliable genetic baseline covering all the main stocks in the target region.
The main practical goal of our research was to develop the basis for a genetic tool that would allow us to reliably identify pink salmon stocks in the Sea of Okhotsk basin, at least at the regional level. In this study, we designed two panels of SNP markers, one for an even-year lineage and one for an odd-year lineage, and assessed their ability to differentiate regional stocks. In addition, we expect to contribute to understanding the species’ population structure and the processes that formed it.
2 Materials and methods
2.1 Study sites, sample collection and DNA extraction
The material for this work was selected in accordance with the purpose of the study and covers all the main regions of pink salmon reproduction in the Sea of Okhotsk basin: West Coast of Kamchatka Peninsula (hereinafter referred to as Western Kamchatka), the Sea of Okhotsk mainland coast above 59°N (Magadan Coast), the Sea of Okhotsk mainland coast below 59°N (Mainland Coast), Sakhalin Island (Sakhalin) and Iturup Island (South Kuriles) (Figure 2). In all figures, each region is marked with a certain color: Western Kamchatka (1) – green, Magadan coast (2) – blue, Mainland coast (3) – pink, Sakhalin (4) – yellow, South Kuriles (5) – red. All samples were taken in rivers from adult fish during the spawning run in July-September 2009-2020 (Table 1). Most of samples were collected by staff of Russian Federal Institute of Fisheries and Oceanography and specimen from the River Langery – by E.A. Kirillova (A.N. Severtsov Institute of Ecology and Evolution of the Russian Academy of Sciences).
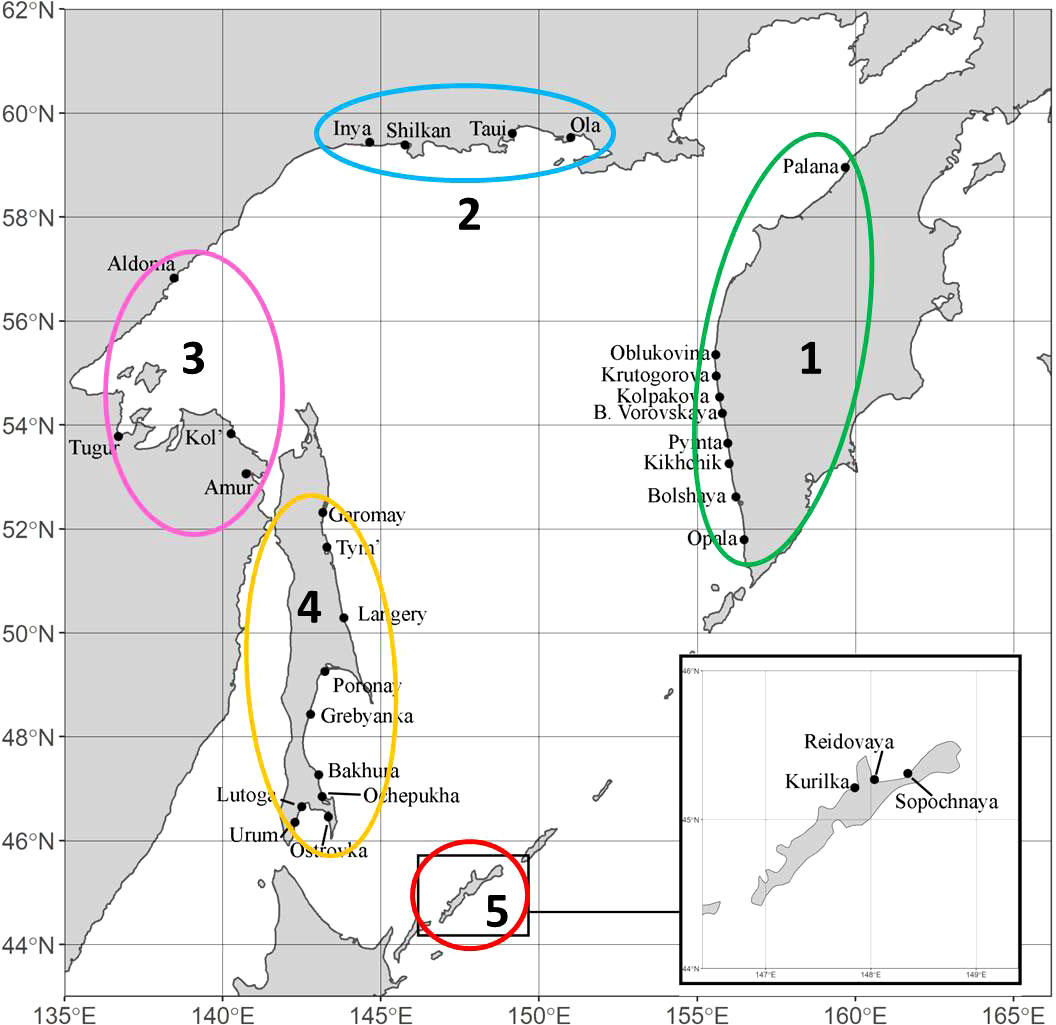
Figure 2 Sampling locations of Oncorhynchus gorbuscha in the basin of the Sea of Okhotsk. Sampling details for both lineages are given in Table 1.
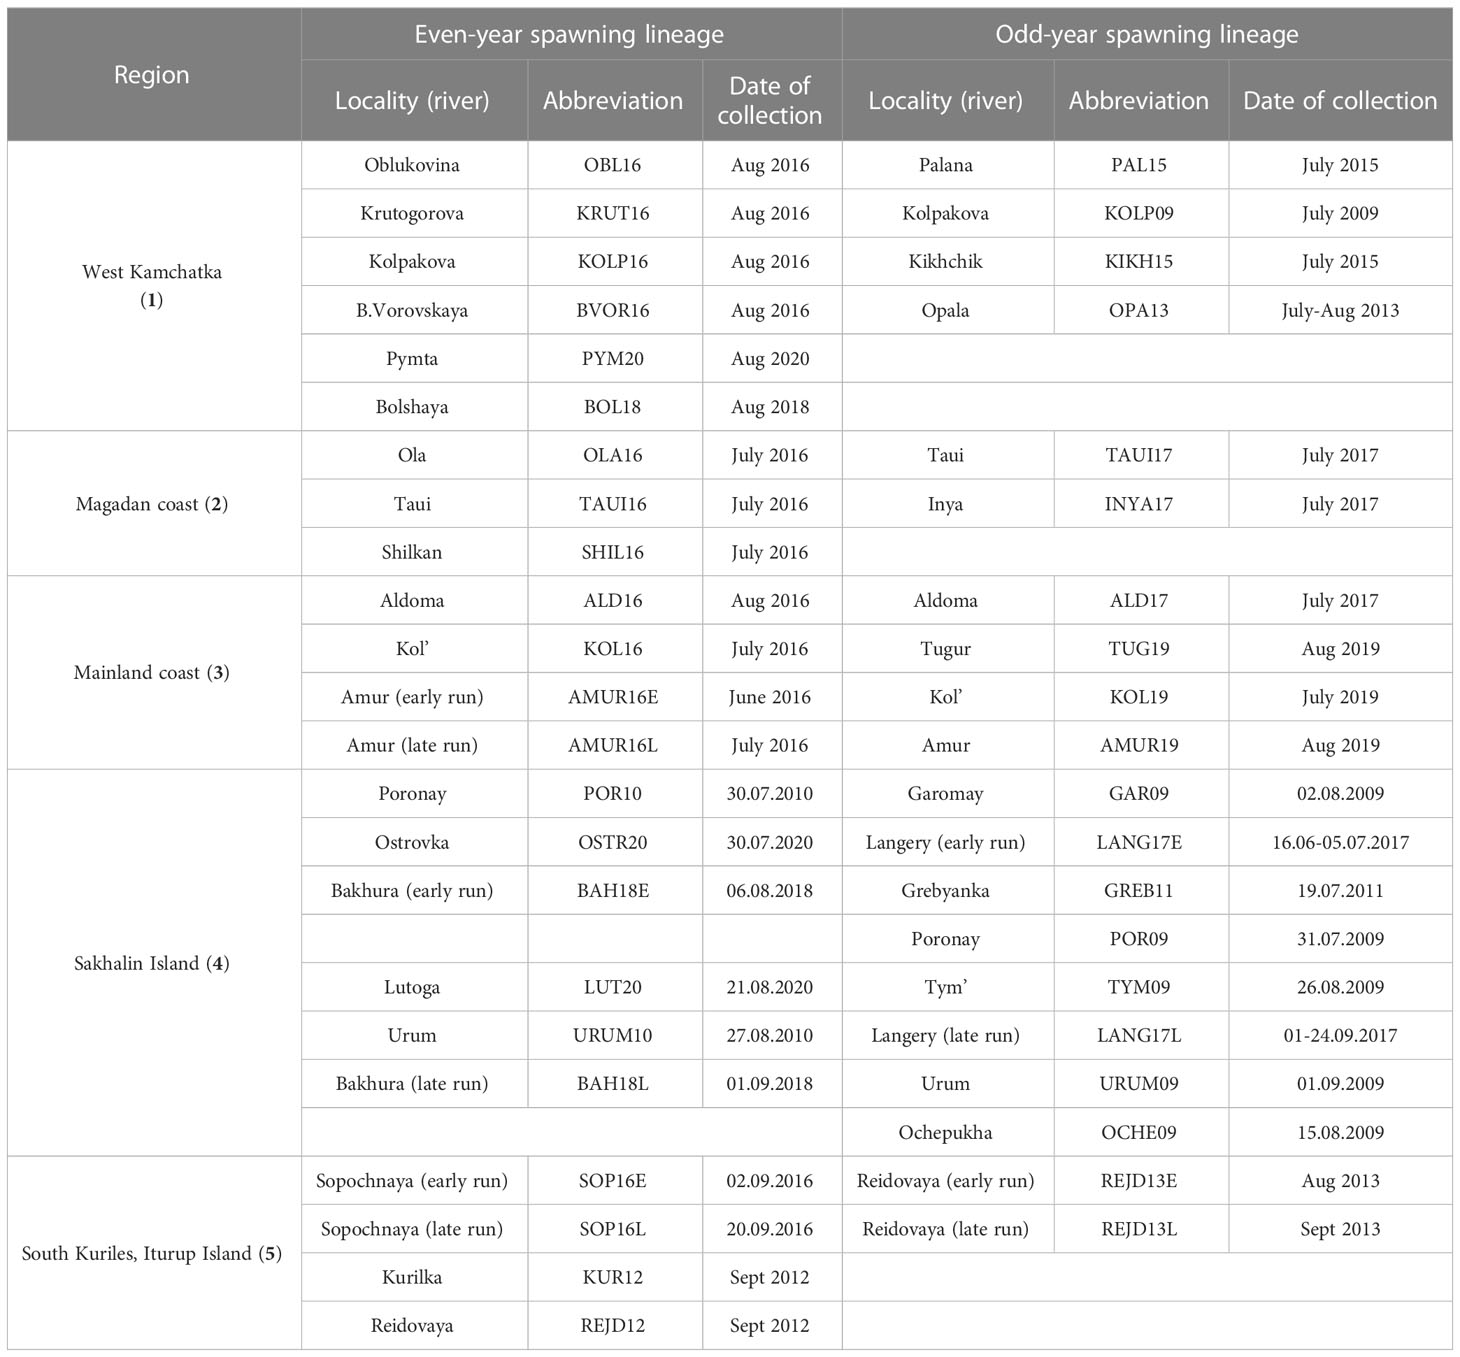
Table 1 Sampling information. Regardless of the initial sample size, 47 fish from each locality/year were analyzed.
Numbers of regions are given in accordance with Figure 2. Samples from Sakhalin Island are listed according to the date they were taken, starting with the earliest.
Pectoral fin tissues were preserved in 96% ethanol and stored at -20°C until DNA isolation. All samples were deposited in the Collection of Genetic Materials of the Russian Federal Institute of Fisheries and Oceanography. Isolation and purification of total DNA was carried out by adsorption on AcroPrep™ 96 filter plate, 1 mL–1.0 μm, glass fiber media microcolumns (PALL, United States), as described earlier (Ivanova et al., 2006). We genotyped 47 fish from each population; thus, the total amount of the analyzed material consisted of 940 fish from the even-year spawning lineage and 1081 – from the odd-year spawning lineage.
2.2 SNP markers: search and development
The search for markers suitable for solving the tasks was based on genomic studies of pink salmon (Tarpey et al., 2018). The DNA sequences for the primer design, 50 for the even lineage pink salmon and 50 – for the odd lineage, were kindly provided by Dr. James Seeb, University of Washington. They contained SNPs, Fst-outliers, that supported the strongest differentiation among several populations of pink salmon, presumably originating from the Beringian refugium: one American, three Russian, and one Japanese (Figure 1).
We used Kompetitive Allele Specific PCR (KASP) for genotyping (He et al., 2014). The PCR primers were designed and synthesized by LGC Genomics, UK, and due to specific requirements for the provided DNA sequences, only half of them were suitable for primer design. Thus, at the validation stage, we had 26 loci for the even lineage and 24 for the odd one. Based on the results of preliminary testing, two panels of SNP markers were compiled, consisting of 8 loci for the “even” pink salmon and of 11 for the “odd” pink salmon. The names of the loci and the sequences of DNA-fragments, used for primer design, are available in the Supplementary Table 1.
2.3 SNP genotyping
The analysis was performed using KASP™ chemistry (LGC Genomics, UK), according to the manufacturer’s standard protocol. The concentration of DNA samples was determined using Qubit 3.0 Fluorometer (Thermo Fisher Scientific, MA, USA), and then the samples were diluted to a concentration of approximately 50 ng/µL. KASP assay was carried out on The LightCycler® 480 Real-Time PCR System (Roche, USA) in 96-well plates in 10 µL reaction volume consisted of 5 μL KASP master mix, 0.14 μL KASP primer mix (both components were provided by LGC Genomics), 1 μL of DNA sample at approximate concentration 50 ng/μL and 4 μL of Milli-Q water. The cycling conditions were the following: initial stage at 94°C for 15 min, then 10 touchdown cycles at 94°C for 20 s, 61°C (decreasing by 0.6°C per cycle) for 60 s, and then 35 cycles of standard PCR at 94°C for 20 s, 55°C for 60 s.
2.4 Data analysis
2.4.1 Genetic diversity
To assess the discriminatory power of SNP loci the polymorphism information content (PIC) and average non-exclusion probability for identity of two unrelated individuals (NE-I) were estimated using CERVUS 3.0.7 (Kalinowski et al., 2007). For each locus average observed (Mean HO) and expected (Mean HE) heterozygosity across populations, as well as F-statistics parameters (FIS, FIT and FST) were calculated in GenAlEx 6 (Peakall and Smouse, 2006).
Genetic SNP diversity in populations was assessed in GenAlEx 6 by calculating several genetic parameters, namely the number of alleles (N), observed heterozygosity (HO), expected heterozygosity (HE) and inbreeding coefficient (FIS).
2.4.2 Genetic structure and differentiation
To study the genetic structure, two statistical approaches were used: the clustering method implemented in STRUCTURE 2.3.4. (Pritchard et al., 2000) and principal coordinate analysis based on pairwise FST estimates performed in GenAlEx 6. The individual Bayesian population assignment test in STRUCTURE was performed with a model of admixed ancestry among populations, correlated allele frequencies and prior population information. We tested from 1 to 6 putative numbers of populations (K) with 10 iterations for each K value using 500,000 burn-in steps followed by 1,000,000 Markov Chain Monte Carlo (MCMC) generations. The number of genetic clusters was determined in StructureSelector (Li and Liu, 2018) based on the Evanno method (Evanno et al., 2005) and the Puechmaille method (Puechmaille, 2016). Calculation of pairwise FST estimates (Weir and Cockerham, 1984) and principal coordinates analysis (PCoA) based on their values were performed in GenAlEx 6.
To further assess genetic subdivision, a hierarchical analysis of molecular variance (AMOVA) was performed in Arlequin ver. 3.5 (Excoffier and Lischer, 2010). For the even-year lineage, the regional clustering was unambiguous, and the AMOVA analysis aimed to confirm its validity. Thus, we formed putative population groups according to PCoA clusters corresponding to geographical regions. For “odd” pink salmon, the situation was not clear: the genetic clusters partly did not conform to regional ones. So we tried three analysis variants and tested i) three population groups conclusively with STRUCTURE results, ii) four groups based on geographical origin, and iii) four groups according to PCoA results. We assumed the model with the smallest intragroup differences to be the most feasible.
3 Results
3.1 Genetic diversity within loci and populations
The summary of genetic diversity for 8 “even-year” and 11 “odd-year” loci is given in the Table 2. For “even-year” loci observed heterozygosity ranged from 0.131 to 0.423 (mean: 0.224) and expected – from 0.123 to 0.403 (mean: 0.22); for “odd-year” loci HO ranged from 0.102 to 0.455 (mean: 0.221) and HE – from 0.111 to 0.445 (mean: 0.227). The polymorphism information content (PIC) varied from 0.123 to 0.342, with an average of 0.215, for “even-year” markers, and from 0.111 to 0.357, with an average of 0.21, for “odd-year” markers. The average non-exclusion probability (NE-I) for identity of two unrelated individuals in each locus was rather high, however the combined probability values across all loci (marked by asterisk) was satisfactory for even (0.02) and odd (0.004) lineages.
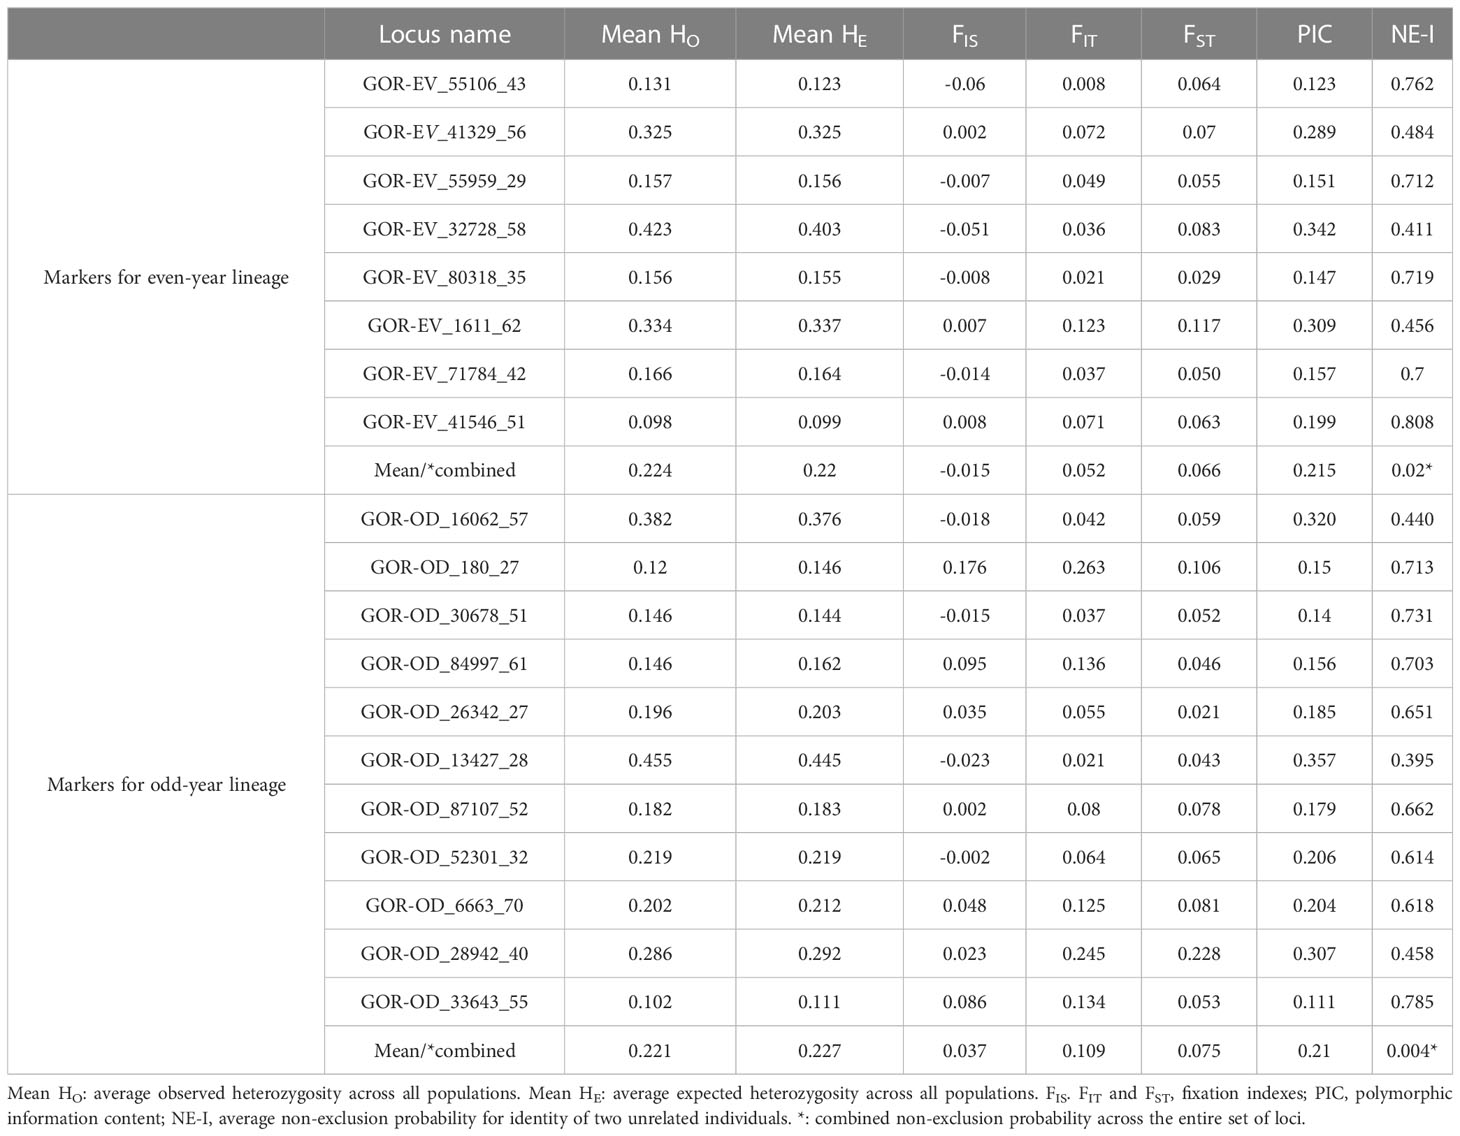
Table 2 Summary statistics (mean across populations) of SNP loci used to differentiate pink salmon populations in the Sea of Okhotsk basin.
Full genetic diversity statistics by locus and population are detailed in the Supplementary Table 2.
3.2 Genetic structure and differentiation
3.2.1 Even-year spawning pink salmon
Figure 3A demonstrates the STRUCTURE analysis results of 23 populations from different regions of the Sea of Okhotsk. The proportions of individuals’ ancestry to the genetic cluster were determined at K values from 2 to 5, and it needed to be made clear which of the values was optional. However, we observed some differences among geographical regions, with the strongest between the combined Northern region (I), which included the Magadan coast and Western Kamchatka, and South Kuriles (IV). To clarify the most appropriate number of clusters, we applied two approaches: according to the Evanno method (Figure 3B), K appeared to be 2, whereas the Puechmaille method (Figure 3C) supported the existence of 4 clusters.
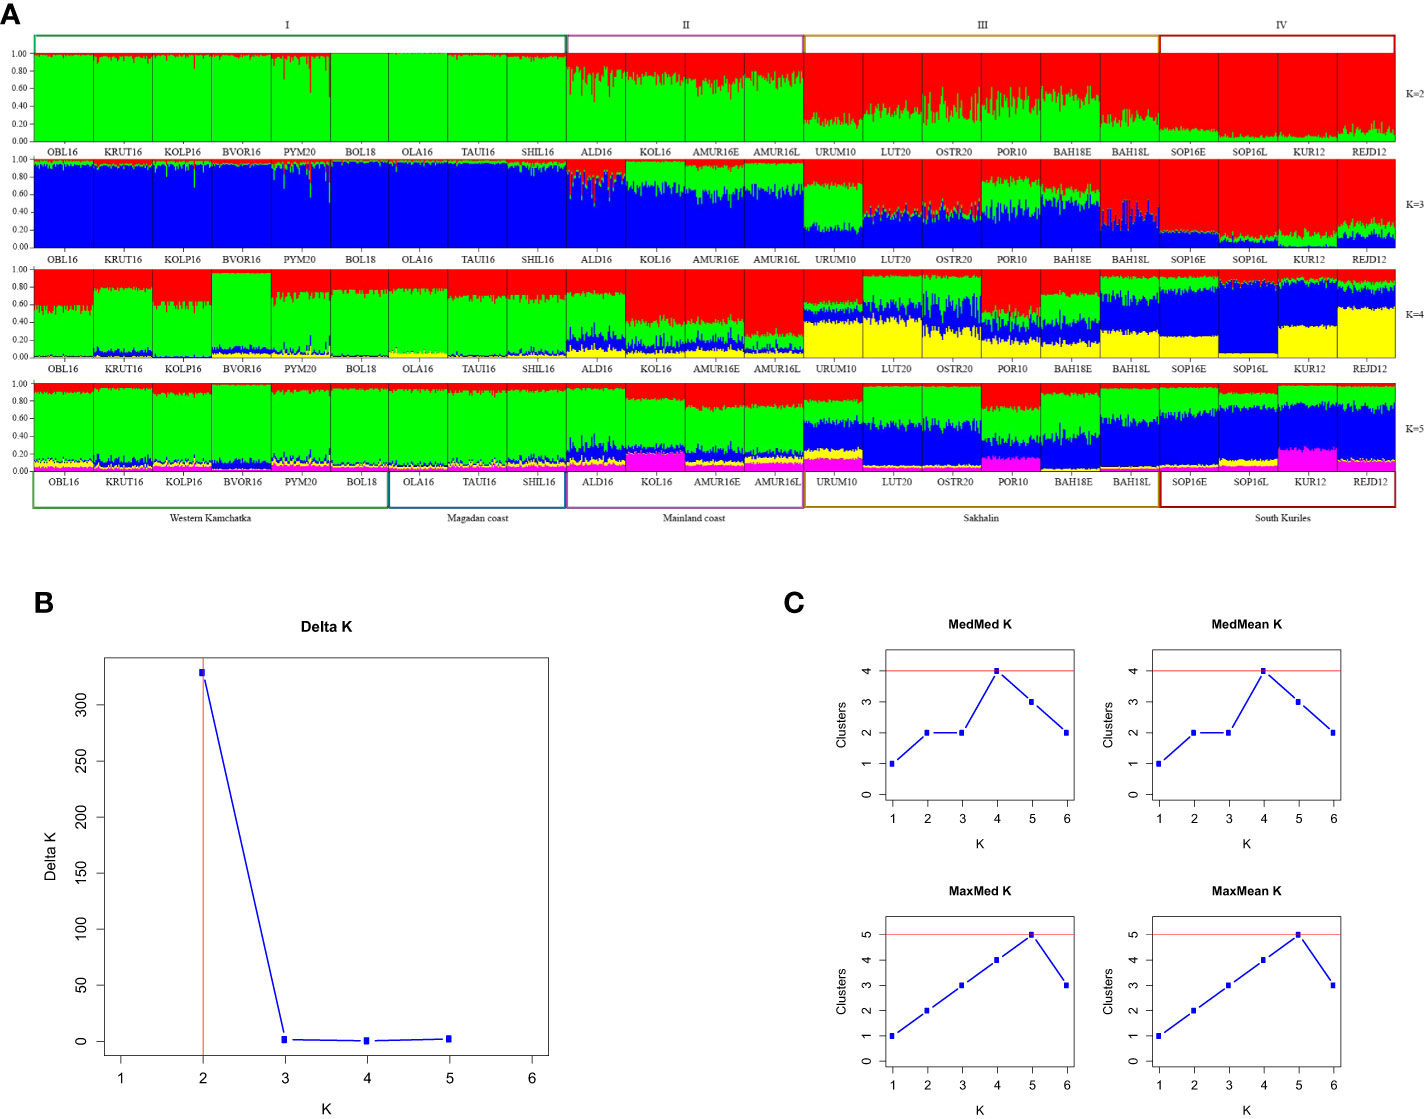
Figure 3 (A) Barplots reflecting the proportion of individual ancestry at K=2, 3, 4, 5 in the even-years lineage. K values are on the right. Sample designations are given in accordance with Table 1. Five regional groups are shown below the plots, and four putative clusters – above them. (B, C) Estimations of number of genetically distant groups within even-spawning lineage of pink salmon, based on ΔK according to (Evanno et al., 2005) (B) and on Puechmaille statistics (Puechmaille, 2016) (C).
Principal coordinate analysis (PCoA) based on Fst genetic distances identified four population clusters formed on a regional principle (Figure 4A). This segregation was provided by the first axis, which accounted for nearly 80% of the molecular dispersion. The most distant were the Northern cluster (I), consisting of populations from Western Kamchatka and the Magadan coast, and the South Kuril cluster (IV), which included samples from Iturup Island. The Sakhalin cluster (III) and the cluster of the mainland coast of the Sea of Okhotsk (II) occupied intermediate positions.
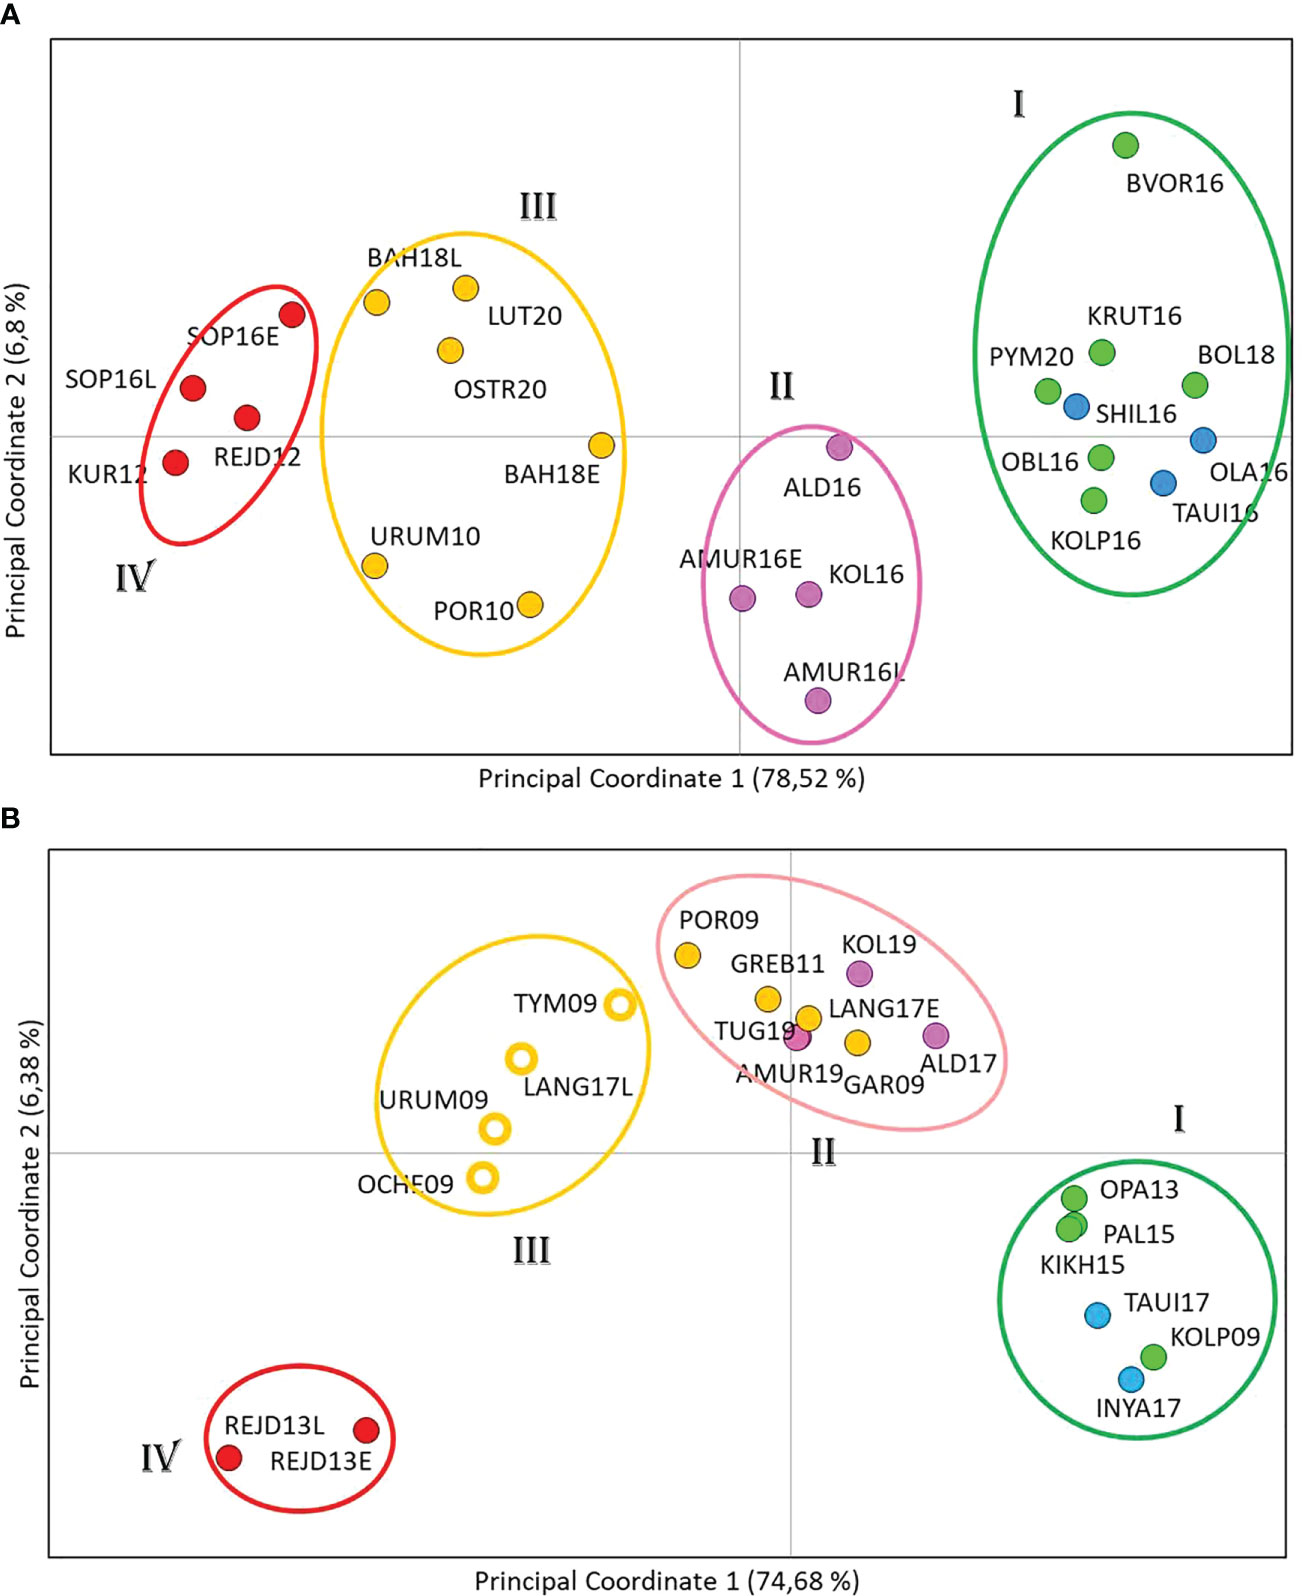
Figure 4 Principal coordinate analysis using the covariance matrix of pairwise Fst projected in a two-dimensional space for even- (A) and odd-spawning (B) lineages of pink salmon. Samples from different regions are marked with different colors.
The results of both types of analysis were generally in concordance. Therefore we considered it possible to divide the entire set of even-year spawning pink salmon populations into four groups: Northern (includes populations from West Kamchatka and Magadan area), Mainland, Sakhalin, and South Kuril (Figure 4A). The AMOVA discovered that strongly significant differences explained the majority of variations (8.46%) among these groups, and the interpopulation variability within the groups was almost 20 times less (0.45%) (Table 3); thus, our hypothesis was supported.
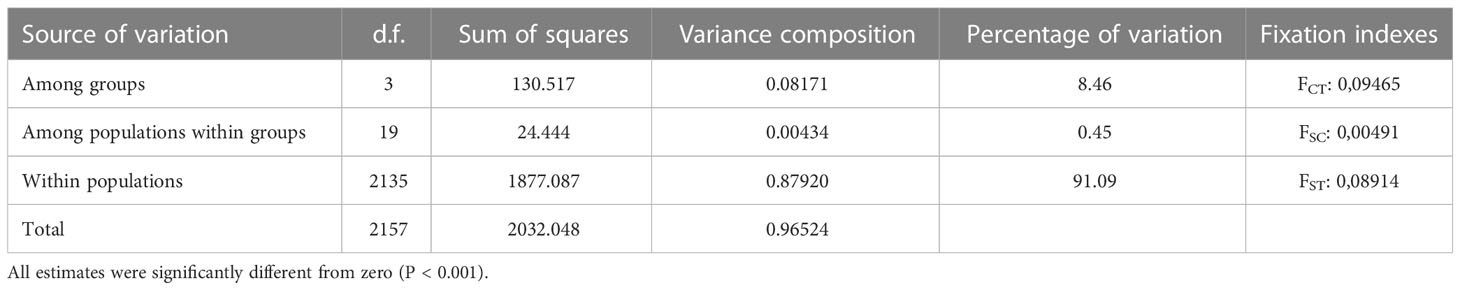
Table 3 The results of AMOVA for even-years spawning pink salmon.
3.2.2 Odd-year spawning pink salmon
The STRUCTURE analysis of 20 odd-year populations (Figure 5A) revealed a pronounced clinal variability at K=2. As in the other lineage, all individuals from Western Kamchatka and the Magadan coast can be unambiguously assigned to one of the genetic clusters (group I), while the South Kuril pink salmon – to the opposite one (group IV). In contrast to the lineage of even years, there was no clear division into regions between the intermediate samples. Analysis performed at bigger K-values allowed us to find more noticeable visual differences. The optional K was 2 when we implemented the Evanno method (Figure 5B), and the Puechmaille approach (Figure 5C) found that the largest number of clusters (3) was at K=4 and 5.
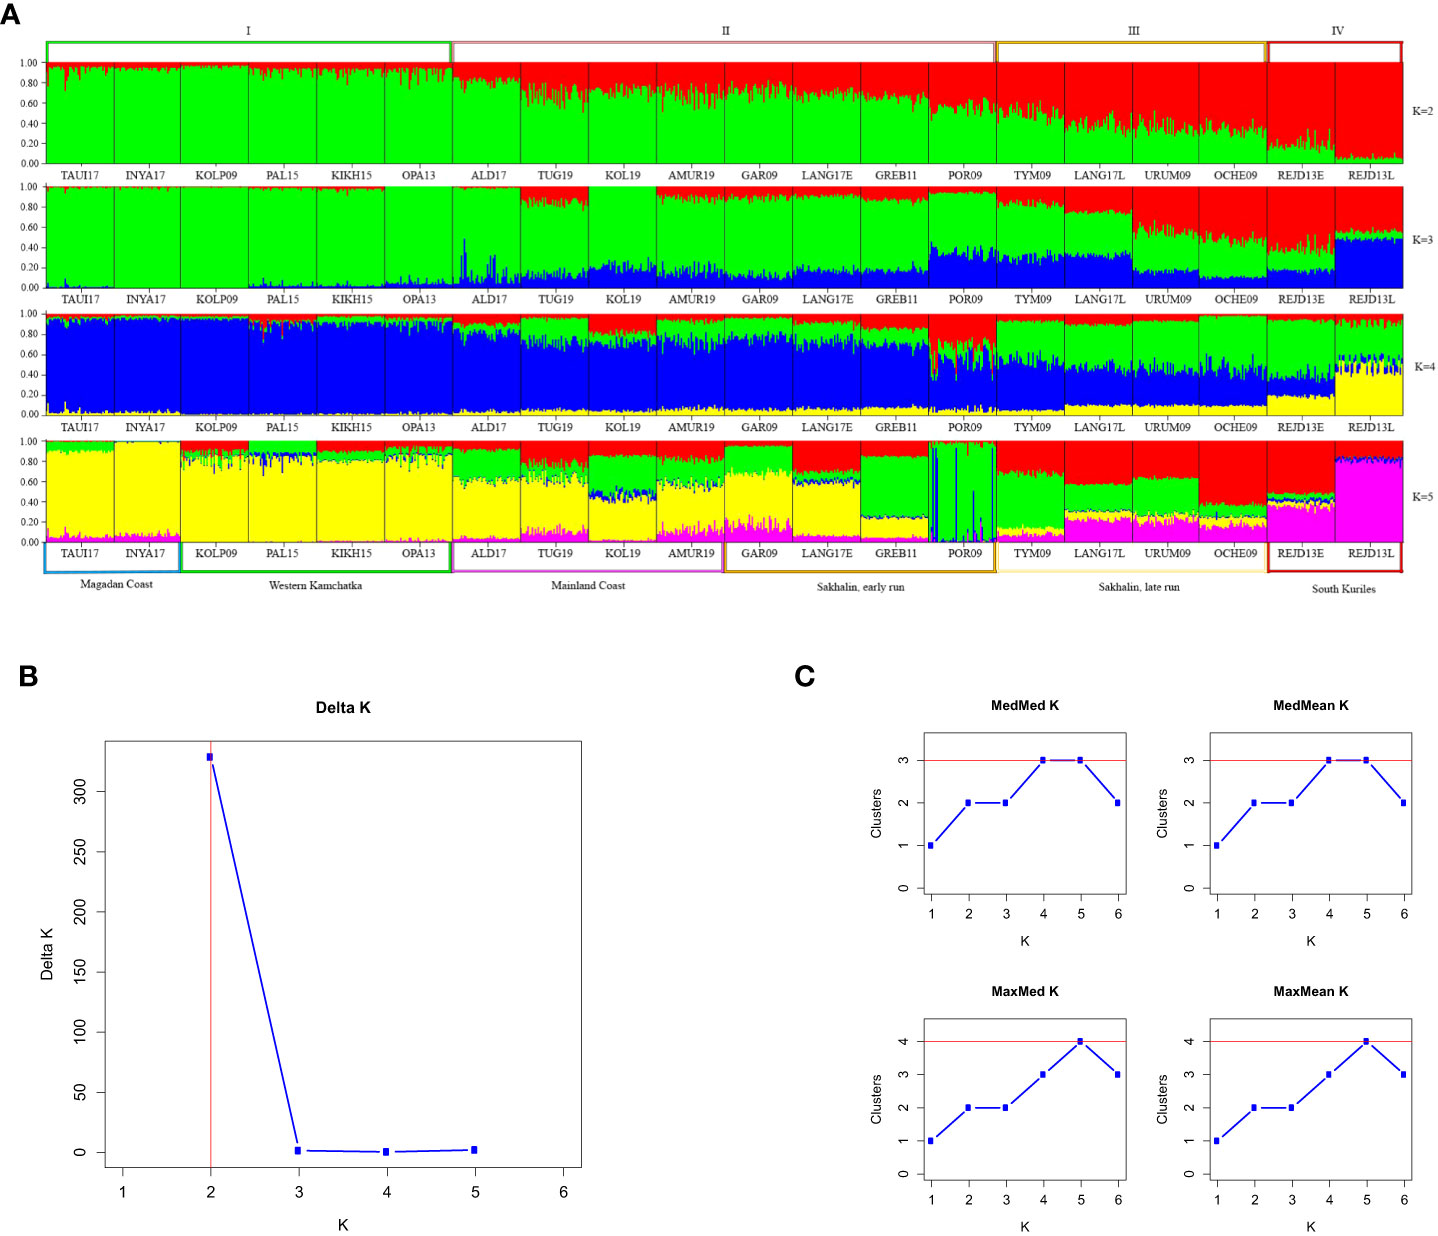
Figure 5 (A) Barplots reflecting the proportion of individual ancestry at K=2, 3, 4, 5 in the odd-years lineage. K values are on the right. Sample designations are given in accordance with Table 1. Five regional groups are shown below the plots, and four putative clusters – above them. (B, C) Estimations of number of genetically distant groups within odd-spawning lineage of pink salmon, based on ΔK according to (Evanno et al., 2005) (B) and on Puechmaille statistics (Puechmaille, 2016) (C).
However, PCoA results of odd-year spawning lineage (Figure 4B) revealed the existence of four clusters, and like in the even-year lineage Northern (I) and South Kuril clusters (IV) occupied the opposite sides of the PCoA plot. As for the two central clusters, the basis of their formation turned out to be different. All populations from the mainland coast formed a single cluster, with half of the samples from Sakhalin (II), while the other half of the Sakhalin samples formed a separate group (III). We have established a specific pattern that determines the location of each of the Sakhalin populations in a particular cluster, which is related to the timing of spawning. As seen from Table 1, all individuals sharing cluster II with pink salmon from the mainland coast came to spawn by the beginning of August and, therefore, can be considered early spawners. At the same time, pink salmon populations of late spawning dates form their separate cluster (III).
When conducting a hierarchical analysis for odd-year lineage (Table 4), we considered three models of population clustering: 1) three groups, that except Northern and Kuril clusters included one intermediate group (according to STRUCTURE results); 2) four groups formed on the regional principle; 3) four clusters in conformity with PCoA results. Near-zero P-values confirmed the significance of all AMOVA results. For each model, the major impact on the overall variability was provided by the differences among the groups and varied from 7.75% to 9.05%. We compared interpopulation variability within groups to determine the most likely clustering model. We found out that the lowest meaning (0.72%) was determined for the third model, suggesting the division of Sakhalin pink salmon into two groups depending on the timing of spawning.
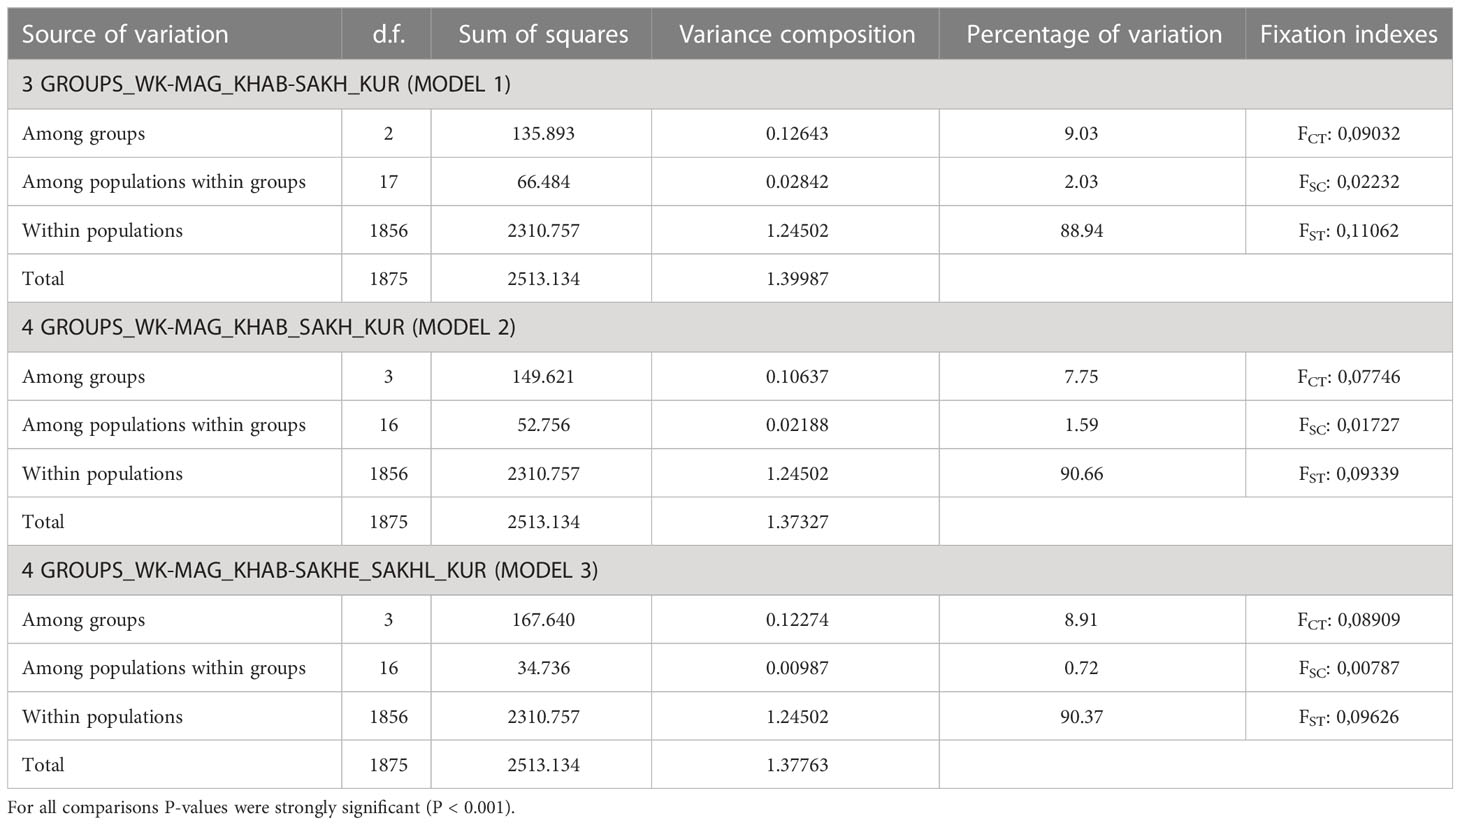
Table 4 The AMOVA analysis of odd-years spawning pink salmon based on 11 SNP-loci.
We consider both SNP panels to be suitable for discrimination purposes. The genetic characteristics of populations were sufficient for forming stable regional clusters, both based on Bayesian estimates and the results of the analysis of principal coordinates. AMOVA outputs confirmed these assumptions.
4 Discussion
Pacific salmon is an abundant, commercially valuable group of anadromous fish inhabiting the Pacific Ocean’s northern part. The conservation of these species is ensured by the North Pacific Anadromous Fish Commission (NPAFC), the international inter-governmental organization that includes five member countries: Canada, Japan, the Republic of Korea, the Russian Federation, and the United States of America. According to the NPAFC anadromous fish Conservation Measures, the fishery of Pacific salmon is prohibited in the high seas. Almost all Pacific salmon originate in the waters of NPAFC member countries, and these countries are responsible for the harvest and conservation of their anadromous stocks. The Pacific salmon fishery occurs mainly in coastal areas or on the routes of spawning migrations within the 200-mile zones (exclusive economic zones) of the coastal states.
In many cases, delineating salmon stocks within a particular area is essential, as this allows for solving different tasks concerning their management and conservation, and fisheries genetics is responsible for answering such vital questions. For Russian salmon fisheries, one of the most urgent problems is the discrimination of pink salmon stocks in the basin of the Sea of Okhotsk. Many attempts were made to solve this problem using different kinds of standard ichthyological approaches, but their resolutions needed to be revised.
This paper presents a powerful tool that distinguishes the main regional pink salmon stocks in the Sea of Okhotsk basin. Our approach is based on advances in high-throughput sequencing: the results of the RAD-sequencing project (Tarpey et al., 2018) provided an opportunity to develop our panels of SNP markers.
Today, SNP loci are essential in fish and fisheries genetics as a convenient tool for population identification and individual assignment. Over the past two decades, the use of SNPs for fisheries management purposes has steadily increased. They first became popular because of their biallelic nature and hence the categorical information obtained (presence or absence of alleles) and reproducibility, regardless of the method of analysis (Sobrino et al., 2005; Zelenina et al., 2005). Then it became clear that the rapid development of genomic techniques promotes the further expansion of the application of SNP markers in fisheries and aquaculture (Zelenina et al., 2011).
Over the past decade, SNP markers have been widely used in mixed stock analysis and management of several species of Pacific salmon: chinook salmon (Larson et al., 2014; Beacham et al., 2022), sockeye salmon (Ackerman et al., 2011; Dann et al., 2013), coho salmon (Beacham et al., 2020; Deeg et al., 2022) and chum salmon (Kitada and Kishino, 2021; McKinney et al., 2022). However, there needed to be more information about the most abundant species of this genus, pink salmon.
Unlike most known Pacific salmon panels, our sets for genetic discrimination of pink salmon stocks consist of only a few SNP markers: 8 for lineage spawning in even years and 11 – for that from odd years. Such a small number of loci make these tools suitable for use close to fishing areas, in fisheries institutions in the Russian Far East, and the only equipment required is a real-time PCR machine.
Comparing the results obtained for both lineages, we stated that we managed to better solve the problem for the “even” pink salmon problem. All samples are reliably distributed over four genetic clusters corresponding to four main regions. However, the situation in the odd-year lineage is not so definite: samples from one of the main fishing areas, Sakhalin Island, were divided into two groups and distributed between two clusters, probably according to the timing of their spawning run.
We consider this phenomenon not to be accidental, and the insufficient discriminatory ability of our set of genetic markers cannot explain it. Instead, the most reasonable explanation lies in the evolutionary histories of the early and late spawning pink salmon on Sakhalin Island. In addition, data on different migration routes of these forms during their return to spawning after oceanic feeding support our assumptions (N. V. Kolpakov, E. A. Shevlyakov, V. D. Nikitin – personal communication).
Considering that the primary goal of the pink salmon forecast is to correctly predict the ratio of northern (West Kamchatka plus the Magadan coast), southern (Sakhalin plus the Mainland coast), and South Kuriles stocks, we conclude that we have reached it. Last year our “even” panel was for the first time tested by mixed stock analysis of the young-of-the-year pink salmon in the Sea of Okhotsk and verified during the fishing season, and the prediction for the northern stocks corresponded to the result (Kositsyna et al., 2022).
It should be noted that our markers were developed based on a comparison of only a few pink salmon populations, and we believe that an additional genomic study (ddRAD) of numerous samples from the rivers of the Sea of Okhotsk basin will allow us to create new sets of SNP markers with better discrimination ability.
Data availability statement
The original contributions presented in the study are included in the article/Supplementary Material, further inquiries can be directed to the corresponding author.
Ethics statement
Ethical review and approval of the animal study were not required, as the pink salmon individuals for this study were sampled partly in the course of ichthyologic scientific surveys, partly during commercial fishing. In the first case, genetic samples (fin clips) were taken without harm to live fish; in case of commercial catches, tissues of already dead animals were used.
Author contributions
DZ wrote the manuscript draft, generated the study’s main idea, designed the experiments and analyzed the data. AS, AK and VS performed the experiments. DZ and VS prepared figures and tables. NS managed the project and organized sampling work in the field.
Funding
This research was supported by a grant from the Ministry of Science and Higher Education of the Russian Federation (agreement No. 075-15-2021-1084) and by funding of State scientific task for the Russian Federal Institute of Fisheries and Oceanography No. 076-00007-22-01. The publication fee was covered by OOO “MAXIM MEDICAL”, Arkhangelskoe, Russian Federation.
Acknowledgments
We thank researchers from the Russian Federal Institute of Fisheries and Oceanography and its Kamchatka, Magadan, Sakhalin and Khabarovsk branches, who collected genetic samples. The authors are grateful to Dr. Nikolai Mugue for editing the manuscript.
Conflict of interest
The authors declare that the research was conducted in the absence of any commercial or financial relationships that could be construed as a potential conflict of interest.
Publisher’s note
All claims expressed in this article are solely those of the authors and do not necessarily represent those of their affiliated organizations, or those of the publisher, the editors and the reviewers. Any product that may be evaluated in this article, or claim that may be made by its manufacturer, is not guaranteed or endorsed by the publisher.
Supplementary material
The Supplementary Material for this article can be found online at: https://www.frontiersin.org/articles/10.3389/fmars.2023.1140538/full#supplementary-material
References
Ackerman M. V., Habicht C., Seeb L. W. (2011). Single-nucleotide polymorphisms (SNPs) under diversifying selection provide increased accuracy and precision in mixed-stock analyses of sockeye salmon from the copper river, Alaska. Trans. Am. Fish. Soc. 140, 865–881. doi: 10.1080/00028487.2011.588137
Aspinwall N. (1974). Genetic analysis of north American populations of pink salmon, Oncorhynchus gorbuscha, possible evidence for the neutral mutation–random drift hypothesis. Evolution 28, 295—305. doi: 10.1111/j.1558-5646.1974.tb00749.x
Beacham T. D., Jonsen K., Sutherland B. J. G., Ramshaw B., Rondeau E. B. (2022). Parentage-based tagging and genetic stock identification applied to assessment of mixed-stock fisheries and hatchery broodstocks for Chinook salmon in British Columbia, Canada. Fish. Res. 253, 106369. doi: 10.1016/j.fishres.2022.106369
Beacham T. D., McIntosh B., MacConnachie C., Spilsted B., White B. A. (2012). Population structure of pink salmon (Oncorhynchus gorbuscha) in British Columbia and Washington, determined with microsatellites. Fish. Bull. 110, 242–256.
Beacham T. D., Wallace C., Jonsen K., McIntosh B., Candy J. R., Rondeau E. B., et al. (2020). Accurate estimation of conservation unit contribution to coho salmon mixed-stock fisheries in British Columbia, Canada, using direct DNA sequencing for single nucleotide polymorphisms. Canad. J. Fish. Aquat. Sci. 77, 1302–1315. doi: 10.1139/cjfas-2019-0339
Beacham T. D., Withler R. E., Gould A. P. (1985). Biochemical genetic stock identification of pink salmon (Oncorhynchus gorbuscha) in southern British Columbia and puget sound. Canad. J. Fish. Aquat. Sci. 42, 1474—1483. doi: 10.1139/f85-185
Beacham T. D., Withler R. E., Murray C. B., Barner L. W. (1988). Variation in body size, morphology, egg size, and biochemical genetics of pink salmon in British Columbia. Trans. Am. Fish. Soc 117, 109–126. doi: 10.1577/1548-8659(1988)117<0109:VIBSME>2.3.CO;2
Brykov V. A., Polyakova N., Skurikhina L. A., Kukhlevsky. A. D. (1996). Geographical and temporal mitochondrial DNA variability in populations of pink salmon. J. Fish Biol. 48, 899–909. doi: 10.1111/j.1095-8649.1996.tb01485.x
Christensen K. A., Rondeau E. B., Sakhrani D., Biagi C. A., Johnson H., Joshi J., et al. (2021). The pink salmon genome: uncovering the genomic consequences of a two-year life cycle. PloS One 16 (12), e0255752. doi: 10.1371/journal.pone.0255752
Churikov D., Gharrett A. J. (2002). Comparative phylogeography of the two pink salmon broodlines: an analysis based on a mitochondrial DNA genealogy. Mol. Ecol. 11, 1077–1011. doi: 10.1046/j.1365-294x.2002.01506.x
Dann T. H., Habicht C., Baker T. T., Seeb J. E. (2013). Exploiting genetic diversity to balance conservation and harvest of migratory salmon. Can. J. Fish. Aquat. Sci. 70, 785–793. doi: 10.1139/cjfas-2012-0449
Deeg C. M., Sutherland B. J. G., Ming T. J., Wallace C., Jonsen K., Flynn K. L., et al. (2022). In-field genetic stock identification of overwintering coho salmon in the gulf of Alaska: evaluation of nanopore sequencing for remote real-time deployment. Mol. Ecol. Res. 22, 1824–1835. doi: 10.1111/1755-0998.13595
Evanno G., Regnaut S., Goudet J. (2005). Detecting the number of clusters of individuals using the software STRUCTURE: a simulation study. Mol. Ecol. 14, 2611–2620. doi: 10.1111/j.1365-294X.2005.02553.x
Excoffier L., Lischer H. E. L. (2010). Arlequin suite ver 3.5: a new series of programs to perform population genetics analyses under Linux and windows. Mol. Ecol. Res. 10, 564–567. doi: 10.1111/j.1755-0998.2010.02847.x
Glubokovskii M. K., Zhivotovskii L. A. (1986). Population structure of pink salmon: a system of fluctuating stocks. Biol. Mor. 12, 39–44.
Gordeeva N. V. (2012). High estimates of differentiation between pink salmon, Oncorhynchus gorbuscha, populations at locus of major histocompatibility complex MHC-I A1 support the “local stock” hypothesis. J. Ichthyol. 52, 68–76. doi: 10.1134/S0032945212010043
Gorshkova G. V., Gorshkov S. A. (1983). Chromosomal polymorphism in even-year and odd-year pink salmon. Dokl. Akad. Nauk SSSR. 273, 1023–1024.
Gritsenko O. F. (1981). Population structure of the pink salmon Oncorhynchus gorbuscha (Walbaum). Vopr. Ikhtiol. 21, 787—799.
Hawkins S. L., Varnavskaya N. V., Matzak E. A., Efremov V. V., Guthrie C. M. III, Wilmot R. L., et al. (2002). Population structure of odd-broodline Asian pink salmon and its contrast to the even-broodline structure. J. Fish Biol. 60, 370–388. doi: 10.1006/jfbi.2001.1850
He C., Holme J., Anthony J. (2014). SNP genotyping: the KASP assay. Crop Breeding. Methods Mol. Biol. 1145, 75–86. doi: 10.1007/978-1-4939-0446-4_7
Heard W. R. (1991). “Life history of pink salmon (Oncorhynchus gorbuscha),” in Pacific salmon life histories (Vancouver: University of British Columbia Press), 119–230.
Ivanova N. V., deWaard J., Hebert P. D. N. (2006). An inexpensive, automation-friendly protocol for recovering high-quality DNA. Mol. Ecol. Notes. 6, 998–1002. doi: 10.1111/j.1471-8286.2006.01428.x
Kalinowski S. T., Taper M. L., Marshall T. C. (2007). Revising how the computer program CERVUS accommodates genotyping error increases success in paternity assignment. Mol. Ecol. 16, 1099–1106. doi: 10.1111/j.1365-294x.2007.03089.x
Kitada S., Kishino H. (2021). Population structure of chum salmon and selection on the markers collected for stock identification. Ecol. Evol. 11, 13972–13985. doi: 10.1002/ece3.8102
Kositsyna A. I., Shpigalskaya N., Sergeev A. A., Soshnina V. A., Savenkov V. V., Denisenko A. D., et al. (2022). Genetic identification of juvenile pink salmon Oncorhynchus gorbuscha (Walbaum) in the Okhotsk sea basin based on the results of restriction analysis of mitochondrial DNA and analysis of single-nucleotide polymorphism. Res. Aquat. Biol. Resour. Kamchatka North-West Part Pacific Ocean. 66, 52–67. doi: 10.15853/2072-8212.2022.66.52-67
Larson W. A., Seeb J. E., Pascal C. E., Templin W. D., Seeb L. W. (2014). Single-nucleotide polymorphisms (SNPs) identified through genotyping-by-sequencing improve genetic stock identification of Chinook salmon (Oncorhynchus tshawytscha) from western Alaska. Can. J. Fish. Aquat. Sci. 71, 1–11. doi: 10.1139/cjfas-2013-0502
Li Y. L., Liu J. X. (2018). StructureSelector: a web based software to select and visualize the optimal number of clusters using multiple methods. Mol. Ecol. Res. 18, 176–177. doi: 10.1111/1755-0998.12719
McKinney G. J., Barry P. D., Pascal C., Seeb J. E., Seeb L. W., McPhee M. V. (2022). A new genotyping-in-Thousands-by-Sequencing single nucleotide polymorphism panel for mixed-stock analysis of chum salmon from coastal Western Alaska. North Am. J. Fish. Manag. 42, 1134–1143. doi: 10.1002/nafm.10805
Peakall R., Smouse P. E. (2006). GENALEX 6: genetic analysis in excel, population genetic software for teaching and research. Mol. Ecol. 6, 288–295. doi: 10.1111/j.1471-8286.2005.01155.x
Podlesnykh A. V., Kukhlevsky A. D., Brykov V. A. (2020). A comparative analysis of mitochondrial DNA genetic variation and demographic history in populations of even and odd-year broodline pink salmon, Oncorhynchus gorbuscha (Walbaum 1792), from Sakhalin island. Environ. Biol. Fish. 103, 1553–1564. doi: 10.1007/s10641-020-01040-0
Pritchard J. K., Stefens M., Donnelly P. (2000). Inference of population structure using multilocus genotype data. Genetics 155, 945–959. doi: 10.1093/genetics/155.2.945
Puechmaille S. J. (2016). The program STRUCTURE does not reliably recover the correct population structure when sampling is uneven: subsampling and new estimators alleviate the problem. Mol. Ecol. Res. 16, 608–627. doi: 10.1111/1755-0998.12512
Ruggerone G. T., Irvine J. R. (2018). Numbers and biomass of natural- and hatchery-origin pink salmon, chum salmon, and sockeye salmon in the north pacific ocean 1925–2015. Mar. Coast. Fish. 10, 152–168. doi: 10.1002/mcf2.10023
Salmenkova E. A., Gordeeva N. V., Omel'chenko V. T., Altukhov I., Afanas'ev K. I., Rubtsova G. A., et al. (2006). Genetic differentiation of pink salmon Oncorhynchus gorbuscha walbaum in the Asian part of the range. Genetika 42, 1371–1387.
Sato S., Urawa S. (2017). Genetic variation of Japanese pink salmon populations inferred from nucleotide sequence analysis of the mitochondrial DNA control region. Environ. Biol. Fish. 100, 1355–1372. doi: 10.1007/s10641-017-0648-4
Seeb L. W., Waples R. K., Limborg M. T., Warheit K. I., Pascal C. E., Seeb J. E. (2014). Parallel signatures of selection in temporally isolated lineages of pink salmon. Mol. Ecol. 23, 2473–2485. doi: 10.1111/mec.12769
Sobrino O. B., Brioan M., Carracedo A. (2005). SNPs in forensic genetics: a review on SNP typing methodologies. Forensic Sci. Int. 154, 181–194. doi: 10.1016/j.forsciint.2004.10.020
Tarpey C. M., Seeb J. E., McKinney G. J., Seeb L. W. (2018). Single-nucleotide polymorphism data describe contemporary population structure and diversity in allochronic lineages of pink salmon (Oncorhynchus gorbuscha). Can. J. Fish. Aq. Sci. 75, 987–997. doi: 10.1139/cjfas-2017-0023
Weir B. S., Cockerham C. C. (1984). Estimating f-statistics for the analysis of population structure. Evolution 38, 1358–1370. doi: 10.1111/j.1558-5646.1984.tb05657.x
Zelenina D. A., Khrustaleva A. M., Volkov A. A., Habicht C., Smith C., Seeb J. E. (2005). A case study of two genetic markers for Inter_Laboratory collaboration: SNPs provide transportability without standardization. NPAFC Doc. 913, 14.
Zelenina D. A., Martinsohn J. T., Ogden R., Volkov A. A., Zelenina I. A., Carvalho G. R. (2011). Advanced approaches to studying the population diversity of marine fishes: new opportunities for fisheries control and management. Russ. J. Genet. 47, 1444–1455. doi: 10.1134/S1022795411120179
Keywords: pink salmon, stocks discrimination, genetic structure, SNP markers, KASP assay, fisheries management, the Sea of Okhotsk
Citation: Zelenina DA, Sergeev AA, Kositsina AI, Soshnina VA and Shpigalskaya NY (2023) SNP-based discrimination of pink salmon stocks of the Sea of Okhotsk basin: resolution of the approach and possible ways to increase it. Front. Mar. Sci. 10:1140538. doi: 10.3389/fmars.2023.1140538
Received: 09 January 2023; Accepted: 02 May 2023;
Published: 22 May 2023.
Edited by:
Reinhold Hanel, Thünen Institute of Fisheries Ecology, GermanyReviewed by:
Simo Njabulo Maduna, Norwegian Institute of Bioeconomy Research (NIBIO), NorwayFilippo Biscarini, National Research Council (CNR), Italy
Copyright © 2023 Zelenina, Sergeev, Kositsina, Soshnina and Shpigalskaya. This is an open-access article distributed under the terms of the Creative Commons Attribution License (CC BY). The use, distribution or reproduction in other forums is permitted, provided the original author(s) and the copyright owner(s) are credited and that the original publication in this journal is cited, in accordance with accepted academic practice. No use, distribution or reproduction is permitted which does not comply with these terms.
*Correspondence: Daria A. Zelenina, ZC56ZWxlbmluYUBnbWFpbC5jb20=