 Junfang Yang
 Yabin Hu
 Jie Zhang1,2,3,4
 Yi Ma
Yi Ma
95% of researchers rate our articles as excellent or good
Learn more about the work of our research integrity team to safeguard the quality of each article we publish.
Find out more
ORIGINAL RESEARCH article
Front. Mar. Sci. , 17 March 2023
Sec. Ocean Observation
Volume 10 - 2023 | https://doi.org/10.3389/fmars.2023.1135356
This article is part of the Research Topic Optics and Machine Vision for Marine Observation View all 25 articles
The types of marine oil spill pollution are closely related to source tracing and pollution disposal, which is an important basis for oil spill pollution punishment. The types of marine oil spill pollution generally include different types of oil products as well as crude oil and its emulsions in different states. This paper designed and implemented two outdoor oil spill simulation experiments, obtained the hyperspectral and thermal infrared remote sensing data of different oil spill pollution types, constructed a hyperspectral recognition algorithm of oil spill pollution type based on classical machine learning, ensemble learning and deep learning models, and explored to improve the identification ability of hyperspectral oil spill pollution type by adding thermal infrared features. The research shows that hyperspectral combined with thermal infrared remote sensing can effectively improve the recognition accuracy of different oils, but thermal infrared remote sensing cannot be used to distinguish crude oil and high concentration water-in-oil emulsion. On this basis, the recognition ability of hyperspectral combined with thermal infrared for different oil film thicknesses is also discussed. The combination of hyperspectral and thermal infrared remote sensing can provide important technical support for emergency response to maritime emergencies and oil spill monitoring business of relevant departments.
Marine oil spill is the most typical and serious environmental pollution accident in the process of marine development. Various oil spills pollution types on the sea not only damage the marine environment and coastline ecology, pollute fishery resources, endanger marine food security, affect tourism, but also threaten human health, and even hinder the healthy development of the marine economy (Washburn et al., 2018; Silva et al., 2022; Wang et al., 2022). It is difficult to eliminate negative impacts of major marine oil spills on the marine ecological environment in a short time.
In general, the types of marine oil spill pollution include different types of oil products as well as crude oil and its emulsions in different states. There are five typical oil products: 1) Crude oil, such as the oil product leaked in the Deepwater Horizon platform oil spill accident in the Gulf of Mexico in 2010 (Leifer et al., 2012) and the Penglai 19-3C platform oil spill accident in 2010 (Yang et al., 2019); 2) Fuel oil, that is, the fuel used for large ship engines, such as the oil product leaked in the oil tanker grounding accident in southeast Mauritius in 2020 (Rajendran et al., 2021); 3) Condensate, also known as natural gasoline, is similar to gasoline, such as the oil product leaked from the East China Sea oil tanker collision accident in 2018 (Lu et al., 2019a); 4) Vegetable oil, such as palm oil with the largest production, consumption and international trade volume in the world (Yang et al., 2021); 5) Diesel oil, that is, the fuel used for high-speed diesel engine for small ships. Crude oil and its emulsions in different states include non-emulsified crude oil, water-in-oil emulsion and oil-in-water emulsion (Lu et al., 2019b; Lu et al., 2020). Once the spilled oil on the sea surface is not removed in time, a series of complex physical and chemical changes, such as diffusion, drift, emulsification, evaporation, dissolution, adsorption precipitation, photooxidation and biodegradation, will occur under the combined action of wind, wave, current and other environmental dynamics, forming water-in-oil (WO) and oil-in-water (OW) emulsions of different concentrations (Lu et al., 2013a).
The types of marine oil spill pollution are closely related to source tracing and pollution disposal, which is an important basis for oil spill pollution punishment. Different types of oil products, crude oils and its emulsions in different states need to adopt different emergency treatment strategies, such as combustion elimination, oil absorption felt adsorption, dispersant spraying, skimmer recovery, etc (Zhong and You, 2011; French-McCay et al., 2022). Timely identification of different types of marine oil spill pollution is of great significance for marine oil spill monitoring and emergency response.
Optical remote sensing and microwave remote sensing are important means for marine oil spill monitoring (Fingas and Brown, 2014; Lu et al., 2016a; Pärt et al., 2021). Synthetic Aperture Radar (SAR) is the most commonly used technology for marine oil spill monitoring in microwave remote sensing, which has the advantages of all-day, all-weather, and can also successfully obtain images under cloudy and rainy conditions. Therefore, SAR has become the primary means for relevant business departments to monitor marine oil spills (Velotto et al., 2011; Marghany, 2014; Alpers et al., 2017; Mdakane and Kleynhans, 2020; Ma et al., 2021; Zhu et al., 2021). However, SAR also has a higher false alarm rate in detecting marine oil spills, and it is difficult to identify oil spill pollution types and estimate the oil film thickness. The oil spill information contained by optical remote sensing is more abundant than SAR, and has been studied and applied widely in oil spill monitoring (Shi et al., 2018; Shen et al., 2020; Hu et al., 2021; Yang et al., 2022b). Among them, hyperspectral remote sensing has higher spectral resolution, and can extract rich subtle features among different oil spill pollution types. Therefore, it has been widely concerned about oil spill monitoring using hypersectral remote sensing (Lu et al., 2013b; Cui et al., 2017; Zhu et al., 2019; Zhu et al., 2019; Li et al., 2020; Wang B. et al., 2021), especially oil spill pollution type identification (Wettle et al., 2009; Yang et al., 2020; Jiang et al., 2021; Lai et al., 2021; Li et al., 2021; Yang et al., 2022a), but is vulnerable to the impact of sun flare in complex marine environment, which lead to the oil film boundary is not clearly identified (Sun and Hu, 2016; Lu et al., 2016b; Duan et al., 2020). The infrared emissivity of seawater and oil film is different, and the oil-water boundary is well identified. Thermal infrared remote sensing is almost not affected by the change of light, which can realize the detection of marine oil spill and the inversion of oil film thickness, but it is difficult to distinguish the type of oil spill emulsion (Jing et al., 2011; Wang and Hu, 2015; Lu et al., 2016c; Guo et al., 2020; Jiao et al., 2021; Li et al., 2022). The comparison of marine oil spill monitoring capabilities of various remote sensing technologies is listed in Table 1.
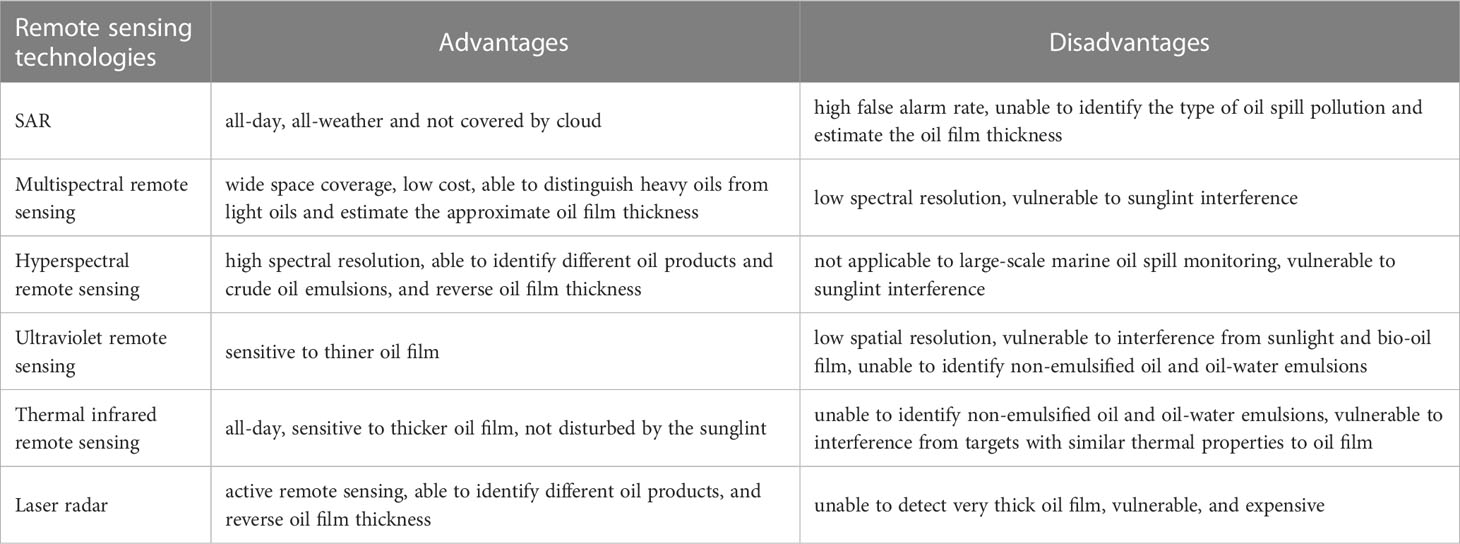
Table 1 Comparison of oil spill monitoring capability of various remote sensing technologies.
Most of the optical remote sensing monitoring of marine oil spill is carried out based on a single sensor type, which has certain limitations and cannot meet the needs of accurate monitoring. Recently, more and more scholars pay attention to combining the advantages of different sensors to effectively improve the remote sensing monitoring ability of marine oil spill, and have made certain achievements (Mohammadi et al., 2021; Rajendran et al., 2021). Lu et al., (2019a) used China’s GF-3 SAR data to delineate suspected oil spill areas in the East China Sea “SANCHI” collision oil spill event in January 2018. The multispectral data of Sentinel-2 satellite is used to carry out optical remote sensing detection of marine oil spill, and further carried out optical remote sensing identification and classification of oil spill pollution types based on the analysis of spectral response characteristics of oil spill simulation experiments, which is mutually verified with the suspected oil spill monitoring results of GF-3 SAR. Wang L. F. et al. (2021) proposed a new method to determine the oil film area using the fusion of visible light and thermal infrared images. This method integrates the advantages of visible light and thermal infrared images, and can accurately determine the oil film area under different lighting conditions, with an average error of 2.78%. Wang and Gao (2020) used SAR and laser fluorescence sensors to carry out airborne platform oil spill monitoring. First, they used SAR for long-distance and large-scale detection. Once the suspected oil spill area was detected, they used laser fluorescence sensor for close detection. The combination of SAR and laser fluorescence sensor greatly improved the detection effect and recognition ability of marine pollutants in large areas.
To sum up, this paper designed and implemented two outdoor oil spill simulation experiments, carried out the extraction and analysis of hyperspectral and thermal infrared optical features of different oil spill pollution types, introduced classification algorithms such as classical machine learning, ensemble learning and deep learning, studied and constructed hyperspectral oil spill pollution type recognition algorithms, and explored how to improve the ability of hyperspectral oil spill pollution type identification by adding thermal infrared features.
This part mainly introduces two outdoor oil spill simulation experiments. One is the experimental scenario (Figures 1A, B) for different types of oil products (Figure 2A), namely crude oil, fuel oil, palm oil, diesel oil and gasoline. In September 2020, the experiment was conducted in the pool (45 m× 40 m) of Qingdao Nanjiang Wharf, five kinds of oil products are distributed in the enclosure made of PVC boards, and the seawater depth is 1.2 m. The second is the experimental scenario (Figures 1C, D) for crude oil and its emulsions in different states (Figure 2B), namely, non-emulsified crude oil, WO emulsion and OW emulsion, which was carried out in Aoshanwei experimental base in Qingdao in May 2022. High speed disperser and emulsifier were used to prepare WO emulsion and OW emulsion with different volume concentrations. The preparation method was referred to (Lu et al., 2019). Crude oil with different thickness and crude oil emulsions with different volume concentration are distributed in the enclosure made of black PVC boards. The oil products information used in the experiment is shown in Table 2.
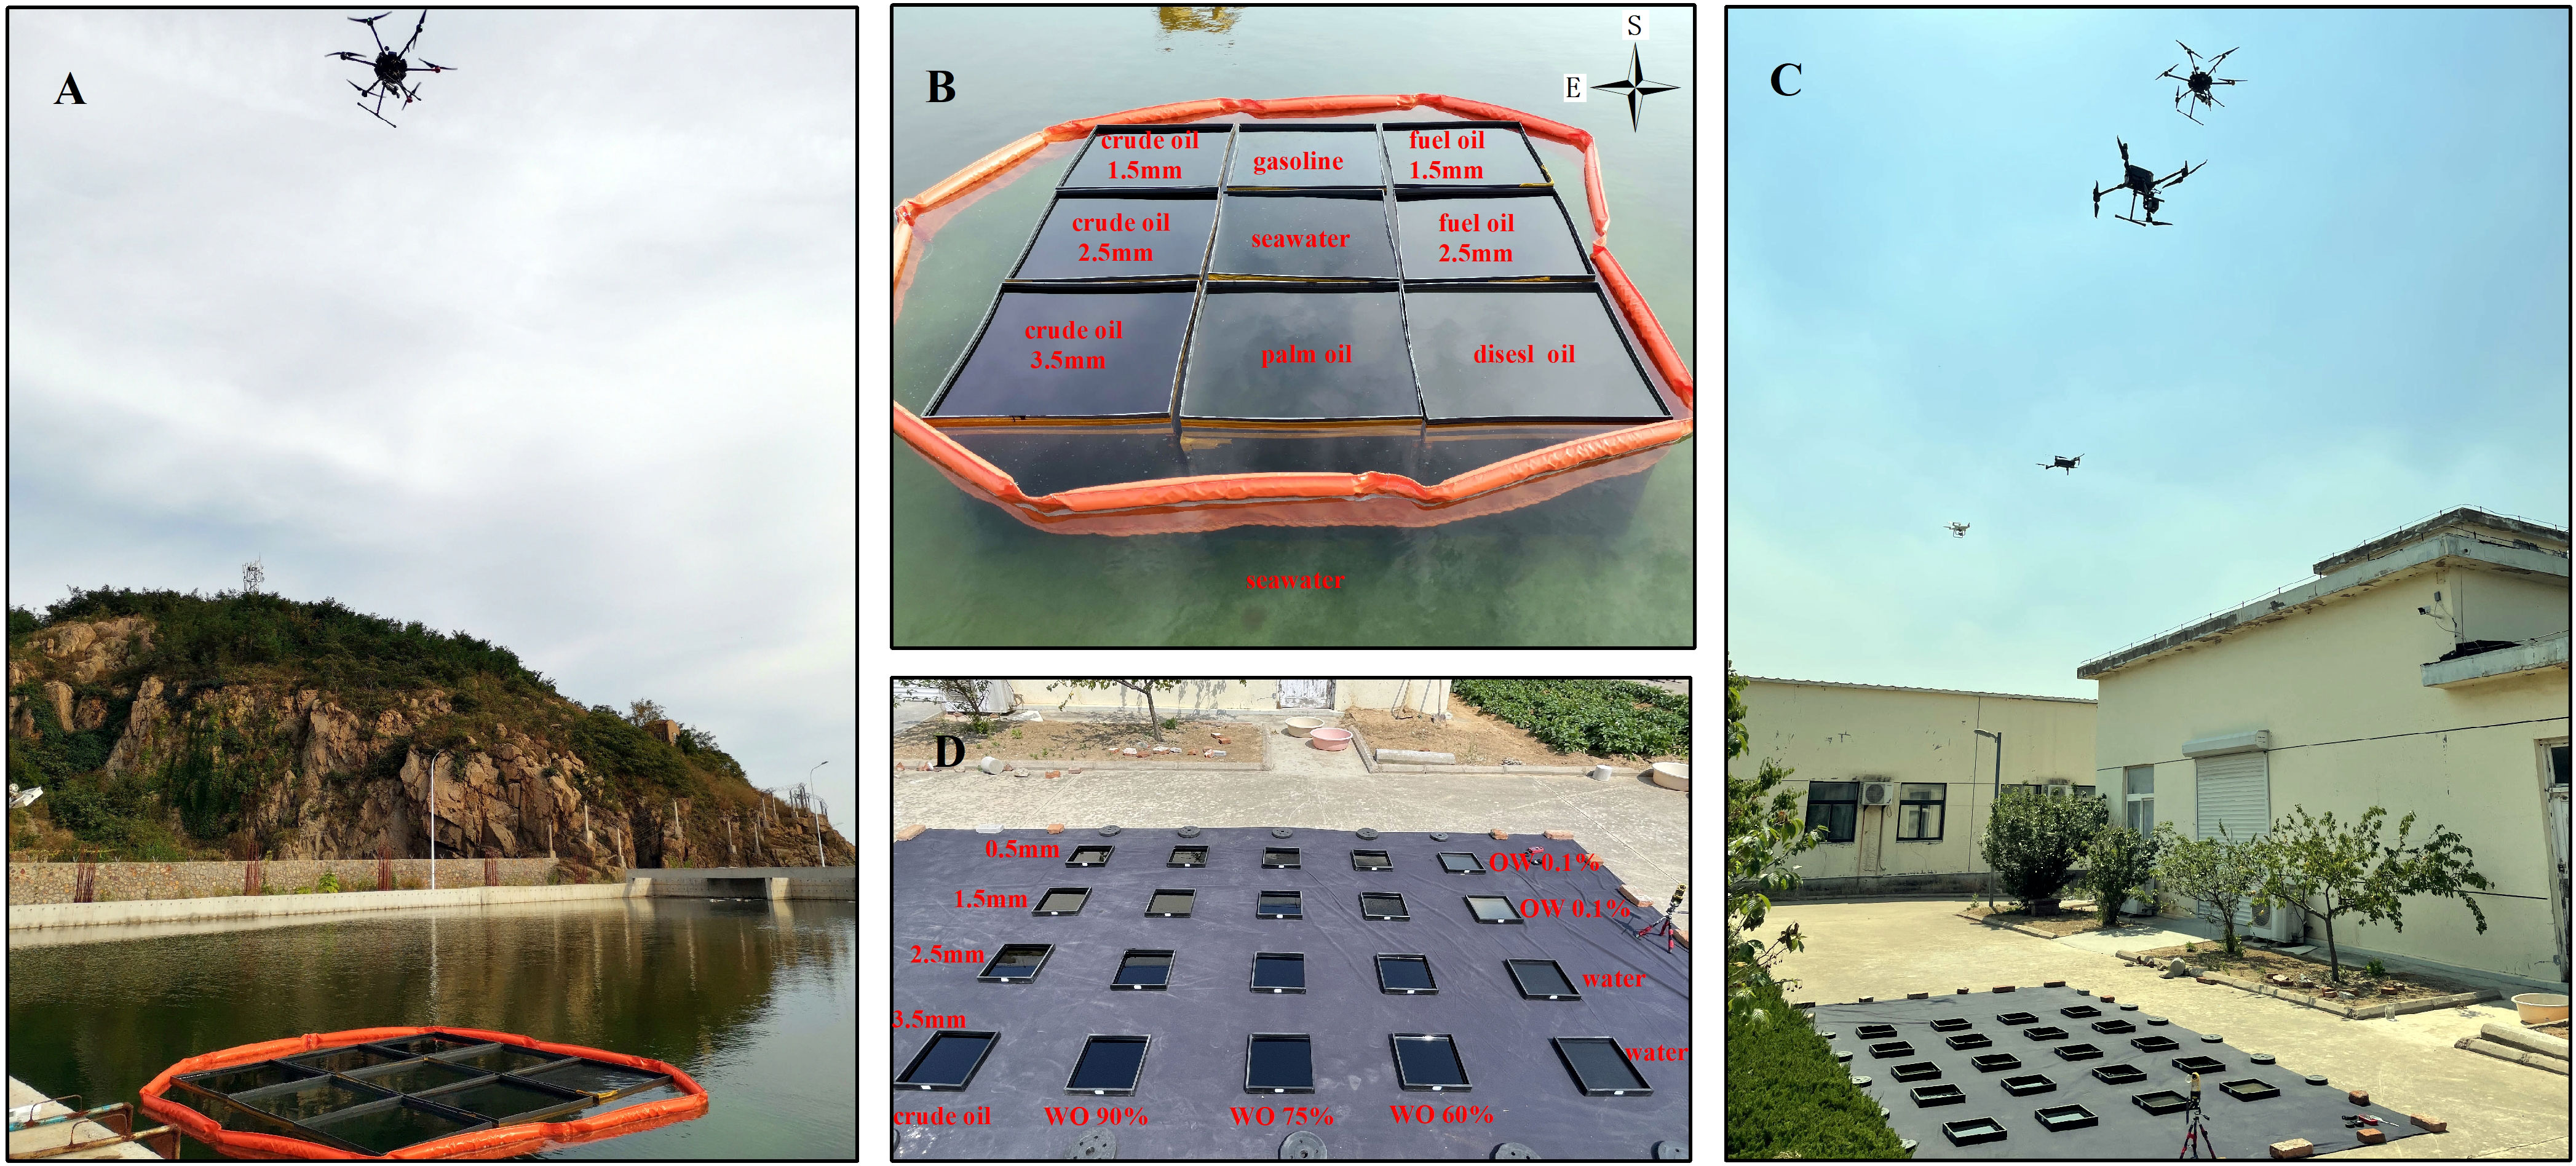
Figure 1 Oil spill observation experimental scenarios and oil distribution using hyperspectral combined thermal infrared remote sensing: (A) experimental scenarios of different types of oil products in September 2020; (B) distribution of different types of oil products; (C) experimental scenario of crude oil and its emulsions in different states in May 2022; (D) distribution of crude oil and its emulsions in different states.
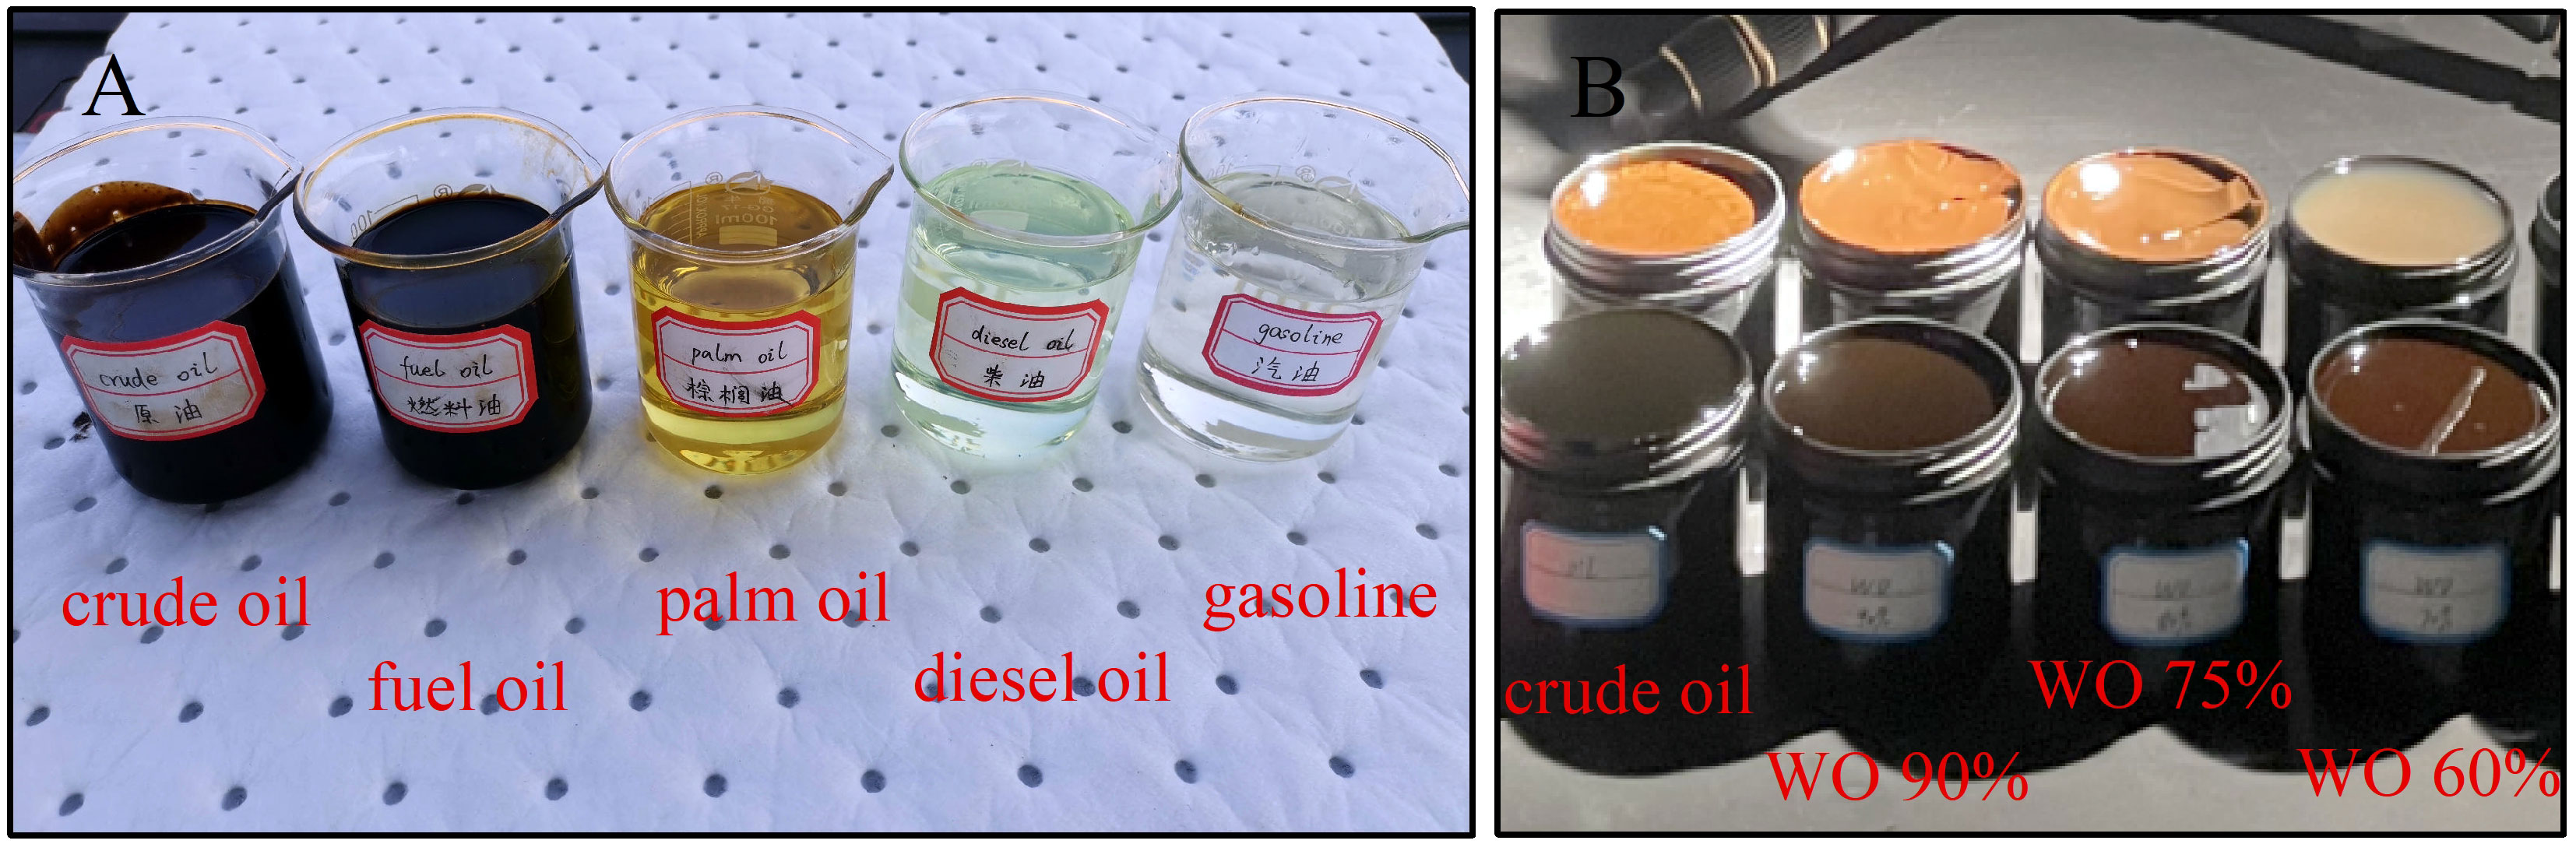
Figure 2 Experimental oils: (A) different types of oil products; (B) crude oil and its emulsions in different states.
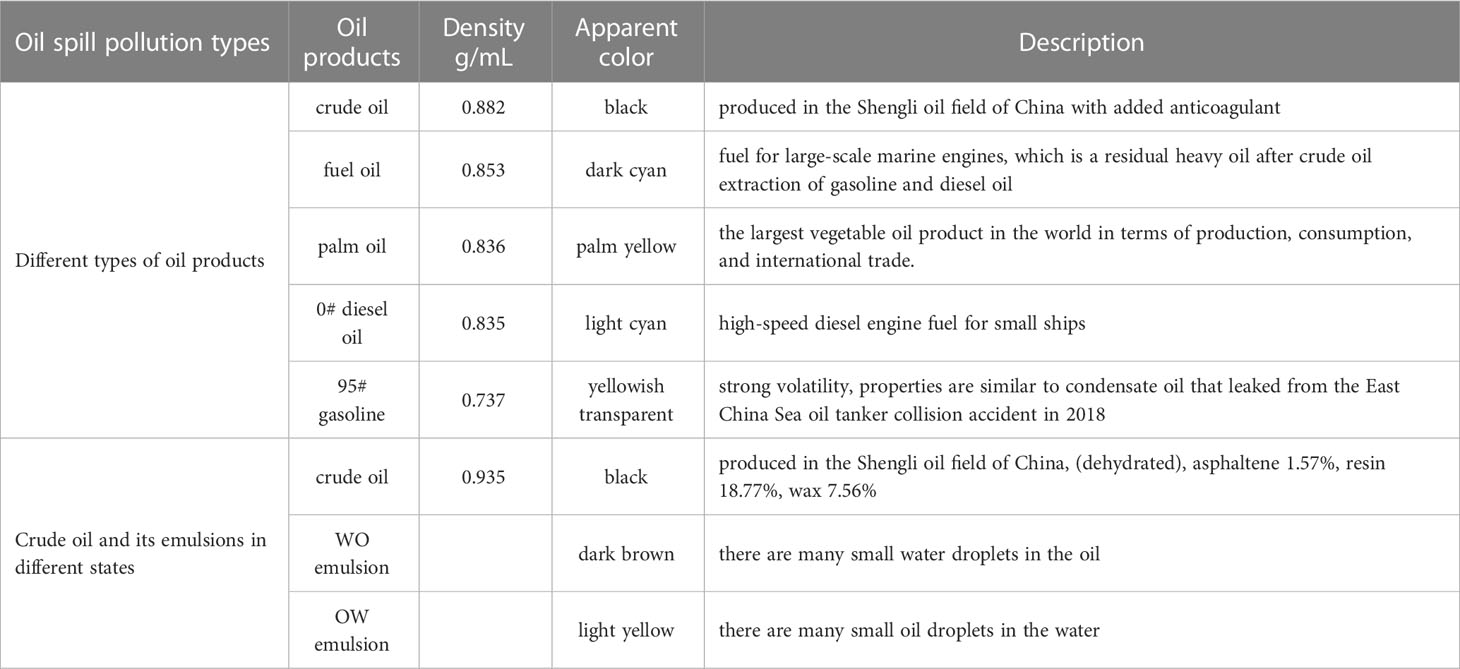
Table 2 The properties and description of experimental oils.
For the experimental scenarios of different types of oil products, the Cubert S185 airborne hyperspectral imager and DJI “Yu” 2 airborne thermal infrared camera were used to obtain approximately synchronous hyperspectral images and thermal infrared images of different types of oil products (Figures 3A, B). For the experimental scenes of crude oil and its emulsions in different states, the Cubert S185 airborne hyperspectral imager and Zemmuse H20T airborne thermal infrared imager were used to obtain approximately synchronous hyperspectral and thermal infrared images of crude oil and its emulsions in different states (Figures 3C, D). The main parameters of the Cubert S185 airborne hyperspectral imager and Zemmuse H20T airborne thermal infrared imager are shown in Table 3. Except for the camera focus and stability, the main parameters of Zemmuse H20T airborne thermal infrared imager and DJI “Yu” 2 airborne thermal infrared camera are the same.
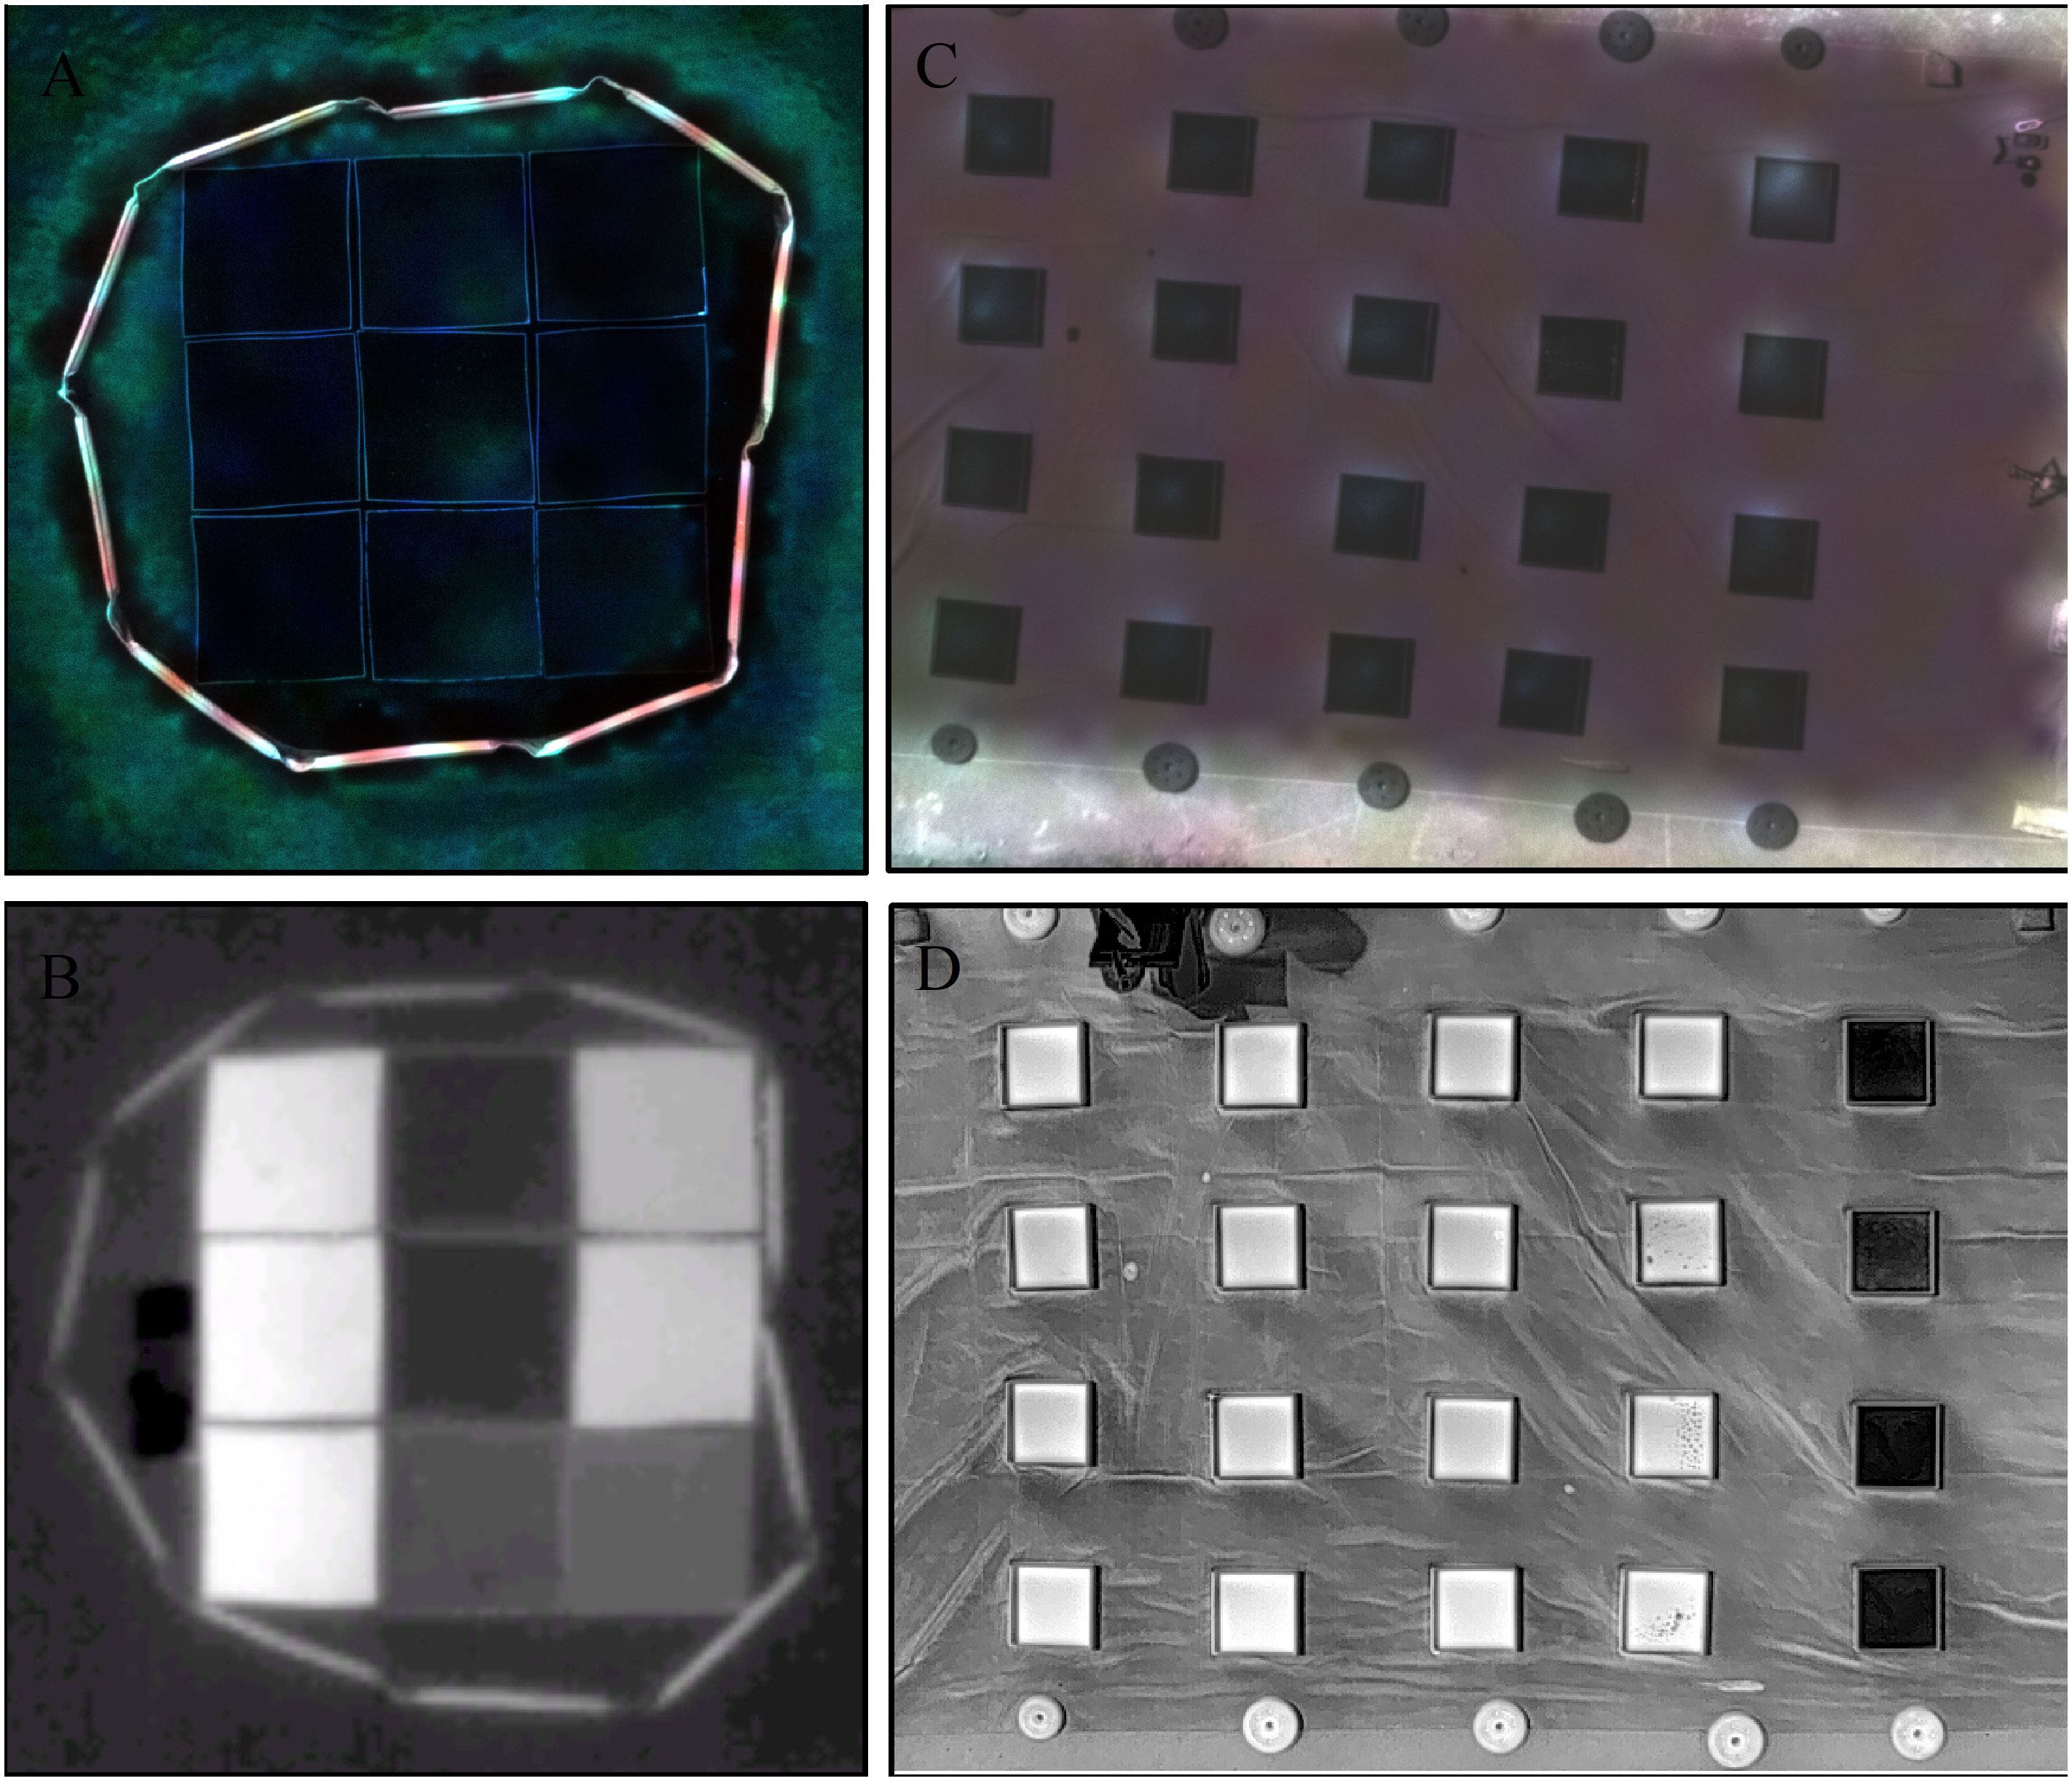
Figure 3 Hyperspectral and thermal infrared images of different oil spill pollution types: (A) airborne hyperspectral image of different oil products; (B) airborne thermal infrared images of different oil products; (C) airborne hyperspectral images of crude oil and its different emulsions; (D) airborne thermal infrared images of crude oil and its different emulsions.
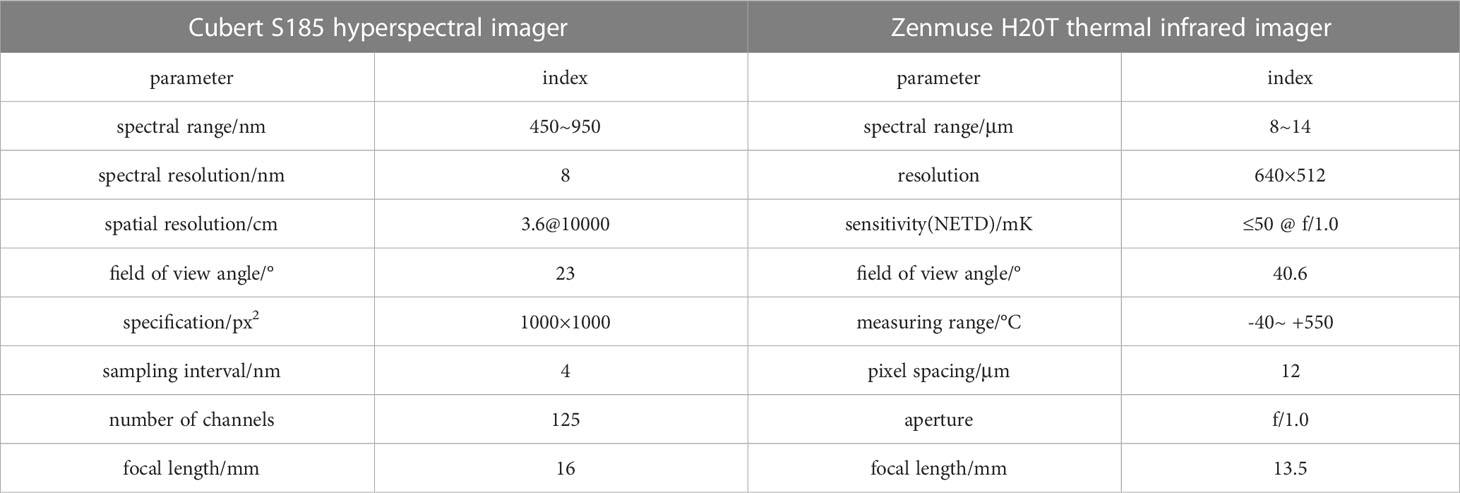
Table 3 The main parameters of Cubert S185 hyperspectral imager and Zenmuse H20T thermal infrared imager.
The data acquired by the airborne hyperspectral imager include the original measured spectral data, reference plate and dark current calibration data. The data to be converted was imported to the Cubert Utils Touch software. The spectral reflectance data of different oil spill pollution types was exported. Import the thermal infrared image acquired by the airborne thermal infrared imager into the DJI Thermal Analysis Tool to export the brightness temperature data of different oil spill pollution types. Due to the different coverage of airborne hyperspectral image and airborne thermal infrared image, two images need to be registered and cropped. The image size of different oil products as well as crude oil and its emulsions in different states used for identification experiments is 638×630 and 551×765 respectively.
Field data includes Analytical Spectral Devices (ASD) data and site photos used to assist in the production of ground truth image. The ASD FieldSpec4 spectrometer (350-2500 nm) was used to measure Lambertian standard plate, different oil spill pollution types, seawater and skylight to obtain their radiance, and then convert the radiance into the spectral reflectance of different oil spill pollution types and seawater according to the formula in literature (Yang et al., 2020). The detailed index parameters of ASD FieldSpec4 spectrometer are shown in literature (Yang et al., 2020). The ground truth image (Figure 4) obtained through human-computer interaction interpretation is used as the benchmark for evaluating the classification and recognition results, and the performance of the classification and recognition model is tested at the same time.
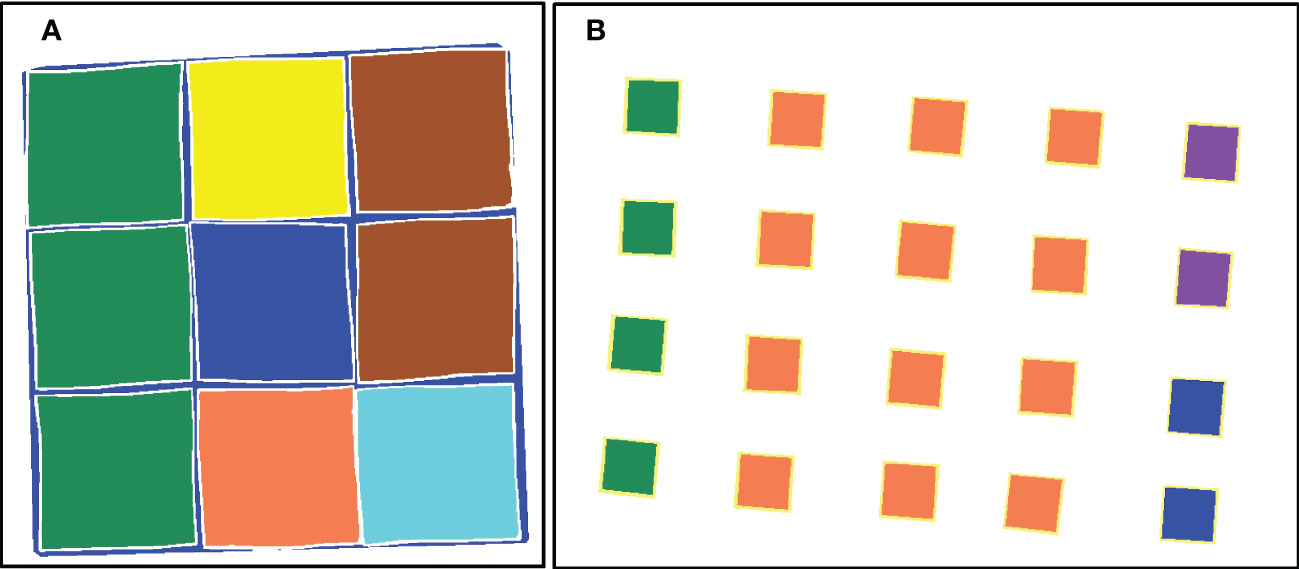
Figure 4 Ground truth image: (A) different oil products; (B) crude oil and its emulsions in different states.
In this paper, the Support Vector Machine model in classical machine learning, the Random Forest model in ensemble learning and the Convolution Neural Network model in deep learning are selected to identify the types of oil spill pollution. For the experiment of different types of oil products, the number of labeled samples is 375606, of which about 3% are used for training and about 3% for validation. For the experiment of crude oil and its emulsions in different states, the number of labeled samples is 135695, of which about 3% are used for training and about 3% for validation. The number of training samples, validation samples and test samples for each oil spill pollution type in the experiment is listed in Table 4.
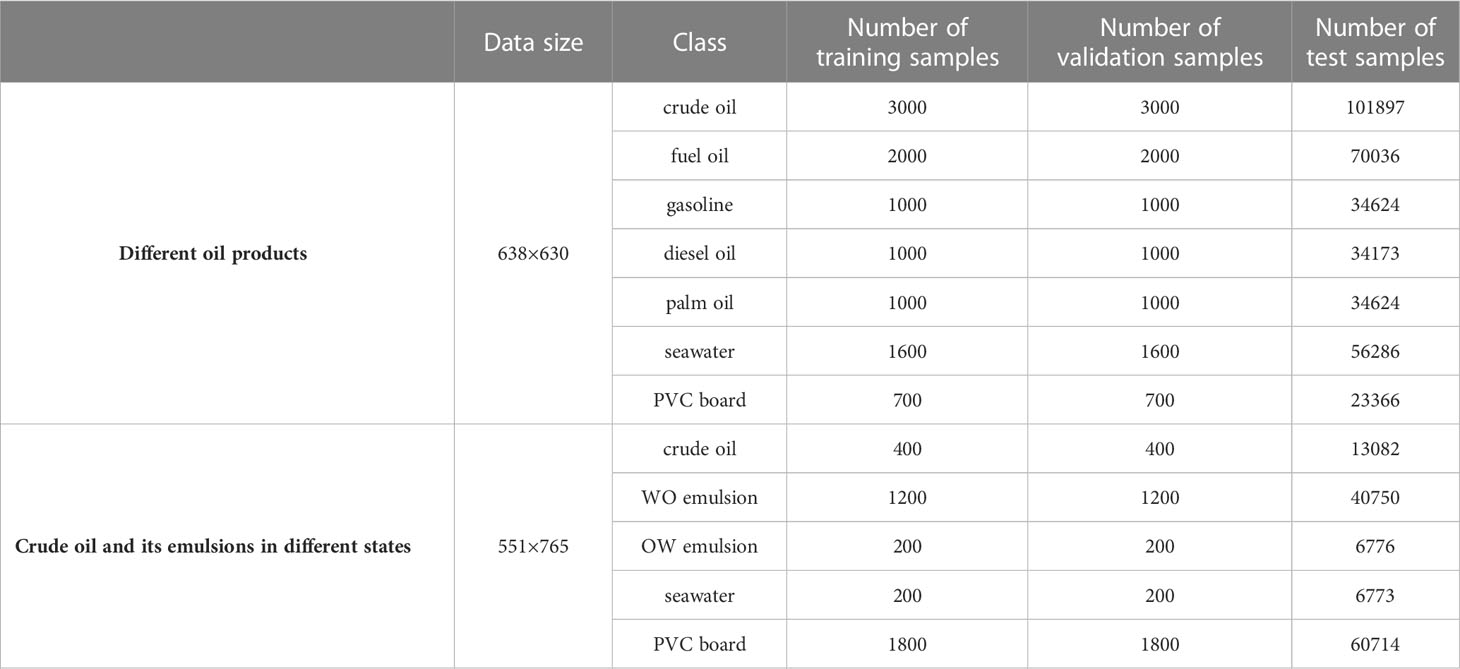
Table 4 Number of training samples, validation samples and test samples in the experiment of oil spill pollution type identification.
SVM is a traditional machine learning method based on statistical learning theory. It can automatically find the support vector that has a greater ability to distinguish classification and then construct the classifier, which can maximize the interval between classes to achieve good statistics when the number of samples is small. This method has high convergence efficiency, training speed, and classification accuracy, and has been widely used in many fields of research in recent years (Wang et al., 2011; Hu et al., 2019a; Hu et al., 2019b). The kernel function selected in this paper is the radial basis function.
Random Forest is an algorithm that effectively uses multiple decision trees to train and predict samples and optimize decisions through the idea of ensemble Learning. The basic unit is the decision tree. The randomness of RF is mainly reflected in two aspects: one is the random selection of data, and the other is the random selection of features to be selected. This can make the decision trees in the RF different from each other, and further enhance the generalization ability of the model.
The RF algorithm uses multiple CART decision trees as weak classifiers. In CART tree, the criterion of impure measure used to select variables is Gini coefficient. The minimum Gini coefficient criterion is used for feature selection. Here, the number of decision trees in the RF is 100.
CNN is a significant achievement in the field of deep learning, and has been widely used in hyperspectral remote sensing classification in recent years. CNN has two main characteristics. One is local receptive fields, the other is weight sharing, which effectively reduces the number of parameters in the network and makes CNN have displacement invariance.
The CNN model structure used in this paper consists of seven information layers, including one input layer, two convolutional layers, two pooling layers, one full connection layer, and one output layer. The number of convolutional kernel in the first convolution layer is 10, and the size of convolutional kernel is 5×5. The number of convolutional kernel in the second convolution layer is 8, and the size of convolutional kernel is 3×3. The size of the subsampling filter in the first pooling layer and the second pooling layer is 1×1 and 1×1 respectively. The maximum pooling is adopted for the pooling layer. The number of batch training is 2, the number of iterations is 80, and the learning rate is 0.7.
In view of the hyperspectral image (HSI) and multidimensional image of hyperspectral combined thermal infrared (HTI), Convolution Neural Network (2D-CNN) model, Support Vector Machine (SVM) algorithm and Random Forest (RF) algorithm are used to carry out classification and identification of different oil spill pollution types, namely, identification of different types of oil products as well as crude oil and its emulsions in different states.
According to the classification results of different types of oil products (Figure 5), it can be seen that 2D-CNN, SVM and RF classifiers have different abilities in data feature mining, and the performance of classification is also different. Intuitively, SVM has relatively poor oil identification effect based on the HSI. The mixing of different oils, especially light oils (palm oil, diesel oil, gasoline) is serious. The recognition effect of heavy oils (crude oil, fuel oil) is good. The classification results are quite different from the ground truth image (Figure 4A). The recognition results of RF model and 2D-CNN model (Figures 5A–C) can better maintain the continuity of oil film, which is consistent with the ground truth image, and shows the powerful data mining ability and feature extraction ability of ensemble learning model and deep learning model.
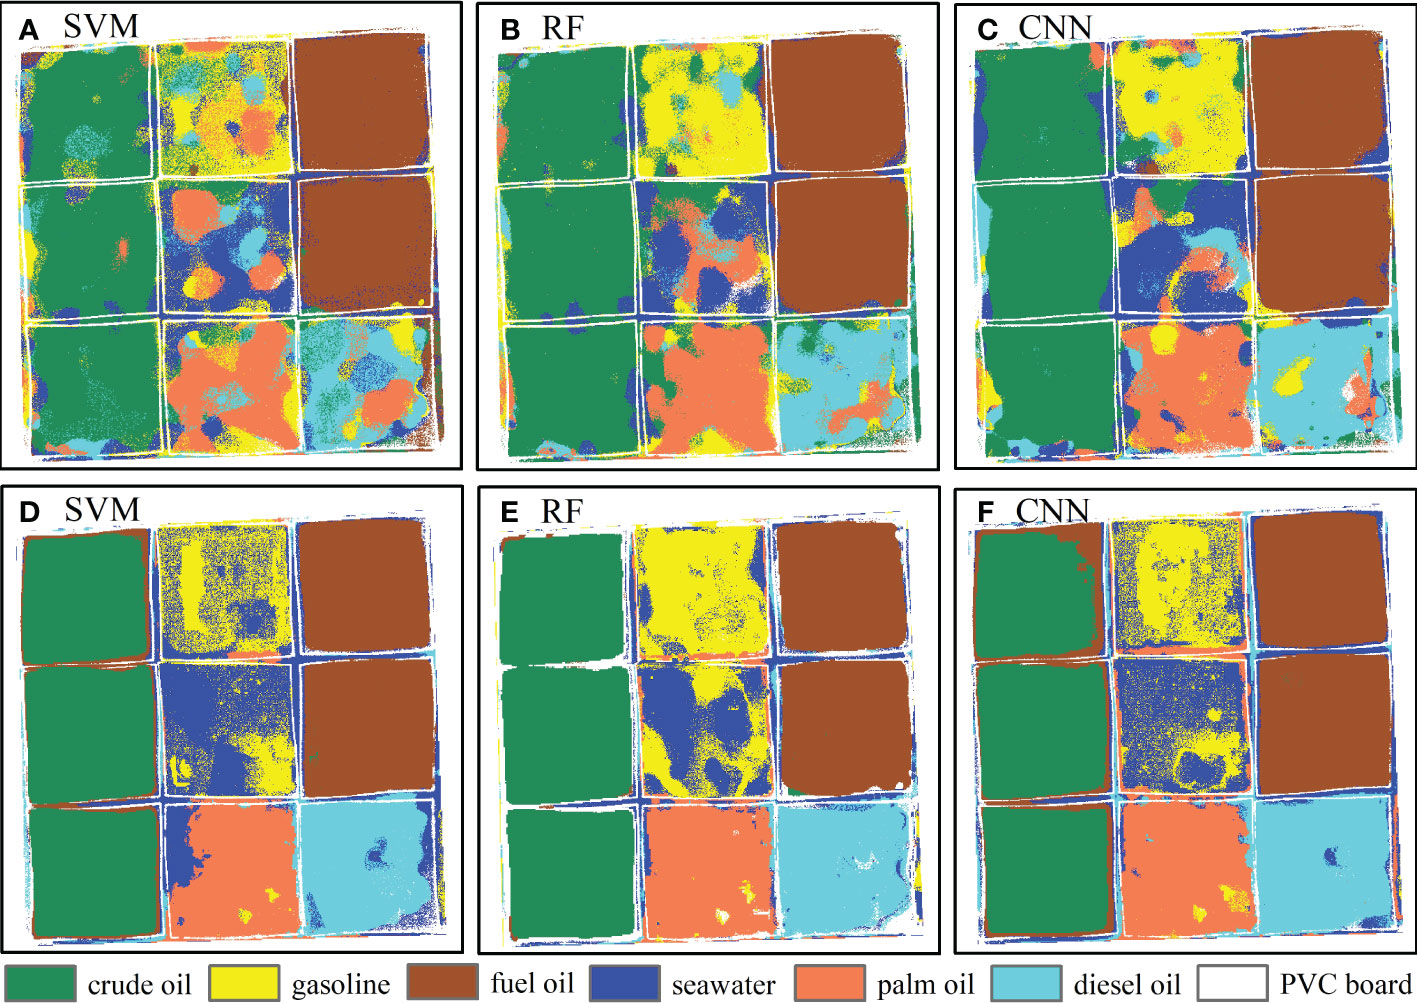
Figure 5 Classification results of oil products based on different dimensional images: (A–C) HSI; (D–F) HTI.
For the HTI, the recognition results (Figures 5D–F) of the three algorithms are obviously better than those based on the HSI. With the addition of thermal infrared features, the oil type recognition results can better maintain the continuity of oil spill on the sea, with clearer boundaries, and the mixing phenomenon between light oils is greatly reduced, which is consistent with the ground truth image. However, gasoline and seawater still have a misclassification phenomenon, which is due to the volatility of gasoline, resulting in that the selected gasoline training samples are not completely pure gasoline pixels.
It can be seen from the recognition results of crude oil and its emulsions in different states (Figure 6) that, for the HSI, the recognition results of 2D-CNN model on WO emulsion, OW emulsion and seawater (Figure 6C) are good, which are consistent with the ground truth image (Figure 4B), but the crude oil is partially divided into WO emulsion, showing the strong data mining ability and feature extraction ability of the deep learning model. The recognition results of SVM model and RF model for crude oil and its emulsions in different states (Figures 6A, B) are similar. In addition to the fact that crude oil is partially divided into WO emulsion, and seawater is also partially divided into WO emulsion.
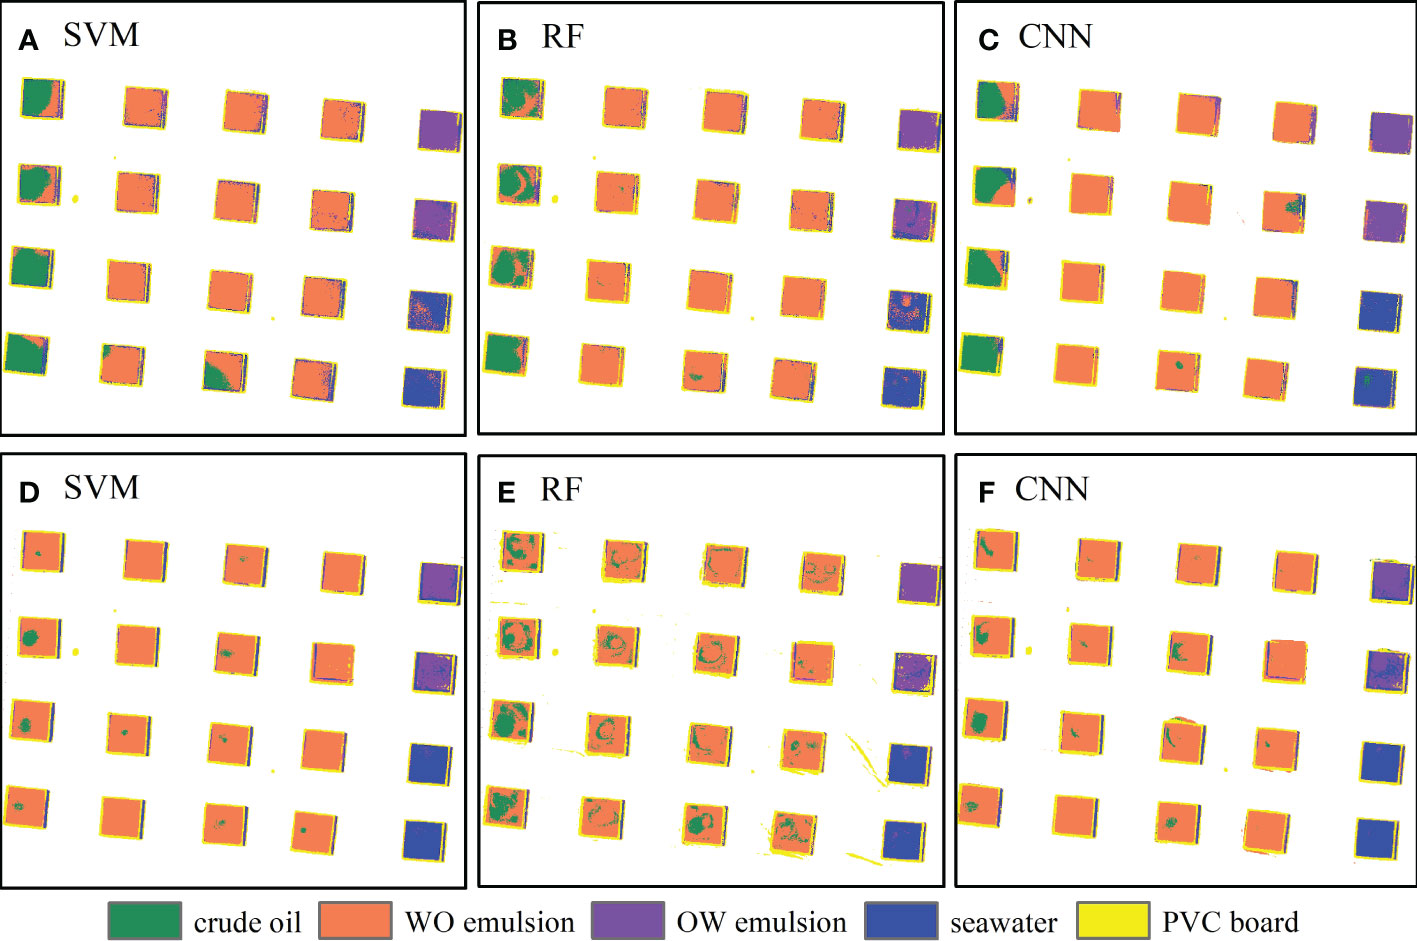
Figure 6 Classification results of crude oil and its different emulsions based on different dimensional images: (A–C) HSI; (D–F) HTI.
Different from the recognition results of different oil products in Section 3.1.1, the recognition results of the three algorithms for crude oil and its emulsions in different states based on the HSI are significantly better than those of the HTI. The addition of thermal infrared features enhances the recognition effect between seawater and WO emulsion, but aggravates the mixing phenomenon between crude oil and WO emulsion, making most crude oil be wrongly divided into WO emulsion (Figures 6D–F).
The same training samples are used to train the 2D-CNN model, SVM and RF model to carry out oil spill pollution type recognition, and the recognition accuracy of oil spill pollution type is evaluated based on the ground truth image (Figure 4).
The overall accuracy and Kappa coefficient in the confusion matrix are used in this paper to evaluate the overall identification accuracy of oil spill pollution types based on HSI and HTI, as shown in Table 5. For different oils, the overall recognition accuracy of SVM, RF and 2D-CNN models based on the HSI is 72.66%, 78.82% and 80.09% respectively. After adding thermal infrared features, the overall recognition accuracy of SVM, RF and 2D-CNN models reached 83.24%, 85.08% and 82.9% respectively, and Kappa coefficients were 0.80, 0.82 and 0.80 respectively, indicating that the prediction results of the HTI were in good agreement with the actual results. For crude oil and its emulsions in different states, the overall recognition accuracy of SVM, RF and 2D-CNN models based on the HSI reaches 94.52%, 94.62% and 95.2% respectively. After adding thermal infrared features, the overall recognition accuracy of SVM, RF and 2D-CNN models is 92.06%, 91.67% and 91.45% respectively.
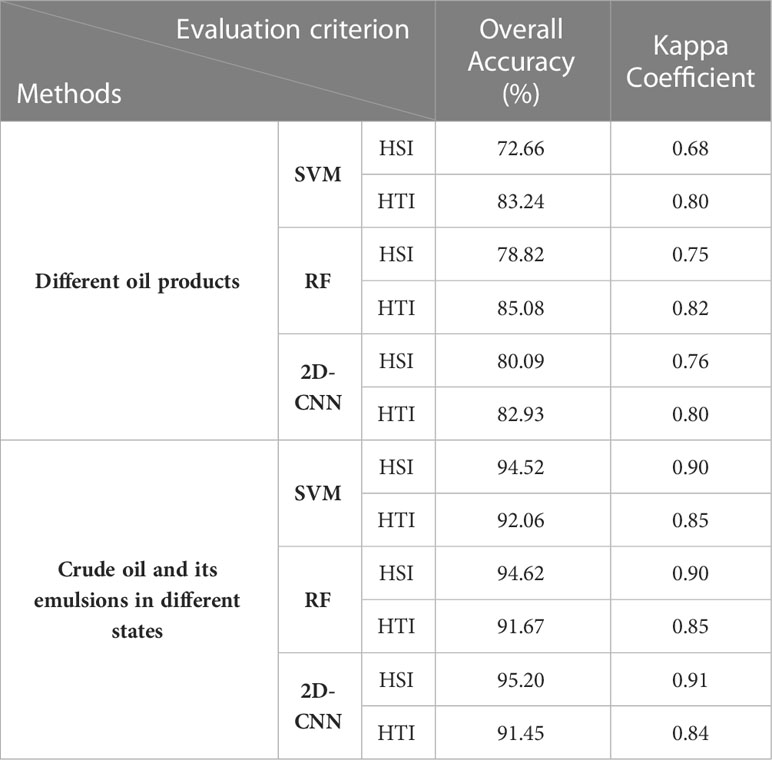
Table 5 The accuracies for oil pollution type identification of three algorithms based on HSI and HTI.
The F1 score is used to evaluate the identification accuracy of single oil spill pollution type based on HSI and HTI, as shown in Figure 7. In general, for different oils, the recognition accuracy of the three algorithms based on HTI has been improved to varying degrees compared with that based on HSI. Taking the recognition results of RF model as an example, the F1 scores of gasoline, palm oil and diesel oil increased by 0.07, 0.21 and 0.20 respectively. The F1 score of crude oil and fuel oil increased by 0.11 and 0.03 respectively. The F1 score of seawater increased by 0.09. The experimental results show that the thermal infrared features can increase the identification ability of hyperspectral for different oils, especially light oils, and can effectively improve the oil identification accuracy. For crude oil and its emulsions in different states, the recognition accuracy of the three algorithms based on HTI is lower than that based on HSI to varying degrees, but the recognition accuracy of seawater is improved. Taking the recognition results of RF model as an example, the F1 scores of crude oil, WO emulsion and OW emulsion decreased by 0.37, 0.09 and 0.04 respectively, while the F1 scores of seawater increased by 0.10.
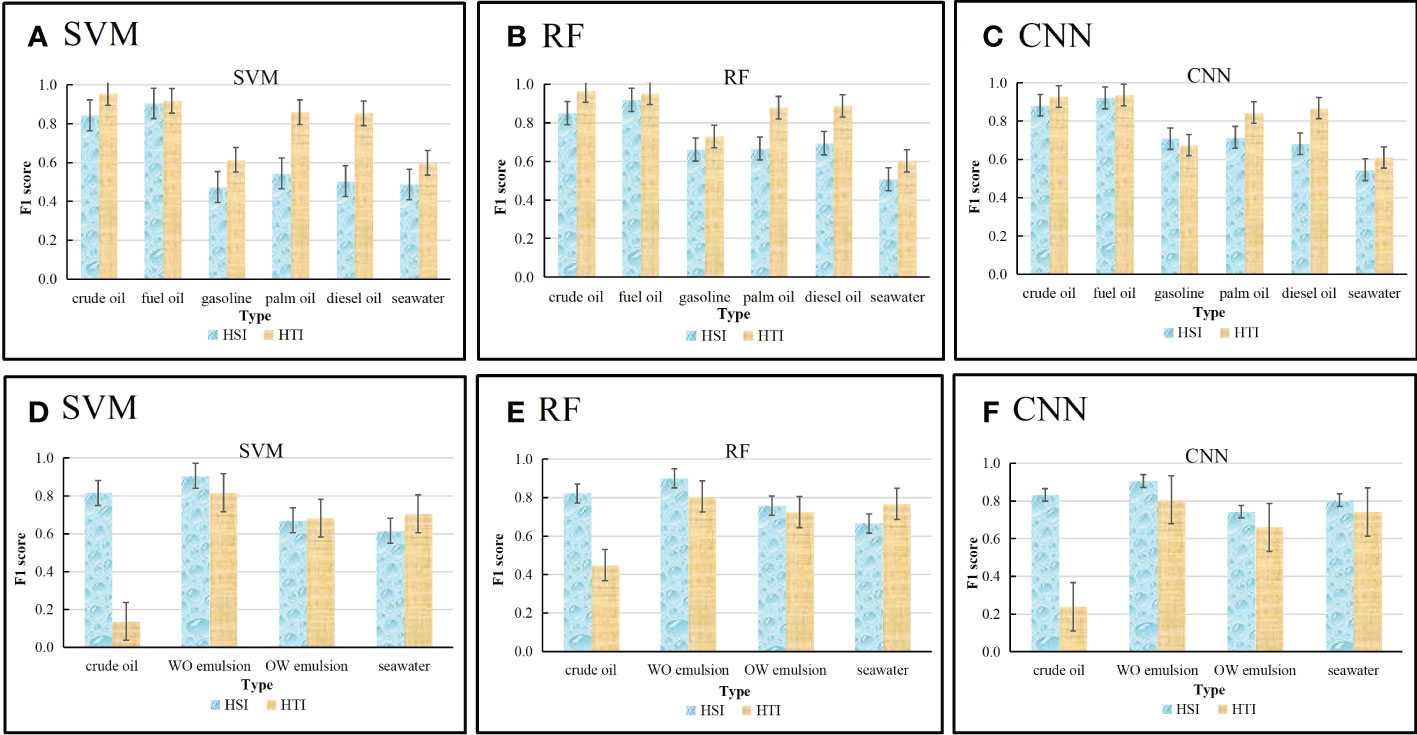
Figure 7 Identification accuracies of single oil spill pollution type based on HSI and HTI: (A–C) different oil products; (D–F) crude oil and its emulsions in different states.
Remote sensing reflectivity of five typical oil products, crude oil and its emulsions in different states, and seawater were obtained by ASD, of which the area around 1.4 μm and 1.9 μm is affected by the strong absorption zone of water, so the reflectivity within this range is abnormal. At the same time, considering the edge effect of the photosensitive devices used, irregular oscillations will occur at the end of the sensing spectrum of the spectrometer. Therefore, this paper studied the spectral response of oil spill in the spectral range of 360~1340 nm, 1440~1800 nm and 1980~2400 nm.
In general, the reflectivity of the five oil products and seawater is very small (Figure 8), which is related to the absorption properties of oil products and seawater. In the visible light band, the reflectance spectra of light oils such as diesel, gasoline and palm oil are generally consistent with those of seawater, and there is an obvious reflection peak at about 480 nm; The reflectivity of heavy oil such as crude oil and fuel oil are obviously lower than those of light oils and seawater. In the near-infrared and shortwave infrared bands, the reflectivity of the five oils are higher than that of seawater. This is because the pure natural water is nearly a “black body” in the near-infrared band. Therefore, in the spectral range of 850~2500 nm, the reflectivity of the purer natural water is very low, almost zero.
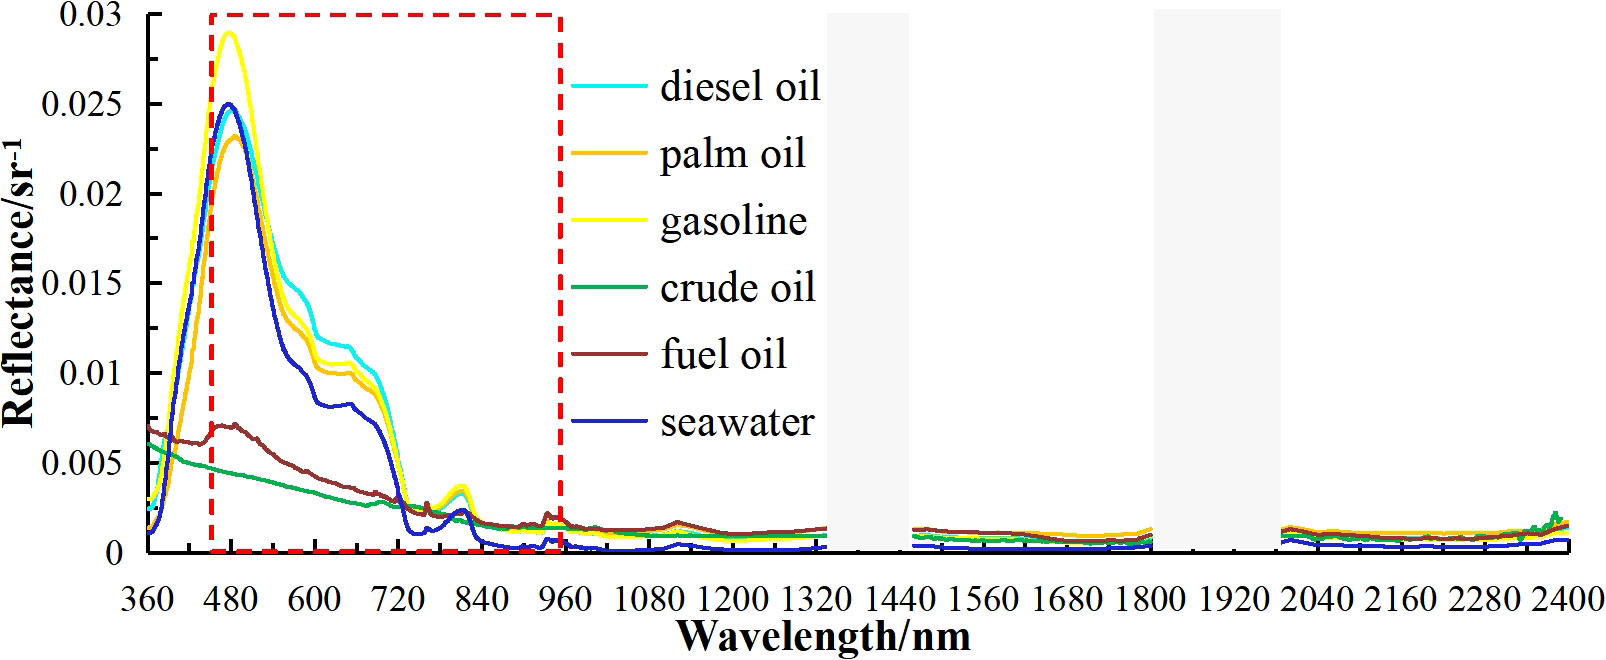
Figure 8 Mean spectral reflectance of typical oil products (The gray area is a non-atmospheric window, the red rectangular area represents the spectral range of airborne hyperspectral image).
Within the spectral range (450~950 nm) of the airborne hyperspectral image, the spectral curves of the three light oils and seawater are very similar. Therefore, based on the single dimensional characteristics of hyperspectral, the recognition results of the three algorithms for light oils (palm oil, diesel oil, gasoline) and seawater are poor, and the mixing phenomenon is serious. At the same time, the spectra of heavy oils and light oils are quite different, so except at the edge of the enclosure, the recognition accuracy of heavy oils such as crude oil and fuel oil based on the HSI is good, and there is little mixing with light oils and seawater.
In general, the spectral response of crude oil and its emulsions in different states and seawater in different spectral ranges is different (Figure 9), which is related to its absorption and scattering properties. WO emulsion contains seawater droplets. When incident light enters seawater droplets from oil film, it will produce strong backscattering. In the near infrared and short wave infrared spectra, the WO emulsion has higher reflectivity. In addition, due to the absorption of -C-H in WO emulsion, obvious reflection valleys are formed at ~1725 nm, ~1760 nm and ~2170 nm. In the OW emulsion, dispersed small oil droplets exist in continuous water, which makes it have high reflectivity in the spectral range of 360~1400 nm. At the same time, due to the absorption of -O-H, obvious reflection valleys are formed at ~975 nm and ~1200 nm. This is very close to the results obtained from the indoor experiment carried out by Lu et al. (2019). Due to the strong absorption and low reflection of incident light, the spectral reflectance of crude oil is low, especially in the near infrared band, the spectral reflectivity of crude oil is nearly zero.
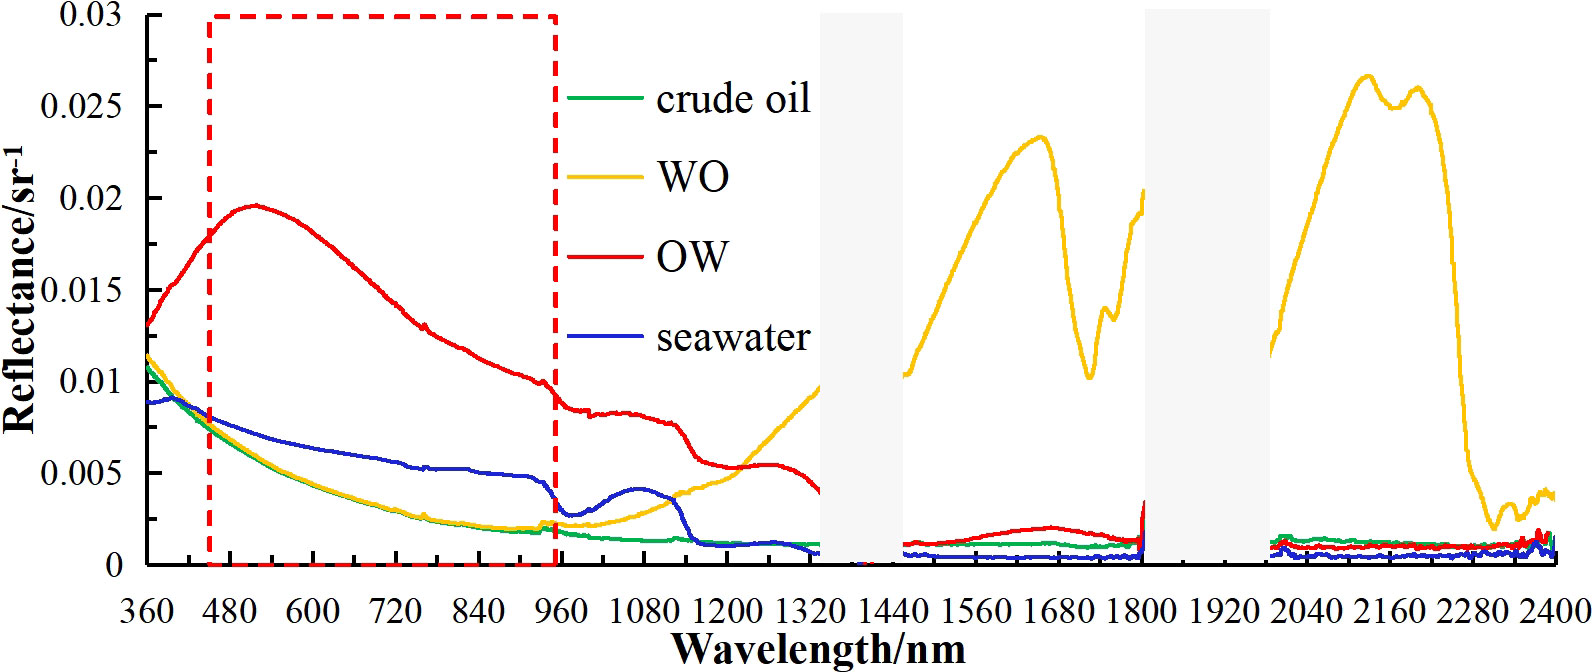
Figure 9 Mean spectral reflectance of crude oil and its emulsions in different states (The gray area is a non-atmospheric window, the red rectangular area represents the spectral range of airborne hyperspectral image).
In the spectral range of airborne hyperspectral images (450~950 nm), there are large differences in the spectral response of crude oil and its emulsion different states and seawater. Therefore, based on the HSI, three algorithms are used to identify WO emulsion, WO emulsion and seawater with good results. However, due to the high oil concentration of the stable WO emulsion, the spectral curve of the WO emulsion is very similar to that of the crude oil. Therefore, the WO emulsion is mixed with the crude oil in the classification and recognition results based on the HSI.
Because the heat capacity and infrared reflectance of oil film and seawater are different, there exists temperature difference between oil film and background seawater, which is the basis using infrared image to detect marine oil spill. It can be seen from Figure 3B that the heavy oils (crude oil and fuel oil) show a “bright” hue on the thermal infrared image, which is the most obvious difference from the seawater background, in which the crude oil shows “brightest”, and the fuel oil shows “brighter”. Light oils (palm oil, diesel oil and gasoline) is displayed as “dark” hue on the thermal infrared image. Diesel oil is “darker”, palm oil is “dark”, and gasoline is “darkest”. This is mainly related to the characteristics of the oil products themselves, the ability to absorption and radiation and other factors. Heavy oils can absorb more solar radiation and emit it in the form of thermal radiation.
There is a certain conversion relationship between intensity of thermal infrared image and brightness temperature. Here, intensity is used to replace brightness temperature to analyze the thermal response characteristics of different oils. It can be seen from Figure 10 that the thermal infrared radiation intensity of the five oil products and seawater from high to low is crude oil, fuel oil, diesel oil, palm oil, seawater and gasoline. The thermal infrared intensity of gasoline is lower than that of seawater, because gasoline volatilization will cause the surface temperature to drop. The thermal infrared intensity of crude oil and fuel oil are obviously higher than those of diesel oil, palm oil and gasoline. The thermal infrared intensity of the three kinds of light oils is quite different. It is precisely because of this difference that the mixing phenomenon between light oils in the recognition results of the HTI is greatly weakened. However, there is still a certain mixing phenomenon between gasoline and seawater, which is related to the strong volatility of gasoline.
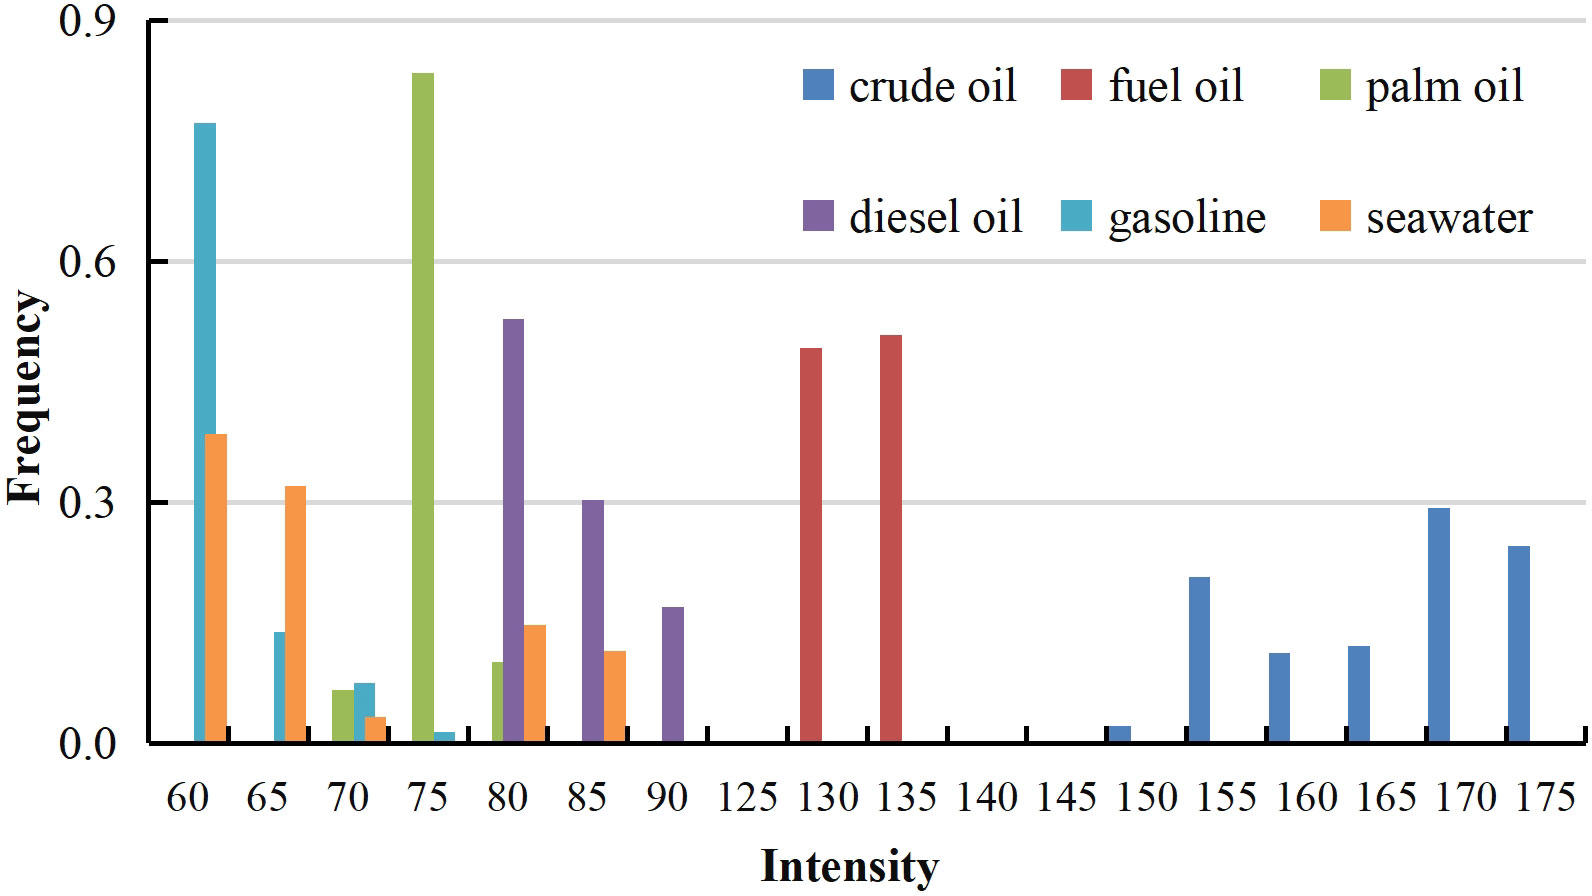
Figure 10 Thermal infrared intensity distribution of different oil products and seawater.
It can be seen from Figure 3D that the crude oil and WO emulsions show “bright” hue on the thermal infrared image, which is the most obvious difference from the seawater background. The OW emulsion and seawater show a “dark” hue on the thermal infrared image, among which, the oil in water emulsion is relatively “dark”, and the seawater is the “darkest”, which is mainly related to the concentration of oil. The higher the oil concentration, the more solar radiation absorbed and emitted in the form of thermal radiation.
The thermal infrared image of crude oil and its emulsion in different states was obtained using the Zemmuse H20T airborne thermal infrared imager. The brightness temperature analysis was carried out by selecting pixels of the same size for crude oil, WO emulsion, OW emulsion and seawater from the thermal infrared image. It can be seen from Figure 11 that the brightness temperature of crude oil and its emulsions in different states and seawater from high to low are crude oil, 90% WO emulsion, 75% WO emulsion, 60% WO emulsion, 0.1% OW emulsion and seawater. The brightness temperatures of crude oil and WO emulsions with different concentrations are close. The brightness temperature of OW emulsion and seawater is similar, but the brightness temperature of crude oil and WO emulsion is significantly different from that of OW emulsion and seawater, with an average difference of 20 °C. It is precisely because the brightness temperature difference between crude oil and WO emulsions of different concentrations is not obvious, which makes the mixing phenomenon of crude oil and WO emulsions enhanced in the recognition results of the HTI, so the vast majority of crude oil is wrongly divided into WO emulsions. This shows that thermal infrared remote sensing technology cannot be used to distinguish crude oil and WO emulsion, which is consistent with the conclusion reached by Jiao et al. (2021).
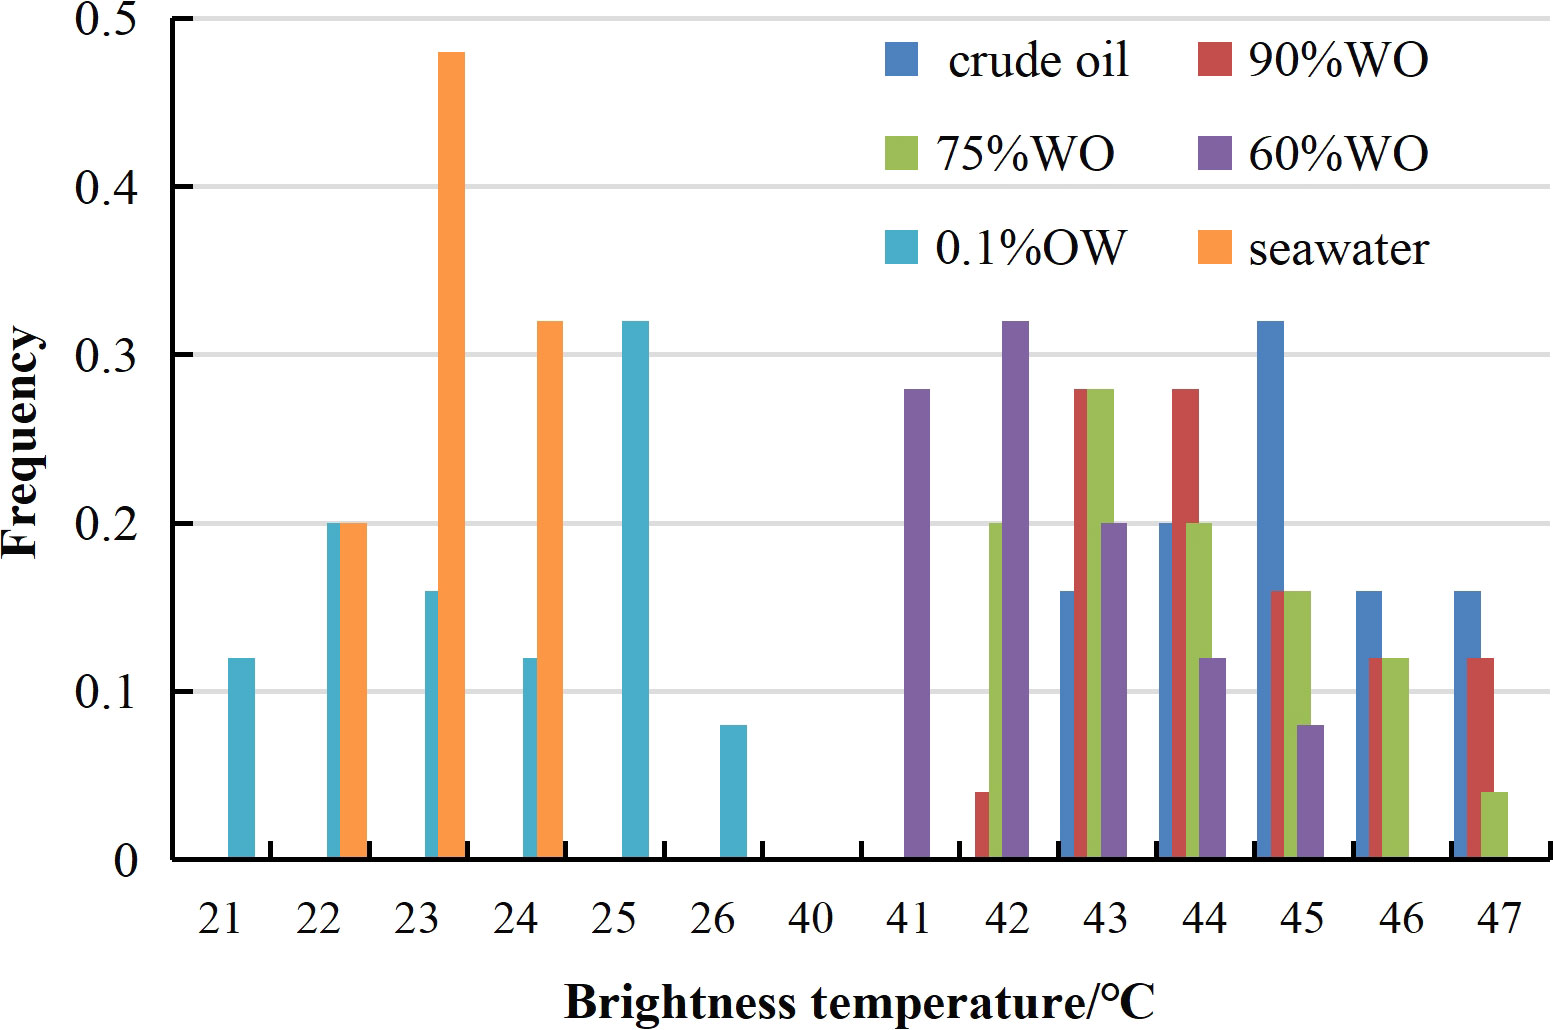
Figure 11 Thermal infrared brightness and temperature distribution of crude oil and its different emulsions and seawater.
In order to explain the identification results of different oil spill pollution types using the HTI, the spectral and brightness temperature characteristics of different oils, crude oil and its emulsions in different states have been analyzed and discussed in the previous section. Here we further analyze and discuss the spectral and brightness temperature characteristics of oil films with different thicknesses, which can be used to explain the possible results of oil film thickness classification using the HTI.
It can be seen from Figure 12 that the spectral curves of oil films with different thicknesses are generally the same. With the increase of wavelength, the spectral reflectance of crude oil decreases gradually. Similarly, with the increase of oil film thickness, the spectral reflectance of crude oil decreases gradually. In the spectral range of airborne hyperspectral images (450~950 nm), the spectral responses of oil films with different thicknesses exist difference. Therefore, theoretically, the classification results of oil films with different thicknesses should be good based on the HSI. It can be seen from Figure 13 that the brightness temperature of oil film with different thickness is different, which increases with the increase of oil film thickness, and the brightness temperature difference is greater than 1°C. In theory, the addition of thermal infrared features will enhance the recognition ability of oil films with different thicknesses. The combination of hyperspectral and thermal infrared remote sensing can be used to classify and identify oil film with different thickness on the sea surface.
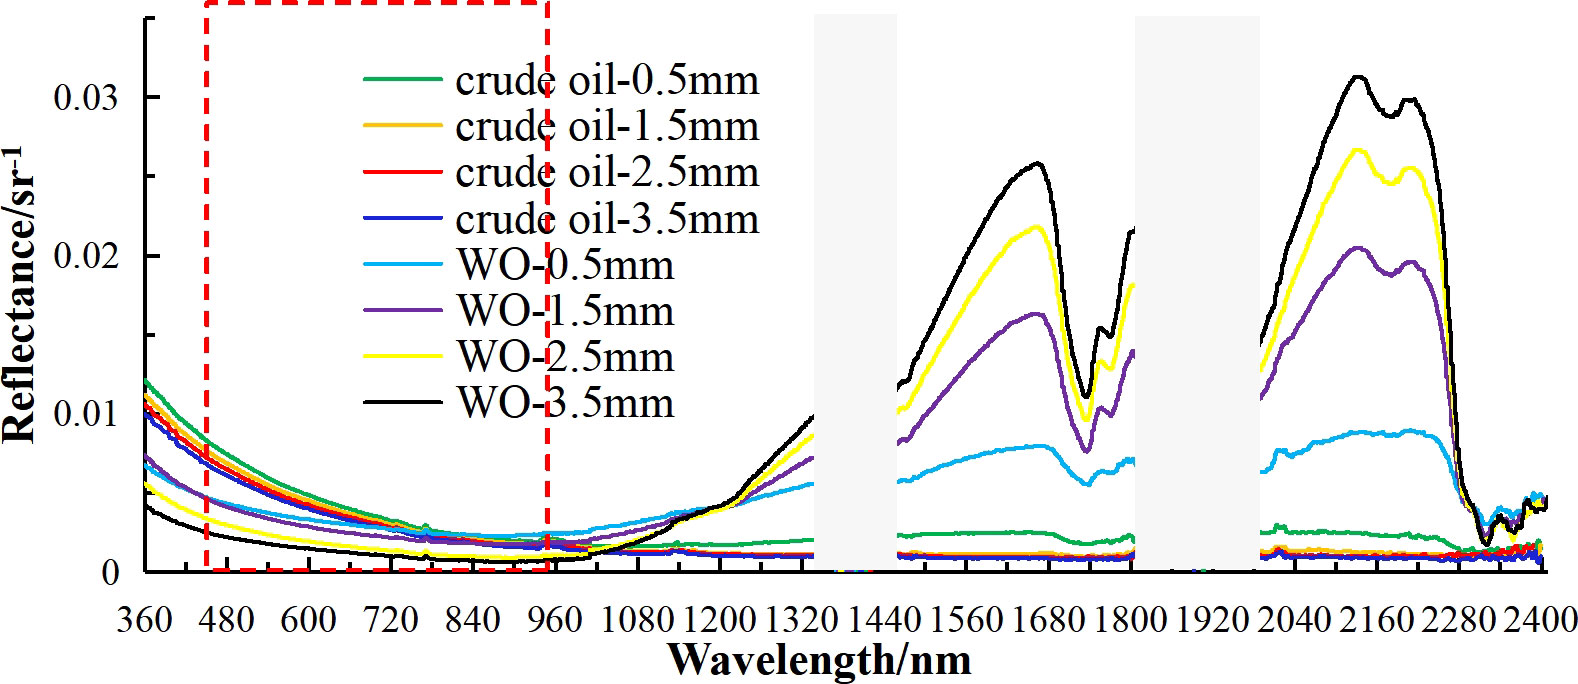
Figure 12 Spectral reflectance of crude oil film with different thickness and WO emulsion with different thickness at the same concentration (The gray area is a non-atmospheric window, the red rectangular area represents the spectral range of airborne hyperspectral image).
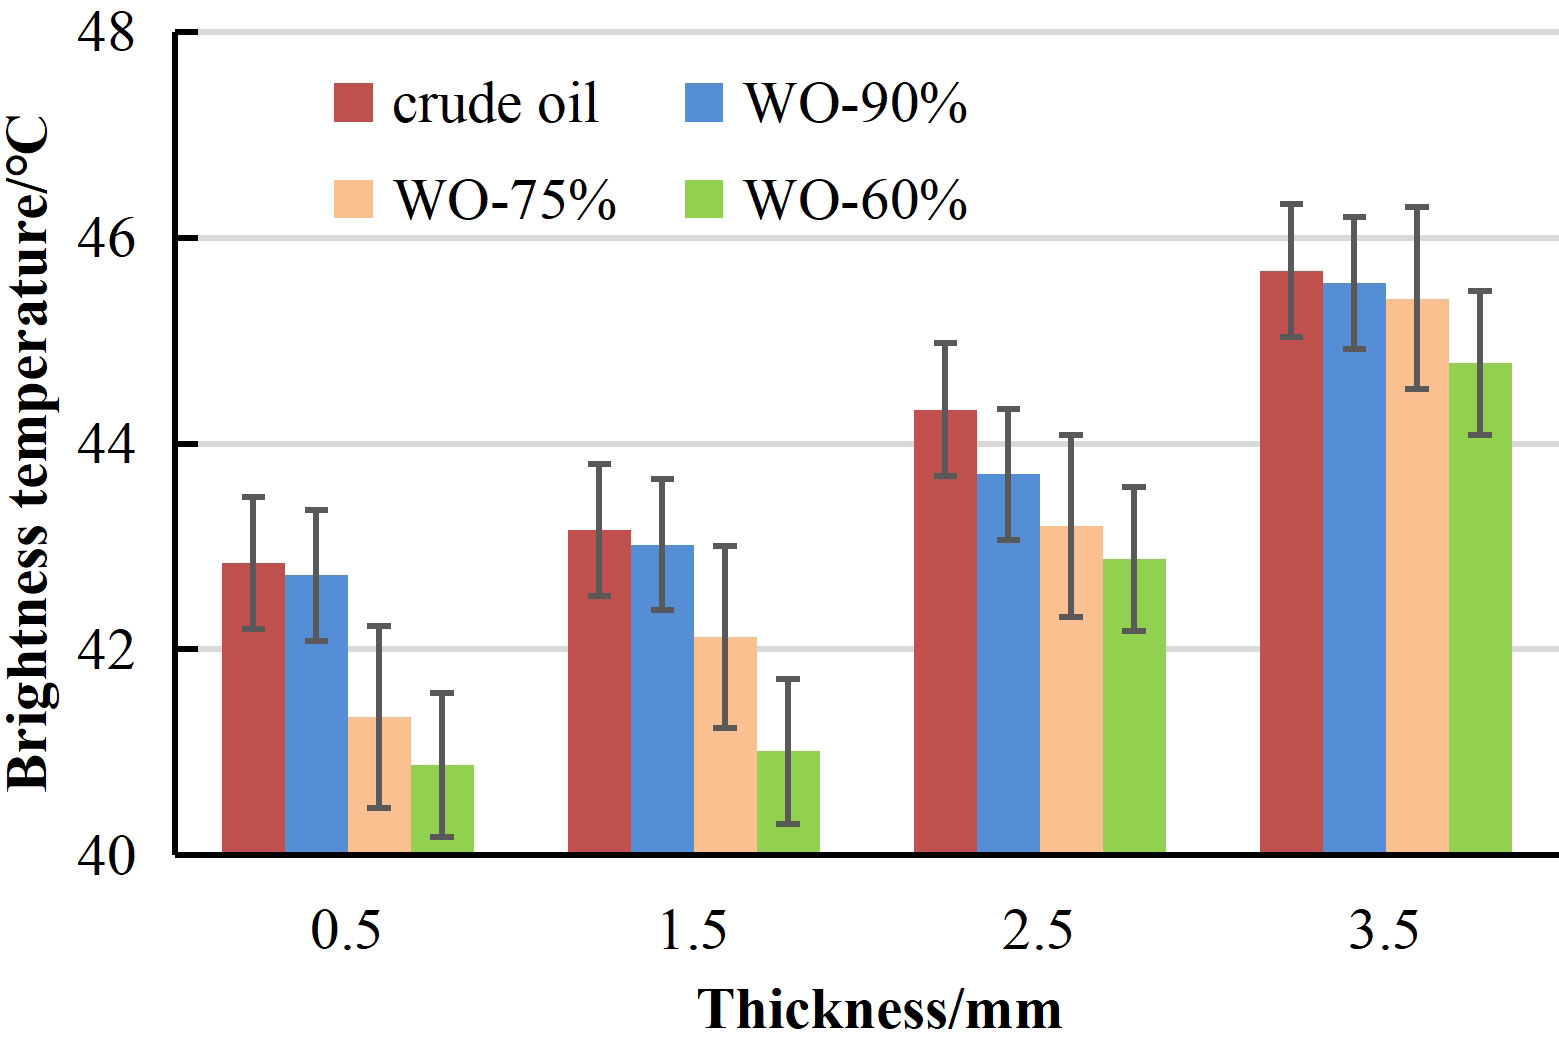
Figure 13 Thermal infrared brightness and temperature of crude oil film with different thickness and WO emulsion with different thickness at the same concentration.
Here, in order to explain the possible classification results of WO with different thicknesses at the same concentration using hyperspectral and thermal infrared remote sensing, the spectral and brightness temperature characteristics of WO emulsions with different thicknesses at the same concentration are analyzed and discussed. It can be seen from Figure 12 that, taking WO emulsions with a concentration of 60% as an example, the spectral curves of WO emulsions with different thickness at the same concentration are generally consistent. In the spectral range before 1200 nm, the spectral reflectance of WO emulsions decreases gradually with the increase of oil film thickness; In the near-infrared range after 1200 nm, the spectral reflectance of WO emulsions increases gradually with the increase of oil film thickness.
In the spectral range of airborne hyperspectral images (450~950 nm), the spectral responses of WO emulsions with different thicknesses at the same concentration are different. Therefore, theoretically, the classification results of oil films with different thicknesses should be good based on the HSI. It can be seen from Figure 13 that the brightness temperature of WO emulsions with different thicknesses at the same concentration is different, which increases with the increase of oil film thickness. However, the brightness temperature difference is not all greater than 1°C, and there may be mixing between oil films with different thicknesses. In conclusion, theoretically, the addition of thermal infrared features may enhance the recognition ability of WO emulsions with different thicknesses at the same concentration.
In this paper, we designed and implemented two outdoor oil spill simulation experiment, carried out the extraction and analysis of hyperspectral and thermal infrared multidimensional optical features of different oil spill pollution types, constructed hyperspectral oil spill pollution type recognition algorithm based on traditional machine learning, ensemble learning, and deep learning model, and explored how to improve the ability of hyperspectral oil spill pollution type identification by adding thermal infrared features. At the same time, the classification ability of hyperspectral combined with thermal infrared remote sensing for different oil film thicknesses and WO emulsions with different thicknesses at the same concentration is also discussed. The main conclusions can be drawn as follows: (1) The addition of thermal infrared features can effectively improve the hyperspectral recognition ability of different oils (crude oil, fuel oil, palm oil, diesel oil, gasoline), especially light oils. Among them, the F1 scores of gasoline, palm oil and diesel oil are increased by 0.07, 0.21 and 0.20 respectively, the F1 scores of crude oil and fuel oil are increased by 0.11 and 0.03 respectively, and the F1 scores of seawater are increased by 0.09. (2) Thermal infrared remote sensing technology cannot be used to distinguish crude oil and high concentration WO emulsions. The addition of thermal infrared features will reduce the recognition effect of hyperspectral on crude oil and WO emulsions; (3) Through the analysis of the spectral characteristics and brightness temperature characteristics of oil films with different thicknesses and WO emulsions with different thicknesses at the same concentration, it is theoretically shown that the thermal infrared characteristics can enhance the ability of hyperspectral classification of oil films with different thicknesses and WO emulsions with different thicknesses at the same concentration.
This paper analyzes the spectral characteristics and brightness temperature characteristics of oil films with different thicknesses and WO emulsions with different thicknesses at the same concentration, and obtains corresponding theoretical conclusions. Next, in order to verify the relevant theories and obtain reliable conclusions, we will use airborne hyperspectral images and airborne thermal infrared images to identify oil films with different thicknesses and WO emulsions with different thicknesses at the same concentration.
Affected by the weather, complex marine environment and lighting conditions, the data obtained by optical remote sensing during the oil spill accident is limited. In the case of few samples, sample self-learning and expansion is a problem worthy of attention, and machine learning models in the case of limited samples should also be concerned. At the same time, facing the needs of oil spill remote sensing business monitoring, transfer learning model based on historical oil spill remote sensing data should be explored to achieve marine oil spill monitoring without samples.
The raw data supporting the conclusions of this article will be made available by the authors, without undue reservation.
JY and ZJ designed outdoor oil spill simulation experiments, JY and YH designed the method with experiments, and JY wrote the manuscript. JY and YH revised the manuscript according to the comments of reviewers. The manuscript was supervised by YH, JZ, YM and ZL. All authors contributed to the article and approved the submitted version.
This research was supported by National Natural Science Foundation of China (No. U1906217, No. 42206177, No. 61890964), Fund of Technology Innovation Center for Ocean Telemetry, Ministry of Natural Resources (No. 2022004), Shandong Provincial Natural Science Foundation (No. ZR2022QD075), Qingdao Postdoctoral Application Research Project (No. qdyy20210082, No. QDBSH202105) and the Fundamental Research Funds for the Central Universities (No. 21CX06057A).
We would like to express our sincere appreciation to the editor and reviewers who provided valuable comments to help improve this paper.
The authors declare that the research was conducted in the absence of any commercial or financial relationships that could be construed as a potential conflict of interest.
All claims expressed in this article are solely those of the authors and do not necessarily represent those of their affiliated organizations, or those of the publisher, the editors and the reviewers. Any product that may be evaluated in this article, or claim that may be made by its manufacturer, is not guaranteed or endorsed by the publisher.
Alpers W., Holt B., Zeng K. (2017). Oil spill detection by imaging radars: Challenges and pitfalls. Remote Sens. Environ. 201, 133–147. doi: 10.1016/j.rse.2017.09.002
Cui C., Li Y., Liu B. X., Li G. N., Salehi B., Kainz W. (2017). A new endmember preprocessing method for the hyperspectral unmixing of imagery containing marine oil spills. ISPRS Int. J. Geo-Inf 69, 286. doi: 10.3390/ijgi6090286
Duan P. H., Lai J. B., Kang J., Kang X. D., Ghamisi P., Li S. T. (2020). Texture-aware total variation-based removal of sun glint in hyperspectral images. ISPRS J. Photogrammetry Remote Sens. 166, 359–372. doi: 10.1016/j.isprsjprs.2020.06.009
Fingas M., Brown C. (2014). Review of oil spill remote sensing. Mar. pollut. Bull. 831, 9–23. doi: 10.1016/j.marpolbul.2014.03.059
French-McCay D. P., Frediani M., Gloekler M. D. (2022). Modeling emulsification influence on oil properties and fate to inform effective spill response. Front. Environ. Sci. 10. doi: 10.3389/fenvs.2022.90898
Guo G., Liu B. X., Liu C. Y. (2020). Thermal infrared spectral characteristics of bunker fuel oil to determine oil-film thickness and API. J. Mar. Sci. Eng. 82, 135. doi: 10.3390/jmse8020135
Hu C. M., Lu Y. C., Sun S. J., Liu Y. X. (2021). Optical remote sensing of oil spills in the ocean: what is really possible? J. Remote Sens. 2021, 9141902. doi: 10.34133/2021/9141902
Hu Y. B., Zhang J., Ma Y., An J. B., Ren G. B., Li X. M. (2019a). Hyperspectral coastal wetland classification based on a multi-object convolutional neural network model and decision fusion. IEEE Geosci. Remote Sens. Lett. 167, 1110–1114. doi: 10.1109/LGRS.2018.2890421
Hu Y. B., Zhang J., Ma Y., Li X. M., Sun Q. P., An J. B. (2019b). Deep learning classification of coastal wetland hyperspectral image combined spectra and texture features: a case study of yellow river estuary wetland. Acta Oceanol Sin. 385, 142–150. doi: 10.1007/s13131-019-1445-z
Jiang Z. C., Ma Y., Yang J. F. (2020). Inversion of the thickness of crude oil film based on an OG-CNN model. J. Mar. Sci. Eng. 89, 653. doi: 10.3390/jmse8090653
Jiang Z. C., Zhang J., Ma Y., Mao X. P. (2021). Hyperspectral remote sensing detection of marine oil spills using an adaptive long-term moment estimation optimizer. Remote Sens. 141, 157. doi: 10.3390/RS14010157
Jiao J. N., Lu Y. C., Hu C. M., Shi J., Sun S. J., Liu Y. X. (2021). Quantifying ocean surface oil thickness using thermal remote sensing. Remote Sens. Environ. 2611, 112513. doi: 10.1016/J.RSE.2021.112513
Jing Y., An J. B., Liu Z. X. (2011). A novel edge detection algorithm based on global minimization active contour model for oil slick infrared aerial image. IEEE Trans. Geosci. Remote Sens. 496, 2005–2013. doi: 10.1109/TGRS.2010.2103671
Lai Q. Z., Xie Y. M., Wang C. G., Wang M., Tan J. Y. (2021). Multiband directional reflectance properties of oil-in-water emulsion: application for identification of oil spill types. Appl. optics 6023, 6902–6909. doi: 10.1364/AO.427978
Leifer I., Lehr W. J., Simecek-Beatty D., Bradley E., Clark R., Dennison P., et al. (2012). State of the art satellite and airborne marine oil spill remote sensing: Application to the BP deepwater horizon oil spill. Remote Sens. Environ. 1249, 185–209. doi: 10.1016/j.rse.2012.03.024
Li Y., Lu H. M., Zhang Z. D., Liu P. (2020). A novel nonlinear hyperspectral unmixing approach for images of oil spills at sea. Int. J. Remote Sens. 4112, 4684–4701. doi: 10.1080/01431161.2020.1723179
Li Y., Yu Q., Xie M., Zhang Z. D., Ma Z. J., Cao K. (2021). Identifying oil spill types based on remotely sensed reflectance spectra and multiple machine learning algorithms. IEEE J. Sel Topics Appl. Earth Observ Remote Sens. 14, 9071–9078. doi: 10.1109/JSTARS.2021.3109951
Li K., Yu H. L., Xu Y. Q., Luo X. Q. (2022). Detection of oil spills based on gray level co-occurrence matrix and support vector machine. Front. Environ. Sci. 10. doi: 10.3389/fenvs.2022.1049880
Lu Y. C., Hu C. M., Sun S. J., Zhang M. W., Zhou Y., Shi J., et al. (2016a). Overview of optical remote sensing of marine oil spills and hydrocarbon seepage. J. Remote Sens. 205, 1259–1269. doi: 10.11834/jrs.20166122
Lu Y. C., Li X., Tian Q., Zheng G., Sun S. J., Liu Y. X., et al. (2013a). Progress in marine oil spill optical remote sensing: detected targets, spectral response characteristics, and theories. Mar. Geodesy 363, 334–346. doi: 10.1080/01490419.2013.793633
Lu Y. C., Liu J. Q., Ding J., Shi J., Chen J., Ye X. (2019a). Optical remote identification of spilled oils from the SANCHI oil tanker collision in the East China Sea (in Chinese). China Sci. Bull. 6431, 3213–3222. doi: 10.1360/N972019-00094
Lu Y. C., Shi J., Wen Y. S., Hu C. M., Liu Y. X. (2019b). Optical interpretation of oil emulsions in the ocean-part I: Laboratory measurements and proof-of-concept with AVIRIS observations. Remote Sens. Environ. 230, 111183. doi: 10.1016/j.rse.2019.05.002
Lu Y. C., Shi J., Wen Y. S., Zhang M. W., Sun S. J., Liu Y. X. (2020). Optical interpretation of oil emulsions in the ocean-part II: Applications to multi-band coarse-resolution imagery. Remote Sens. Environ. 242, 111778. doi: 10.1016/j.rse.2020.111778
Lu Y. C., Sun S. J., Zhang M. W., Murch B., Hu C. M. (2016b). Refinement of the critical angle calculation for the contrast reversal of oil slicks under sunglint. J. Geophys Res: Oceans 1211, 148–161. doi: 10.1002/2015JC011001
Lu Y. C., Tian Q. J., Wang X. Y., Zheng G., Li X. (2013b). Determining oil slick thickness using hyperspectral remote sensing in the bohai Sea of China. Int. J. Digital Earth 61, 76–93. doi: 10.1080/17538947.2012.695404
Lu Y. C., Zhan W., Hu C. M. (2016c). Detecting and quantifying oil slick thickness by thermal remote sensing: A ground-based experiment. Remote Sens. Environ. 181, 207–217. doi: 10.1016/j.rse.2016.04.007
Ma X. S., Xu J. G., Wu P. H., Kong P. (2021). Oil spill detection based on deep convolutional neural networks using polarimetric scattering information from sentinel-1 SAR images. IEEE Trans. Geosci. Remote Sens. 60, 4204713. doi: 10.1109/TGRS.2021.3126175
Marghany M. (2014). Utilization of a genetic algorithm for the automatic detection of oil spill from RADARSAT-2 SAR satellite data. Mar. pollut. Bull. 891, 20–29. doi: 10.1016/j.marpolbul.2014.10.041
Mdakane L. W., Kleynhans W. (2020). Feature selection and classification of oil spill from vessels using sentinel-1 wide-swath synthetic aperture radar data. IEEE Geosci. Remote Sens. Lett. 19, 4002505. doi: 10.1109/LGRS.2020.3025641
Mohammadi M., Sharifi A., Hosseingholizadeh M., Tariq A. (2021). Detection of oil pollution using SAR and optical remote sensing imagery: a case study of the Persian gulf. J. Indian Soc. Remote Sens. 4910, 2377–2385. doi: 10.1007/S12524-021-01399-2
Pärt S., Kankaanpää H., Björkqvist J. V., Uiboupin R. (2021). Oil spill detection using fluorometric sensors: Laboratory validation and implementation to a ferrybox and a moored smartbuoy. Front. Mar. Sci. 8. doi: 10.3389/fmars.2021.778136
Rajendran S., Vethamony P., Sadooni F., Al-Saad A. H., Jassim A., Vashist S., et al. (2021). Detection of wakashio oil spill off Mauritius using sentinel-1 and 2 data: Capability of sensors, image transformation methods and mapping. Environ. Pollut. 274, 116618. doi: 10.1016/J.ENVPOL.2021.116618
Shen Y. F., Liu J. Q., Ding J., Jiao J. N., Sun S. J., Lu Y. C. (2020). HY-1 CCOCTS and CZI observation of marine oil spills in the south China Sea. J. Remote Sens. 248, 933–944. doi: 10.11834/jrs.20209475
Shi J., Jiao J. N., Lu Y. C., Zhang M. W., Mao Z. H., Liu Y. X. (2018). Determining spectral groups to distinguish oil emulsions from sargassum over the gulf of Mexico using an airborne imaging spectrometer. ISPRS J. Photogr Remote Sens. 146, 251–259. doi: 10.1016/j.isprsjprs.2018.09.017
Silva F. R., Schiavetti A., Malhado A. C. M., Ferreira B., Sousa C. V. P., Vieira F. P., et al. (2022). Oil spill and socioeconomic vulnerability in marine protected areas. Front. Mar. Sci. 9. doi: 10.3389/fmars.2022.85969
Song M. P., Cai L. F., Lin B., An J. B., Chang C. (2016). “Hyperspectral oil spill image segmentation using improved region-based active contour model,” in 2016 IEEE International Geoscience and Remote Sensing Symposium (IGARSS 2016). (Beijing, China: IEEE), 6352–6355. doi: 10.1109/IGARSS.2016.7730660
Sun S. J., Hu C. M. (2016). Sun glint requirement for the remote detection of surface oil films. Geophys Res. Lett. 431, 309–316. doi: 10.1002/2015GL066884
Velotto D., Migliaccio M., Nunziata F., Lehner S. (2011). Dual-polarized TerraSAR-X data for oil-spill observation. IEEE Trans. Geosci. Remote Sens. 4912, 4751–4762. doi: 10.1109/TGRS.2011.2162960
Wang Y. B., Du P. P., Liu J. Q., Chen C. T. (2022). Spatial variation of coastal wetland vulnerability to oil spill stress in the bohai Sea. Front. Mar. Sci. 9. doi: 10.3389/fmars.2022.107
Wang X. L., Du P. J., Tan K. (2011). Research on training sample selection in SVM classification of hyperspectral remote sensing image. Sci. Surveying Mapp. 03, 127–129.
Wang G. C., Gao C. (2020). Airborne ocean oil spill detection mission system. Ind. Technol. Innovation 73, 97–101. doi: 10.14103/j.issn.2095-8412.2020.03.018
Wang M. Q., Hu C. M. (2015). Extracting oil slick features from VIIRS nighttime imagery using a gaussian filter and morphological constraints. IEEE Geosci. Remote Sens. Lett. 1210, 2051–2055. doi: 10.1109/LGRS.2015.2444871
Wang B., Shao Q. F., Song D. M., Li Z. W., Tang Y. H., Yang C. L., et al. (2021). A spectral-spatial features integrated network for hyperspectral detection of marine oil spill. Remote Sens. 138, 1568. doi: 10.3390/rs13081568
Wang L. F., Xin L. P., Yu B., Ju L., Wei L. (2021). A novel method for determination of the oil slick area based on visible and thermal infrared image fusion. Infrared Phys. Technol. 119, 103915. doi: 10.1016/J.INFRARED.2021.103915
Washburn T. W., Yoskowitz D. W., Montagna P. A. (2018). Valuing nature waste removal in the offshore environment following the deepwater horizon oil spill. Front. Mar. Sci. 5. doi: 10.3389/fmars.2018.0047
Wettle M., Daniel P. J., Logan G. A., Thankappan M. (2009). Assessing the effect of hydrocarbon oil type and thickness on a remote sensing signal: A sensitivity study based on the optical properties of two different oil types and the HYMAP and quickbird sensors. Remote Sens. Environ. 113, 2000–2010. doi: 10.1016/j.rse.2009.05.010
Yang J. F., Hu Y. B., Ma Y., Li Z. W., Zhang J. (2022a). “Research on oil spill pollution type identification using RPnet deep learning model and airborne hyperspectral image,” in 2022 IEEE International Geoscience and Remote Sensing Symposium (IGARSS 2022). (Kuala Lumpur, Malaysia: IEEE), 807–810. doi: 10.1109/IGARSS46834.2022.9883530
Yang J. F., Ma Y., Hu Y. B., Jiang Z. C., Zhang J., Wan J. H., et al. (2022b). Decision fusion of deep learning and shallow learning for marine oil spill detection. Remote Sens. 143, 666. doi: 10.3390/RS14030666
Yang J. F., Wan J. H., Ma Y., Jiang Z. C., Hu Y. B. (2021). Accuracy assessments of hyperspectral characteristic waveband for common marine oil spill types identification. Mar. Sci. 454, 97–105. doi: 10.11759/hykx20200720003
Yang J. F., Wan J. H., Ma Y., Zhang J., Hu Y. B. (2020). Characterization analysis and identification of common marine oil spill types using hyperspectral remote sensing. Int. J. Remote Sens. 4118, 7163–7185. doi: 10.1080/01431161.2020.1754496
Yang J. F., Wan J. H., Ma Y., Zhang J., Jiang Z. C. (2019). Oil spill hyperspectral remote sensing detection based on DCNN with multi-scale features. J. Coast. Res. 90 (sp1), 332–339. doi: 10.2112/SI90-042.1
Zhong Z. X., You F. Q. (2011). Oil spill response planning with consideration of physicochemical evolution of the oil slick: a multiobjective optimization approach. Comput. Chem. Eng. 358, 1614–1630. doi: 10.1016/j.compchemeng.2011.01.009
Zhu X. Y., Li Y., Zhang Q., Liu B. X. (2019). Oil film classification using deep learning-based hyperspectral remote sensing technology. ISPRS Int. J. Geo-Inf 84, 181. doi: 10.3390/ijgi8040181
Keywords: marine oil spills, hyperspectral remote sensing, thermal infrared remote sensing, oil pollution types identification, deep learning
Citation: Yang J, Hu Y, Zhang J, Ma Y, Li Z and Jiang Z (2023) Identification of marine oil spill pollution using hyperspectral combined with thermal infrared remote sensing. Front. Mar. Sci. 10:1135356. doi: 10.3389/fmars.2023.1135356
Received: 31 December 2022; Accepted: 06 March 2023;
Published: 17 March 2023.
Edited by:
Hong Song, Zhejiang University, ChinaReviewed by:
Renliang Huang, Tianjin University, ChinaCopyright © 2023 Yang, Hu, Zhang, Ma, Li and Jiang. This is an open-access article distributed under the terms of the Creative Commons Attribution License (CC BY). The use, distribution or reproduction in other forums is permitted, provided the original author(s) and the copyright owner(s) are credited and that the original publication in this journal is cited, in accordance with accepted academic practice. No use, distribution or reproduction is permitted which does not comply with these terms.
*Correspondence: Junfang Yang, eWFuZ2p1bmZhbmdAdXBjLmVkdS5jbg==
†These authors have contributed equally to this work and share first authorship
Disclaimer: All claims expressed in this article are solely those of the authors and do not necessarily represent those of their affiliated organizations, or those of the publisher, the editors and the reviewers. Any product that may be evaluated in this article or claim that may be made by its manufacturer is not guaranteed or endorsed by the publisher.
Research integrity at Frontiers
Learn more about the work of our research integrity team to safeguard the quality of each article we publish.