 Youjung Oh
 Sang Myeong Oh2
 Il-Ju Moon
- 1Typhoon Research Center/Graduate School of Interdisciplinary Program in Marine Meteorology, Jeju National University, Jeju, Republic of Korea
- 2Forecast Research Department, National Institute of Meteorological Sciences, Jeju, Republic of Korea
The maximum significant wave height () induced by a tropical cyclone (TC) can be estimated from an empirical fetch formula using the TC’s size, maximum wind speed, and translation speed, in which larger, stronger, and faster-moving TCs generally have higher the . In the formula, the radius of maximum wind (RMW) has been widely used as the TC size parameter under the assumption that is mainly generated by strong winds near the RMW. This study investigates whether RMW is the optimal parameter for determining TC-induced through extensive wave model simulations for North Atlantic hurricanes from 1988–2017. The correlation analysis between the estimated and TC size parameters revealed that the radius of the 34-kt wind speed (R34, r = 0.84–0.95) was much higher than the widely used RMW (r = 0.33–0.58), which suggests that R34 is a more important TC size parameter for determining TC-induced than RMW. This result can be explained by the fact that R34 showed a significantly higher correlation (r = 0.96) than RMW (r = 0.31) with cumulative TC wind speeds, which are closely related to . These findings also indicate that the TC-induced is more affected by the region containing moderately strong winds outside the TC than by the region of maximum wind speed near the RMW. Our paper provides additional insight into the mechanisms by which extreme wave heights, which cause severe damage during TC passage, occur.
1 Introduction
Tropical cyclones (TCs) with spatially compact and well-formed vortex structures are one of the major extreme meteorological events that can generate large and potentially destructive ocean surface waves (Moon et al., 2003). The highest recorded significant wave heights (maximum crest-to-trough wave heights) resulting from TCs are 23.9 m (32.3 m) in the western North Pacific and 17.9 m (27.7 m) in the North Atlantic (Wang et al., 2005; Liu et al., 2008; Moon et al., 2016), observed during Typhoon Korosa (2007) and Hurricane Ivan (2004), respectively. With regard to TC disaster prevention, improving the forecasts of TC-generated high waves is an essential step toward minimizing the damage caused by TCs to coastal settlements and economic activities in the nearshore zone. In particular, it is important to accurately predict the maximum significant wave height () caused by TCs and to understand its generation mechanism, as it is a major factor that determines design waves, which are widely used in the engineering field (Kim et al., 2008; Lee and Kim, 2015).
Since TC wind fields can be parameterized in a relatively simple form, many studies have attempted to describe the wave field in a similarly parametric form (Young, 1988; Young and Burchell, 1996; Alves et al., 2004; Young and Vinoth, 2013; Hwang, 2016; Young, 2017; Hwang and Walsh, 2018). These attempts can help elucidate the mechanism of occurrence caused by TCs. Several studies have introduced the concept of “extended (or trapped) fetch” in developing parametric models (King and Shemdin, 1978; Young, 1988; Young and Burchell, 1996; Alves et al., 2004; Bowyer and MacAfee, 2005; MacAfee and Bowyer, 2005; Young and Vinoth, 2013; Hwang, 2016; Hwang and Fan, 2017; Lee et al., 2017; Hwang and Walsh, 2018). King and Shemdin (1978) first proposed the key concept of extended fetch within TCs using aircraft-based NASA Scanning Radar Altimeter observation data. They showed that to the right of the storm center (in the Northern Hemisphere), the wind direction approximately aligns with the direction of propagation of the storm; in this region, the waves propagate forward with the storm and consequently remain within the intense wind regions of the storm for an extended period, which leads to an “extended” fetch. If the propagation speed of the waves (i.e., group velocity) is comparable to the velocity of the forward movement of the storm, the waves remain “locked” to the TC, which results in extended or trapped fetch (Young, 2017).
Based on these concepts, Young (1988) proposed a parametric model to estimate the TC-induced that has been widely used as a guideline for emergency management (Alves et al., 2004). Using a synthetic database created by numerical model runs, Young defined the equivalent fetch for typical TCs, which is a function of the maximum wind speed (MWS) and the translation speed of the storm (Vfm ). The equivalent fetch is normalized by a scaling parameter that is related to the radius of maximum wind (RMW) representing the size of the TC system (Alves et al., 2004; Young, 2017). With the equivalent fetch defined, Young (1988) used the JONSWAP relationship (Hasselmann et al., 1973) to determine the within the TC. The parametric model of Young (1988) has been adopted in many engineering studies because it successfully captures the important physics of TCs. Recently, Alves et al. (2004) proposed an advanced parametric model based on wave simulations using a moving-grid version of the WAVEWATCH III model, a third-generation wave model. The model included RMW as an additional parameter in defining the equivalent fetch, along with MWS and storm translation speed (Vfm ), unlike Young (1988), who used RMW as a scaling parameter. This idea is based on the fact that wind field curvature affects the effective fetch. That is, if RMW is small, the wind field curvature is large, which produces a smaller equivalent fetch since waves propagate in straight lines.
Besides RMW, there are various TC size parameters, such as wind radii at 34 knots (R34), 50 knots (R50), and 64 knots (R64) (see Figure 1; Sampson et al., 2018). Among the parameters, most studies used RMW as a scaling parameter or a proxy representing the curvature of the TC wind field without questioning whether RMW is an optimal representative TC size parameter that influences extended fetch for TCs. The use of RMW basically assumes that larger RMW values result in higher values within the TC due to longer “accumulated fetches” (Young, 2017). However, in many cases, this assumption does not hold true. For example, for the two TCs (Cases A and B) in Figure 1, RMW is greater in A than in B, but the resulting is less in A than in B. This result occurred because although A has a larger RMW, it has smaller R64, R50, and R34 values than B and thus a smaller total cumulative wind (see Figure 1; this will be discussed in detail in a later section). This simple example suggests that the TC size parameter that most strongly influences for translating TCs may not be RMW.
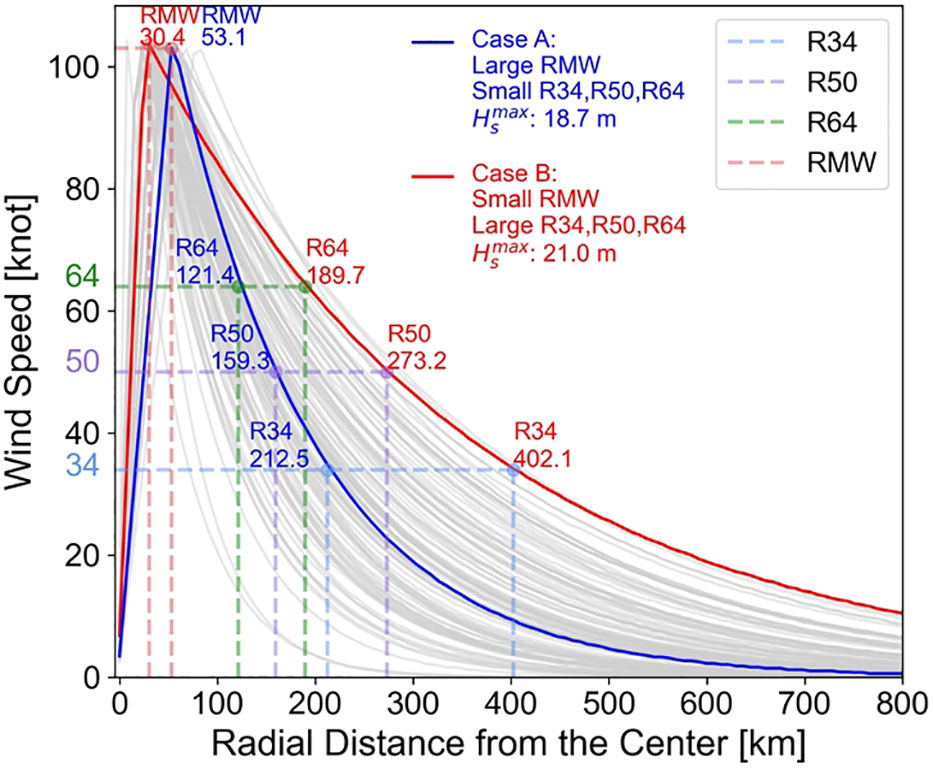
Figure 1 Radial wind profiles (gray lines) of TCs with MWS of 105 knots. The gray lines are from 105 North Atlantic hurricanes from 1988 to 2017 using extended best-track data, from which the blue (Case A) and red (Case B) lines were selected for a case study. The values of the four TC wind radii and simulated for the two selected profiles are shown. Dashed lines indicate the radius of maximum wind (RMW) and the 34-, 50-, and 64-knot wind radii (R34, R50, and R64).
This study aims to investigate the TC size parameter that best fits the extended fetch concept and is most closely related to the induced by TCs. To this end, an empirical TC wind field was constructed using TC size information observed in the North Atlantic from 1988 to 2017, and the for each TC was calculated using a third-generation wave model. The calculated values were classified and compared according to various TC size parameters to find the optimal parameter that affects . The data and design of the ideal numerical experiments are described in Section 2. Section 3 examines the relationship between TC-induced and TC size parameters. A summary and conclusion are presented in Section 4.
2 Data and design of numerical experiments
To determine the TC size parameter that has the greatest influence on within TCs, ideal numerical experiments were designed using the size information of TCs that occurred in the Atlantic Ocean. First, an empirical parametric wind model was used to produce TC wind fields based on the collected TC size, intensity, and track information (Bender and Ginis, 2000; Moon et al., 2003; Kim and Moon, 2021). TC winds were used to simulate using a third-generation wave model. TC size and track information were obtained from the Extended Best-Track (EBT) data provided by the Regional and Mesoscale Meteorology Branch every six hours (Demuth et al., 2006). The EBT data include the MWS and its radius, the radii with wind speeds of 34, 50, and 64 knots in all four quadrants of the hurricane, and the central pressure and location of the TC center. All storm parameters in the EBT data were first interpolated in time to the model time step (30 min). Radial wind profiles were then calculated along the northeast (NE), southeast (SE), northwest (NW), and southwest (SW) directions, correspondingly, using the following formula (Moon et al., 2003):
where Vmax , R34, R50, and RMW are the TC’s MWS and the radii with wind speeds of 34 knots, 50 knots, and MWS, respectively (see dotted lines in Figure 1). The radial wind profile was constructed such that wind speed increased linearly in proportion to the ratio of Vmax and RMW within RMW and decreased exponentially, depending on the average values of R34 and R50 outside RMW. The two-dimensional wind field was generated via spatial interpolation of the above radial profiles azimuthally.
The current parametric wind model can produce an asymmetric TC wind field based on the size information of the fourth quadrant of the TC (Kim and Moon, 2021). However, to make the results easier to interpret, a symmetrical wind field produced by averaging the TC information across the four quadrants was used in the experiment. The numerical experiments were designed using 12,830 TC data points obtained at six-hour intervals from a total of 642 TCs that occurred in the North Atlantic from 1988 to 2017. Numerical experiments for all TC intensities require substantial computational time. Thus, in this study, only the following two TC intensities were tested: 55 knots (517 points) and 105 knots (105 points). For the TC translation speed, only the basin-mean value (5.6 m s-1) and the 75th percentile value (7.875 m s-1) were applied. All experiments were designed to move a TC with a symmetrical wind field from west to east at a constant speed.
Wave simulations were performed using WAVEWATCH III v5.16, developed by the National Centers for Environmental Prediction Environmental Modeling Center. This model has been validated in many previous studies and has been shown to realistically simulate the mean wave parameters and wave spectrum, especially under various TC conditions (Moon et al., 2003; Tolman et al., 2005; Fan et al., 2009; Montoya et al., 2013; Moon et al., 2016; Liu et al., 2017; Abdolali et al., 2020; Wang et al., 2020; Zieger et al., 2021). The spatial resolution of the current model was set to 1/12° x 1/12° (541 x 481), and the basic source term ST2 was used as the physics package (Tolman and Chalikov, 1996). The water depth was uniformly set to 200 m. The values within the TC were extracted after the waves had fully developed and reached a steady state.
3 Results
3.1 Relationship between Hmax and TC size parameters
For 105 TCs with strong intensity (MWS = 105 knots) and average translation speed (Vfm = 5.25 m s-1), the simulated significant wave heights (Hs) show a clear asymmetric distribution; waves in the front-right quadrant of the storm track are high, while those in the rear-left quadrant are low (Figure 2). This is because to the right (left) of the storm center, the wind direction approximately aligns with (opposes) the direction of propagation of the storm, and thus waves would remain in the strong wind regions for a long (short) period of time, consequently increasing (decreasing) Hs (Bretschneider, 1972; Patterson, 1974; Ross, 1976; Young, 1988; Young and Burchell, 1996; Moon et al., 2003; Young and Vinoth, 2013; Liu et al., 2017; Young, 2017; Tamizi and Young, 2020; Tamizi et al., 2021). Similar to previous studies (Moon et al., 2003), the largest wave was found close to RMW, but these results do not imply that RMW is the TC size parameter that most strongly influences within TCs. In fact, the largest variation in wave height was not found at RMW but between RMW and R50, which are located slightly away from RMW in the front-right quadrant of the TC center.
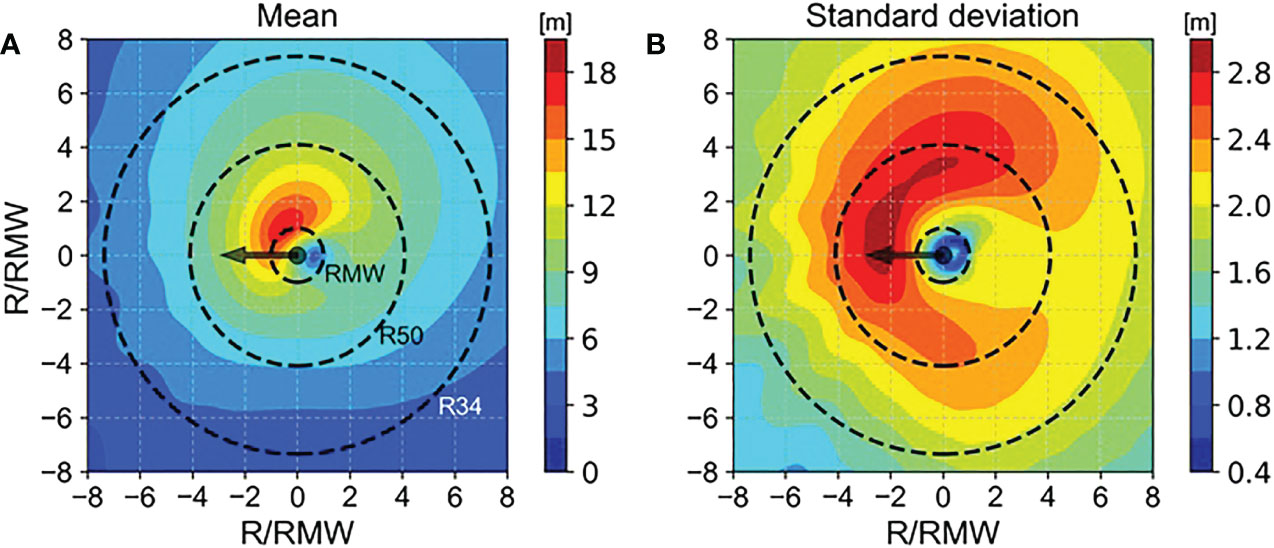
Figure 2 The spatial distribution of composited (average) significant wave heights (A) and their standard deviations (B) obtained from 105 North Atlantic TCs with MWS of 105 knots and Vfm of 5.25 m s-1. Arrows indicate the direction of propagation of the storm. Dashed lines indicate RMW, R50, and R34. All values are expressed on axes normalized in RMW.
To investigate the factors that have the greatest influence on for a moving TC, the correlations between three TC size parameters (RMW, R34, and R50) and the simulated were examined. Figure 3 shows the results for TCs with intensities of 55 knots and 105 knots moving at average speed (Vfm = 5.25 m s-1). Interestingly, the results show that the RMW, which has been used in the extended fetch concept in previous studies, had the lowest correlation (r = 0.36~0.58) with in both intensity experiments (Figures 3A, D), while R34 had the highest correlation with (r = 0.84~0.94; see Figures 3B, E). R50 also showed a higher correlation (r = 0.70~0.90) than RMW but lower than R34 (Figures 3C, F). Similar results were also confirmed in fast-moving experiments (Vfm = 7.875 m s-1) (Figure 4). Further analysis reveals that for R34 and R50, stronger and faster-moving TCs tend to have a higher correlation with Among all experiments, the highest correlation with was shown in R34 (r = 0.95) when MWS was 105 knots and Vfm was 7.875 m s-1. R34 has the highest correlation with Hs not only in the area where occurs but also across a wide range within the TC, while RMW is highly correlated only near the rear of the storm center (Figure 5). These results suggest that R34—rather than RMW—is the TC size parameter that has the greatest impact on .
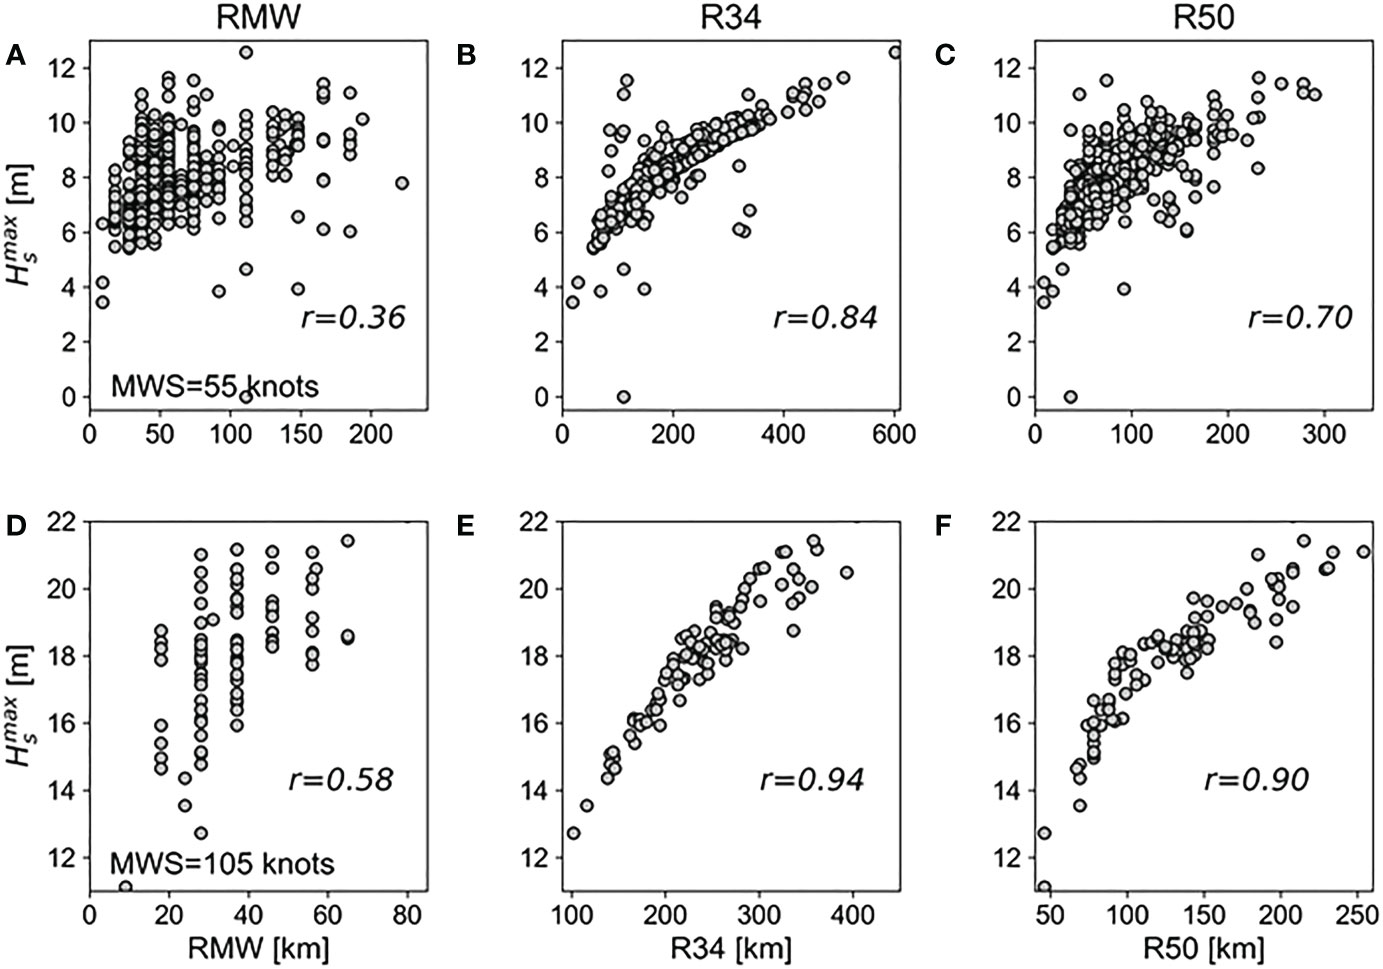
Figure 3 Scatter plots of simulated against three TC size parameters: RMW (A, D), R34 (B, E), and R50 (C, F). The values were obtained from TCs with a constant translation speed (Vfm = 5.25 m s-1) and MWS of 55 knots (A–C) and 105 knots (D–F). The correlation coefficients (r) between and TC size parameters are indicated in each scatter plot.
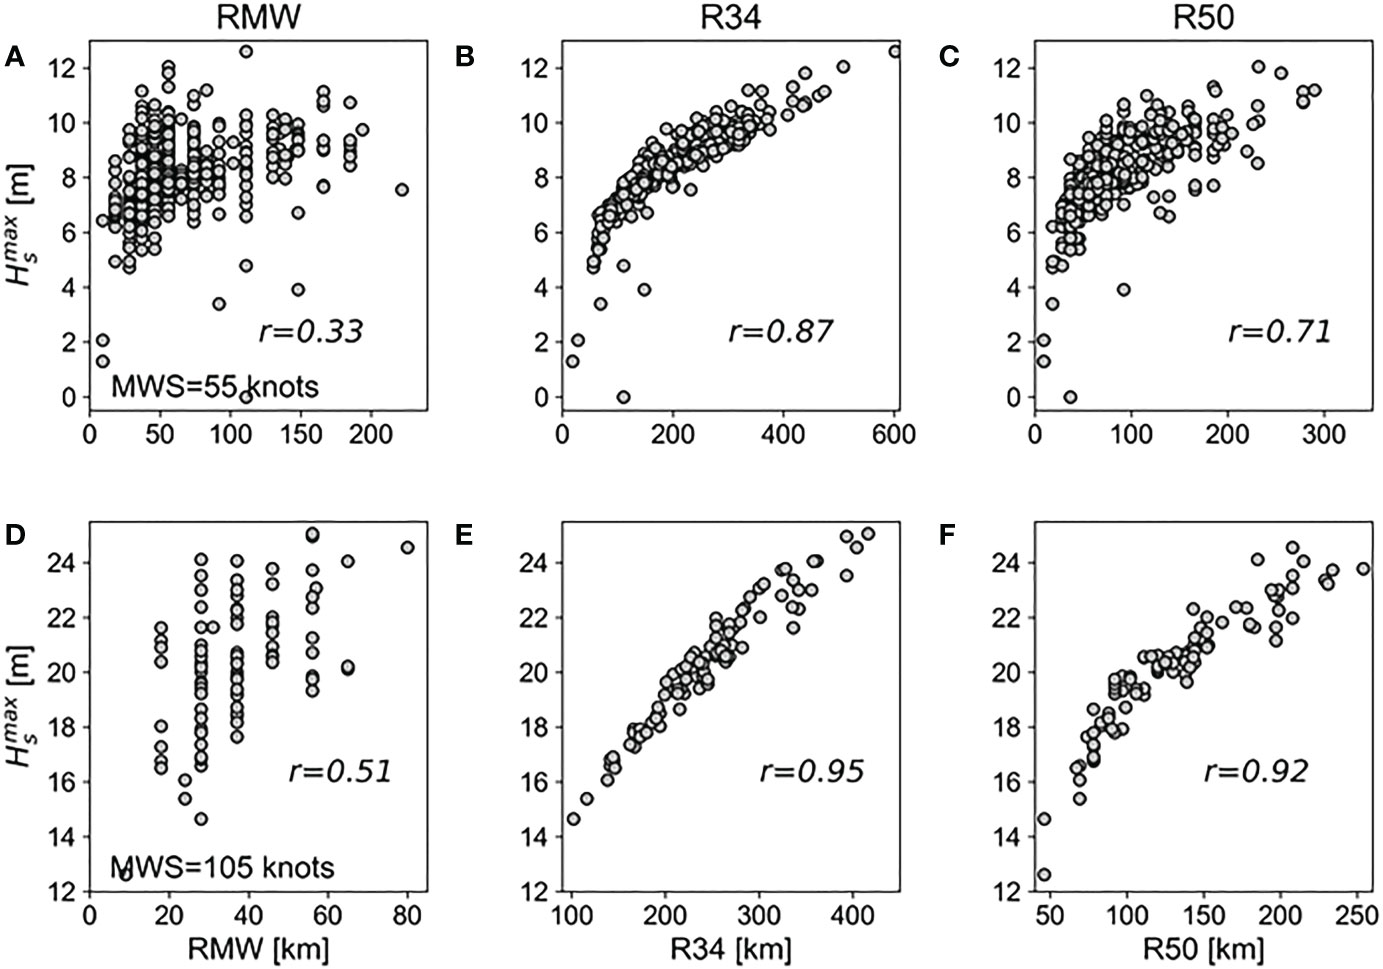
Figure 4 Same as in Figure 3 but Vfm is 7.875 m s-1. RMW (A, D), R34 (B, E), and R50 (C, F).
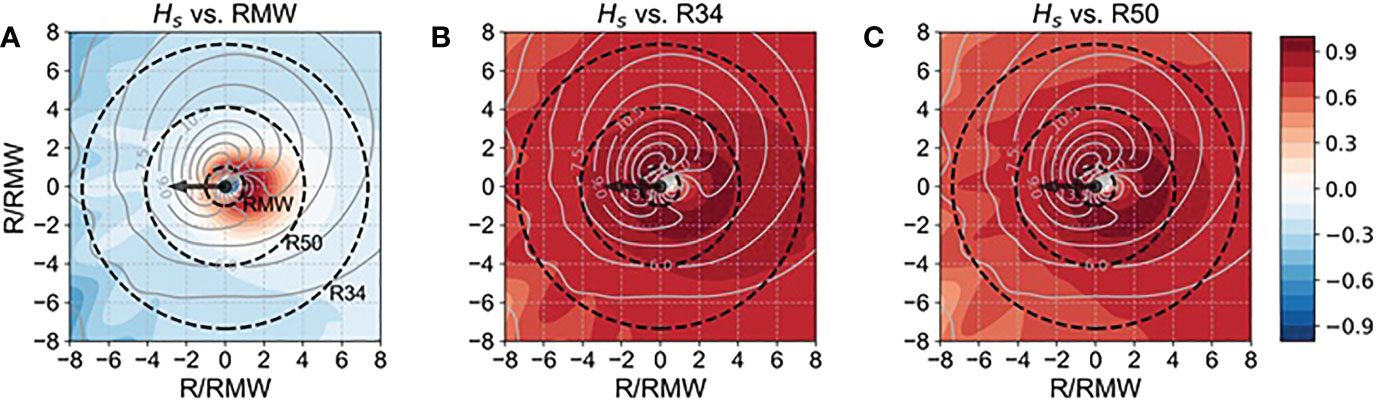
Figure 5 Spatial distribution of the correlation coefficients (shading) between significant wave height and TC size parameters (A, RMW; B, R34; C, R50) at all grid points. These results were obtained from 105 North Atlantic hurricanes with MWS of 105 knots and Vfm of 5.25 m s-1. Arrows indicate the direction of propagation of the storm. Dashed lines indicate RMW, R50, and R34. Gray contours represent the composite (average) of all the significant wave heights (unit: m) for the 105 TCs. All values are expressed on axes normalized in RMW.
The occurrence of high waves within a TC is determined by how long the waves can remain in strong wind regions due to the movement of the TC (Young, 2017). Here, the strong wind region includes not only the area in which the maximum wind speed occurs but also all strong wind areas that can affect “extended fetch.” Under the same conditions, it can therefore be assumed that as the total accumulated wind components aligned with the direction of propagation of the storm increases, increases as well (World Meteorological Organization, 2017). In fact, for TCs moving at mean speed (Vfm = 5.25 m s-1), was highly correlated with the cumulative wind within the TC (r = 0.91~0.94; see Figure 6). Based on these results, we investigated how the three TC size parameters were related to the cumulative wind within the TC. Figure 7 shows that RMW had the lowest correlation with the accumulated wind in both intensity experiments (Figures 7A, D), while R34 had the highest correlation (r = 0.96 for 105 knots; r = 0.84 for 55 knots; see Figures 7B, E), followed by R50 (Figures 7C, F). This explains why R34 is the TC size parameter most closely related to . For R50, the correlations were broadly comparable to R34, but their differences were relatively large in weak MWS (i.e., 55 knots) (compare Figures 3B, D, 7B, C).
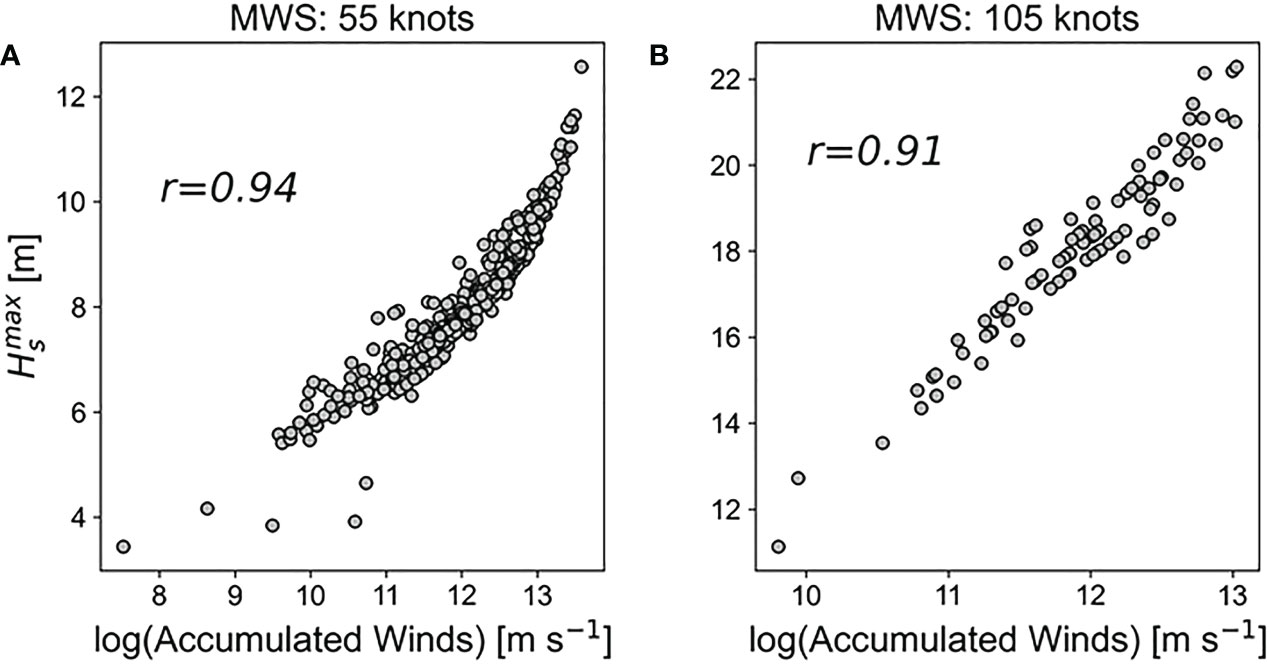
Figure 6 Scatter plots of simulated against the total accumulated wind within a TC. The values were obtained from TCs with a constant translation speed (Vfm = 5.25 m s-1) and MWS of 55 knots (A) and 105 knots (B). Accumulated winds were calculated by summing all the wind components aligned with the direction of propagation of the storm, up to 900 km from the TC center. The correlation coefficients (r) between and accumulated wind are indicated in each scatter plot.
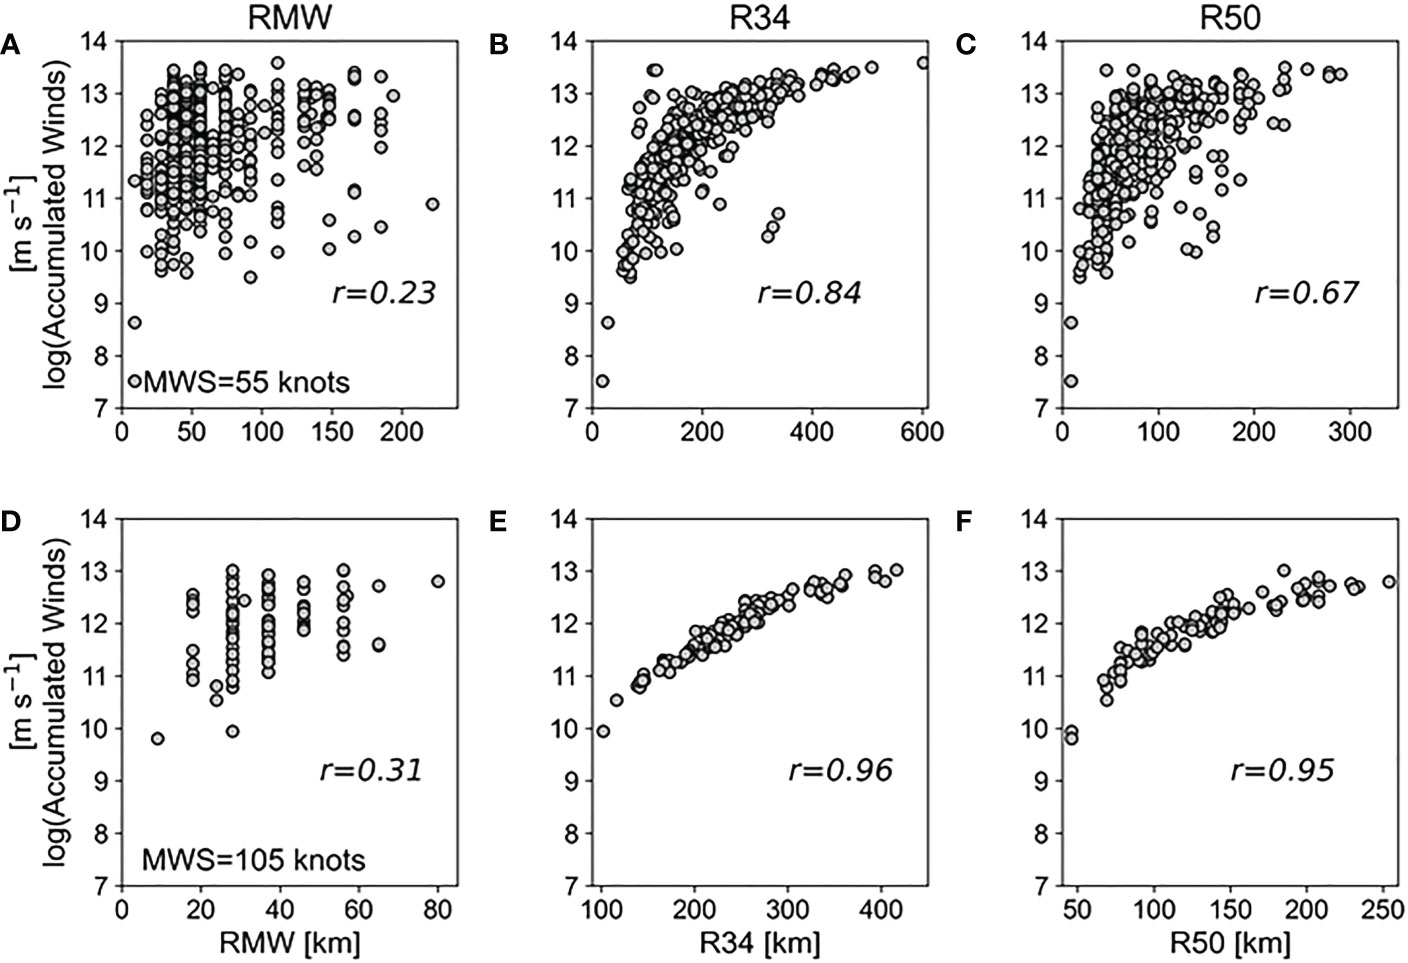
Figure 7 Scatter plots of the total accumulated wind within a TC against three TC size parameters: RMW (A, D), R34 (B, E), and R50 (C, F). The total accumulated wind values were obtained from North Atlantic hurricanes with MWS of 55 knots (A–C) and 105 knots (D–F) by summing all the wind components aligned with the direction of propagation of the storm up to 900 km from the TC center. The correlation coefficients (r) between accumulated wind and TC size parameters are indicated in each scatter plot.
3.2 A case study
In the introduction, an example of a TC with a larger RMW but a relatively lower was presented. This section analyzes these cases in more detail. As seen in Figure 1, Case A had a larger RMW but smaller R64, R50, and R34 than Case B. The difference in the radial sections of the TC wind was more obvious when implemented as a two-dimensional wind field (Figures 8A, B). In Case A, the TC’s eye was large, and MWS (105 knots) was distributed along a large circle, but strong winds of 17 m s-1 or more only existed within 200 km from the TC center; on the other hand, in Case B, the MWS was distributed along a small circle, but strong winds of 17 m s-1 or more were widely distributed up to 400 km. The Hs distributions obtained from these two wind fields reveal that Case B (= 21.0 m) had a higher Hs distributed over a wider area than Case A (= 18.7 m), while in both cases, the spatial distribution of high Hs had a common crescent shape to the front-right quadrant of the storm track (Figures 8C, D), as reported by numerous other authors (Young, 1988; Moon et al., 2004; Bowyer and MacAfee, 2005; Young, 2017; Zhang and Oey, 2019).
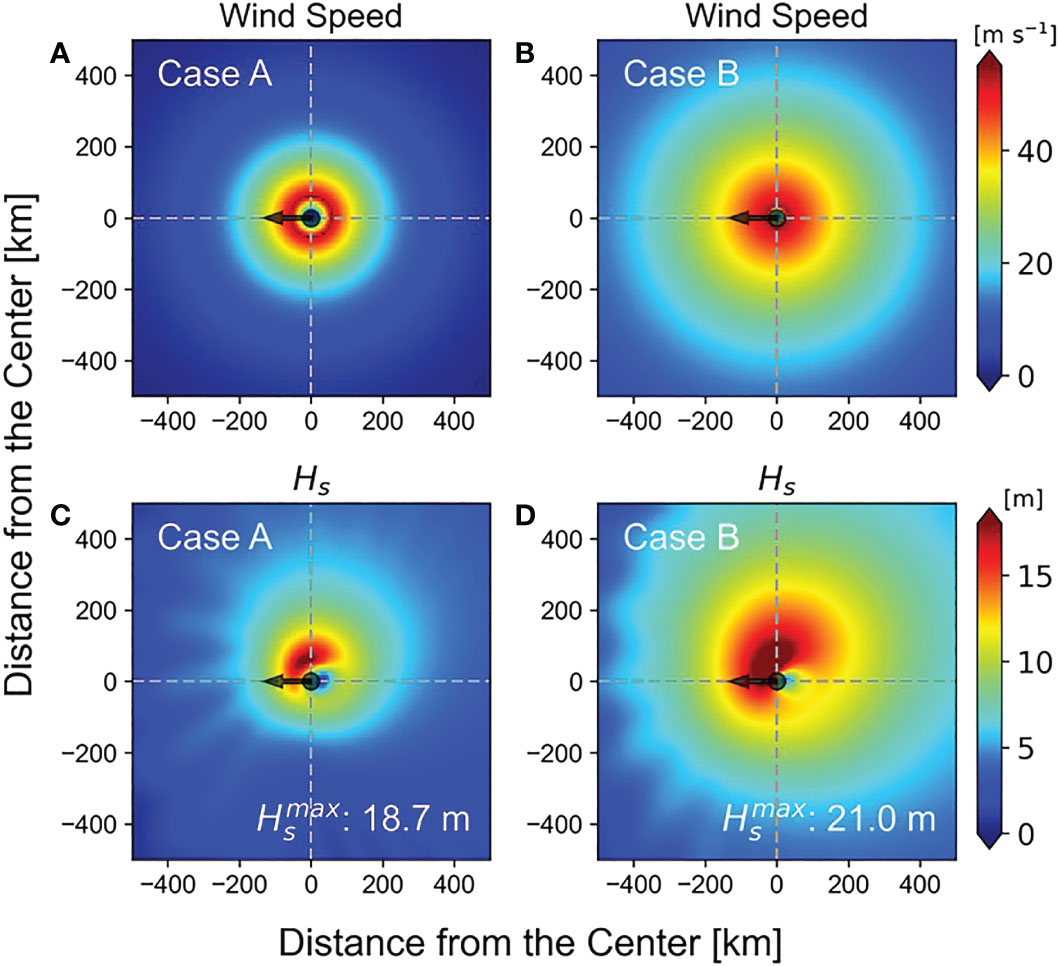
Figure 8 The spatial distribution of wind speed (A, B) and significant wave height (C, D) for the two examples in Figure 1. Here, Case A (A, C) has a larger RMW but a smaller R64, R50, and R34 than Case B (B, D). The TCs in both cases translate with a constant speed (Vfm = 5.25 m s-1) and MWS of 105 knots. Arrows indicate the direction of propagation of the storm.
To examine the difference in the TC wind field of the two cases in more detail, we investigated the wind components aligned with the direction of propagation of the storm for each bin of wind speed (Figure 9). The results reveal that Case B had more strong winds than Case A in all bins of wind speed. These differences in TC winds had a direct effect on the simulated Hs. That is, Case B has more high waves than Case A in all bins of Hs. This emphasizes again that TCs with large RMWs have lower .7 than TCs with small RMWs due to the relatively small wind component affecting wave development. In addition, the low correlation between RMW and cumulative winds shown in Figure 7 suggests that there are many actual examples similar to Cases A and B.
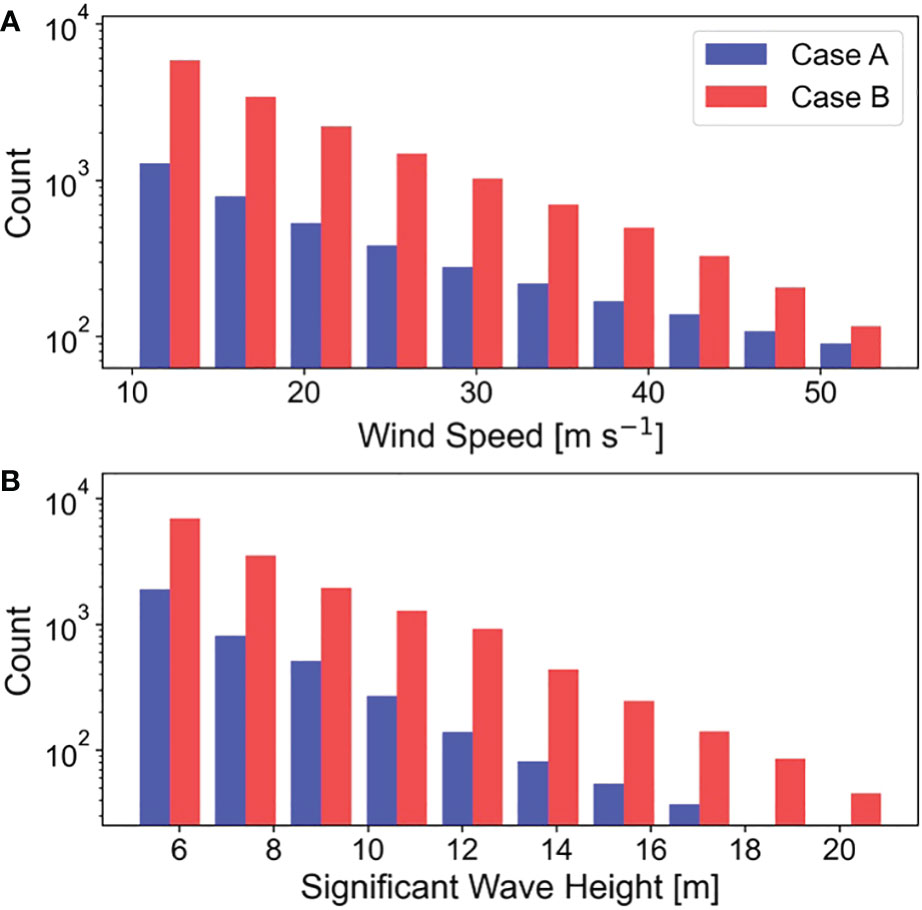
Figure 9 Comparison of the number of samples against each bin at various (A) wind speeds (over 10 m s-1) and (B) significant wave heights (over 5 m) within the TC (up to 900 km from the storm center) between the two cases in Figure 1. The bins are spaced at 4.4-m s-1 and 1.6-m intervals, respectively.
4 Summary and conclusions
This study investigated whether RMW, which has been widely used in previous studies for the extended fetch by TCs, is the optimal TC size parameter for determining TC-induced through an idealized numerical experiment using actual TC size information in the North Atlantic from 1988 to 2017. Based on the collected TC size, intensity, and track information, translating TC wind fields were produced using an empirical parametric wind model. The TC winds were then used to simulate using a WAVEWATCH III model. Finally, for TCs with two translation speeds and intensities, the correlation between simulated and three TC size parameters (RMW, R34, and R50) was investigated.
The numerical experiments revealed that the RMW had the lowest correlation with in all experiments (Figures 3A, D), while R34 had the highest correlation with . We also further examined how the three TC size parameters correlated with the total accumulated wind component aligned with the direction of propagation of the storm, which had a significant impact on , and found that RMW had the lowest correlation with the accumulated wind, while R34 had the highest correlation, followed by R50. This explains why R34, rather than RMW, is the TC size parameter most closely related to . In a case study of two TCs with the same intensity and translation speed but different TC size parameters, we found that TCs with large RMWs can have lower values than TCs with small RMWs due to the relatively small wind component affecting wave development. Figures 3A, 4A, 7A reveal that there could be many actual examples of this.
The low correlation of RMW with is fundamentally related to the negative correlation of RMW with TC intensity. Figure 10 implies that RMW tends to decrease as the intensity of TC increases, which contrasts with the tendency of R34 and R50 to increase as the TC gets stronger. This explains why cases where the RMW is small but the other TC parameters are large, such as in Case B in Figure 1, often occur in reality. In many cases, therefore, the TC-induced is more affected by the region containing moderately strong winds outside the TC than by the region of maximum wind speed near the RMW. These findings provide additional insights into the mechanisms by which TC-induced extreme waves occur. Finally, our paper suggests the need to change the RMW used in the traditional “extended fetch” concept to a more appropriate TC size parameter, such as R34, and to re-parameterize the corresponding equivalent fetch based on extensive experiments for TCs with more diverse translation speeds and intensities.
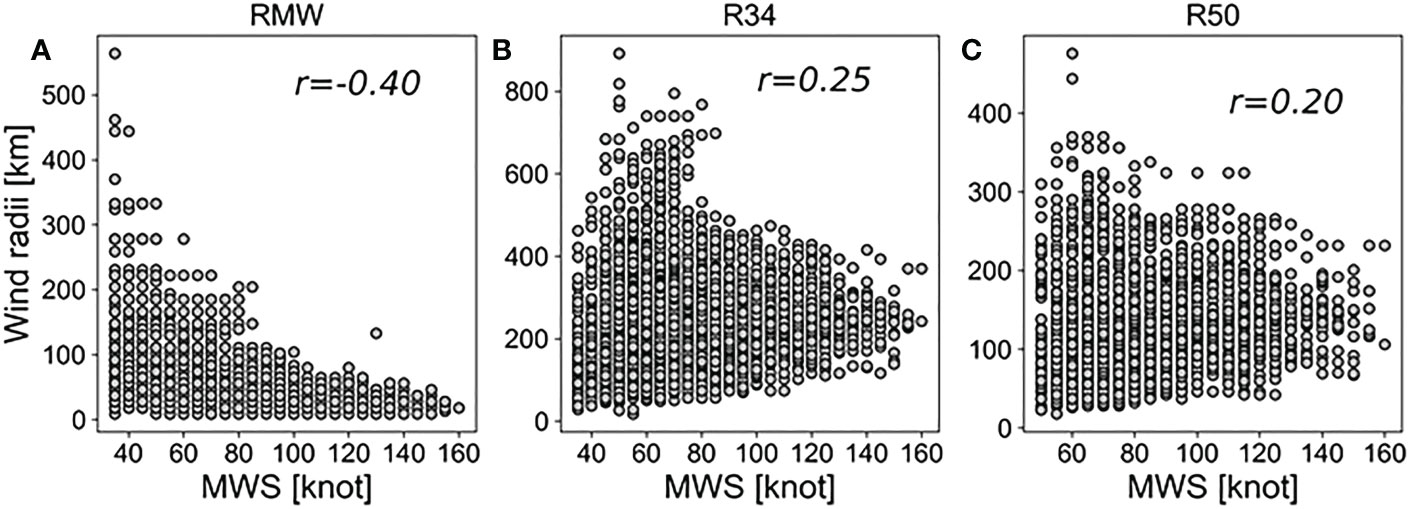
Figure 10 Relationship between TC intensity (i.e., MWS) and three TC size parameters: RMW (A), R34 (B), and R50 (C). The data were obtained from North Atlantic hurricanes from 1988 to 2017. The correlation coefficients (r) between MWS and TC size parameters are indicated in each plot.
Data availability statement
The original contributions presented in the study are included in the article/supplementary material. Further inquiries can be directed to the corresponding author.
Author contributions
Conceptualization, YO and I-JM. Methodology, YO. Validation, YO. Formal analysis, SMO and P-HC. Data curation, YO and I-JM. Writing-original draft preparation, YO. Writing-review and editing, YO and I-JM. Supervision, YO, I-JM, SMO, and P-HC. All authors contributed to the article and approved the submitted version.
Funding
This research was supported by the Korea Meteorological Administration, National Institute of Meteorological Sciences, titled “Development of marine meteorology monitoring and next-generation ocean forecasting system” (KMA2018-00420), and Basic Science Research Program through the National Research Foundation of Korea (NRF) funded by the Ministry of Education (2021R1A2C1005287)
Conflict of interest
The authors declare that the research was conducted in the absence of any commercial or financial relationships that could be construed as a potential conflict of interest.
Publisher’s note
All claims expressed in this article are solely those of the authors and do not necessarily represent those of their affiliated organizations, or those of the publisher, the editors and the reviewers. Any product that may be evaluated in this article, or claim that may be made by its manufacturer, is not guaranteed or endorsed by the publisher.
References
Abdolali A., Roland A., van der Westhuysen A., Meixner J., Chawla A., Hesser T., et al. (2020). Large-Scale hurricane modeling using domain decomposition parallelization and implicit scheme implemented in WAVEWATCH III wave model. Coast. Eng. 157, 103656. doi: 10.1016/j.coastaleng.2020.103656
Alves J. H. G. M., Tolman H. L., Chao Y. Y. (2004)Hurricane-generated wind-wave research at NOAA/NCEP. In: NOAA/NCEP/EMC/MMAB technical note nr. 242, 8th international workshop on wave hindcasting and forecasting, turtle bay, Hawaii, paper G3. Available at: https://polar.ncep.noaa.gov/mmab/papers/tn242/MMAB242.pdf (Accessed February 9, 2022).
Bender M. A., Ginis I. (2000). Real-case simulations of hurricane-ocean interaction using high-resolution coupled model: Effects on hurricane intensity. Mon. Wea. Rev. 128, 917–946. doi: 10.1175/1520-0493(2000)128<0917:RCSOHO>2.0.CO;2
Bowyer P. J., MacAfee A. W. (2005). The theory of trapped-fetch waves with tropical cyclones – an operational perspective. Weather forecast. 20, 229–244. doi: 10.1175/WAF849.1
Bretschneider C. L. (1972). Revisions to hurricane design wave practices. Coast. Eng. 13, 7. doi: 10.9753/icce.v13.7
Demuth J. L., Demaria M., Knaff J. A. (2006). Improvement of advanced microwave sounding unit tropical cyclone intensity and size estimation algorithms. J. Appl. Meteorol. Climatol. 45, 1573–1581. doi: 10.1175/JAM2429.1
Fan Y., Ginis I., Hara T., Wright C. W., Walsh E. J. (2009). Numerical simulations and observations of surface wave fields under an extreme tropical cyclone. J. Phys. Oceanogr 39 (9), 2097–2116. doi: 10.1175/2009JPO4224.1
Hasselmann K., Barnett T. P., Bouws E., Carlson H., Cartwright D. E., Ewing J. A., et al. (1973). Measurements of wind-wave growth and swell decay during the joint north Sea wave project (JONSWAP). Dtsch. Hydrogr. Z. Suppl. A, 8 (12), 95. doi: 10013/epic.20654
Hwang P. A. (2016). Fetch- and duration- limited nature of surface wave growth inside tropical cyclones: with applications to air-sea exchange and remote sensing. J. Phys. Oceanogr. 46, 41–46. doi: 10.1175/JPO-D-15-0173.1
Hwang P. A., Fan Y. (2017). Effective fetch and duration of tropical cyclone wind fields estimated from simultaneous wind and wave measurements: Surface wave and air-sea exchange computation. J. Phys. Oceanogr. 47, 447–470. doi: 10.1175/JPO-D-16-0180.1
Hwang P. A., Walsh E. J. (2018). Estimating maximum significant wave height and dominant wave period inside tropical cyclones. Weather Forecast. 33, 955–966. doi: 10.1175/WAF-D-17-0186.1
Kim K. O., Lee H. S., Yamashita T., Choi B. H. (2008). Wave and storm surge simulations for hurricane Katrina using coupled process based models. KSCE J. Civil Eng. 12 (1), 1–8. doi: 10.1007/s12205-008-8001-2
Kim H. I., Moon I. J. (2021). Estimation of extreme wind speeds in the western north pacific using reanalysis data synthesized with empirical typhoon vortex model. Ocean Polar Res. 43 (1), 1–14. doi: 10.4217/OPR.2021.43.1.001
Kim D. B., Shemdin O. H. (1978). “Radar observations of hurricane wave directions. Coastal Eng. Proc. 1 (16), 10. doi: 10.9753/icce.v16.10
Lee H. S., Kim K. O. (2015)Modeling of storm surges and waves due to typhoon haiyan using an integrated atmosphere-wave-ocean coupled model. In: In Australasian coasts & ports conference 2015: 22nd Australasian coastal and ocean engineering conference and the 15th Australasian port and harbour conference (Auckland, New Zealand: Engineers Australia and IPENZ). Available at: https://search.informit.org/doi/10.3316/informit.726391881479739 (Accessed December 14, 2022).
Lee W., McLaughlin P. W., Kaihatu J. M. (2017). Parameterization of maximum significant wave height in coastal regions due to hurricanes. J. Waterw. Port Coast. Ocean Eng. 143 (2), 1–14. doi: 10.1061/(ASCE)WW.1943-5460.0000362
Liu Q., Babanin A., Fan Y., Zieger S., Guan C., Moon I.-J. (2017). Numerical simulations of ocean surface waves under hurricane conditions: assessment of existing model performance. Ocean Model. 118, 73–93. doi: 10.1016/j.ocemod.2017.08.005
Liu P. C., Chen H. S., Doong D.-J., Kao C. C., Hsu Y.-J. G. (2008). Monstrous ocean waves during typhoon krosa. Ann. Geophys. 26, 1327–1329. doi: 10.5194/angeo-26-1327-2008
MacAfee A. W., Bowyer B. J. (2005). The modeling of trapped-fetch waves with tropical cyclones – a desktop operational model. Weather forecast. 20, 245–263. doi: 10.1175/WAF850.1
Montoya R., Arias A. O., Foyero J. O., Ocampo-Torres F. (2013). A wave parameters and directional spectrum analysis for extreme winds. Ocean Eng. 67, 100–118. doi: 10.1016/j.oceaneng.2013.04.016
Moon I.-J., Ginis I., Hara T. (2004). Effect of surface waves on air-sea momentum exchange: II. behavior of drag coefficient under tropical cyclones. J. Atoms. Sci. 61 (19), 2334–2348. doi: 10.1175/1520-0469(2004)061<2334:EOSWOA>2.0.CO;2
Moon I.-J., Ginis I., Hara T., Tolman H. L., Wright C. W., Walsh E. J. (2003). Numerical modeling of sea surface directional wave spectra under hurricane wind forcing. J. Phys. Oceanogr. 33 (8), 1680–1706. doi: 10.1175/2410.1
Moon I.-J., Kim M., Joh M., Ahn J., Shim J.-S., Jung J. (2016). Resent record-breaking high ocean waves induced by typhoons in the seas adjacent to Korea. J. Coas. Res. 75, 1397–1401. doi: 10.2112/SI75-280.1
Patterson M. M. (1974). “Oceanographic data from hurricane Camille. J. Pet Technol. 28 (03), 345–351. doi: 10.2118/5240-PA.
Ross D. B. (1976). A simplified model for forecasting hurricane generated waves. Bull. Amer. Meteor. Soc. 7, 95–179. doi: 10.1175/1520-0477-57.1.95
Sampson C. R., Goerss J. S., Knaff J. A., Strahl B. R., Fukada E. M., Serra E. A. (2018). Tropical cyclone gale wind radii estimates, forecasts and error forecast for the western north pacific. Weather Forecast. 33, 1081–1092. doi: 10.1175/WAF-D-17-0153.1
Tamizi A., Alves J. H., Young I. R. (2021). The physics of ocean wave evolution within tropical cyclones. J. Phys. Oceang. 51, 2373–2388. doi: 10.1175/JPO-D-21-0005.1
Tamizi A., Young I. R. (2020). The spatial distribution of ocean waves in tropical cyclones. J. Phys. Oceang. 50, 2123–2139. doi: 10.1175/JPO-D-20-0020.1
Tolman H. L., Alves J. H. G. M., Chao Y. Y. (2005). Operational forecasting of wind- generated waves by hurricane Isabel at NCEP. Weather forecast. 20 (4), 544–557. doi: 10.1175/WAF852.1
Tolman H. L., Chalikov D. (1996). Source terms in a third-generation wind wave model. J. Phys. Oceanogr. 26 (11), 2497–2518. doi: 10.1175/1520-0485(1996)026<2497:STIATG>2.0.CO;2
Wang D. W., Mitchell D. A., Teague W. J., Jarosz E., Hulbert M. S. (2005). Extreme waves under hurricane Ivan. Science 309 (5736), 896. doi: 10.1126/science.1112509
Wang L., Zhang Z. B., Lee D., Luo S. (2020). An efficient method for simulating typhoon waves based on modified Holland vortex model. J. Mar. Sci. Eng. 8, 177. doi: 10.3390/jmse8030177
World Meteorological Organization (WMO). (2017). Global guide to tropical cyclone forecasting. (Switzerland: WMO) WMO-No.1194. 399 p.
Young I. R. (1988). Parametric hurricane wave prediction model. J. Waterw. Port Coast. Ocean Eng. 114, 637–652. doi: 10.1061/(ASCE)0733-950X(1988)114:5(637)
Young I. R. (2017). A review of parametric descriptions of tropical cyclone wind-wave generation. Atmosphere 8 (10), 194. doi: 10.3390/atmos8100194
Young I. R., Burchell G. P. (1996). Hurricane generated waves as observed by satellite. Ocean Eng. 23, 761–776. doi: 10.1016/0029-8018(96)00001-7
Young I. R., Vinoth J. (2013). An “extended fetch” model for the spatial distribution of tropical cyclone wind-waves as observed by altimeter. Ocean Eng. 70, 14–24. doi: 10.1016/j.oceaneng.2013.05.015
Zhang L., Oey L. (2019). An observational analysis of ocean surface waves in tropical cyclones in the western north pacific ocean. J.Geophys. Res. Oceans 125, 184–195. doi: 10.1029/2018JC014517
Keywords: maximum significant wave height, tropical cyclone wind radii, extended fetch, parametric model, fetch-limited growth, the radius of maximum wind speed, the radius of 34-kt wind speed
Citation: Oh Y, Oh SM, Chang P-H and Moon I-J (2023) Optimal tropical cyclone size parameter for determining storm-induced maximum significant wave height. Front. Mar. Sci. 10:1134579. doi: 10.3389/fmars.2023.1134579
Received: 30 December 2022; Accepted: 25 January 2023;
Published: 08 February 2023.
Edited by:
Lichuan Wu, Uppsala University, SwedenReviewed by:
Hailun He, Ministry of Natural Resources, ChinaJan-Victor Björkqvist, Norwegian Meteorological Institute, Norway
Copyright © 2023 Oh, Oh, Chang and Moon. This is an open-access article distributed under the terms of the Creative Commons Attribution License (CC BY). The use, distribution or reproduction in other forums is permitted, provided the original author(s) and the copyright owner(s) are credited and that the original publication in this journal is cited, in accordance with accepted academic practice. No use, distribution or reproduction is permitted which does not comply with these terms.
*Correspondence: Il-Ju Moon, aWptb29uQGplam51LmFjLmty