 Carlos Toledo-Hernández1*
 Claudia Patricia Ruiz-Diaz1*
 Juan Sebastian Ramírez-Lugo2
 Marielys Torres-Díaz3
 Lisby Santiago-Pagán3Andrea Bruno-Chardón3
 Liz M. Díaz-Vázquez3,4
- 1Sociedad Ambiente Marino (SAM), San Juan, Puerto Rico
- 2Department of Biology, University of Puerto Rico, San Juan, Puerto Rico
- 3Department of Chemistry, University of Puerto Rico, San Juan, Puerto Rico
- 4NSF-CREST Center for Innovation, Research, and Education in Environmental Nanotechnology University of Puerto Rico, San Juan, Puerto Rico
Worsening environmental conditions due to climate change have profoundly affected the health of coral reefs worldwide. Thus, understanding how corals respond to fluctuating and/or extreme levels of temperature and solar irradiation will guide future protection and restoration efforts of this valuable ecosystem. Herein, we present a study of the immune responses of the endangered coral Acropora cervicornis to seasonal fluctuations in water temperature (WT), light intensity (LI), and water depth. Immune responses were observed by measuring the concentration of green and cyan fluorescent proteins (GFP and CyFP) and the activity of phenoloxidase (PO), an enzyme involved in the biosynthesis of the photoprotective protein melanin. To study these responses, visually healthy A. cervicornis fragments were placed at 8, and 12 m depth, and GFP, CyPF, and PO activity were measured at three-month intervals over a 12-month period. Seawater temperature and light intensity were also measured at each depth during this period. A general linear mixed model was used to determine the effects of seasonal variations of WT, LI, and water depth on the immune proteins. GFP, CyFP, and PO activity varied significantly across time – all higher in late summer/early fall and lower in late winter/early spring. Likewise, WT and LI significantly affected GFP, CyFP, and PO activity. On the other hand, water depth only had a significant effect on fluorescent protein concentrations but not PO activity. Our study demonstrates that corals can modulate these key immune-related proteins throughout natural seasonal fluctuations. That is, increasing in months of higher thermal and light conditions while decreasing in months with mild thermal and light conditions. The phenotypic plasticity of A. cervicornis in adapting to a changing environment underscores the importance that in future studies time of the year should be a meaningful consideration when evaluating the responses of A. cervicornis to the environment.
Introduction
All corals possess constitutive immunity, meaning a basal level of immune activity required to balance the organism’s internal biochemical processes, promote, and provide a healthy environment for the interaction between the coral host and microbes to thrive while optimizing the allocation of resources into the different life-historic trait (Palmer, 2018). However, constitutive immunity must be plastic, meaning that it must have the capacity to adjust rather quickly to natural or seasonal variations in environmental conditions. As sessile organisms, corals can’t escape from these harsh environmental conditions by migrating to sites with better conditions. Instead, corals rely on a suite of constituents, including pigments such as fluorescent proteins (FPs) and melanin, to protect themselves when stressful environmental conditions threaten their internal homeostasis.
FPs and melanin are ubiquitous in corals and serve as primary constituents of corals’ innate immune system due to their multiple roles (Roth et al., 2010). Four FP-like proteins have been identified in corals, green (GFP), cyan (CyFP), red (RFP), and yellow (Alieva et al., 2008). The first three are common in corals, while the last one is rarely observed in reef organisms (Alieva et al., 2008; Quick et al., 2018). In general, these pigments are thought to be immunologically competent due to their photoprotective properties as they scatter light and absorb potentially harmful high-energy radiation (Salih et al., 2000). FPs also have the capacity to quench reactive oxygen species (ROS), which dramatically increase under high levels of abiotic stressors, leading to coral bleaching (Palmer et al., 2009).
As in the case of FPs, melanin provides corals with photoprotection by scattering and absorbing high-energy radiation such as ultraviolet light (UV) (Palmer et al., 2011). Melanin is commonly found in a coral’s epithelial cells, creating a physical barrier to prevent and/or reduce the harmful impact of radiation. In addition, melanin plays a vital role in the coral’s inflammatory responses such as wound healing and the response to pathogens (Palmer et al., 2010). In such cases, melanin is stored in granules within mobile cells known as amoebocytes. Granular amoebocytes rush to afflicted areas and release melanin to seal the injury or encapsulate pathogens in the case of pathogen infection (Petes et al., 2003).
In this study, we investigate the constitutive immune response of Acropora cervicornis to seasonal and depth-related variations of seawater temperatures (ST) and light intensity (LI). Specifically, we measured the intrinsic mean FP and phenoloxidase (PO) activity, an enzyme responsible for activating the biosynthesis of melanin in A. cervicornis colonies, at four moments within a 12-months period to understand the effect of seasonal variation of ST and LI on the synthesis of photoprotective pigments. Given that ST and LI vary seasonally, with peaks occurring during late summer in the Caribbean, and that the production of FP and Melanin are closely linked to the coral’s immune system where high levels of these proteins indicate increased stress in corals (Mydlarz et al., 2010), we would expect a seasonal response of Caribbean corals’ innate immune system due to these temporally predictable stressors. Meanwhile, provided the immune constituents’ roles are to protect corals from heat and light stressors, and that these environmental factors vary with depths, we would expect a depth response of these innate immune constituents. Therefore, to test this hypothesis, we conducted a retro-transplant experiment where we relocated A. cervicornis fragments from their original depths to a different depth, i.e., from 8m to 12m and vice-versa, and measured the PO-activity and FP concentration.
We selected A. cervicornis as the study subject because this coral is highly sensitive to changes in ST and LI. Hence, moderate changes in environmental conditions may yield detectable levels of variation in FP concentration and PO activity. Likewise, A. cervicornis was one of the most conspicuous corals across the Caribbean basin, covering extensive areas of reef-scape (O’Donnell et al., 2017). Sadly, it is currently near extinction due to bleaching-related events, solar radiation and temperature increases, and diseases. Therefore, understanding how natural fluctuations of these environmental factors affect the internal environment of corals and how these internal changes may affect viability is crucial to foster the conservation of this important reef-building species.
Materials and methods
Experimental design
To evaluate the effects of ST and LI seasonal variation on FPs and PO, we used genets of A. cervicornis that we have been nursing in farming lines (donor farms) at water depths of 8 and 12m since 2016 at Punta Soldado, Culebra Puerto Rico. Five months before the start of the experiment, we selected 20 healthy-looking genets from the donor farming lines, ten genets per water depth. We divided them into three fragments (i.e., ramets), two of these between 15-20cm in length and the third one of 6cm (Figure 1). Immediately afterward, the two large ramets were tagged with a unique number, and one of them was placed in a new farming line set at its original collection depth (hereafter shallow-shallow control [SS]) or deep-deep control [DD]; Figure 1). These two groups will be known as the control groups. The other large ramet was set from shallow to deep (shallow-deep [SD]) or deep to shallow (deep-shallow [DS], Figure 1). These fragments will be known as treatment groups. Farming lines where the ramets were set were constructed by hammering two-rod bars of 1.5m in length each, 0.5m into the sandy bottom, 2.5m apart, and connecting them with fish lines. The farms were visited monthly for the next five months to check for fragment bleaching and disease signs. Such signs were never observed during this period, suggesting that by the start of the experiment, all coral fragments were fully acclimated to the environmental conditions. The 6cm-long ramets were placed in numbered conical centrifuge tubes, frozen in liquid nitrogen, and transported to the laboratory, where they were stored in a -80°C freezer until further analyses. These 6cm fragments were subsequently analyzed as described below and understood to represent baseline levels of FP concentration and PO activity. Tissue fragments of 4-6cm in length from control (SS and DD) and treatment (SD and DS) colonies were subsequently collected on June 09, 2018 (Summer 2018), Nov 02, 2018 (Fall 2018), and May 18, 2019 (Spring 2019) following the same procedures as explained earlier for immune analyses. Farms were visited monthly for maintenance throughout the study, as described in Ruiz-Diaz et al. (2022).
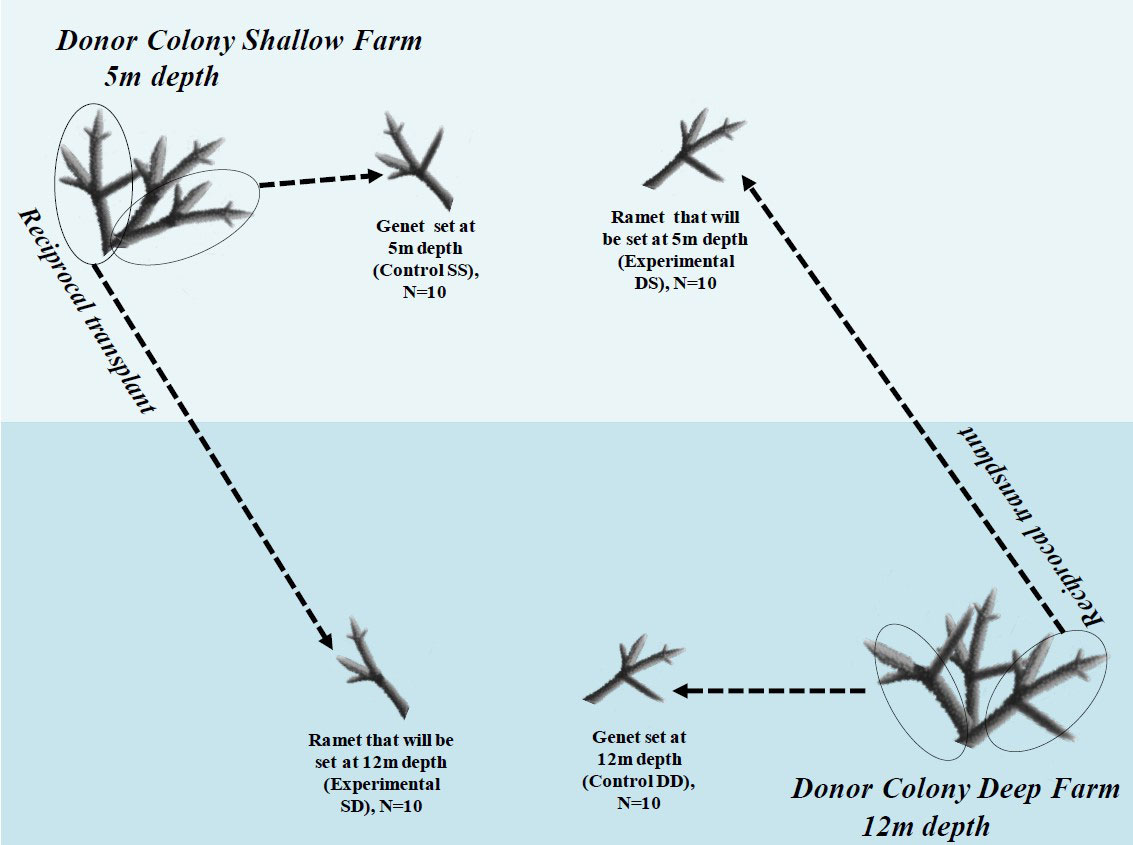
Figure 1 Diagram illustrating the experimental design procedures. DD represent control genet colonies from deep water farm; SS represent control genet colonies from shallow water farms. DS represents ramet colonies transplanted from deep to shallow, and SD represents ramet colonies transplanted from shallow to deep coral farms.
Tissue extraction and total protein quantification
Each frozen coral fragment was individually airbrushed to separate soft tissue from the skeleton using cold phosphate extraction buffer (50 mM phosphate buffer, pH 7.8 with 0.05 mM dithiothreitol) and separately collected into sterile tubes on ice. The crude extracts were then homogenized using a Fisher Scientific PowerGen 125 Tissue Homogenizer with a medium saw tooth tip for 60 seconds on the ice at low power. The homogenized tissue slurry was centrifuged at 4°C at 4,000 RPM for 5 minutes. The supernatant was aliquoted and used fresh or stored at -20°C. The coral fragments were processed using a modified Bradford assay to quantify the total protein concentration. To measure the total protein concentration, 5 μL of each extracted sample were plated in triplicate in 96-well plates along with a buffer-only control. Then 250 μL of Bradford reagent was added and left to incubate for 5 minutes at room temperature. Absorbance was recorded at 595 nm using a Scientific Multiskan GO spectrophotometer. A set of eight protein standards was prepared by serial dilution using bovine serum albumin at a 200 mg/mL concentration as a stock solution to prepare the calibration curve. The concentrations for each of the standard solutions were as indicated: 0.063, 0.125, 0.250, 0.500, 0.750, 1.000, 1.500, and 2.000 mg/mL.
Biochemical examination of fluorescent proteins
Mean intrinsic protein fluorescence (RFU/mg of total proteins, hereafter mean intrinsic FP) in coral tissues was estimated through the spectral emission of these proteins following Palmer et al. (2009) with slight modifications. To measure the mean FP, 30 µL of the extracted samples was placed in a black 96-well plate, along with a control sample (buffer-only well). Triplicates of each sample were excited using an Infinite 200 Pro Multimode Microplate Reader at 280, 410, 470, and 520nm, and the emission spectra were measured from 450 nm to 750 nm at 5 nm intervals. Each sample’s relative fluorescence and absorbance were normalized to total protein concentration determined using Bradford Reagent and measuring absorbance at 595 nm, using Bovine Serum Albumin (BSA) to generate the mean fluorescence spectra per mg of total protein.
Biochemical examination of phenoloxidase enzymatic activity
PO activity was quantified from fresh tissue extracts and processed as Palmer et al. (2011) described with slight modifications. PO activity was determined by adding 20 µL of the freshly extracted coral sample to a 96-well plate, in addition to 40 µL of 50 mM phosphate buffer, pH 7.8, and 25 µl of double-distilled water (ddH2O). After incubating at room temperature for 20 min, 30 µL of a 10mM dopamine hydrochloride solution was added as a substrate. The change in absorbance of the reaction was monitored every 5 min for 45 min using an Infinite 200 Pro Multimode Microplate Reader at 490 nm. The change in absorbance for the linear portion of the reaction curve was used to determine PO activity. Control reactions under the same condition, but with 70 µL of 50 mM phosphate buffer, pH 7.8, and no substrate were run in parallel as a control. PO activity was normalized to total protein concentration in each sample. The total protein concentration of the extracted coral sample was determined as described above.
Environmental measurements
Seawater temperature (ST) and light intensity (LI) were measured using Hobo Pendant temperature/light data logger 64k-UA-002-64 (Onset Company) attached to one of the rods of the experimental nursery lines at each depth. The devices were programmed to record one datum every hour for 30 -40 days, after which they were retrieved and substituted by new ones until the end of the study. For the statistical analysis, temperature records were averaged by summing all the temperature records between the collection of tissue divided by the number of days between the last and previous tissue collection. For LI, only the first ten days of records from each month between tissue collection were used, as algae and sediments covered the device sensor, potentially interfering with the detection of light after day 10 of the device being deployed. Therefore, LI records after the 10th day were not reliable. These data were used to run the general linear mixed models.
Statistical analyses
To determine significant differences between ST and LI, between water depths (i.e., 8 and 12 m) two One-way repeated ANOVA were done with depth as the independent variable and ST, and SI measured at four distinct time intervals, (spring 2018, summer 2018, fall 2018 and spring 2019) as the dependent variable. Post-hoc analyses were performed to determine differences between periods.
Our statistical analysis also consists of repeated measures of FPs (including green and cyan FP) and PO activity taken in a seasonal-based fashion, i.e., June 09, 2018, Nov 02, 2018, and May 18, 2019. For these analyses, we used data from genets (control DD and SS) and ramets (experimental SD and DS) fragments of A. cervicornis, set at two depths, i.e., 8 & 12 m depths. Exploratory analyses of these data suggested a linear relationship between mean intrinsic FPs and PO activity across the monitoring periods, treatments (i.e., depths), ST, and LI. Therefore, to explore how these factors explain the observed variation in mean intrinsic FPs and PO activity across time, we developed a general linear mixed model (GLMM) with fixed and random effects described as follows. Fixed effects: (1) treatments with four levels, i.e., control shallow and deep and experimental shallow and deep groups; (2) ST, (3) LI, and (4) monitoring period with four levels, i.e., spring 2018, summer 2018, fall 2018 and spring 2019. The random effect only consisted of ramets fragments. To determine the effects of the natural variation (seasonal) of ST and LI on the immune-related proteins, we ran the model (one run per immune-related protein) considering only the results from control colonies, i.e., DD and SS colonies. We used data from control and experimental colonies to determine the effects of ST and LI between depths on the immune-related proteins. We performed three additional runs (one per immune-related protein), yet, in this case, we only used data from the summer of 2018 to the spring of 2019 since the experimental group had no data in the spring of 2018. The structure of the model was specified by backward stepwise analysis, excluding those non-significant effects. The final model components (i.e., most parsimonious)were selected by performing an Akaike Information Criterion (AIC) comparing nested models that only differed on the components of interest. These analyses involved choosing the more saturated model only if the reduction in the residual sum of squares was statistically significant compared to the simpler models.
Results
Environmental variables
ST at the shallow farms was statistically different from temperatures at the deep-water farms (Figure 2; Table 1). However, the temperature at the two depths exhibited a similar temporal pattern of variation, increasing from spring to fall 2018, while decreasing from fall 2018 to spring 2019. Variations in temperature across time periods were also statistically significant (Table 1).
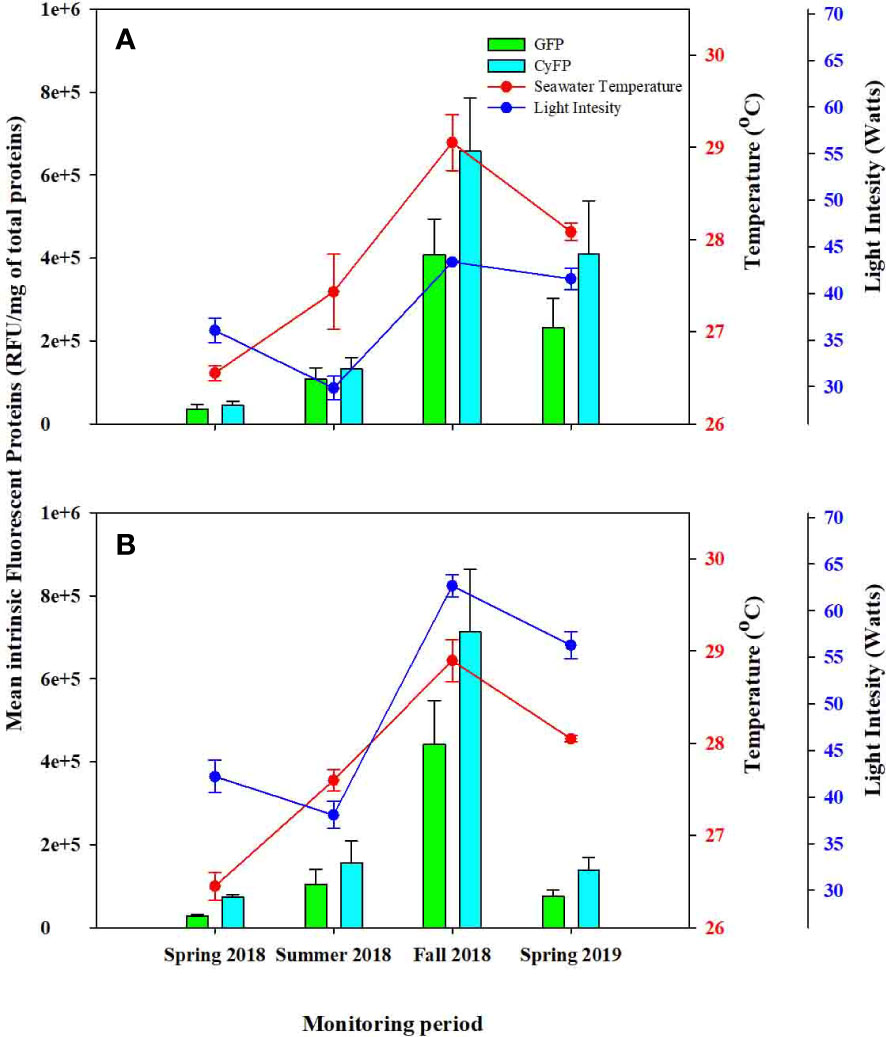
Figure 2 Comparison between Green Fluorescent (GFP) and Cyan Fluorescent Protein (CyFP) for control colonies across survey periods. (A) Control colonies from deep water farms (DD) and (B) control colonies from shallow water farms (SS). Red and blue dots represent seawater temperature and light intensity respectively; Green bars represent GFP and Cyan bars represent CyFP; whiskers represent standard error.
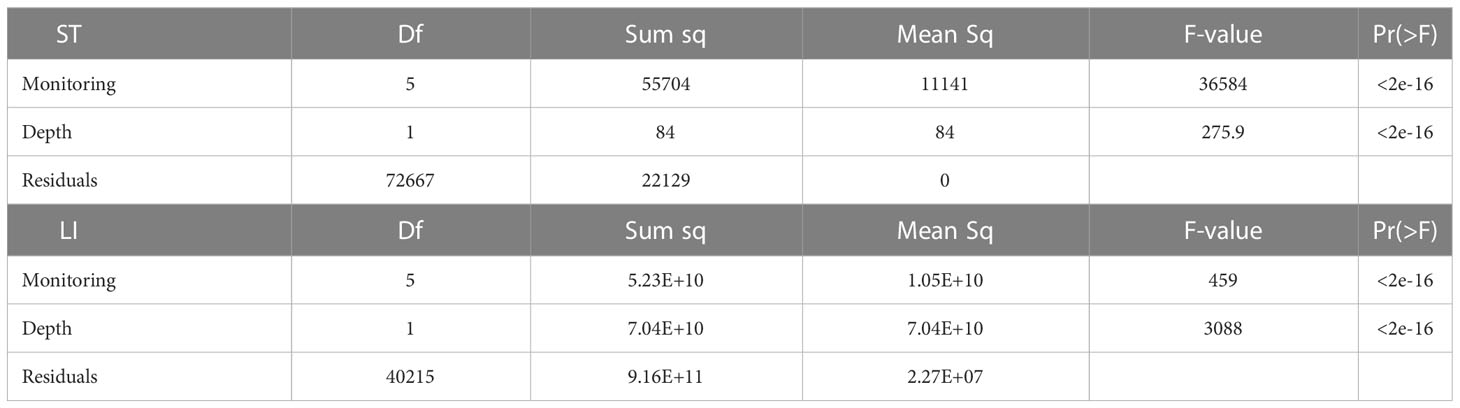
Table 1 Two-Way Repeated ANOVA analyses for water surface temperature (ST) and light intensity (LI).
Meanwhile, LI was significantly higher at the shallow farms than at the deep farms (Figure 2). Likewise, LI also varied significantly across monitoring periods, yet in a slightly different manner than the temperature at both depths, decreasing from spring to summer 2018, reaching its highest values in fall 2018, and decreasing again in spring 2019.
Temporal variation in intrinsic mean fluorescent proteins
Control groups (SS and DD) remained visually healthy throughout the study periods, yet detectable and varying levels of GFP and CyFP proteins and PO activity were observed in every colony during each monitoring period. However, levels of these immune-related proteins varied in magnitude across periods. For instance, GFP in both control groups steadily increased from spring to summer and further in fall 2018, while decreasing from fall 2018 to spring 2019 (Figure 2). These differences among monitoring periods were statistically significant in both groups (Table 2). Furthermore, seasonal fluctuations in ST and LI also showed a strong correspondence to the concentrations of GFP, for both control groups (F = 3.89; P = 0.013; Figure 2; Table 2). That is, increases in ST and LI from the spring to summer of 2018 corresponded to increases in GFP, with the highest peak of ST and LI mirroring the highest peak of GFP. Consistently, the observed decreases in ST and LI from Fall 2018 to Spring 2019 corresponded to a decrease in GFP detection. These effects were also statistically significant (ST: F = 7.531, P = 0.008; LI: F = 7.527, P = 0.008; Table 2) for both control groups.
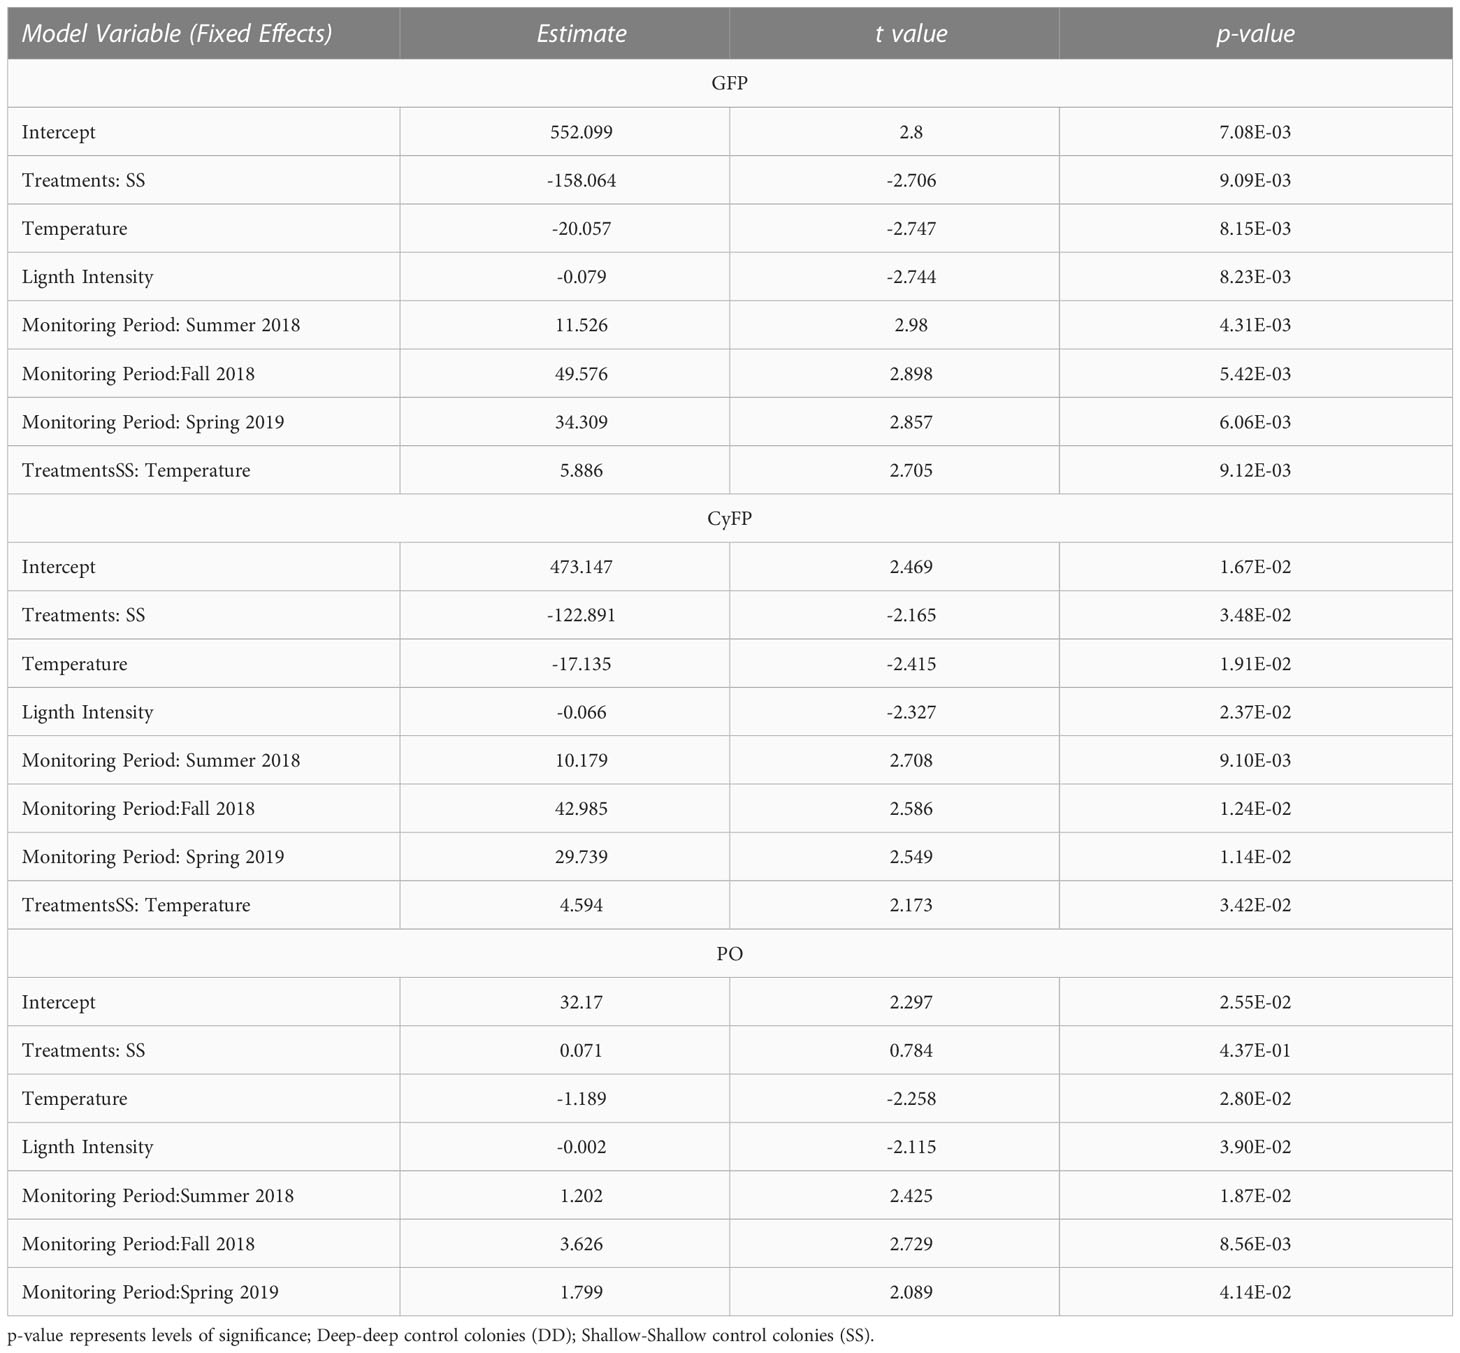
Table 2 Fixed effects result from the General Linear Mixed Model (GLMM) analyses for Green Fluorescent Protein (GFP), Cyan Fluorescent Protein (CyFP), and Phenoloxidase (PO) activity from control colonies fitted by maximum likelihood t-test using Satterthwaite.
A similar trend was observed when considering CyFP in the DD and SS colonies, with detection levels steadily increasing from spring to summer and then to fall 2018 while decreasing from fall 2018 to spring 2019 (Figure 2). Differences in CyFP among monitoring periods were statistically significant (F = 3.048, P = 0.036; Figure 2; Table 2). Seasonal fluctuation of ST and LI also fluctuate across time in a similar way as CyFP fluctuates (Figure 2; Table 2), with the highest peak of ST and LI coinciding with the highest of CyFP and lowest peaks of ST and LI also coinciding with the lowest peak of CyFP. ST and LI had a significant effect on CyFP in both experimental groups (ST: F = 5.995, P = 0.018; LI: F = 5.416, P = 0.024; Table 2).
Temporal variation in phenoloxidase activity
The activity of the phenoloxidase enzyme (PO) exhibited a slightly different pattern of fluctuation than FPs in the control groups. PO activity from DD colonies increased from spring 2018 to summer and fall 2018 and then decreased from fall to spring 2019 (Figure 3). However, PO activity in SS colonies decreased from spring 2018 and then increased from summer to fall 2018, and decreased from fall 2018 to spring 2019 (Figure 3). These differences among monitoring periods were statistical differences for both control groups (F = 22.854, P =0.000; Table 2). Meanwhile, seasonal fluctuations of ST and LI also showed a similar fluctuation as the PO activity (Table 2); increasing from spring to summer 2018, with the highest peak coinciding with the highest peak of ST and LI (Figure 3), and as ST and LI decreased from Fall 2018 to Spring 2019, so does PO activity. ST and LI had a significant effect on PO activity in both control groups (ST: F = 5.098, P = 0.028, LI: F =4.474, P = 0.039; Table 2).
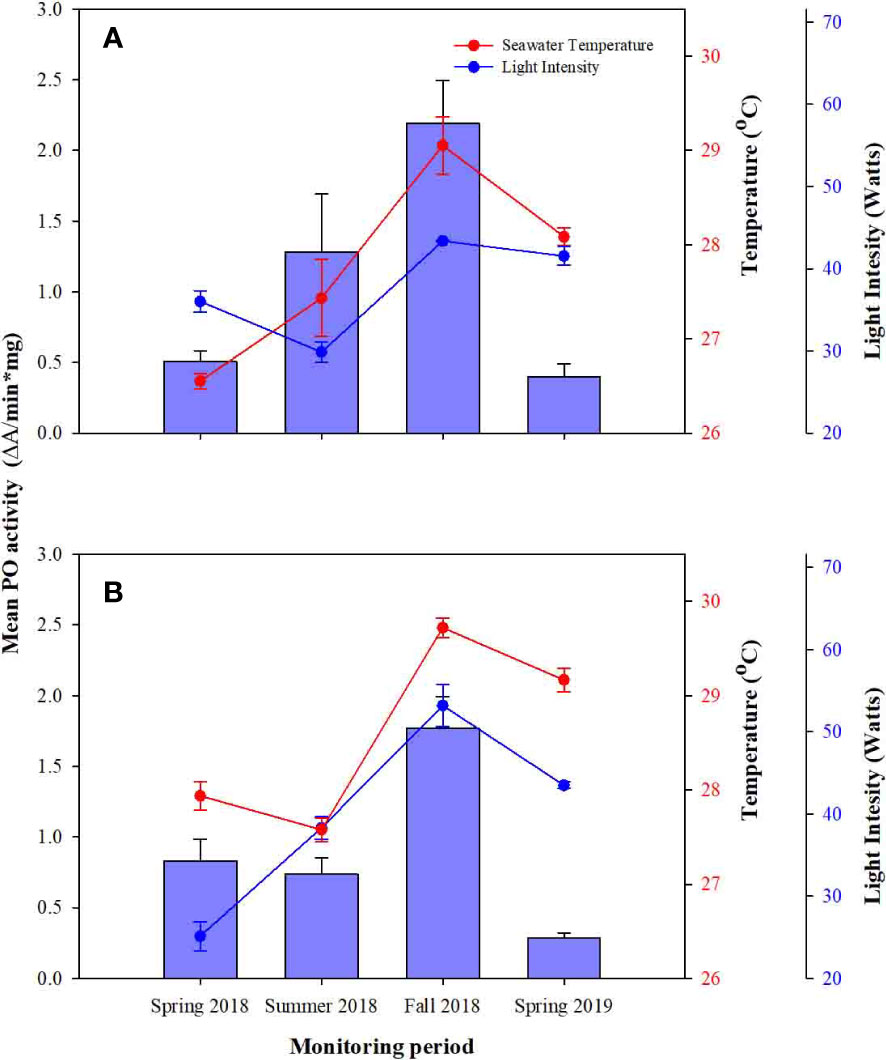
Figure 3 Comparison of Phenoloxidase (PO) activity over time and between, (A) Control colonies from deep farms (DD) and (B) control colonies from shallow farms. Red and blue circles represent water temperature and light intensity. Whiskers represent standard error.
Depth related variation in intrinsic mean fluorescent proteins
GFP concentration from DD colonies showed significant differences compared to SS colonies (F = 7.323, P = 0.009, Table 2). Specifically, DD colonies exhibited significantly higher GFP in the spring, and summer and SS exhibited significantly higher GFP in the fall of 2018 and spring of 2019 (Figure 2A).
A depth-related impact in GFP was also observed between the control and experimental groups. For instance, GFP was higher in DS colonies compared to DD colonies in the summer of 2018. By the fall of 2018, detection levels in DS increased threefold with respect to DD colonies. However, in spring 2019, levels of GFP in DD colonies almost tripled compared to DS colonies (Figure 4). These differences were statistically significant (Table 3). A similar detection pattern was also observed when comparing DD and SD colonies. However, differences in GFP detection levels show no statistical differences.
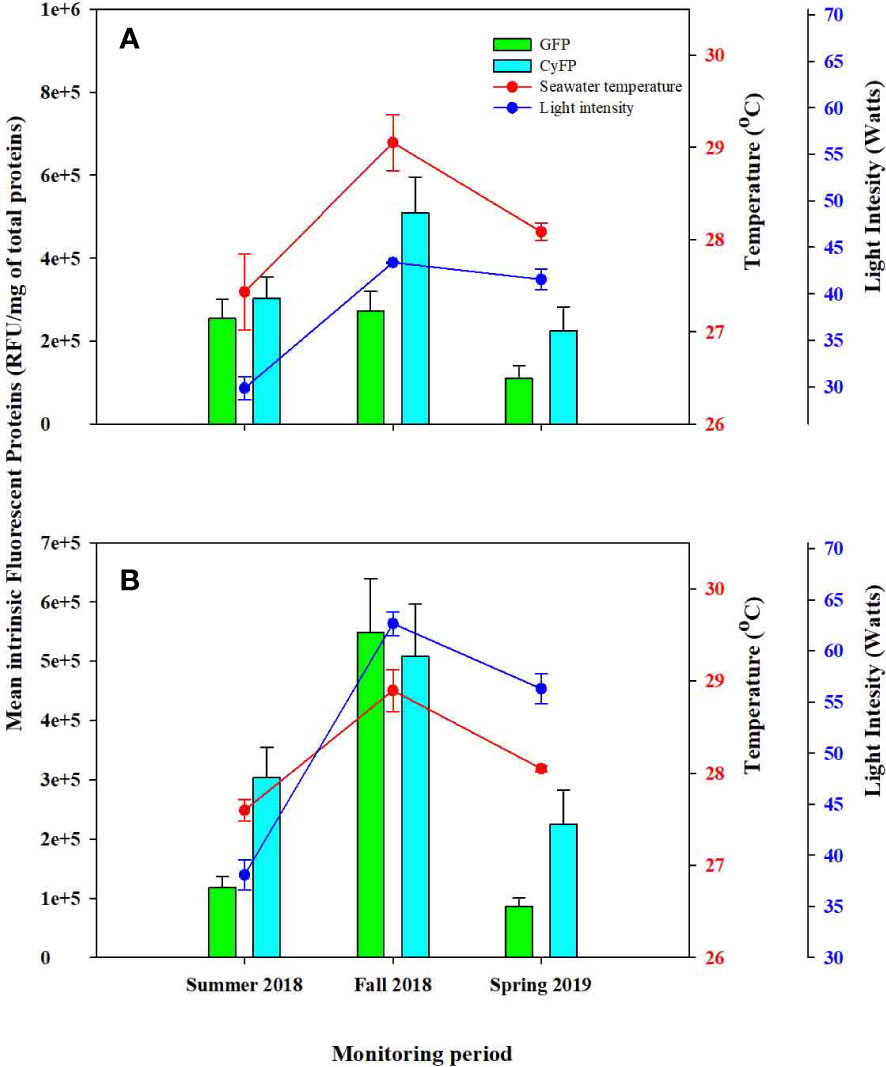
Figure 4 Comparison between Green Fluorescent (GFP), and Cyan Fluorescent Proteins (CyFP) concentrations from experimental colonies across survey periods. (A) Experimental colonies from deep waters farms (SD) and (B) experimental colonies from shallow waters farms (DS). Red and blue dots represent water temperature and light intensity respectively; Green bars represent GFP, and Cyan bars represent CyFP. Whiskers represent standard error.
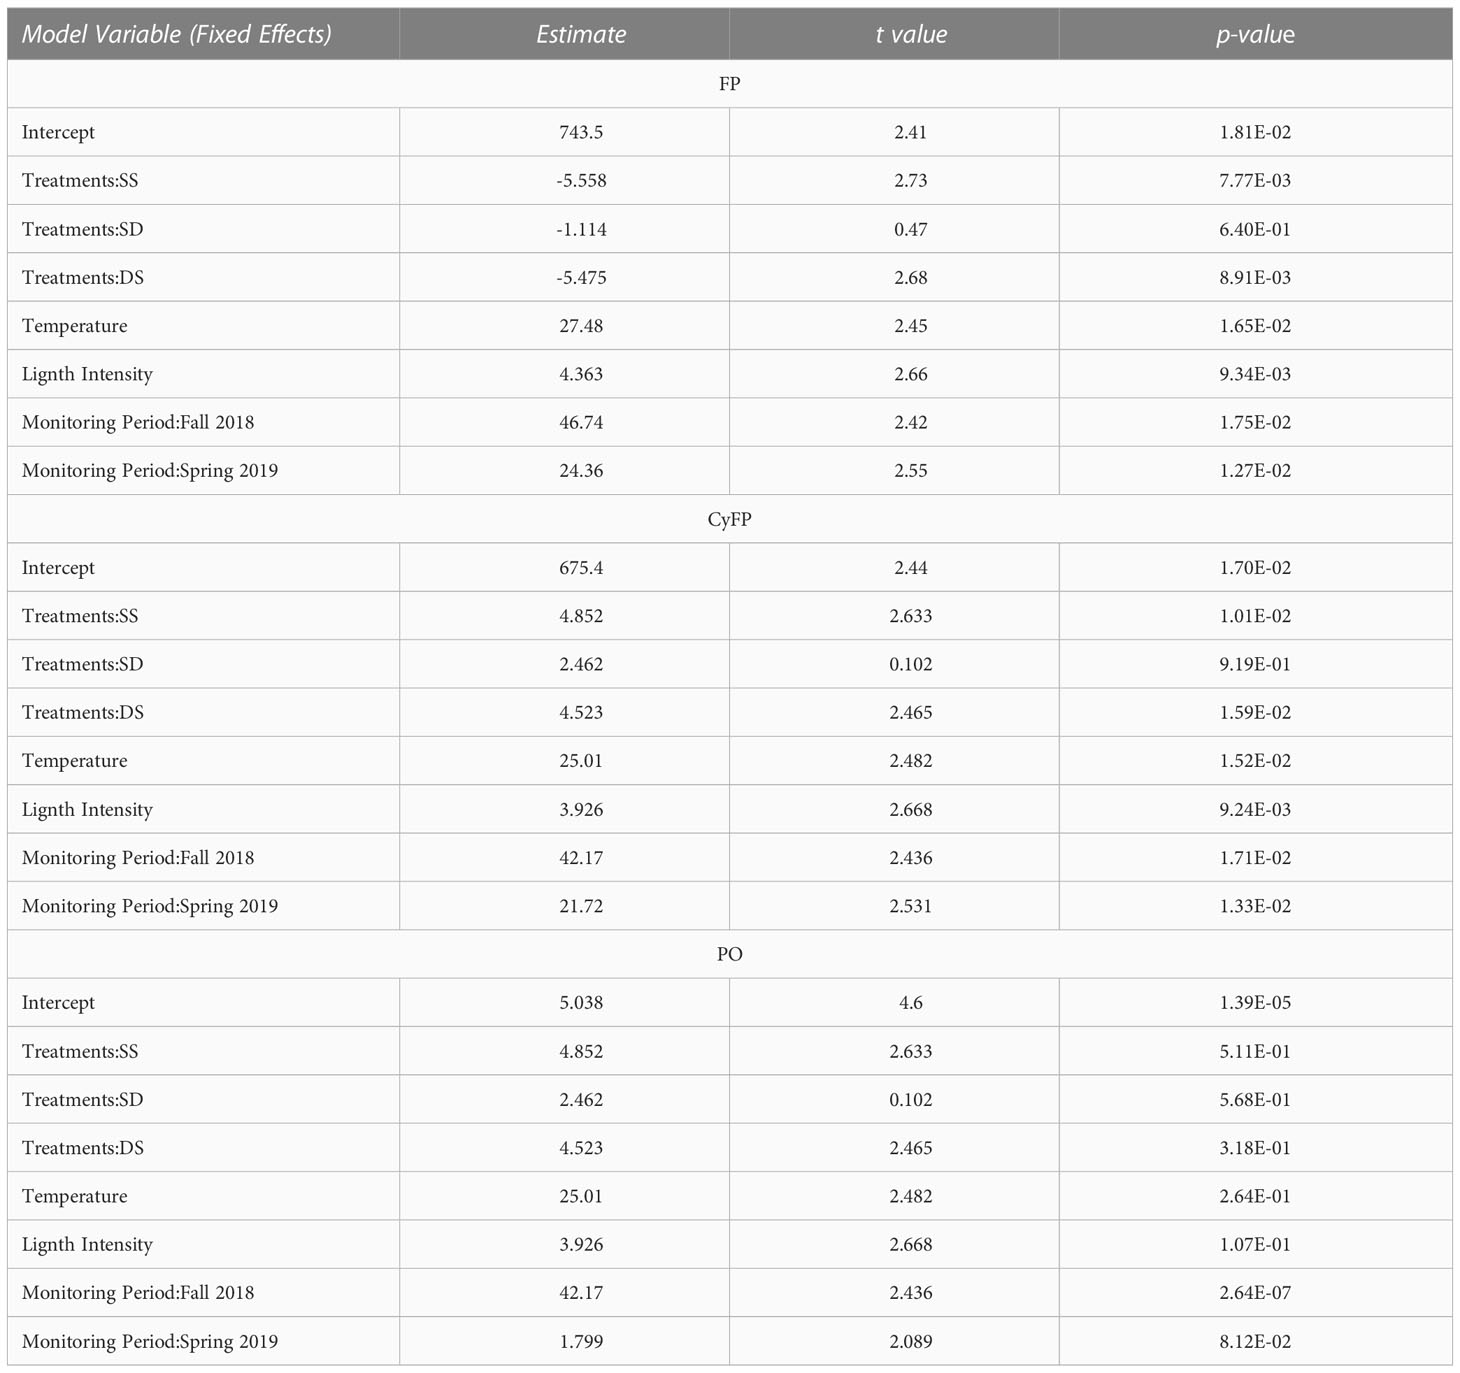
Table 3 Fixed effects result from the General Linear Mixed Model (GLMM) analyses for Green Fluorescent Protein (GFP), Cyan Fluorescent Protein (CyFP), and Phenoloxidase (PO) activity from control colonies fitted by maximum likelihood t-test using Satterthwaite, p-value represents levels of significance; Deep-shallow experimental colonies (DS); Shallow-deep experimental colonies (SD).
GFP levels between SS and SD/DS colonies exhibited a slightly different pattern. For instance, GFP levels from SD colonies double that of SS during the summer of 2018. However, by the fall of 2018, both groups increased. Nonetheless, SS doubled the concentration of SD. Whereas by spring 2019, both groups decreased in GFP levels. However, SD exhibited higher detection levels than SS colonies (Figure 4). Differences between SS and SD were statistically significant (Table 3). A similar detection pattern was also observed between SS and DS colonies, although differences in GFP levels show no statistical differences.
CyFP also varied between depths in the control and experimental colonies, consistent with previous analyses. For example, the data revealed statistical differences in CyFP between DD and SS colonies (F = 4.688, P = 0.034), with DD colonies exhibiting lower mean CyFP than SS colonies in all monitoring periods except from Spring 2019 (Figure 4; Table 3). Meanwhile, CyFP in DS colonies almost doubled that of DD colonies in the summer of 2018. However, by the fall of 2018, CyFP from DD colonies nearly quadrupled compared to the previous monitoring period, whereas DS colonies decreased by half. By contrast, in spring 2019, CyFP concentration in DD colonies decreased by half, while DS colonies increased by half with respect to fall 2018. CyFP concentration between DD and DS colonies was statically significant (F = 2.98, P = 0.042; Table 3). A similar pattern was also observed between DD and SD colonies, although differences in CyFP concentration show no statistical differences. CyFP concentration between SS and SD/DS colonies behaved similarly. In the summer of 2018, SD colonies doubled the concentration of CyFP compared to SS colonies. By the fall of 2018, CyFP in both groups increased; however, CyFP concentration in SS colonies increased by order of five, while SD colonies increased by two. By spring 2019, both groups showed CyFP, similar to spring 2018. Differences across time between SS and SD were statistically significant (F = 2.98, P = 0.042; Table 3). Variation in CyFP between SS and DS showed similar increase/decrease patterns. Nonetheless, these variations were not statically significant.
Depth-related variation in phenoloxidase activity
Meanwhile, the effect of depth on the PO activity was less than clear, as no statistical differences were observed between control colonies, and between control and experimental colonies (Figures 3, 5A, B; Tables 2, 3). Instead, the observed fluctuations of PO activities were related to seasonality and WT and LI variation.
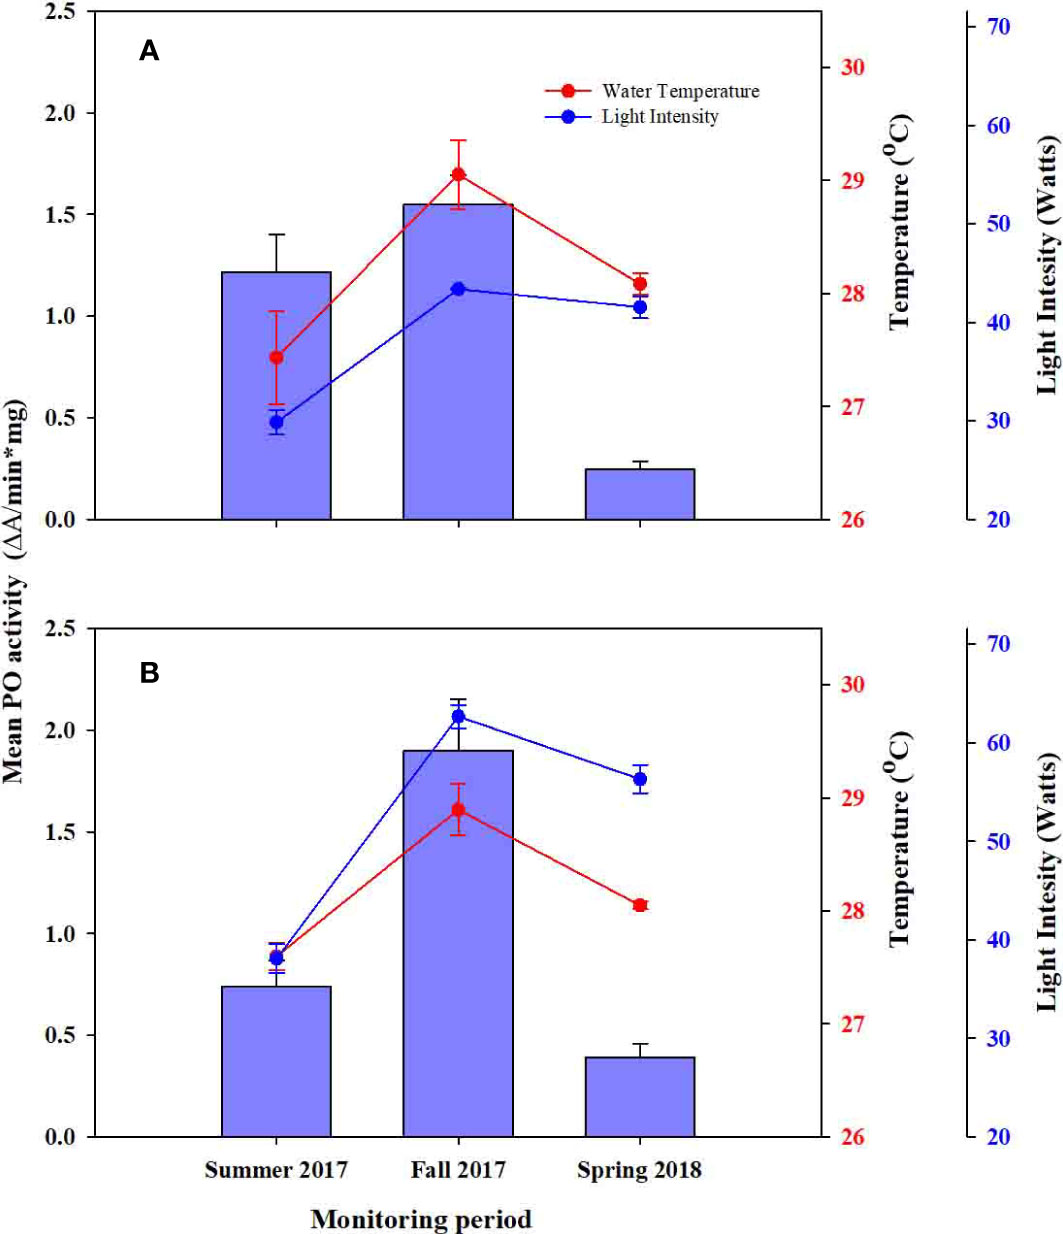
Figure 5 Comparison of Phenoloxidase (PO) activity across survey periods and, (A) Experimental colonies from deep farms (SD) and (B) experimental colonies from shallow farms (DS). Red and blue circles represent water temperature and light intensity. Whiskers represent standard error.
Discussion
In this study, we seek to understand how constitutive immune-associated proteins i.e., green, and cyan fluorescent proteins and phenoloxidase enzyme from A. cervicornis respond to seasonal variations in seawater temperatures, light intensity, and water depth. Our results showed a persistent detection of GFP and CyFP and PO in all colonies, even though no visual signs of physiological stress such as bleaching were observed. The presence of these proteins was recorded regardless of the monitoring period, water depth, or coral individuals confirming the capacity of A. cervicornis to maintain a certain level of constitutive immunity. In addition, our results clearly show that the levels of constitutive immunity in A cervicornis are subjected to the fluctuation of environmental factors. In our case, we observed a close correspondence between seasonal variations in temperature light intensity and, intrinsic mean FPs, and PO activity. That is, an increase and decrease in temperature and light intensity led to synchronized increases and decreases in intrinsic means of GFP and CyFP, and PO activity. This pattern was observed in all colonies i.e., DD, SS, DS, and DS colonies, but the magnitudes of the changes were better observed in SS and DD colonies. For example, our results show that when seawater temperature increased by 2.5C° and light intensity by 30 Watt/m2 from spring to fall 2018, the concentrations of GPF and CyFP increase nearly 11 and 15 times respectively, whereas PO activity increased four times. Similarly, when seawater temperature and light intensity decreased 10C and 4 Watt/m2 from fall 2018 to spring 2019, the concentrations of GFP decreased by half when compared to fall 2018, whereas CyFP and PO decreased 5 times when compared to fall 2018. Furthermore, the fact that SD (clone fragments of SS colonies) and DS (clone fragments of DD) responded according to their depths of settlement and not to their genetic origin, strongly supports the conclusion that indeed environmental factors exert a great influence in the constitute immunity of A. cervicornis corals. From the coral’s perspective, our study shows that A. cervicornis has the capacity to acclimate to seasonal changes.
Previous studies have also reported similar patterns of variations in coral’s immune proteins in response to seasonal fluctuations in seawater temperature and solar radiation. For instance, Van de Water et al. (2015, 2016) observed that GPF concentration and PO activity from the scleractinian coral A. millepora increased during summer’s warmer and brighter months. Roth and Deheyn (2013) also detected increases in FP concentrations in A. yongei coral after increasing ST and LI. Whereas Roth et al. (2010) showed that corals increase or decrease the concentration of GFP in response to increase or decrease light intensity. Meanwhile, Palmer et al. (2011), and Palmer (2018) reached similar conclusions working with the phenoloxidase paths of three Caribbean corals i.e., Orbicela faveolate, Stephanocoenia intersepta and Porites astreoides, and the Pacific coral Porites cylindrica.
In contrast to the strong seasonal response in FPs and PO to variation in temperature and light intensity, the results of the transplant experiment indicate a weak response to changes in depth. This was particularly evident with PO activity. For instance, equivalent levels of PO activity were recorded between colonies set at depth and shallow zones (DD and SS) and colonies transplanted from shallow to deep and deep to shallow zones (SD and DS respectively). Overall, these results suggest that phenoloxidase seems to be less sensitive toward light intensity than the FPs system. Furthermore, these results may reflect the different roles FPs and PO plays within the A. cervicornis immune arsenal, with FPs mainly reacting toward environmental stressors as quencher of reactive oxygen species during thermal stress and sun screening (Salih et al., 2000), and PO primarily responding toward infectious diseases, and tissue repairing (Palmer et al., 2011; Palmer and Baird, 2018). However, since we only measured the PO activity, which is an intermediate step in the melanization process, is uncertain if melanin (the final product of the melanization process) will show a similar pattern of variation to that observed in PO activity or will minor the patterns observed in FPs toward changes in depth.
Our data also show differential physiological responses among individuals toward cyclic and depth-related changes in environmental conditions. In general, all individuals displayed similar variation in FP and PO through time, but the magnitudes of the response varied between colonies. Several factors are likely contributing to these phenotypic variations, including genetic heritages (Yetsko et al., 2020), environmental memory originated through epigenetic modifications (Hackerrott et al., 2021), or/and holobiont-related factors (Marangon et al., 2021). Thus, future investigation should be devoted to deeper our understating of that matters.
This study shows that, in the absence of severe environmental disturbance or abnormal environmental stresses, constitutive levels of immunity vary concomitant with seasonal environmental cycles, increasing in months of higher thermal and light stressing condition, e.g., late spring-early fall, decreasing in seasons with lower thermal and light stress conditions, e.g., late fall-early spring. Yet, the fluctuating immune responses also suggest a resource constraint, where resources are allocated into immune constituents as demanded by environmental pressures. However, given the optimal resource allocation paradigm used in life-history theory (Stearns, 1992), allocating resources into immunity will compromise other vital functions such as growth and reproduction. Consequently, corals must strive to utilize resources optimally to maximize their fitness. This paradigm has been, also discussed from the growth perspective. For instance, Ruiz-Diaz et al. (2022) compared the growth rate of several hundred fragments of A cervicornis through seasonal changes in temperature and light intensity and demonstrated that the growth rate was higher during the winter months than during the summer months. To explain these seasonal growth patterns, the authors argued that growth in the winter season is higher because seawater temperature (ST) and light intensity (LI), are mild in comparison to summer, and therefore the investment of resources into growth was higher than into immunity. Other studies have also reached similar conclusions (Palmer et al., 2010; Palmer et al., 2011; Sheridan et al., 2014; Van de Water et al., 2016). That is, the level of resource allocation into immunity competency is detrimental to the allocation of resources into growth.
Given the close correspondence between immune constitutive and environmental factors and acknowledging the climate change scenario, whereby winters are becoming warmer and summers hotter, we should observe an increase in the baseline of this constitutive immunity of corals, concomitant with a reduction of growth or reproduction. For a coral species such as A. cervicornis that depend so much on growth and branch fracturing to produce new colonies, this could have a devastating effect because we may observe a reduction in growth and branch fracturing to create new individuals and because growth and mortality are closely correlated the newly formed colonies should have higher mortality.
FPs and PO in the coral literature have been mostly discussed in the context of diseases or environmental challenges. However, our study is one of the few aimed to investigate the baseline fluctuations of these immune-related proteins under normal environmental conditions. In that regard, our findings are significant to understanding how corals naturally utilize these immune-related proteins. Therefore, future studies devoted to understanding the immune response of corals through FPs and PO challenges should consider the natural fluctuation of these immune-related proteins, as the sampling period may influence the final interpretation of the results.
Data availability statement
The raw data supporting the conclusions of this article will be made available by the authors, without undue reservation.
Author contributions
C-TH and CPR-D worked equally in developing this manuscript, i.e., data collection (field and laboratory), analysis, and manuscript draft. JSR-L and LMD-V equally worked in the lab work, analysis of data, and drafting of the manuscript. MT-D, LS-P and AB-C equally worked in lab work and analysis of data. All authors contributed to the article and approved the submitted version.
Funding
This project was conducted with the support of the University of Puerto Rico Sea Grant College Program (NOAA Grant number NA14OAR4170068), NSF-CREST, grant number HRD-1736093; NIH-RISE: 5R25GM061151-19. and US Department of Education, MSEIP-P120A210035.
Acknowledgments
We would like to extend our gratitude to Dr. A. Sabat for critical review of the manuscript., P. Gómez, J.L. Sánchez, and other members of SAM for their fieldwork help.
Conflict of interest
The authors declare that the research was conducted in the absence of any commercial or financial relationships that could be construed as a potential conflict of interest.
Publisher’s note
All claims expressed in this article are solely those of the authors and do not necessarily represent those of their affiliated organizations, or those of the publisher, the editors and the reviewers. Any product that may be evaluated in this article, or claim that may be made by its manufacturer, is not guaranteed or endorsed by the publisher.
References
Alieva N. O., Konzen K. A., Field S. F., Memeshkevitch E. A., Hunt M. E., Beltran-Ramirez V., et al. (2008). Diversity and evolution of coral fluorescent proteins. PloS One 3 (7), e2680. doi: 10.1371/journal.pone.0002680
Hackerrott S., Martell H. A., Eirin-López J. M. (2021). Coral environmental memory: causes, mechanisms, and consequences for future reefs. Trends Ecol. Evolution. 36, 1011–1016. doi: 10.1016/j.tree.2021.06.014
Marangon E., Laffy P. W., Bourne D. G., Webster N. S. (2021). Microbiome-mediated mechanisms contributing to the environmental tolerance of reef invertebrate species. Mar. Biol. 168, 89. doi: 10.1007/s00227-021-03893-0
Mydlarz L. D., McGinty E. S., Harvell C. D. (2010). What are the physiological and immunological responses of coral to climate warming and disease? J. Exp. Biol. 213 (6), 934–945. doi: 10.1242/jeb.037580
O’Donnell K. E., Lohr K. E., Bartels E., Patterson J. T. (2017). Evaluation of staghorn coral (Acropora cervicornis, lamarck 1816) production techniques in an ocean-based nursery considering coral genotype. J. Exp. Mar. Bio. Ecol 487, 53–58. doi: 10.1016/j.jembe.2016.11.013
Palmer C. (2018). Warmer water affects the immunity of a tolerant reef coral. Front. Mar. Sci. 5. doi: 10.3389/fmars.2018.00253
Palmer C. V., Baird A. H. (2018). Coral tumor-like growth anomalies induce and immune response and reduce fecundity. Dis. Aquat. Organisms. 130, 77–81. doi: 10.3354/dao03258
Palmer C. V., Bythell J. C., Willis B. L. (2010). Levels of immunity parameters underpin bleaching and disease susceptibility of reef corals. FASEB J. 24, 1935–1946. doi: 10.1096/fj.09-152447
Palmer C. V., Bythell J. C., Willis B. L. (2011). A comparative study of phenoloxidase activity in diseased and bleached colonies of the coral Acropora millepora. Dev. Comp. Immunol. 35, 1096–1099. doi: 10.1016/j.dci.2011.04.001
Palmer C., McGinty E. S., Cummings D. J., Smith S., Bartels R., Mydlarz L. D. (2011). Pattern of coral ecological immunology: variation in the responses of Caribbean corals to elevated temperature and pathogen elicitor. J. Exp. Biol. 214, 4240–4249. doi: 10.1242/jeb.061267
Palmer C. V., Modi C. K., Mydlarz L. D. (2009). Coral fluorescent proteins as antioxidants. PloS One 4 (10), e7298. doi: 10.1371/journal.pone.0007298
Petes L. E., Harvell C. D., Peters E. C., Webb M. A. H., Mullen K. M. (2003). Pathogens compromise reproduction and induce melanization in Caribbean sea fans. Mar. Ecol. Prog. Ser. 264, 161–171. doi: 10.3354/meps264167
Quick C., D’Angelo C., Wiedenmann J. (2018). Trade-offs associated with photoprotective green fluorescent protein expression as potential drivers of balancing selection for color polymorphism in reef corals. Front. Mar. Sci 5. doi: 10.3389/fmars.2018.00011
Roth M. S., Deheyn M. S. (2013). Effect of cold stress and heat stress on coral fluorescence in reef-building corals. Sci. Rep. 3, 1421. doi: 10.1038/srep01421
Roth M., Lazt M., Georicke R., Deheyn D. (2010). Green fluorescent protein regulation in the coral acropora younger during photo-acclimation. J. Exp. Biol. 213, 3644–3655. doi: 10.1242/jeb.040881
Ruiz-Diaz C. P., Toledo-Hernández C., Sánchez J. L. (2022). The effects of depth-related environmental factors and source of collection on life history traits in Acropora cervicornis raised in nurseries. Water J. 14, 212. doi: 10.3390/w14020212
Salih A., Larkum A., Cox G., Kuhl M., Hoegh-Gulderg O. (2000). Fluorescent pigments in corals are photoprotective. Nature 408, 850–853. doi: 10.1038/35048564
Sheridan C., Grosjean PH., Leblud J., Palmer C. V., Kusmaro A., Eackhout I. (2014). Sedimentation rapidly induces an immune response and depletes energy in hard coral. Coral Reef 33, 1067–1076. doi: 10.1007/s00338-014-1202-x
Stearns S. C. (1992). The evolution of life histories (Oxford, UK: Oxford University Press). doi: 10.1038/srep17639
Van de Water J. A. J. M., Lamb J. B., Heron S. F., van Oppen M. J. H., Will B. L. (2016). Temporal patterns in innate immunity parameters in reef-building corals and linkages with local climatic conditions. Ecosphere 7 (11), e01505. doi: 10.1002/esc2.1505
Van de Water J. A. J. M., Lamb J. B., van Oppen ,. M. J. H., Willis B. L., Bourne D. G. (2015). Comparative immune responses of coral to stressors associated with offshore reef-based tourist platforms. Conerv Physiol. 3 (1), cov032. doi: 10.1093/conphys/cov032
Keywords: climate change, fluorescent proteins (FPs), phenoloxidase (PO) activity, coral immunity, coral farms
Citation: Toledo-Hernández C, Ruiz-Diaz CP, Ramírez-Lugo JS, Torres-Díaz M, Santiago-Pagán L, Bruno-Chardón A and Díaz-Vázquez LM (2023) Uncovering the link between environmental factors and coral immunity: A study of fluorescent protein expression and phenoloxidase activity in Acropora cervicornis. Front. Mar. Sci. 10:1133486. doi: 10.3389/fmars.2023.1133486
Received: 29 December 2022; Accepted: 15 February 2023;
Published: 02 March 2023.
Edited by:
Virginia M. Weis, Oregon State University, United StatesReviewed by:
Nicholas MacKnight, University of Miami, United StatesBradford Dimos, Washington State University, United States
Copyright © 2023 Toledo-Hernández, Ruiz-Diaz, Ramírez-Lugo, Torres-Díaz, Santiago-Pagán, Bruno-Chardón and Díaz-Vázquez. This is an open-access article distributed under the terms of the Creative Commons Attribution License (CC BY). The use, distribution or reproduction in other forums is permitted, provided the original author(s) and the copyright owner(s) are credited and that the original publication in this journal is cited, in accordance with accepted academic practice. No use, distribution or reproduction is permitted which does not comply with these terms.
*Correspondence: Carlos Toledo-Hernández, Y2d0aDA5MThAZ21haWwuY29t; Claudia Patricia Ruiz-Diaz, Y2xhdWRpYXBhdHJpY2lhcnVpekBnbWFpbC5jb20=