 Curtis J. Szewczyk
 Erik M. Smith
 Claudia R. Benitez-Nelson
94% of researchers rate our articles as excellent or good
Learn more about the work of our research integrity team to safeguard the quality of each article we publish.
Find out more
ORIGINAL RESEARCH article
Front. Mar. Sci., 02 March 2023
Sec. Marine Biogeochemistry
Volume 10 - 2023 | https://doi.org/10.3389/fmars.2023.1133336
This article is part of the Research TopicOxygen Decline in Coastal Waters: Its Cause, Present Situation and Future ProjectionView all 7 articles
Dissolved oxygen (DO) impairment within coastal waters is widespread and rising temperatures may exacerbate low DO levels by enhancing organic matter (OM) degradation. Here, the temperature sensitivity of OM degradation was investigated as DO decay rates determined during standard five-day biochemical oxygen demand (BOD) measurements conducted under different incubation temperatures. Sampling was conducted in the Waccamaw River watershed, South Carolina, a blackwater river with extensive forested wetland that also receives drainage from stormwater detention ponds associated with coastal development, thus providing different sources of contrasting OM composition. Temperature sensitivities were measured as Q10 temperature coefficients, which define how DO decay rates change with 10 degrees of warming. The average Q10 value for the wetland sites (2.14 ± 0.41) was significantly greater (p < 0.05) than those measured in either the River (1.49 ± 0.36) or stormwater ponds (1.41 ± 0.21). Furthermore, using Intergovernmental Panel on Climate Change intermediate-to-very high temperature estimates for 2100 of +2.7 – 4.4°C, average predicted increases in DO decay rates for wetlands (~22-39%) are more than double the River (~11-18%) and stormwater pond rates (~9-16%). Our findings for inland, coastal waters agree with previous results for soils, suggesting that temperature sensitivities are variable across sites and increase with more complex, lower quality OM. Future modeling scenarios of DO utilization must therefore consider the influence of OM heterogeneity and the temperature sensitivity response of OM degradation across sources and region to better predict how climate change may impact oxygen impairment in aquatic ecosystems.
Deoxygenation is a critical issue facing numerous marine systems (Earle et al., 2018) with open ocean oxygen minimum zones expanding throughout the late 20th and early 21st centuries (Stramma et al., 2008). Dissolved oxygen (DO) impairment and hypoxic conditions (oxygen concentrations < 2 mg L-1) are also increasingly common within coastal (Breitburg et al., 2018) and inland (Saari et al., 2018) waters. Hypoxia may cause large shifts in ecological and environmental conditions, such as increasing eutrophication via an increase in the sediment release of nutrients (Testa and Kemp, 2012), adversely affecting fish growth rates, and contributing to fish kills in both the coastal zone (Breitburg, 2002) and within aquaculture systems (Abdel-Tawwab et al., 2019). Several studies have further shown that even DO concentrations above hypoxic thresholds (2.4 to 4.8 mg L-1) can lead to species decline (Environmental Protection Agency, U. S., 2000; Vaquer-Sunyer and Duarte, 2008; Saari et al., 2018).
Most work on the underlying causes of coastal hypoxia have focused on nutrient loading and increasing temperatures associated with climate change (e.g., Meire et al., 2013; Low et al., 2021). For example, increasing water temperatures result in a decrease in DO solubility (Keeling et al., 2010). A temperature increase of 2.7 to 4.4°C by 2100 under two greenhouse gas emissions scenarios, intermediate (SSP2-4.5) and very high (SSP5-8.5), therefore results in a DO saturation decline of 5-10% (Oschlies, 2019; IPCC, 2021). The greater delivery of nutrients to coastal waters, often associated with urbanization, results in higher rates of primary production that in turn lead to the formation of sinking organic matter that is remineralized below the depth of gas exchange, or the mixed layer and depletes bottom water DO (Diaz and Rosenber, 2008; Howarth et al., 2011). It has also been recognized that greater anthropogenic delivery of nutrients to carbon-rich waters can directly stimulate organic matter remineralization and enhanced DO consumption (Mallin et al., 2004; Rosemond et al., 2015). At the same time, biological rates of production, respiration, and organic matter (OM) degradation, as well as community composition, are all also influenced by temperature (Lloyd and Taylor, 1994; Pietikäinen et al., 2005; Vázquez-Domínguez et al., 2007). For example in an analysis of warming impacts in Chesapeake Bay, declines in DO solubility coupled with greater water column stratification accounted for 67% of bottom water DO declines, with the remaining 33% attributed to changes in biological rates, mainly heterotrophic remineralization (Tian et al., 2021). Thus, teasing apart the various processes influencing DO, reduced DO solubility, enhanced OM production and remineralization, and temperature responses to biologically mediated growth and respiration, are critical.
The metabolic theory of ecology (MTE) argues that biological processes largely possess a similar temperature sensitivity, commonly expressed as a Q10 temperature coefficient of 2.0 (Gillooly et al., 2001; Brown et al., 2004), where Q10 reflects the exponential effect of a 10°C rise in temperature on the biologically mediated degradation rate. A value of 2.0 thus indicates a doubling in degradation rate with 10°C of warming. Most studies within aquatic systems have followed the MTE model and assumed that biologically mediated OM degradation rates have a relatively uniform temperature sensitivity (Gillooly et al., 2001; Brown et al., 2004) regardless of the source or heterogeneity of the OM available for degradation. Within terrestrial soils there is an increasing body of work that suggests there are variable temperature sensitivities across OM composition (or “quality”) resulting from different OM sources (Sierra, 2012). For example, Bosatta and Ågren (1999) have shown that the decomposition rate of low-quality (recalcitrant) OM substrates increases more rapidly with increasing temperatures relative to high-quality (labile) substrates. The greater temperature sensitivity of low-quality OM is hypothesized to be due to the alleviation of higher activation energies associated with the breakdown of more complex chemical bonds (Davidson and Janssens, 2006). Several studies have since determined elevated temperature sensitivities, measured as Q10 temperature coefficients, for lower-quality OM (Fierer et al., 2005; Conant et al., 2008). Similar temperature sensitivity studies within aquatic systems are rare, although Lønborg et al. (2019) found that metabolic responses to temperature varied relative to the bioavailability of DOM within tropical waters. These results are intriguing given the synergies between rising temperatures, OM degradation, and resulting low DO concentrations in coastal waters, especially with increasing population growth. For example, urbanization may alter OM composition and promote nonpoint source inputs of readily degradable, high quality, OM (Arndt et al., 2013; Hosen et al., 2014) characterized by lower degrees of aromaticity and molecular weight.
In this study, we explore the relationship of OM source on the temperature sensitivity of OM degradation, as determined by DO consumption rate, in the blackwater Waccamaw River watershed, South Carolina. Coastal blackwater rivers are dominated by terrestrially derived OM and are common in the Southeast and Gulf coasts of the U.S., as well as within other semi-tropical latitudes globally (Meyer, 1990). These waters are designated as “blackwater” due to their tea-colored waters, which occurs due to the large influence of chromophoric dissolved organic matter (CDOM) (Gallegos, 2005). Blackwaters are often light limited, which reduces autotrophic production (Lewis, 1988; Phlips et al., 2000). High concentrations of terrestrial OM and low light levels also make these systems naturally low in DO, although this can be exacerbated by anthropogenic disturbances in their watersheds (Todd et al., 2009). The Waccamaw River, in particular, experiences periodic DO impairment, as characterized by daily minimum DO concentrations < 4.0 mg L-1, that is associated with increasing urbanization in its watershed (SCDHEC, 1999; SCDHEC, 2014). As such, the Waccamaw River serves as an ideal system to explore our objective, investigating the potential for how distinct OM sources influence DO demand in response to increasing temperature. Based on terrestrial OM research, it is hypothesized that sites dominated by lower quality OM will display the greatest temperature sensitivities. If this relationship is supported within aquatic systems, sites characterized by low-quality OM might experience greater oxygen consumption, providing further insight on the potential influence of increasing temperatures associated with climate change on deoxygenation in coastal, inland systems.
The Waccamaw River is a tidal, coastal plain river typical of the southeastern United States located within the greater Pee Dee Basin. As part of the Intracoastal Waterway, its waters can influence coastal activity, as the Waccamaw River drains into Winyah Bay and North Inlet Estuary before entering the Atlantic Ocean (Figure 1). Its watershed is dominated by extensive forested wetlands (39.3% of land use). These wetlands are common in the region, and similar systems have been estimated to export vast quantities of DOM, upwards of 4 to 119 x 1010 g y-1, within the southeastern United States (Spencer et al., 2013). The high CDOM content gives the River its characteristic blackwater designation (SCDHEC, 2015) and the pH typically varies between 6 and 7, according to data from Conway Marina (USGS site number: 2110704). Although blackwater rivers are naturally prone to low DO concentrations, increasing residential and peri-urban development (15.4% of land use) in the greater Myrtle Beach, South Carolina, area contributes substantial delivery of additional anthropogenic OM (SCDHEC, 2015). While South Carolina does not have distinct dry- versus wet-seasons, highest monthly precipitation occurs in the summer throughout the state’s coastal region due to the influence of sea-breeze generated thunderstorm activity (Runkle et al., 2022). A characteristic feature of residential development in this region is the construction of stormwater detention ponds. According to 2013 aerial imagery, over 9,000 stormwater ponds currently exist within the South Carolina coastal zone and are used as a best management practice for controlling stormwater runoff (Smith et al., 2018). These ponds are constructed to meet stormwater permit requirements associated with land disturbing activities and are engineered to capture and detain the first 0.5 to 1.0 inch (1.27 to 2.54 cm) of rainfall over the developed area. In retaining this “first flush” of stormwater flow, stormwater ponds also provide water quality treatment by containing land-derived nutrients and OM. Despite alleviating first flush effects, impervious surface coverage and stormwater conveyance connectivity result in wet detention ponds located in urbanized areas that continue to release elevated volumes of runoff, relative to undeveloped regions (Gold et al., 2020). Further, by containing nutrient runoff from developed landscapes, these ponds also provide ideal conditions for the excessive growth of algae (Lewitus et al., 2003), which can lead to the production and export of large quantities of high-quality, labile OM that contributes to increased biochemical oxygen demand (BOD) in downstream receiving waters (McCabe et al., 2021).
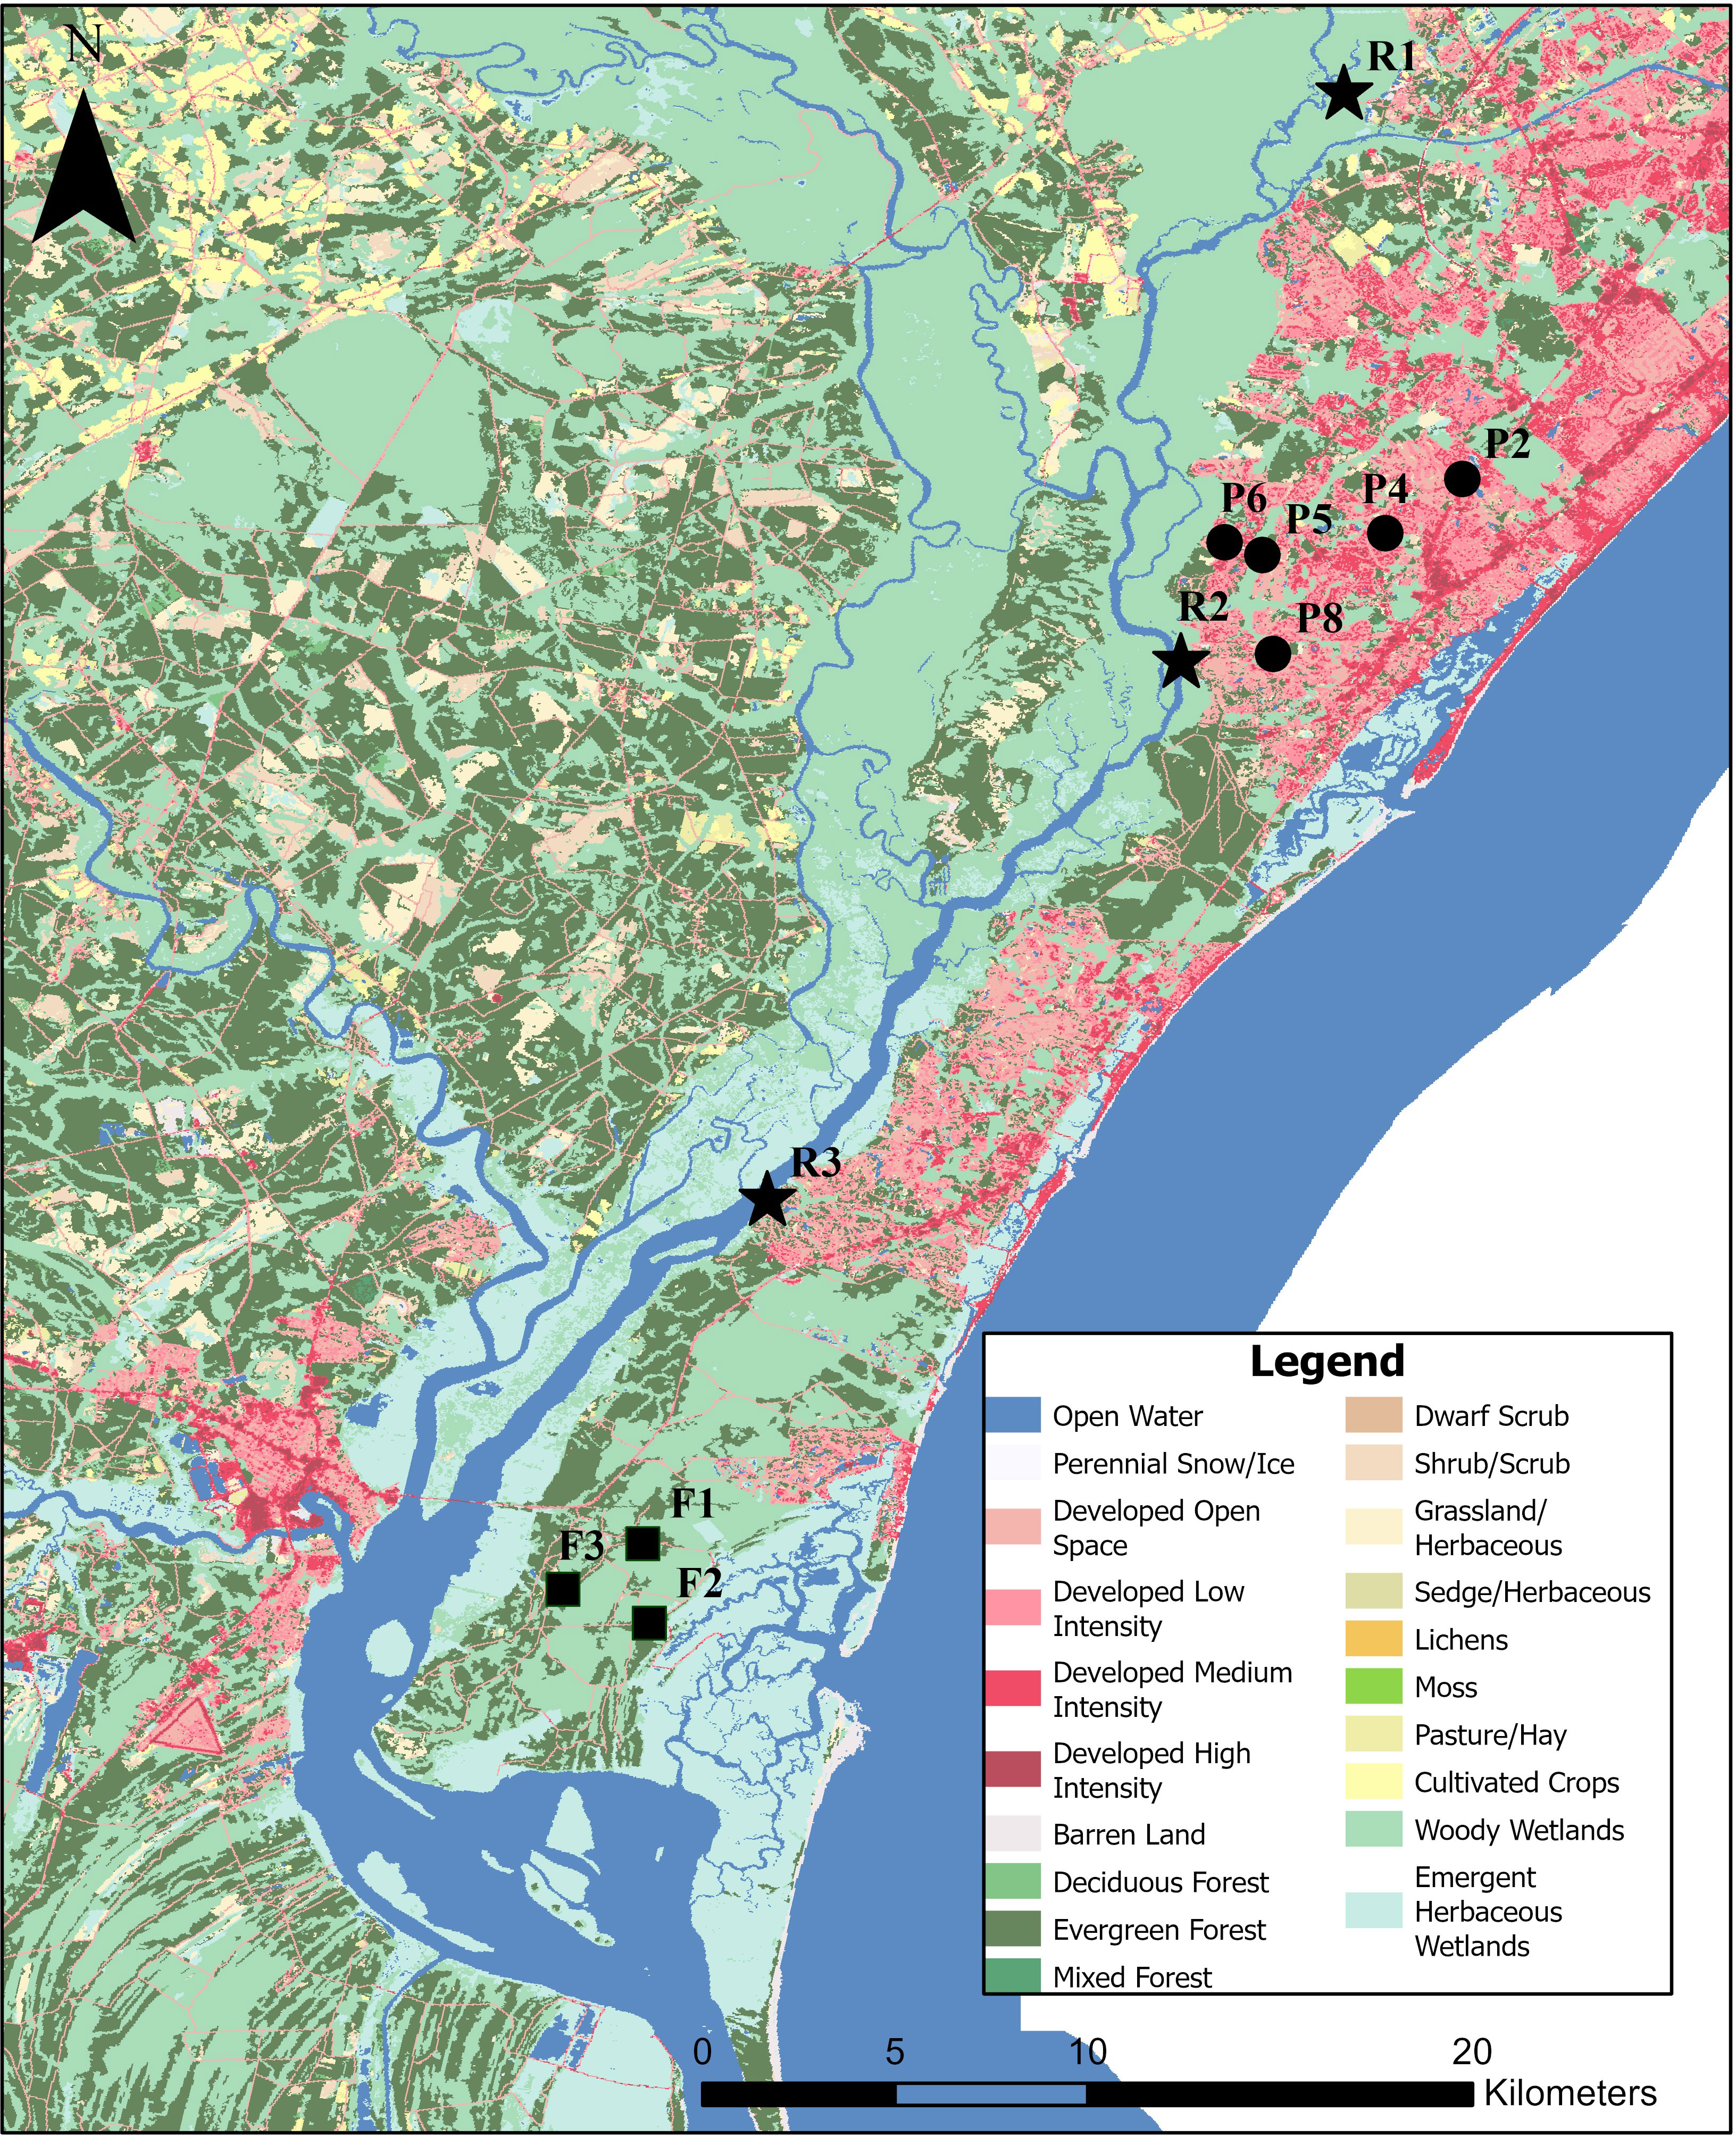
Figure 1 Site map displaying land cover base map from USGS National Land Cover Database (https://www.usgs.gov/centers/eros/science/national-land-cover-database). The different symbols refer to the different site types and locations with circles, stars, and squares corresponding to stormwater detention ponds (P), Waccamaw River (R), and forested wetland (F) sites. See Table 1 for site details.
To characterize OM decomposition rates and temperature sensitivities, OM from various watershed sources (Figure 1) was collected at different times during the summer of 2020 (June 5 – August 5) from multiple wetland (n=3) and pond (n=5) systems (Table 1). The wetlands, which can be considered dystrophic, sensu Wetzel (2001), were all located within the reaches of Hobcaw Barony, a protected and undeveloped tract of land in the lower Waccamaw River watershed. All stormwater pond samples were collected from medium-density, residential developments located in Georgetown and Horry counties, South Carolina. Replicate samples were also collected from three locations within the lower main stem of the Waccamaw River, where a total maximum daily load (TMDL) was established for DO impairment in 1999 (SCDHEC, 1999). Due to the Waccamaw River receiving a heterogenous mixture of inputs, from high-quality pond OM to low-quality wetland OM, it is hypothesized that the Waccamaw River will display an intermediate response relative to the endmember OM sources.
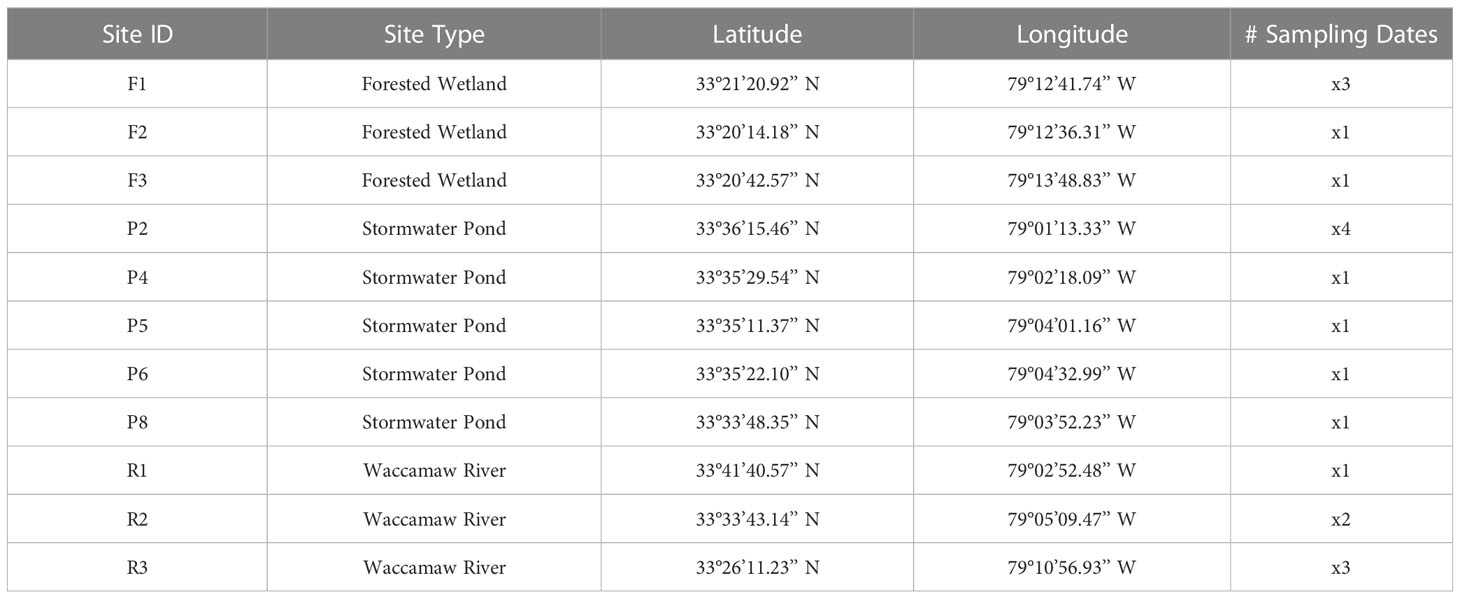
Table 1 Sampling site information.
Water samples (20 L) were collected with a diaphragm pump into pre-cleaned LDPE carboys for transport back to the lab. Since water temperatures were roughly similar to ambient air temperatures, carboys were transported as is, to roughly maintain ambient sample temperatures during the brief transport to the laboratory (generally < 1 h). Surface water samples were immediately split back in the laboratory into three replicates to mirror three temperature regimes: (1) 20°C, the standard incubation temperature for the determination of 5-day BOD (BOD5; Eaton et al., 2005); (2) 27.5°C, which serves as a close approximation of the average summer temperature observed in the Waccamaw River during our sampling period (27.1°C); and (3) 35°C, several degrees above the maximum ambient summer temperature observed during our sampling season (30.8°C). Our highest temperature regime of 35.0°C allows for the inference of potential climate change within the region, following the very high (SSP5-8.5) scenario of greenhouse gas emissions, which predicts a global temperature increase of 4.4°C by the end of the century (IPCC, 2021). Note that these open-bottle replicates were equilibrated overnight at the selected temperature prior to the start of the experiment, thus ensuring that changes in DO within the bottles were a result of biological processing and not from changes in DO solubility. Temperature-equilibrated samples were further partitioned into three, 300 mL borosilicate glass BOD bottles prior to further incubation. Initial and subsequent measurements of DO within each BOD bottle were made approximately every 12 hours over the course of 5-day dark incubations through utilization of a Wiltrox 1 (Loligo Systems, Denmark) chemiluminescent oxygen meter for mini sensors (accuracy ± 0.4%/precision ± 0.1%). The instrument employs fiber optic technology and internally adhered sensor membranes within each bottle, allowing for time-series measurements of DO on individual bottles without invasive sampling. Consumption of DO was measured and calculated both as the absolute BOD5 and the relative decay rate of the DO time series over 5-days. Lastly, the temperature sensitivity of each sample was quantified as the Q10 temperature coefficient using the rate of DO decay at the various temperature regimes.
Prior to temperature equilibration, a suite of additional measurements were collected to further characterize the study sites. Samples were filtered using pre-combusted, 25 mm diameter, 0.7 μm nominal pore size, glass fiber filters (GF/F). The particulate fraction was analyzed for particulate carbon (PC), particulate nitrogen (PN), molar C:N ratios (C:N), total particulate phosphorus (TPP), particulate inorganic phosphorus (PIP), particulate organic phosphorus (POP), and chlorophyll-a (Chl-a) concentrations. The filtrate was analyzed for dissolved organic carbon (DOC), total dissolved nitrogen (TDN), and total dissolved phosphorus (TDP) concentrations as well as for DOM absorbance spectral metrics, including the specific ultraviolet absorbance at 254 nm (SUVA254) and absorption coefficients at 250, 254, 365, and 436 nm (a250, a254, a365 and a436). The magnitude of SUVA254 is commonly used to infer the degree of aromaticity (Weishaar et al., 2003) and a355 is commonly used as a relative measure of the abundance of CDOM within the DOM pool (Zhang et al., 2009). The a250/a365, or E2/E3 ratio, is used as an inverse metric of DOM molecular weight (Dahlén et al., 1996) and the a254/a436 ratio is frequently used to assess allochthonous (low ratios) versus autochthonous DOM (high ratios) (Battin, 1998; Jaffé et al, 2004). Through the determination of these parameters, differences among sites were evaluated and used to help explain variable temperature responses and overall oxygen demand experienced within our study.
PC and PN were analyzed on a PerkinElmer Series II CHNS/O Analyzer 2400. Previous work has shown that stormwater catchments within coastal South Carolina possess only negligible amounts of inorganic carbon, thus total PC is assumed to be equal to POC (Schroer et al., 2018). The molecular ratio of PC : PN was calculated to assess the C:N ratios of our sites. To determine the concentrations of TPP and PIP, the ash/hydrolysis method was used (Aspila et al., 1976; Benitez-Nelson et al., 2007). The calculated difference between TPP and PIP was used to determine POP. A Turner Trilogy Laboratory Fluorometer was used to determine the concentration of Chl-a following U.S. EPA method 445.0 (Arar et al, 1997).
DOC was determined following methodology described by Benner and Strom (1993). Briefly, samples were acidified to pH 2 with 10% hydrochloric acid (HCl) prior to analysis using high-temperature combustion on a TOC-VCPN Shimadzu Analyzer. TDN and TDP were analyzed on a SEAL Analytical AA3 nutrient auto analyzer following Standard Methods SM 4500-N C (Eaton et al., 2005). Absorbance spectra of DOM was measured from 250 to 550 nm with a Shimadzu UV-2450 UV-Vis dual-beam spectrophotometer and then converted to absorption coefficients at 250 nm (a250), 254 nm (a254), 355 nm (a355), 365 (a365) and 436 nm (a436) with units of m-1. The ratios of E2/E3 (a250/a365) and a254/a436 were then calculated. To calculate SUVA254 (L mg-1 m-1), a254 values were normalized to DOC concentrations converted from μM to mg L-1.
All statistical analyses were completed using R (version 4.0.3) (R Core Team, 2022) and errors were determined from the standard deviation of replicate measurements. To determine how the Waccamaw River varied with the source water from wetlands and ponds, the use of one-way analysis of variance (ANOVA) was utilized when the data (or log transformed data) were considered normally distributed via Shapiro-Wilk tests. If assumptions of normality were not met, the use of non-parametric Kruskal Wallis tests were conducted to test differences in concentrations or degradation rates between site types (e.g., Waccamaw River, stormwater detention ponds, and forested wetlands). Significant differences were further examined using parametric, Tukey HSD or non-parametric, Conover-Iman tests (Dinno, 2017) (Bonferroni adjustment method) to identify specific differences among groups. The decay rates of DO were calculated using the slope of natural log transformed decay trends, averaged per triplicate bottle within each sample and temperature regime combination. Temperature sensitivity, Q10 was calculated following the van’t Hoff equation:
Where R1 and R2 correspond to the DO decay rate over the 5-day incubations at a given temperature (T) treatment, with R1 being the rate of DO decay at the lower temperature, T1, and R2 corresponding to the rate at the higher temperature, T2. The Q10 temperature coefficient was calculated both at the lower temperature range (20 to 27.5°C) and the upper temperature range (27.5 to 35°C). All datasets for this study are available in Szewczyk et al. (2022).
Shifts in DO concentrations were assumed to be the result of internal biological processing, as bottling occurred after equilibration and samples were incubated at steady-state temperatures. Average BOD5 differs among temperature regimes (F[2, 16] = 6.48, p < 0.05); and was highest for ponds (2.65 ± 1.03 mg O2 L-1), followed by the wetlands (2.07 ± 0.50 mg O2 L-1) and the Waccamaw River (1.26 ± 0.60 mg O2 L-1). Within each temperature treatment, there were significant increases (p < 0.05) in the average DO decay rate with temperature across sites, but to differing extents (Figure 2). The greatest overall shift between DO decay rates at 20°C and 35°C occurred within wetlands (0.05 to 0.18 d-1), followed by ponds (0.07 to 0.16 d-1), and the Waccamaw River (0.03 to 0.08 d-1). Trends in Q10 are summarized in Figure 3. The lower temperature range (20 to 27.5°C) had higher Q10 temperature coefficients in the wetlands and River relative to the ponds, although differences were not significant due to high variability (F[2, 16] = 1.99, p = 0.169). In contrast, the Q10 temperature coefficients for the upper range (27.5 to 35°C) differed significantly (F[2, 16] = 7.77, p < 0.05) and were highest in the wetlands (2.14 ± 0.41) (padj < 0.05) relative to either the River (1.49 ± 0.36) or the ponds (1.41 ± 0.21).
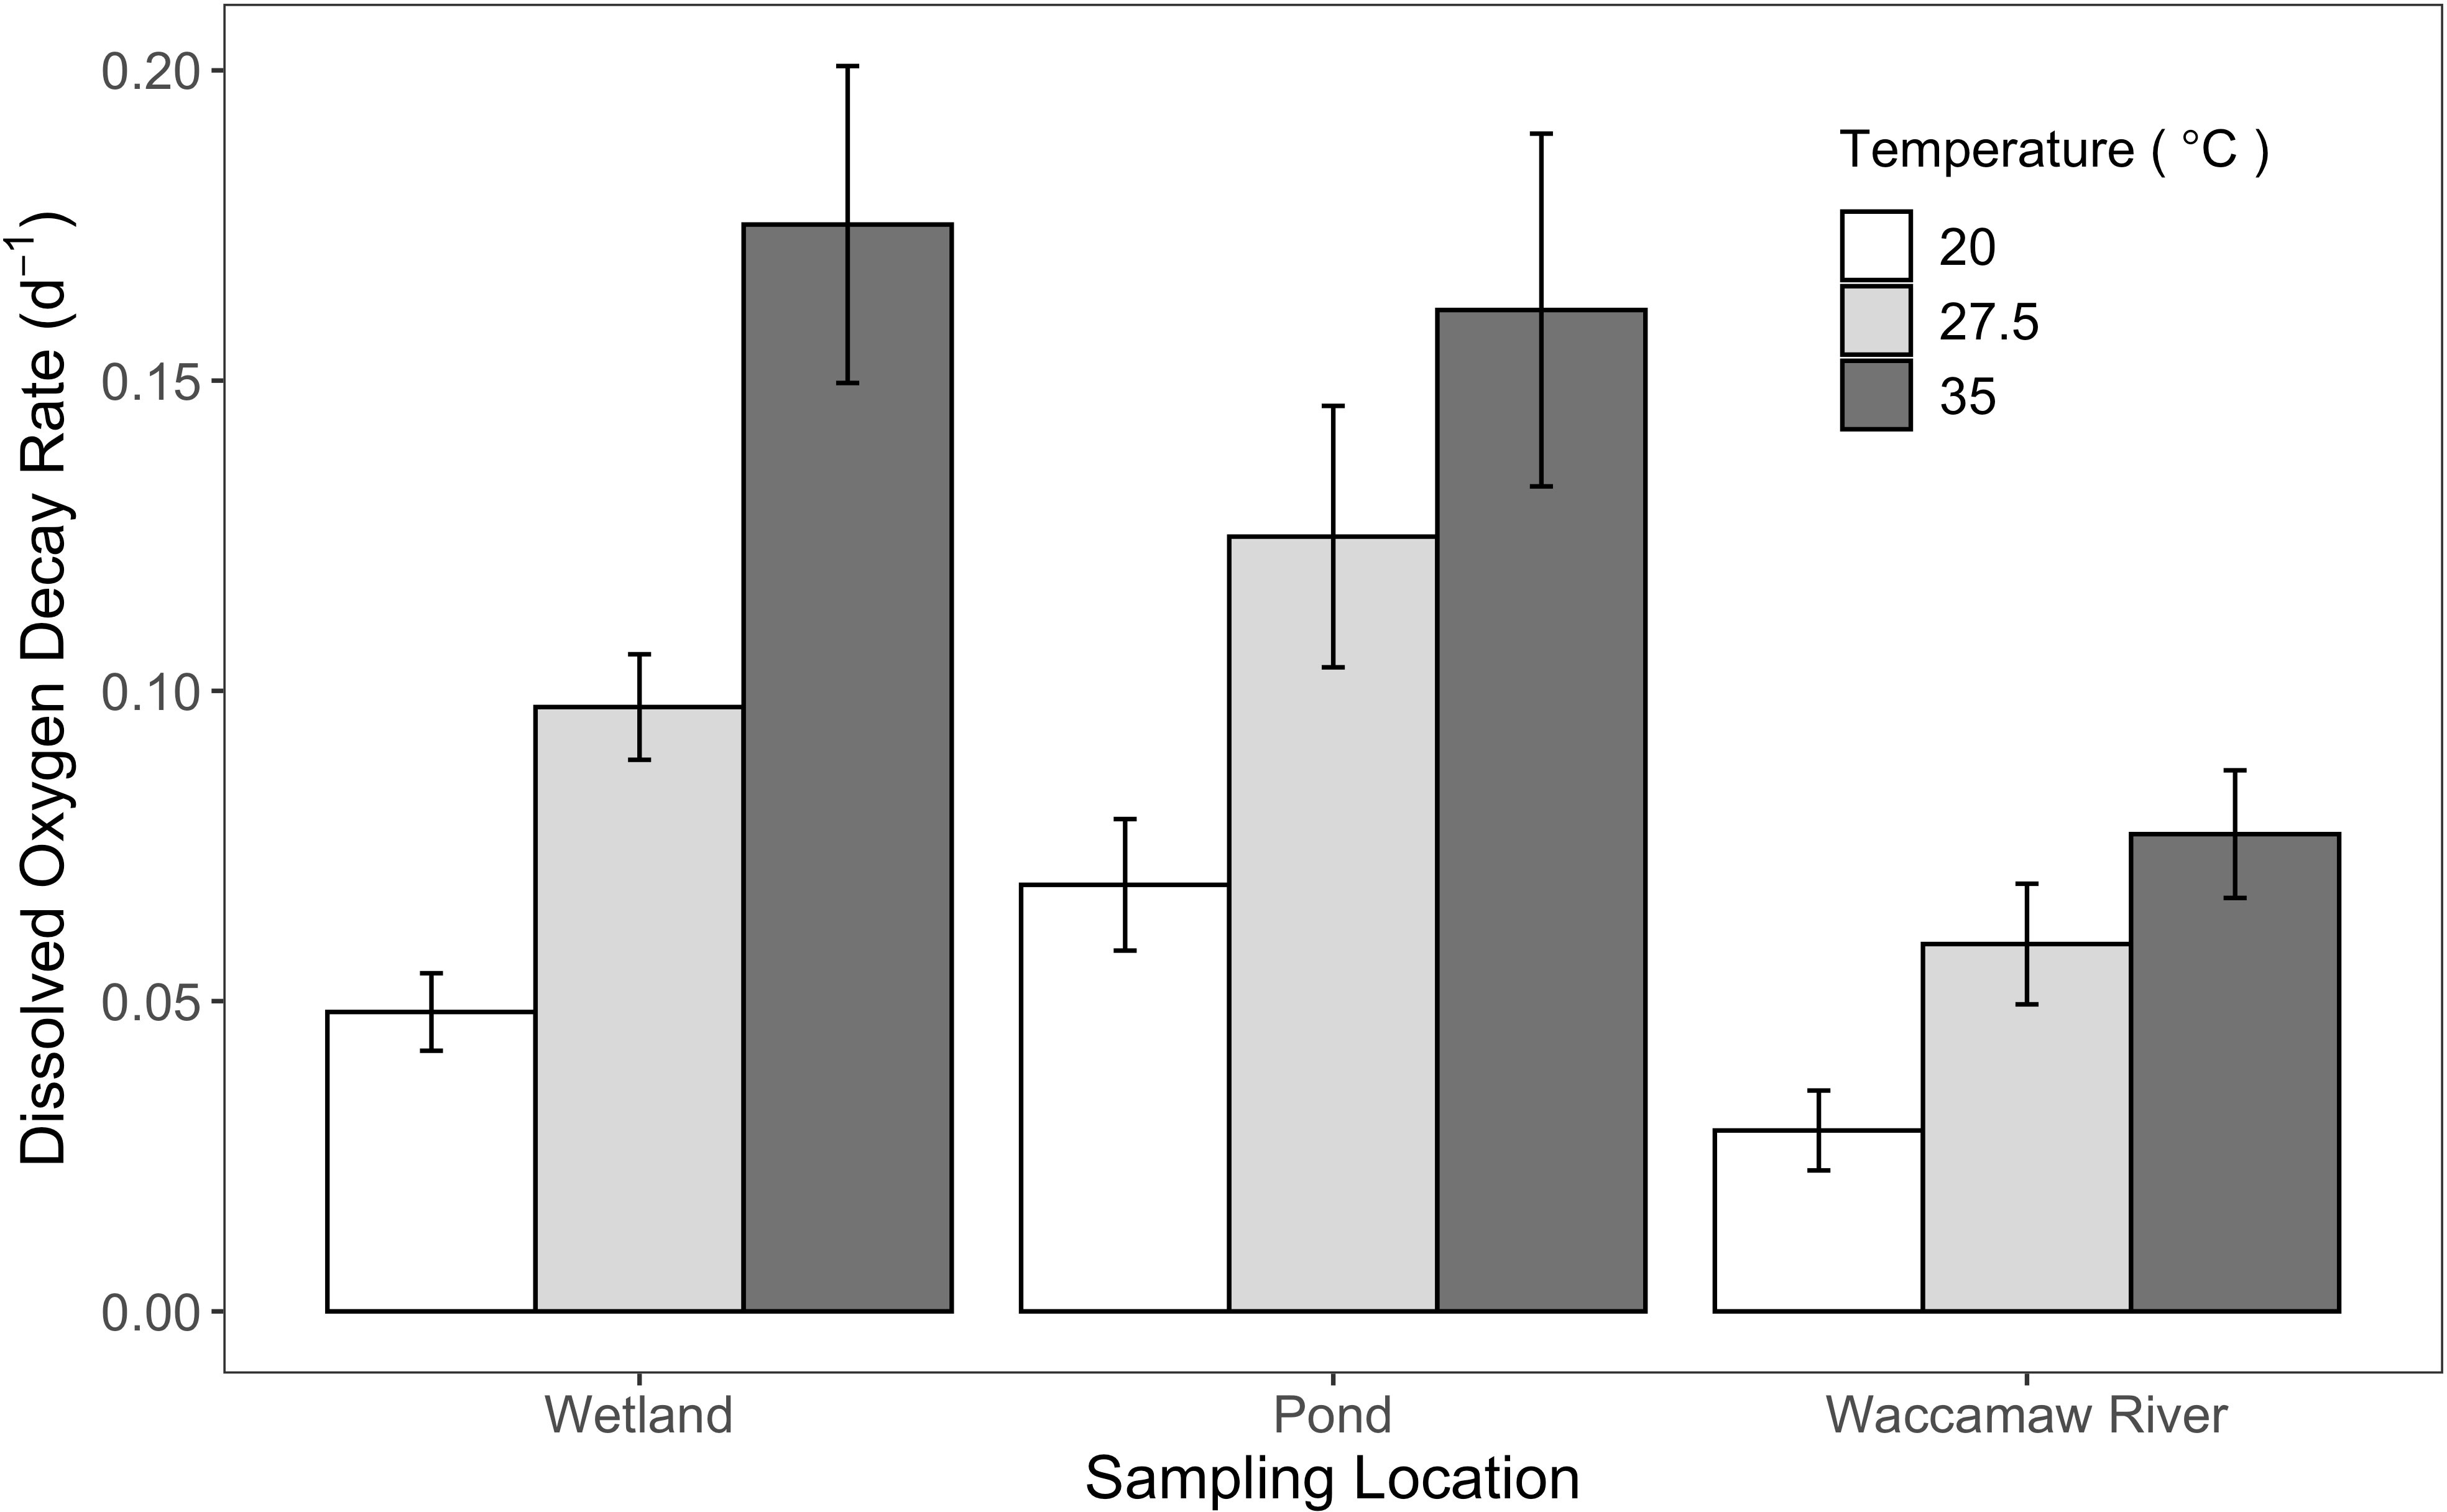
Figure 2 Bar plot displaying the average decay rates of dissolved oxygen (DO) (d-1) for each site type: forested wetland, the Waccamaw River, and stormwater detention ponds; error bars represent standard error. Plots are grouped by incubation temperature: 20 (white), 27.5 (light gray), and 35°C (dark gray).
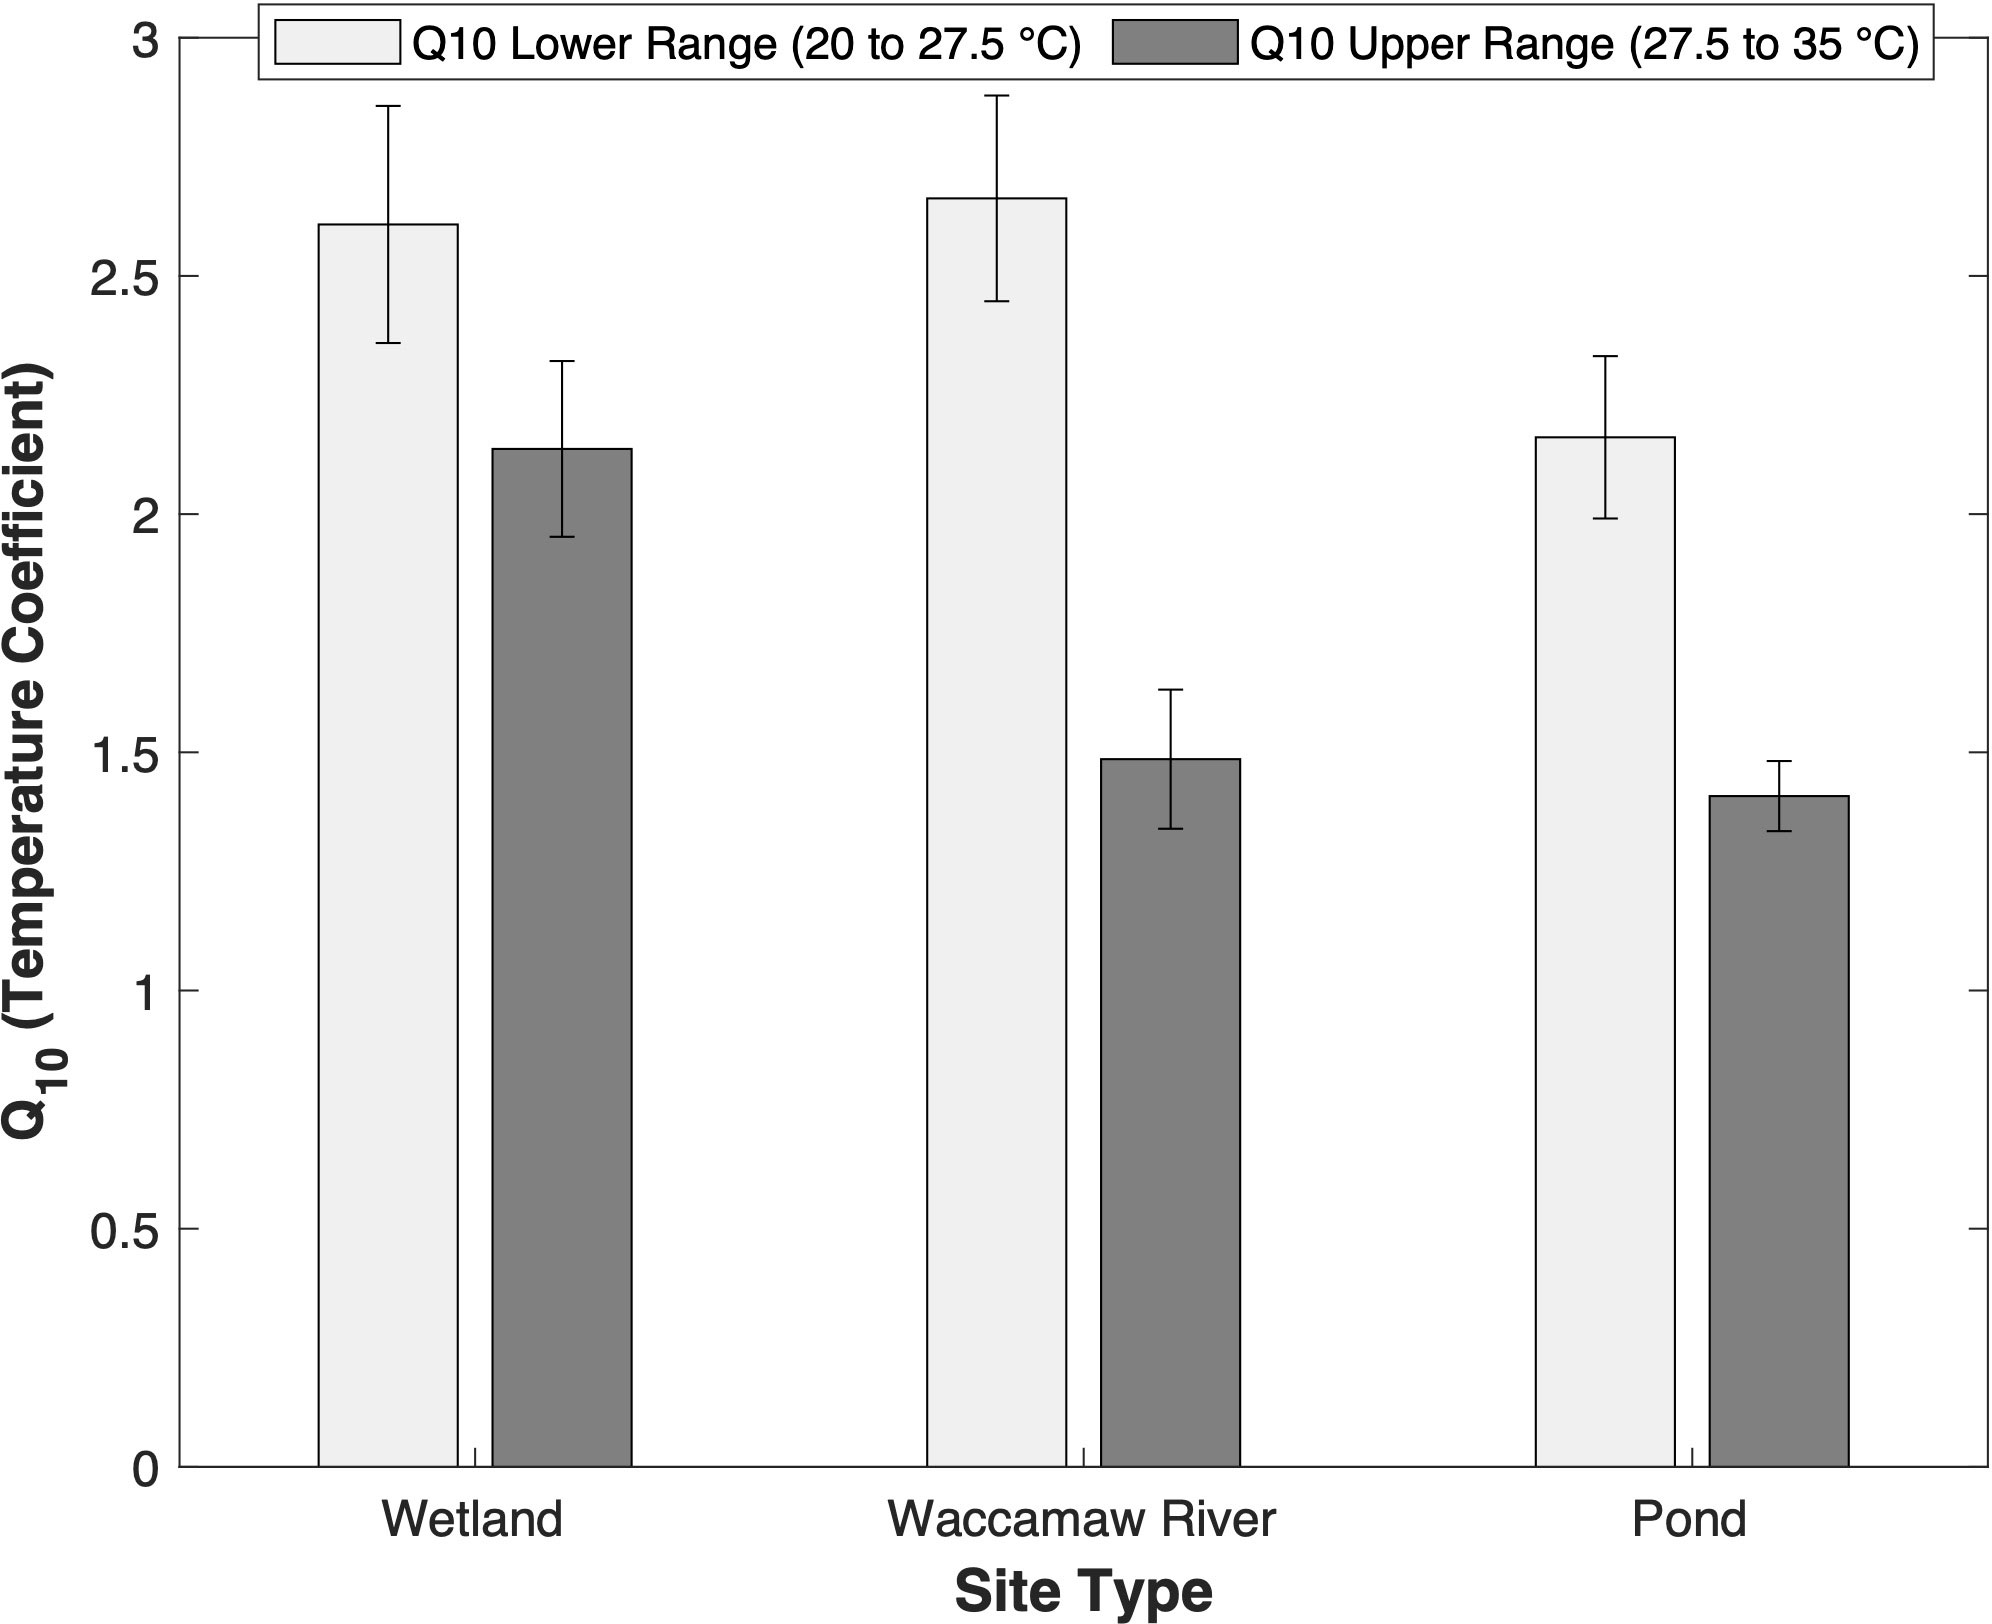
Figure 3 Bar graph depicting the Q10 temperature coefficients for each site type (forested wetlands, Waccamaw River, and stormwater detention ponds) at two temperature ranges: Lower range (20 to 27.5°C, light bars) and upper range (27.5 to 35°C, dark bars). Error bars represent standard error across group replication. ANOVA tests yielded no significant differences for the lower range Q10 values across sites (p > 0.05), however, for the upper range, wetlands yielded significantly higher values (p < 0.05).
Ambient monitoring of daily, minimum DO concentrations at Hagley Landing (USGS site number: 2110815) in the Waccamaw River from 2010 to 2020 (Figure 4) confirms seasonally low DO impairment (< 4.0 mg L-1) during the summer. Impaired DO conditions have continued to occur despite implementation of TMDL regulations for the region, specifically implemented to reduce the prevalence of low DO (SCDHEC, 1999). Although the data are highly seasonal, a Seasonal Kendall Test (McLeod, 2022) confirmed that DO concentrations have continued to monotonically decline over the decade (p < 0.001; τ = -0.073) while average temperatures have increased (p < 0.001, τ = 0.066). In order to separate the effects of reduced DO solubility from other processes, a second data monitoring station located at Conway Marina (USGS site number: 2110704) within the Waccamaw River was explored (Figure 5). Expected DO equilibrium concentrations were determined using ambient site temperatures, altitude, and an assumed salinity of 0 (the monitoring site is well above tidally induced saltwater intrusions). While measured monthly average DO concentrations displayed a significant negative regression with temperature (F[1, 91] = 805, p < 0.001, R2adj = 0.89), absolute DO concentrations were 1.5 to 6.5 mg L-1 lower than that determined from equilibrium with the overlying atmosphere. As temperatures increase, observed DO concentrations deviate further from expected DO equilibrium concentrations.
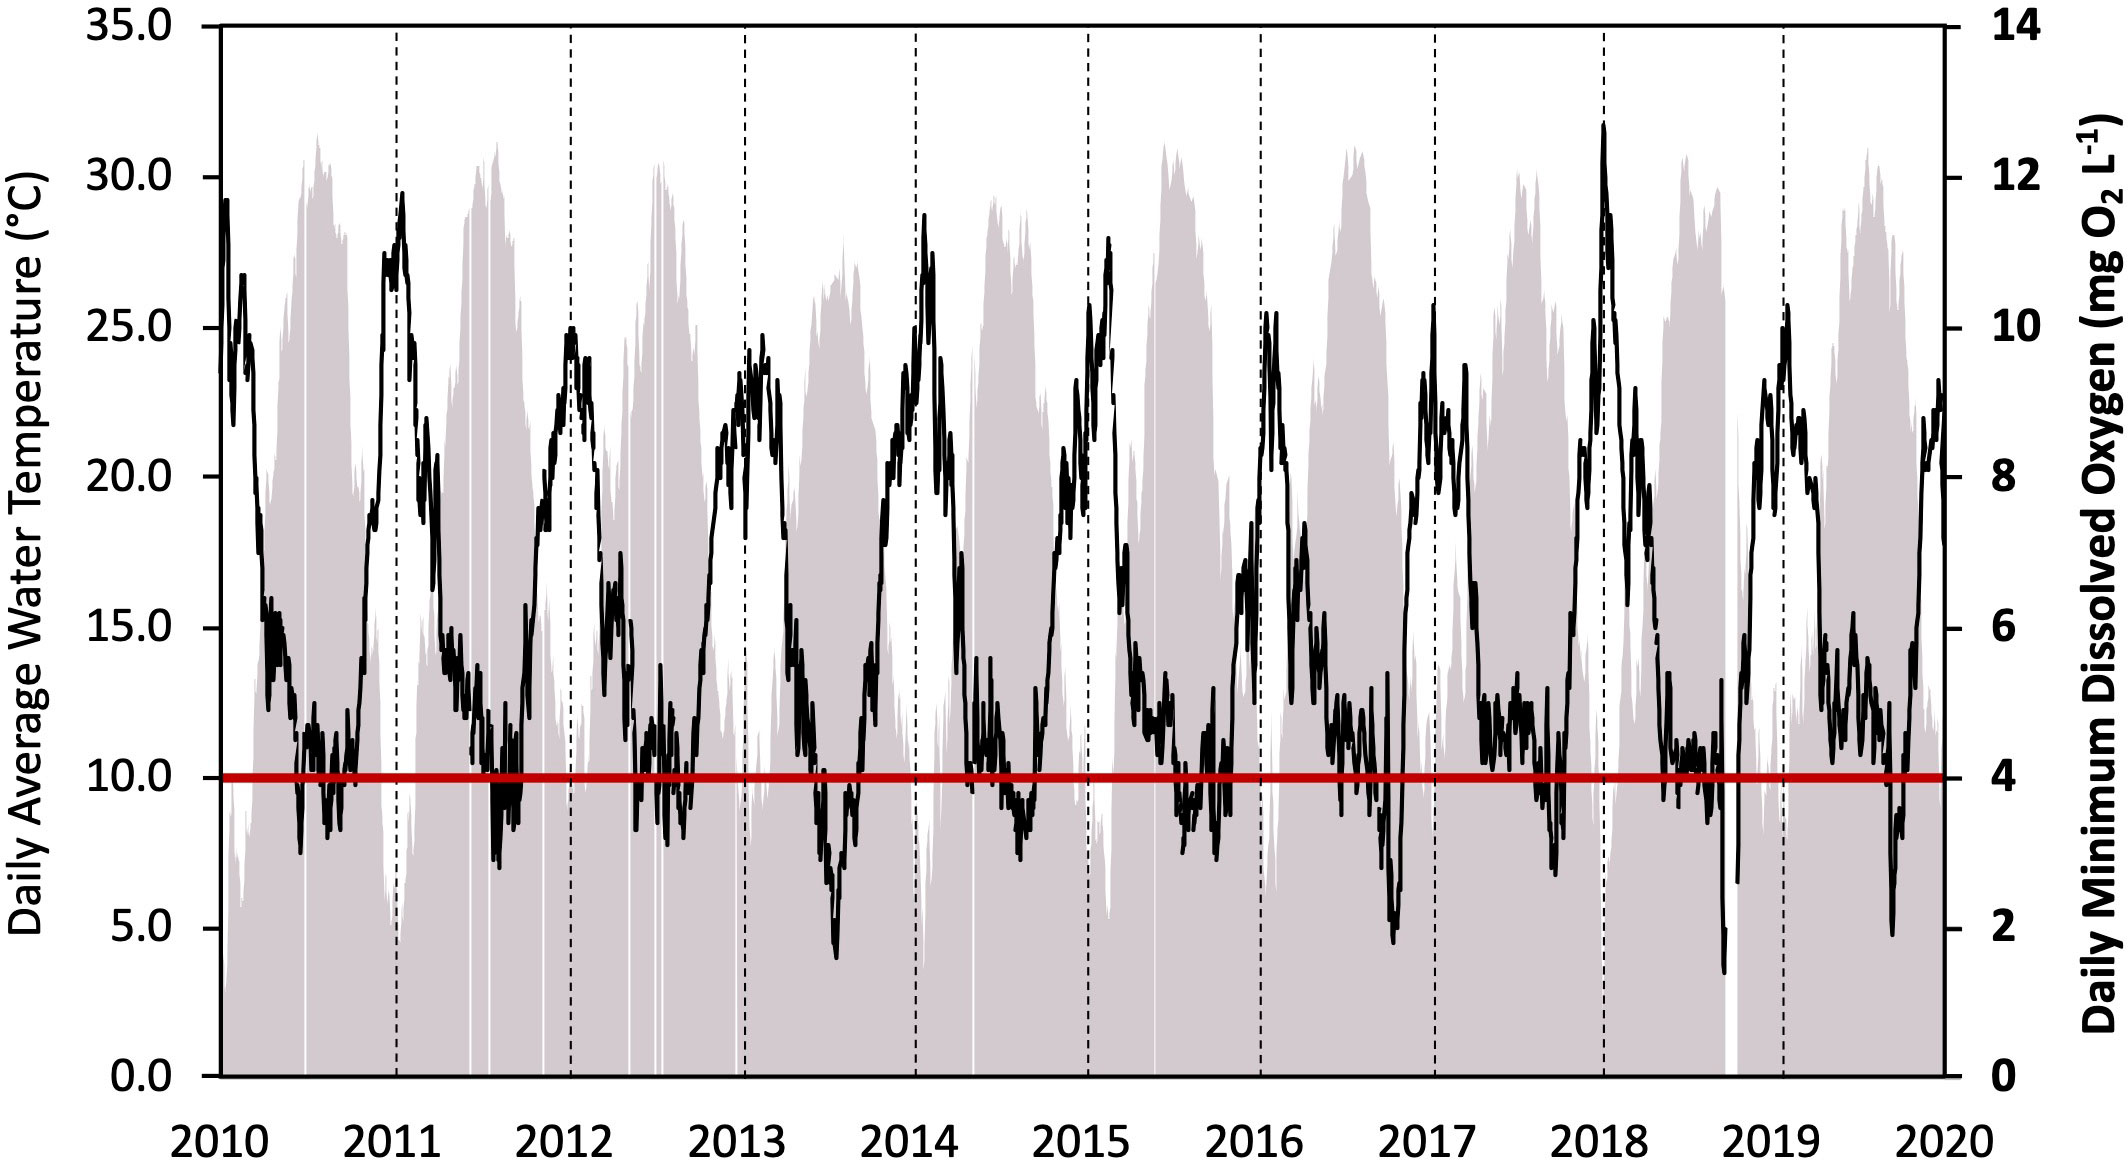
Figure 4 Continuous monitoring data from 2010 – 2020 including: Daily average water temperature (°C; filled grey region) and daily minimum dissolved oxygen concentrations (mg L-1; solid black line); the red line indicates the threshold of dissolved oxygen impairment as defined by a daily minimum oxygen concentration < 4.0 mg L-1 set by the South Carolina Department of Health and Environmental Control (SCDHEC, 2014). Dashed black lines indicate the start of the annual cycle in January. Data gathered from Waccamaw River at Hagley Landing (USGS site number 2110815).
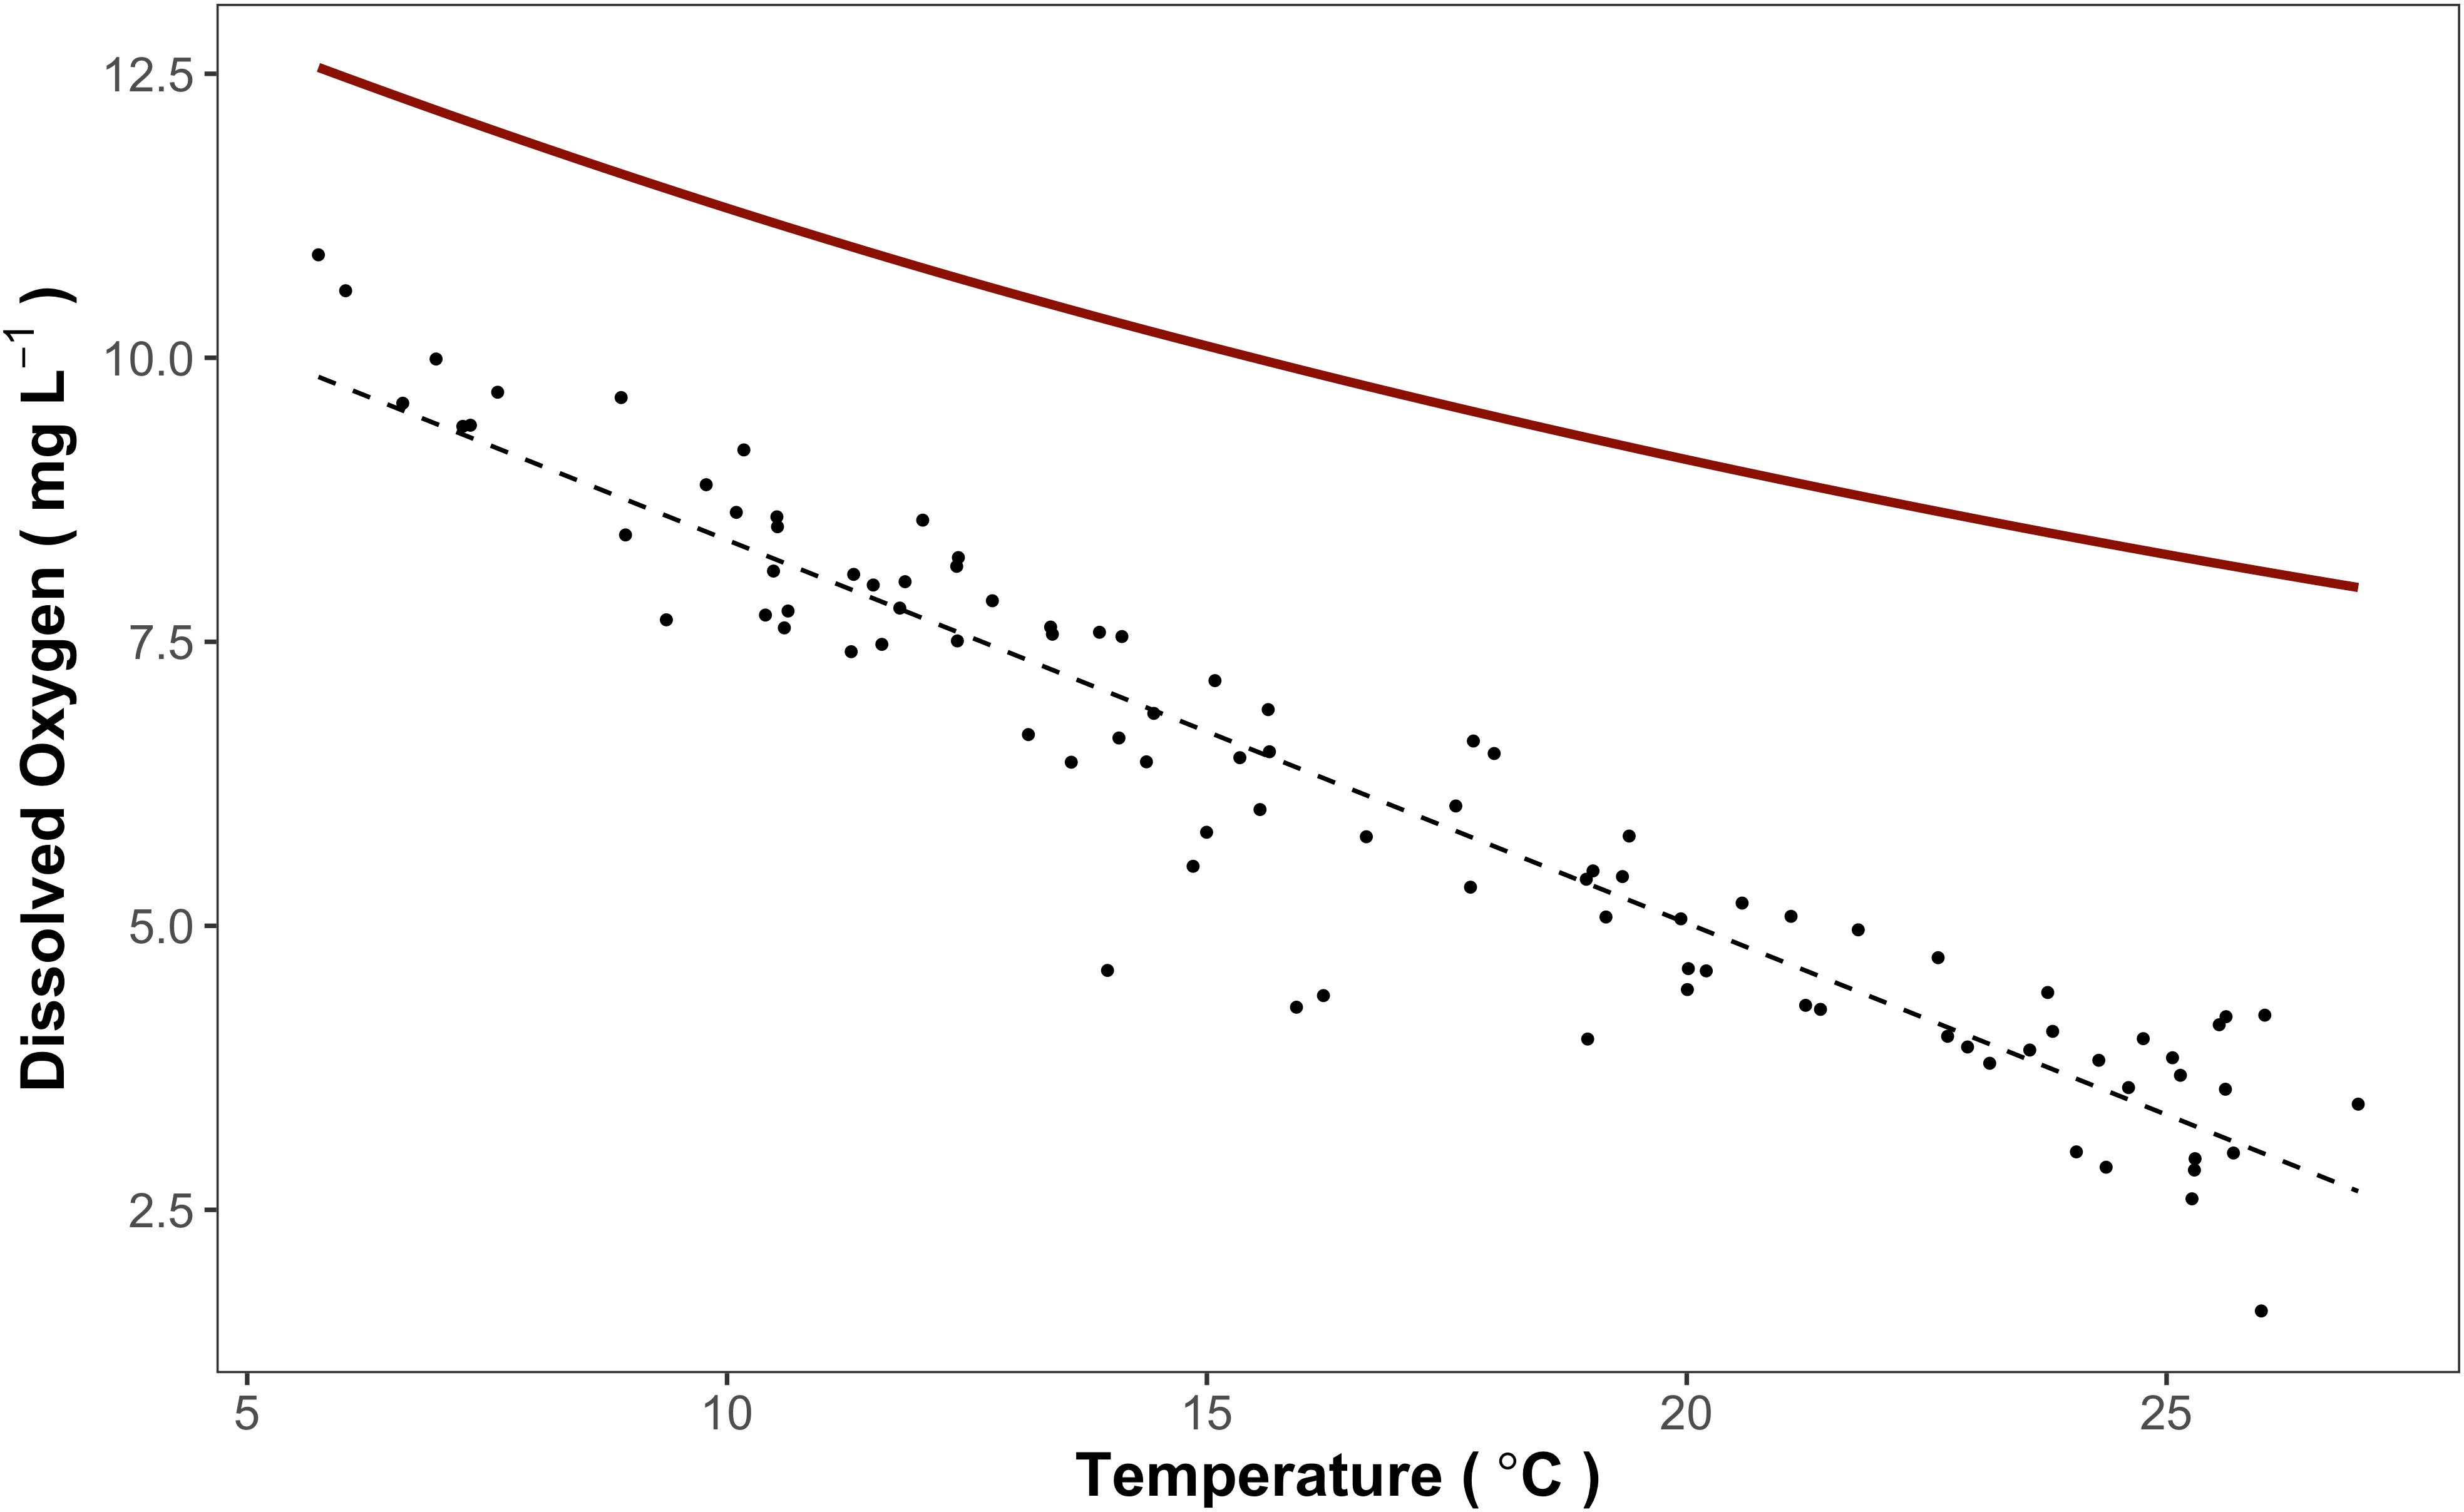
Figure 5 Dissolved oxygen (mg L-1), plotted as observed monthly average (black circles) and expected saturation concentration (solid red line), and average monthly temperature (°C) from 2010-2020 from data collected at USGS site 2110704 (Waccamaw River at Conway Marina, at Conway, SC). Expected saturation concentrations were calculated via site temperature, altitude, and an assumed salinity of 0. The dashed grey line represents a linear regression model, which displays a significant negative relationship between dissolved oxygen and temperature (p < 0.001, R2 = 0.89).
To help characterize biogeochemical differences between the Waccamaw River, wetlands, and ponds, we measured dissolved and particulate nutrient and carbon concentrations along with chlorophyll-a and absorbance spectra at each site (Table 2). Neither PC nor PN concentrations were significantly different (p > 0.05) between site types, although the ponds tended to have higher concentrations relative to the wetland and River sites. The ratio of particulate C:N was also similar for the forested wetlands (14.5 ± 3.9) and the Waccamaw River (13.4 ± 4.9) and higher than the ponds (10.7 ± 2.8), although differences were again not significant due to high variability (F[2, 16] = 1.65, p = 0.224). All measures of particulate phosphorus (TPP, PIP, and POP) showed similar trends with average concentration in the ponds significantly higher (p < 0.05) than the Waccamaw River and the wetlands. Concentrations of Chl-a in the stormwater ponds were more than double those measured in the wetlands and River.
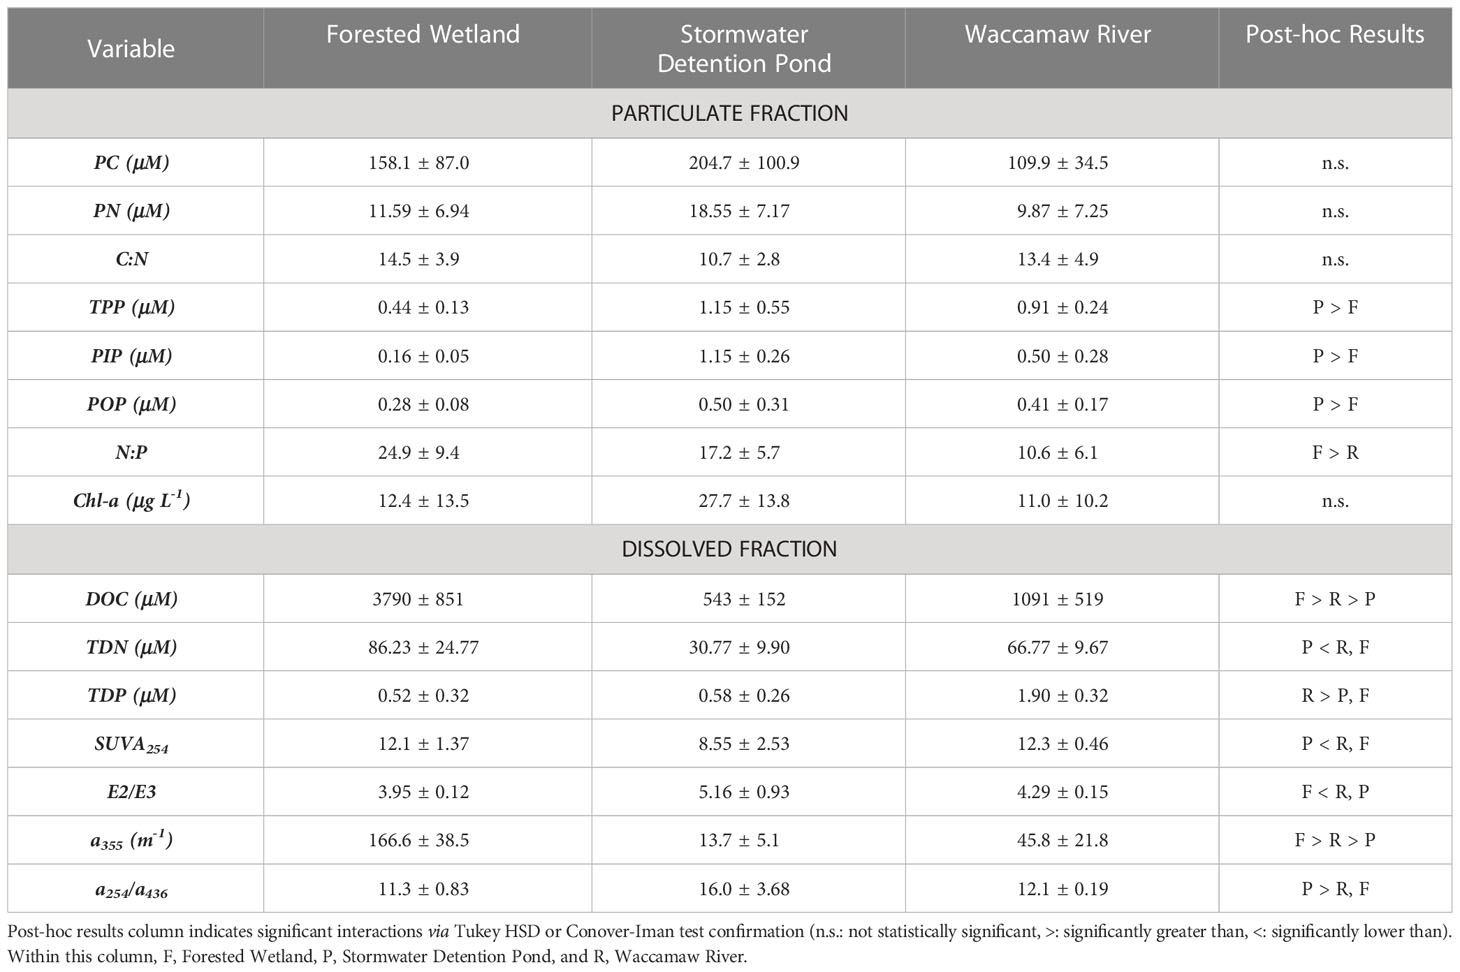
Table 2 Overview of average ambient conditions for each site type.
Large differences were observed in dissolved nutrient and dissolved organic carbon concentrations between the sites, but in general, the nutrient and organic carbon concentrations did not systematically co-vary (Table 2). Average concentrations of DOC were highest in the wetlands (3790 ± 851 μM) and lesser in the River (1091 ± 519 μM) and ponds (543 ± 152 μM), with all sites displaying significant differences to each other (padj < 0.05). In contrast, highest TDN concentrations were measured in the forested wetlands, and highest TDP concentrations were measured in the River. Post hoc analyses show that TDN was statistically lower in the pond sites (padj < 0.05), while TDP was statistically higher in the Waccamaw River (padj < 0.05). DOM absorbance metrics are summarized in Figure 6. The ponds displayed lower aromaticity (SUVA254), higher degrees of phytoplankton/in situ OM (a254/a436), lower molecular weight (E2/E3), and lower levels of CDOM (a355) (Table 2). In general, the River and wetland sites were similar to one another, with the exception of significantly higher CDOM (a355) within the forested wetlands (padj < 0.001). Overall both the River and wetland sites characteristics are opposite of the ponds.
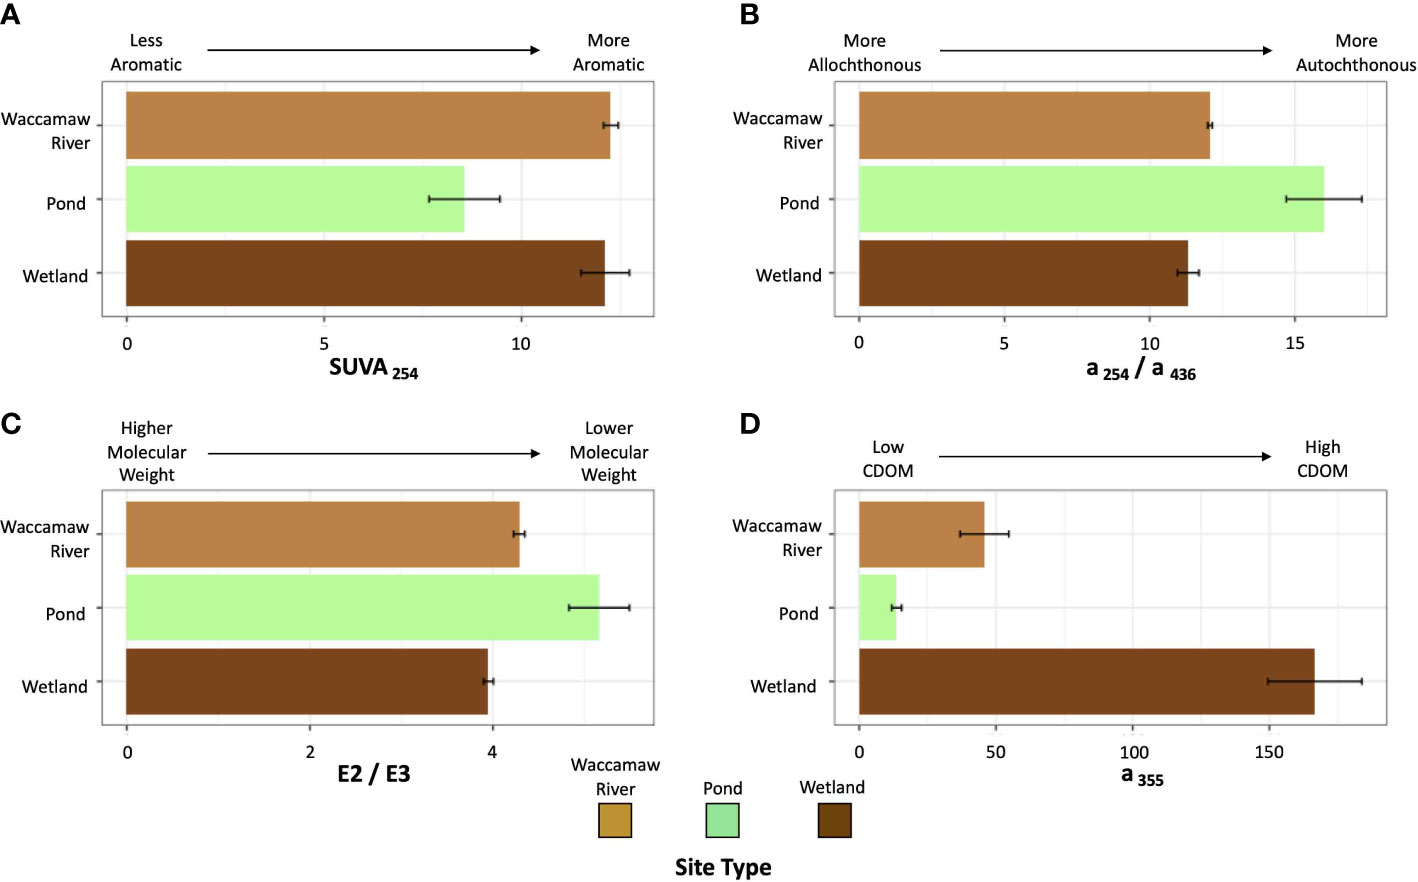
Figure 6 Bar graphs depicting a variety of dissolved organic matter spectral metrics as averages, with error bars representing standard error. Bars are grouped and colored by site type: forested wetlands (dark brown), stormwater detention ponds (green), and Waccamaw River (light brown). The metrics are (A) SUVA254 (degree of aromaticity), (B) a254/a436 (allochthonous vs autochthonous), (C) E2/E3 (inverse to molecular weight), and (D) a355 (quantity of chromophoric dissolved organic matter; CDOM).
The Waccamaw River watershed drains a variety of source waters, ranging from relatively pristine wetlands to urban community stormwater drainages. Substantial autochthonous production from algal cells is common in stormwater detention ponds providing a fresh source of easily degradable OM (Lewitus et al., 2008). In contrast, blackwater ecosystems, like our forested wetlands, possess substantial levels of more degradation-resistant dissolved organic substrates derived from diverse terrestrial humic-OM, such as fallen vegetation material from vascular plants or topsoil particles delivered via runoff (Hopkinson et al., 1998; Majidzadeh et al., 2017; Textor et al., 2018). In this study, ponds were characterized by higher concentrations of particulate nutrients and Chl-a, characteristic of autochthonous algae production of bioavailable OM and similar to other ponds in the region (DeLorenzo et al., 2012). In contrast, wetlands contained vastly more DOC than the ponds, consistent with forested wetlands serving as a large source of humic-rich DOC to receiving waters (Vidon et al., 2014). The Waccamaw River is characterized by intermediate particulate and dissolved carbon and nutrient concentrations due to variable source water inputs. These results are consistent with previous work in the Waccamaw River that found similar DOC concentrations during wet-season flood conditions (Goñi et al., 2003; Ruecker et al., 2017), supporting our findings that DOC-rich source waters from wetlands have large influences on the River.
To confirm how OM quality and complexity varies with source, measures of DOM spectral properties were conducted. Measurements of SUVA254 have been used to identify the degree of aromaticity within OM (Weishaar et al., 2003). Lower values in the stormwater ponds, relative to either the wetlands or River, are consistent with fresh, algal derived material. Dahlén et al. (1996) describe a strong inverse correlation between E2/E3 and DOM molecular weight. Here, the forested wetlands possess significantly lower values (padj < 0.05) relative to the ponds and River, suggesting that wetland DOM is dominated by higher molecular weight compounds, consistent with more complex terrestrially derived humic material. Similarly, OM dominated by autochthonous production is characterized by higher a254/a436 ratios (Battin, 1998; Jaffé et al., 2004), which is consistent with our stormwater ponds possessing a greater degree of autochthonous OM (16.0 ± 3.68) relative to the forested wetlands (11.3 ± 0.83). The final absorbance metric, a355, refers to the magnitude of CDOM. Again, our results show significantly increasing values (padj < 0.001) from stormwater ponds to the Waccamaw River to the forested wetlands.
Differences in OM sources influence the ease by which microbes can degrade OM and thus consume DO (Marschner and Kalbitz, 2003; Mavi et al., 2012). Combined, ambient conditions and spectral measurements of DOM confirm that OM composition varies significantly (Table 2) between Waccamaw River source waters, with higher degrees of aromaticity, molecular weight, allochthonous material, and CDOM found within wetlands. Higher complexity OM within the wetlands confirms our definition of these waters as containing lower quality OM relative to the higher quality, more easily degraded pond derived OM, characterized as autochthonous material low in aromaticity, molecular weight, and CDOM.
Average BOD5 across all temperature regimes was highest for ponds (2.65 ± 1.03 mg O2 L-1), followed by the wetlands (2.07 ± 0.50 mg O2 L-1) and the Waccamaw River (1.26 ± 0.60 mg O2 L-1), consistent with differences in OM concentrations, and presumed lability based on spectral qualities and provenance. Lowest BOD5 at the River site likely reflects the additional processing of OM that occurs during transit into receiving waters (McCabe et al., 2021). The rate of DO decay over the 5-day incubation periods also significantly differs across both temperature and site type (p < 0.05) (Figure 2). Here, the focus is on DO decay as a measure of OM degradation rates, analogous to the many studies that have used long-term time-series decay rates of DOC to define OM lability (e.g., Holmes et al., 2008). The large increase in DO decay rates, with increasing temperature across sites, supports the influence of biologically mediated declines in DO observed with rising temperatures in Waccamaw River waters (Figures 4, 5). This observed influence of biological processing on DO, via rising temperatures, might aid in explaining why impairment is exhibited annually within the lower main stem of the Waccamaw River during summer high temperatures, regardless of TMDL implementation.
The Q10 temperature coefficient quantifies how DO decay rates change with 10 degrees of warming and have been largely used in studies focusing on the sensitivity of metabolic rates to changing temperatures in soils and aquatic systems. Many studies use a generalized constant Q10 value of 2.0 and assume a constant value across OM composition and with temperature (Gillooly et al., 2001; Appelboom et al., 2010). Based on our results, Q10 temperature coefficients are neither uniform across sites nor with increasing temperatures (Figure 3). Highest Q10 coefficients (> 2.0) occurred within the lower temperature range with no significant difference between sites (F[2, 16] = 1.99, p = 0.169), although the wetlands and River were higher than the ponds. The lack of a significant response between sites may be an artifact of our experimental design as ambient waters were cooled to 20°C to determine BOD5. This may have differentially impacted the biological community and depressed their response, especially in the ponds that were characterized by higher ambient temperatures. Lower Q10 coefficients ( < 1.5) occurred within the upper temperature range and were lowest in the River and ponds sites. Lower Q10 values within the upper temperature range are consistent with the additional degradation of lower quality, less degradable OM (Davidson and Janssens, 2006) found in our sampled sites. Note that differences between the ponds and wetlands suggests that the wetlands have a higher quantity of OM available for degradation at higher temperatures relative to the pond sites. Previous work has shown that the decomposition rate of low-quality OM substrates increases more rapidly with increasing temperatures relative to high-quality substrates (Bosatta and Ågren, 1999) and that the greater temperature sensitivity of low-quality OM is due to the alleviation of higher activation energies associated with the breakdown of more complex chemical bonds (Davidson and Janssens, 2006). In addition, the magnitude of wetland OM available for DO consumption is more than 7 times higher than that found in the ponds. Thus, only small changes in the Q10 of forested wetlands may have significantly more impact on the receiving waters of the Waccamaw River versus lower DOC concentration, high quality OM pond sources.
This study is among the first within coastal waters to investigate the role that OM source plays in the temperature dependence of OM degradation and associated DO consumption. Although the specific relationship between OM source and temperature sensitivity remains poorly resolved (Sierra, 2012; Tang et al., 2017), our study supports the findings in the soil literature that systems characterized by lower-quality, more complex OM possess greater Q10 temperature sensitivities relative to their higher-quality counterparts (Fierer et al., 2005; Conant et al., 2008). When comparing our high-quality OM substrate, stormwater ponds, to our low-quality OM substrate, forested wetlands, the average Q10 value was ~ 52% higher for wetlands. This increase in temperature sensitivity across the OM quality gradient is similar to previous work that found that low quality OM had an increase in temperature sensitivity of ~ 48.5% in a litterbag decomposition study analyzing labile versus recalcitrant sources (Conant et al., 2008) and ~ 40.9% in a comparison of added C sources to litter between complex catechol and simple citric acid (Fierer et al., 2005). It is important to note that these studies tracked the rate of DOC decay over time, whereas DO decay rates were directly measured in this study. Thus, direct comparisons rely on the assumption that DO decay in our incubations was largely due to OM degradation. Previous work in this system has shown that the fraction of total BOD from carbonaceous processing dominates DO consumption over the first 5 days (McCabe et al., 2021), supporting our assumption. While results-to-date are limited, these shared findings between different fields and studies suggest that warming induced from climate change can differentially affect both terrestrial and aquatic system OM degradation, and thus DO consumption and can explain, in part, the ongoing deoxygenation within many ecosystems.
Continued urbanization and other anthropogenic activities will continue to cause DO impairment within a developing watershed (Gold et al., 2020), however, our current study demonstrates the susceptibility of natural systems to ongoing climate change and the influence a warming world may have on deoxygenation. Under current climate predictions, natural ecosystems with lower-quality OM will likely be disproportionately impacted by warmer temperatures, leading to a greater risk of declining DO in these systems. Current IPCC best estimates suggest a 2.7 to 4.4°C average increase in global temperatures by 2100, for intermediate to very high greenhouse gas emissions (IPCC, 2021). Assuming the lower and upper magnitude of these estimates to average summer-time temperature of the Waccamaw River (~27.5°C), DO decay rates at the wetland sites could increase by an average of 22.4 ± 6.8 to 39.1 ± 12.4% depending on the emission scenario. This calculated projection yields increases in DO decay more than double the average increase for the Waccamaw River proper (10.8 ± 6.8 to 18.4 ± 12.0%) and ponds (9.5 ± 4.5 to 16.0 ± 7.8%). Our findings clearly demonstrate the interaction that OM source and warming may have on degradation rates and DO decay. Such an interaction will further drive declines in inland, coastal DO concentrations, thus supporting our claim that departures from equilibrium concentrations in the Waccamaw River may be due to elevated OM remineralization under increasing temperatures (Figure 5).
Other processes may exacerbate the DO declines within the Waccamaw River in response to changing climates, as well. Future predictions include higher pulses of extreme precipitation in the coastal zone (Degerman et al., 2013). These storm events will likely increase the relative flushing of temperature sensitive OM from wetlands into the River (Majidzadeh et al., 2017), allowing for even higher rates of DO demand within the system. The Waccamaw River is just one example of a carbon rich system suffering from DO impairment, as similar coastal blackwater systems are common in semi-tropical latitudes globally (Meyer, 1990). As such, there remains a need to better characterize the relationship between aspects of molecular complexity from varying OM sources, temperature sensitivity of OM degradation, and the impact of this processing on DO dynamics.
Our study was aimed towards investigating the potential influence that OM source has on temperature sensitivity of OM degradation and DO consumption within aquatic environments. The “quality-temperature relationship” explored within the soil science literature suggests that sites characterized by more complex, low-quality organic matter tend to display higher temperature sensitivities. Here, our results support a similar relationship in the composition of source waters to the Waccamaw River. Forested wetlands, which were assumed to be lower-quality based on ancillary measurements, possess significantly higher Q10 values (padj < 0.05) than initially higher quality pond OM. Together, these metrics support a greater complexity in wetland organic matter that appears to have a stronger response to warming relative to less complex, high-quality organic matter within stormwater detention ponds. Many studies have tended to oversimplify the effect that temperature plays on the rates of metabolic processes of various taxa and habitats (Huey and Kingsolver, 2011). Thus, similar to the work being conducted in the soil community (Sierra, 2012), there is a need for aquatic scientists to further investigate the temperature-quality relationship. This is particularly true in coastal ecosystems where a combination of land use, population growth and rising temperatures are already leading to widespread hypoxia (Gilbert et al., 2010; Zhang et al., 2010).
The datasets presented in this study can be found in online repositories. The names of the repository/repositories and accession number(s) can be found below: https://doi.org/10.6073/pasta/f4641c0d98a48000e276be866a31d485.
CS collected samples, carried out the study, and conducted statistical analyses. ES and CB-N provided insight towards data analyses and interpretations. ES, CJ, and CB-N developed the experimental approach. CS wrote the first draft of the manuscript, ES and CB-N contributed to subsequent revisions. All authors contributed to the article and approved the submitted version.
This research was supported financially through the NOAA National Ocean Service through the National Estuarine Research Reserve System (Grant #NA20NOS4200030). Additional funding was provided through the University of South Carolina School of Earth, Ocean, and Environment and the Belle W. Baruch Institute for Marine and Coastal Sciences (F. John Vernberg Bicentennial Graduate Fellowship).
This work could not have been conducted without the help of fellow graduate student, Kelly McCabe, along with assistance from laboratory technicians Eric Tappa, Julie Krask, Brittany Morse, and Meryssa Piper.
The authors declare that the research was conducted in the absence of any commercial or financial relationships that could be construed as a potential conflict of interest.
All claims expressed in this article are solely those of the authors and do not necessarily represent those of their affiliated organizations, or those of the publisher, the editors and the reviewers. Any product that may be evaluated in this article, or claim that may be made by its manufacturer, is not guaranteed or endorsed by the publisher.
Abdel-Tawwab M., Monier M. N., Hoseinifar S. H., Faggio C. (2019). Fish response to hypoxia stress: growth, physiological, and immunological biomarkers. Fish Physiol. Biochem. 45, 997–1013. doi: 10.1007/s10695-019-00614-9
Appelboom T. W., Chescheir G. M., Birgand F., Skaggs R. W., Gilliam J. W., Amatya D. (2010). Temperature coefficient for modeling denitrification in surface water sediments using the mass transfer coefficient. Am. Soc. Agric. Boiological Engineers Vol. 53 (2), 465–474. doi: 10.13031/2013.29578
Arar E. J., Collins G. B. (1997). Method 445.0: in vitro determination of chlorophyll a and pheophytin a in marine and freshwater algae by fluorescence. U.S. Environmental Protection Agency, Washington, DC, 1997.
Arndt S., Jørgensen B. B., LaRowe D. E., Middelburg J. J., Pancost R. D., Regnier P. (2013). Quantifying the degradation of organic matter in marine sediments: A review and synthesis. Earth-Science Rev. 123, 53–86. doi: 10.1016/j.earscirev.2013.02.008
Aspila K. I., Agemian H., Chau A. S. Y. (1976). A semiautomated method for the determination of inorganic, organic and total phosphate in sediment. Analyst 101, 187–197. doi: 10.1039/an9760100187
Battin T. J. (1998). Dissolved organic matter and its optical properties in a blackwater tributary of the upper Orinoco river, Venezuela. Organic Geochemistry 28, 561–569. doi: 10.1016/S0146-6380(98)00028-X
Benitez-Nelson C. R., Madden L. P. O., Styles R. M., Thunell R. C., Astor Y. (2007). Inorganic and organic sinking particulate phosphorus fluxes across the oxic/anoxic water column of cariaco basin, Venezuela. Mar. Chem. 1-2, 90–100. doi: 10.1016/j.marchem.2007.01.007
Benner R., Strom M. (1993). A critical evaluation of the analytical blank associated with DOC measurements by high-temperature catalytic oxidation. Mar. Chemistry Measurement Dissolved Organic Carbon Nitrogen Natural Waters 41, 153–160. doi: 10.1016/0304-4203(93)90113-3
Bosatta E., Ågren G. I. (1999). Soil organic matter quality interpreted thermodynamically. Soil Biol. Biochem. 31, 1889–1891. doi: 10.1016/S0038-0717(99)00105-4
Breitburg D. (2002). Effects of hypoxia, and the balance between hypoxia and enrichment, on coastal fishes and fisheries. Estuaries 25, 767–781. doi: 10.1007/BF02804904
Breitburg D., Levin L. A., Oschlies A., Grégoire M., Chavez F. P., Conley D. J., et al. (2018). Declining oxygen in the global ocean and coastal waters. Science, 359(6371). doi: 10.1126/science.aam7240
Brown J., Gillooly J., Allen A., Savage V., West G. (2004). Toward a metabolic theory of ecology. Ecology 85, 1771–1789. doi: 10.1890/03-9000
Conant R. T., Drijber R. A., Haddix M. L., Parton W. J., Paul E. A., Plante A. F., et al. (2008). Sensitivity of organic matter decomposition to warming varies with its quality. Global Change Biol. 14, 868–877. doi: 10.1111/j.1365-2486.2008.01541.x
Dahlén J., Bertilsson S., Pettersson C. (1996). Effects of UV-a irradiation on dissolved organic matter in humic surface waters. Environ. International HUMEX/HUMOR Project Humic Substances 22, 501–506. doi: 10.1016/0160-4120(96)00038-4
Davidson E. A., Janssens I. A. (2006). Temperature sensitivity of soil carbon decomposition and feedbacks to climate change. Nature 440, 165–173. doi: 10.1038/nature04514
Degerman R., Dinasquet J., Riemann L., Luna S. S., Andersson A. (2013). Effect of resource availability on bacterial community responses to increased temperature. Aquat. Microbial Ecol. 68, 131–142. doi: 10.3354/ame01609
DeLorenzo M. E., Thompson B., Cooper E., Moore J., Fulton M. H. (2012). A long-term monitoring study of chlorophyll, microbial contaminants, and pesticides in a coastal residential stormwater pond and its adjacent tidal creek. Environ. Monit Assess. 184, 343–359. doi: 10.1007/s10661-011-1972-3
Diaz R., Rosenber R. (2008). Spreading dead zones and consequences for marine ecosystems. Science 321, 926–929. doi: 10.1126/science.1156401
Dinno A. (2017). “Conover.test: Conover-iman test of multiple comparisons using rank sums,” in R package version 1.1.5. Available at: https://CRAN.R-project.org/package=conover.test.
Earle S. A., Wright D. J., Joye S., Laffoley D., Baxter J., Safina C., et al. (2018). Ocean deoxygenation: Time for action. Science 359, 1475–1476. doi: 10.1126/science.aat0167
Eaton A. D., Clesceri L. S., Greenbaerg A. E. (2005). Standard methods for the examination of water and wastewater. 21 Ed (Washington, D.C.: American Public Health Association).
Environmental Protection Agency. U. S. (2000). Ambient aquatic life water quality criteria for dissolved oxygen (saltwater): Cape cod to cape hatteras (EPA-822-R-00-012) (Washigtn, D.C., USA).
Fierer N., Craine J. M., McLauchlan K., Schimel J. P. (2005). Litter quality and the temperature sensitivity of decomposition. Ecology 86, 320–326. doi: 10.1890/04-1254
Gallegos C. L. (2005). Optical water quality of a blackwater river estuary: The lower st. johns river, Florida, USA. estuarine. Coast. Shelf Sci. 63, 57–72. doi: 10.1016/j.ecss.2004.10.010
Gilbert D., Rabalais N. N., Díaz R. J., Zhang J. (2010). Evidence for greater oxygen decline rates in the coastal ocean than in the open ocean. Biogeosciences 7, 2283–2296. doi: 10.5194/bg-7-2283-2010
Gillooly J. F., Brown J. H., West G. B., Savage V. M., Charnov E. L. (2001). Effects of size and temperature on metabolic rate. Science 293, 2248–2251. doi: 10.1126/science.1061967
Gold A. C., Thompson S. P., Magel C. L., Piehler M. F. (2020). Urbanization alters coastal plain stream carbon export and dissolved oxygen dynamics. Sci. Total Environ. 747, 141132. doi: 10.1016/j.scitotenv.2020.141132
Goñi M. A., Teixeira M. J., Perkey D. W. (2003). Sources and distribution of organic matter in a river-dominated estuary (Winyah bay, SC, USA). Estuarine Coast. Shelf Sci. 57, 1023–1048. doi: 10.1016/S0272-7714(03)00008-8
Holmes R. M., McClelland J. W., Raymond P. A., Frazer B. B., Peterson B. J., Stieglitz M. (2008). Lability of DOC transported by alaskan rivers to the Arctic ocean. Geophysical Res. Lett. 35(L03402). doi: 10.1029/2007GL032837
Hopkinson C. S., Buffam I., Hobbie J., Vallino J., Perdue M., Eversmeyer B., et al. (1998). Terrestrial inputs of organic matter to coastal ecosystems: An intercomparison of chemical characteristics and bioavailability. Biogeochemistry 43, 211–234. doi: 10.1023/A:1006016030299
Hosen J. D., McDonough O. T., Febria C. M., Palmer M. A. (2014). Dissolved organic matter quality and bioavailability changes across an urbanization gradient in headwater streams. Environ. Sci. Technol. 48, 7817–7824. doi: 10.1021/es501422z
Howarth R., Chan F., Conley D. J., Garnier J., Doney S. C., Marino R., et al. (2011). Coupled biogeochemical cycles: eutrophication and hypoxia in temperate estuaries and coastal marine ecosystems. Front. Ecol. Environ. 9, 18–26. doi: 10.1890/100008
Huey R. B., Kingsolver J. G. (2011). Variation in universal temperature dependence of biological rates. PNAS 108, 10377–10378. doi: 10.1073/pnas.1107430108
IPCC (2021). “Climate change 2021: The physical science basis,” in Contribution of working group I to the sixth assessment report of the intergovernmental panel on climate change. Eds. Masson-Delmotte V., Zhai P., Pirani A., Connors S. L., Péan C., Berger S. (Cambridge, United Kingdom and New York, NY, USA: Cambridge University Press).
Jaffé R., Boyer J. N., Lu X., Maie N., Yang C., Scully N. M., et al. (2004). Source characterization of dissolved organic matter in a subtropical mangrove-dominated estuary by fluorescence analysis. Mar. Chem. 84, 195–210. doi: 10.1016/j.marchem.2003.08.001
Keeling R. E., Körtzinger A., Gruber N. (2010). Ocean deoxygenation in a warming world. Ann. Rev. Mar. Sci. 2, 199–229. doi: 10.1146/annurev.marine.010908.163855
Lønborg C., Baltar F., Carreira C., Morán X. A. G. (2019). Dissolved organic carbon source influences tropical coastal heterotrophic bacterioplankton response to experimental warming. Front. Microbiol. 10. doi: 10.3389/fmicb.2019.02807
Lewis W. M. (1988). Primary production in the Orinoco river. Ecology 69, 679–692. doi: 10.2307/1941016
Lewitus A. J., Brock L. M., Burke M. K., DeMattio K. A., Wilde S. B. (2008). Lagoonal stormwater detention ponds as promoters of harmful algal blooms and eutrophication along the south Carolina coast. Harmful Algae HABs Eutrophication 8, 60–65. doi: 10.1016/j.hal.2008.08.012
Lewitus A. J., Schmidt L. B., Mason L. J., Kempton J. W., Wilde S. B., Wolny J. L., et al. (2003). Harmful algal blooms in south Carolina residential and golf course ponds. Population Environ. 24, 387–413. doi: 10.1023/A:1023642908116
Lloyd J., Taylor J. A. (1994). On the temperature dependence of soil respiration. Funct. Ecol. 8, 315–323. doi: 10.2307/2389824
Low N. H. N., Micheli F., Aguilar J. D., Arce D. R., Boch C. A., Bonilla J. C., et al. (2021). Variable coastal hypoxia exposure and drivers across the southern California current. Sci. Rep. 11, 10929. doi: 10.1038/s41598-021-89928-4
Majidzadeh H., Uzun H., Ruecker A., Miller D., Vernon J., Zhang H., et al. (2017). Extreme flooding mobilized dissolved organic matter from coastal forested wetlands. Biogeochemistry 136, 293–309. doi: 10.1007/s10533-017-0394-x
Mallin M. A., McIver M. R., Ensign S. H., Cahoon L. B. (2004). Photosynthetic and heterotrophic impacts of nutrient loading to blackwater streams. Ecol. Appl. 14, 823–838. doi: 10.1890/02-5217
Marschner B., Kalbitz K. (2003). Controls of bioavailability and biodegradability of dissolved organic matter in soils. Geoderma Ecol. aspects dissolved organic matter soils 113, 211–235. doi: 10.1016/S0016-7061(02)00362-2
Mavi M. S., Marschner P., Chittleborough D. J., Cox J. W., Sanderman J. (2012). Salinity and sodicity affect soil respiration and dissolved organic matter dynamics differentially in soils varying in texture. Soil Biol. Biochem. 45, 8–13. doi: 10.1016/j.soilbio.2011.10.003
McCabe K. M., Smith E. M., Lang S. Q., Osburn C. L., Benitez-Nelson C. R. (2021). Particulate and dissolved organic matter in stormwater runoff influences oxygen demand in urbanized headwater catchments. Environ. Sci. Technol. 55, 952–961. doi: 10.1021/acs.est.0c04502
McLeod A. I. (2022). “Kendall: Kendall rank correlation and Mann-Kendall trend test,” in R package. version 2.2.1. Available at: https://CRAN.R-project.org/package=Kendall.
Meire L., Soetaert K. E. R., Meysman F. J. R. (2013). Impact of global change on coastal oxygen dynamics and risk of hypoxia. Biogeosciences 10, 2633–2653. doi: 10.5194/bg-10-2633-2013
Meyer J. L. (1990). A blackwater perspective on riverine ecosystems. BioScience 40, 643–651. doi: 10.2307/1311431
Oschlies A. (2019). “Ocean deoxygenation from climate change,” in Ocean deoxygenation: Everyone’s problem – causes, impacts, consequences, and solutions. Eds. Laffoley D., Baxter J. M. (Gland, Switzerland: IUCN), 105–116.
Phlips E. J., Cichra M., Aldridge F. J., Jembeck J., Hendrickson J., Brody R. (2000). Light availability and variations in phytoplankton standing crops in a nutrient-rich blackwater river. Limnology Oceanography 45, 916–929. doi: 10.4319/lo.2000.45.4.0916
Pietikäinen J., Pettersson M., Bååth E. (2005). Comparison of temperature effects on soil respiration and bacterial and fungal growth rates. FEMS Microbiol. Ecol. 52, 49–58. doi: 10.1016/j.femsec.2004.10.002
R Core Team (2022). R: A language and environment for statistical computing. (Vienna, Austria: R Foundation for Statistical Computing). Available at: https://www.R-project.org/.
Rosemond A. D., Benstead J. P., Bumpers P. M., Gulis V., Kominoski J. S., Manning D. W. P., et al. (2015). Experimental nutrient additions accelerate terrestrial carbon loss from stream ecosystems. Science 347, 1142–1145. doi: 10.1126/science.aaa1958
Ruecker A., Uzun H., Karanfil T., Tsui M. T. K., Chow A. T. (2017). Disinfection byproduct precursor dynamics and water treatability during an extreme flooding event in a coastal blackwater river in southeastern united states. Chemosphere 188, 90–98. doi: 10.1016/j.chemosphere.2017.08.122
Runkle J., Kunkel K. E., Stevens L. E., Frankson R., Stewart B. C., Sweet W., et al. (2022). “South Carolina state climate summary 2022,” in NOAA Technical report NESDIS 150-SC (Silver Spring, MD: NOAA/NESDIS), 5 pp.
Saari G. N., Wang Z., Brooks B. W. (2018). Revisiting inland hypoxia: diverse exceedances of dissolved oxygen thresholds for freshwater aquatic life. Environ. Sci. pollut. Res. 25, 3139–3150. doi: 10.1007/s11356-017-8908-6
SCDHEC (1999). State of south Carolina administrative record TMDL submittal for waccamaw river and Atlantic intracoastal waterway biochemical oxygen demand. (Columbia, SC, USA: South Carolina Department of Health and Environmental Control (SCDHEC)) 3–21.
SCDHEC (2014). R.61-68, water classifications and standard, (Columbia, SC, USA: South Carolina Department of Health and Environmental Control (SCDHEC)) Vol. 803.
SCDHEC (2015). Watershed water quality assessment: Catawba river basin, (Columbia, SC, USA: South Carolina Department of Health and Environmental Control (SCDHEC)) Vol. 2015.
Schroer W. F., Benitez-Nelson C. R., Smith E. M., Ziolkowski L. A. (2018). Drivers of sediment accumulation and nutrient burial in coastal stormwater detention ponds, south Carolina, USA. Ecosystems 21, 1118–1138. doi: 10.1007/s10021-017-0207-z
Sierra C. A. (2012). Temperature sensitivity of organic matter decomposition in the arrhenius equation: some theoretical considerations. Biogeochemistry 108, 1–15. doi: 10.1007/s10533-011-9596-9
Smith E., Sanger D., Tweel A., Koch E. (2018). “Chapter 1: Pond landscape,” in Stormwater ponds in coastal south Carolina: Inventory and state of the knowledge report. Eds. Cotti-Rausch B. E., DeVoe M. R. (Charleston, SC: SC Sea Grant Consortium), 14.
Spencer R. G. M., Aiken G. R., Dornblaser M. M., Butler K. D., Holmes R. M., Fiske G., et al. (2013). Chromophoric dissolved organic matter export from U.S. rivers. Geophysical Res. Lett. 40, 1575–1579. doi: 10.1002/grl.50357
Stramma L., Johnson G. C., Sprintall J., Mohrholz V. (2008). Expanding oxygen-minimum zones in the tropical oceans. Science 320, 655–658. doi: 10.1126/science.1153847
Szewczyk C. J., Benitez-Nelson C., Smith E. (2022). Ambient nutrients, carbon, and DOM absorbance metrics along with experimental dissolved oxygen decay rates for 5-day incubations of water within the waccamaw river watershed, SC, summer 2020. ver 1 (Environmental Data Initiative). doi: 10.6073/pasta/f4641c0d98a48000e276be866a31d485
Tang J., Cheng H., Fang C. (2017). The temperature sensitivity of soil organic carbon decomposition is not related to labile and recalcitrant carbon. PloS One 12, e0186675. doi: 10.1371/journal.pone.0186675
Testa J. M., Kemp W. M. (2012). Hypoxia-induced shifts in nitrogen and phosphorus cycling in Chesapeake bay. Limnology Oceanography 57, 835–850. doi: 10.4319/lo.2012.57.3.0835
Textor S. R., Guillemette F., Zito P. A., Spencer R. G. M. (2018). An assessment of dissolved organic carbon biodegradability and priming in blackwater systems. J. Geophysical Research: Biogeosciences 123, 2998–3015. doi: 10.1029/2018JG004470
Tian R., Cerco C. F., Bhatt G., Linker L. C., Shenk G. W. (2021). Mechanisms controlling climate warming impact on the occurrence of hypoxia in Chesapeake bay. JAWRA 58(6): 855–875. doi: 10.1111/1752-1688.12907
Todd M. J., Vellidis G., Lowrance R. R., Pringle C. M. (2009). High sediment oxygen ddemand within an instream swamp in southern Georgia: Implications for low dissolved oxygen levels in coastal blackwater streams. JAWRA J. Am. Water Resour. Assoc. 45, 1493–1507. doi: 10.1111/j.1752-1688.2009.00380.x
Vaquer-Sunyer R., Duarte C. M. (2008). Thresholds of hypoxia for marine biodiversity. Proc. Natl. Acad. Sci. 105, 15452–15457. doi: 10.1073/pnas.0803833105
Vázquez-Domínguez E., Vaqué D., Gasol J. M. (2007). Ocean warming enhances respiration and carbon demand of coastal microbial plankton. Global Change Biol. 13, 1327–1334. doi: 10.1111/j.1365-2486.2007.01377.x
Vidon P., Carleton W., Mitchell M. J. (2014). Spatial and temporal variability in stream dissolved organic carbon quantity and quality in an Adirondack forested catchment. Appl. Geochemistry 46, 10–18. doi: 10.1016/j.apgeochem.2014.04.008
Weishaar J. L., Aiken G. R., Bergamaschi B. A., Fram M. S., Fujii R., Mopper K. (2003). Evaluation of specific ultraviolet absorbance as an indicator of the chemical composition and reactivity of dissolved organic carbon. Environ. Sci. Technol. 37, 4702–4708. doi: 10.1021/es030360x
Wetzel R. G. (2001). Limnology: Lake and river ecosystems. Third edition, (San Diego, CA: Academic Press).
Zhang J., Gilbert D., Gooday A. J., Levin L., Naqvi S. W. A., Middelburg J. J., et al. (2010). Natural and human-induced hypoxia and consequences for coastal areas: synthesis and future development. Biogeosciences 7, 1443–1467. doi: 10.5194/bg-7-1443-2010
Keywords: dissolved oxygen, temperature sensitivity, organic matter, climate change, degradation, Q10 temperature coefficient
Citation: Szewczyk CJ, Smith EM and Benitez-Nelson CR (2023) Temperature sensitivity of oxygen demand varies as a function of organic matter source. Front. Mar. Sci. 10:1133336. doi: 10.3389/fmars.2023.1133336
Received: 28 December 2022; Accepted: 15 February 2023;
Published: 02 March 2023.
Edited by:
Tsuneo Ono, Japan Fisheries Research and Education Agency (FRA), JapanReviewed by:
Sairah Malkin, College Park, United StatesCopyright © 2023 Szewczyk, Smith and Benitez-Nelson. This is an open-access article distributed under the terms of the Creative Commons Attribution License (CC BY). The use, distribution or reproduction in other forums is permitted, provided the original author(s) and the copyright owner(s) are credited and that the original publication in this journal is cited, in accordance with accepted academic practice. No use, distribution or reproduction is permitted which does not comply with these terms.
*Correspondence: Curtis J. Szewczyk, Y3VydGlzLnN6ZXdjenlrQGdtYWlsLmNvbQ==
Disclaimer: All claims expressed in this article are solely those of the authors and do not necessarily represent those of their affiliated organizations, or those of the publisher, the editors and the reviewers. Any product that may be evaluated in this article or claim that may be made by its manufacturer is not guaranteed or endorsed by the publisher.
Research integrity at Frontiers
Learn more about the work of our research integrity team to safeguard the quality of each article we publish.