 Olga Rubin
 Osher Soffer
 Yaniv Levy
 Joseph Aizen
- 1The Faculty of Marine Science, Ruppin Academic Center, Michmoret, Israel
- 2The Israel Sea Turtle, Rescue Centre, Nature Parks Authority (NPA), Michmoret, Israel
- 3Department of Marine Biology, Leon H. Charney School of Marine Sciences, University of Haifa, Haifa, Israel
Circulating estradiol (E2), testosterone (T) and progesterone (P4) concentrations, and blood chemistry were monitored in the female green turtle Chelonia mydas over continuous seasons at the Israel sea turtle breeding facility. The tested factors were analyzed with regard to the female`s nesting activity in the subsequent nesting season: Future nesters (FN) and Non-nesters (NN). Our analysis showed significant changes in all three sex steroids, E2, T, P4, and in 13 blood biochemical parameters between the two females` groups. All females presented consistent E2 profiles from year to year, with a single elevation in September in FN females. P4 concentrations in nesting females were high in April (mating) and higher towards the beginning of June due to oviposition, females that presented concentrations above 1ng/ml had successful oviposition (8 females: 1 female in 2018, 5 in 2019 and 2 in 2020). T profiles were high at the onset of vitellogenesis towards November and again high during April. We were able to predict which females would undergo oviposition with a specific profile seen only in FN females - elevated P4 concentrations from February to June and the elevation of metabolites electrolytes and Gamma-Glutamyl Transferase (GGT) concentrations toward November. This will facilitate selectively choice mating pairs to ensure that the Mediterranean population genetic variability is maintained. Clutches per female were between 2 and 6, with 25 in total. Females laid an average of 91 ± 7 eggs (range 39-139 eggs) per nest with emergence rate of ~10% (0-58%). Overall, the same trend in circulating steroid concentrations was revealed over the years in the females reaching oviposition only when a certain threshold was achieved. In this study all the factors mentioned above can indicate an upcoming oviposition at least 6 months prior to nesting as seen in the PCA analysis. This information can contribute to the success of green sea turtle breeding programs in captivity and will hopefully help the Israeli Rescue Center predict and prepare for nesting activities in the years ahead.
Introduction
The green sea turtles, belonging to the Cheloniidae family, have a fossil record from about 110 million years ago (Hirayama, 1998; Kear and Lee, 2006), and a wide ecological habitat range, including tropics, subtropical waters, and to a lesser extent temperate water (Bjorndal and Jackson, 2002) in the Atlantic, Mediterranean and Indo-Pacific. In recent history, commercial exploitation for food, and pressure from by-catch in marine fisheries led to a massive decline of the green turtle population (Van Houtan and Kittinger, 2014). The use of destructive machinery, and gear, such as trawls, destroy the foraging grounds, and harm sea turtles as collateral damage (Nada and Casale, 2011; López-Barrera et al., 2012; Lewison et al., 2014). Offshore activities including gas production, seismic surveys, and noise from drill-ships (Viada et al., 2008), as well as oil, and plastic pollution (Clukey et al., 2017) impact sea turtles. Even with local, and global conservation efforts, this species still faces many threats. Man-induced destruction or modification of beaches, resulting from coastal development, and construction, sand extraction, and beach pollution, directly impact the availability of nesting habitat, and affect nesting success and the survival of eggs and hatchlings (Kasparek et al., 2001; Casale and Margaritoulis, 2010). Global warming is also an important factor since high sand temperature may affect the survival of pre-emergent sea turtle hatchlings (Cavallo et al., 2015). The green turtle has been declared as endangered worldwide, and the Mediterranean subpopulation was classified as critically endangered in 2004 (IUCN, 2004), though the present conservation status of this subpopulation has not been evaluated. The green sea turtle has unique ecological roles in seagrass, and coral reef ecosystems. In the event of extinction, the negative impacts on the environment, the complexity, and stability of the food web would be highly significant (Bjorndal and Jackson, 2002).
After the incubation period, the hatchlings emerge at night, and navigate their way towards the brightest horizon (Limpus and Kamrowski, 2013). After scurrying to the water, the first step of their life cycle involves an oceanic juvenile dispersal, dictated mostly by currents, with some degree of active navigation (Putman and Mansfield, 2015; Patrício et al., 2017; Casale et al., 2018). Following the pelagic stage, the juvenile turtles are often recruited to neritic foraging areas in populations that are frequently comprised of individuals from multiple nesting sources (Bass et al., 2006; Proietti et al., 2012). The juvenile`s age, and size at recruitment to the neritic habitats varies widely. The age at recruitment can vary from 1 to 10 years, and CCL (Curved Carapace Length) size at recruitment was measured at 20-47.8 cm from different locations (Zug and Glor, 1998; Zug et al., 2002; Seminoff et al., 2003; Balazs and Chaloupka, 2004; Chaloupka et al., 2004; Reich et al., 2007; Goshe et al., 2010). Green turtles mostly forage at the neritic grounds until they reach the age of sexual maturity, after which they can migrate thousands of kilometers to mating and nesting areas. Typically, mating occurs near the nesting beaches shortly before the onset of nesting activity, and it is terminated soon after nesting begins. Green turtle females can mate with several males during the same mating season, and can store sperm for an extended period using the grooves in the middle section of the oviduct (Ekanayake et al., 2013; Chassin-Noria et al., 2017).
Although the reproductive biology and endocrinology of sea turtles has been widely investigated, and reviewed, most of the studies are inconclusive (Broderick et al., 2003; Balazs and Chaloupka, 2004; Chaloupka et al., 2004; Reina et al., 2009; Wood and Wood, 2015; Saragoça Bruno et al., 2020). Sexual maturity of female green turtles in the wild range from 16 to 50 years with minimal CCL reported at different locations of 72-90 cm (Frazer and Ladner, 1986; Limpus et al., 2003; Balazs and Chaloupka, 2004; Chaloupka et al., 2004; Goshe et al., 2010; Almeida et al., 2011; Van Houtan et al., 2014; Sönmez, 2019). In captivity, the age of sexual maturation was reported to be 8-11 years at the Cayman Turtle Farm Ltd. (Wood and Wood, 2015), much shorter than reported in the wild. Further studies demonstrated that the mating seasons, and the length of intervals between them may change according to weather conditions and food availability (Limpus and Nicholls, 1988; Broderick et al., 2003). At the onset of the reproductive cycle of most vertebrates, females reach an energetic threshold to support reproduction, and offspring nutrition, nesting interval reported for females as 2-4 years in the wild, and 1-2 years in captivity (Broderick et al., 2003; Wood and Wood, 2015). Reproductive success in vertebrates is regulated by the hypothalamus-pituitary-gonadal (HPG) axis. At the base of the axis the gonadotropin-releasing hormone (GnRH), produced in the hypothalamus, stimulates the secretion of gonadotropins (GTHs) from the pituitary gland. The reproductive cycle, and sexual development in reptiles is dependent on GTH release, which directly controls many aspects of gonadal development across vertebrates (Licht et al., 1979; Licht and Porter, 1985). GTHs activate second-messenger pathways leading to production and secretion of sex steroids by the gonads. Three main sex steroid hormones affect behavior, and reproduction in most vertebrates: progesterone (P4), testosterone (T), and estradiol (E2). P4 is potentially an ovulation inhibitor in green turtles; an assumption supported by the higher concentrations of P4 observed in females successfully nested over those unsuccessful (Wibbels et al., 1992; Al-Habsi et al., 2006). E2 in female sea turtles is the primary stimulus for vitellogenin (Vtg) synthesis, which is essential in oocyte and oviductal development (Herbst et al., 2003; Sifuentes-Romero et al., 2006). Vitellogenesis in green turtles (Miller, 1996), and loggerheads (Wibbels et al., 1990; Miller, 1996) lasts between 10 and 12 months, and is completed before the migration to mating sites. Owens and Morris (1985) reported that a peak in E2 in early spring may serve both behavioral, and physiological functions. It could induce the drive to migrate to nesting beaches and cause final maturation of ovarian follicles just prior to first ovulation. In green sea turtles, T concentrations elevation coincides with female mating receptivity, suggesting that it initiates breeding behavior; this is supported by higher T concentrations in successful nesting females (Licht et al., 1979; Licht et al., 1985a; Al-Habsi et al., 2006). Moreover, sexually receptive females may produce male-attractive pheromones triggered by T, since pheromones are commonly under direct control of steroids (Owens and Morris, 1985; Al-Habsi et al., 2006).
Blood parameters of sea turtles are influenced by many factors, including season, age, sex, health status, geographic sites, physiological state, reproductive status (Dickinson et al., 2002; Jacobson, 2007), season, food availability, environmental conditions, disease, and activity concentrations (Arthur et al., 2008; Deem et al., 2009). Plasma blood biochemistry is used to monitor the state of health of sea turtles, but it can also be used to indicate the reproductive state due to physical and hormonal changes during reproduction cycles such as vitellogenesis, and folliculogenesis. Several plasma biochemical parameters have been reported to be influenced by the reproductive stage in different species of sea turtles. During the reproduction season, sea turtles go through many physical, behavioral, and environmental changes. These changes include fasting or low food intake during the period preceding mating, and nesting of green turtle females (Hays et al., 2002). In advance of the reproduction season, green turtle females prepare for the long migration, egg formation, and Vtg formation (vitellogenesis). Changes in calcium (Ca), phosphorus (Phos), cholesterol (Chol), and triglyceride (TGL) concentrations were found to be related to vitellogenesis, and egg formation. Changes in Ca and Phos concentrations are mainly due to mobilization directed by egg formation, with the concentrations of both elements elevated in females preparing for nesting (Deem et al., 2006). Furthermore, a large increase in the total serum Ca concentration in sea turtle females is associated with an increase in protein-bound Ca during follicular development before ovulation (Casal et al., 2009). Catabolism of energy reserves during egg formation, and vitellogenesis (Kakizoe et al., 2007; Deem et al., 2009; Goldberg et al., 2011) in nesting females, and T production in males (Kakizoe et al., 2007) results in high plasma lipid values, such as Chol and TGL (Goldberg et al., 2013; Prieto-Torres et al., 2013; Ehsanpour et al., 2015). In addition, during vitellogenesis there are increased protein synthesis demands which result in elevated albumin (ALB) concentrations. This is consistent with biochemical results observed in hawksbill turtles, and loggerheads (Deem et al., 2006; Goldberg et al., 2011). Like other vertebrates, male green turtles accumulate significant body reserves prior to migration in order to provide the energy necessary for migration, and reproduction, and exhibit energy metabolite changes associated with breeding activities (Hamann et al., 2002; Tim et al., 2004). These changes can be identified by fluctuation in lipid and protein concentrations over the course of the year, corresponding with foraging season and then breeding season.
Israel national Sea Turtle Rescue Center at Mikhmoret was established in 1999 by the Israel Nature and Parks Authority (NPA). The center`s main objectives are medical treatment, and rehabilitation of injured turtles, followed by release of the turtles back to the sea. The rescue center works to rehabilitate sea turtles on several levels which include treatment of injured sea turtles and their reintroduction to the wild, physical protection of the eggs by relocating the nests to protected and monitored areas, and protection of the marine environment and beaches. There are five NPA declared protected hatching farms for the translocated nests along the Israeli shoreline at Betzet, Atlit, Hof-Gador, Nitzzanim and Ziqim (Tikochinski et al., 2012).
Given that the green turtles exhibit high natal homing behavior and due to their long and complex life cycle, the green turtle population in Israel is not likely to increase without human intervention and support. Because of the declining number of sea turtles arriving to Israel shores a captive breeding stock was established at the Sea Turtle Rescue Center in Mikhmoret in 2002 with the aim of green sea turtle conservation and increasing their population in the Mediterranean Sea. It also functions as a genetic bank for the species in the event of local extinction. 24 hatchlings were collected from their nests in order to be reared in captivity - these individuals will not return to the sea, but their breeding will contribute greatly to the rehabilitation of the species population. In 2019, the first successful nesting of green turtle female from the captive stock was recorded at the center. More knowledge of the green turtles reproductive cycle is needed to maximize the breeding effort and enhance nesting success.
Materials and methods
Research population and site
The research population consists of 12 females (weight: 83.91 ± 20.56 Kg; CCL: 82.58 ± 6.85 cm; CCW: 75.08 ± 6.6 cm) from the captive breeding stock in Michmoret (Table S1). The breeding stock includes 21 turtles, from two clutches acquired as hatchlings in 2002: eight females and three males from the Ashkelon beach; and three females and seven males from the Givat Olga beach. In addition, one female found seriously injured in Haifa in 2012 was added to the breeding stock. The turtles were placed in sea water tanks, 7.5 - 60 m3 in volume, at the Seakura farm in Netanya. After sexual dimorphism the female turtles were separated into two tanks: an all-female tank (A) and a mixed tank (B). In April 2019, the breeding stock was transferred to a new facility that features an artificial nesting beach and divided based on their genetic origin to avoid inbreeding. In this new facility, water temperature is kept at 20-22°C, and periodically altered. The turtles` diet is composed of romaine lettuce (2% BW) and frozen fish (Herring, Flounder and Salmon,0.2% BW). All turtles were tagged with metal plates on either their front or back limb. In addition, each turtle was marked with color and number card attached to their carapace for behavioral observation, and identification.
Blood samples collection
Blood was sampled over three consecutive years: July, September, and November of 2017; January, April, June and November of 2018; February, April, June, July, September and November of 2019; January, April, June, August, September and November of 2020. The blood samples (5 ml) were collected from the dorsal cervical sinus using a sterile 21-gauge 8.9 cm needles. Blood was moved into a biobased blood collection tube that contains an anticoagulant agent heparin sodium. The collected blood samples were stored at 4°C until centrifugation at 2,000 g for 15 min, no longer than three hours after collection. The separated plasma was divided to 3 tubes (~1 ml each tube) for steroid analysis, blood biochemistry, and backup. Plasma for steroid analysis was stored at -80°C while plasma for biochemical analysis was stored at -20°C. All experimental procedures were carried out according to the Animal Care and Use Guidelines of the NPA.
Steroid extraction and measurement
Plasma samples were measured for three sex steroids (E2, P4, and T). The steroids were extracted from the separated serum using di-ethyl ether as follows: (1) 500 µl of plasma sample was transferred into a 17 cm glass tube, following addition of 5 ml of di-ethyl ether, and mixed by vortex three times (15 sec. each); (2) the glass tubes were placed at -80°C for 50 minutes, and the organic phase was then transferred to a new glass tube; (3) the ether was evaporated by heating to 55°C (in water bath) for one hour and the extraction products were dissolved with 500 µl SAB buffer (0.1M PPBS, 0.1% BSA, 1mM EDTA, 0.15mM Sodium azide; pH=7.4) with 60 sec. of vortex mixing. The extracts were stored at -80°C until analysis. Plasma E2, P4 and, T concentrations were measured using commercial ELISA kits by Cayman CHEMICAL® (items 501890, 582701 and 582601 respectively). Concentration detection levels for the kits were 6.6-4,000, 7.8-1,000 and 3.9-500 pg/ml for E2, P4, and T respectively, with sensitivity range of 6-15 pg/ml. Duo to the limited range of the ELISA steroid kits, we needed to assess the concentration range of each steroid in the research population, primarily tests were conducted. For each steroid assay, at least three dilutions were tested, with samples from different sampling dates in order to calculate the annual concentration variation. This helped us to know what dilution to use in different sampling dates.
Blood biochemistry
16 blood biochemical parameters were analyzed in this study. The biochemical parameters can be separated into three general categories: (1) nutrients and metabolites: TP (total protein) [mg/dL], ALB [mg/dL], Chol [mg/dL], TGL [mg/dL] and UA (uric acid) [mg/dL]; (2) enzymes: ALT (alanine transaminase) [U/L], AST (aspartate transaminase) [U/L], LDH (lactate dehydrogenase) [U/L] and GGT (gamma-glutamyl transferase) [U/L]; (3) elements and electrolytes: Ca (calcium) [mg/dL], iCa (ionized calcium) [mmol/L], Cl (chloride) [mmol/L], Phos (phosphorous)[mg/dL], K (potassium) [mmol/L], Mg (magnesium) [mg/dL] and Na (sodium) [mmol/L]. Biochemical concentrations were measured and analyzed by the Hebrew University Veterinary Hospital, Rishon LeZion.
Statistical analysis
Significant differences between monthly values of the various plasma steroid and biochemical concentrations were tested by Welch`s t test between the nesting states at each sampling date. A nonparametric Spearman`s p correlation test was performed between related parameters for each nesting group. Correlation analyses were made between paired parameters in each category using Spearman’s rho. Multivariate statistical analyses, principal component analysis (PCA) was performed to estimate the earliest time for future nesting activity prediction. The PCA construction was performed using `factoextra` and `devtools` packages in R 3.6.3 software (R. Core Team, 2022). Results were considered statistically significant for p <0.05. All statistical tests and visual represented charts, excluding the PCA analysis, were performed using JMP®, 15. SAS Institute Inc., Cary, NC, 1989–2021software.
Results
From the establishment of the Rescue Center in 2002 and up to November 2020, 6 of the 12 females nested in 3 nesting seasons: ID Tag 401 in 2018 and 2020; ID Tags 474, 495, 729 and 760 in 2019; ID Tag 173 in 2020. The nesting activity of Tag ID 401 in 2018 resulted in 56 infertile eggs laid in the water in an all-female tank (Table S2), measurements from this season did not enter any statistical analysis due to difference in growing conditions compared to the following two seasons. Clutches per female were between 2 and 6, with 25 in total. Females laid an average of 91 ± 7 eggs (range 39-139 eggs) per nest with emergence rate of ~10% (0-58%) (Table S2).
Out of the 19 tested parameters, 12 showed notable differences between the non-nester (NN) and future-nester (FN) groups in the pre-nesting (PN – up to 11 months prior to nestin season that starts from April to August)) seasons. Due to the nature of this study, some measurements tested during the 2019-20 FN season were not significantly different according to the statistical test, though the results were compatible with trends seen in the previous season. All tested parameters can be divided into four main categories: sex steroids, nutrients and metabolites, elements and electrolytes, and enzymes.
Sex steroids
The only sex steroid that did not show a repeating discrepancy between the two tested groups was E2. Circulating E2 concentrations were low at most sampling dates with no regard to the females` nesting state, aside from samples taken from FN females during 2019-20 PN season (Figures 1A, B). Both P4 and T showed significant discrepancy between the FN and NN females several months prior to nesting season (Figure 1A). The first steroid to rise was T during the fall towards November, from ~6-8 months prior to nesting activities of the 2018-19 and 2019-20 PN periods, with increase of T concentrations ~24-time fold in the 2018-19 PN season and ~12-time fold in the 2019-20 PN season (Figure 1A). P4 concentrations showed a major peak in April of each PN season, with significant results during the 2018-19 PN season, about one month before nesting onset, with ~50 times increase in the 2018-19 and 2019-20 PN seasons respectively. Measurements of ID Tag 401’s steroid concentrations in 2018 showed a similar trend of P4 concentrations, with a prominent peak in April 2018, in contrast to T concentrations that were not as high as in the subsequent two seasons and were slightly elevated only in April. No correlation was detected between the steroid concentrations in the FN group (Figure S1).
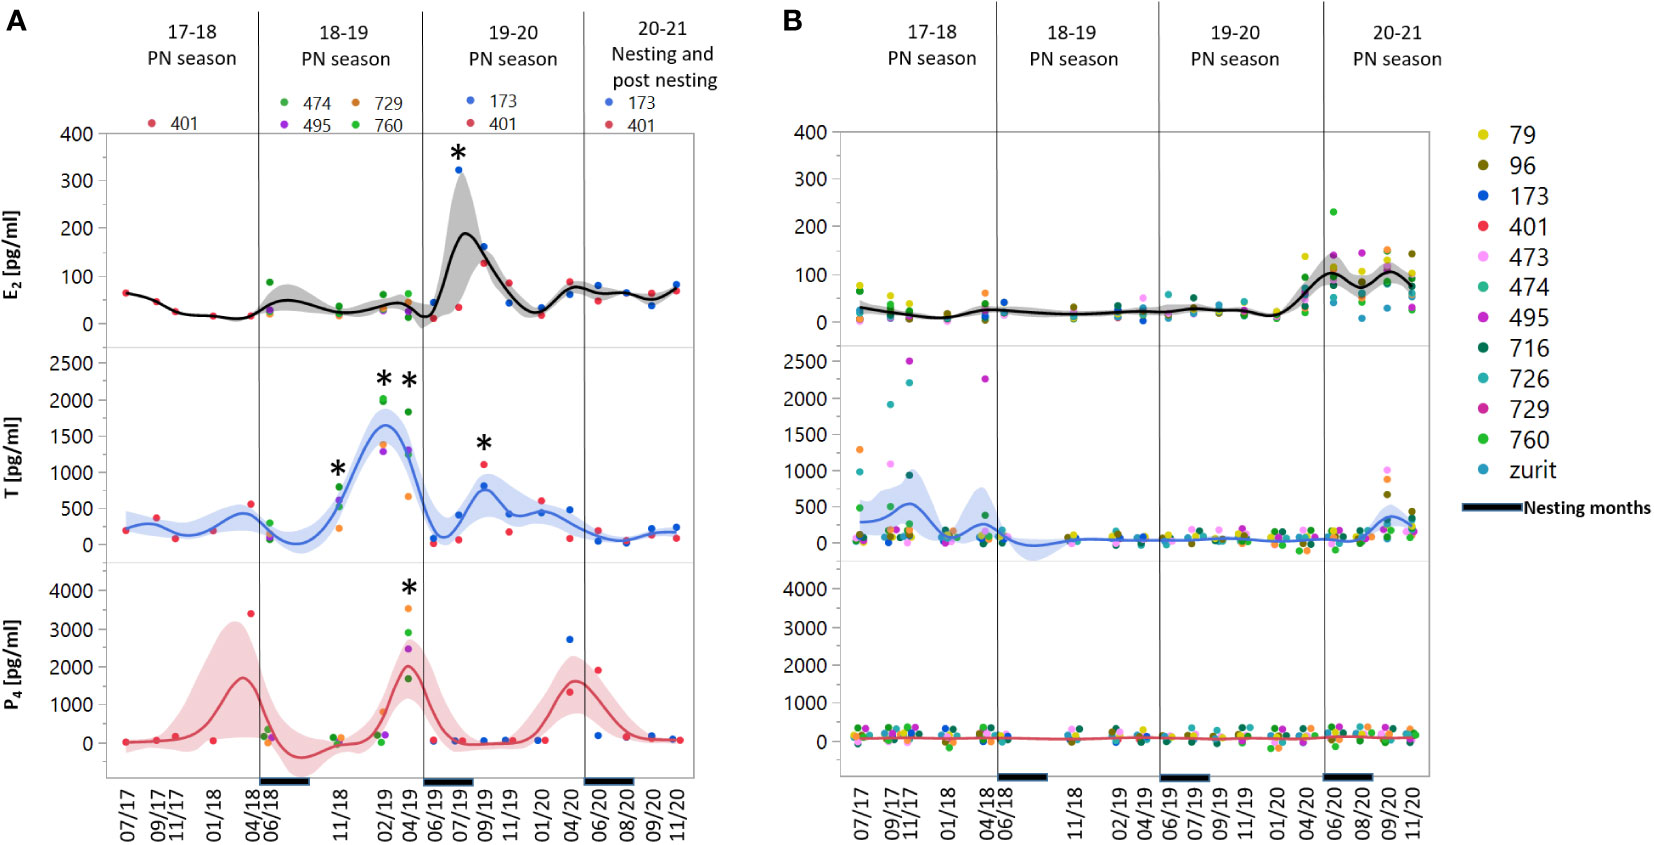
Figure 1 Concentration measurements of sex steroids: estradiol (E2), testosterone (T) and progesterone (P4) in female green turtles, (A) Future nesters (FN) and (B) Non-nesters (NN). Measurements are represented for 19 sampling dates in the period of 2017-2020 divided to 3 pre-nesting (PN) seasons – 2017-18, 2018-19 and 2019-20 and the last nesting/posting season, the nesting period marked at the X axis. At the left panels, asterisk represents significant difference between the two groups p= 0.05. Shaded areas represent the confidence of fit.
Nutrients and metabolites
No apparent differences in UA concentration range and concentrations were observed between the two nesting groups (data not shown). ALB, Chol, TGL and TP concentrations were highly correlated in both nesting groups, except for Chol vs ALB in the NN group that showed no correlation (Figure S2). All four parameters showed elevation towards November and high concentrations in the winter, followed by a drop in concentration right before and with the onset of the nesting activity in April, as seen in the 2020-21 nesting season (Figure 2).
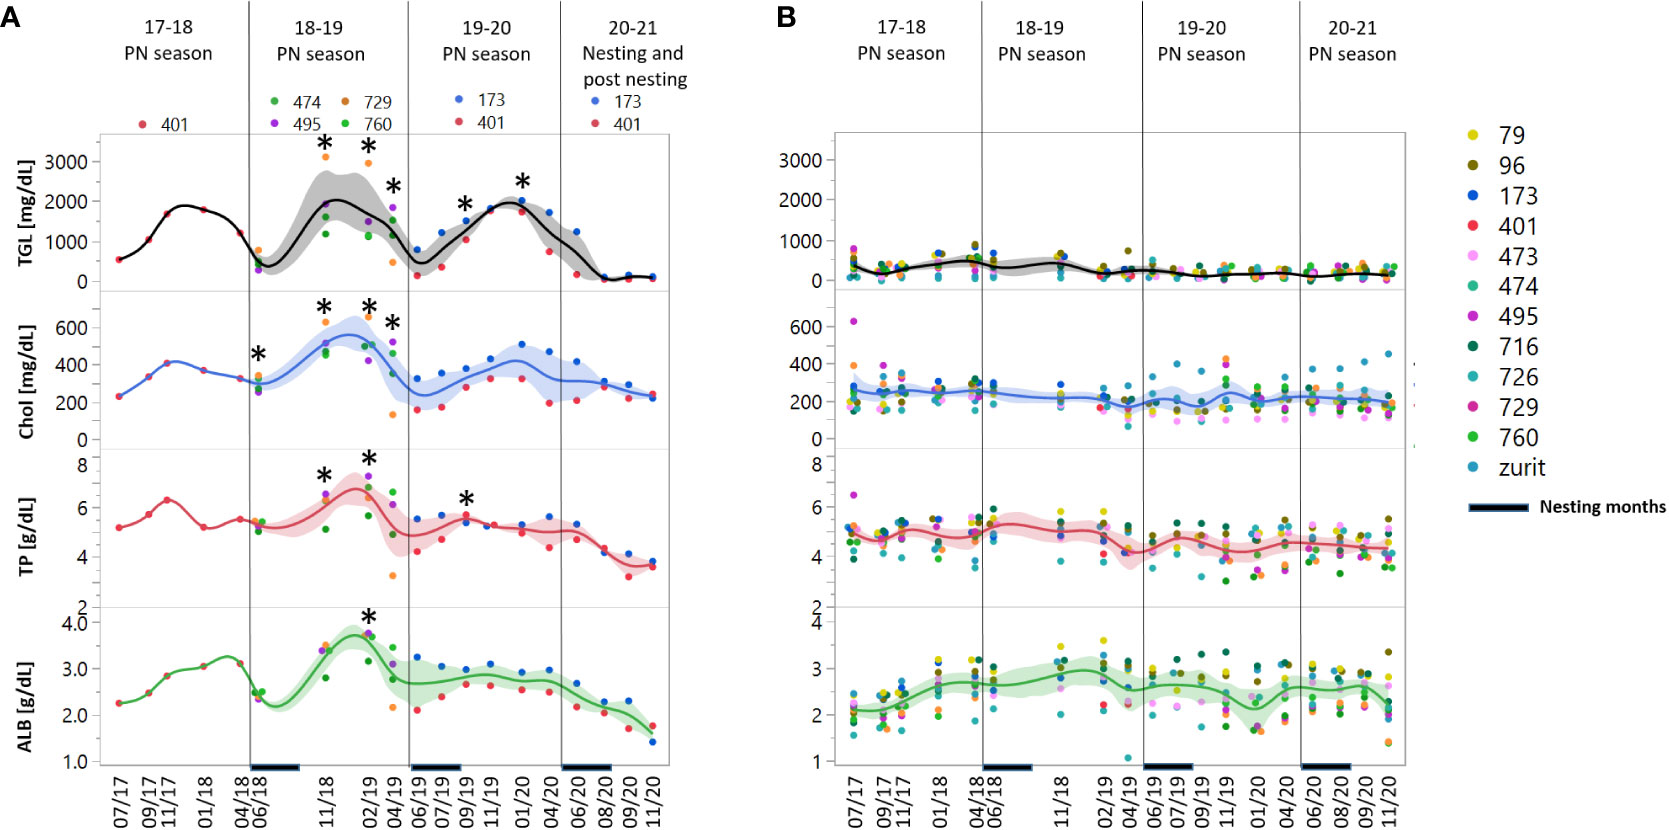
Figure 2 Concentration measurements of nutrients and metabolites: triglycerides (TGL), cholesterol (Chol), total protein (TP) and albumin (ALB) in female green turtles, (A) Future nesters (FN) and (B) Non-nesters (NN). Measurements are represented for 19 sampling dates in the period of 2017-2020 divided to 3 pre-nesting (PN) seasons – 2017-18, 2018-19 and 2019-20 and the last nesting/posting season, the nesting period marked at the X axis. At the left panels, asterisk represents significant difference between the two groups p= 0.05. Shaded areas represent the confidence of fit.
Elements and electrolytes
Similar to nutrient and metabolite concentrations, Ca, Mg and Phos were elevated towards November and remained elevated until February. iCa on the other hand, showed significantly lower concentrations in the FN group compared to the NN during the fall-winter (Figure 3). Within this category, the first three parameters showed significant correlation in both FN and NN groups while iCa concentrations were correlated to Mg and Phos only in the NN group (Figure S3). There were no significant differences between the groups in Cl, K and Na concentrations (data not shown).
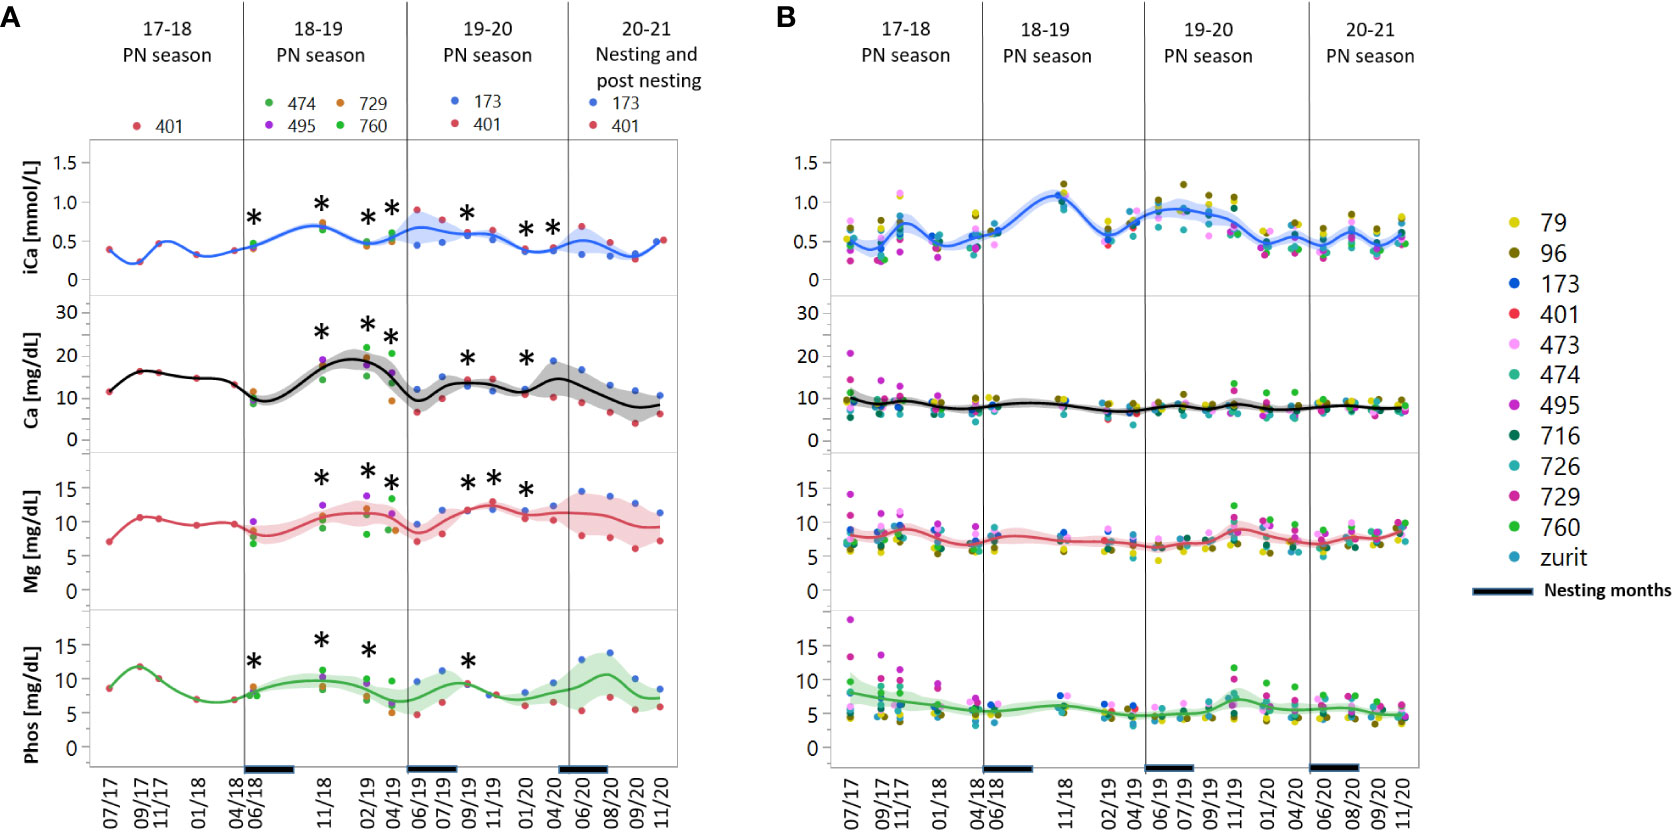
Figure 3 Concentration measurements of elements and electrolytes: ionized calcium (iCa), calcium (Ca), magnesium (Mg) and phosphate (Phos) in female green turtles, (A) Future nesters (FN) and (B) Non nesters (NN). Measurements are represented for 19 sampling dates in the period of 2017-2020 divided to 3 pre-nesting (PN) seasons: 17-18, 18-19 and 19-20, and the last nesting/posting season, the nesting period marked at the X axis. At the left panels, asterisk represents significant difference between the two groups p= 0.05. Shaded areas represent the confidence of fit.
Enzymes
In the enzyme category, only GGT showed a significant difference between groups, while AST, ALT and LDH showed no periodic consistency or repeatability (data not shown). GGT concentrations presented a prominent difference between the NN group, with no enzyme activity detected at all, and the FN group that showed elevated concentrations in November-February (Figure 4).
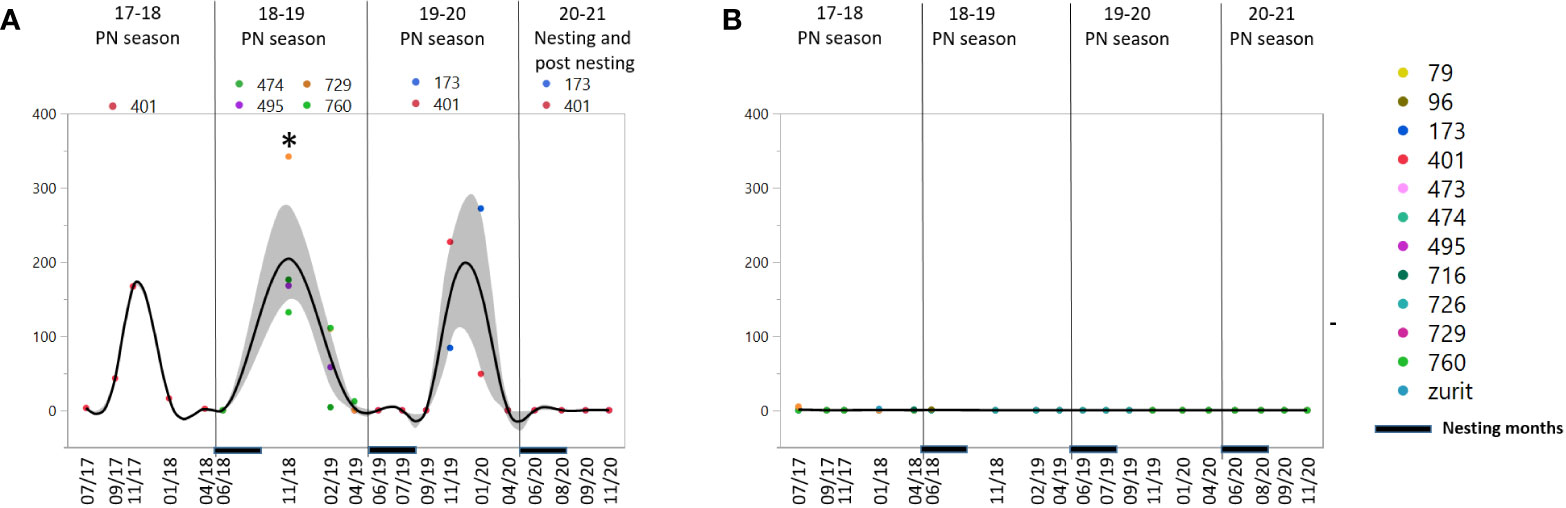
Figure 4 Concentration measurements of gamma-glutamyl transferase (GGT) in female green turtles, (A) Future nesters (FN) and (B) Non nesters (NN). Measurements are represented for 19 sampling dates in the period of 2017-2020 divided to 3 pre-nesting (PN) seasons – 17-18, 18-19 and 19-20 and the last nesting/posting season, the nesting period marked at the X axis. At the left panels, asterisk represents significant difference between the two groups p= 0.05. Shaded area represent the confidence of fit.
Reproductive stage prediction
To assess the best and earliest measurement period suitable for nesting potential prediction, only the parameters significantly or notably different between the two groups were utilized. This collective data was used to devise a PCA test with no regard to the PN season. The earliest month showing a dominant split of the two tested groups was November; ~6 months prior to nesting in April and ~4 months prior to mating (Figure 5A). The difference between the two groups in November was mainly influenced by T, TGL, GGT, Ca and Chol. September`s PCA shows two clearly distinct groups as well, but with only two FN females in one season, and so more data is needed to confirm these results (Figure 5B). Subsequent months also show prominent division of the two groups, mainly influenced by TGL, T GGT, Chol and Ca, up to but not including April (Figure S4).
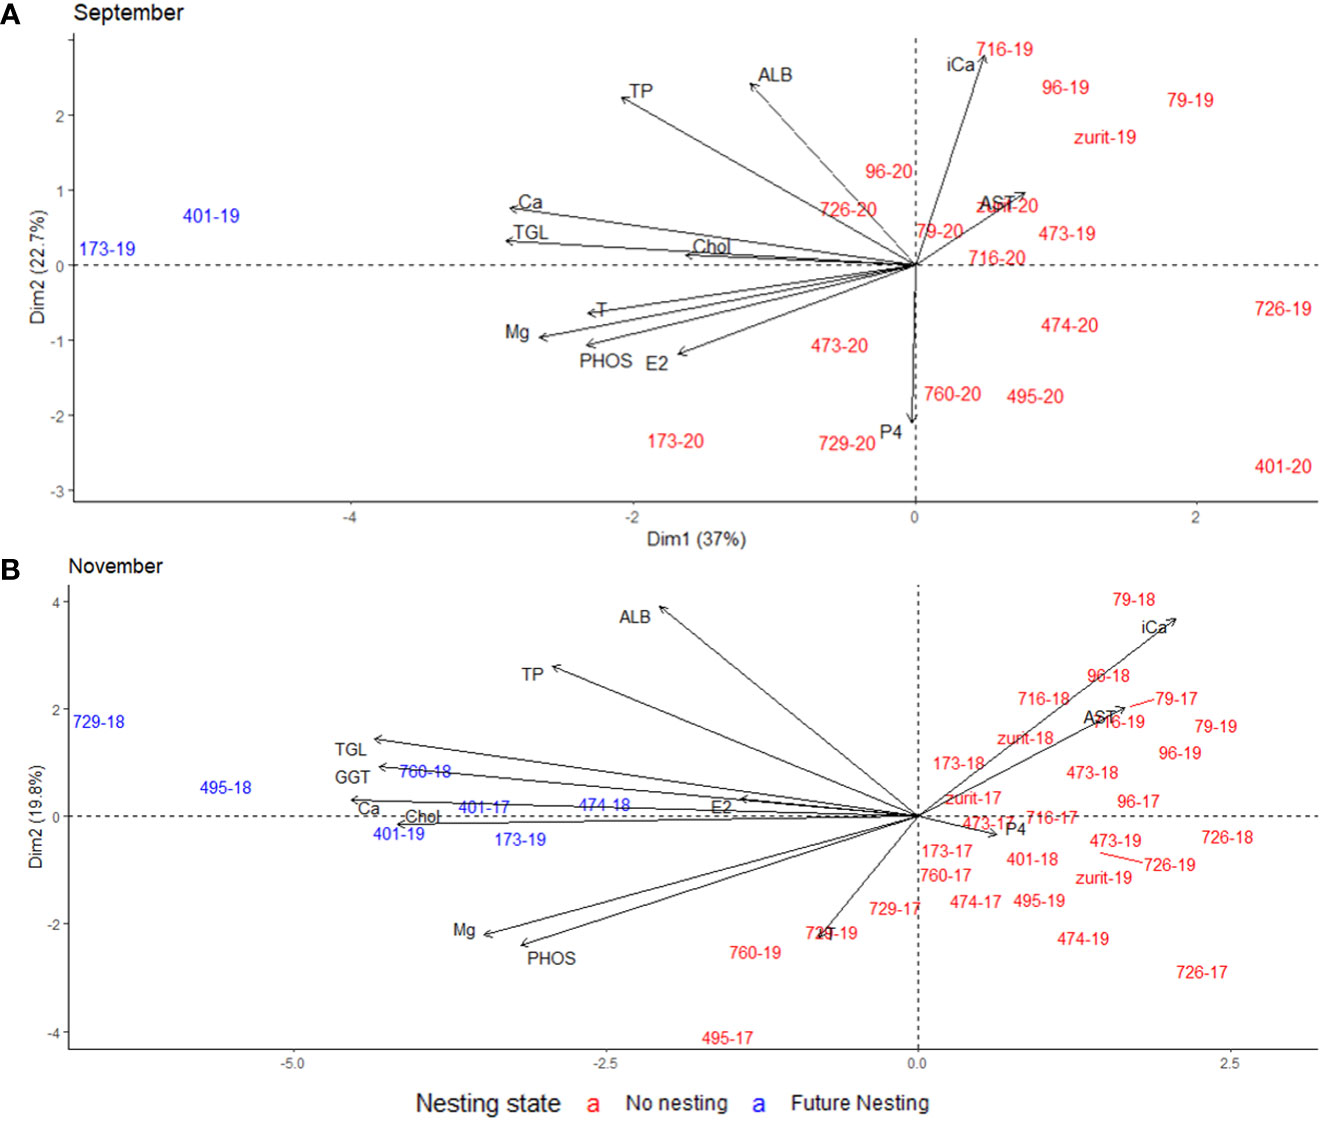
Figure 5 Graphical representations of PCA including 12 blood parameters tested in September (A) and November (B) of two nesting cycles (2018-2020). Each individual sample positioned within the PC axes represented with green turtle female`s ID and the sampled year divided by `-`. The color indicating that individual’s nesting status, future nesting (blue) or non-nesting (red).
P4 was elevated close to nesting season (February April) and influenced the division of the two groups in February and April. P4 was the only one in the sex steroid group to remain elevated over the nesting season in four out of the six nesting females (Figure S5).
Discussion
In this study 3 sex steroids and 16 biochemical parameter concentrations were measured throughout the year to deepen the understanding of the relation between sex steroids and blood biochemistry, and reproductive state in green turtles. The results were analyzed in relation to two reproductive states: future nesting and non-nesting, and showed changes affected by the reproductive state, in all three sex steroids, E2, P4 and T, and 9 blood biochemical parameters: TGL, Chol, ALB, TP, Phos, Mg, Ca, iCa and GGT. All parameters showed notable changes in these concentrations in nesting females` compared to non-nesters during the PN period, some up to 11 months prior to nesting onset (Chol, TGL, iCa and Phos). Most of these parameters increased in FN females during the fall, towards November during both tested PN seasons, and several exhibited notable elevations in September 2019.
The reproductive cycle involves various linked processes, physiological, endocrinal, and behavioral. The chronological sequence of the ovarian cycle in sea turtles is initiated with vitellogenesis that can start 10-12 months before migration in green turtles (Hamann et al., 2002) and in loggerheads (Wibbels et al., 1990; Miller, 1996), and is fully complete prior to the beginning of nesting. Vtg is a precursor to several egg yolk proteins and carries lipids (predominantly TGL) to the growing oocytes (Ho et al., 1982; Wallace, 1985). Vtg is a relatively large (205 kDa) lipoglycophospho-protein synthesized in the liver and transported to the ovary via blood circulation (Heck et al., 1997). The pattern of TGL plasma concentrations in the FN females can be explained with the transport of TGL to the liver for Vtg synthesis and the transport of Vtg to the ovary that will be depleted by the end of the nesting period. Hamann et al., (Hamann et al., 2002) showed a similar pattern with TGL concentrations peaking during vitellogenesis and courtship, and declining to base concentrations after the last clutch. Kwan, suggested that sub-carapace depot fat which was found to be high in vitellogenic green turtle females, is used to fuel the energetically expensive costs of migration and egg production (Kwan, 1994). High body fat can explain the high plasma Chol concentrations remaining even at the end of the nesting season.
In reptiles, Vtg synthesis is reported to be dependent on E2. This was confirmed by stimulation of Vtg synthesis and oviductal growth by E2 injections in green turtles (Herbst et al., 2003). Most studies showed very low or undetectable E2 concentrations in nesting green turtle females, captive and wild, during the nesting period (Licht et al., 1979; Al-Habsi et al., 2006). E2 results from our study show a peak in September (>100 pg/ml compared to mean of 23.13 pg/ml in non-nesters) in both nesting females of 2020 in their PN season. The elevation in September 2019, 8 months prior to nesting, coincides with the early onset of Vtg synthesis in sea turtles, yet no significantly elevated concentrations were detected in the prior PN season. Since no samples were taken between June and November of 2018, there is a five-month interval in which an elevation in E2 could have occurred in the nesting females of the 2018-19 season.
Mg, Phos and Ca concentrations were significantly higher in nesting females, compared to non-nesters, from the early PN season, 8-11 months prior to nesting, with more dominantly higher concentrations in September-November, 6-8 months prior to nesting. Numerous factors related to the reproductive status of the female may influence these high concentrations; the most likely are vitellogenesis and egg production. In addition to lipids, Vtg binds both Phos and to a lesser extent, Ca (Wallace, 1985). Indeed, Heck et al. (1997) showed highly correlated increases in Ca and Phos, in addition to Vtg, stimulated by E2 injections in L. kempi turtles. The measured Phos concentrations in nesting females can be explained by the presence of Vtg in the plasma as it is mobilized to the ovary during the PN season. Ca is needed both for Vtg synthesis and for eggshell calcification. The measured Ca concentrations consist of both free Ca (iCa) and protein-bound Ca. The significant decline in iCa concentrations in nesting females during the majority of the PN season may indicate the usage of iCa in egg production while increasing protein bound Ca in the blood, such as Vtg. No specific correlation to Mg elevation during vitellogenesis in sea turtles were found except for Mg mobilization to the ovary for egg production. Youngsabanant and Nuamsukon (2020) found that green turtle`s eggshell contains 0.1% Mg, compared to 2.54% Ca, 0.96% Na and 0.21% Cl, both Na and Cl showed no difference in concentrations between the two groups, though their percentage of the eggshell is higher than Mg, making this explanation less feasible. In contrast to studies on sea turtle, Vtg was found to be co-eluted with Mg in the rainbow trout in a 9:1 ratio, as Ca (Björnsson and Haux, 1985). The relation of Mg to Vtg can explain its elevation in the nesting females` plasma. Increase in protein synthesis demands during vitellogenesis can also explain the elevation in plasma ALB and TP concentrations. Herbst et al. (2003) showed a two-fold rise in TP concentration within one month after E2 treatment. In addition, ALB production may be influenced by a massive P4 surge at ovulation as the fertilized gametes are processed in the oviduct to form eggs (Licht et al., 1979; Owens and Morris, 1985). P4, secreted by the corpora lutea, is associated with the ovulation process, involved in the maturation of follicles and reducing oviductal movement during the shelling of the eggs (Blanvillain et al., 2011). Licht et al. (1979) reported elevated P4 concentrations in captive breeding females during their mating phase (1,820 - 1,900 pg/ml) and higher concentrations in their nesting phase (2,360 -3,000 pg/ml). Though the present study did not test P4 surges hours after nesting, it showed that P4 concentrations were significantly high in all nesting females and was the only steroid with elevated concentrations during the nesting season. All nesting females exhibited high concentrations in June (mean of 2,760 pg/ml compared to 60.6 pg/ml in NN females) that gradually decreased by the end of the nesting season in September. These results combined with the measurement of high concentrations in successful nesters compared to unsuccessful ones (Wibbels et al., 1992; Al-Habsi et al., 2006) support the assumption that P4 acts as ovulation inhibitor.
During the PN season, pronounced elevation of testosterone was observed in females from September/November, 4-6 months prior to mating, until the concentrations peaked in February, two months prior to mating. No previous study has tested T concentrations in female green turtles over such an extensive period of time for the same individuals, yet it has been suggested that rise in T concentrations can act as a breeding behavior initiator and a possible trigger to male-attractive pheromones (Owens and Morris, 1985; Licht et al., 1985b).
Some of the most interesting results of this study are related to the enzyme groups. GGT enzyme is not usually used in biochemical analysis in sea turtles since its concentrations are minor or undetectable (Anderson et al., 2013) in any tissues or serum in reptiles and no previous data relating GGT activity to a reproductive cycle in reptiles exists. Previously it was suggested in loggerhead sea turtle that elevations in GGT together with ALT and AST might suggest renal or liver disease (Anderson et al., 2013). However, in the present study, though GGT concentrations were undetectable in most turtles` measurement, all nesting females had elevated GGT concentrations from November to February in the PN season (3-6 months prior to nesting) with a high peak in November. In mallards, egg laying activity significantly influences serum enzyme activity and GGT activity was reported to be elevated tenfold compared to other reproductive periods (Fairbrother et al., 1990). In cattle, GGT was identified as one of the enzymes found in milk and was found active during lactation but with no change in plasma GGT during this process (Calamari et al., 2015). Yet, the reason for GGT elevation in female green turtles before the nesting activity itself, is yet to be understood.
This study recorded the clutch size per each nested female and the hatching success per nest. All nests in this study were relocated to coastal hatcheries in protected and monitored nature reserves immediately after nesting. Nest relocation was preformed according to the NPA nesting management program applied successfully since 1993 on nests laid in disturbed coasts due to anthropogenic impacts such as light pollution (Kuller, 1999; Levy and Rybak, 2022). Nevertheless, hatching success of the captivated females was low in comparison to the wild population. We suggest that the low hatching success can be due to the first oviposition of the females, as this is one of the few projects in the world that kept the turtles in captivity from their hatching in the breeding facility, it is uncertain which nests are the first nests of females in the wild. Secondly, sexual maturity of Mediterranean green sea turtle’s subpopulation is considered as 20 to 30 years. Earlier ovulating (16 years) of the captivated turtles may result in low hatching success. Furthermore, we suspect that the sexual maturity of the males in this project were later than the females. This can lead to less effective males in the breeding facility which can result in low fertilization rate, hence low hatching success. As green sea turtles have multiple parenting (Ireland et al., 2003), if only one of the males is sexually mature this can lead to low percentage of fertilization. Lastly, in 2019, 4 nests of the females from our facility were flooded and therefore we had low emergence rates that year in those specific nests (Table S2). Further research is needed to confirm these hypotheses by conducting more sampling to better understand the effects of captivity on the hormone activity and consequently on the breeding success.
To our knowledge this is the first study in which both sex steroids and biochemical parameters were tested with regard to the reproductive stage of green turtles and measured over a prolonged period of time. Our study on the green turtles` breeding stock allowed the comparison between siblings and turtles of the same age, which were raised under similar conditions. All parameters, except for GGT, can be related to at least one of the reproductive processes: vitellogenesis, female mating receptivity, ovulation, egg production or high metabolic requirements. The changes in enzyme level in the blood and the connection to the reproduction state of the females warrants attention for future studies.
The knowledge gained from the analysis of blood sex steroids and biochemistry in green sea turtle females can be divided according to a possible relation to each of the reproductive processes. The vitellogenic process probably commences in September, at least 8 months prior to nesting activity, and some parameters are possibly related to more than one process. We can link TGL, Chol, Mg, Phos, Ca and TP to this process as well as to the presence of Vtg in the female`s blood stream; T can be related to female mating receptivity based on its elevation timing and prior studies; P4 is related to ovulation commencement and possibly to oviposition itself, and egg production requires TP, ALB, Ca, Phos and Mg. In addition to the processes mentioned above, the female has high metabolic requirements translated to further elevation in protein and lipids. Little is still known regarding the role and circulation of E2, but our results indicate that elevation occurs in green turtles early in their reproductive preparations, and within the timeframe in which vitellogenesis takes place. Further investigation of the elevation of E2 concentrations at the end of the season may produce insights regarding the reason for the long nesting cycle, and an understanding of the influencing conditions could help to shorten the period between nesting seasons. To conclude, in this study all the factors mentioned above can indicate an upcoming oviposition at least 6 months prior to nesting as seen in the PCA analysis. This information can contribute to the success of green sea turtle breeding programs in captivity and will hopefully help the Israeli Rescue Center predict and prepare for nesting activities in the years ahead.
Data availability statement
The raw data supporting the conclusions of this article will be made available by the authors, without undue reservation.
Ethics statement
The animal study was reviewed and approved by Israel Nature and Parks Authority.
Author contributions
This study was conceived and designed by OR and JA. OR, OS, and YL performed the experiments and sampling. The manuscript was written by OR and JA and reviewed and approved by all co-authors. All authors analyzed and interpreted the data. All authors contributed to the article and approved the submitted version.
Funding
This research was supported by the Israel Science Foundation (ISF) (Grant No. 451/21) and the internal research funding program of Faculty of Marine Sciences, Ruppin Academic Center, Israel.
Conflict of interest
The authors declare that the research was conducted in the absence of any commercial or financial relationships that could be construed as a potential conflict of interest.
Publisher’s note
All claims expressed in this article are solely those of the authors and do not necessarily represent those of their affiliated organizations, or those of the publisher, the editors and the reviewers. Any product that may be evaluated in this article, or claim that may be made by its manufacturer, is not guaranteed or endorsed by the publisher.
Supplementary material
The Supplementary Material for this article can be found online at: https://www.frontiersin.org/articles/10.3389/fmars.2023.1132573/full#supplementary-material
Supplementary Figure 1 | Correlation matrices showing Spearman rank correlation coefficient between blood sex steroids of future nesting (FN) green turtle females (A) and non-nesting (NN) green turtle females (B).
Supplementary Figure 2 | Correlation matrices showing Spearman rank correlation coefficient between blood nutrients and metabolites of future nesting (FN) green turtle females (A) and non-nesting (NN) green turtle females (B).
Supplementary Figure 3 | Correlation matrices showing Spearman rank correlation coefficient between blood elements and electrolytes of future nesting (FN) green turtle females (A) and non-nesting (NN) green turtle females (B).
Supplementary Figure 4 | Graphical representations of PCA including 12 blood parameters tested in June (A), July (B), January (C), February (D) and April (E) of two nesting cycles (2018-2020). Each individual sample positioned within the PC axes represented with green turtle female`s ID and the sampled year divided by `-`. The color indicating that individual’s nesting status, future nesting (blue) or non-nesting (red).
Supplementary Figure 5 | Concentration measurements of progesterone (P4) for females that nested in 18-19 season (A) and 19-20 season (B), in their future nesting - FN (green symbols) and nesting state (blue symbols). Measurements are represented for the (PN) season and the nesting period as marked at the X axis.
Supplementary Table 1 | Information of location, tagging and physical data of the green sea turtles from Mikhmoret, Israel breeding stock. CCL - curved carapace length, CCW - curved carapace width. Origin refers to city in Israel.
Supplementary Table 2 | Nesting activity of green turtle females in the years 2018-2020. Ukn – unknown female
References
Al-Habsi A. A., AlKindi A. Y. A., Mahmoud I. Y., Owens D. W., Khan T., al-Abri A. (2006). Plasma hormone levels in the green turtles chelonia mydas during peak period of nesting at ras Al-Hadd-Oman. J. Endocrinol. 191 (1), 9–14. doi: 10.1677/joe.1.06790
Almeida A. P., Moreira L. M. P., Bruno S. C., Thomé J. C. A., Martins A. S., Bolten A. B., et al. (2011). Green turtle nesting on trindade island, Brazil: Abundance, trends, and biometrics. Endangered Species Res. 14 (3), 193–201. doi: 10.3354/esr00357
Anderson E. T., Socha V. L., Gardner J., Byrd L., Manire C. A. (2013). Tissue enzyme activities in the loggerhead sea turtle (Caretta caretta). J. Zoo Wildlife Med. 44 (1), 62–69. doi: 10.1638/1042-7260-44.1.62
Arthur K. E., Limpus C. J., Whittier J. M. (2008). Baseline blood biochemistry of Australian green turtles (Chelonia mydas) and effects of exposure to the toxic cyanobacterium lyngbya majuscula. Aust. J. Zoology 56 (1), 23–32. doi: 10.1071/ZO08055
Balazs G. H., Chaloupka M. (2004). Spatial and temporal variability in somatic growth of green sea turtles (Chelonia mydas) resident in the Hawaiian archipelago. Mar. Biol. 145 (5), 1043–1059. doi: 10.1007/s00227-004-1387-6
Bass A. L., Epperly S. P., Braun-McNeill J. (2006). Green turtle (Chelonia mydas) foraging and nesting aggregations in the Caribbean and Atlantic: Impact of currents and behavior on dispersal. J. Heredity 97 (4), 346–354. doi: 10.1093/jhered/esl004
Bjorndal K. A., Jackson J. B. (2002). “"10 roles of sea turtles in marine ecosystems: reconstructing the past,",” in The biology of sea turtles. Eds. Lutz P. L., Musick J. A., Wyneken J. (Boca Raton, FL: CRC Press).
Björnsson B. T., Haux C. (1985). Distribution of calcium, magnesium and inorganic phosphate in plasma of estradiol-17β treated rainbow trout. J. Comp. Physiol. B 155 (3), 347–352. doi: 10.1007/BF00687477
Blanvillain G., Owens D. W., Kuchling G. (2011). “Chapter 10 - hormones and reproductive cycles in turtles,” in Hormones and reproduction of vertebrates. Eds. Norris D. O., Lopez K. H. (London: Academic Press), 277–303.
Broderick A. C., Glen F., Godley B. J., Hays G. C. (2003). Variation in reproductive output of marine turtles. J. Exp. Mar. Biol. Ecol. 288 (1), 95–109. doi: 10.1016/S0022-0981(03)00003-0
Calamari L., Gobbi L., Russo F., Cappelli F. P. (2015). Pattern of γ-glutamyl transferase activity in cow milk throughout lactation and relationships with metabolic conditions and milk composition1. J. Anim. Sci. 93 (8), 3891–3900. doi: 10.2527/jas.2015-9022
Casal A. B., Camacho M., López-Jurado L. F., Juste C., Orós J. (2009). Comparative study of hematologic and plasma biochemical variables in Eastern Atlantic juvenile and adult nesting loggerhead sea turtles (Caretta caretta). Veterinary Clin. Pathol. 38 (2), 213–218. doi: 10.1111/j.1939-165X.2008.00106.x
Casale P., Broderick A. C., Camiñas J. A., Cardona L., Carreras C., Demetropoulos A., et al. (2018). Mediterranean Sea turtles: Current knowledge and priorities for conservation and research. Endangered Species Res. 36, 229–267. doi: 10.3354/esr00901
Casale P., Margaritoulis D. (2010). Sea Turtles in the Mediterranean: Distribution, threats and conservation priorities (Gland, Switzerland: IUCN).
Cavallo C., Dempster T., Kearney M. R., Kelly E., Booth D., Hadden K. M., et al. (2015). Predicting climate warming effects on green turtle hatchling viability and dispersal performance. Funct. Ecol. 29 (6), 768–778. doi: 10.1111/1365-2435.12389
Chaloupka M., Limpus C., Miller J. (2004). Green turtle somatic growth dynamics in a spatially disjunct great barrier reef metapopulation. Coral Reefs 23 (3), 325–335. doi: 10.1007/s00338-004-0387-9
Chassin-Noria O., Macip-Ríos R., Dutton P. H., Oyama K. (2017). Multiple paternity in the East pacific green turtle (Chelonia mydas) from the pacific coast of Mexico. J. Exp. Mar. Biol. Ecol. 495, 43–47. doi: 10.1016/j.jembe.2017.05.015
Clukey K. E., Lepczyk C. A., Balazs G. H., Work T. M., Lynch J. M. (2017). Investigation of plastic debris ingestion by four species of sea turtles collected as bycatch in pelagic pacific longline fisheries. Mar. pollut. Bull. 120 (1), 117–125. doi: 10.1016/j.marpolbul.2017.04.064
R. Core Team (2022). "R: A language and environment for statistical computing (Vienna, Austria: R Foundation for Statistical Computing").
Deem S. L., Dierenfeld E. S., Sounguet G. P., Alleman A. R., Cray C., Poppenga R. H., et al. (2006). Blood values values in free-ranging nesting leatherback sea turtles (Dermochelys coriacea) on the coast of the republic of gabon. J. Zoo Wildlife Med. 37 (4), 464–471. doi: 10.1638/05-102.1
Deem S. L., Norton T. M., Mitchell M., Segars A., Alleman A. R., Cray C., et al. (2009). Comparison of blood values in foraging, nesting, and stranded loggerhead turtles (Caretta caretta) along the coast of georgia, usa. J. Wildlife Dis. 45 (1), 41–56. doi: 10.7589/0090-3558-45.1.41
Dickinson V. M., Jarchow J. L., Trueblood M. H. (2002). Hematology and plasma biochemistry reference range values for free-ranging desert tortoises in arizona. J. Wildlife Dis. 38 (1), 143–153. doi: 10.7589/0090-3558-38.1.143
Ehsanpour M., Ahmadi M. R., Bahri A. H., Afkhami M., Reich K. J. (2015). Plasma biochemistry values in wild female hawksbill turtles (Eretmochelys imbricata), during nesting and foraging seasons in qeshm island, Persian gulf. Comp. Clin. Pathol. 24 (3), 561–566. doi: 10.1007/s00580-014-1945-3
Ekanayake L., Kapurusinghe T., Saman M., Rathnakumara D. S., Samaraweera P., Ranawana K., et al. (2013). Paternity of green turtle (Chelonia mydas) clutches laid at kosgoda, Sri Lanka. Herpetological Conserv. Biol. 8, 27–37.
Fairbrother A., Craig M. A., Walker K., O'Loughlin D. (1990). Changes in mallard (Anas platyrhynchos) serum chemistry due to age, sex, and reproductive condition. J. Wildlife Dis. 26 (1), 67–77. doi: 10.7589/0090-3558-26.1.67
Frazer N. B., Ladner R. C. (1986). A growth curve for green Sea turtles, Chelonia mydas, in the U.S. virgin islands 1913-14. Copeia 1986 (3), 798–802. doi: 10.2307/1444963
Goldberg D. W., Leitão S. A. T., Godfrey M. H., Lopez G. G., Santos A. J. B., Neves F. A., et al. (2013). Ghrelin and leptin modulate the feeding behaviour of the hawksbill turtle Eretmochelys imbricata during nesting season. Conserv. Physiol. 1 (1). doi: 10.1093/conphys/cot016
Goldberg D. W., Wanderlinde J., Freire I. M. A., Silva L. C. P. (2011). Serum biochemistry profile determination for wild loggerhead sea turtles nesting in Campos dos goytacazes, Rio de Janeiro, Brazil. Ciec. Rural 41 (1), 143–148. doi: 10.1590/S0103-84782011000100023
Goshe L. R., Avens L., Scharf F. S., Southwood A. L. (2010). Estimation of age at maturation and growth of Atlantic green turtles (Chelonia mydas) using skeletochronology. Mar. Biol. 157 (8), 1725–1740. doi: 10.1007/s00227-010-1446-0
Hamann M., Limpus C., Whittier J. (2002). Patterns of lipid storage and mobilisation in the female green sea turtle (Chelonia mydas). J. Comp. Physiol. B 172 (6), 485–493. doi: 10.1007/s00360-002-0271-2
Hays G. C., Broderick A. C., Glen F., Godley B. J. (2002). Change in body mass associated with long-term fasting in a marine reptile: the case of green turtles (Chelonia mydas) at ascension island. Can. J. Zoology 80 (7), 1299–1302. doi: 10.1139/z02-110
Heck J., MacKenzie D. S., Rostal D., Medler K., Owens D. (1997). Estrogen induction of plasma vitellogenin in the kemp's ridley Sea turtle (Lepidochelys kempi). Gen. Comp. Endocrinol. 107 (2), 280–288. doi: 10.1006/gcen.1997.6930
Herbst L. H., Siconolfi-Baez L., Torelli J. H., Klein P. A., Kerben M. J., Schumacher I. M. (2003). Induction of vitellogenesis by estradiol-17β and development of enzyme-linked immunosorbant assays to quantify plasma vitellogenin levels in green turtles (Chelonia mydas). Comp. Biochem. Physiol. Part B: Biochem. Mol. Biol. 135 (3), 551–563. doi: 10.1016/S1096-4959(03)00141-6
Ho S. M., Kleis S., McPherson R., Heisermann G. J., Callard I. P. (1982). Regulation of vitellogenesis in reptiles. Herpetologica 38 (1), 40–50. https://www.jstor.org/stable/3892360
Ireland J. S., Broderick A. C., Glen F., Godley B. J., Hays G. C., Lee P. L. M., et al. (2003). Multiple paternity assessed using microsatellite markers, in green turtles Chelonia mydas (Linnaeus 1758) of ascension island, south Atlantic. J. Exp. Mar. Biol. Ecol. 291 (2), 149–160. doi: 10.1016/S0022-0981(03)00118-7
IUCN (2004). Chelonia mydas: Seminoff, J.A. (Southwest Fisheries Science Center, U.S.): The IUCN Red List of Threatened Species 2004. International Union for Conservation of Nature. doi: 10.2305/IUCN.UK.2004.RLTS.T4615A11037468.en
Jacobson E. R. (2007). Infectious diseases and pathology of reptiles: color atlas and text (Boca Raton, FL: CRC Press).
Kakizoe Y., Sakaoka K., Kakizoe F., Yoshii M., Nakamura H., Kanou Y., et al. (2007). Successive changes of hematologic characteristics and plasma chemistry values of juvenile loggerhead turtles (Caretta caretta). J. Zoo Wildlife Med. 38 (1), 77–84. doi: 10.1638/05-096.1
Kasparek M., Godley B. J., Broderick A. C. (2001). ). nesting of the green turtle, Chelonia mydas, in the Mediterranean: a review of status and conservation needs. Zoology Middle East 24 (1), 45–74. doi: 10.1080/09397140.2001.10637885
Kear B. P., Lee M. S. Y. (2006). A primitive protostegid from Australia and early sea turtle evolution. Biol. Lett. 2 (1), 116–119. doi: 10.1098/rsbl.2005.0406
Kuller Z. (1999). Current status and conservation of marine turtles on the Mediterranean coast of Israel. Mar. Turtle Newslett. 86, 3–5. https://www.seaturtle.org/mtn/archives/mtn86/mtn86p3.shtml
Kwan D. (1994). Fat reserves and reproduction in the green turtle, Chelonia mydas. Wildlife Res. 21 (3), 257–265. doi: 10.1071/WR9940257
Levy Y., Rybak O. (2022). A report on the 2021 Sea turtle breeding season along israel's Mediterranean coast. MedTurtle Bulletin. 2:23–27 https://alanrees.my-free.website/medturtlebulletin
Lewison R. L., Crowder L. B., Wallace B. P., Moore J. E., Cox T., Zydelis R., et al. (2014). Global patterns of marine mammal, seabird, and sea turtle bycatch reveal taxa-specific and cumulative megafauna hotspots. Proc. Natl. Acad. Sci. 111 (14). doi: 10.3389/fmars.2022.826587
Licht P., Breitenbach G. L., Congdon J. D. (1985a). Seasonal cycles in testicular activity, gonadotropin, and thyroxine in the painted turtle, Chrysemys picta, under natural conditions. Gen. Comp. Endocrinol. 59 (1), 130–139. doi: 10.1016/0016-6480(85)90427-7
Licht P., Porter D. A. (1985). LH secretion in response to gonadotropin releasing hormone (GnRH) by superfused pituitaries from two species of turtles. Gen. Comp. Endocrinol. 59 (3), 441–448. doi: 10.1016/0016-6480(85)90402-2
Licht P., Wood J., Owens D. W., Wood F. (1979). Serum gonadotropins and steroids associated with breeding activities in the green sea turtle Chelonia mydas: I. captive animals. Gen. Comp. Endocrinol. 39 (3), 274–289. doi: 10.1016/0016-6480(79)90122-9
Licht P., Wood J. F., Wood F. E. (1985b). Annual and diurnal cycles in plasma testosterone and thyroxine in the male green sea turtle Chelonia mydas. Gen. Comp. Endocrinol. 57 (3), 335–344. doi: 10.1016/0016-6480(85)90212-6
Limpus C., Kamrowski R. L. (2013). Ocean-finding in marine turtles: the importance of low horizon elevation as an orientation cue. Behaviour 150 (8), 863–893. doi: 10.1163/1568539X-00003083
Limpus C. J., Miller J. D., Parmenter C. J., Limpus D. J. (2003). The green turtle, Chelonia mydas, population of raine island and the northern great barrier reef: 1843-2001. Memoirs-Queensland Museum 49 (1), 349–440.
Limpus C., Nicholls N. (1988). The southern oscillation regulates the annual numbers of green turtles (Chelonia mydas) breeding around northern australia. Wildlife Res. 15 (2), 157–161. doi: 10.1071/WR9880157
López-Barrera E. A., Longo G. O., Monteiro-Filho E. L. A. (2012). Incidental capture of green turtle (Chelonia mydas) in gillnets of small-scale fisheries in the paranaguá bay, southern Brazil. Ocean Coast. Manage. 60, 11–18. doi: 10.1016/j.ocecoaman.2011.12.023
Miller J. D. (1996). The biology of Sea turtles. Eds. Lutz P. L., Musick J. A. (Boca Raton: CRC Press).
Nada M., Casale P. (2011). Sea Turtle bycatch and consumption in Egypt threatens Mediterranean turtle populations. Oryx 45 (1), 143–149. doi: 10.1017/S0030605310001286
Owens D. W., Morris Y. A. (1985). The comparative endocrinology of Sea turtles. Copeia 1985 (3), 723–735. doi: 10.2307/1444766
Patrício A. R., Formia A., Barbosa C., Broderick A. C., Bruford M., Carreras C., et al. (2017). Dispersal of green turtles from africas largest rookery assessed through genetic markers. Mar. Ecol. Prog. Ser. 569, 215–225. doi: 10.3354/meps12078
Prieto-Torres D. A., Hernández J. L., Henríquez A. R. B., Alvarado M. C., Dávila M. J. (2013). Blood biochemistry of the breeding population of green turtles (Chelonia mydas) in the Aves island wildlife refuge, Venezuela. South Am. J. Herpetology 8 (3), 147–154. doi: 10.2994/SAJH-D-13-00010.1
Proietti M. C., Reisser J. W., Kinas P. G., Kerr R., Monteiro D. S., Marins L. F., et al. (2012). Green turtle Chelonia mydas mixed stocks in the western south Atlantic, as revealed by mtDNA haplotypes and drifter trajectories. Mar. Ecol. Prog. Ser. 447, 195–209. doi: 10.3354/meps09477
Putman N. F., Mansfield K. L. (2015). Direct evidence of swimming demonstrates active dispersal in the Sea turtle “Lost years”. Curr. Biol. 25 (9), 1221–1227. doi: 10.1016/j.cub.2015.03.014
Reich K. J., Bjorndal K. A., Bolten A. B. (2007). The ‘lost years’ of green turtles: Using stable isotopes to study cryptic lifestages. Biol. Lett. 3 (6), 712–714. doi: 10.1098/rsbl.2007.0394
Reina R. D., Spotila J. R., Paladino F. V., Dunham A. E. (2009). Changed reproductive schedule of eastern pacific leatherback turtles Dermochelys coriacea following the 1997–98 El niño to la niña transition. Endangered Species Res. 7 (2), 155–161. doi: 10.3354/esr00098
Saragoça Bruno R., Restrepo J. A., Valverde R. A. (2020). Effects of El niño southern oscillation and local ocean temperature on the reproductive output of green turtles (Chelonia mydas) nesting at tortuguero, Costa Rica. Mar. Biol. 167 (9), 128. doi: 10.1007/s00227-020-03749-z
Seminoff J. A., Jones T. T., Resendiz A., Nichols W. J., Chaloupka M. Y. (2003). Monitoring green turtles (Chelonia mydas) at a coastal foraging area in Baja California, Mexico: Multiple indices to describe population status. J. Mar. Biol. Assoc. United Kingdom 83 (6), 1355–1362. doi: 10.1017/S0025315403008816
Sifuentes-Romero I., Vázquez-Boucard C., Sierra-Beltrán A. P., Gardner S. C. (2006). Vitellogenin in black turtle (Chelonia mydas agassizii): Purification, partial characterization, and validation of an enzyme-linked immunosorbent assay for its detection. Environ. Toxicol. Chem. 25 (2), 477–485. doi: 10.1897/05-063R2.1
Sönmez B. (2019). Morphological variations in the green turtle (Chelonia mydas): A field study on an Eastern Mediterranean nesting population. Zool Stud. 58, e16. doi: 10.6620/ZS.2019.58-16
Tikochinski Y., Bendelac R., Barash A., Daya A., Levy Y., Friedmann A. (2012). Mitochondrial DNA STR analysis as a tool for studying the green sea turtle (Chelonia mydas) populations: The Mediterranean Sea case study. Mar. Genomics 6, 17–24. doi: 10.1016/j.margen.2012.01.002
Tim S. J., Mark H., Colin J. L. (2004). Body condition and physiological changes in male green turtles during breeding. Mar. Ecol. Prog. Ser. 276, 281–288. doi: 10.3354/meps276281
Van Houtan K. S., Hargrove S. K., Balazs G. H. (2014). Modeling Sea turtle maturity age from partial life history records. Pacific Sci. 68 (4), 465–477. doi: 10.2984/68.4.2
Van Houtan K. S., Kittinger J. N. (2014). Historical commercial exploitation and the current status of Hawaiian green turtles. Biol. Conserv. 170, 20–27. doi: 10.1016/j.biocon.2013.11.011
Viada S. T., Hammer R. M., Racca R., Hannay D., Thompson M. J., Balcom B. J., et al. (2008). Review of potential impacts to sea turtles from underwater explosive removal of offshore structures. Environ. Impact Assess. Rev. 28 (4), 267–285. doi: 10.1016/j.eiar.2007.05.010
Wallace R. A. (1985). “Vitellogenesis and oocyte growth in nonmammalian vertebrates,” in Oogenesis. Ed. Browder L. W. (Boston, MA: Springer US), 127–177.
Wibbels T., Owens D. W., Light P., Limpus C., Reed P. C., Amoss M. S. (1992). Serum gonadotropins and gonadal steroids associated with ovulation and egg production in sea turtles. Gen. Comp. Endocrinol. 87 (1), 71–78. doi: 10.1016/0016-6480(92)90151-9
Wibbels T., Owens D. W., Limpus C. J., Reed P. C., Amoss M. S. (1990). Seasonal changes in serum gonadal steroids associated with migration, mating, and nesting in the loggerhead sea turtle (Caretta caretta). Gen. Comp. Endocrinol. 79 (1), 154–164. doi: 10.1016/0016-6480(90)90099-8
Wood J. R., Wood F. E. (2015). Reproductive biology of captive green Sea turtles Chelonia mydas. Am. Zoologist 20 (3), 499–505. doi: 10.1093/icb/20.3.499
Youngsabanant M, Nuamsukon S. (2020). Morphology and elemental components of sea turtle eggshells using scanning electron microscopy. Engineering and Health Studies 14 (1), 73–82. doi: 10.14456/sehs.2020.7
Zug G., Balazs G., Wetherall J. A., Parker D., Murakawa S. (2002). Age and growth of Hawaiian green seaturtles (Chelonia mydas) : An analysis based on skeletochronology. Fishery Bull. 100, 117–127.
Keywords: sea turtle, nesting, progesterone, testosterone, estradiol
Citation: Rubin O, Soffer O, Levy Y and Aizen J (2023) Plasma hormone levels in the green turtle Chelonia mydas reared under captivity as a tool to predict mating and oviposition. Front. Mar. Sci. 10:1132573. doi: 10.3389/fmars.2023.1132573
Received: 26 January 2023; Accepted: 14 February 2023;
Published: 23 February 2023.
Edited by:
Kyle S. Van Houtan, Duke University, United StatesReviewed by:
Salvatore Siciliano, Fundação Oswaldo Cruz (Fiocruz), BrazilCraig A. Harms, North Carolina State University, United States
Copyright © 2023 Rubin, Soffer, Levy and Aizen. This is an open-access article distributed under the terms of the Creative Commons Attribution License (CC BY). The use, distribution or reproduction in other forums is permitted, provided the original author(s) and the copyright owner(s) are credited and that the original publication in this journal is cited, in accordance with accepted academic practice. No use, distribution or reproduction is permitted which does not comply with these terms.
*Correspondence: Joseph Aizen, YWl6ZW5AcnVwcGluLmFjLmls